Embed Size (px)
DESCRIPTION
Important Dates Public Information Meetings Town Hall, 2101 Innisfil Beach Road, Innisfil Tuesday, November 29, 2011 9:00 - 11:00 am 2:00 - 4:00 pm 7:00 - 9:00 pm
Citation preview
INSPIRATION IN ACTION
TAB COLOUR
BUDGET STAFF REPORT
Tax Rate Operating
INDEX
User Rate Operating
Fees & Charges
Capital Budget
TOWN OF INNISFIL STAFF REPORT
STAFF REPORT NO. DSR-185-11 DATE: November 16, 2011 TO: Mayor, Deputy Mayor and Members of Council FROM: Lockie Davis, Director of Finance & Customer Service/CFO SUBJECT: Draft 2012 Operating and Capital Budgets, Business Plans and Fees & Charges RECOMMENDATION: THAT Staff Report DSR-185-11 being a report to provide an overview of the 2012 Draft Operating and Capital Budgets, 2012 Business Plans, 2012 User Rates and 2012 Fees & Charges be received; and THAT the Draft 2012 draft Operating and Capital Budgets, 2012 Business Plans and 2012 Fees and Charges be considered at the special Council meetings of November 30 & December 1, 2011; and THAT the Director of Finance includes any amendments arising from the deliberations for consideration of the Final Budgets at the Council meeting of December 14, 2011. BACKGROUND: Broader Financial pressures:
According to the October 21 Statistics Canada’s website release “In Ontario, consumer prices went up 3.4% in the 12 months to September, 2011”. These inflationary impacts adversely affect municipalities in the goods and services that are acquired for the purpose of delivering services to our residents. Increases in OMERS rates and benefit costs, wage settlements, and the full year effect of new staff from the previous year also contribute to the pressures faced by the municipality when determining the 2012 budget requirements. The Ontario Ministry of Energy website also indicates that electricity prices are expected to rise by 7.9% annually for the next five years.
Additional pressures can be attributed to the slower than expected growth and development that is in the Town’s Official Plan and development charges background study. The revenue streams that are generated from the receipt of development charges and realized through increased assessment and the corresponding property tax revenues are lower than anticipated. This puts pressure on the capital program expenditures for the replacement of existing assets that need to be funded through property taxes and then restricts the ability to construct growth related infrastructure unless alternative methods of funding can be identified to allow them to proceed. Operating and User Rate Budgets
The 2012 property tax and user rate based operating budgets where developed on the basis of status quo/existing service levels. Staff were not provided with any predetermined percentage or dollar increase but rather were tasked with looking closely at their 2011 projected results to the end of the year as compared to budget to determine where increases or decreases to their base budget were needed, as appropriate including any inflationary pressures. In a number of
Staff Report DSR-185-11 November 16, 2011 Draft 2012 Operating and Capital Budgets Page 2 of 19
instances Council will note that the costs have been held consistent with the 2011 approved budget levels. In keeping with previous budget submissions any additional implications due to service level changes were submitted by staff and were considered by the SMT and either supported or rejected based upon the merits of each situation.
Water and Wastewater services are provided to users connected to one of the Town’s two wastewater systems (Cookstown and Alcona) and/or one of the seven water systems (Lakeshore Water Treatment Plant, Golf Haven, Churchill, Stroud, Innisfil Heights, Goldcrest, and Cookstown). Rates charged to the users consist of two primary drivers: a base annual charge per connection which is established to recover the costs for the infrastructure assets which support the production, supply, delivery and treatment of water & wastewater along with applicable debt financing repayments incurred for these assets and; a variable charge that is calculated on the basis of the consumption on a per cubic meter basis for water or waste consumed. The recovery of this component is intended to ensure annual operating costs for staff, materials and chemicals, utilities etc. are properly funded plus a portion towards future capital replacements.
Although each system throughout the Town has a different cost based on the nature of the operation the current practice is to harmonize the rates so as not to disadvantage one community over another. The Sandy Cove Acres community is the one exception where a reduced wastewater base rate was implemented previously established at 2/3 of a “unit” to reflect their average resident per household when compared other parts of the Town. However, this rate had eroded over time to less than 2/3 of the full rate. To minimize the impact to the residents of that community Council approved a phased increase over two years commencing in 2011 that would return the reduced rate to 2/3 of a full rate and this is reflected in the 2012 wastewater budget. Over time as the servicing strategy for the Town matures and our reliance on multiple stand alone systems diminishes the harmonized rate will become easier to rationalize for users of water and wastewater services.
Increases in water and wastewater infrastructure costs are becoming readily more visible as municipalities begin using the asset valuations determined under the accounting standards for tangible capital assets in their lifecycle management and planning processes. An article in the Kingston Whig Standard quoted Barry Steinburg, president of the Consulting Engineers of Ontario whose non-profit association represents almost 230 engineering firms in the province as follows: “Municipalities across the province should raise their water rates by substantial amounts. We need to think about planning and growth and the impact of decisions on generations to come. The longer term you plan, the better the economies for the assets you're building.” Kingston along with many other municipalities are acknowledging the need for increased fees for their water & wastewater systems and are making the difficult decisions required to ensure that funds are being set aside for the future requirements.
Fees and Charges
Section 391 of the Municipal Act 2001, as amended permits a municipality to enact by-laws to impose fees for municipal services and activities. The objective of the fees is to recover costs for services or activities provided or done by or on behalf of any other municipality or local board and; for the use of its property including property under its control. Additionally, Section 69(1) of the Planning Act R.S.O. 1990, Chapter P.13 permits a municipality to pass a by-law to establish a schedule of fees for the processing of applications in respect of planning matters. The basis for determining fees and charges involves identifying the costs associated with delivering the service. The direct cost of the staff or contracted person(s) performing the service is traditionally included but in order to strive towards full cost recovery the inclusion of departmental and corporate overhead plus amounts related to the physical depletion (and future replacement) of assets used in the delivery of the service needs to be quantified. In some instances this work can be complex and the assistance from external consultants for best
Staff Report DSR-185-11 November 16, 2011 Draft 2012 Operating and Capital Budgets Page 3 of 19
practices etc. is necessary. Once the analysis has been completed then staff can provide recommendations for Council consideration regarding fees that may be not be appropriate to have full cost recovery or those that should be phased in over a number of years to minimize the impact to the users of those services. For 2012, most fee increases proposed are inflationary in the 3% range until the detailed analysis can be completed. For building inspection and other related fees staff engaged the services of Hemson Consulting to update a 2006 study to quantify the full cost to deliver the services. A report will be brought forward for Council consideration by the Director of Development regarding the implications to fees and a strategy for implementation but as an interim step the fees are recommended to increase by 14.5% in 2012. Parks & Recreation fees will be looked at in detail subject to the approval of a 2012 budget request to engage the services of a consultant for the significant analysis required in that area. 2012 to 2016 Capital Budget and Plan
The 2012 to 2016 capital budget and plan was prepared based on the provisions contained in the Capital Budget Funding Policy CP04-11.05 approved by Council on August 10. The 2012 – 2016 capital budget/plan maximize the funds available while placing the Town on a path towards financial sustainability by 2014. Inspiring Innisfil 2020 strategic items were considered first priority during the formulation and review of the budget/plan. The need for a five year plan is required for the Gas Tax revenues received under the Municipal Funding Agreement between the federal and provincial governments, administered in Ontario through the Association of Municipalities of Ontario. In addition to Gas Tax funding the Town uses revenues from the receipt of development charges collected at the time of building permit issuance, reserves that have been created through contributions from property taxes and water/wastewater user rates, revenues received from the OLG from slot revenues, monies collected under specific agreements (e.g. 7th/8th contribution agreement) and other sources that include developer specific payments, grants from senior levels of government and potentially long term debt financing. Projecting the timing of cashflow for receipt and expenditure is critical to ensure the financial well being of the municipality. Pressure stemming for slower than anticipated growth heightens the need to balance the receipts with the expenditures through careful projections and a structured approach as contemplated by the capital budget funding policy. The charts shown in Appendix F & G summarize the amount of funds available and their intended uses for the next five years. ANALYSIS/CONSIDERATION: 2012 to 2016 Capital Budget and Plan
Significant capital funding challenges exist as development and related revenues have not been realized at the levels that were identified in the development charges background studies and the Town’s official plan. To ensure that significant projects proceeded as planned (e.g. Innisfil Beach Road Improvements) “internal” borrowing has occurred where funds set aside for one purpose have provided the cashflow for non related projects to continue. However, the reduced revenue being received coupled with the expenditure on the committed projects has placed significant burden on the Town’s cash position. The adoption of the Capital Project Funding Policy is intended that on a go-forward basis there is a strategy in place to restrict capital expenditures until such time that adequate funds have been received to restore the Town’s cash positions and achieve greater financial stability goals.
The draft 2012 to 2016 capital budget and plan has been developed using various funding approaches. Key strategic initiatives have been supported primarily from slot revenues received through the Ontario Lottery and Gaming Corporation via the Alternative Revenue Source
Staff Report DSR-185-11 November 16, 2011 Draft 2012 Operating and Capital Budgets Page 4 of 19
reserve fund. Using a revenue source that is outside of Town control minimizes any potential impact to the taxpayer as these are non-recurring strategic initiatives expenditures but ensures that on-going major repairs and replacements of existing assets (shown as operational requirements in the budget/plan) are funded through a stable and reliable source funded through property taxes or water/wastewater rates.
Furthermore, Staff analysed projects to ensure that essential growth related initiatives were included in the 2012 recommended draft budget but others were moved to further out for consideration in later years based on the new policy. Gas Tax revenues were maximized to ensure that program guidelines related to timing of expenditures was being achieved.
The draft 2012 budget also includes projects that will require debt financing approval in order to proceed. A total of $7,194,010 is proposed to be funded through the issuance of long term debt with the largest item being the Lefroy Library at $6,554,000. At the end of 2011 the Town will have net total debt outstanding of $35.9M (total debt is $39.6 with $3.7M repayable by Innisfil Hydro) and an additional debt capacity calculated by the Province of approx. $69.8M. The approval of the 2012 items would reduce the Town’s remaining borrowing capacity to approx. $62.6M and increase annual debt servicing costs by $560K. A property tax increase of $513,000 or other revenue source would be necessary for the Library portion based on a 20 year amortization period and an interest rate of 4% and the balance of the debt requiring water and wastewater rate increases in order to be funded.
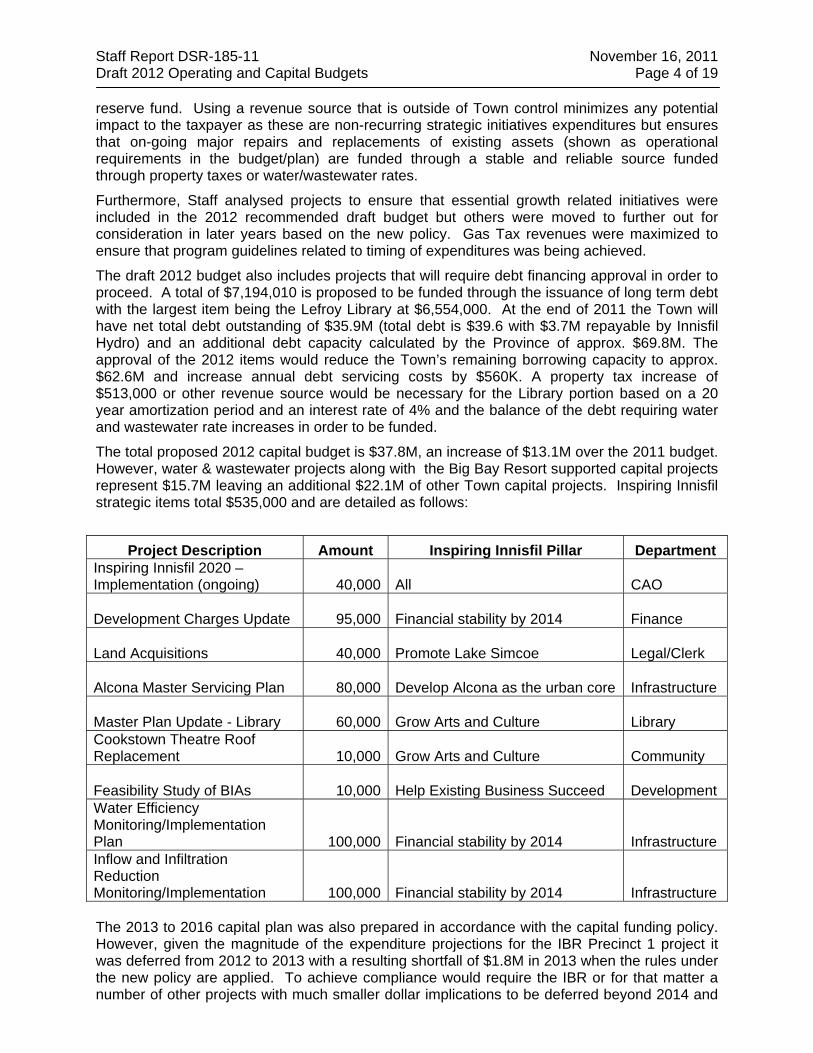
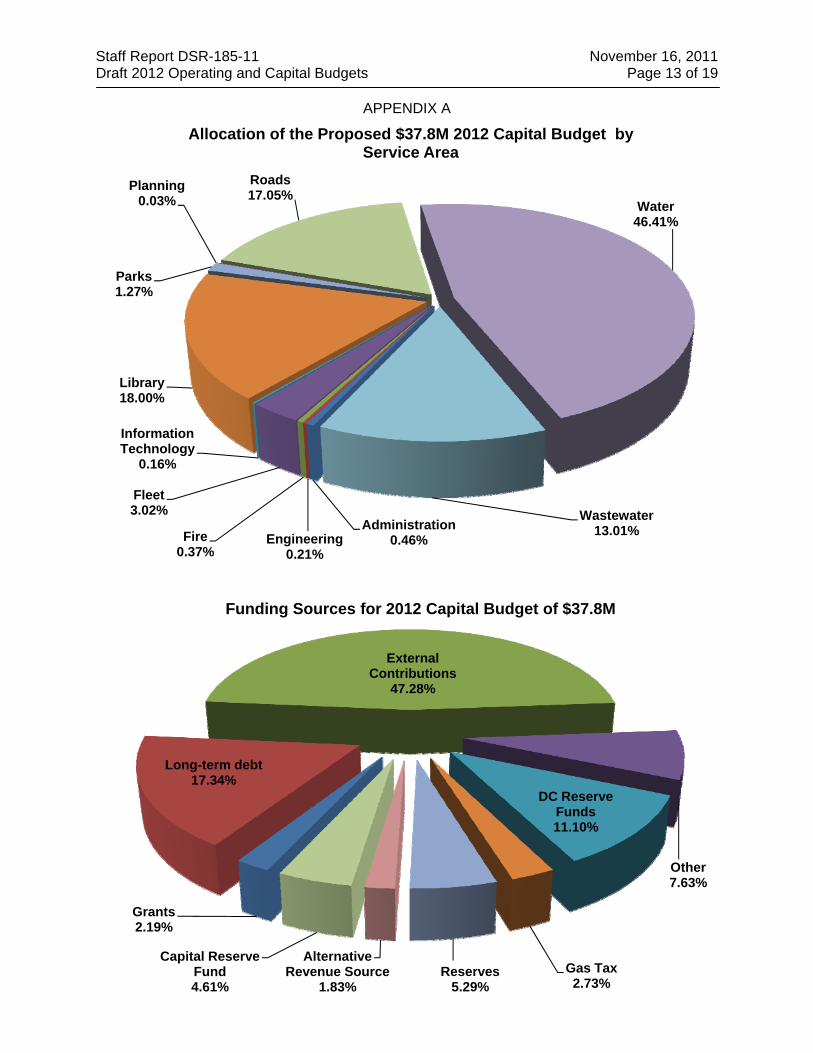
The total proposed 2012 capital budget is $37.8M, an increase of $13.1M over the 2011 budget. However, water & wastewater projects along with the Big Bay Resort supported capital projects represent $15.7M leaving an additional $22.1M of other Town capital projects. Inspiring Innisfil strategic items total $535,000 and are detailed as follows:
Project Description Amount Inspiring Innisfil Pillar Department
Inspiring Innisfil 2020 – Implementation (ongoing)
40,000 All CAO
Development Charges Update
95,000 Financial stability by 2014 Finance
Land Acquisitions
40,000 Promote Lake Simcoe Legal/Clerk
Alcona Master Servicing Plan
80,000 Develop Alcona as the urban core Infrastructure
Master Plan Update - Library
60,000 Grow Arts and Culture Library Cookstown Theatre Roof Replacement
10,000 Grow Arts and Culture Community
Feasibility Study of BIAs
10,000 Help Existing Business Succeed Development Water Efficiency Monitoring/Implementation Plan
100,000 Financial stability by 2014 Infrastructure
Inflow and Infiltration Reduction Monitoring/Implementation
100,000 Financial stability by 2014 Infrastructure
The 2013 to 2016 capital plan was also prepared in accordance with the capital funding policy. However, given the magnitude of the expenditure projections for the IBR Precinct 1 project it was deferred from 2012 to 2013 with a resulting shortfall of $1.8M in 2013 when the rules under the new policy are applied. To achieve compliance would require the IBR or for that matter a number of other projects with much smaller dollar implications to be deferred beyond 2014 and
Staff Report DSR-185-11 November 16, 2011 Draft 2012 Operating and Capital Budgets Page 5 of 19
subsequently such a strategy could see impacts to operational replacement requirements or delay growth opportunities. From a cash-flow perspective a projected $7.8M in reserve and reserve fund accumulated “savings” from 2012 & 2013 could be used to offset this one-time pressure and is being recommended as a bridge approach while adhering to the general policy objectives.
Assuming that Council supports the departure from policy for this specific item as noted in the previous paragraph staff are seeking confirmation to proceed with the procurement process to seek competitive bids relative for the next phase of Innisfil Beach Road construction project. Council will note that the intention is to seek concurrence now to proceed with Innisfil Beach Road Precinct 1 project in 2013. The purpose of seeking this approval at the time of Council’s consideration of the capital program is time is to allow staff to proceed with the tendering process in the fall of 2012 without actually incurring any expenditure until 2013 when the project has been included specific in that year’s capital budget program. Staff will be seeking the inclusion of this project as part of the specific motion when staff brings the final versions of the budget forward for approval in December.
The chart shown in Appendix A provides an indication of how the proposed $37.8M of 2012 capital expenditures will occur by service area and the funding sources.
2012 Property Tax Based Operating Budget
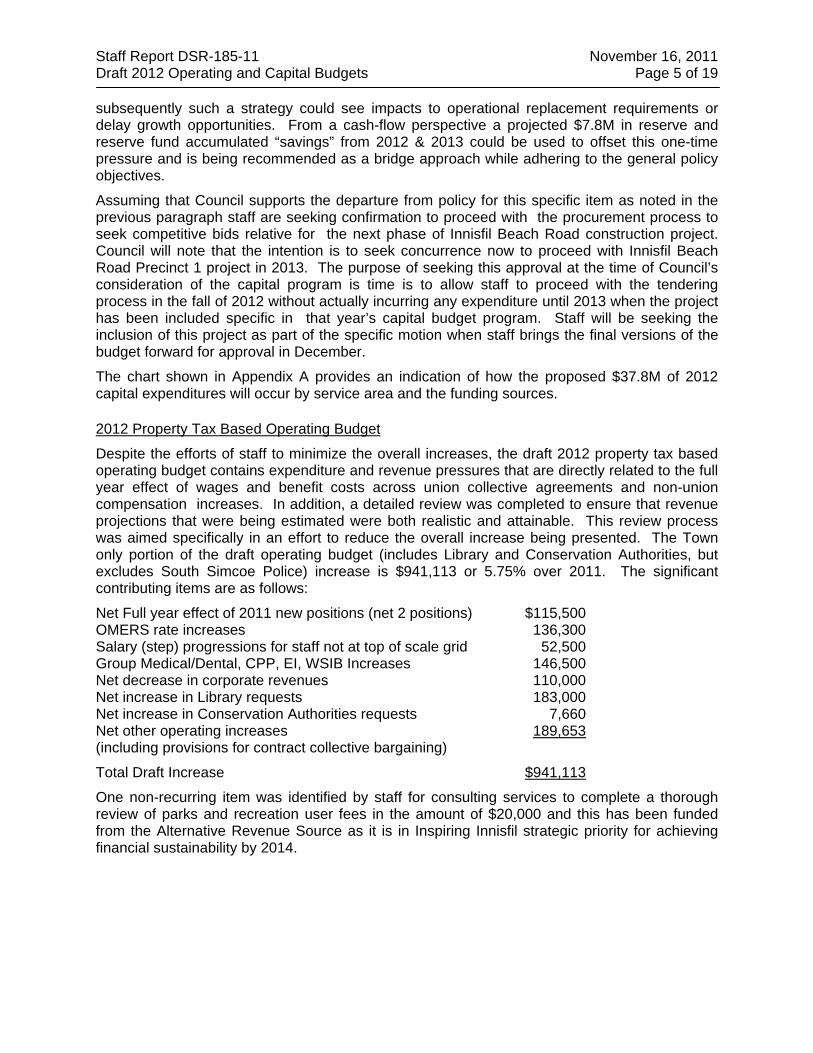
Despite the efforts of staff to minimize the overall increases, the draft 2012 property tax based operating budget contains expenditure and revenue pressures that are directly related to the full year effect of wages and benefit costs across union collective agreements and non-union compensation increases. In addition, a detailed review was completed to ensure that revenue projections that were being estimated were both realistic and attainable. This review process was aimed specifically in an effort to reduce the overall increase being presented. The Town only portion of the draft operating budget (includes Library and Conservation Authorities, but excludes South Simcoe Police) increase is $941,113 or 5.75% over 2011. The significant contributing items are as follows:
Net Full year effect of 2011 new positions (net 2 positions) $115,500 OMERS rate increases 136,300 Salary (step) progressions for staff not at top of scale grid 52,500 Group Medical/Dental, CPP, EI, WSIB Increases 146,500 Net decrease in corporate revenues 110,000 Net increase in Library requests 183,000 Net increase in Conservation Authorities requests 7,660 Net other operating increases 189,653 (including provisions for contract collective bargaining)
Total Draft Increase $941,113
One non-recurring item was identified by staff for consulting services to complete a thorough review of parks and recreation user fees in the amount of $20,000 and this has been funded from the Alternative Revenue Source as it is in Inspiring Innisfil strategic priority for achieving financial sustainability by 2014.
Staff Report DSR-185-11 November 16, 2011 Draft 2012 Operating and Capital Budgets Page 6 of 19
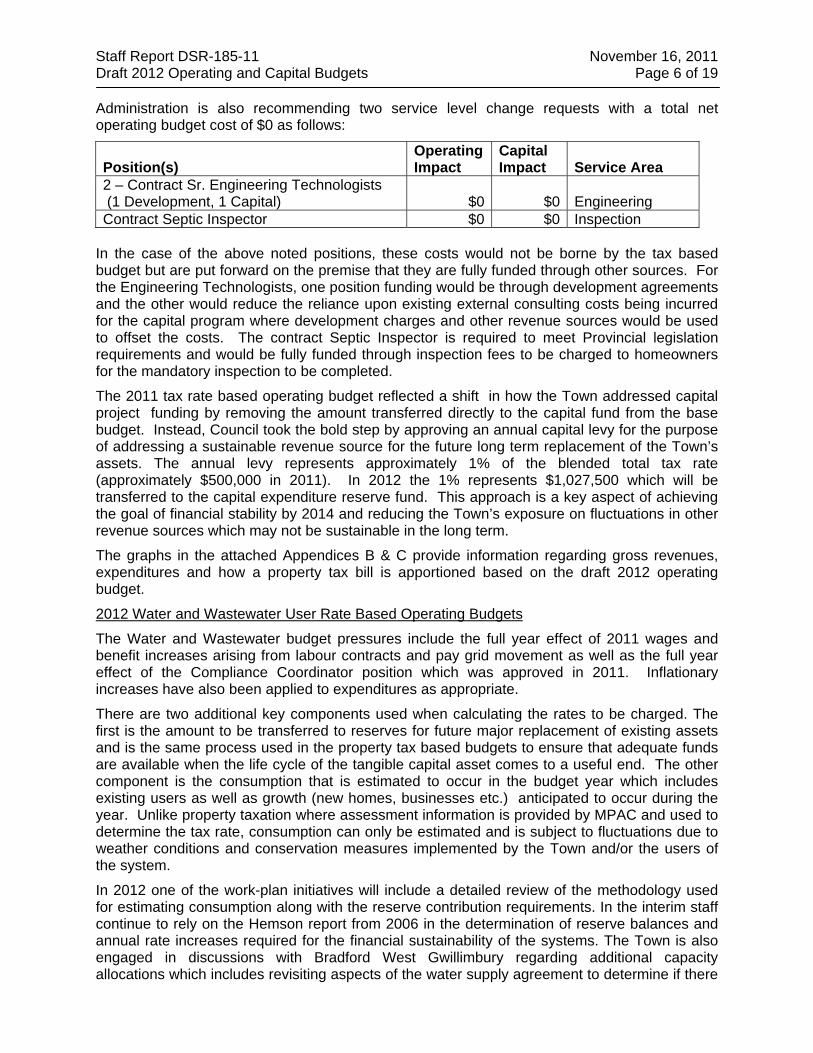
Administration is also recommending two service level change requests with a total net operating budget cost of $0 as follows:
Position(s) Operating Impact
Capital Impact Service Area
2 – Contract Sr. Engineering Technologists (1 Development, 1 Capital) $0 $0 Engineering Contract Septic Inspector $0 $0 Inspection
In the case of the above noted positions, these costs would not be borne by the tax based budget but are put forward on the premise that they are fully funded through other sources. For the Engineering Technologists, one position funding would be through development agreements and the other would reduce the reliance upon existing external consulting costs being incurred for the capital program where development charges and other revenue sources would be used to offset the costs. The contract Septic Inspector is required to meet Provincial legislation requirements and would be fully funded through inspection fees to be charged to homeowners for the mandatory inspection to be completed.
The 2011 tax rate based operating budget reflected a shift in how the Town addressed capital project funding by removing the amount transferred directly to the capital fund from the base budget. Instead, Council took the bold step by approving an annual capital levy for the purpose of addressing a sustainable revenue source for the future long term replacement of the Town’s assets. The annual levy represents approximately 1% of the blended total tax rate (approximately $500,000 in 2011). In 2012 the 1% represents $1,027,500 which will be transferred to the capital expenditure reserve fund. This approach is a key aspect of achieving the goal of financial stability by 2014 and reducing the Town’s exposure on fluctuations in other revenue sources which may not be sustainable in the long term.
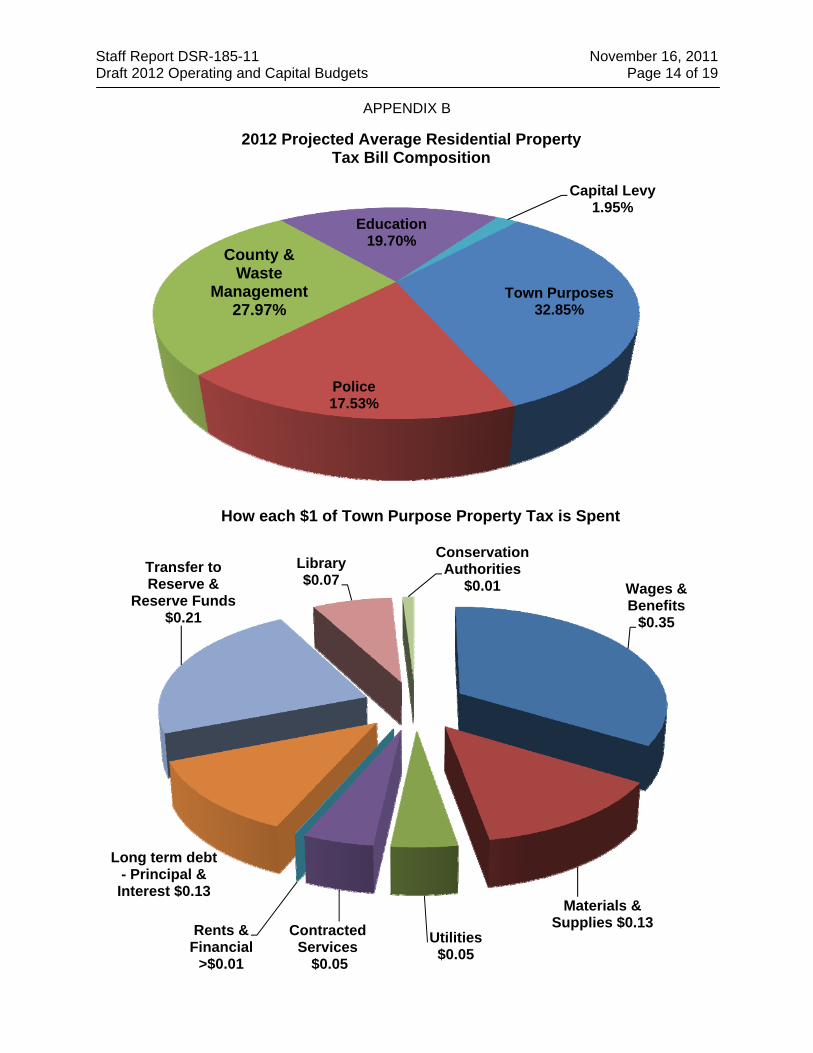
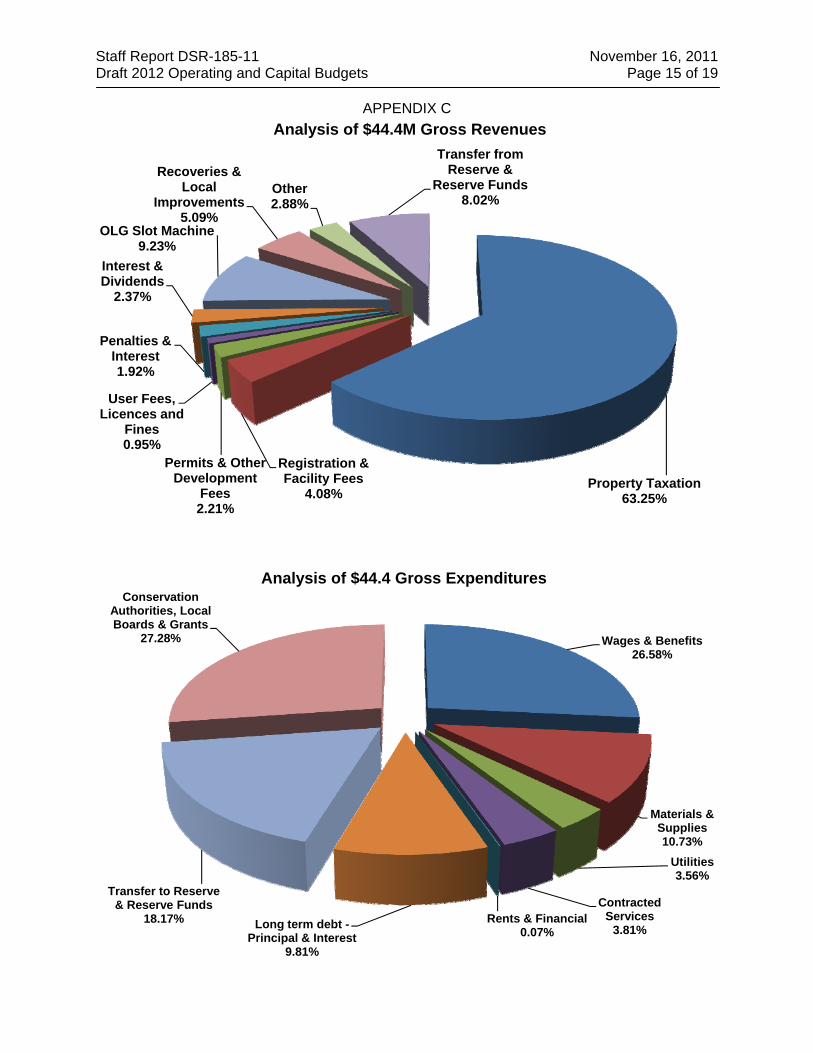
The graphs in the attached Appendices B & C provide information regarding gross revenues, expenditures and how a property tax bill is apportioned based on the draft 2012 operating budget.
2012 Water and Wastewater User Rate Based Operating Budgets
The Water and Wastewater budget pressures include the full year effect of 2011 wages and benefit increases arising from labour contracts and pay grid movement as well as the full year effect of the Compliance Coordinator position which was approved in 2011. Inflationary increases have also been applied to expenditures as appropriate.
There are two additional key components used when calculating the rates to be charged. The first is the amount to be transferred to reserves for future major replacement of existing assets and is the same process used in the property tax based budgets to ensure that adequate funds are available when the life cycle of the tangible capital asset comes to a useful end. The other component is the consumption that is estimated to occur in the budget year which includes existing users as well as growth (new homes, businesses etc.) anticipated to occur during the year. Unlike property taxation where assessment information is provided by MPAC and used to determine the tax rate, consumption can only be estimated and is subject to fluctuations due to weather conditions and conservation measures implemented by the Town and/or the users of the system.
In 2012 one of the work-plan initiatives will include a detailed review of the methodology used for estimating consumption along with the reserve contribution requirements. In the interim staff continue to rely on the Hemson report from 2006 in the determination of reserve balances and annual rate increases required for the financial sustainability of the systems. The Town is also engaged in discussions with Bradford West Gwillimbury regarding additional capacity allocations which includes revisiting aspects of the water supply agreement to determine if there
Staff Report DSR-185-11 November 16, 2011 Draft 2012 Operating and Capital Budgets Page 7 of 19
are opportunities for a revised cost sharing structure that will be agreeable to both parties. The 2012 budget reflects the existing agreement provisions.
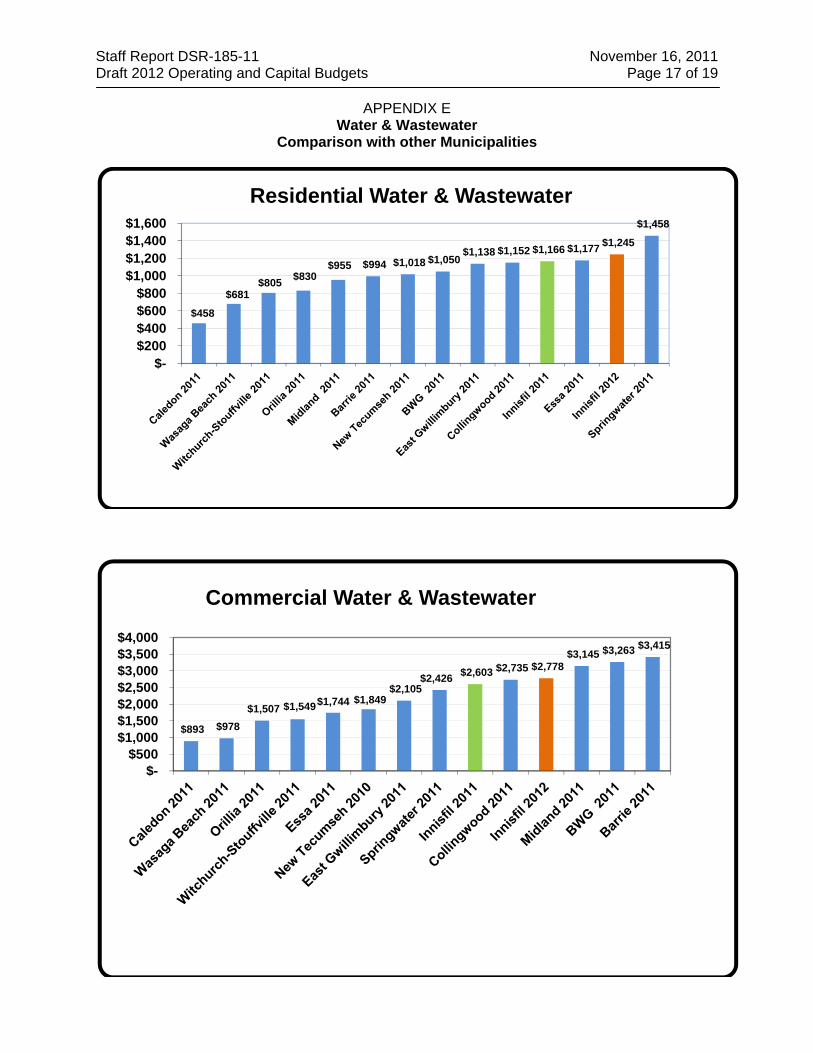
Appendix E provides a comparison of the average annual residential and commercial customer water & wastewater bills in Innisfil (2011 actual and 2012 proposed) with the 2011 actual for those of surrounding municipalities. The 2012 comparators information is not available at this time.
User Fees and Charges
Departments were requested to closely look at their operations to determine if changes were required to the existing schedules of fees and charges and if there was an opportunity for new items to be included. Their approach was to determine the full cost recovery to provide the services (including an allocation of departmental and corporate overhead) and make recommendations for any changes to the fee that may include phasing in increases over a number of years to lessen the impact to users. The shortened turnaround time for the 2012 budget along with other competing priorities did not allow sufficient time to complete the detailed review but as this is an Inspiring Innisfil 2020 initiative further detailed work is intended to occur in the first quarter of 2012 for recreation and facility fees. Specific items of note are:
• Building & Inspection Fees - Hemson Consulting provided an update to the detailed analysis they conducted in 2006 regarding the fees. Results of this work will be provided to Council separately by the Director of Development in conjunction with an operational review that was also conducted and recommendations will be provided at that time. However, as an interim step, a 14.5% increase in fees is recommended to commence to address deficits being experienced in this service area.
• Parks & Recreation fees have been adjusted to reflect inflationary increases only at this time pending the outcome of the 2012 detailed review. Staff met with representatives from Innisfil minor hockey on November 3 and will have met with representatives from the other the various other Associations prior to Council budget deliberations (anticipated to occur the week of November 21) to explain the need for the increases and to seek their input on any other solutions that may be considered to keep rates affordable for their members. As has been the practise in the past, rate increases are recommended to take place May 1 to ensure that the seasonal sports activities and collection of membership fees from the participants by the organizations can be properly staged so as not to cause those organizations financial difficulties during their current operational period.
• A road occupancy permit fee of $100 is being recommended to be included in the 2012 fees and charges schedule to cover the cost of Roads and Customer Service staff for the administrative processing and inspection activities. This is a common fee charged by other municipalities and will generate approximately $20,000 in additional revenue for the Town once fully implemented.
• Planning Services is also recommending economic increases to all fees charged for their services rendered.
Recreational Programmes fees are not listed in the fee by-law as it is difficult to know what the participant rate will be; what the cost to deliver the course or program will be and; what the availability of instructors to deliver the service is but the goal is to ensure that the Town is in a breakeven position. Accordingly, program guides are issued four times each year for the seasonal programs to be offered and fees are based on an anticipated participation rate and the cost of hiring the instructor, facility cost, administration fee and any supplies required for the program and the price included in the guide at that time. In the event that the enrolment is not adequate to cover off the these costs then participants are advised that the course is cancelled and given the opportunity of a refund or leaving their payment on account to be used against a future program or course offering.
Staff Report DSR-185-11 November 16, 2011 Draft 2012 Operating and Capital Budgets Page 8 of 19
The draft proposed Fees & Charges schedules are included in the Budget and Business Plan binder for Council’s information and review. The current 2011 fees are provided along with the recommended fees for 2012 with an explanation regarding the rationale for the change. Reasons for the recommended increase include inflationary adjustments, new fees where staff have identified that the service should be recovered from specific users and adjustments to move towards full recovery of actual costs incurred by the Town where deemed appropriate.
Reserves and Reserve Funds
Although staff do not provide a budget for approval regarding reserves and reserve funds it is important for Council to be aware of the effect to the balances based on the projected additions and utilization contained within the operating and capital budgets and the other sources of revenues that may be available (e.g. Gas Tax, OLG, interest revenues etc.).
Reserves contain funds set aside from Town property tax or user rate revenues for unexpected or to mitigate one-time operating requirements (e.g. tax rate stabilization, contingency, legal) or for tangible capital asset replacement purposes (e.g. water & wastewater, fleet, general facilities, computers). These do not receive any interest revenues as they are maintained in the Town’s general account and interest revenue is used to reduce the net operating budget requirements and rates required.
Reserve funds also include funds set aside from property tax revenues (i.e. special capital levy) as well as revenues received through the imposition and collection of development charges, funds from the OLG for the Town’s share of slot revenues, Gas Tax funds and interest income (or interest expense if in a deficit position) on balances that are maintained in each of the respective funds.
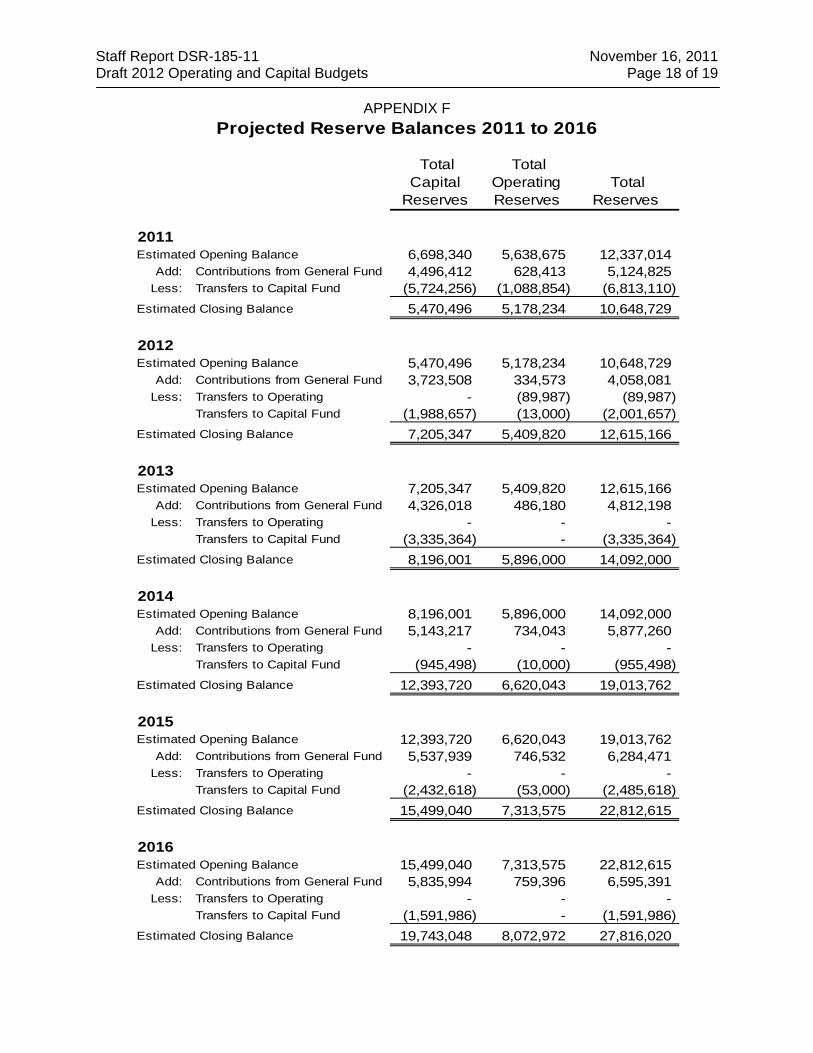
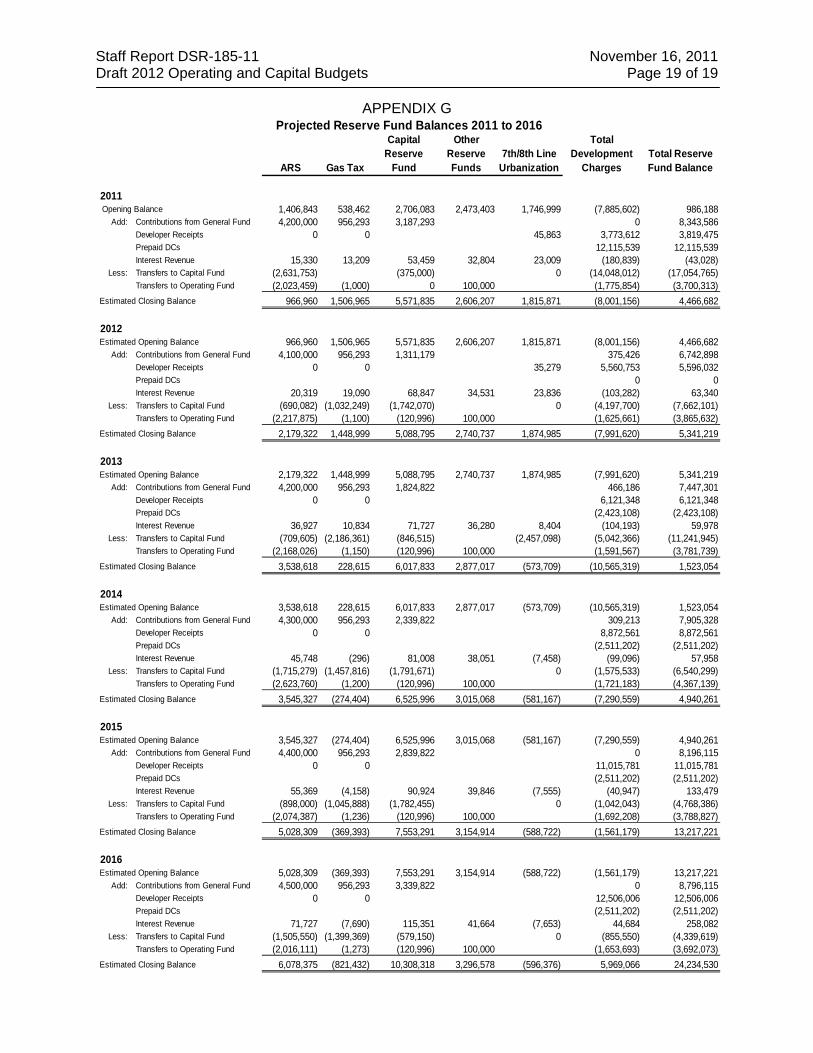
The 2012 Draft Budgets and Business Plan binder provides a detailed breakdown of the various reserves and reserve funds that are summarized in Appendix F & G.
OPTIONS/ALTERNATIVES: Capital Budget:
Council always has the prerogative to make any amendments to the submitted budget and plan by deleting projects, deferring projects to later years or advancing projects to reflect different priorities for the Town as it relates to growth projects and affordability issues. Significant changes to the 2012 budget will necessitate a review by staff for the purpose of ensuring the various funding sources and rationale for the project would be consistent with the use of the proposed funds (e.g. Development Charges, Gas Tax or some other revenue sources). The final approval of the capital budget will drive the timing and issuance of tenders, request for proposals and other procurement activities. As Council is aware, the early bidding process at the start of the year often generates the most competitive bids and may result in substantial cost savings for the Town. Property Tax Based Operating Budget:
Council has a number of options as it pertains to the Operating Budget including: Directing staff to complete a further review of the 2012 draft budget to determine
where service level reductions could be made and provide a report indicating the service to be reduced, the cost savings that would be achieved and any implications from a legal or community perspective;
Use existing reserves to reduce any tax rate increase for 2012 recognizing that such a strategy would not provide a permanent solution to address the funding gap as these are ongoing requirements;
Staff Report DSR-185-11 November 16, 2011 Draft 2012 Operating and Capital Budgets Page 9 of 19
Reduce the contribution to capital expenditure reserve fund to minimize the 2012 tax rate impact which would shift Council away from the target of financial sustainability by 2014;
Implement a combination of service level reductions, application of reserves and reduction of capital expenditure reserve fund contributions to minimize the tax rate impact in 2012. Once again subject to the weighting of Council’s approach the strategy may not be consistent with the desire to become financially sustainable.
User Rate Based Operating Budgets, Water and Wastewater Rates:
Council could:
Approve the recommended approach to increase the base and variable rates by 7.32% and 6.29% for water & wastewater respectively.
Opt to maintain the current water and wastewater rates; do not increase the base charge. This alternative would significantly reduce the amount of transfer to reserves that was recommended in the 2006 Hemson report and the Town would be at risk at having to find financing sources when assets eventually need to be replaced or ratepayers could be faced with very large rate increases at that time.
Select an increase above 0% and below the recommended %. This would require further calculations once direction is provided and the impact to the reserves could be provided at a future Council meeting.
User Fees & Charges:
Council could direct staff to make changes to the proposed fee schedules to: • Increase the current fees per the proposed staff recommendations • Maintain the current fees • Adopt an increase higher or lower than recommended; • Eliminate a fee or charge deemed not appropriate to be charged; • Direct the inclusion of additional services that should have a fee or charge collected; • Any combination of the above.
It should be noted that any action to reduce the proposed user fees or potentially eliminate a fee(s) will have consequences to the operating budgets and shift the costs associated for the program or service on to the property tax base. In short such a strategy would subsidize the users of the programs and services by the property tax payers. FINANCIAL CONSIDERATIONS: Property Tax Implications: The draft 2012 Town operating budget along with the draft budgets of the other agencies that property taxes are collected on behalf of is summarized as follows:
Staff Report DSR-185-11 November 16, 2011 Draft 2012 Operating and Capital Budgets Page 10 of 19
2012 Budget
2011 2012
Approved Draft Change Budget Budget $ %
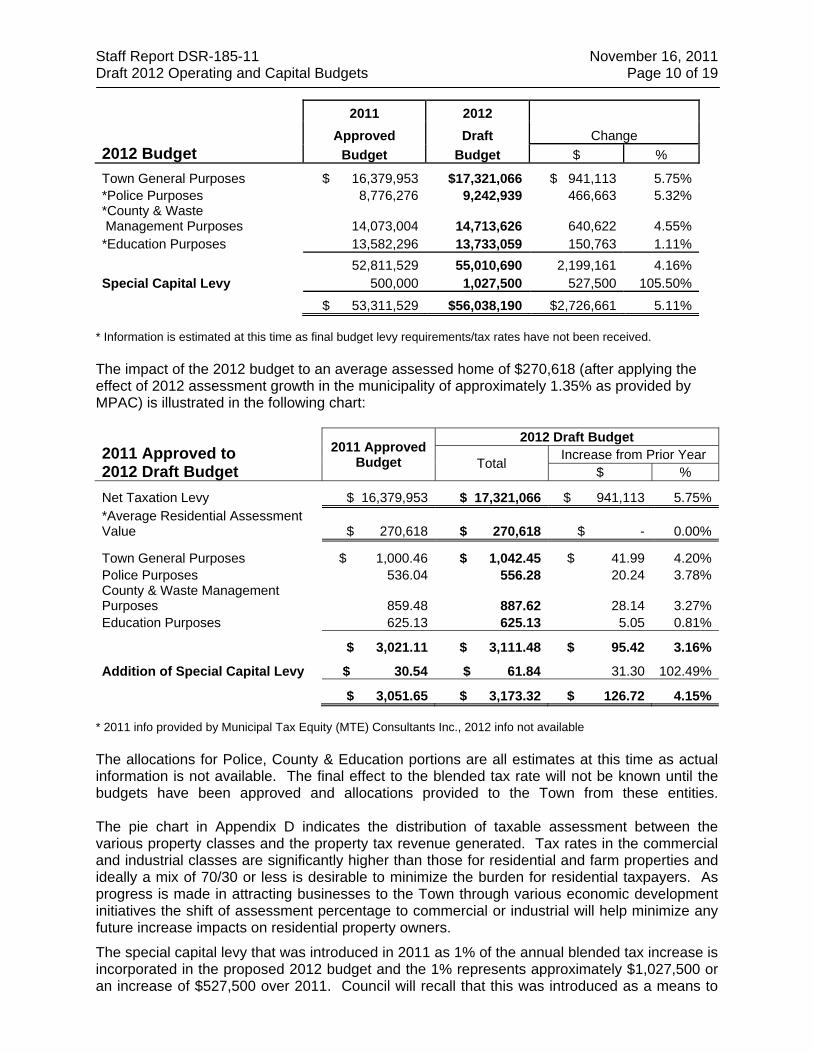
Town General Purposes $ 16,379,953 $17,321,066 $ 941,113 5.75%*Police Purposes 8,776,276 9,242,939 466,663 5.32%*County & Waste Management Purposes 14,073,004 14,713,626 640,622 4.55%*Education Purposes 13,582,296 13,733,059 150,763 1.11%
52,811,529 55,010,690 2,199,161 4.16%Special Capital Levy 500,000 1,027,500 527,500 105.50%
$ 53,311,529 $56,038,190 $2,726,661 5.11% * Information is estimated at this time as final budget levy requirements/tax rates have not been received. The impact of the 2012 budget to an average assessed home of $270,618 (after applying the effect of 2012 assessment growth in the municipality of approximately 1.35% as provided by MPAC) is illustrated in the following chart:
2011 Approved to 2012 Draft Budget
2011 Approved Budget
2012 Draft Budget
Total Increase from Prior Year $ %
Net Taxation Levy $ 16,379,953 $ 17,321,066 $ 941,113 5.75%*Average Residential Assessment Value $ 270,618 $ 270,618 $ - 0.00%
Town General Purposes $ 1,000.46 $ 1,042.45 $ 41.99 4.20%Police Purposes 536.04 556.28 20.24 3.78%County & Waste Management Purposes 859.48 887.62 28.14 3.27%Education Purposes 625.13 625.13 5.05 0.81%
$ 3,021.11 $ 3,111.48 $ 95.42 3.16%
Addition of Special Capital Levy $ 30.54 $ 61.84 31.30 102.49%
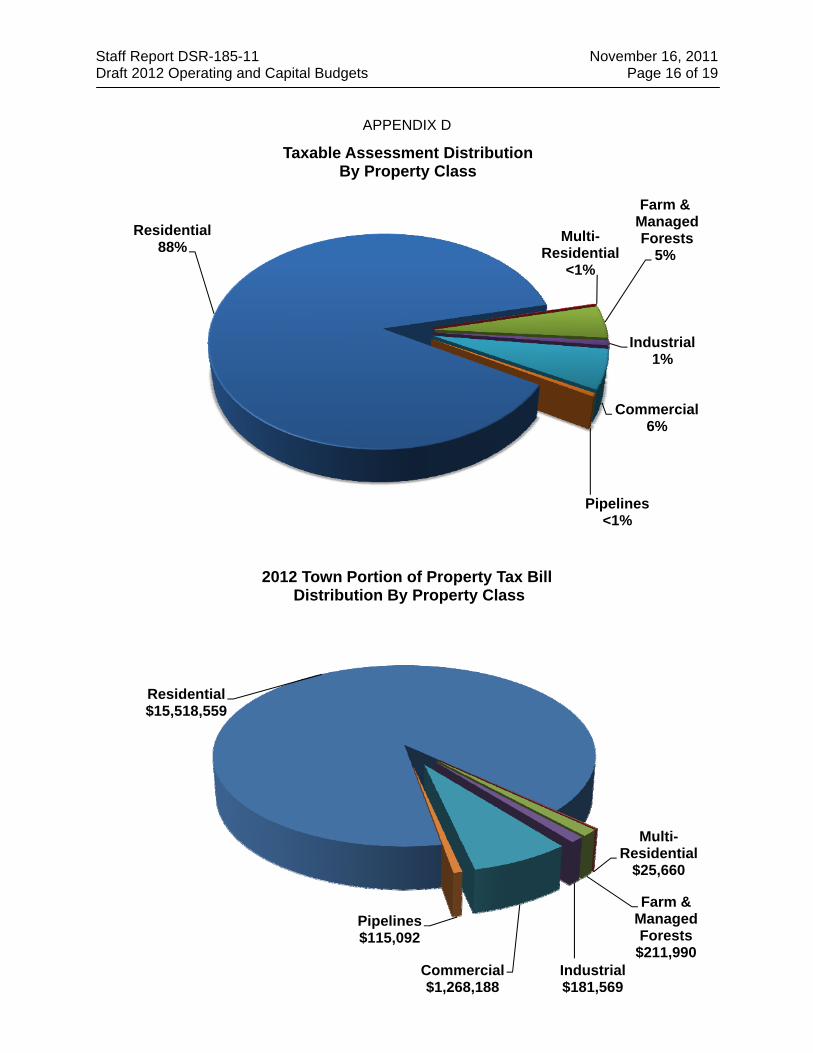
$ 3,051.65 $ 3,173.32 $ 126.72 4.15% * 2011 info provided by Municipal Tax Equity (MTE) Consultants Inc., 2012 info not available The allocations for Police, County & Education portions are all estimates at this time as actual information is not available. The final effect to the blended tax rate will not be known until the budgets have been approved and allocations provided to the Town from these entities. The pie chart in Appendix D indicates the distribution of taxable assessment between the various property classes and the property tax revenue generated. Tax rates in the commercial and industrial classes are significantly higher than those for residential and farm properties and ideally a mix of 70/30 or less is desirable to minimize the burden for residential taxpayers. As progress is made in attracting businesses to the Town through various economic development initiatives the shift of assessment percentage to commercial or industrial will help minimize any future increase impacts on residential property owners.
The special capital levy that was introduced in 2011 as 1% of the annual blended tax increase is incorporated in the proposed 2012 budget and the 1% represents approximately $1,027,500 or an increase of $527,500 over 2011. Council will recall that this was introduced as a means to
Staff Report DSR-185-11 November 16, 2011 Draft 2012 Operating and Capital Budgets Page 11 of 19
increase the Town’s capacity for capital asset replacements and to reduce the reliance on OLG slot revenues as the funding source which has a certain degree of potential volatility and uncertainty. To further highlight this need the Town was advised in April that mandatory new International Financial Reporting Standards (IFRS) were being implemented by the OLG for their 2011 fiscal year. The result is a decrease in the “net win” realized from the slot machines located at the various race tracks throughout Ontario and specifically for the Town a loss of approx. $103,000 annually from this revenue source. This decrease is further to the reduction already experienced when the OLG expanded from 450 to 1,000 machines which reduced the Town’s share by approximately $500,000 from 2009 levels. The Town’s long term fiscal well being requires stable and quantifiable revenue sources to fund the gaps that have been identified through the tangible capital asset work that was required by the Public Sector Accounting Board.
Water and Wastewater rate implications:
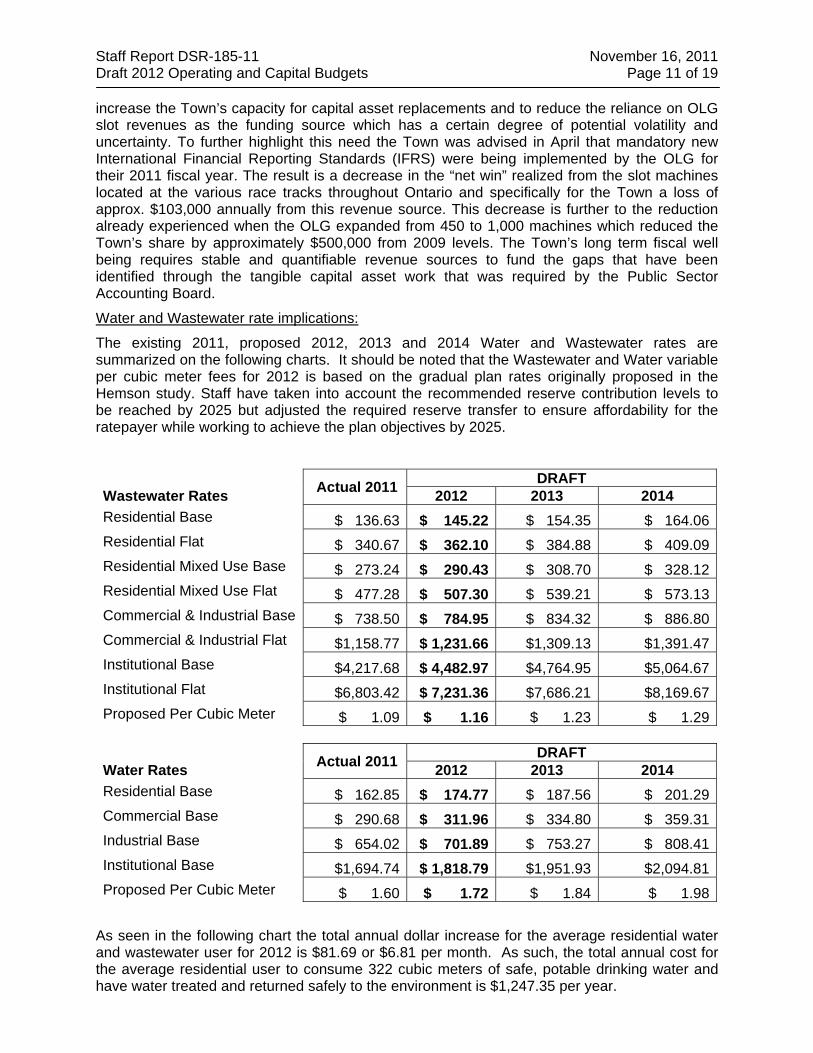
The existing 2011, proposed 2012, 2013 and 2014 Water and Wastewater rates are summarized on the following charts. It should be noted that the Wastewater and Water variable per cubic meter fees for 2012 is based on the gradual plan rates originally proposed in the Hemson study. Staff have taken into account the recommended reserve contribution levels to be reached by 2025 but adjusted the required reserve transfer to ensure affordability for the ratepayer while working to achieve the plan objectives by 2025.
Actual 2011 DRAFT Wastewater Rates 2012 2013 2014 Residential Base $ 136.63 $ 145.22 $ 154.35 $ 164.06 Residential Flat $ 340.67 $ 362.10 $ 384.88 $ 409.09 Residential Mixed Use Base $ 273.24 $ 290.43 $ 308.70 $ 328.12 Residential Mixed Use Flat $ 477.28 $ 507.30 $ 539.21 $ 573.13 Commercial & Industrial Base $ 738.50 $ 784.95 $ 834.32 $ 886.80 Commercial & Industrial Flat $1,158.77 $ 1,231.66 $1,309.13 $1,391.47 Institutional Base $4,217.68 $ 4,482.97 $4,764.95 $5,064.67 Institutional Flat $6,803.42 $ 7,231.36 $7,686.21 $8,169.67 Proposed Per Cubic Meter $ 1.09 $ 1.16 $ 1.23 $ 1.29
Actual 2011 DRAFT Water Rates 2012 2013 2014 Residential Base $ 162.85 $ 174.77 $ 187.56 $ 201.29 Commercial Base $ 290.68 $ 311.96 $ 334.80 $ 359.31 Industrial Base $ 654.02 $ 701.89 $ 753.27 $ 808.41 Institutional Base $1,694.74 $ 1,818.79 $1,951.93 $2,094.81 Proposed Per Cubic Meter $ 1.60 $ 1.72 $ 1.84 $ 1.98
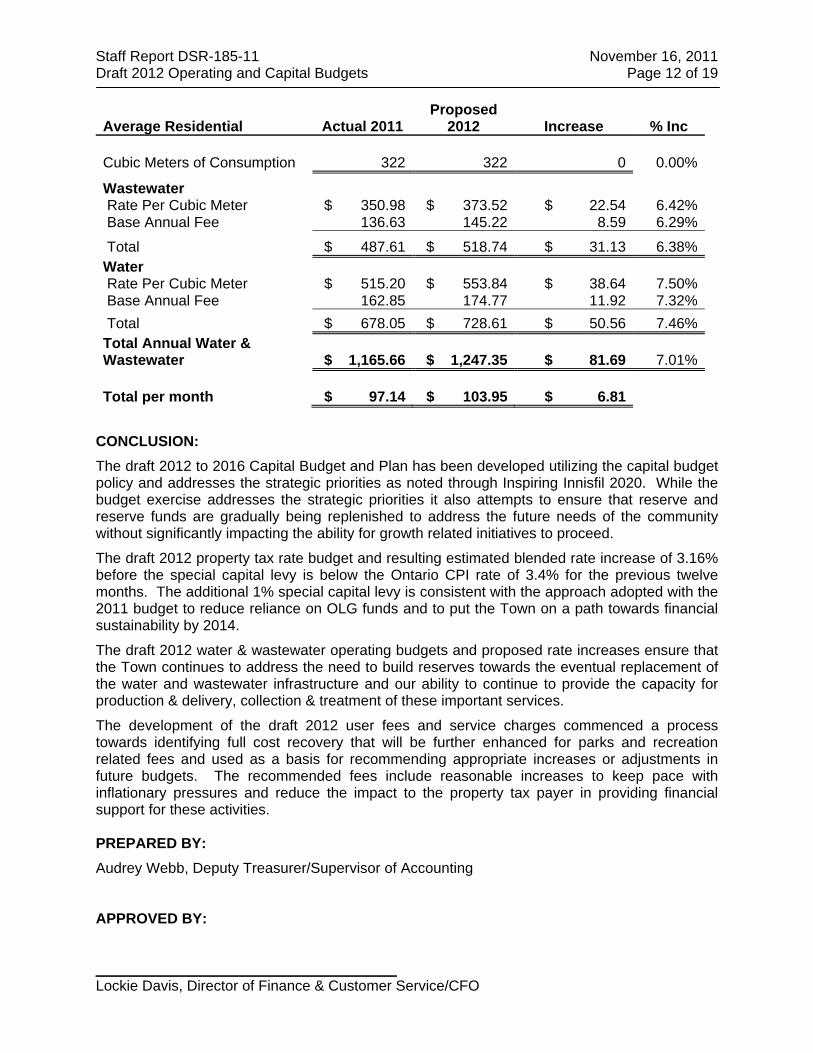
As seen in the following chart the total annual dollar increase for the average residential water and wastewater user for 2012 is $81.69 or $6.81 per month. As such, the total annual cost for the average residential user to consume 322 cubic meters of safe, potable drinking water and have water treated and returned safely to the environment is $1,247.35 per year.
Staff Report DSR-185-11 November 16, 2011 Draft 2012 Operating and Capital Budgets Page 12 of 19
Average Residential Actual 2011 Proposed
2012 Increase % Inc
Cubic Meters of Consumption 322 322 0 0.00%
Wastewater Rate Per Cubic Meter $ 350.98 $ 373.52 $ 22.54 6.42% Base Annual Fee 136.63 145.22 8.59 6.29%
Total $ 487.61 $ 518.74 $ 31.13 6.38%Water Rate Per Cubic Meter $ 515.20 $ 553.84 $ 38.64 7.50% Base Annual Fee 162.85 174.77 11.92 7.32% Total $ 678.05 $ 728.61 $ 50.56 7.46%Total Annual Water & Wastewater $ 1,165.66 $ 1,247.35 $ 81.69 7.01% Total per month $ 97.14 $ 103.95 $ 6.81
CONCLUSION: The draft 2012 to 2016 Capital Budget and Plan has been developed utilizing the capital budget policy and addresses the strategic priorities as noted through Inspiring Innisfil 2020. While the budget exercise addresses the strategic priorities it also attempts to ensure that reserve and reserve funds are gradually being replenished to address the future needs of the community without significantly impacting the ability for growth related initiatives to proceed.
The draft 2012 property tax rate budget and resulting estimated blended rate increase of 3.16% before the special capital levy is below the Ontario CPI rate of 3.4% for the previous twelve months. The additional 1% special capital levy is consistent with the approach adopted with the 2011 budget to reduce reliance on OLG funds and to put the Town on a path towards financial sustainability by 2014.
The draft 2012 water & wastewater operating budgets and proposed rate increases ensure that the Town continues to address the need to build reserves towards the eventual replacement of the water and wastewater infrastructure and our ability to continue to provide the capacity for production & delivery, collection & treatment of these important services.
The development of the draft 2012 user fees and service charges commenced a process towards identifying full cost recovery that will be further enhanced for parks and recreation related fees and used as a basis for recommending appropriate increases or adjustments in future budgets. The recommended fees include reasonable increases to keep pace with inflationary pressures and reduce the impact to the property tax payer in providing financial support for these activities. PREPARED BY: Audrey Webb, Deputy Treasurer/Supervisor of Accounting APPROVED BY: _____________________________________ Lockie Davis, Director of Finance & Customer Service/CFO
Staff Report DSR-185-11 November 16, 2011 Draft 2012 Operating and Capital Budgets Page 13 of 19
APPENDIX A
Administration0.46%Engineering
0.21%Fire
0.37%
Fleet3.02%
Information Technology
0.16%
Library18.00%
Parks1.27%
Planning0.03%
Roads17.05%
Water46.41%
Wastewater13.01%
Allocation of the Proposed $37.8M 2012 Capital Budget by Service Area
Grants2.19%
Long-term debt17.34%
External Contributions
47.28%
Other7.63%
DC Reserve Funds11.10%
Gas Tax 2.73%
Reserves5.29%
Alternative Revenue Source
1.83%
Capital Reserve Fund4.61%
Funding Sources for 2012 Capital Budget of $37.8M
Staff Report DSR-185-11 November 16, 2011 Draft 2012 Operating and Capital Budgets Page 14 of 19
APPENDIX B
Town Purposes 32.85%
Police 17.53%
County & Waste
Management 27.97%
Education 19.70%
Capital Levy 1.95%
2012 Projected Average Residential PropertyTax Bill Composition
Wages & Benefits
$0.35
Materials & Supplies $0.13
Utilities$0.05
Contracted Services
$0.05
Rents & Financial
>$0.01
Long term debt - Principal &
Interest $0.13
Transfer to Reserve &
Reserve Funds$0.21
Library$0.07
Conservation Authorities
$0.01
How each $1 of Town Purpose Property Tax is Spent
Staff Report DSR-185-11 November 16, 2011 Draft 2012 Operating and Capital Budgets Page 15 of 19
APPENDIX C
Property Taxation63.25%
Registration & Facility Fees
4.08%
Permits & Other Development
Fees2.21%
User Fees, Licences and
Fines0.95%
Penalties & Interest1.92%
Interest & Dividends
2.37%
OLG Slot Machine9.23%
Recoveries & Local
Improvements5.09%
Other2.88%
Transfer from Reserve &
Reserve Funds8.02%
Analysis of $44.4M Gross Revenues
Wages & Benefits26.58%
Materials & Supplies10.73%
Utilities3.56%
Contracted Services
3.81%Rents & Financial
0.07%Long term debt -Principal & Interest
9.81%
Transfer to Reserve & Reserve Funds
18.17%
Conservation Authorities, Local Boards & Grants
27.28%
Analysis of $44.4 Gross Expenditures
Staff Report DSR-185-11 November 16, 2011 Draft 2012 Operating and Capital Budgets Page 16 of 19
APPENDIX D
Residential88%
Multi-Residential
<1%
Farm &ManagedForests
5%
Industrial1%
Commercial6%
Pipelines<1%
Taxable Assessment DistributionBy Property Class
Residential $15,518,559
Multi-Residential
$25,660
Farm & Managed Forests
$211,990 Industrial $181,569
Commercial $1,268,188
Pipelines $115,092
2012 Town Portion of Property Tax BillDistribution By Property Class
Staff Report DSR-185-11 November 16, 2011 Draft 2012 Operating and Capital Budgets Page 17 of 19
APPENDIX E Water & Wastewater
Comparison with other Municipalities
$458
$681 $805 $830
$955 $994 $1,018 $1,050 $1,138 $1,152 $1,166 $1,177 $1,245
$1,458
$-$200 $400 $600 $800
$1,000 $1,200 $1,400 $1,600
Residential Water & Wastewater
$893 $978 $1,507 $1,549 $1,744 $1,849
$2,105 $2,426 $2,603 $2,735 $2,778
$3,145 $3,263 $3,415
$-$500
$1,000 $1,500 $2,000 $2,500 $3,000 $3,500 $4,000
Commercial Water & Wastewater
Staff Report DSR-185-11 November 16, 2011 Draft 2012 Operating and Capital Budgets Page 18 of 19
APPENDIX F
Total Capital
Reserves
Total Operating Reserves
Total Reserves
2011Estimated Opening Balance 6,698,340 5,638,675 12,337,014
Add: Contributions from General Fund 4,496,412 628,413 5,124,825 Less: Transfers to Capital Fund (5,724,256) (1,088,854) (6,813,110)
Estimated Closing Balance 5,470,496 5,178,234 10,648,729
2012Estimated Opening Balance 5,470,496 5,178,234 10,648,729
Add: Contributions from General Fund 3,723,508 334,573 4,058,081 Less: Transfers to Operating - (89,987) (89,987)
Transfers to Capital Fund (1,988,657) (13,000) (2,001,657) Estimated Closing Balance 7,205,347 5,409,820 12,615,166
2013Estimated Opening Balance 7,205,347 5,409,820 12,615,166
Add: Contributions from General Fund 4,326,018 486,180 4,812,198 Less: Transfers to Operating - - -
Transfers to Capital Fund (3,335,364) - (3,335,364) Estimated Closing Balance 8,196,001 5,896,000 14,092,000
2014Estimated Opening Balance 8,196,001 5,896,000 14,092,000
Add: Contributions from General Fund 5,143,217 734,043 5,877,260 Less: Transfers to Operating - - -
Transfers to Capital Fund (945,498) (10,000) (955,498) Estimated Closing Balance 12,393,720 6,620,043 19,013,762
2015Estimated Opening Balance 12,393,720 6,620,043 19,013,762
Add: Contributions from General Fund 5,537,939 746,532 6,284,471 Less: Transfers to Operating - - -
Transfers to Capital Fund (2,432,618) (53,000) (2,485,618) Estimated Closing Balance 15,499,040 7,313,575 22,812,615
2016Estimated Opening Balance 15,499,040 7,313,575 22,812,615
Add: Contributions from General Fund 5,835,994 759,396 6,595,391 Less: Transfers to Operating - - -
Transfers to Capital Fund (1,591,986) - (1,591,986) Estimated Closing Balance 19,743,048 8,072,972 27,816,020
Projected Reserve Balances 2011 to 2016
Staff Report DSR-185-11 November 16, 2011 Draft 2012 Operating and Capital Budgets Page 19 of 19
APPENDIX G
ARS Gas Tax
Capital Reserve
Fund
Other Reserve Funds
7th/8th Line Urbanization
Total Development
ChargesTotal Reserve Fund Balance
2011 Opening Balance 1,406,843 538,462 2,706,083 2,473,403 1,746,999 (7,885,602) 986,188
Add: Contributions from General Fund 4,200,000 956,293 3,187,293 0 8,343,586Developer Receipts 0 0 45,863 3,773,612 3,819,475Prepaid DCs 12,115,539 12,115,539Interest Revenue 15,330 13,209 53,459 32,804 23,009 (180,839) (43,028)
Less: Transfers to Capital Fund (2,631,753) (375,000) 0 (14,048,012) (17,054,765)Transfers to Operating Fund (2,023,459) (1,000) 0 100,000 (1,775,854) (3,700,313)
Estimated Closing Balance 966,960 1,506,965 5,571,835 2,606,207 1,815,871 (8,001,156) 4,466,682
2012Estimated Opening Balance 966,960 1,506,965 5,571,835 2,606,207 1,815,871 (8,001,156) 4,466,682
Add: Contributions from General Fund 4,100,000 956,293 1,311,179 375,426 6,742,898Developer Receipts 0 0 35,279 5,560,753 5,596,032Prepaid DCs 0 0Interest Revenue 20,319 19,090 68,847 34,531 23,836 (103,282) 63,340
Less: Transfers to Capital Fund (690,082) (1,032,249) (1,742,070) 0 (4,197,700) (7,662,101)Transfers to Operating Fund (2,217,875) (1,100) (120,996) 100,000 (1,625,661) (3,865,632)
Estimated Closing Balance 2,179,322 1,448,999 5,088,795 2,740,737 1,874,985 (7,991,620) 5,341,219
2013Estimated Opening Balance 2,179,322 1,448,999 5,088,795 2,740,737 1,874,985 (7,991,620) 5,341,219
Add: Contributions from General Fund 4,200,000 956,293 1,824,822 466,186 7,447,301Developer Receipts 0 0 6,121,348 6,121,348Prepaid DCs (2,423,108) (2,423,108)Interest Revenue 36,927 10,834 71,727 36,280 8,404 (104,193) 59,978
Less: Transfers to Capital Fund (709,605) (2,186,361) (846,515) (2,457,098) (5,042,366) (11,241,945)Transfers to Operating Fund (2,168,026) (1,150) (120,996) 100,000 (1,591,567) (3,781,739)
Estimated Closing Balance 3,538,618 228,615 6,017,833 2,877,017 (573,709) (10,565,319) 1,523,054
2014Estimated Opening Balance 3,538,618 228,615 6,017,833 2,877,017 (573,709) (10,565,319) 1,523,054
Add: Contributions from General Fund 4,300,000 956,293 2,339,822 309,213 7,905,328Developer Receipts 0 0 8,872,561 8,872,561Prepaid DCs (2,511,202) (2,511,202)Interest Revenue 45,748 (296) 81,008 38,051 (7,458) (99,096) 57,958
Less: Transfers to Capital Fund (1,715,279) (1,457,816) (1,791,671) 0 (1,575,533) (6,540,299)Transfers to Operating Fund (2,623,760) (1,200) (120,996) 100,000 (1,721,183) (4,367,139)
Estimated Closing Balance 3,545,327 (274,404) 6,525,996 3,015,068 (581,167) (7,290,559) 4,940,261
2015Estimated Opening Balance 3,545,327 (274,404) 6,525,996 3,015,068 (581,167) (7,290,559) 4,940,261
Add: Contributions from General Fund 4,400,000 956,293 2,839,822 0 8,196,115Developer Receipts 0 0 11,015,781 11,015,781Prepaid DCs (2,511,202) (2,511,202)Interest Revenue 55,369 (4,158) 90,924 39,846 (7,555) (40,947) 133,479
Less: Transfers to Capital Fund (898,000) (1,045,888) (1,782,455) 0 (1,042,043) (4,768,386)Transfers to Operating Fund (2,074,387) (1,236) (120,996) 100,000 (1,692,208) (3,788,827)
Estimated Closing Balance 5,028,309 (369,393) 7,553,291 3,154,914 (588,722) (1,561,179) 13,217,221
2016Estimated Opening Balance 5,028,309 (369,393) 7,553,291 3,154,914 (588,722) (1,561,179) 13,217,221
Add: Contributions from General Fund 4,500,000 956,293 3,339,822 0 8,796,115Developer Receipts 0 0 12,506,006 12,506,006Prepaid DCs (2,511,202) (2,511,202)Interest Revenue 71,727 (7,690) 115,351 41,664 (7,653) 44,684 258,082
Less: Transfers to Capital Fund (1,505,550) (1,399,369) (579,150) 0 (855,550) (4,339,619)Transfers to Operating Fund (2,016,111) (1,273) (120,996) 100,000 (1,653,693) (3,692,073)
Estimated Closing Balance 6,078,375 (821,432) 10,308,318 3,296,578 (596,376) 5,969,066 24,234,530
Projected Reserve Fund Balances 2011 to 2016