Embed Size (px)
Citation preview

2012 Chicago Community Area Report
Uptown
Data collected Spring 2012

Introduction
Based on the administration of the Illinois Survey (2012), this report provides community-level data on a variety ofhealth and social indicators such as drug use, bullying, and school climate. The data has been organized into topicalsections as noted in the table of contents following this introduction. In most cases, only a portion of schools in acommunity participate in the Illinois Youth Survey (IYS). There will be NO DATA presented in this report for any gradelevel with only one school reporting. This is to protect the confidentiality of school-level results.
The IYS is offered to both public and private schools. In order to have the best understanding of how well the results inthis report reflect the experience of the youth in this community, several factors should be considered including: PublicSchool Building Participation, Public School Student Participation, and Private School Student Participation.
Public School Building Participation
In Table 1, the number of eligible public schools (i.e. contain at least 15 students at the 6th, 8th, 10th, or 12th gradelevel) is compared with the actual number of IYS participating public schools in the community.
Table 1: Public School Building IYS Participation by School Level
Elementary & Middle Schools (6th and/or 8th grades)
High Schools (10th and/or 12th grades)
N Schools Participating
N Schools Eligible
N Schools Participating
N Schools Eligible
3 7 0 1
Public School Student Participation
Table 2 provides a comparison between the actual number of students surveyed and the number of all studentsenrolled in public schools within the community. This percentage can be increased by surveying more schools andstudents within the community. Again, enrollment totals are based on student enrollment at public schools with at least
15 enrolled students at the 6th , 8th, 10th, or 12th grade level. Table 2 is based solely on public school students due tothe lack of available enrollment information for private schools.
Table 2: Public School Student IYS Participation by Grade
N StudentsSurveyed
N EnrolledStudents inCommunity
% Enrolled Students in Community
Reported
8th 102 334 31%
Total 102 334 31%
Private School Student Participation
Table 3 provides a count of the number of private school students surveyed in this community. Note that the datapresented in this report includes both public and private schools that participated in this community.
Table 3: Number of Private School Students Surveyed by Grade
6th 8th 10th 12th Total
0 0 0 0 0
If schools that serve youth in specialized settings like charter schools, alternative schools, etc. participated in the IYS,these students are represented in the survey results but are not included in data summaries presented in Table 2 orTable 3 above.

Organization of the Report Data (Data Tables and Charts)
Tables can be helpful when you are looking for a summary of responses for particular survey questions, for example,
the percentage of 8th grade youth who report using prescription pain killers to get high. Some tables may contain amean score (an average of all the responses), a median score (the middle point of all responses given) or an "N"(number of students who responded to that question). Tables can also be useful when you need specific data tosupport a grant or report. If you see an "N/A" (Not Applicable) noted in a table, this indicates that the question was notasked at that grade level. If you see an "N/R (Not Reported) noted in a table, this indicates that at least 90% of the
students skipped the question for no known reason, making the results too biased to report.
Summary charts can be helpful to view multiple questions in one place (e.g., use of different drugs to determinewhich is the most used) and to compare your results with the scientific sample of Illinois students who participated inthe 2010 IYS. State level results from the 2012 IYS will not be available until late fall. IYS state level norms from 2010are a good benchmark for immediate decision-making because state estimates stay relatively stable across two IYSadministration years. To locate the starting page of the Summary Charts, refer to the Table of Contents on the nextpage.
Keep in mind that the IYS 6th and 8th grade forms do not include all questions asked on the IYS high school form. Forthat reason, responses to some questions do not appear in the tables and the charts for some grade levels. If youwould like to determine what section includes responses to a specific survey item or verify if a question was asked at aspecific grade level, please refer to the Site Report Appendix on our websitehttp://iys.cprd.illinois.edu/results/individual-school-reports.
We are confident that you will find this report to be a valuable resource for planning, grant writing, program developmentand reporting. If you have any questions about this report, please call 888-333-5612 and ask for an IYS Coordinator orvisit the IYS website at http://iys.cprd.illinois.edu/.

Table of Contents
Data Tables
(1) Student Characteristics .............................................................................................
Includes demographic data and other information about the surveyed population.
(2) Drug Prevalence and Behaviors .............................................................................
Includes substance use behaviors including type, frequency, and consequencesof drug use.
(3) Drug Use Contributing Factors ................................................................................
Includes factors in students, their families and their communities that may increaseor reduce the risk of youth substance abuse, such as access to substances andparental communication about expectations to not use drugs.
(4) Interpersonal Conflict, Violence and Delinquency ..............................................
Includes experiences with violence and high-risk behaviors including bullying andfighting.
(5) Academic and School Experiences ........................................................................
Includes youth opinions of their academic experiences, their school environmentand engagement in youth activities.
(6) Mental, Social and Physical Health .........................................................................
Includes a variety of mental and physical health issues including thoughts aboutdepression/suicide, nutrition, and physical activity (including estimates of obesity).
Summary Charts .............................................................................................
1
4
9
16
18
22
25

(1) Student Characteristics
Age
8th
Avg N
13.9 102
Gender
8th
% N
Female 45% 46
Male 55% 56
Total 100% 102
Race
8th
% N
White 8% 8
Black/African American 32% 31
Latino/Latina 26% 25
Asian American 20% 20
Native American/American Indian 0% 0
Multi-racial 12% 12
Other 2% 2
Total 100% 98
Page 1
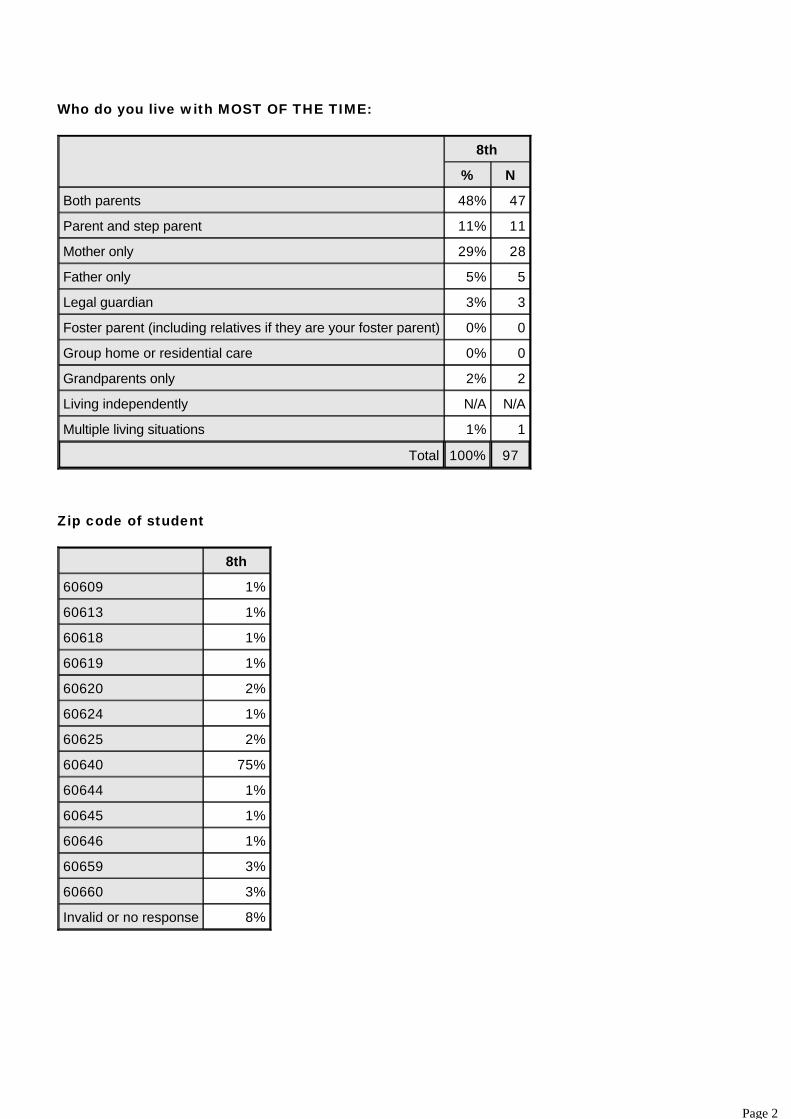
Who do you live with MOST OF THE TIME:
8th
% N
Both parents 48% 47
Parent and step parent 11% 11
Mother only 29% 28
Father only 5% 5
Legal guardian 3% 3
Foster parent (including relatives if they are your foster parent) 0% 0
Group home or residential care 0% 0
Grandparents only 2% 2
Living independently N/A N/A
Multiple living situations 1% 1
Total 100% 97
Zip code of student
8th
60609 1%
60613 1%
60618 1%
60619 1%
60620 2%
60624 1%
60625 2%
60640 75%
60644 1%
60645 1%
60646 1%
60659 3%
60660 3%
Invalid or no response 8%
Page 2

At school, are you eligible to receive:
8th
% N
Free lunch 90% 88
Reduced price lunch 6% 6
Neither 4% 4
Total 100% 98
Amount of time spent home alone each week after school:
8th
None 47%
1 to 2 days, less than 3 hours per day 14%
1 to 2 days, more than 3 hours per day 3%
3 or more days, less than 3 hours per day 18%
3 or more days, more than 3 hours per day 17%
Total 100%
Page 3
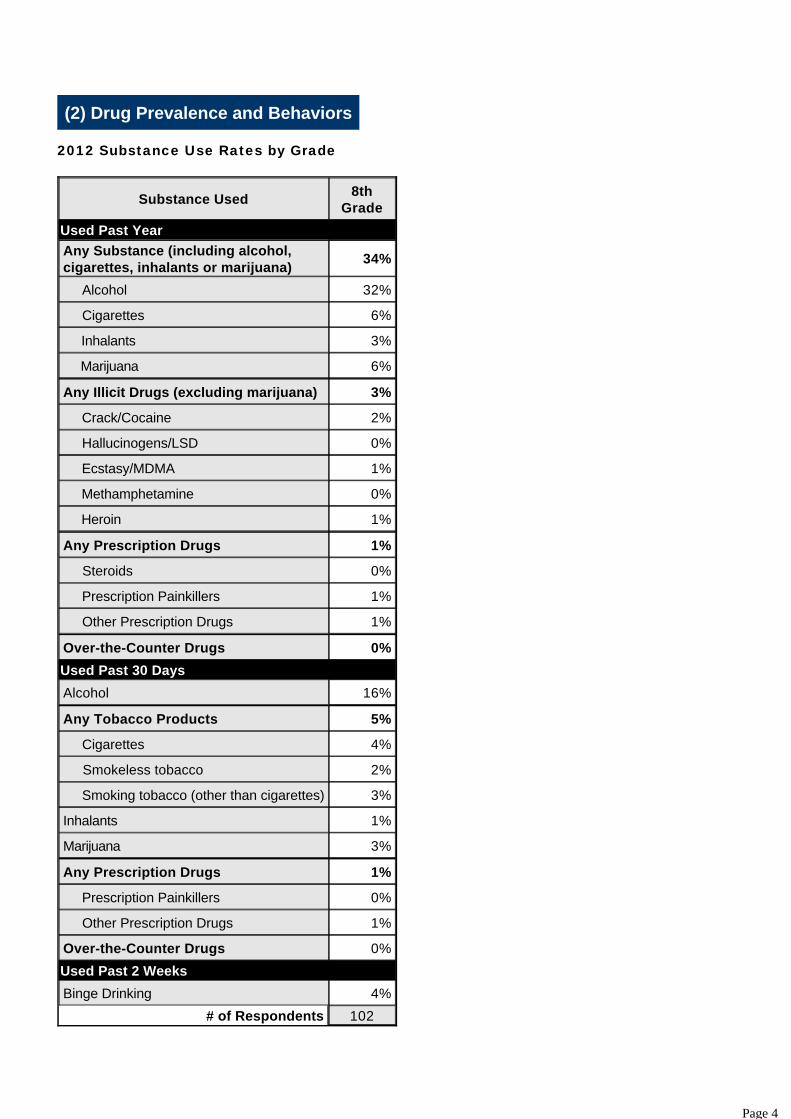
(2) Drug Prevalence and Behaviors
2012 Substance Use Rates by Grade
Substance Used8th
Grade
Used Past Year
Any Substance (including alcohol, cigarettes, inhalants or marijuana)
34%
Alcohol 32%
Cigarettes 6%
Inhalants 3%
Marijuana 6%
Any Illicit Drugs (excluding marijuana) 3%
Crack/Cocaine 2%
Hallucinogens/LSD 0%
Ecstasy/MDMA 1%
Methamphetamine 0%
Heroin 1%
Any Prescription Drugs 1%
Steroids 0%
Prescription Painkillers 1%
Other Prescription Drugs 1%
Over-the-Counter Drugs 0%
Used Past 30 Days
Alcohol 16%
Any Tobacco Products 5%
Cigarettes 4%
Smokeless tobacco 2%
Smoking tobacco (other than cigarettes) 3%
Inhalants 1%
Marijuana 3%
Any Prescription Drugs 1%
Prescription Painkillers 0%
Other Prescription Drugs 1%
Over-the-Counter Drugs 0%
Used Past 2 Weeks
Binge Drinking 4%
# of Respondents 102
Page 4

How old were you when you first:
Neverhave
10 oryounger
11 12 13 14 15 16 1718 orolder
Total
8th
Had more than a sip ortwo of alcohol
61% 9% 2% 9% 12% 6% 0% 0% 0% 0% 100%
Began drinking alcoholregularly (at least onceor twice a month)
92% 1% 0% 1% 3% 3% 0% 0% 0% 0% 100%
Smoked a cigarette,even just a puff
78% 9% 3% 2% 4% 3% 1% 0% 0% 0% 100%
Used any other tobaccoproduct (e.g., chewingtobacco or cigars)
94% 1% 1% 1% 1% 2% 0% 0% 0% 0% 100%
Smoked marijuana 91% 2% 1% 3% 2% 1% 0% 0% 0% 0% 100%
ALCOHOL: On how many occasions (if any) have you had alcohol:
0
occasions1-2
occasions3-5
occasions6-9
occasions10-19
occasions
20 ormore
occasionsTotal
8thIn the past 30 days 82% 15% 3% 0% 0% 0% 100%
In the past year 69% 22% 6% 1% 1% 1% 100%
BINGE DRINKING: Think back over the last two weeks. How many times have you had five or
more alcoholic drinks in a row:
8th
None 95%
Once 2%
Twice 1%
3-5 times 1%
6-9 times 1%
10 or more times 0%
Total 100%
Page 5
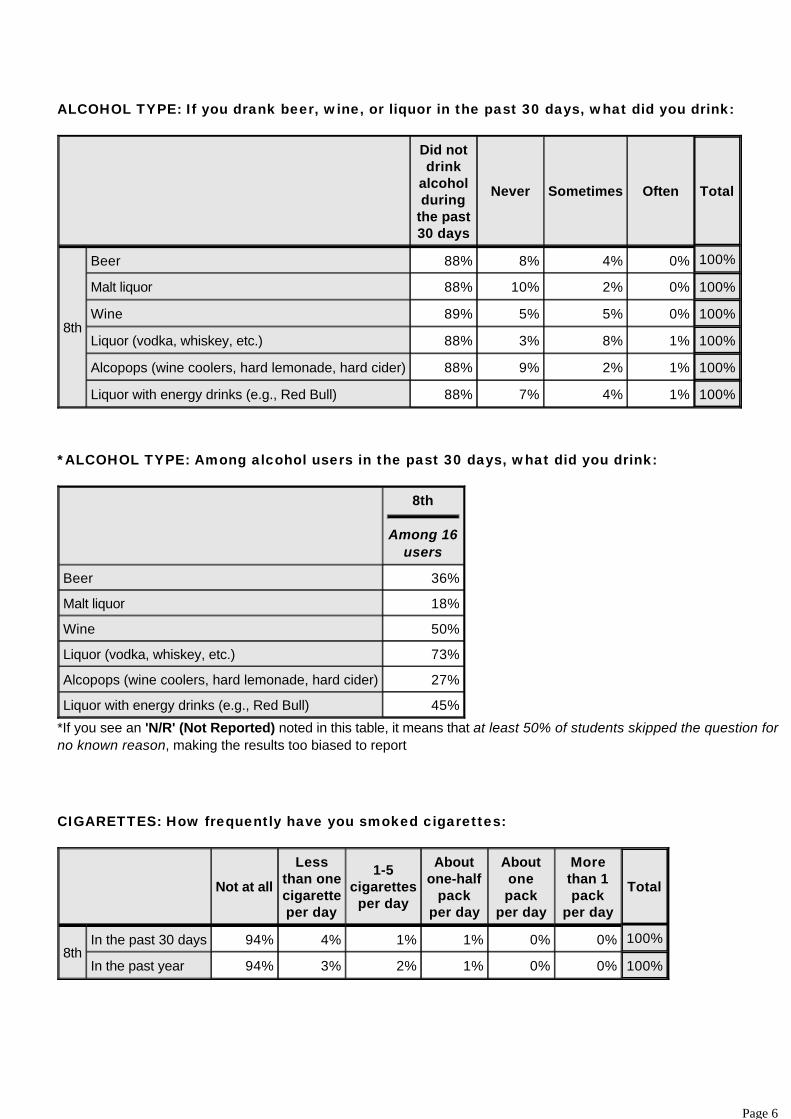
ALCOHOL TYPE: If you drank beer, wine, or liquor in the past 30 days, what did you drink:
Did notdrink
alcoholduring
the past30 days
Never Sometimes Often Total
8th
Beer 88% 8% 4% 0% 100%
Malt liquor 88% 10% 2% 0% 100%
Wine 89% 5% 5% 0% 100%
Liquor (vodka, whiskey, etc.) 88% 3% 8% 1% 100%
Alcopops (wine coolers, hard lemonade, hard cider) 88% 9% 2% 1% 100%
Liquor with energy drinks (e.g., Red Bull) 88% 7% 4% 1% 100%
*ALCOHOL TYPE: Among alcohol users in the past 30 days, what did you drink:
8th
Among 16
users
Beer 36%
Malt liquor 18%
Wine 50%
Liquor (vodka, whiskey, etc.) 73%
Alcopops (wine coolers, hard lemonade, hard cider) 27%
Liquor with energy drinks (e.g., Red Bull) 45%
*If you see an 'N/R' (Not Reported) noted in this table, it means that at least 50% of students skipped the question for
no known reason, making the results too biased to report
CIGARETTES: How frequently have you smoked cigarettes:
Not at all
Lessthan onecigaretteper day
1-5cigarettes
per day
Aboutone-half
packper day
Aboutonepack
per day
Morethan 1pack
per day
Total
8thIn the past 30 days 94% 4% 1% 1% 0% 0% 100%
In the past year 94% 3% 2% 1% 0% 0% 100%
Page 6

INHALANTS: On how many occasions (if any) have you sniffed glue, breathed the contents of
an aerosol spray can, or inhaled other gases or sprays, in order to get high:
0
occasions1-2
occasions3-5
occasions6-9
occasions10-19
occasions
20 ormore
occasionsTotal
8thIn the past 30 days 97% 3% 0% 0% 0% 0% 100%
In the past year 97% 3% 0% 0% 0% 0% 100%
MARIJUANA: On how many occasions (if any) have you used marijuana:
0
occasions1-2
occasions3-5
occasions6-9
occasions10-19
occasions
20 ormore
occasionsTotal
8thIn the past 30 days 95% 3% 0% 0% 1% 1% 100%
In the past year 94% 2% 2% 0% 0% 2% 100%
OTHER TOBACCO: During the past 30 days, how frequently have you used:
NeverOnce or
twice
Once ortwiceper
week
Aboutonce a
day
Morethan
once aday
Total
8th
Smokeless tobacco such as chewing tobacco,snuff, dip, or snus
98% 2% 0% 0% 0% 100%
Smoked tobacco products other than cigarettessuch as cigars, cigarillos, or little cigars
97% 2% 0% 0% 1% 100%
PRESCRIPTION AND OVER THE COUNTER DRUGS: During the past 30 days, how often have
you used the following to get high:
8th
Prescription painkillers (like Oxycontin, Vicodin, Lortab, or others) 0%
Other prescription drugs (like Ritalin, Adderall, or Xanax) 1%
Anything you could buy in a store ("over the counter drugs") 0%
Page 7

ILLICIT DRUGS: During the past 12 months, how often have you used:
0
occasions1-2
occasions3-5
occasions6-9
occasions10-19
occasions
20 ormore
occasionsTotal
8th
MDMA ("ecstasy") 99% 0% 0% 1% 0% 0% 100%
LSD or other psychedelics 100% 0% 0% 0% 0% 0% 100%
Cocaine or crack 98% 1% 0% 0% 1% 0% 100%
Meth (methamphetamine) 100% 0% 0% 0% 0% 0% 100%
Heroin 99% 0% 0% 0% 0% 1% 100%
PRESCRIPTION AND OVER THE COUNTER DRUGS: During the past 12 months, how often have
you used:
Never1-2
times3-5
times
6 ormoretimes
Total
8th
Steroids without a doctor's prescription? 100% 0% 0% 0% 100%
Prescription painkillers to get high? (e.g., Oxycontin, Vicodin,Lortab, etc.)
99% 1% 0% 0% 100%
Other prescription drugs to get high? (e.g., Ritalin, Adderall,Xanax, etc.)
99% 1% 0% 0% 100%
Something you bought in a store to get high? (e.g., coughsyrup, etc.)
100% 0% 0% 0% 100%
Page 8

(3) Drug Use Contributing Factors
PERSONAL DISAPPROVAL: How wrong do you think it is for someone your age to:
Very
wrongWrong
A littlebit
wrong
Notwrongat all
Total
8th
Drink beer, wine or hard liquor (e.g., vodka, whiskey or gin)regularly
65% 25% 8% 2% 100%
Smoke cigarettes 73% 22% 4% 1% 100%
Smoke marijuana 72% 18% 8% 2% 100%
Use LSD, cocaine, amphetamines, or another illegal drug 90% 8% 1% 1% 100%
PERCEIVED RISK ASSOCIATED WITH USE: How much do you think people risk harming
themselves (physically or in other ways) if they:
No riskSlightrisk
Moderaterisk
Greatrisk
Total
8th
Take one or two drinks of an alcoholic beverage (beer, wine,liquor) nearly every day
5% 18% 29% 48% 100%
Have five or more drinks of an alcoholic beverage once ortwice a week
5% 11% 35% 48% 100%
Smoke one or more packs of cigarettes per day 4% 7% 21% 68% 100%
Smoke marijuana regularly 6% 6% 20% 67% 100%
Smoke marijuana once or twice a week 8% 20% 28% 44% 100%
Use inhalants regularly 7% 5% 25% 63% 100%
PERCEIVED PEER NORMS: What are the chances you would be seen as cool if you:
No orverylittle
chance
Littlechance
Somechance
Prettygood
chance
Verygood
chanceTotal
8th
Began drinking alcohol regularly, that is, at leastonce or twice a month
51% 17% 19% 10% 3% 100%
Smoked cigarettes 55% 14% 21% 2% 7% 100%
Smoke marijuana 53% 13% 11% 9% 15% 100%
Page 9

PERCEIVED PARENT DISAPPROVAL OF USE: How wrong do your parents feel it would be for
you to:
Very
wrongWrong
A littlebit
wrong
Notwrongat all
Total
8th
Drink beer, wine, or hard liquor (e.g., vodka, whiskey, or gin)regularly (at least once or twice a month)
80% 14% 5% 1% 100%
Smoke cigarettes 93% 5% 1% 1% 100%
Smoke marijuana 91% 5% 3% 1% 100%
PARENT COMMUNICATION ABOUT DRUGS: In the past year, have your parents/guardians
talked to you about:
Yes NoDon't
rememberTotal
8th
Not using alcohol 58% 31% 11% 100%
Not using tobacco 52% 34% 14% 100%
Not using marijuana and other illegal drugs 55% 37% 9% 100%
PARENT ALCOHOL MONITORING: Would you be caught by your parents if:
Never SometimesMost ofthe time
Always Total
8th
You drank some beer, wine or liquor (e.g., vodka, whiskey,or gin) without your parents' permission
48% 7% 18% 27% 100%
You go to a party where alcohol is served 44% 18% 11% 27% 100%
PARENT OVERALL MONITORING:
Never SometimesMost ofthe time
Always Total
8th
When I am not at home, one of my parents/guardiansknows where I am and who I am with
5% 6% 28% 60% 100%
My parents/guardians ask if I've gotten my homeworkdone
16% 16% 17% 52% 100%
Would your parents/guardians know if you did not comehome on time
6% 9% 22% 62% 100%
Page 10
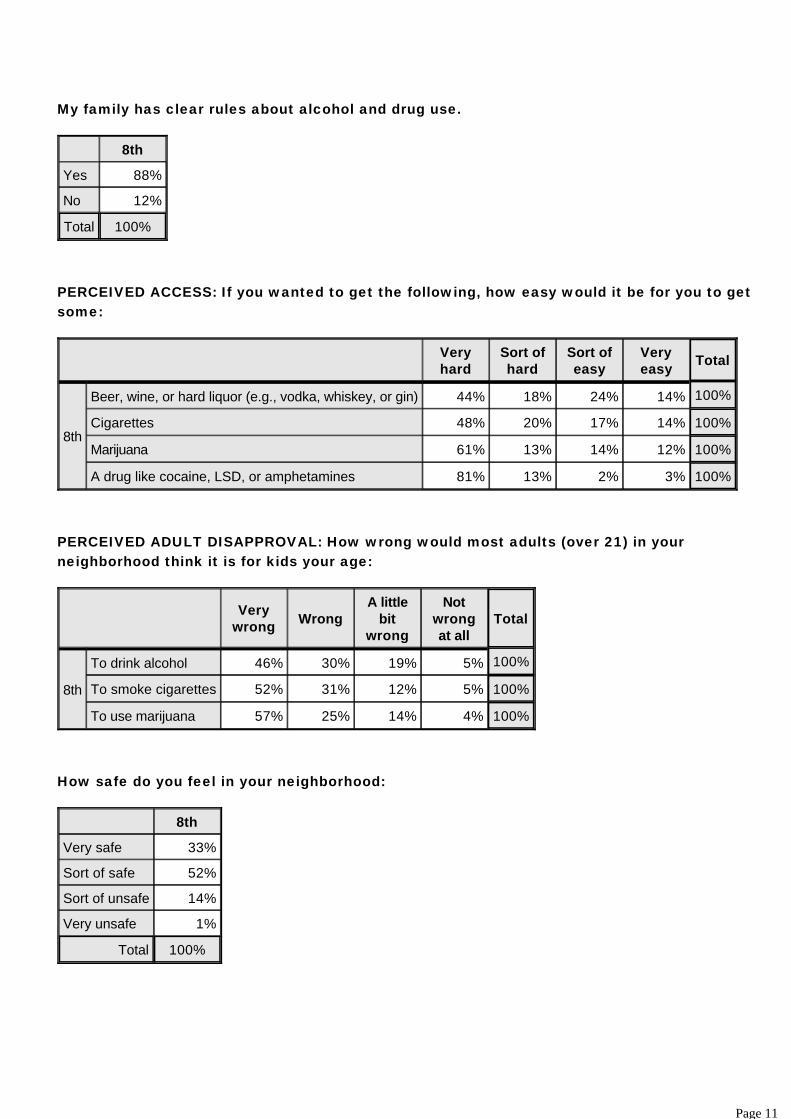
My family has clear rules about alcohol and drug use.
8th
Yes 88%
No 12%
Total 100%
PERCEIVED ACCESS: If you wanted to get the following, how easy would it be for you to get
some:
Veryhard
Sort ofhard
Sort ofeasy
Veryeasy
Total
8th
Beer, wine, or hard liquor (e.g., vodka, whiskey, or gin) 44% 18% 24% 14% 100%
Cigarettes 48% 20% 17% 14% 100%
Marijuana 61% 13% 14% 12% 100%
A drug like cocaine, LSD, or amphetamines 81% 13% 2% 3% 100%
PERCEIVED ADULT DISAPPROVAL: How wrong would most adults (over 21) in your
neighborhood think it is for kids your age:
Very
wrongWrong
A littlebit
wrong
Notwrongat all
Total
8th
To drink alcohol 46% 30% 19% 5% 100%
To smoke cigarettes 52% 31% 12% 5% 100%
To use marijuana 57% 25% 14% 4% 100%
How safe do you feel in your neighborhood:
8th
Very safe 33%
Sort of safe 52%
Sort of unsafe 14%
Very unsafe 1%
Total 100%
Page 11

TOBACCO SUPPLY SOURCE AMONG ALL STUDENTS: During the past year, how often did you
get cigarettes or other tobacco products from the following sources:
Did notsmoke
cigarettesor useother
tobaccoproducts
duringthe past
year
Never Sometimes Often Total
8th
I bought them at a gas station 95% 4% 1% 0% 100%
I bought them at a store 95% 3% 2% 0% 100%
I bought them from a vending machine 95% 5% 0% 0% 100%
I gave a stranger money to buy them for me 96% 2% 0% 2% 100%
I bought them over the Internet 96% 4% 0% 0% 100%
A friend gave them to me 96% 1% 2% 1% 100%
My older brother or sister gave them to me 96% 4% 0% 0% 100%
My parent gave them to me 96% 4% 0% 0% 100%
I took them from a store 96% 3% 1% 0% 100%
I took them from home without my parents knowing it 96% 4% 0% 0% 100%
Page 12
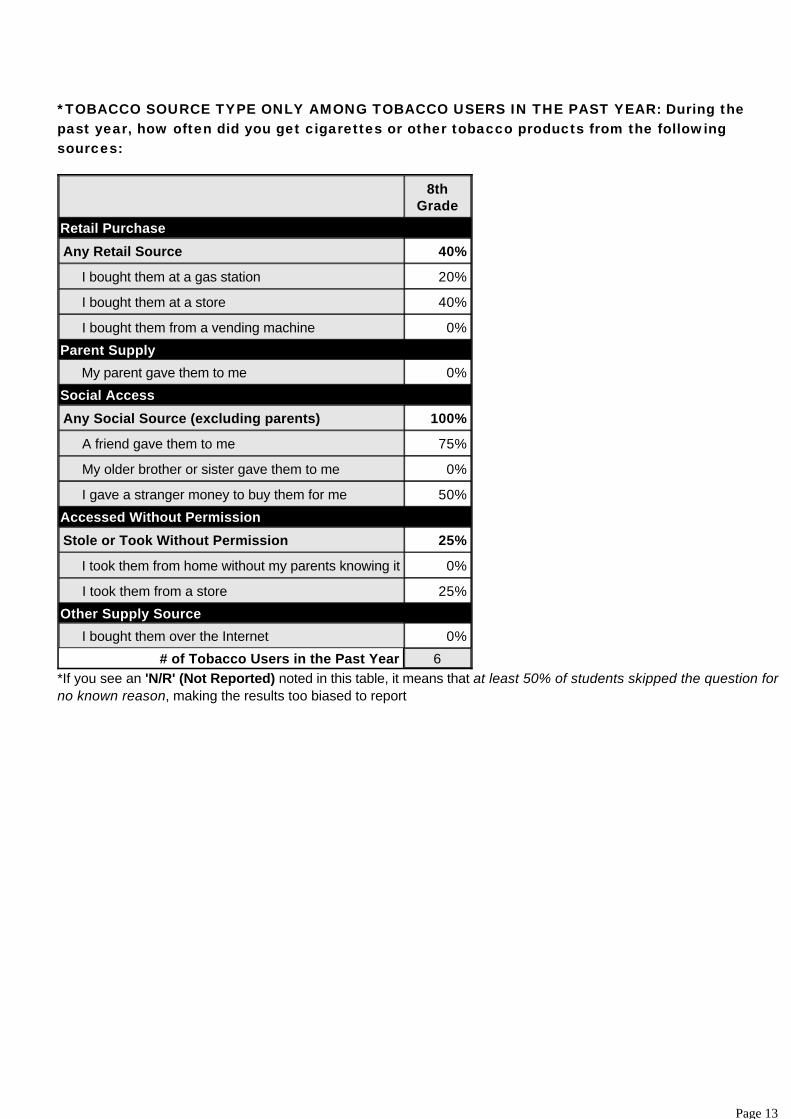
*TOBACCO SOURCE TYPE ONLY AMONG TOBACCO USERS IN THE PAST YEAR: During the
past year, how often did you get cigarettes or other tobacco products from the following
sources:
8thGrade
Retail Purchase
Any Retail Source 40%
I bought them at a gas station 20%
I bought them at a store 40%
I bought them from a vending machine 0%
Parent Supply
My parent gave them to me 0%
Social Access
Any Social Source (excluding parents) 100%
A friend gave them to me 75%
My older brother or sister gave them to me 0%
I gave a stranger money to buy them for me 50%
Accessed Without Permission
Stole or Took Without Permission 25%
I took them from home without my parents knowing it 0%
I took them from a store 25%
Other Supply Source
I bought them over the Internet 0%
# of Tobacco Users in the Past Year 6
*If you see an 'N/R' (Not Reported) noted in this table, it means that at least 50% of students skipped the question for
no known reason, making the results too biased to report
Page 13

ALCOHOL SUPPLY SOURCE AMONG ALL STUDENTS: During the past year, how often did you
usually get your own beer, wine or liquor from the following sources:
Did notdrinkbeer,
wine orliquorduring
the pastyear
Never Sometimes Often Total
8th
I bought it at a gas station 81% 19% 0% 0% 100%
I bought it at a store 81% 17% 2% 0% 100%
I bought it at a bar or restaurant 81% 19% 0% 0% 100%
I gave a stranger money to buy it for me 81% 18% 0% 1% 100%
I bought it over the Internet 82% 18% 0% 0% 100%
A friend gave it to me 81% 8% 10% 1% 100%
My older brother or sister gave it to me 81% 17% 2% 0% 100%
My parents WITH their permission 80% 11% 8% 1% 100%
My parents WITHOUT their permission 81% 16% 4% 0% 100%
An adult (other than my parents) WITH that adult's permission 80% 14% 5% 1% 100%
An adult (other than my parents) WITHOUT that adult's permission 81% 14% 5% 0% 100%
I took it from a store 81% 18% 1% 0% 100%
I got it at a party 78% 9% 10% 2% 100%
Page 14

*ALCOHOL SOURCE TYPE ONLY AMONG ALCOHOL USERS IN THE PAST YEAR: During the past
year, how often did you usually get your own beer, wine or liquor from the following sources:
8thGrade
Retail Purchase
Any Retail Source 12%
I bought it at a bar or restaurant 0%
I bought it at a gas station 0%
I bought it at a store 12%
Parent Supply
My parents WITH their permission 47%
Social Access
Any Social Source (excluding parents) 74%
A friend gave it to me 56%
I got it at a party 58%
I gave a stranger money to buy it for me 6%
My older brother or sister gave it to me 12%
An adult (other than my parents) WITH that adult's permission 29%
Accessed Without Permission
Stole or Took Without Permission 31%
I took it from a store 6%
My parents WITHOUT their permission 19%
An adult (other than my parents) WITHOUT that adult's permission 25%
Other Supply Source
I bought it over the Internet N/R
# of Alcohol Users in the Past Year 31
*If you see an 'N/R' (Not Reported) noted in this table, it means that at least 50% of students skipped the question for
no known reason, making the results too biased to report
Page 15

(4) Interpersonal Conflict, Violence and Delinquency
DELINQUENCY: How many times in the past year (12 months) have you:
Never1-2
times3-5
times
6 ormoretimes
Total
8th
Been in a physical fight 59% 27% 9% 6% 100%
Carried a weapon such as a handgun, knife or club 90% 3% 4% 2% 100%
Sold illegal drugs 99% 0% 0% 1% 100%
Been drunk or high at school 97% 2% 1% 0% 100%
Do you currently belong to a "street gang":
8th
Yes 3%
No 97%
Total 100%
BULLYING EXPERIENCES: During the past 12 months, has another student at school:
8th
Bullied you by calling you names 21%
Threatened to hurt you 14%
Bullied you by hitting, punching, kicking, or pushing you 10%
Bullied, harassed or spread rumors about you on the Internet or through text messages 16%
Ever bullied (reported at least 1 type of bullying) 35%
Intensely bullied (reported all types of bullying) 2%
BIAS-BASED BULLYING: In the past 12 months at school, how often have you been bullied,
harassed, or made fun of because of:
Never1-2
times3-5
times
6 ormoretimes
Total
8th Your appearance or a disability 72% 19% 4% 4% 100%
Page 16

DATING VIOLENCE: During the past 12 months, have any of the following been done by
someone in a dating relationship with you:
I havenot
begunto date
Yes No Not sure Total
8th Slapped, kicked, punched, hit, or threatened you 24% 2% 71% 2% 100%
Page 17

(5) Academic and School Experiences
TRUANCY: About how many days are you absent from school during an entire year:
8th
0-9 days 95%
10-19 days 5%
20-30 days 0%
More than 30 days 0%
Total 100%
ACTIVITIES AND OPPORTUNITIES: In which of the following activities do you participate:
8th
% N
School sports team 61% 57
Other sports 52% 47
Service clubs (e.g., scouting, 4H) 15% 13
Other activity clubs (e.g., Boys & Girls, YMCA, etc.) 40% 36
Service or volunteer projects 27% 24
Church youth group or other faith-based youth group 28% 24
Youth drug prevention leadership group 12% 10
ACTIVITIES AND OPPORTUNITIES: Participation in activities:
8th
0 activities 14%
1 activity 25%
2 or more activities 61%
Total 100%
Page 18

ACADEMIC ACHIEVEMENT: Putting them all together, what were your grades like for the last
year:
8th
Mostly A 22%
Mostly A and B 37%
Mostly B 1%
Mostly B and C 34%
Mostly C 6%
Mostly C and D 0%
Mostly D 0%
Mostly F 0%
Total 100%
SCHOOL CLIMATE/CARING ADULTS: At my school, there is a teacher or some other adult:
Not at all
trueA littletrue
Prettymuchtrue
Verymuchtrue
Total
8th
Who really cares about me 9% 12% 34% 46% 100%
Who notices when I'm not there 8% 11% 31% 51% 100%
Who listens to me when I have something to say 7% 15% 32% 46% 100%
Who notices if I have trouble learning something 6% 11% 39% 44% 100%
SCHOOL CLIMATE/HIGH EXPECTATIONS: At my school, there is a teacher or some other adult:
Not at all
trueA littletrue
Prettymuchtrue
Verymuchtrue
Total
8th
Who tells me when I do a good job 8% 11% 23% 58% 100%
Who always wants me to do my best 3% 9% 21% 67% 100%
Who believes I will be a success 3% 7% 32% 59% 100%
Who encourages me to work hard in school 4% 7% 26% 63% 100%
Page 19

SCHOOL CLIMATE/MEANINGFUL PARTICIPATION: How true are the following statements:
Not at all
trueA littletrue
Prettymuchtrue
Verymuchtrue
Total
8th
At school, I do interesting activities 9% 27% 37% 28% 100%
At school, I help decide things like class activities or rules 17% 35% 24% 25% 100%
At school, I do things that make a difference 12% 32% 31% 24% 100%
SCHOOL CLIMATE/SCHOOL CONNECTEDNESS: How strongly do you agree or disagree with the
following statements about your school:
Stronglydisagree
Disagree
Neitheragreenor
disagree
AgreeStrongly
agreeTotal
8th
I feel close to people at this school 4% 1% 15% 40% 40% 100%
I am happy to be at this school 8% 5% 11% 42% 34% 100%
I feel safe in my school 2% 0% 12% 38% 48% 100%
The teachers at this school treat students fairly 4% 5% 21% 45% 24% 100%
During the past 30 days, how many days did you not go to school because you felt you would
be unsafe at school or on your way to or from school:
8th
0 days 96%
1 day 3%
2 or 3 days 1%
4 or 5 days 0%
6 or more days 0%
Total 100%
Page 20

During the past 12 months, how many times on school property have you been in a physical
fight:
8th
0 times 82%
1 time 12%
2 or 3 times 3%
4 or more times 2%
Total 100%
Page 21

(6) Mental, Social and Physical Health
During the past 12 months did you ever:
8th
% N
Feel so sad or hopeless almost every day for two weeks or more in a row that you stopped doing someusual activities
26% 25
Is there an adult you know (other than your parent) you could talk to about important things in
your life:
NoYes, one
adult
Yes,morethanoneadult
Total
8th 14% 20% 67% 100%
Average (mean, median) height and weight:
8th
Mean Median N
Height (in feet) 5.4 5.4 79
Weight (in pounds) 133.1 132.0 76
BMI (Body Mass Index) Categories based on CDC guidelines:
8th
% N
Underweight 1% 1
Healthy weight 71% 51
Overweight 18% 13
Obese 10% 7
Total 100% 72
Page 22

How do you describe your weight:
8th
Very underweight 5%
Slightly underweight 11%
About the right weight 55%
Slightly overweight 28%
Very overweight 1%
Total 100%
In a typical week, how often do you and your parent(s) or guardian(s) eat dinner together:
8th
Never 18%
1 day 4%
2 days 6%
3 days 6%
4 days 9%
5 days 13%
6 days 3%
7 days 40%
Total 100%
During the past 7 days, how many times did you:
0 timesduring
the past7 days
1 to 3times
duringthe past7 days
4 to 6times
duringthe past7 days
1 timeper day
2 timesper day
3 timesper day
4 ormoretimes
per day
Total
8thEat fruit 3% 24% 18% 6% 15% 7% 26% 100%
Eat vegetables 10% 24% 21% 7% 9% 9% 20% 100%
Page 23

On an average school day, how many hours do you watch TV:
8th
I do not watch TV on an average school day 9%
Less than 1 hour per day 11%
1 hour per day 11%
2 hours per day 15%
3 hours per day 25%
4 hours per day 13%
5 or more hours per day 16%
Total 100%
During the past 7 days, on how many days were you physically active for a total of at least 60
minutes per day:
8th
0 days 10%
1 day 9%
2 days 14%
3 days 11%
4 days 12%
5 days 12%
6 days 6%
7 days 26%
Total 100%
Page 24

Summary Charts
Summary charts provide a snapshot of selected health and social indicators. All charts provide grade-level data. Somecharts illustrate comparisons between one grade level of Your Students in 2012 with the same grade level in a statewide
random sample of Illinois Students in 2010 (as noted in the introduction to your report). Other charts provide a
comparison of Your Students in 2012 across all grades surveyed to easily surface developmental trends.
Your report may not contain the full array of charts listed below. As noted in the introduction to your report, therewill be NO DATA presented in this report for any grade level with fewer than 10 valid surveys in order to protect theconfidentiality of your students. In addition, the IYS 6th and 8th grade forms contain a subset of the questions asked onthe IYS high school form. As a result, some of the charts listed below may not be included in your report. Informationabout the availability of grade-specific charts or data is defined for each chart below. If an item within a chart is notdisplayed for a grade level (most often 6th and 8th grades), a footnote is included on the chart to explain.
Substance Use Behaviors and Consequences Substance Use in the Past Year
Separate chart displayed for each grade level surveyedYour Students in 2012 compared to Illinois Students in 2010
Substance Use in the Past 30 Days
Separate chart displayed for each grade level surveyedYour Students in 2012 compared to Illinois Students in 2010
Average Age of First Use: Among 12th Graders Having Ever Used the Drug
ONLY reported for 12th gradersYour Students in 2012 compared to Illinois Students in 2010
First Use Before Age 15: Among 12th Graders Having Ever Used the Drug
ONLY reported for 12th gradersYour Students in 2012 compared to Illinois Students in 2010
Source of Alcohol in the Past Year: Among Alcohol Users
Separate chart displayed for each grade level surveyed (these items are not included on the IYS 6th grade form)Your Students in 2012 compared to Illinois Students in 2010Note that alcohol sources are classified into types based on responses to a specific set of questions on the IYS. Todetermine what items are included in each type of alcohol source, refer to the relevant tables in the “Drug UseContributing Factors” section of this report.
Source of Tobacco in the Past Year: Among Tobacco Users
Separate chart displayed for each grade level surveyed (these items are not included on the IYS 6th grade form)Your Students in 2012 compared to Illinois Students in 2010Note that tobacco sources are classified into types based on responses to a specific set of questions on the IYS.To determine what items are included in each type of tobacco source, refer to the relevant tables in the “Drug UseContributing Factors” section of this report.
Driving Under the Influence in the Past Year
Separate chart displayed for each grade level surveyed (NOT included on the IYS 6th grade or 8th grade forms)Your Students in 2012 compared to Illinois Students in 2010
High School Students Who May Benefit from an Individual Substance Abuse Assessment: By Grade in 2012
One chart displaying all grade levels surveyed (NOT included on the IYS 6th grade or 8th grade forms)No comparisons between Your Students in 2012 and Illinois Students in 2010 are available because the questionsfrom the CRAFFT Screening Tool are new in the 2012 IYS.
Interpersonal Violence and Safety Bullying Victimization in the Past 12 Months
Separate chart displayed for each grade level surveyedYour Students in 2012 compared to Illinois Students in 2010
Page 25

Extent of Bullying in the Past 12 Months: By Grade in 2012
One chart displaying all grade levels surveyedNo comparisons between Your Students in 2012 and Illinois Students in 2010 are available because one additionalform of bullying (cyber-bullying) is new in the 2012 IYS, making the 2010 vs. 2012 summaries incomparable.
Bias-Based Bullying Victimization in the Past 12 Months: By Grade in 2012
One chart displaying all grade levels surveyedNo comparisons between Your Students in 2012 and Illinois Students in 2010 are available because the bias-basedbullying questions are new in the 2012 IYS.
Dating Violence in the Past 12 Months By Grade
Dating Violence is defined as being “punched, hit or threatened in a dating relationship.”One chart displaying all grade levels surveyed (NOT asked on the 6th grade IYS form)Your Students in 2012 compared to Illinois Students in 2010
School ClimateStudent Perceptions of School Climate Mean Scores
Separate chart displayed for each grade level surveyedYour Students in 2012 compared to Illinois Students in 2010In order to compare perceptions across different dimensions of school climate, a mean score for each schoolclimate scale (Caring Adults, High Expectations, Meaningful Participation, and School Connectedness) is
adjusted to a 4point scale, where “1”= the least positive and “4”= the most positive perception. To determine whatIYS questions are included in each school climate scale, refer to the relevant tables in the “Academic and SchoolExperiences” section of this report.
Student Perceptions of School Climate Mean Scores: By Grade in 2012
One chart displaying all grade levels surveyedIn order to compare perceptions across different dimensions of school climate, a mean score for each schoolclimate scale (Caring Adults, High Expectations, Meaningful Participation, and School Connectedness) is
adjusted to a 4point scale, where “1”= the least positive and “4”= the most positive perception. To determine whatIYS questions are included in each school climate scale, refer to the relevant tables in the “Academic and SchoolExperiences” section of this report.
Mental and Physical Health Mental Health Concerns in the Past 12 Months
Separate chart displayed for each grade level surveyed (NOT asked on the IYS 6th grade form)Your Students in 2012 compared to Illinois Students in 2010
Prevalence of Obesity According to BMI
Obesity is defined by the Centers for Disease Control based on Body Mass Index (BMI) as calculated by a self-reported height and weight ratio for age and genderOne chart displaying all grade levels surveyedYour Students in 2012 compared to Illinois Students in 2010
Nutrition Behavior
Separate chart displayed for each grade level surveyedYour Students in 2012 compared to Illinois Students in 2010
Frequency of Physical Activity
Separate chart displayed for each grade level surveyedYour Students in 2012 compared to Illinois Students in 2010
Sedentary Activity: TV Watching Behavior
One chart displaying all grade levels surveyedYour Students in 2012 compared to Illinois Students in 2010
Page 26

Substance Use in the Past YearAmong 8th Grade Youth
* Questions not asked on IYS 6th grade form
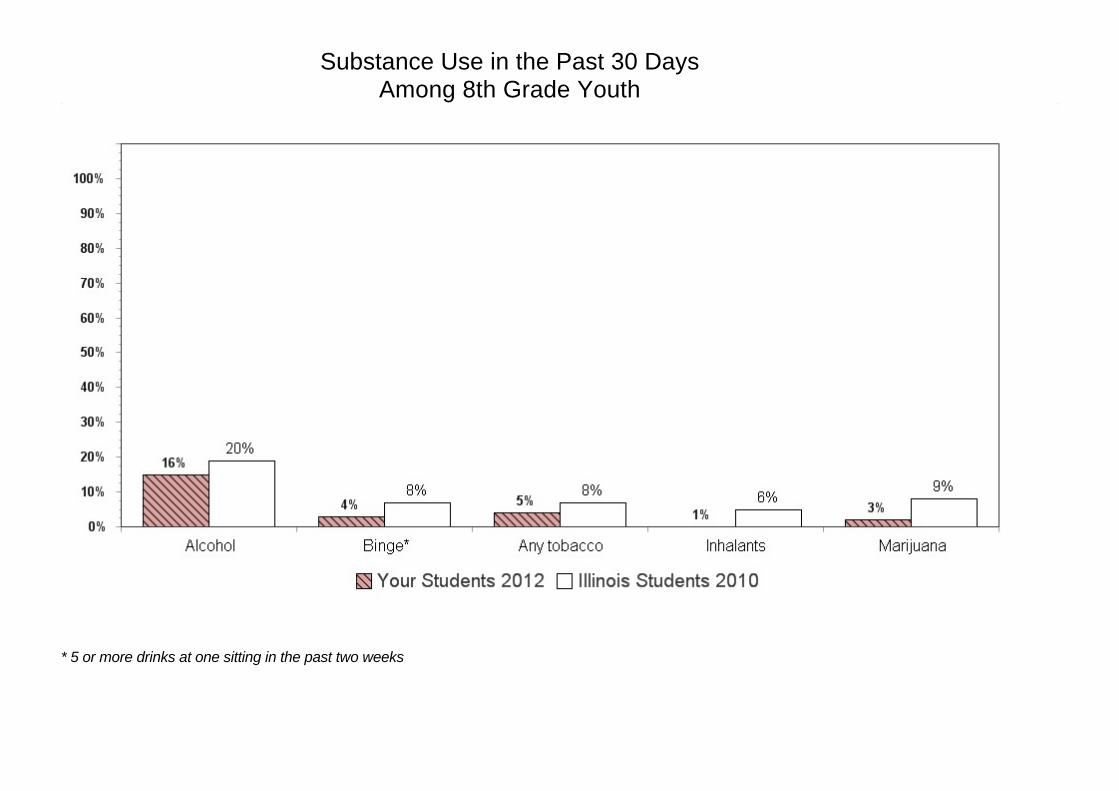
Substance Use in the Past 30 DaysAmong 8th Grade Youth
* 5 or more drinks at one sitting in the past two weeks
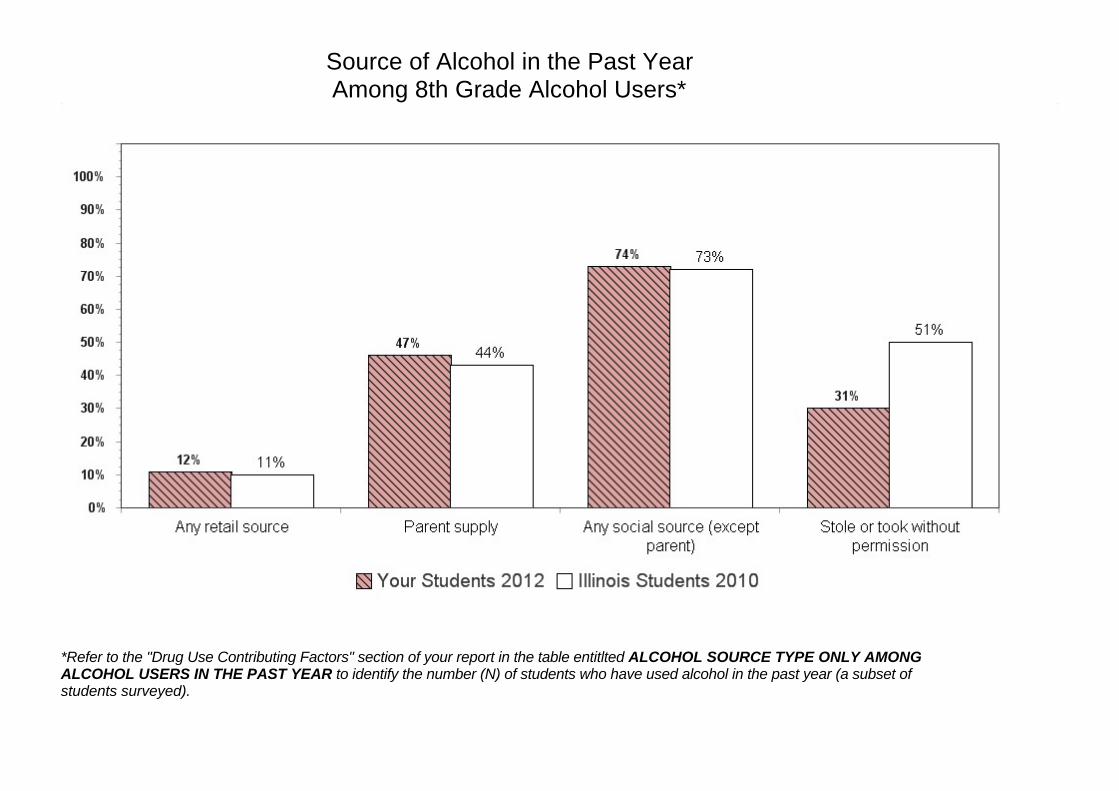
Source of Alcohol in the Past YearAmong 8th Grade Alcohol Users*
*Refer to the "Drug Use Contributing Factors" section of your report in the table entitlted ALCOHOL SOURCE TYPE ONLY AMONGALCOHOL USERS IN THE PAST YEAR to identify the number (N) of students who have used alcohol in the past year (a subset ofstudents surveyed).

Source of Tobacco in the Past YearAmong 8th Grade Tobacco Users*
*Refer to the "Drug Use Contributing Factors" section of your report in the table entitlted TOBACCO SOURCE TYPE ONLY AMONGTOBACCO USERS IN THE PAST YEAR to identify the number (N) of students who have used alcohol in the past year (a subset ofstudents surveyed).

Bullying Victimization in the Past 12 MonthsAmong 8th Grade Youth
*Question was not included on any 2010 IYS form, therefore no state comparisons can be made

Extent of Bullying in the Past 12 MonthsBy Grade in 2012
*Victimized in ONE OR MORE of the following ways: called names, threatened, physically assaulted, cyber-bullied** Victimized in ALL of the following ways: called names, threatened, physically assaulted, cyber-bullied

Bias-Based Bullying Victimization in the Past 12 MonthsBy Grade in 2012
* Question asked only on IYS high school form

Dating Violence* in the Past 12 MonthsBy Grade
* Punched, hit, or threatened in a dating relationship

Student Perceptions of School Climate Mean ScoresAmong 8th Grade Youth

Student Perceptions of School Climate Mean ScoresBy Grade in 2012

Mental Health Concerns in the Past 12 MonthsAmong 8th Grade Youth
* Question asked only on IYS high school form
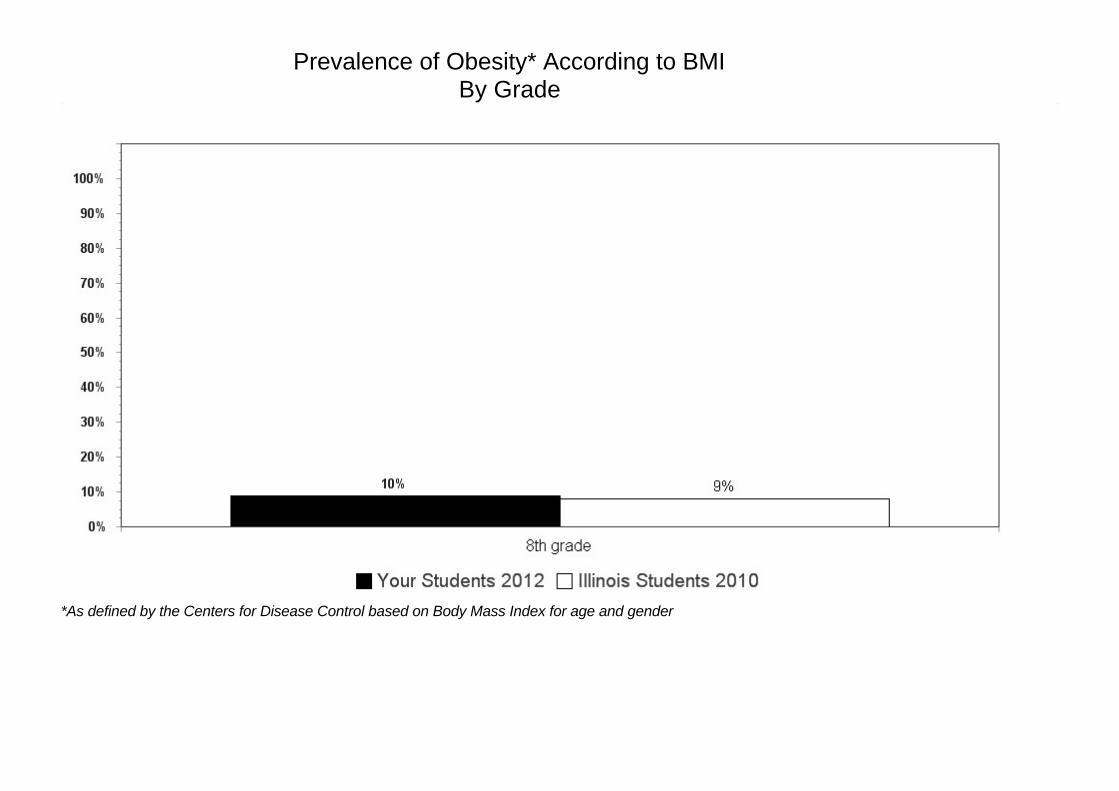
Prevalence of Obesity* According to BMIBy Grade
*As defined by the Centers for Disease Control based on Body Mass Index for age and gender

Nutrition BehaviorAmong 8th Grade Youth
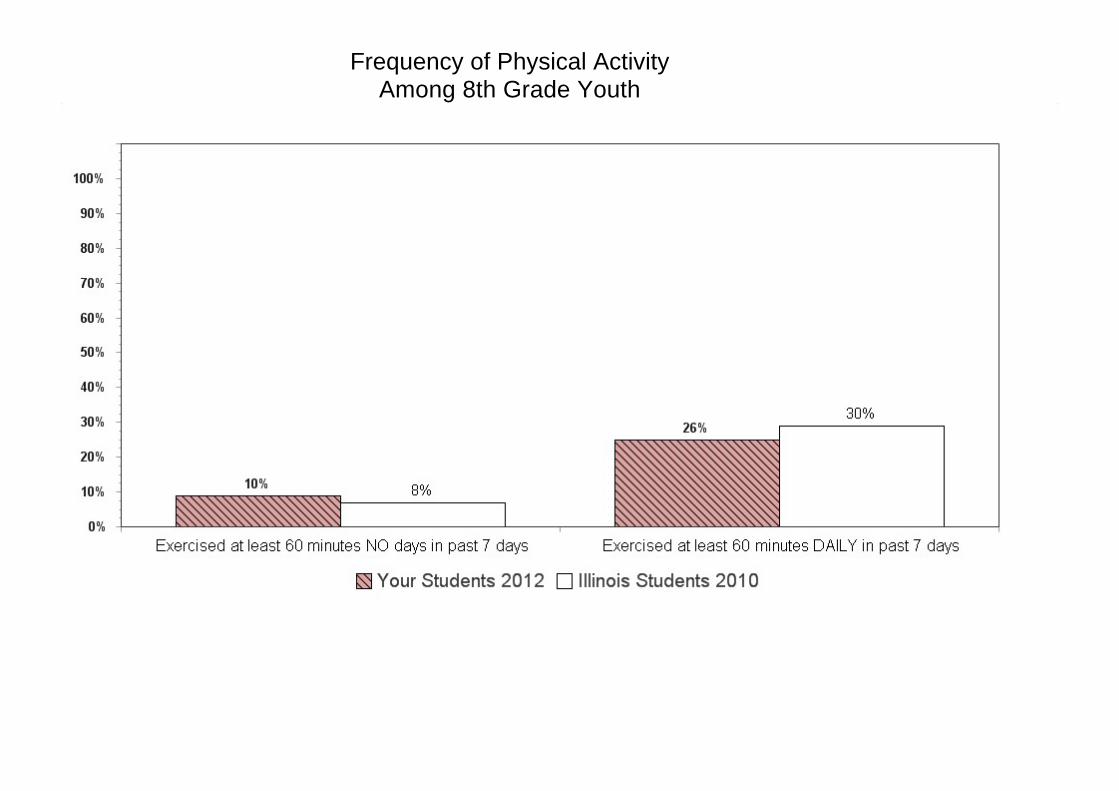
Frequency of Physical ActivityAmong 8th Grade Youth

Sedentary Activity: TV Watching Behavior*By Grade
* Watched TV 3 or more hours per day on an average school day