Embed Size (px)
Citation preview
THE URBAN INSTITUTE
Fundraising Effectiveness Project (FEP)
A project to help nonprofit organizations measure and compare their annual growth in giving by gain/loss category and increase the net by maximizing their gains and minimizing their losses
2012 Fundraising Effectiveness Survey Report FEP
Participating Donor Software Firms
Donor2/Campus Management Corporation* PhilanthrAppeal (FundTrack Software)*
DonorPerfect Fundraising Software* The Raiser’s Edge ® (Blackbaud)*
eTapestry* ROI Solutions
GiftWorks (Mission Research)* Sage Software*
MatchMaker FundRaising Software* Telosa Software (Exceed!) Metafile*
* Charter member of the AFP Donor Software Workgroup
Project Sponsors
Association of Fundraising Professionals (AFP)* Center on Nonprofits and Philanthropy at the Urban Institute*
Association of Donor Relations Professionals (ADRP) Center on Philanthropy at Indiana University
Council for Advancement and Support of Education (CASE) Council for Resource Development (CRD) National Committee on Planned Giving (NCPG)
* Founding partners, providing resources for the project.
Gain
Loss
Net
1
2012 Fundraising Effectiveness Survey Report
Contents Executive Summary ....................................................................................................................................................... 2
About the Fundraising Effectiveness Project ................................................................................................................. 2
Why Analyzing Fundraising Gains and Losses Is Important for Fundraising Effectiveness .......................................... 3
Project Method ............................................................................................................................................................... 6
Summary of 2010-2011 FEP Survey Findings ............................................................................................................... 8
Overview ..................................................................................................................................................... 8
Gains and Losses by Category ................................................................................................................... 9
Significance of Size of Organization ........................................................................................................... 9
Gains and Losses by Percentile ............................................................................................................... 11
Figure 6a shows that in all percentile levels, the largest growth came from new gifts, and the pattern was most pronounced in the highest levels. ............................................................................................. 11
Implications of the FEP Data for Fundraising Decision Makers ................................................................................... 15
Examining the Ratio of Gains to Losses ................................................................................................... 15
Strategies Suggested by FEP ................................................................................................................... 15
Investing to Maximize Fundraising Results .............................................................................................. 15
Setting Fundraising Goals for Doubling Annual Giving ............................................................................. 16
Taking the Next Steps .............................................................................................................................. 16
Appendices .................................................................................................................................................................. 17
A. Detailed 2010-2011 Fundraising Effectiveness Survey Statistics ..................................................... 17
B. How to Respond to the FEP Survey and Extract and Configure Your Organization’s Gain/Loss Donor Tracking Data ......................................................................................................................... 25
2
Executive Summary The 2012 Fundraising Effectiveness Project report summarizes data from 3,184 survey respondents received as of February 2012, covering year-to-year fundraising results for 2010-2012. The report shows that:
• Gains of $1.1 billion in gifts from new, upgraded current, and previously lapsed donors were offset by losses of $1.1 billion through reduced gifts and lapsed donors. This means that, while there was a very small, positive $1 million net growth-in-giving, every $100 gained in 2011 was offset by $100 in losses through gift attrition. That is, 100 percent of gains in giving were offset by losses in giving.
• Gains of 1.3 million in new and previously lapsed donors were offset by losses of 1.4 million in lapsed donors. This means that there was a negative (86,437) growth-in-donors and every 100 donors gained in 2011 was offset by 107 in lost donors through attrition. That is, 107 percent of the donors gained were offset by lapsed donors.
• Growth-in-giving performance varies significantly according to organization size (based on total amount raised), with larger organizations performing much better than smaller ones.
o Organizations raising $500,000 or more had an average 10 percent net gain.
o Organizations raising $100,000 to $500,000 had an average 0.8 percent net gain.
o Organizations in the under $100,000 groups had an average net loss of -9.6 percent.
• The largest growth in gift dollars/donors came from new gifts/donors, and the pattern was most pronounced in the organizations with the highest growth-in-giving ratios.
• The greatest losses in gift dollars/donors came from lapsed new gifts/donors, particularly in the organizations with the lowest growth-in-giving ratios.
About the Fundraising Effectiveness Project In 2006 the Association of Fundraising Professionals (AFP) and the Center on Nonprofits and Philanthropy at the Urban Institute established the Fundraising Effectiveness Project to conduct research on fundraising effectiveness and help nonprofit organizations increase their fundraising results at a faster pace. Organizations listed on the cover page have joined them as sponsors of the project.
The project goal is to help nonprofit organizations measure, compare, and maximize their annual growth in giving.
Making the Most of the Enormous Untapped Giving Potential For decades, research has indicated that there is an enormous untapped potential for giving in the United States. Yet, total giving as a percentage of gross domestic product (GDP) has averaged a flat two percent for the last 40 years. In addition to the annual FEP surveys, FEP research is also addressing the question: why hasn’t the sector been able to tap this potential and increase its share of the GDP pie?
The Fundraising Effectiveness Survey The groundbreaking annual Fundraising Effectiveness Survey, piloted in November 2006, collects fundraising data from nonprofit organizations beginning with data for 2004-2005. The Fundraising Effectiveness Survey enables participating groups to measure and compare their fundraising gain and loss ratios to those of similar organizations. Participants can use this industry data, which AFP offers free, to make better-informed, growth-oriented budget decisions to boost donor revenue.
3
FEP Survey Responses The 2012 Fundraising Effectiveness Survey Report is based on 3,184 responses for 2010-2011, received as of February, 2012, from nonprofit organizations in the United States. The 2010-2011 responses reflected a total amount raised of $2,049,794,709 for an average of $643,780 in amounts raised reported in 3,184 responses.
Additional Participants Are Invited The annual Fundraising Effectiveness Survey is ongoing and open to all nonprofit organizations. There is no charge to participate, and participating organizations receive access to the survey performance data. All information supplied by survey respondents is kept strictly anonymous and confidential, and results are reported in aggregate form only.
Donor Software Firms Facilitate Nonprofits’ Participation A critical element in the success of the Fundraising Effectiveness Survey has been the cooperation and support of the members of the AFP Donor Software Workgroup listed on the cover page. Collectively, they serve more than 50,000 nonprofit clients. If your donor software provider is not on this list, please ask them to participate. AFP and the other sponsors of the Fundraising Effectiveness Project encourage all firms to help their clients respond to the survey and measure and compare their annual growth in giving against the survey results.
These firms have assisted with the design of the survey and are ready to help their clients respond to the surveys. All of the firms have developed “all-electronic” software modules for the FEP surveys that eliminate the need for their clients to key the fundraising performance data manually into AFP’s web-based survey instrument. By working with the donor software community in this way, AFP is able to increase survey response rates, ensure greater accuracy in the data gathered, significantly save participating organizations on data-entry costs, and speed the data analysis process.
The AFP Donor Software Workgroup developed and recommended to AFP for endorsement the core FEP Gain/Loss Growth-in-Giving Performance Report (see Figure A1, Appendix A, page 17) for use by all nonprofits to measure their growth in giving. The content of this basic FEP report has remained unchanged since the FEP was initiated.
Participating software firms are incorporating the FEP standard report in their reporting modules. The FEP project has also developed downloadable templates that can produce this FEP report, enabling nonprofits to measure their own Gain/Loss performance over time and against the statistics in the appendices of the annual FEP reports. The downloadable Excel-based GiG Report template has instructions for retrieving gain/loss data from donor databases and automatically produces the"Core GiG Report" - the centerpiece of the FEP gain(loss) reporting package -- along with 7 other GiG Reports that are also useful.. All the GiG Reports in the GiG template are growth-oriented fundraising tools for tracking growth in giving by gain/loss category. The templates may be found online at www.afpnet.org/GiGtemplate.
The article “A Better Measure of Success: How to Use AFP’s Growth-in-Giving Reports to Improve Fundraising Performance” in the March-April, 2011, issue of Advancing Philanthropy introduces the GiG Reports, describes them and explains how to use them with CEOs and boards to help justify growth-oriented fundraising budgets. A copy of the article in PDF is available at http://www.afpnet.org/files/ContentDocuments/2011MarchApril_135-41FEPLevisWilliams.pdf.
Why Analyzing Fundraising Gains and Losses Is Important for Fundraising Effectiveness
Although nonprofit organizations usually watch their overall growth-in-giving results carefully, they seldom pay as close attention to the gains and losses that make up those results.
Looking only at the overall net performance (the “bottom line”) does not tell management and boards what is really happening in their fundraising or where to invest additional resources to improve fundraising effectiveness. Neither is
4
it sufficient to look only at the new gifts coming in. To understand what is really happening in a way that is useful for planning and budgeting, it is necessary to analyze both the fundraising gains and the fundraising losses – in dollars and donors -- from one year to the next. Significant losses can substantially reduce or eliminate the gains. For example, an organization that has gains in annual giving of 65% from one year to the next but has annual giving losses of 55%, achieves a net growth-in-giving of only 10%.
Growth in giving is increased both by maximizing gains and minimizing losses, and management and boards need to know this to make intelligent, informed, growth-oriented planning and budgetary decisions. The basic concept of the Fundraising Effectiveness Survey is that growth in giving from one year to the next is the net of gains minus losses. Gains consist of gifts by new donors and recaptured lapsed donors and increases in gift amounts by upgraded donors. Losses consist of decreases in gift amounts by downgraded donors and lost gifts from lapsed new and lapsed repeat donors. The net increase (or decrease) is the net of gains minus losses.
Continuing with the above example of an organization with gains of 65% and losses of 55% for a net of 10%, increasing gains by 10 percentage points—from 65% to 75%—would double the net growth from 10% to 20%.
Reducing losses by 10 percentage points—from 55% to 45%—would also double the net from 10% to 20%. And, a reduction of losses by 20 percentage points—to 35%—would triple the net to 30%.
It usually costs less to retain and motivate an existing donor than to attract a new one. For most organizations—and especially those that are sustaining losses or achieving only modest net gains in gifts and donors—taking positive steps to reduce gift and donor losses is the least expensive strategy for increasing net fundraising gains.
The data provided by the Fundraising Effectiveness Survey makes it possible for fundraisers, management, and boards of nonprofit organizations to not only compare the performance of their organization from one year to the next, but also to compare with the performance of other organizations in terms of total dollars raised and total number of donors in a variety of categories. With this information, they can make more informed, growth-oriented decisions about where to invest increased resources and effort to improve their fundraising effectiveness.
5
The Survey makes the following data available for each year in the database.
Total gift dollars Gains:
$ gained from new donors in current year $ gained from recaptured donors (former donors who did not give in previous year) $ gained from upgraded donors (donors who increased their gift from previous year)
Same: $ from donors who gave the same amount as in previous year
Losses: $ lost from downgraded donors (donors who gave less in the current year than in previous year)
$ lost from lapsed new donors (new donors in the previous year who did not give in current year) $ lost from lapsed repeat donors (repeat donors in previous year who did not give in current year)
Total number of donors Gains: # of new donors gained in the current year
# of recaptured donors gained (former donors who did not give in the previous year)
# of upgraded donors (donors who increased their gift from the previous year)
Same: # of donors who gave the same amount as in the previous year
Losses: # of downgraded donors (donors who gave less in the current year than in the previous year)
# of lapsed new donors (new donors in the previous year who did not give in the current year)
# of lapsed repeat donors (repeat donors in the previous year who did not give in the current year)
As the survey proceeds, data is added to the database each year, providing historical data for analysis of trends over time (see seven-year comparison of gain/loss ratios, Figure A2a and A2b, Appendix A).
The charts and tables in this report are based on data for 3,184 respondents for the year 2010-2011.
6
Project Method Automatic Data Extraction Thanks to FEP survey software provided by the participating donor software firms, each participating nonprofit organization is able to extract its data for the survey automatically from its donor tracking software system—taking less than five minutes per submission. Annually, each participating nonprofit uploads its data electronically to the FEP survey application on the Urban Institute website. Next, using the data extracted for the FEP survey, participants generate “Growth-in-Giving Performance Reports” for their organizations.
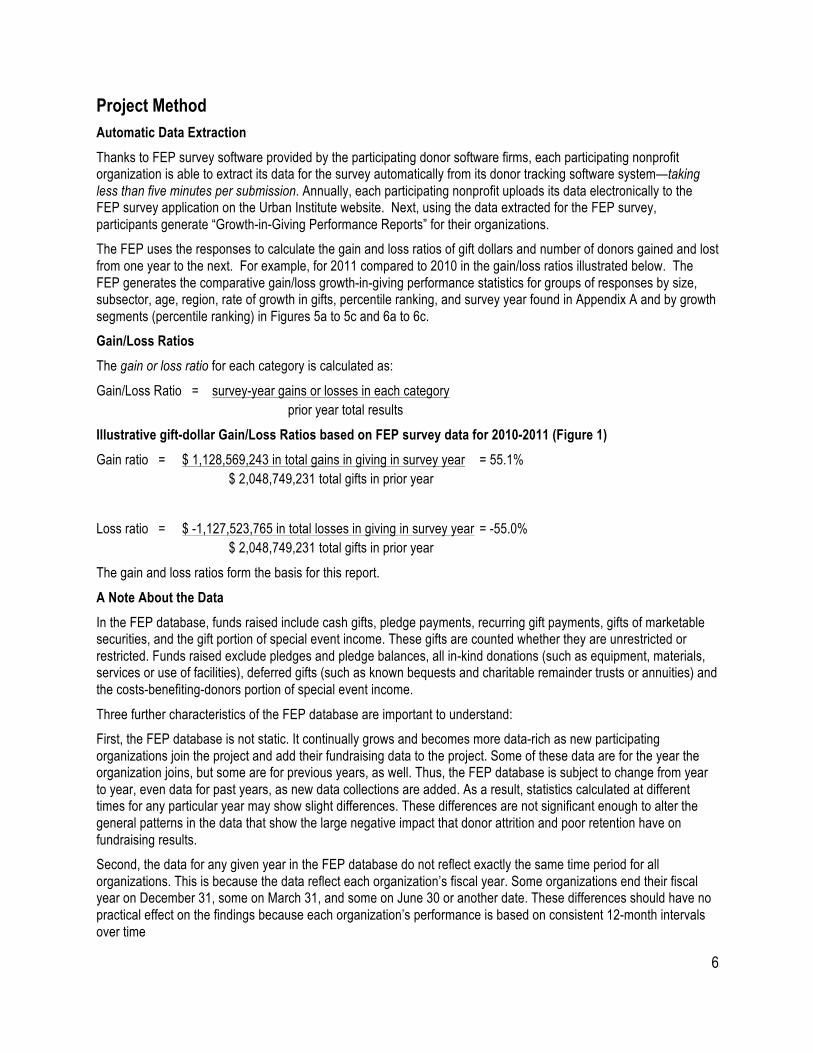
The FEP uses the responses to calculate the gain and loss ratios of gift dollars and number of donors gained and lost from one year to the next. For example, for 2011 compared to 2010 in the gain/loss ratios illustrated below. The FEP generates the comparative gain/loss growth-in-giving performance statistics for groups of responses by size, subsector, age, region, rate of growth in gifts, percentile ranking, and survey year found in Appendix A and by growth segments (percentile ranking) in Figures 5a to 5c and 6a to 6c.
Gain/Loss Ratios The gain or loss ratio for each category is calculated as:
Gain/Loss Ratio = survey-year gains or losses in each category prior year total results
Illustrative gift-dollar Gain/Loss Ratios based on FEP survey data for 2010-2011 (Figure 1) Gain ratio = $ 1,128,569,243 in total gains in giving in survey year = 55.1% $ 2,048,749,231 total gifts in prior year
Loss ratio = $ -1,127,523,765 in total losses in giving in survey year = -55.0% $ 2,048,749,231 total gifts in prior year
The gain and loss ratios form the basis for this report.
A Note About the Data In the FEP database, funds raised include cash gifts, pledge payments, recurring gift payments, gifts of marketable securities, and the gift portion of special event income. These gifts are counted whether they are unrestricted or restricted. Funds raised exclude pledges and pledge balances, all in-kind donations (such as equipment, materials, services or use of facilities), deferred gifts (such as known bequests and charitable remainder trusts or annuities) and the costs-benefiting-donors portion of special event income.
Three further characteristics of the FEP database are important to understand:
First, the FEP database is not static. It continually grows and becomes more data-rich as new participating organizations join the project and add their fundraising data to the project. Some of these data are for the year the organization joins, but some are for previous years, as well. Thus, the FEP database is subject to change from year to year, even data for past years, as new data collections are added. As a result, statistics calculated at different times for any particular year may show slight differences. These differences are not significant enough to alter the general patterns in the data that show the large negative impact that donor attrition and poor retention have on fundraising results.
Second, the data for any given year in the FEP database do not reflect exactly the same time period for all organizations. This is because the data reflect each organization’s fiscal year. Some organizations end their fiscal year on December 31, some on March 31, and some on June 30 or another date. These differences should have no practical effect on the findings because each organization’s performance is based on consistent 12-month intervals over time

7
Third, the results reported here are not representative of the entire nonprofit sector, since the data collected for the FEP surveys are collected via voluntary submissions, not from a representative sampling of all nonprofit organizations. Most participants in the surveys are small to midsize organizations—averaging $643,780 in annual giving for the 3,184 responses reflected in this report. One reason this average is relatively low is because many large organizations with proprietary software or “enterprise” systems are not participating in the survey.
8
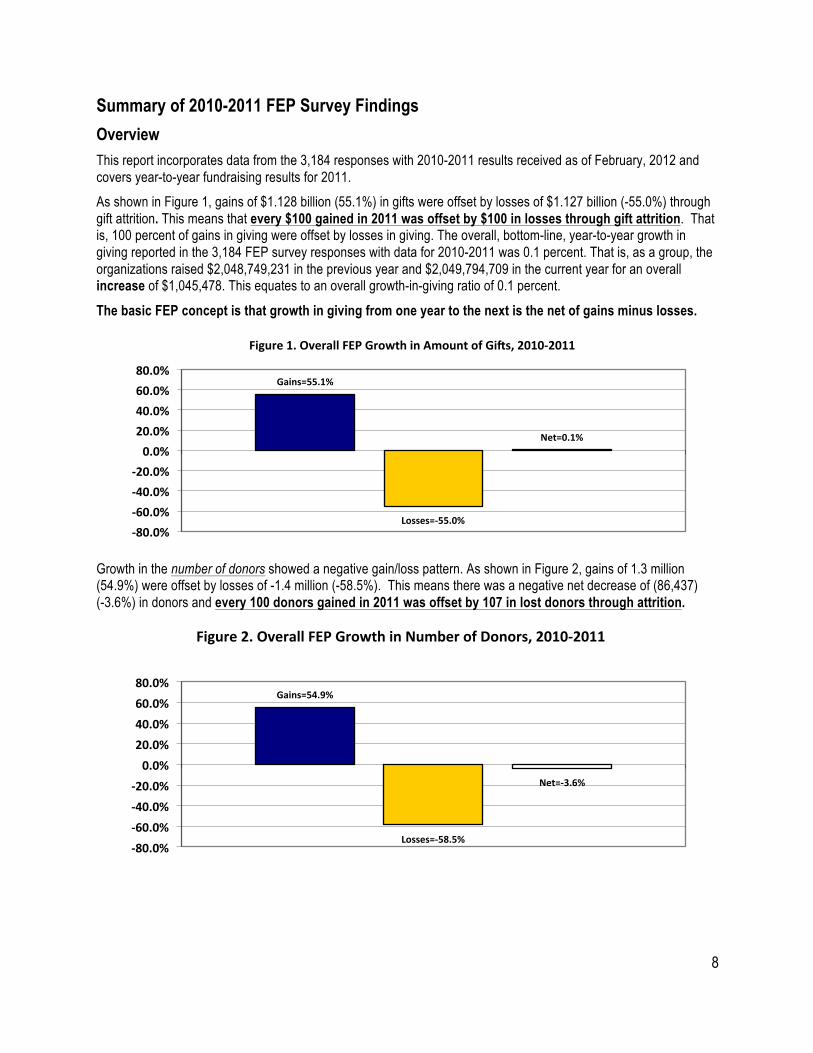
Summary of 2010-2011 FEP Survey Findings Overview This report incorporates data from the 3,184 responses with 2010-2011 results received as of February, 2012 and covers year-to-year fundraising results for 2011.
As shown in Figure 1, gains of $1.128 billion (55.1%) in gifts were offset by losses of $1.127 billion (-55.0%) through gift attrition. This means that every $100 gained in 2011 was offset by $100 in losses through gift attrition. That is, 100 percent of gains in giving were offset by losses in giving. The overall, bottom-line, year-to-year growth in giving reported in the 3,184 FEP survey responses with data for 2010-2011 was 0.1 percent. That is, as a group, the organizations raised $2,048,749,231 in the previous year and $2,049,794,709 in the current year for an overall increase of $1,045,478. This equates to an overall growth-in-giving ratio of 0.1 percent.
The basic FEP concept is that growth in giving from one year to the next is the net of gains minus losses.
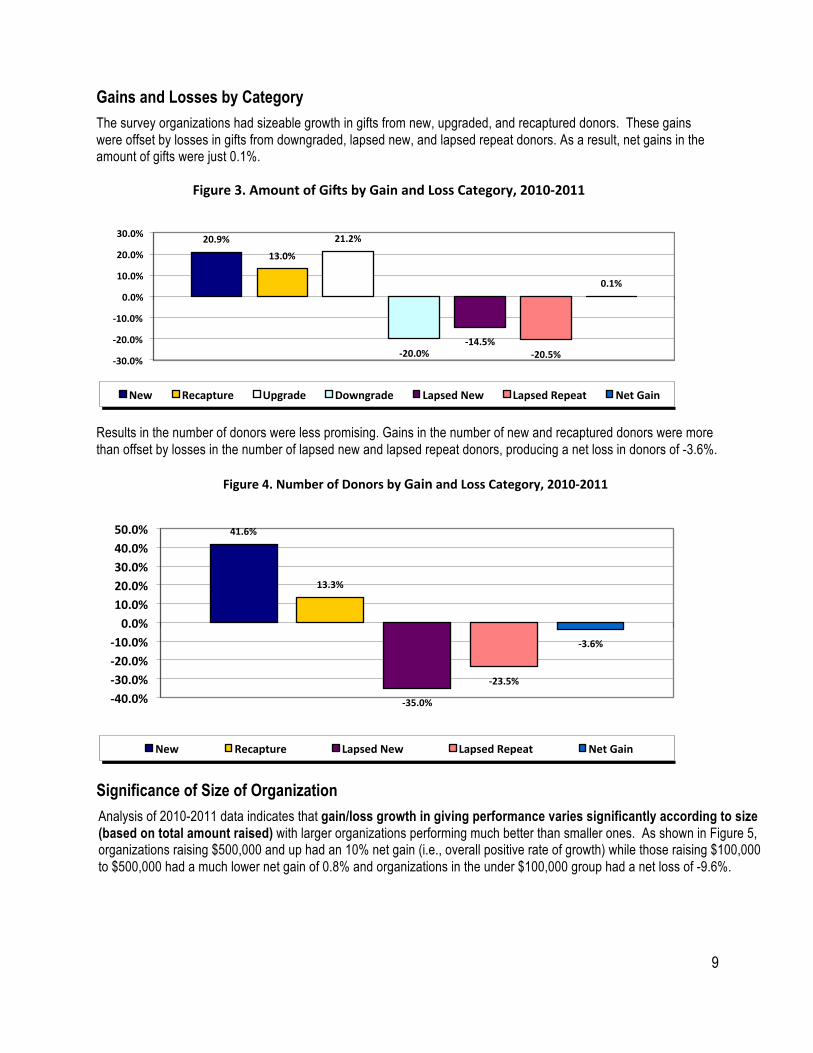
Growth in the number of donors showed a negative gain/loss pattern. As shown in Figure 2, gains of 1.3 million (54.9%) were offset by losses of -1.4 million (-58.5%). This means there was a negative net decrease of (86,437) (-3.6%) in donors and every 100 donors gained in 2011 was offset by 107 in lost donors through attrition.
Gains=55.1%
Losses=-‐55.0%
Net=0.1%
-‐80.0% -‐60.0% -‐40.0% -‐20.0% 0.0%
20.0% 40.0% 60.0% 80.0%
Figure 1. Overall FEP Growth in Amount of GiEs, 2010-‐2011
Gains=54.9%
Losses=-‐58.5%
Net=-‐3.6%
-‐80.0% -‐60.0% -‐40.0% -‐20.0% 0.0% 20.0% 40.0% 60.0% 80.0%
Figure 2. Overall FEP Growth in Number of Donors, 2010-‐2011
9
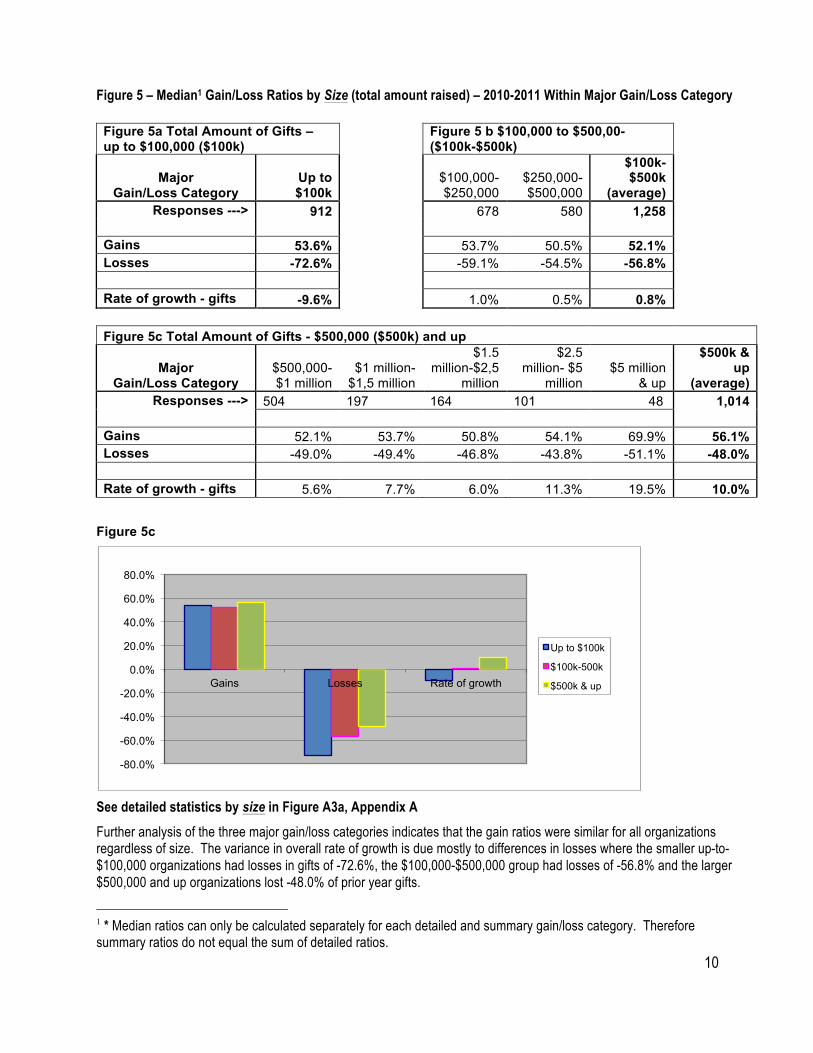
Gains and Losses by Category The survey organizations had sizeable growth in gifts from new, upgraded, and recaptured donors. These gains were offset by losses in gifts from downgraded, lapsed new, and lapsed repeat donors. As a result, net gains in the amount of gifts were just 0.1%.
Results in the number of donors were less promising. Gains in the number of new and recaptured donors were more than offset by losses in the number of lapsed new and lapsed repeat donors, producing a net loss in donors of -3.6%.
Significance of Size of Organization Analysis of 2010-2011 data indicates that gain/loss growth in giving performance varies significantly according to size (based on total amount raised) with larger organizations performing much better than smaller ones. As shown in Figure 5, organizations raising $500,000 and up had an 10% net gain (i.e., overall positive rate of growth) while those raising $100,000 to $500,000 had a much lower net gain of 0.8% and organizations in the under $100,000 group had a net loss of -9.6%.
20.9%
13.0%
21.2%
-‐20.0% -‐14.5%
-‐20.5%
0.1%
-‐30.0%
-‐20.0%
-‐10.0%
0.0%
10.0%
20.0%
30.0%
Figure 3. Amount of GiEs by Gain and Loss Category, 2010-‐2011
New Recapture Upgrade Downgrade Lapsed New Lapsed Repeat Net Gain
41.6%
13.3%
-‐35.0%
-‐23.5%
-‐3.6%
-‐40.0% -‐30.0% -‐20.0% -‐10.0% 0.0% 10.0% 20.0% 30.0% 40.0% 50.0%
Figure 4. Number of Donors by Gain and Loss Category, 2010-‐2011
New Recapture Lapsed New Lapsed Repeat Net Gain
10
Figure 5 – Median1 Gain/Loss Ratios by Size (total amount raised) – 2010-2011 Within Major Gain/Loss Category Figure 5a Total Amount of Gifts – up to $100,000 ($100k)
Figure 5 b $100,000 to $500,00- ($100k-$500k)
Major
Gain/Loss Category Up to $100k
$100,000-$250,000
$250,000-$500,000
$100k-$500k
(average) Responses ---> 912
678 580 1,258
Gains 53.6%
53.7% 50.5% 52.1%
Losses -72.6%
-59.1% -54.5% -56.8%
Rate of growth - gifts -9.6%
1.0% 0.5% 0.8%
Figure 5c Total Amount of Gifts - $500,000 ($500k) and up
Major Gain/Loss Category
$500,000- $1 million
$1 million-$1,5 million
$1.5 million-$2,5
million
$2.5 million- $5
million $5 million
& up
$500k & up
(average) Responses ---> 504 197 164 101 48 1,014
Gains 52.1% 53.7% 50.8% 54.1% 69.9% 56.1% Losses -49.0% -49.4% -46.8% -43.8% -51.1% -48.0%
Rate of growth - gifts 5.6% 7.7% 6.0% 11.3% 19.5% 10.0%
Figure 5c
See detailed statistics by size in Figure A3a, Appendix A
Further analysis of the three major gain/loss categories indicates that the gain ratios were similar for all organizations regardless of size. The variance in overall rate of growth is due mostly to differences in losses where the smaller up-to-$100,000 organizations had losses in gifts of -72.6%, the $100,000-$500,000 group had losses of -56.8% and the larger $500,000 and up organizations lost -48.0% of prior year gifts.
1 * Median ratios can only be calculated separately for each detailed and summary gain/loss category. Therefore summary ratios do not equal the sum of detailed ratios.
-80.0%
-60.0%
-40.0%
-20.0%
0.0%
20.0%
40.0%
60.0%
80.0%
Gains Losses Rate of growth
Up to $100k
$100k-500k
$500k & up
11
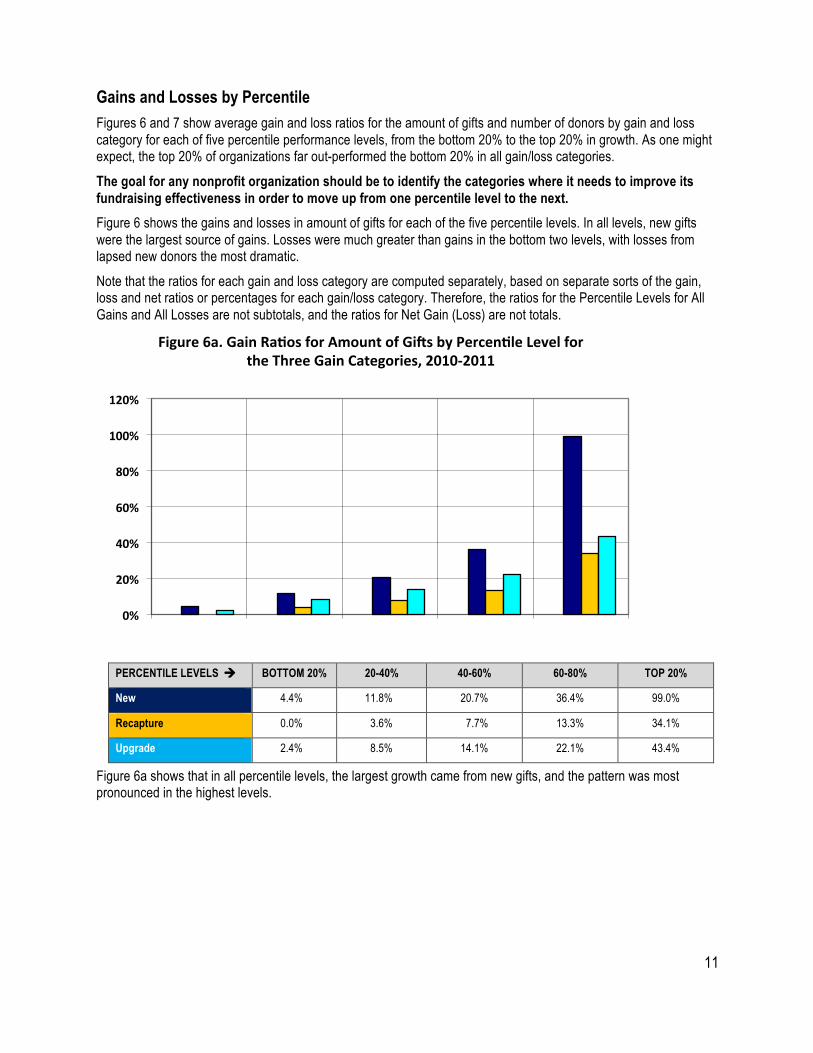
Gains and Losses by Percentile Figures 6 and 7 show average gain and loss ratios for the amount of gifts and number of donors by gain and loss category for each of five percentile performance levels, from the bottom 20% to the top 20% in growth. As one might expect, the top 20% of organizations far out-performed the bottom 20% in all gain/loss categories.
The goal for any nonprofit organization should be to identify the categories where it needs to improve its fundraising effectiveness in order to move up from one percentile level to the next. Figure 6 shows the gains and losses in amount of gifts for each of the five percentile levels. In all levels, new gifts were the largest source of gains. Losses were much greater than gains in the bottom two levels, with losses from lapsed new donors the most dramatic.
Note that the ratios for each gain and loss category are computed separately, based on separate sorts of the gain, loss and net ratios or percentages for each gain/loss category. Therefore, the ratios for the Percentile Levels for All Gains and All Losses are not subtotals, and the ratios for Net Gain (Loss) are not totals.
PERCENTILE LEVELS à BOTTOM 20% 20-40% 40-60% 60-80% TOP 20%
New 4.4% 11.8% 20.7% 36.4% 99.0%
Recapture 0.0% 3.6% 7.7% 13.3% 34.1%
Upgrade 2.4% 8.5% 14.1% 22.1% 43.4%
Figure 6a shows that in all percentile levels, the largest growth came from new gifts, and the pattern was most pronounced in the highest levels.
0%
20%
40%
60%
80%
100%
120%
Figure 6a. Gain RaRos for Amount of GiEs by PercenRle Level for the Three Gain Categories, 2010-‐2011
12
PERCENTILE LEVELS à BOTTOM 20% 20-40% 40-60% 60-80% TOP 20% Downgrade -32.7% -19.4% -13.4% -8.6% -2.6%
Lapsed New -55.6% -26.3% -14.5% -8.3% -3.4%
Lapsed Repeat -44.8% -24.9% -15.7% -9.1% -0.6%
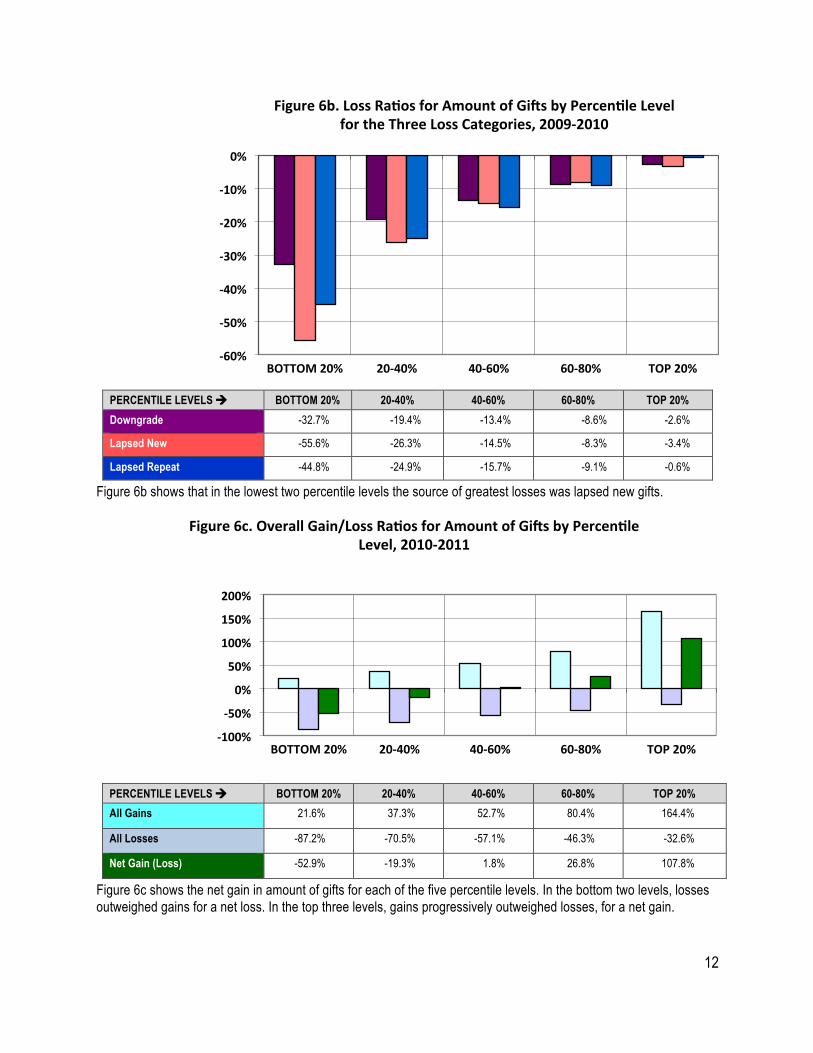
Figure 6b shows that in the lowest two percentile levels the source of greatest losses was lapsed new gifts.
PERCENTILE LEVELS à BOTTOM 20% 20-40% 40-60% 60-80% TOP 20% All Gains 21.6% 37.3% 52.7% 80.4% 164.4%
All Losses -87.2% -70.5% -57.1% -46.3% -32.6%
Net Gain (Loss) -52.9% -19.3% 1.8% 26.8% 107.8%
Figure 6c shows the net gain in amount of gifts for each of the five percentile levels. In the bottom two levels, losses outweighed gains for a net loss. In the top three levels, gains progressively outweighed losses, for a net gain.
-‐60%
-‐50%
-‐40%
-‐30%
-‐20%
-‐10%
0%
BOTTOM 20% 20-‐40% 40-‐60% 60-‐80% TOP 20%
Figure 6b. Loss RaRos for Amount of GiEs by PercenRle Level for the Three Loss Categories, 2009-‐2010
-‐100%
-‐50%
0%
50%
100%
150%
200%
BOTTOM 20% 20-‐40% 40-‐60% 60-‐80% TOP 20%
Figure 6c. Overall Gain/Loss RaRos for Amount of GiEs by PercenRle Level, 2010-‐2011
13
PERCENTILE LEVELS à BOTTOM 20% 20-40% 40-60% 60-80% TOP 20% New 12.0% 26.5% 39.2% 58.9% 120.9%
Recapture 0.3% 6.7% 11.6% 16.7% 26.7%
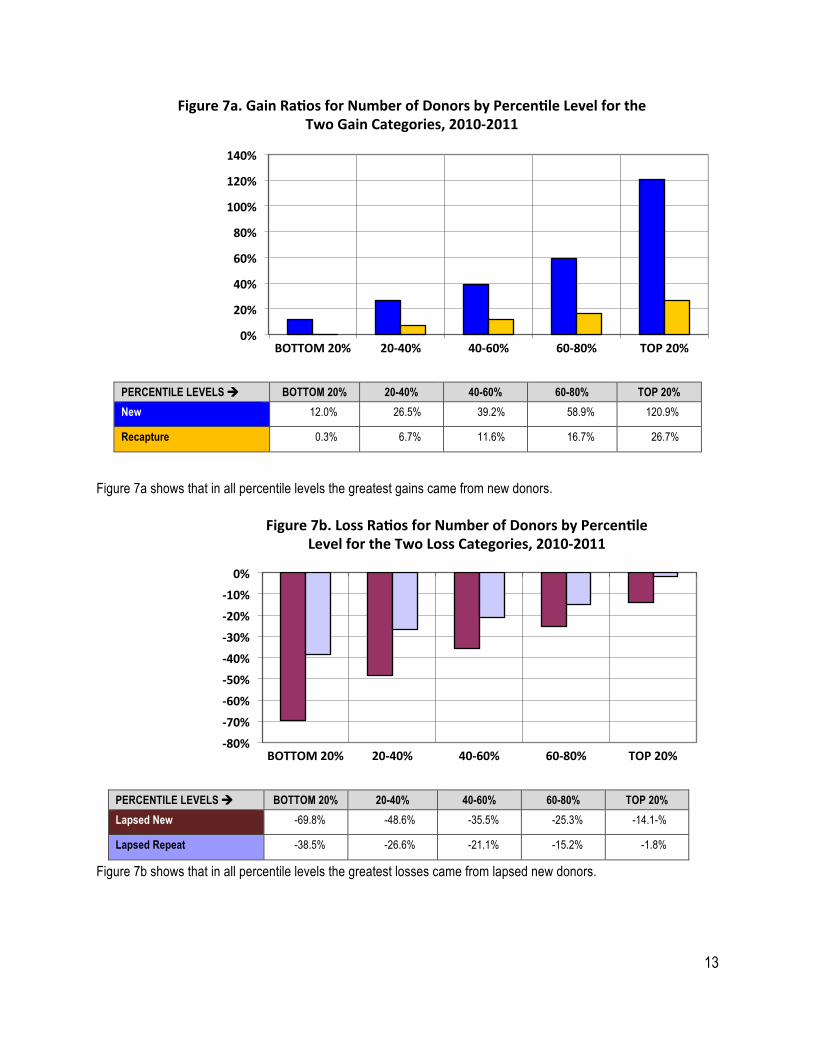
Figure 7a shows that in all percentile levels the greatest gains came from new donors.
PERCENTILE LEVELS à BOTTOM 20% 20-40% 40-60% 60-80% TOP 20% Lapsed New -69.8% -48.6% -35.5% -25.3% -14.1-%
Lapsed Repeat -38.5% -26.6% -21.1% -15.2% -1.8%
Figure 7b shows that in all percentile levels the greatest losses came from lapsed new donors.
0%
20%
40%
60%
80%
100%
120%
140%
BOTTOM 20% 20-‐40% 40-‐60% 60-‐80% TOP 20%
Figure 7a. Gain RaRos for Number of Donors by PercenRle Level for the Two Gain Categories, 2010-‐2011
-‐80%
-‐70%
-‐60%
-‐50%
-‐40%
-‐30%
-‐20%
-‐10%
0%
BOTTOM 20% 20-‐40% 40-‐60% 60-‐80% TOP 20%
Figure 7b. Loss RaRos for Number of Donors by PercenRle Level for the Two Loss Categories, 2010-‐2011
14
PERCENTILE LEVELS à BOTTOM 20% 20-40% 40-60% 60-80% TOP 20% All Gains 22.0% 40.2% 52.9% 72.3% 137.7%
All Losses -87.1% -70.3% -60.1% -50.3% -38.2%
Net Gain (Loss) -53.2% -16.8% -0.9% 15.4% 75.6%
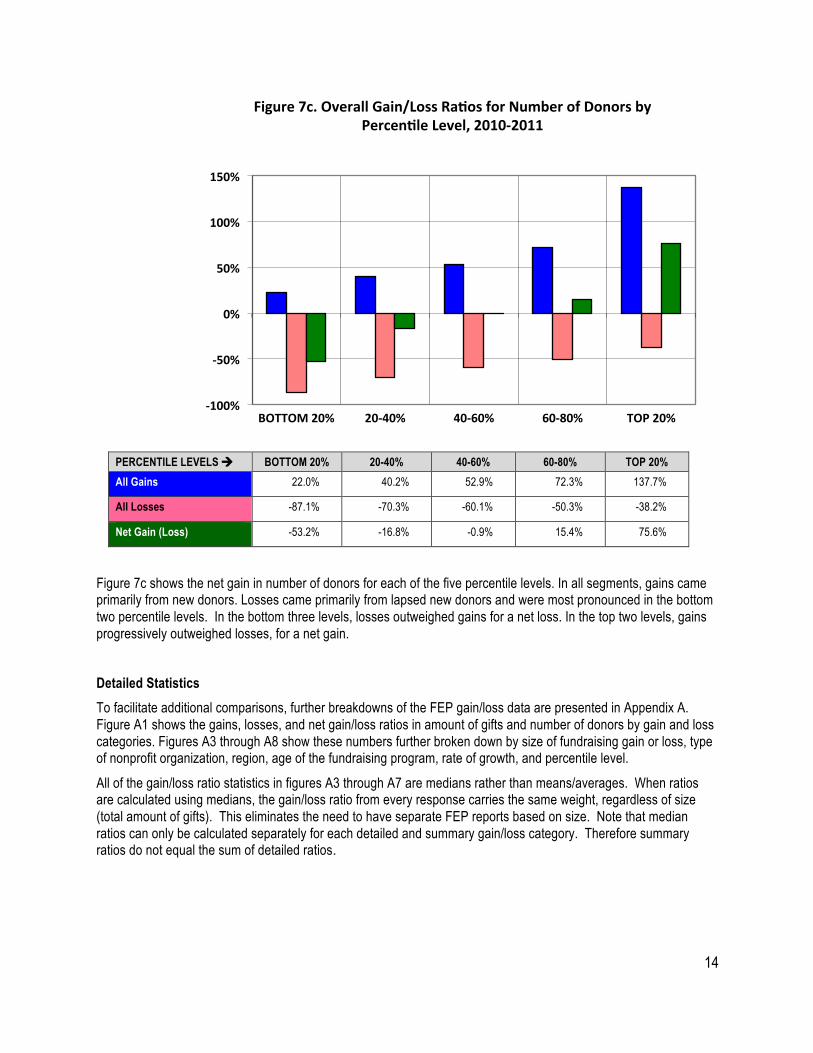
Figure 7c shows the net gain in number of donors for each of the five percentile levels. In all segments, gains came primarily from new donors. Losses came primarily from lapsed new donors and were most pronounced in the bottom two percentile levels. In the bottom three levels, losses outweighed gains for a net loss. In the top two levels, gains progressively outweighed losses, for a net gain.
Detailed Statistics To facilitate additional comparisons, further breakdowns of the FEP gain/loss data are presented in Appendix A. Figure A1 shows the gains, losses, and net gain/loss ratios in amount of gifts and number of donors by gain and loss categories. Figures A3 through A8 show these numbers further broken down by size of fundraising gain or loss, type of nonprofit organization, region, age of the fundraising program, rate of growth, and percentile level.
All of the gain/loss ratio statistics in figures A3 through A7 are medians rather than means/averages. When ratios are calculated using medians, the gain/loss ratio from every response carries the same weight, regardless of size (total amount of gifts). This eliminates the need to have separate FEP reports based on size. Note that median ratios can only be calculated separately for each detailed and summary gain/loss category. Therefore summary ratios do not equal the sum of detailed ratios.
-‐100%
-‐50%
0%
50%
100%
150%
BOTTOM 20% 20-‐40% 40-‐60% 60-‐80% TOP 20%
Figure 7c. Overall Gain/Loss RaRos for Number of Donors by PercenRle Level, 2010-‐2011
15
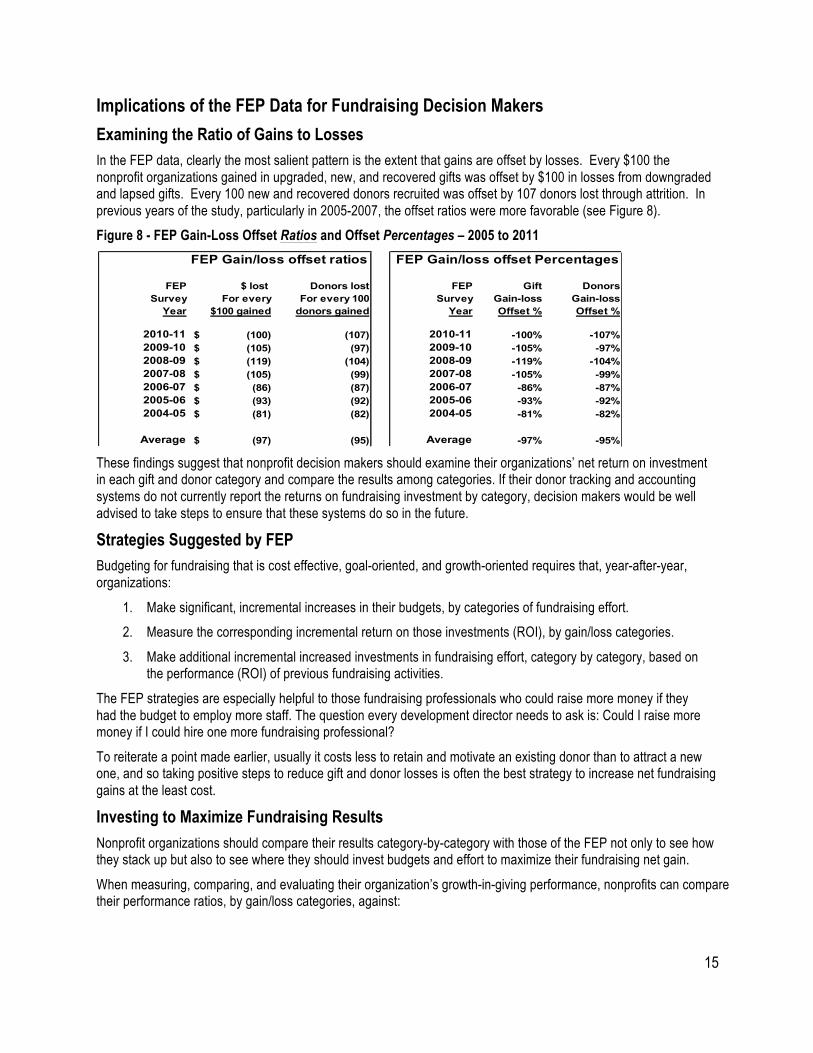
Implications of the FEP Data for Fundraising Decision Makers Examining the Ratio of Gains to Losses In the FEP data, clearly the most salient pattern is the extent that gains are offset by losses. Every $100 the nonprofit organizations gained in upgraded, new, and recovered gifts was offset by $100 in losses from downgraded and lapsed gifts. Every 100 new and recovered donors recruited was offset by 107 donors lost through attrition. In previous years of the study, particularly in 2005-2007, the offset ratios were more favorable (see Figure 8).
Figure 8 - FEP Gain-Loss Offset Ratios and Offset Percentages – 2005 to 2011
These findings suggest that nonprofit decision makers should examine their organizations’ net return on investment in each gift and donor category and compare the results among categories. If their donor tracking and accounting systems do not currently report the returns on fundraising investment by category, decision makers would be well advised to take steps to ensure that these systems do so in the future.
Strategies Suggested by FEP Budgeting for fundraising that is cost effective, goal-oriented, and growth-oriented requires that, year-after-year, organizations:
1. Make significant, incremental increases in their budgets, by categories of fundraising effort.
2. Measure the corresponding incremental return on those investments (ROI), by gain/loss categories.
3. Make additional incremental increased investments in fundraising effort, category by category, based on the performance (ROI) of previous fundraising activities.
The FEP strategies are especially helpful to those fundraising professionals who could raise more money if they had the budget to employ more staff. The question every development director needs to ask is: Could I raise more money if I could hire one more fundraising professional?
To reiterate a point made earlier, usually it costs less to retain and motivate an existing donor than to attract a new one, and so taking positive steps to reduce gift and donor losses is often the best strategy to increase net fundraising gains at the least cost.
Investing to Maximize Fundraising Results Nonprofit organizations should compare their results category-by-category with those of the FEP not only to see how they stack up but also to see where they should invest budgets and effort to maximize their fundraising net gain.
When measuring, comparing, and evaluating their organization’s growth-in-giving performance, nonprofits can compare their performance ratios, by gain/loss categories, against:
FEP Gain/loss offset ratios FEP Gain/loss offset Percentages
FEP $ lost Donors lost FEP Gift DonorsSurvey For every For every 100 Survey Gain-loss Gain-loss
Year $100 gained donors gained Year Offset % Offset %
2010-11 (100)$ (107) 2010-11 -100% -107%2009-10 (105)$ (97) 2009-10 -105% -97%2008-09 (119)$ (104) 2008-09 -119% -104%2007-08 (105)$ (99) 2007-08 -105% -99%2006-07 (86)$ (87) 2006-07 -86% -87%2005-06 (93)$ (92) 2005-06 -93% -92%2004-05 (81)$ (82) 2004-05 -81% -82%
Average (97)$ (95) Average -97% -95%
16
• FEP Survey growth-in-giving performance statistics for peer-group organizations selected by level of giving, age of development program, location, subsector, rate of growth, and percentile level (See Figures A3 through A8 in Appendix A).
• Their own prior period performance (trend analysis)
• Their performance goals (income budgets)
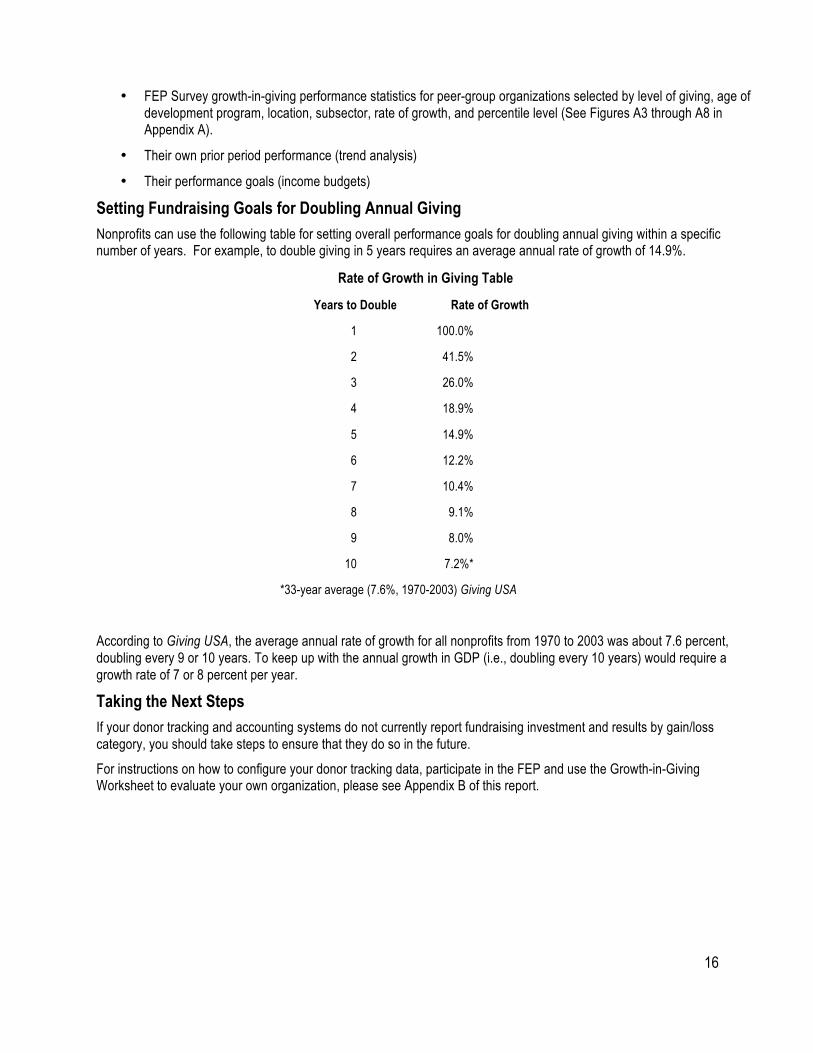
Setting Fundraising Goals for Doubling Annual Giving Nonprofits can use the following table for setting overall performance goals for doubling annual giving within a specific number of years. For example, to double giving in 5 years requires an average annual rate of growth of 14.9%.
Rate of Growth in Giving Table
Years to Double Rate of Growth
1 100.0%
2 41.5%
3 26.0%
4 18.9%
5 14.9%
6 12.2%
7 10.4%
8 9.1%
9 8.0%
10 7.2%*
*33-year average (7.6%, 1970-2003) Giving USA
According to Giving USA, the average annual rate of growth for all nonprofits from 1970 to 2003 was about 7.6 percent, doubling every 9 or 10 years. To keep up with the annual growth in GDP (i.e., doubling every 10 years) would require a growth rate of 7 or 8 percent per year.
Taking the Next Steps If your donor tracking and accounting systems do not currently report fundraising investment and results by gain/loss category, you should take steps to ensure that they do so in the future.
For instructions on how to configure your donor tracking data, participate in the FEP and use the Growth-in-Giving Worksheet to evaluate your own organization, please see Appendix B of this report.
17
Appendices A. Detailed 2010-2011 Fundraising Effectiveness Survey Statistics
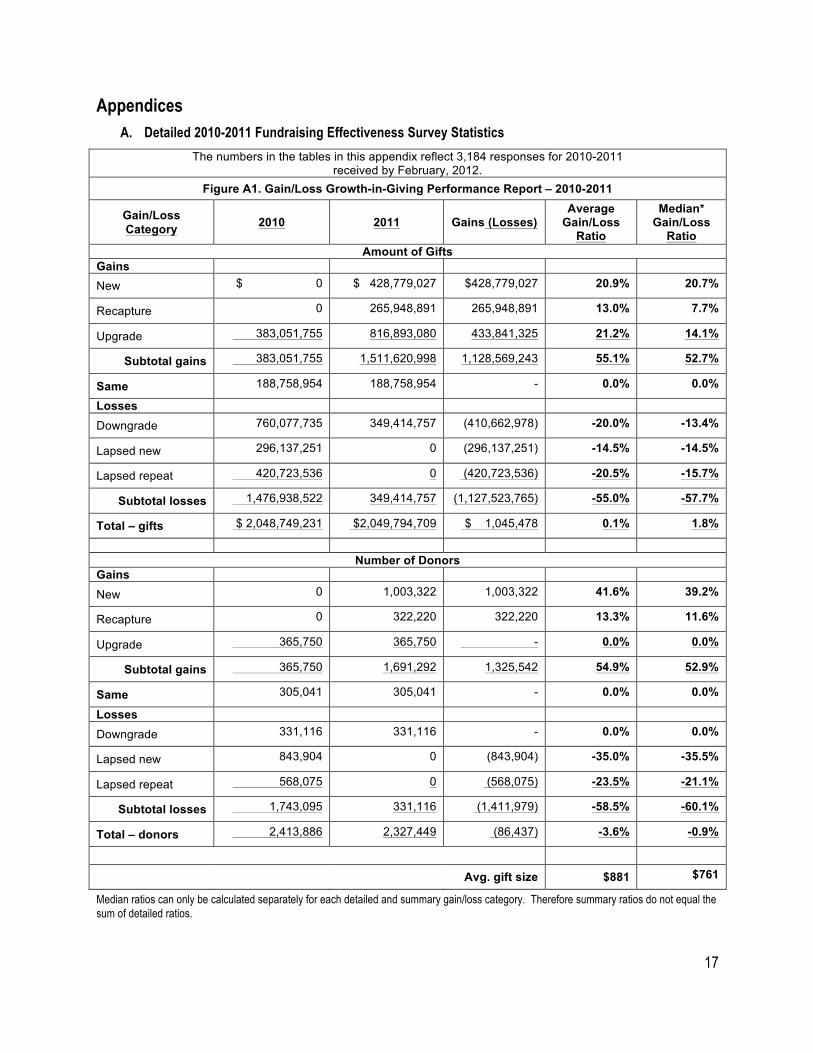
The numbers in the tables in this appendix reflect 3,184 responses for 2010-2011 received by February, 2012.
Figure A1. Gain/Loss Growth-in-Giving Performance Report – 2010-2011
Gain/Loss Category 2010 2011 Gains (Losses)
Average Gain/Loss
Ratio
Median* Gain/Loss
Ratio Amount of Gifts
Gains New $ 0 $ 428,779,027 $428,779,027 20.9% 20.7%
Recapture 0 265,948,891 265,948,891 13.0% 7.7%
Upgrade 383,051,755 816,893,080 433,841,325 21.2% 14.1%
Subtotal gains 383,051,755 1,511,620,998 1,128,569,243 55.1% 52.7%
Same 188,758,954 188,758,954 - 0.0% 0.0%
Losses Downgrade 760,077,735 349,414,757 (410,662,978) -20.0% -13.4%
Lapsed new 296,137,251 0 (296,137,251) -14.5% -14.5%
Lapsed repeat 420,723,536 0 (420,723,536) -20.5% -15.7%
Subtotal losses 1,476,938,522 349,414,757 (1,127,523,765) -55.0% -57.7%
Total – gifts $ 2,048,749,231 $2,049,794,709 $ 1,045,478 0.1% 1.8%
Number of Donors
Gains
New 0 1,003,322 1,003,322 41.6% 39.2%
Recapture 0 322,220 322,220 13.3% 11.6%
Upgrade 365,750 365,750 - 0.0% 0.0%
Subtotal gains 365,750 1,691,292 1,325,542 54.9% 52.9%
Same 305,041 305,041 - 0.0% 0.0%
Losses Downgrade 331,116 331,116 - 0.0% 0.0%
Lapsed new 843,904 0 (843,904) -35.0% -35.5%
Lapsed repeat 568,075 0 (568,075) -23.5% -21.1%
Subtotal losses 1,743,095 331,116 (1,411,979) -58.5% -60.1%
Total – donors 2,413,886 2,327,449 (86,437) -3.6% -0.9%
Avg. gift size $881 $761
Median ratios can only be calculated separately for each detailed and summary gain/loss category. Therefore summary ratios do not equal the sum of detailed ratios.
18
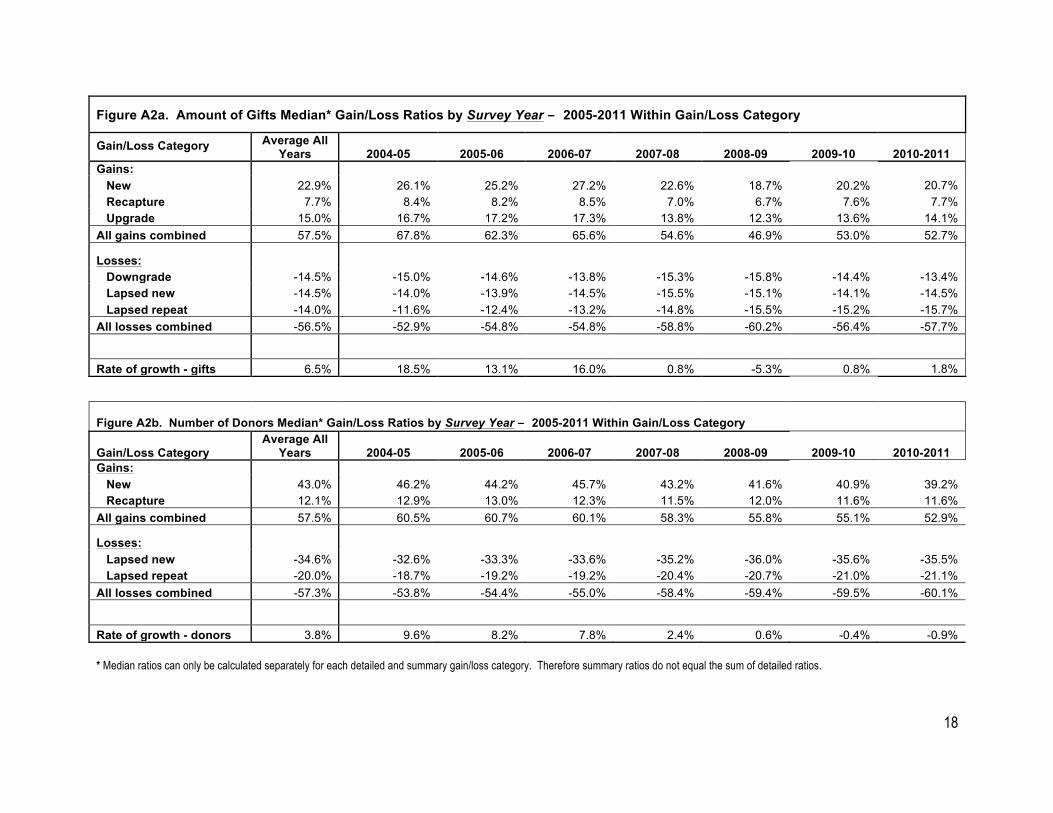
Figure A2a. Amount of Gifts Median* Gain/Loss Ratios by Survey Year – 2005-2011 Within Gain/Loss Category
Gain/Loss Category Average All Years 2004-05 2005-06 2006-07 2007-08 2008-09 2009-10 2010-2011
Gains: New 22.9% 26.1% 25.2% 27.2% 22.6% 18.7% 20.2% 20.7% Recapture 7.7% 8.4% 8.2% 8.5% 7.0% 6.7% 7.6% 7.7% Upgrade 15.0% 16.7% 17.2% 17.3% 13.8% 12.3% 13.6% 14.1% All gains combined 57.5% 67.8% 62.3% 65.6% 54.6% 46.9% 53.0% 52.7%
Losses:
Downgrade -14.5% -15.0% -14.6% -13.8% -15.3% -15.8% -14.4% -13.4% Lapsed new -14.5% -14.0% -13.9% -14.5% -15.5% -15.1% -14.1% -14.5% Lapsed repeat -14.0% -11.6% -12.4% -13.2% -14.8% -15.5% -15.2% -15.7% All losses combined -56.5% -52.9% -54.8% -54.8% -58.8% -60.2% -56.4% -57.7%
Rate of growth - gifts 6.5% 18.5% 13.1% 16.0% 0.8% -5.3% 0.8% 1.8%
Figure A2b. Number of Donors Median* Gain/Loss Ratios by Survey Year – 2005-2011 Within Gain/Loss Category
Gain/Loss Category Average All
Years 2004-05 2005-06 2006-07 2007-08 2008-09 2009-10 2010-2011 Gains: New 43.0% 46.2% 44.2% 45.7% 43.2% 41.6% 40.9% 39.2% Recapture 12.1% 12.9% 13.0% 12.3% 11.5% 12.0% 11.6% 11.6% All gains combined 57.5% 60.5% 60.7% 60.1% 58.3% 55.8% 55.1% 52.9%
Losses:
Lapsed new -34.6% -32.6% -33.3% -33.6% -35.2% -36.0% -35.6% -35.5% Lapsed repeat -20.0% -18.7% -19.2% -19.2% -20.4% -20.7% -21.0% -21.1% All losses combined -57.3% -53.8% -54.4% -55.0% -58.4% -59.4% -59.5% -60.1%
Rate of growth - donors 3.8% 9.6% 8.2% 7.8% 2.4% 0.6% -0.4% -0.9% * Median ratios can only be calculated separately for each detailed and summary gain/loss category. Therefore summary ratios do not equal the sum of detailed ratios.
19
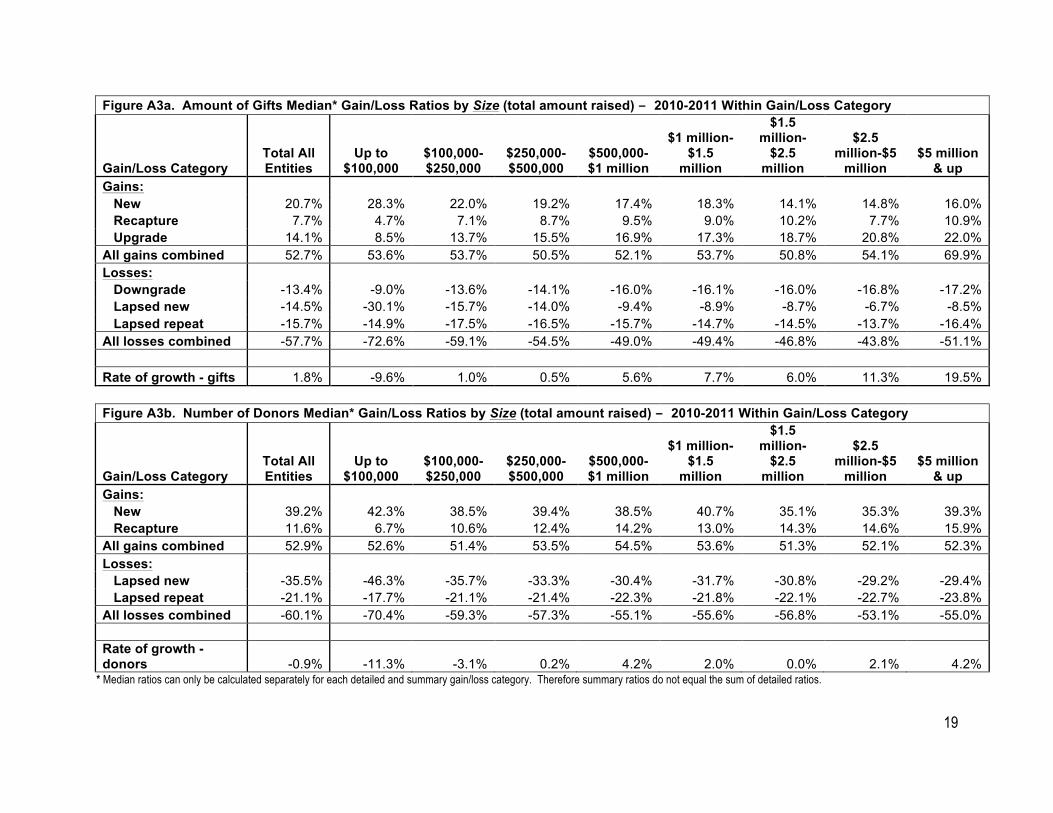
Figure A3a. Amount of Gifts Median* Gain/Loss Ratios by Size (total amount raised) – 2010-2011 Within Gain/Loss Category
Gain/Loss Category Total All Entities
Up to $100,000
$100,000-$250,000
$250,000-$500,000
$500,000-$1 million
$1 million-$1.5
million
$1.5 million-
$2.5 million
$2.5 million-$5
million $5 million
& up Gains: New 20.7% 28.3% 22.0% 19.2% 17.4% 18.3% 14.1% 14.8% 16.0% Recapture 7.7% 4.7% 7.1% 8.7% 9.5% 9.0% 10.2% 7.7% 10.9% Upgrade 14.1% 8.5% 13.7% 15.5% 16.9% 17.3% 18.7% 20.8% 22.0% All gains combined 52.7% 53.6% 53.7% 50.5% 52.1% 53.7% 50.8% 54.1% 69.9% Losses:
Downgrade -13.4% -9.0% -13.6% -14.1% -16.0% -16.1% -16.0% -16.8% -17.2% Lapsed new -14.5% -30.1% -15.7% -14.0% -9.4% -8.9% -8.7% -6.7% -8.5% Lapsed repeat -15.7% -14.9% -17.5% -16.5% -15.7% -14.7% -14.5% -13.7% -16.4% All losses combined -57.7% -72.6% -59.1% -54.5% -49.0% -49.4% -46.8% -43.8% -51.1% Rate of growth - gifts 1.8% -9.6% 1.0% 0.5% 5.6% 7.7% 6.0% 11.3% 19.5%
Figure A3b. Number of Donors Median* Gain/Loss Ratios by Size (total amount raised) – 2010-2011 Within Gain/Loss Category
Gain/Loss Category Total All Entities
Up to $100,000
$100,000-$250,000
$250,000-$500,000
$500,000-$1 million
$1 million-$1.5
million
$1.5 million-
$2.5 million
$2.5 million-$5
million $5 million
& up Gains: New 39.2% 42.3% 38.5% 39.4% 38.5% 40.7% 35.1% 35.3% 39.3% Recapture 11.6% 6.7% 10.6% 12.4% 14.2% 13.0% 14.3% 14.6% 15.9% All gains combined 52.9% 52.6% 51.4% 53.5% 54.5% 53.6% 51.3% 52.1% 52.3% Losses:
Lapsed new -35.5% -46.3% -35.7% -33.3% -30.4% -31.7% -30.8% -29.2% -29.4% Lapsed repeat -21.1% -17.7% -21.1% -21.4% -22.3% -21.8% -22.1% -22.7% -23.8% All losses combined -60.1% -70.4% -59.3% -57.3% -55.1% -55.6% -56.8% -53.1% -55.0% Rate of growth - donors -0.9% -11.3% -3.1% 0.2% 4.2% 2.0% 0.0% 2.1% 4.2%
* Median ratios can only be calculated separately for each detailed and summary gain/loss category. Therefore summary ratios do not equal the sum of detailed ratios.
20
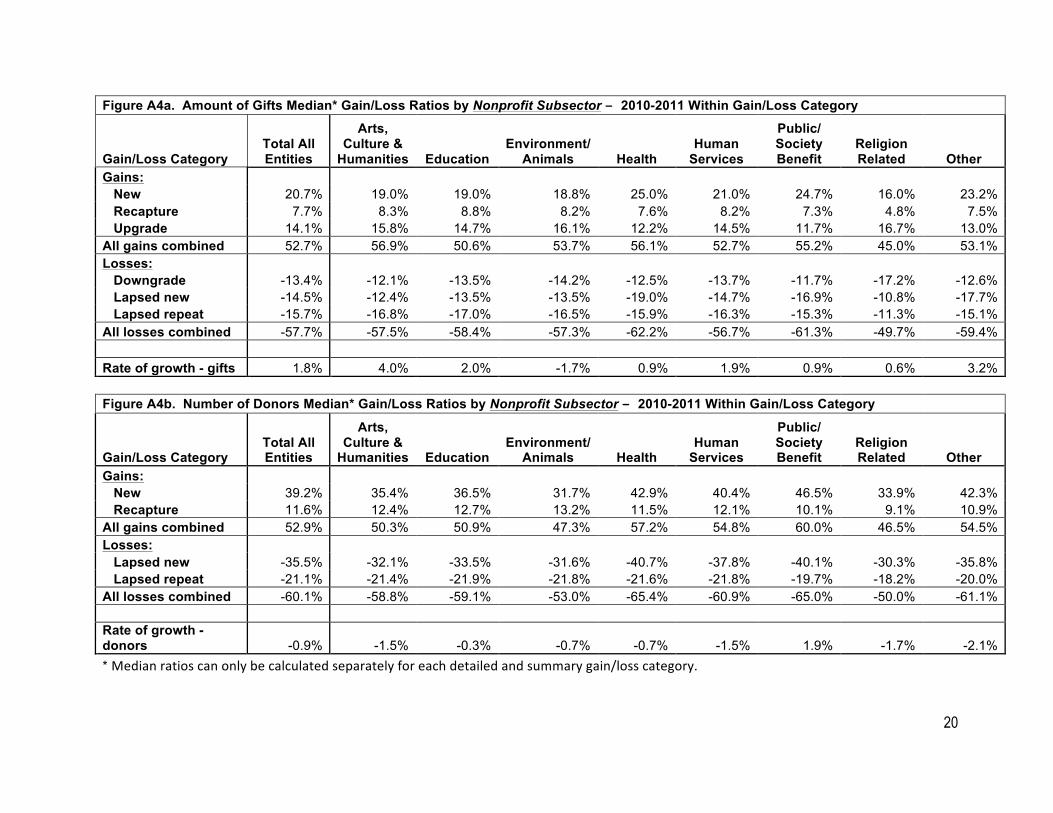
Figure A4a. Amount of Gifts Median* Gain/Loss Ratios by Nonprofit Subsector – 2010-2011 Within Gain/Loss Category
Gain/Loss Category Total All Entities
Arts, Culture &
Humanities Education Environment/
Animals Health Human
Services
Public/ Society Benefit
Religion Related Other
Gains: New 20.7% 19.0% 19.0% 18.8% 25.0% 21.0% 24.7% 16.0% 23.2% Recapture 7.7% 8.3% 8.8% 8.2% 7.6% 8.2% 7.3% 4.8% 7.5% Upgrade 14.1% 15.8% 14.7% 16.1% 12.2% 14.5% 11.7% 16.7% 13.0% All gains combined 52.7% 56.9% 50.6% 53.7% 56.1% 52.7% 55.2% 45.0% 53.1% Losses:
Downgrade -13.4% -12.1% -13.5% -14.2% -12.5% -13.7% -11.7% -17.2% -12.6% Lapsed new -14.5% -12.4% -13.5% -13.5% -19.0% -14.7% -16.9% -10.8% -17.7% Lapsed repeat -15.7% -16.8% -17.0% -16.5% -15.9% -16.3% -15.3% -11.3% -15.1% All losses combined -57.7% -57.5% -58.4% -57.3% -62.2% -56.7% -61.3% -49.7% -59.4% Rate of growth - gifts 1.8% 4.0% 2.0% -1.7% 0.9% 1.9% 0.9% 0.6% 3.2%
Figure A4b. Number of Donors Median* Gain/Loss Ratios by Nonprofit Subsector – 2010-2011 Within Gain/Loss Category
Gain/Loss Category Total All Entities
Arts, Culture &
Humanities Education Environment/
Animals Health Human
Services
Public/ Society Benefit
Religion Related Other
Gains: New 39.2% 35.4% 36.5% 31.7% 42.9% 40.4% 46.5% 33.9% 42.3% Recapture 11.6% 12.4% 12.7% 13.2% 11.5% 12.1% 10.1% 9.1% 10.9% All gains combined 52.9% 50.3% 50.9% 47.3% 57.2% 54.8% 60.0% 46.5% 54.5% Losses:
Lapsed new -35.5% -32.1% -33.5% -31.6% -40.7% -37.8% -40.1% -30.3% -35.8% Lapsed repeat -21.1% -21.4% -21.9% -21.8% -21.6% -21.8% -19.7% -18.2% -20.0% All losses combined -60.1% -58.8% -59.1% -53.0% -65.4% -60.9% -65.0% -50.0% -61.1% Rate of growth - donors -0.9% -1.5% -0.3% -0.7% -0.7% -1.5% 1.9% -1.7% -2.1% * Median ratios can only be calculated separately for each detailed and summary gain/loss category.
21
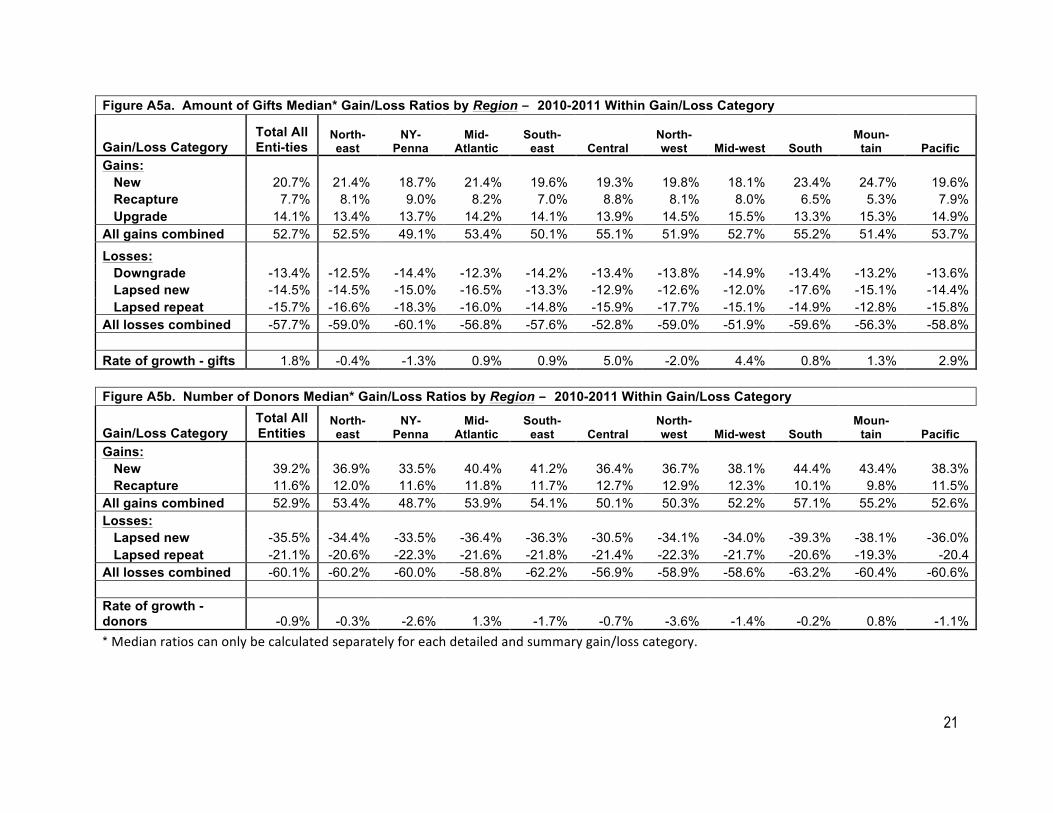
Figure A5a. Amount of Gifts Median* Gain/Loss Ratios by Region – 2010-2011 Within Gain/Loss Category
Gain/Loss Category Total All Enti-ties
North-east
NY-Penna
Mid-Atlantic
South-east Central
North-west Mid-west South
Moun-tain Pacific
Gains: New 20.7% 21.4% 18.7% 21.4% 19.6% 19.3% 19.8% 18.1% 23.4% 24.7% 19.6% Recapture 7.7% 8.1% 9.0% 8.2% 7.0% 8.8% 8.1% 8.0% 6.5% 5.3% 7.9% Upgrade 14.1% 13.4% 13.7% 14.2% 14.1% 13.9% 14.5% 15.5% 13.3% 15.3% 14.9% All gains combined 52.7% 52.5% 49.1% 53.4% 50.1% 55.1% 51.9% 52.7% 55.2% 51.4% 53.7%
Losses:
Downgrade -13.4% -12.5% -14.4% -12.3% -14.2% -13.4% -13.8% -14.9% -13.4% -13.2% -13.6% Lapsed new -14.5% -14.5% -15.0% -16.5% -13.3% -12.9% -12.6% -12.0% -17.6% -15.1% -14.4% Lapsed repeat -15.7% -16.6% -18.3% -16.0% -14.8% -15.9% -17.7% -15.1% -14.9% -12.8% -15.8% All losses combined -57.7% -59.0% -60.1% -56.8% -57.6% -52.8% -59.0% -51.9% -59.6% -56.3% -58.8% Rate of growth - gifts 1.8% -0.4% -1.3% 0.9% 0.9% 5.0% -2.0% 4.4% 0.8% 1.3% 2.9%
Figure A5b. Number of Donors Median* Gain/Loss Ratios by Region – 2010-2011 Within Gain/Loss Category
Gain/Loss Category Total All Entities
North-east
NY-Penna
Mid-Atlantic
South-east Central
North-west Mid-west South
Moun-tain Pacific
Gains: New 39.2% 36.9% 33.5% 40.4% 41.2% 36.4% 36.7% 38.1% 44.4% 43.4% 38.3% Recapture 11.6% 12.0% 11.6% 11.8% 11.7% 12.7% 12.9% 12.3% 10.1% 9.8% 11.5% All gains combined 52.9% 53.4% 48.7% 53.9% 54.1% 50.1% 50.3% 52.2% 57.1% 55.2% 52.6% Losses:
Lapsed new -35.5% -34.4% -33.5% -36.4% -36.3% -30.5% -34.1% -34.0% -39.3% -38.1% -36.0% Lapsed repeat -21.1% -20.6% -22.3% -21.6% -21.8% -21.4% -22.3% -21.7% -20.6% -19.3% -20.4 All losses combined -60.1% -60.2% -60.0% -58.8% -62.2% -56.9% -58.9% -58.6% -63.2% -60.4% -60.6% Rate of growth - donors -0.9% -0.3% -2.6% 1.3% -1.7% -0.7% -3.6% -1.4% -0.2% 0.8% -1.1% * Median ratios can only be calculated separately for each detailed and summary gain/loss category.
22
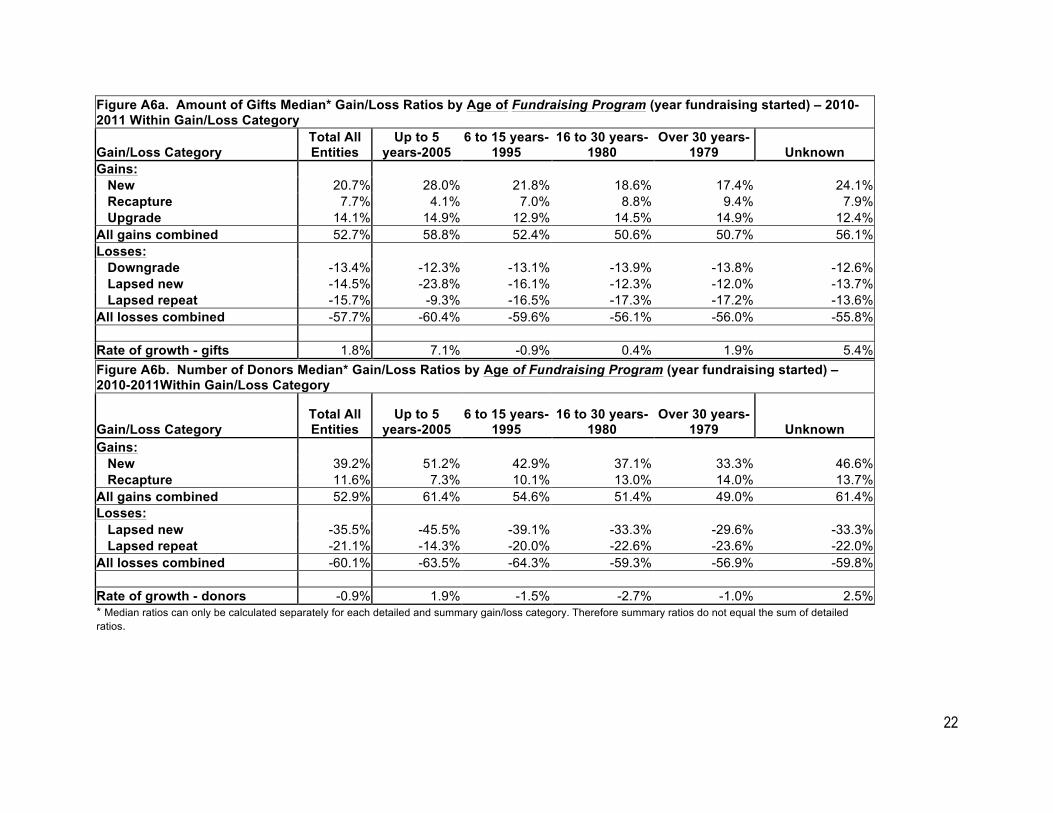
Figure A6a. Amount of Gifts Median* Gain/Loss Ratios by Age of Fundraising Program (year fundraising started) – 2010-2011 Within Gain/Loss Category
Gain/Loss Category Total All Entities
Up to 5 years-2005
6 to 15 years-1995
16 to 30 years-1980
Over 30 years-1979 Unknown
Gains: New 20.7% 28.0% 21.8% 18.6% 17.4% 24.1% Recapture 7.7% 4.1% 7.0% 8.8% 9.4% 7.9% Upgrade 14.1% 14.9% 12.9% 14.5% 14.9% 12.4% All gains combined 52.7% 58.8% 52.4% 50.6% 50.7% 56.1% Losses:
Downgrade -13.4% -12.3% -13.1% -13.9% -13.8% -12.6% Lapsed new -14.5% -23.8% -16.1% -12.3% -12.0% -13.7% Lapsed repeat -15.7% -9.3% -16.5% -17.3% -17.2% -13.6% All losses combined -57.7% -60.4% -59.6% -56.1% -56.0% -55.8% Rate of growth - gifts 1.8% 7.1% -0.9% 0.4% 1.9% 5.4% Figure A6b. Number of Donors Median* Gain/Loss Ratios by Age of Fundraising Program (year fundraising started) – 2010-2011Within Gain/Loss Category
Gain/Loss Category Total All Entities
Up to 5 years-2005
6 to 15 years-1995
16 to 30 years-1980
Over 30 years-1979 Unknown
Gains: New 39.2% 51.2% 42.9% 37.1% 33.3% 46.6% Recapture 11.6% 7.3% 10.1% 13.0% 14.0% 13.7% All gains combined 52.9% 61.4% 54.6% 51.4% 49.0% 61.4% Losses:
Lapsed new -35.5% -45.5% -39.1% -33.3% -29.6% -33.3% Lapsed repeat -21.1% -14.3% -20.0% -22.6% -23.6% -22.0% All losses combined -60.1% -63.5% -64.3% -59.3% -56.9% -59.8% Rate of growth - donors -0.9% 1.9% -1.5% -2.7% -1.0% 2.5% * Median ratios can only be calculated separately for each detailed and summary gain/loss category. Therefore summary ratios do not equal the sum of detailed ratios.
23
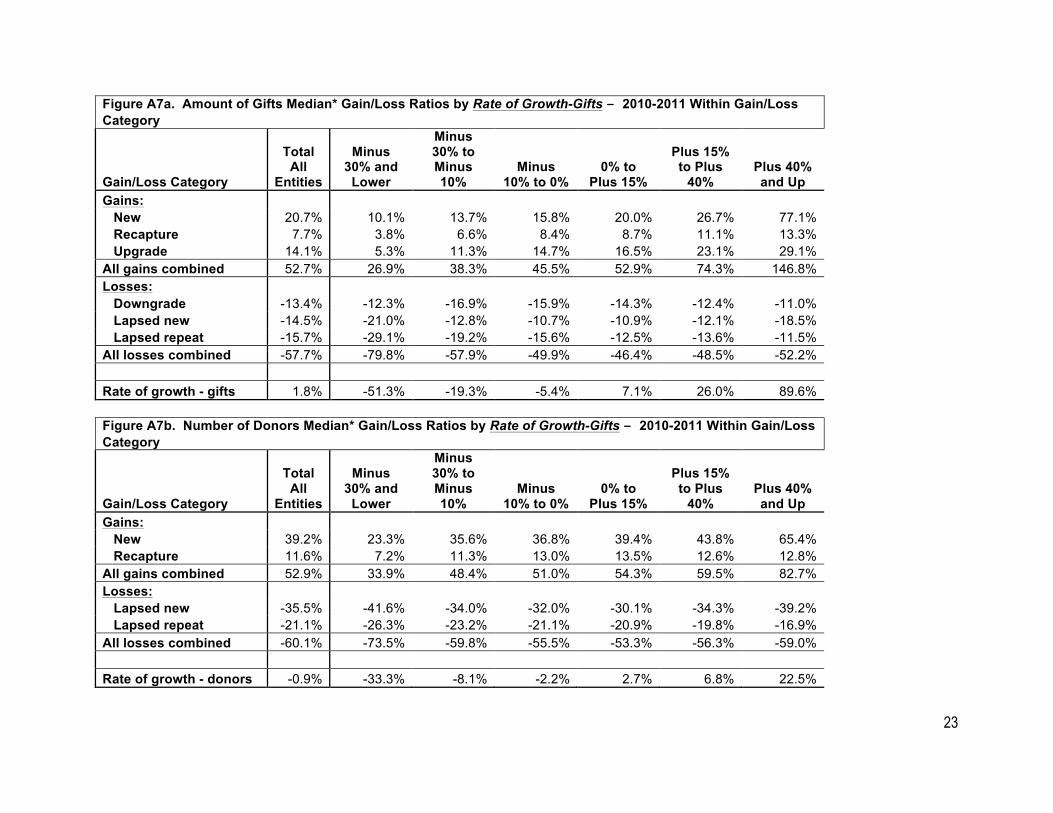
Figure A7a. Amount of Gifts Median* Gain/Loss Ratios by Rate of Growth-Gifts – 2010-2011 Within Gain/Loss Category
Gain/Loss Category
Total All
Entities
Minus 30% and
Lower
Minus 30% to Minus 10%
Minus 10% to 0%
0% to Plus 15%
Plus 15% to Plus
40% Plus 40% and Up
Gains: New 20.7% 10.1% 13.7% 15.8% 20.0% 26.7% 77.1% Recapture 7.7% 3.8% 6.6% 8.4% 8.7% 11.1% 13.3% Upgrade 14.1% 5.3% 11.3% 14.7% 16.5% 23.1% 29.1% All gains combined 52.7% 26.9% 38.3% 45.5% 52.9% 74.3% 146.8% Losses:
Downgrade -13.4% -12.3% -16.9% -15.9% -14.3% -12.4% -11.0% Lapsed new -14.5% -21.0% -12.8% -10.7% -10.9% -12.1% -18.5% Lapsed repeat -15.7% -29.1% -19.2% -15.6% -12.5% -13.6% -11.5% All losses combined -57.7% -79.8% -57.9% -49.9% -46.4% -48.5% -52.2% Rate of growth - gifts 1.8% -51.3% -19.3% -5.4% 7.1% 26.0% 89.6%
Figure A7b. Number of Donors Median* Gain/Loss Ratios by Rate of Growth-Gifts – 2010-2011 Within Gain/Loss Category
Gain/Loss Category
Total All
Entities
Minus 30% and
Lower
Minus 30% to Minus 10%
Minus 10% to 0%
0% to Plus 15%
Plus 15% to Plus
40% Plus 40% and Up
Gains: New 39.2% 23.3% 35.6% 36.8% 39.4% 43.8% 65.4% Recapture 11.6% 7.2% 11.3% 13.0% 13.5% 12.6% 12.8% All gains combined 52.9% 33.9% 48.4% 51.0% 54.3% 59.5% 82.7% Losses:
Lapsed new -35.5% -41.6% -34.0% -32.0% -30.1% -34.3% -39.2% Lapsed repeat -21.1% -26.3% -23.2% -21.1% -20.9% -19.8% -16.9% All losses combined -60.1% -73.5% -59.8% -55.5% -53.3% -56.3% -59.0% Rate of growth - donors -0.9% -33.3% -8.1% -2.2% 2.7% 6.8% 22.5%
24
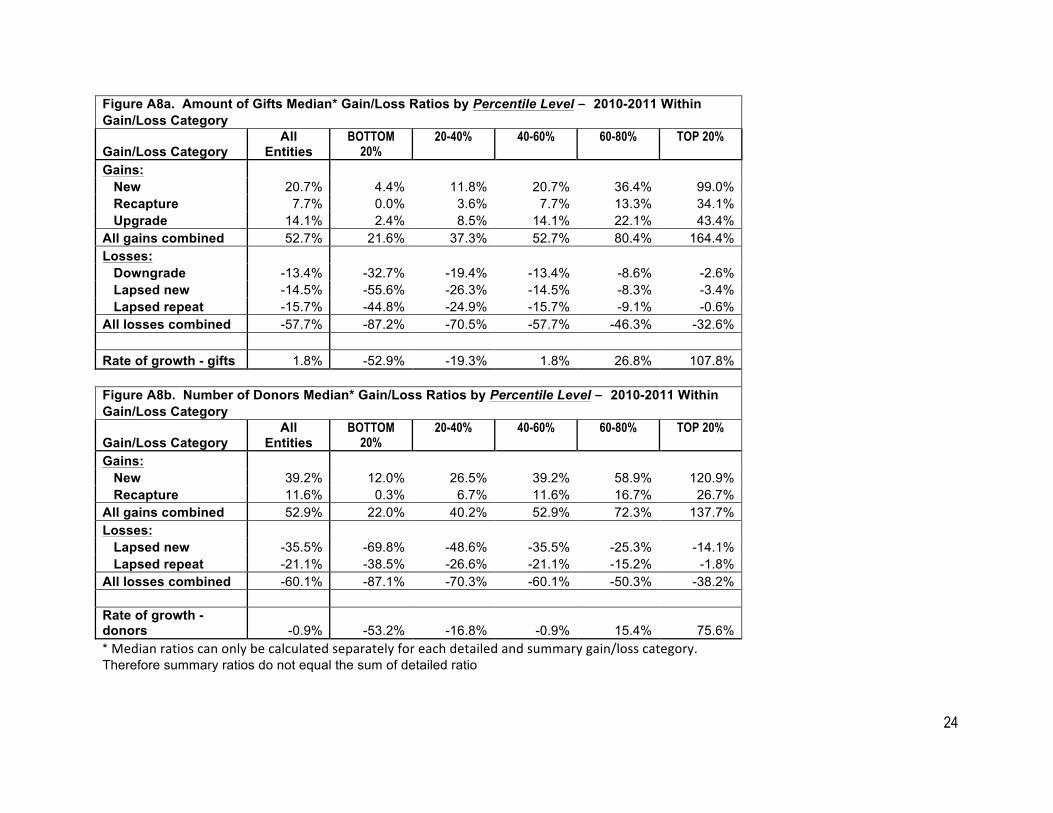
Figure A8a. Amount of Gifts Median* Gain/Loss Ratios by Percentile Level – 2010-2011 Within Gain/Loss Category
Gain/Loss Category All
Entities BOTTOM
20% 20-40% 40-60% 60-80% TOP 20%
Gains: New 20.7% 4.4% 11.8% 20.7% 36.4% 99.0% Recapture 7.7% 0.0% 3.6% 7.7% 13.3% 34.1% Upgrade 14.1% 2.4% 8.5% 14.1% 22.1% 43.4% All gains combined 52.7% 21.6% 37.3% 52.7% 80.4% 164.4% Losses: Downgrade -13.4% -32.7% -19.4% -13.4% -8.6% -2.6% Lapsed new -14.5% -55.6% -26.3% -14.5% -8.3% -3.4% Lapsed repeat -15.7% -44.8% -24.9% -15.7% -9.1% -0.6% All losses combined -57.7% -87.2% -70.5% -57.7% -46.3% -32.6% Rate of growth - gifts 1.8% -52.9% -19.3% 1.8% 26.8% 107.8%
Figure A8b. Number of Donors Median* Gain/Loss Ratios by Percentile Level – 2010-2011 Within Gain/Loss Category
Gain/Loss Category All
Entities BOTTOM
20% 20-40% 40-60% 60-80% TOP 20%
Gains: New 39.2% 12.0% 26.5% 39.2% 58.9% 120.9% Recapture 11.6% 0.3% 6.7% 11.6% 16.7% 26.7% All gains combined 52.9% 22.0% 40.2% 52.9% 72.3% 137.7% Losses:
Lapsed new -35.5% -69.8% -48.6% -35.5% -25.3% -14.1% Lapsed repeat -21.1% -38.5% -26.6% -21.1% -15.2% -1.8% All losses combined -60.1% -87.1% -70.3% -60.1% -50.3% -38.2% Rate of growth - donors -0.9% -53.2% -16.8% -0.9% 15.4% 75.6% * Median ratios can only be calculated separately for each detailed and summary gain/loss category. Therefore summary ratios do not equal the sum of detailed ratio
25
B. How to Respond to the FEP Survey and Extract and Configure Your Organization’s Gain/Loss Donor Tracking Data
The donor software firms participating in the FEP have developed software that makes it possible for their clients to respond to the FEP surveys “all electronically,” thereby providing fundraising data to the FEP and participating nonprofit organizations with very little effort, for gain/loss and comparative analysis (*).
The process is as follows:
1. Ask your donor software provider to point you to their FEP survey module that pulls the information from your database “all electronically” for your gain/loss performance measurement and for participating in the FEP surveys. (See page 2 of this report for information about the involvement of donor software firms in the FEP survey.)
(*) If your software provider is not participating in the FEP, you will find an AFP survey form with instructions online at http://vovici.com/wsb.dll/s/c13g2ad8e.
2. Open your donor software provider’s FEP survey module and fill in the survey year and basic identification information about your organization and fundraising operation.
3. When you choose the submit-FEP-survey option, a text file (*.txt) is automatically generated and transmitted over the internet to the FEP database at the Urban Institute—directly, or through your software provider.
4. Locate that text file on your computer and save it for use in preparing Gain/Loss Growth-in-Giving Performance Reports for your organization (see steps 5 and 6).
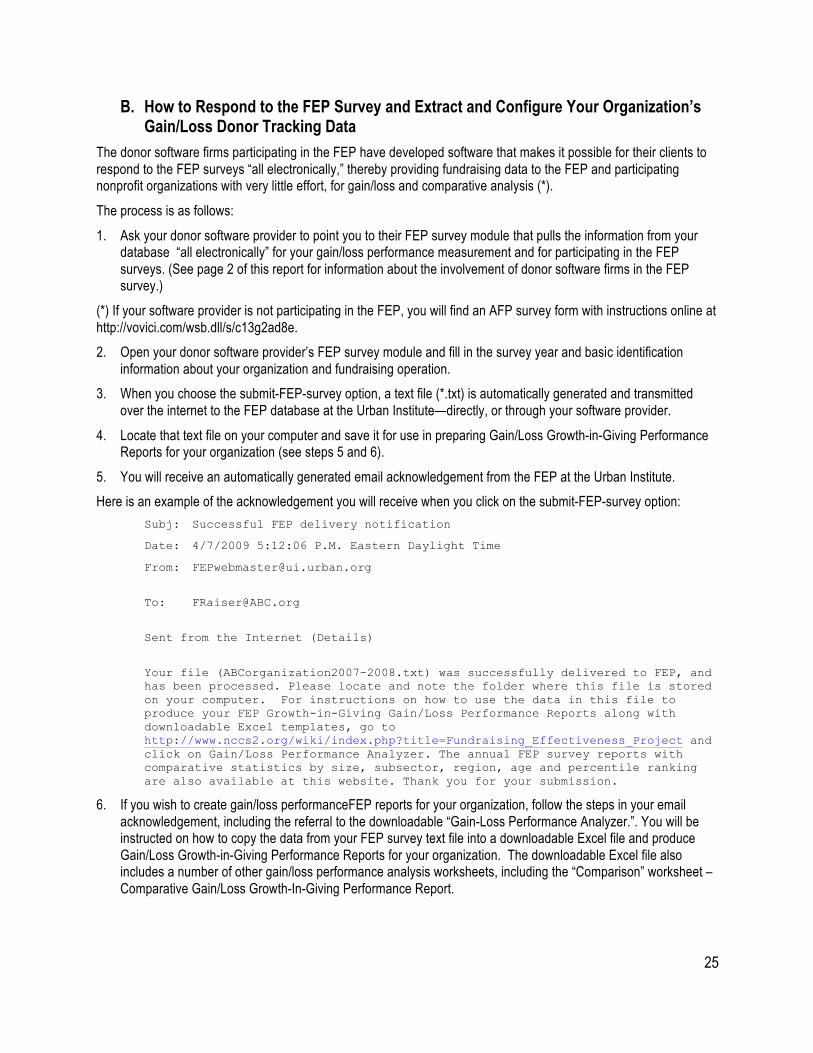
5. You will receive an automatically generated email acknowledgement from the FEP at the Urban Institute.
Here is an example of the acknowledgement you will receive when you click on the submit-FEP-survey option:
Subj: Successful FEP delivery notification
Date: 4/7/2009 5:12:06 P.M. Eastern Daylight Time
From: [email protected]
Sent from the Internet (Details)
Your file (ABCorganization2007-2008.txt) was successfully delivered to FEP, and has been processed. Please locate and note the folder where this file is stored on your computer. For instructions on how to use the data in this file to produce your FEP Growth-in-Giving Gain/Loss Performance Reports along with downloadable Excel templates, go to http://www.nccs2.org/wiki/index.php?title=Fundraising_Effectiveness_Project and click on Gain/Loss Performance Analyzer. The annual FEP survey reports with comparative statistics by size, subsector, region, age and percentile ranking are also available at this website. Thank you for your submission.
6. If you wish to create gain/loss performanceFEP reports for your organization, follow the steps in your email acknowledgement, including the referral to the downloadable “Gain-Loss Performance Analyzer.”. You will be instructed on how to copy the data from your FEP survey text file into a downloadable Excel file and produce Gain/Loss Growth-in-Giving Performance Reports for your organization. The downloadable Excel file also includes a number of other gain/loss performance analysis worksheets, including the “Comparison” worksheet – Comparative Gain/Loss Growth-In-Giving Performance Report.
26
7. Using the “Comparison” Worksheet to Find Out How Your Fundraising Performance Measures Up
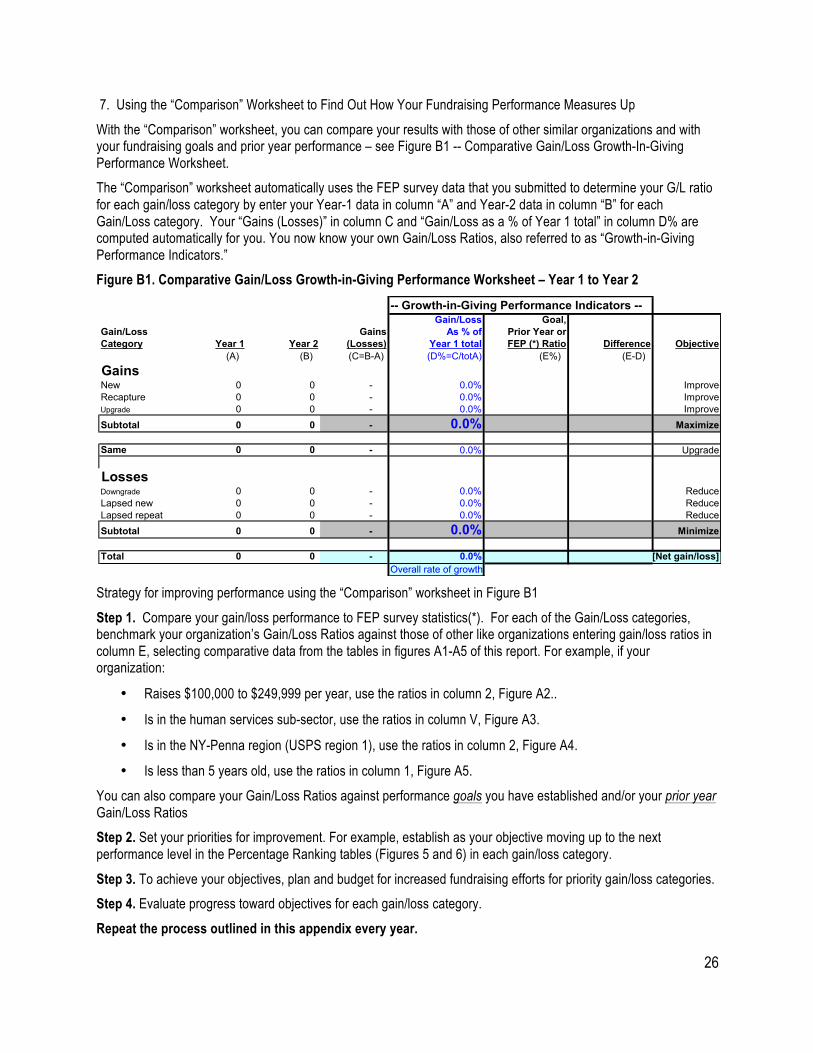
With the “Comparison” worksheet, you can compare your results with those of other similar organizations and with your fundraising goals and prior year performance – see Figure B1 -- Comparative Gain/Loss Growth-In-Giving Performance Worksheet.
The “Comparison” worksheet automatically uses the FEP survey data that you submitted to determine your G/L ratio for each gain/loss category by enter your Year-1 data in column “A” and Year-2 data in column “B” for each Gain/Loss category. Your “Gains (Losses)” in column C and “Gain/Loss as a % of Year 1 total” in column D% are computed automatically for you. You now know your own Gain/Loss Ratios, also referred to as “Growth-in-Giving Performance Indicators.”
Figure B1. Comparative Gain/Loss Growth-in-Giving Performance Worksheet – Year 1 to Year 2
Strategy for improving performance using the “Comparison” worksheet in Figure B1
Step 1. Compare your gain/loss performance to FEP survey statistics(*). For each of the Gain/Loss categories, benchmark your organization’s Gain/Loss Ratios against those of other like organizations entering gain/loss ratios in column E, selecting comparative data from the tables in figures A1-A5 of this report. For example, if your organization:
• Raises $100,000 to $249,999 per year, use the ratios in column 2, Figure A2..
• Is in the human services sub-sector, use the ratios in column V, Figure A3.
• Is in the NY-Penna region (USPS region 1), use the ratios in column 2, Figure A4.
• Is less than 5 years old, use the ratios in column 1, Figure A5.
You can also compare your Gain/Loss Ratios against performance goals you have established and/or your prior year Gain/Loss Ratios
Step 2. Set your priorities for improvement. For example, establish as your objective moving up to the next performance level in the Percentage Ranking tables (Figures 5 and 6) in each gain/loss category.
Step 3. To achieve your objectives, plan and budget for increased fundraising efforts for priority gain/loss categories.
Step 4. Evaluate progress toward objectives for each gain/loss category.
Repeat the process outlined in this appendix every year.
-- Growth-in-Giving Performance Indicators --Gain/Loss Goal,
Gain/Loss Gains As % of Prior Year orCategory Year 1 Year 2 (Losses) Year 1 total FEP (*) Ratio Difference Objective
(A) (B) (C=B-A) (D%=C/totA) (E%) (E-D) GainsNew 0 0 - 0.0% ImproveRecapture 0 0 - 0.0% ImproveUpgrade 0 0 - 0.0% ImproveSubtotal 0 0 - 0.0% Maximize
Same 0 0 - 0.0% Upgrade
LossesDowngrade 0 0 - 0.0% ReduceLapsed new 0 0 - 0.0% ReduceLapsed repeat 0 0 - 0.0% ReduceSubtotal 0 0 - 0.0% Minimize
Total 0 0 - 0.0% [Net gain/loss]Overall rate of growth