Embed Size (px)
DESCRIPTION
Oklahoma City Benefits From Past Development Decisions
Citation preview

Oklahoma City Metro
Greater Oklahoma City Chamber
123 Park Ave.
Oklahoma City, OK 73102
(405) 297-8900
www.okcchamber.com
www.greateroklahomacity.com
222000111222 GGGrrreeeaaattteeerrr OOOkkklllaaahhhooommmaaa CCCiiitttyyy EEEcccooonnnooommmiiiccc FFFooorrreeecccaaasssttt
Prepared by Dan Rickman Regents Professor of Economics Oklahoma State University Eric Long Research Economist Economic Development Division Greater Oklahoma City Chamber [email protected] (405) 297-8976

2012 Oklahoma City MSA
2
Table of Contents
Overview .................................................................................................................................... 3
National Conditions .................................................................................................................... 6
State Conditions ......................................................................................................................... 9
Statewide Employment .............................................................................................................10
State Production and Personal Income .....................................................................................12
OKC MSA Production and Income ............................................................................................13
OKC MSA Employment – CES Survey .....................................................................................13
OKC MSA Employment – Professional and Business Services .................................................14
OKC MSA Employment - Manufacturing ...................................................................................14
OKC MSA Employment - Mining ...............................................................................................15
OKC MSA Employment – Housing & Construction ....................................................................15
OKC MSA Employment – Education and Health Services ........................................................16
OKC MSA Employment – Total, State and Local Government ..................................................16
OKC MSA Population ...............................................................................................................17
OKC Retail Sales / Sales Tax Receipts .....................................................................................17
OKC MSA Employment Forecast ..............................................................................................18

2012 Oklahoma City MSA
3
Overview Oklahoma City Benefits From Past Development Decisions The Greater Oklahoma City Economic Forecast provides a comprehensive analysis of the metro
economy. It details historic trend analysis, a snapshot of the current situation, as well as a
forecast for the upcoming year.
As a precursor to the forecast, it is important to recognize significant occurrences that will or
have taken place in 2012. The following are expected to shape the Oklahoma City landscape in
2012:
In January 2012, Boeing announced that it would be relocating nearly 900 positions to
Oklahoma City from Wichita. This is in addition to the 550 positions moving from Long
Beach (announced Aug. 2010). These jobs are engineering and management positions
that will only strengthen the aerospace sector in the metro area and state.
Devon Energy will have completed its 50 story, $750 million world headquarters in
downtown with an early summer move-in date. This helps to consolidate all of its metro
area employees into a single facility, leaving significant available office space for
potential new to market firms. In addition, once the building opens, millions of dollars will
be generated from the appraised property, as well as the county’s collection of personal
property taxes on furniture, fixtures and equipment. The economic impact from the new
building will influence the development of downtown for years to come.
Continental Resources will have finished moving its headquarters from Enid to
downtown Oklahoma City. The firm will move 255 employees to the new location, with
more than 450 new jobs expected within the next several years.
The opening of the Interstate 40 Crosstown Expressway. This $680 million project is the
largest public infrastructure project since the completion of the state’s interstate system.
It re-opened in January 2012, but all connections to downtown and the development of
the Downtown Boulevard will be phased in through 2014.
SandRidge Energy continues the expansion and redevelopment of its headquarters
downtown, with the anticipation of employing 2,000 people within five years. The
physical expansion is expected to be completed in 2014. And, Chesapeake Energy also
continues to aggressively expand its campus – which is heavily influencing retail
development in the northwest sector of the city.
The $700 million Oklahoma City MAPS for Kids program draws to a close in 2012. This
program, funded by a temporary sales tax for seven years and a bond issue, will have
built new or renovated 73 school sites throughout the Oklahoma City public school
district. In addition, the program encourages other districts in the metro area to make
similar improvements.
Many of the projects associated with MAPS 3 will continue to progress in terms of land
acquisition, planning, and engineering/design work. MAPS 3 is a $777 million sales tax
extension comprised of 8 diverse public projects including a new downtown convention
center, a world class central park, a new downtown rail-based streetcar system, an
extension of sidewalks and bicycle trails throughout the city, several health and wellness

2012 Oklahoma City MSA
4
aquatic centers designed for senior citizens, and improvements to the Oklahoma River
to achieve the finest rowing racecourse in the world.
Project 180, a four year, $160 million redesign of downtown streets, sidewalks, parks
and plazas will continue to transform downtown Oklahoma City. The project is
scheduled for completion by January 2014.
Over the past three years, Oklahoma City has become accustomed to consistently having the
lowest monthly unemployment rate of any large metro (over 1 million population) in the nation.
In 2011, Oklahoma City still boasted the lowest unemployment rate (2011 annual average of
approximately 5.5 percent). Perceptions are changing and people are now recognizing
Oklahoma City’s active and prosperous business climate. This drives more people to the
Oklahoma City market who are looking for work and increases the total labor force. Thus, we
should anticipate Oklahoma City’s unemployment rate to rise slightly in 2012 due to in-migration
and labor force participation rates. In reality, this can be seen as a positive, resulting in a larger
available labor pool from which Oklahoma City businesses can draw upon. Even with these
changes, it is anticipated that Oklahoma City will continue to remain in the top five large metros
with lowest unemployment.
National and global uncertainties continue to be a drag on the local economy. Overall, a jobless
recovery persists at the national level. Oklahoma City is one of only twenty-two major metros to
gain back more than half the jobs lost between their employment peak and their post-recession
employment low point (for Oklahoma City, this was from Q3 2008 to Q4 2009). Job gains in the
Oklahoma City metro are forecasted to be modest in 2012, with growth under two percent.
Slow, steady growth locally continues to be a positive alternative to recent national trends.
This economic forecast is based upon historic growth models and does not necessarily take into
account unanticipated growth from relocations/new to market firms. Job announcements from
Boeing and Continental Resources have not been fully incorporated into forecasted numbers.
Employment forecasts in those particular segments might be slightly understated. In addition,
Boeing job gains are gradual and will take place over a period of time. Most will occur in 2013.
Nationally, while 2011 provided fewer economic development leads relative to prior years, it was
not a dramatic decline. Many companies have been delaying plans for expansion or new
operations due to the lack of clear economic signals. Firms have been hoping for “normal”
economic conditions to return to pre-recession conditions. However, it is becoming more
apparent that a “new normal” is establishing itself, and business decisions must fall in line with
revised expectations. This may result in an overall increase in economic development activity in
2012, but it is too early to speculate.
Despite challenges with economic conditions nationally, the Greater Oklahoma City region
enjoyed strong employment gains from new to market firms and the expansion of existing
businesses. In 2011, the number of announced jobs created from chamber assisted new to
market firms was relatively consistent with the previous year. However, the wages for those
new to market jobs were 108% higher than the Oklahoma City metro average wage. For
existing companies assisted by the Chamber in 2011, the total number of jobs resulting from

2012 Oklahoma City MSA
5
business expansions grew by over 80% for the second consecutive year. Finally, capital
investment plans for both existing and new to market chamber assisted firms exceeded last
year by over 24%. Increases in capital investment are expected to continue as firms choose to
invest more in equipment and efficiencies.
Nationally, there is a continual shift in economic development strategies toward the expansion
of existing companies and entrepreneurship activities. According to YourEconomy.org, of the
more than 77,000 stand-alone or headquartered businesses in the Oklahoma City metro,
approximately 92 percent have fewer than 10 employees. This emphasizes the importance of
fostering innovation and entrepreneurship as part of the Greater Oklahoma City region’s
economic development strategic plan. However, there is growing discussion about what size
firm actually adds the most jobs to the economy over time. The Edward Lowe Foundation
supports the theory that most job creation comes from second stage companies. Second stage
companies are typically characterized by having between $1 to $100 million in total receipts and
between 10 to 100 employees. In contrast, Kauffman Foundation research supports the
concept that startups create most new net jobs in the United States. Finally, business surveys
from Erik Hurst and Ben Pugsley of the University of Chicago indicate that 90 percent of all
companies employ fewer than 20 employees. And, those 90 percent only account for about 20
percent of all jobs. Thus, this study concludes that larger businesses are often
underappreciated for the role they play in overall job creation and economic stability. As data
sources improve, the debate and discussion will continue. It will be critical that economic
development strategies remain flexible enough to respond to any possible source of potential
job growth.
In conclusion, while optimism exists for 2012, there are a few areas of caution as they relate to
potential risks for the Greater Oklahoma City regional economy. Federal budget cuts continue
to be discussed as we enter into a presidential election year. Tinker Air Force Base and the
Mike Monroney Aeronautical Center (FAA) are two major employers in the city and state. Local
and state leadership remains united in protecting political and economic decisions that would
negatively impact these facilities. In terms of the Energy sector, natural gas prices remain at
historic lows. Weak natural gas prices are a result of rising production, a record amount of gas
in storage, and a mild winter for much of the country. Energy firms in the region have a major
interest in how short and long-term natural gas demand and supply lines up with future prices.
In many cases, firms are shifting their operations from natural gas to oil. In addition, land-
buying budgets are being trimmed and some gas leases are being allowed to expire. This is all
in response to realigning operations to better optimize current conditions.
2012 Oklahoma City MSA
6
Figure 1: U.S. Real GDP and Payroll Employment Growth: Percent Change
National Economic Conditions
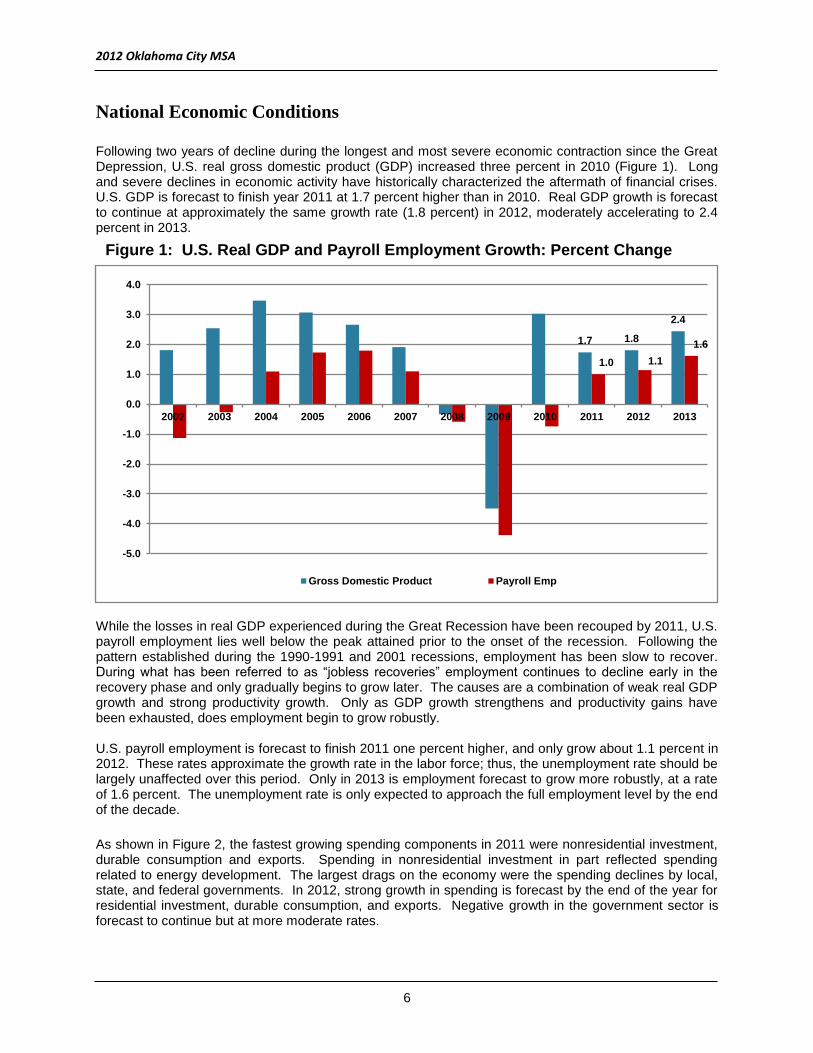
Following two years of decline during the longest and most severe economic contraction since the Great Depression, U.S. real gross domestic product (GDP) increased three percent in 2010 (Figure 1). Long and severe declines in economic activity have historically characterized the aftermath of financial crises. U.S. GDP is forecast to finish year 2011 at 1.7 percent higher than in 2010. Real GDP growth is forecast to continue at approximately the same growth rate (1.8 percent) in 2012, moderately accelerating to 2.4 percent in 2013.
While the losses in real GDP experienced during the Great Recession have been recouped by 2011, U.S. payroll employment lies well below the peak attained prior to the onset of the recession. Following the pattern established during the 1990-1991 and 2001 recessions, employment has been slow to recover. During what has been referred to as “jobless recoveries” employment continues to decline early in the recovery phase and only gradually begins to grow later. The causes are a combination of weak real GDP growth and strong productivity growth. Only as GDP growth strengthens and productivity gains have been exhausted, does employment begin to grow robustly. U.S. payroll employment is forecast to finish 2011 one percent higher, and only grow about 1.1 percent in 2012. These rates approximate the growth rate in the labor force; thus, the unemployment rate should be largely unaffected over this period. Only in 2013 is employment forecast to grow more robustly, at a rate of 1.6 percent. The unemployment rate is only expected to approach the full employment level by the end of the decade.
As shown in Figure 2, the fastest growing spending components in 2011 were nonresidential investment, durable consumption and exports. Spending in nonresidential investment in part reflected spending related to energy development. The largest drags on the economy were the spending declines by local, state, and federal governments. In 2012, strong growth in spending is forecast by the end of the year for residential investment, durable consumption, and exports. Negative growth in the government sector is forecast to continue but at more moderate rates.
1.7 1.8
2.4
1.0 1.1
1.6
-5.0
-4.0
-3.0
-2.0
-1.0
0.0
1.0
2.0
3.0
4.0
2002 2003 2004 2005 2006 2007 2008 2009 2010 2011 2012 2013
Gross Domestic Product Payroll Emp
Figure 1: U.S. Real GDP and Payroll Employment Growth: Percent Change

2012 Oklahoma City MSA
7
The energy sector is expected to remain strong, though with growth moderating in 2012. As shown in Figure 3, the price of West Texas Intermediate Oil is forecast to decline slightly by the end of 2012, but then rise sharply by the end of 2013 with the strengthening of the national economy. The price of natural gas (Henry Hub) is forecast to increase robustly throughout both years. Clearly, these forecasts are sensitive to the resulting economic growth in the country and world, and geopolitical events as evidenced by recent tensions with Iran. Stronger than expected economic growth in 2012 would shift some of the forecasted price increases for 2013 into 2012. Likewise, increased uncertainty in the energy markets could cause prolonged rises in energy prices. However, significant downside risks also exist such as the unfolding debt crisis in Europe and slowing of growth in China.
-15.0
-10.0
-5.0
0.0
5.0
10.0
15.0
2011Q1 2011Q2 2011Q3 2011Q4 2012Q1 2012Q2 2012Q3 2012Q4
GDP ConsDur ConsNondurInvtNonres InvtRes ExportsImports FedGov S&Lgov
Figure 2: U.S. Real GDP Component Growth: Percent Change
Figure 3: Energy Price Forecasts

2012 Oklahoma City MSA
8
Figures 4 and 5 show forecasts of U.S. employment by sector. These are important to understand as they factor into the sector forecasts for the Oklahoma state and local economies. Following strong growth in 2011, employment in the Natural Resources and Mining sector is expected to become much more moderate in 2012 and 2013. Energy prices affect employment in the sector, but with a time lag. Thus, a large part of the growth benefit of the forecasted surge of energy prices at the end of 2013 is expected to occur in 2014. Following growth in 2011, employment in Durable Goods Manufacturing is expected to be flat in 2012 and decline slightly in 2013. Employment in both Nondurable Goods Manufacturing and Construction is expected to decline in 2012 but increase mildly in 2013. Employment growth in both the Retail Trade and Wholesale Trade sectors is expected to strengthen in each of the next two years. Health Services employment growth is forecast to hold steady at approximately two percent. Corresponding to forecasted declines in spending, employment is forecast to decline in both State and Local Government and Federal Government in 2012, though slight gains are forecast for State and Local Government in 2013.
Figure 4: U.S. Employment Forecasts, Total Nonfarm and by Sector: Percent Growth
Figure 5: U.S. Employment Sector Forecasts: Percent Growth

2012 Oklahoma City MSA
9
Oklahoma Economic Forecast The Oklahoma economy lagged behind the nation in falling into recession (Figure 6). While the national economic recession began in December of 2007, the first negative quarterly growth rate in Oklahoma did not occur until the fourth quarter of 2008. Two primary factors account for the disparity. First, the regions that led the nation into recession were those that experienced the largest housing market bubbles. Second, energy prices initially ran counter to the national economic cycle. Areas in the southwest, southeast and northwest regions of the nation saw rapid increases in housing prices and booms in construction employment during the 2002-2006 period. However, when the housing bubble burst, many of these areas began to falter as wealth and consumer credit declined with the fall in housing prices, leading to spending declines on consumer durable goods and housing. The declines in spending then spread across the nation as producers of consumer and housing goods elsewhere were adversely affected. Natural gas and oil prices held up during the onset of the national recession, peaking in the second quarter of 2008. Subsequently, energy prices declined dramatically and Oklahoma and most other energy producing states fell into recession with the nation. In fact, Oklahoma experienced a quarterly negative employment growth rate approximately equal to the most negative rate experienced nationwide.
Although Oklahoma was late going into recession, it emerged from recession at the same time as the nation. Over the 2007-2010 period, Oklahoma had the eighth fastest growth in employment as reported by the U.S. Bureau of Economic Analysis. Recent employment growth in Oklahoma has greatly exceeded that of the nation, particularly during the second quarter of 2011.
Figure 6: Quarterly U.S. and Oklahoma Nonfarm Employment Growth 1990Q1-2011Q3
(Seasonally-Adjusted Annualized Percent Change)

2012 Oklahoma City MSA
10
Based on data through the third quarter of the year, employment is expected to have averaged two percent higher in 2011 when compared to 2010 (Figure 7). Growth is forecast to moderate to approximately 1.8 percent in 2012 and 1.4 percent in 2013. Only in 2013 does the level of employment exceed the peak established in 2008. The 2013 employment growth forecast is roughly on par with the forecast for the nation. The strong energy price growth in latter 2013 is expected to have most of its effect in 2014.
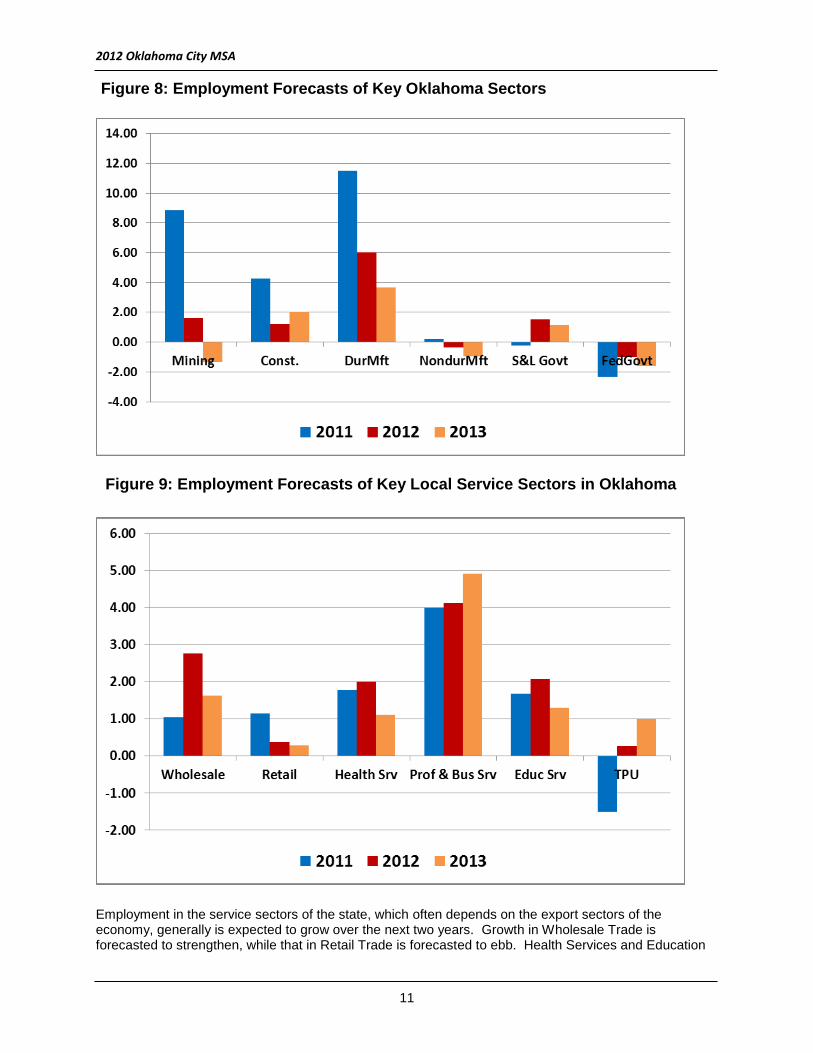
Figures 8 and 9 display the forecasted growth rates of key sectors of the Oklahoma economy. Following the nation, employment growth in the Natural Resources and Mining sector is expected to moderate along with energy prices. Yet, any deviation in energy prices from the forecasts will greatly affect the forecast for employment in this sector. Employment growth in both Durable Goods Manufacturing and Construction is forecast to moderate over the next two years. Growth in Nondurable Goods Manufacturing is forecast to turn slightly negative over the period. State and Local Government employment is forecast to rise slightly as the state budget recovers, but this is highly dependent on the political process. Federal Government employment in the state is forecast to continue declining.
Figure 7: Oklahoma Total Nonfarm Employment: Level and Percent Change
2012 Oklahoma City MSA
11
Employment in the service sectors of the state, which often depends on the export sectors of the economy, generally is expected to grow over the next two years. Growth in Wholesale Trade is forecasted to strengthen, while that in Retail Trade is forecasted to ebb. Health Services and Education
Figure 8: Employment Forecasts of Key Oklahoma Sectors
Figure 9: Employment Forecasts of Key Local Service Sectors in Oklahoma

2012 Oklahoma City MSA
12
Services employment is forecast to continue at approximately the current pace in 2012, though expected to slow in 2013. Strong growth in Professional and Business Services is forecast to continue. Employment growth in Transportation Services and Public Utilities is forecast to turn from negative in 2011 to positive in 2012 and more robustly positive in 2013. Following declines in 2009, both Real Personal Income and Nonfarm Real Gross State Product (GSP) increased in 2010. Based on data through 2010 from the U.S. Bureau of Economic Analysis (BEA), real GSP is forecast to increase approximately 4.7 percent in 2011, declining to 3.2 percent in 2012. Using BEA data through the second quarter of 2011, and the consumer price index for all urban consumers produced by the U.S. Bureau of Labor Statistics through the third quarter of 2011, real income is forecast to increase 3.1 percent in 2011, with growth declining to 2.8 percent in 2012.
Figure 10: Real Personal Income and Nonfarm Real Gross State Product Growth
(percent change)
2012 Oklahoma City MSA
13
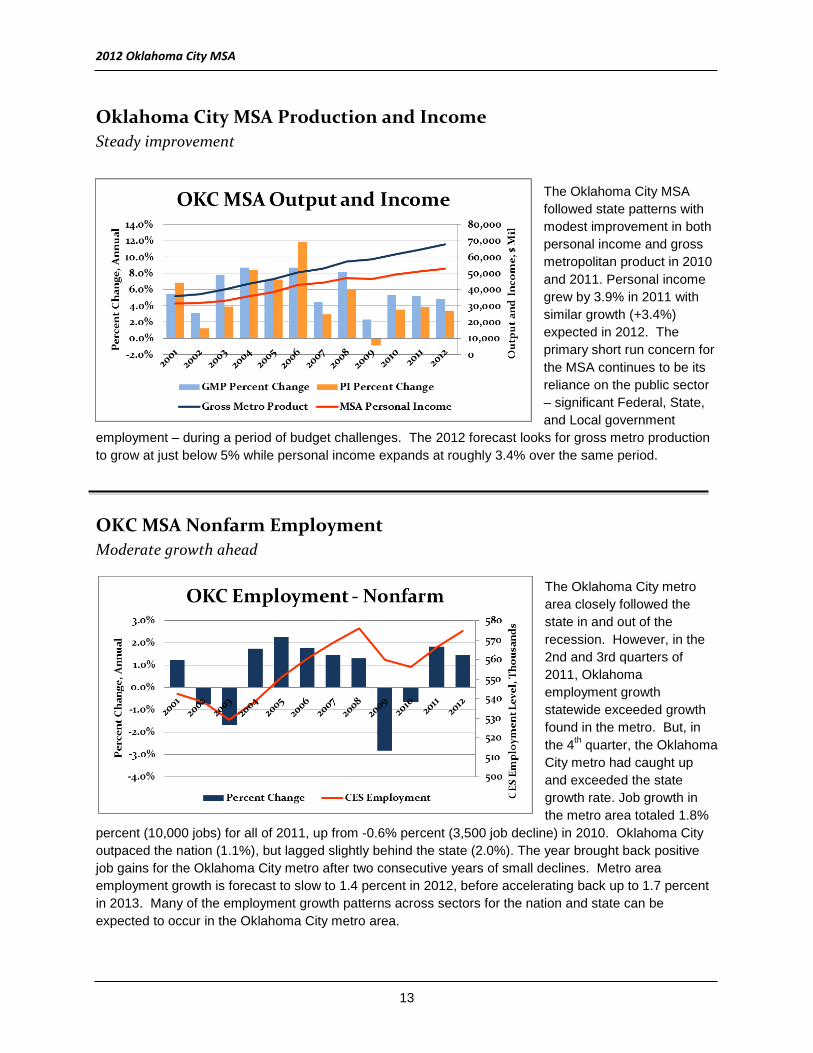
Oklahoma City MSA Production and Income
Steady improvement
The Oklahoma City MSA
followed state patterns with
modest improvement in both
personal income and gross
metropolitan product in 2010
and 2011. Personal income
grew by 3.9% in 2011 with
similar growth (+3.4%)
expected in 2012. The
primary short run concern for
the MSA continues to be its
reliance on the public sector
– significant Federal, State,
and Local government
employment – during a period of budget challenges. The 2012 forecast looks for gross metro production
to grow at just below 5% while personal income expands at roughly 3.4% over the same period.
OKC MSA Nonfarm Employment
Moderate growth ahead The Oklahoma City metro
area closely followed the
state in and out of the
recession. However, in the
2nd and 3rd quarters of
2011, Oklahoma
employment growth
statewide exceeded growth
found in the metro. But, in
the 4th quarter, the Oklahoma
City metro had caught up
and exceeded the state
growth rate. Job growth in
the metro area totaled 1.8%
percent (10,000 jobs) for all of 2011, up from -0.6% percent (3,500 job decline) in 2010. Oklahoma City
outpaced the nation (1.1%), but lagged slightly behind the state (2.0%). The year brought back positive
job gains for the Oklahoma City metro after two consecutive years of small declines. Metro area
employment growth is forecast to slow to 1.4 percent in 2012, before accelerating back up to 1.7 percent
in 2013. Many of the employment growth patterns across sectors for the nation and state can be
expected to occur in the Oklahoma City metro area.

2012 Oklahoma City MSA
14
Professional & Business Services
Anticipate strongest growth of any sector in 2012
The Professional &
Business Services
sector has experienced
year over year
increases in each of the
past two years. 2011
brought about
especially strong
growth of 7.7% or 500
jobs. Approximately
8,800 Professional and
Business Services jobs
have been added to the
metro economy since
2004. The sector
should expand by 4% or 3,000 jobs in 2012. More than half of all Business Service jobs are in the
administrative support, waste management, and remediation sector, which is dominated by temporary
employment.
Manufacturing
First employment gains in seven years
2011 brought about the first
year over year increase in
manufacturing employment
to the region since 2004.
This is largely attributed to
Durable Goods
Manufacturing tied to the oil
and gas sector.
Manufacturing employment
expanded by 6.1% or 1,500
jobs in 2011. Local
manufacturing firms are
expected to add an
additional 1,000 jobs (3.7%
increase) in 2012. This is a welcome change as the Oklahoma City metro attempts to capitalize on some
of the Durable Goods Manufacturing employment growth expected at the state level. Despite anticipated
gains in 2012, the region will continue to struggle in its efforts to recapture the 21,000 manufacturing jobs
shed since its peak levels in 1999.
2012 Oklahoma City MSA
15
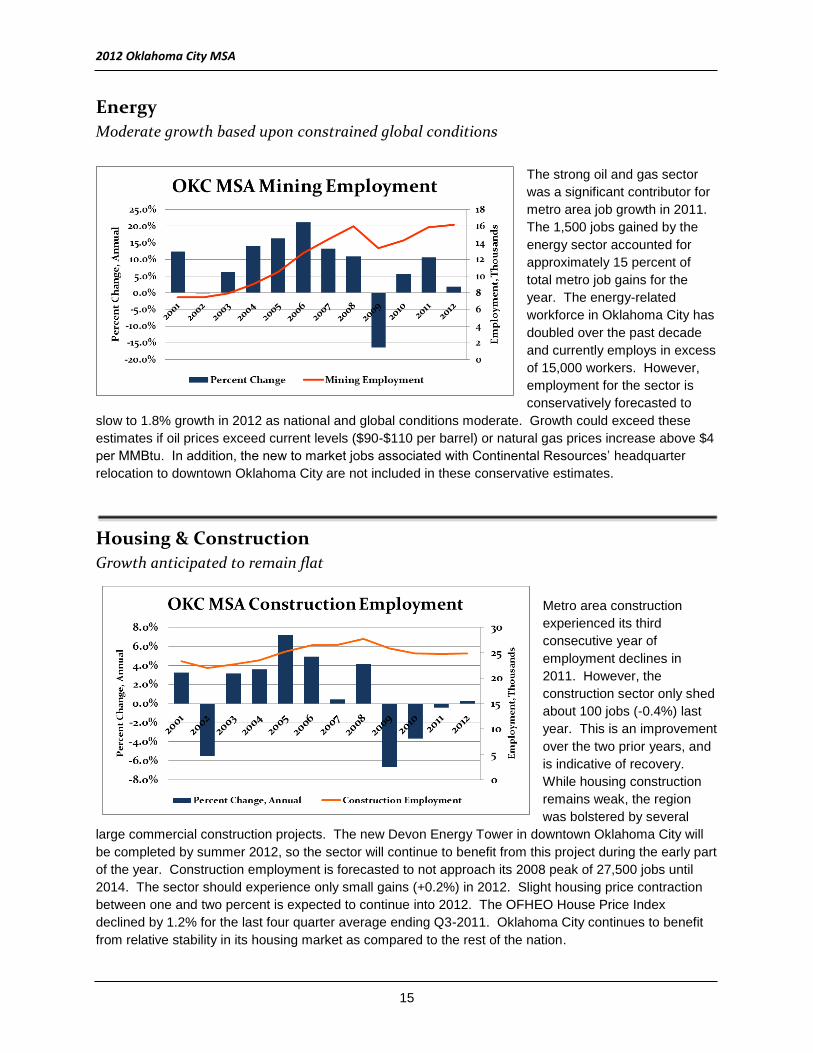
Energy
Moderate growth based upon constrained global conditions
The strong oil and gas sector
was a significant contributor for
metro area job growth in 2011.
The 1,500 jobs gained by the
energy sector accounted for
approximately 15 percent of
total metro job gains for the
year. The energy-related
workforce in Oklahoma City has
doubled over the past decade
and currently employs in excess
of 15,000 workers. However,
employment for the sector is
conservatively forecasted to
slow to 1.8% growth in 2012 as national and global conditions moderate. Growth could exceed these
estimates if oil prices exceed current levels ($90-$110 per barrel) or natural gas prices increase above $4
per MMBtu. In addition, the new to market jobs associated with Continental Resources’ headquarter
relocation to downtown Oklahoma City are not included in these conservative estimates.
Housing & Construction
Growth anticipated to remain flat
Metro area construction
experienced its third
consecutive year of
employment declines in
2011. However, the
construction sector only shed
about 100 jobs (-0.4%) last
year. This is an improvement
over the two prior years, and
is indicative of recovery.
While housing construction
remains weak, the region
was bolstered by several
large commercial construction projects. The new Devon Energy Tower in downtown Oklahoma City will
be completed by summer 2012, so the sector will continue to benefit from this project during the early part
of the year. Construction employment is forecasted to not approach its 2008 peak of 27,500 jobs until
2014. The sector should experience only small gains (+0.2%) in 2012. Slight housing price contraction
between one and two percent is expected to continue into 2012. The OFHEO House Price Index
declined by 1.2% for the last four quarter average ending Q3-2011. Oklahoma City continues to benefit
from relative stability in its housing market as compared to the rest of the nation.

2012 Oklahoma City MSA
16
Education and Health Services
Combined sector responds after two consecutive years of flat growth
The heavy concentration of advanced and specialized medical care facilities in Oklahoma City draw residents from across the state and region and produce a large net inflow of spending to the metro area economy. The Bioscience industry continues to develop, providing prospects
for long-run high wage job growth in the region. The Health Care and Social Assistance sector now employs 1 in 8 metro area workers. While job growth in 2011 was flat, it is expected to increase by 2.6% or 1,700 jobs in 2012. Over the past three years, the region has seen a surge in Health Care capital expenditure projects. Private education workforce showed a slight decline in 2011 (less than 1%) and is expected to contract by 1% again next year before rebounding in 2013.
Government
Uncertain future
The Government sector continues to serve as the largest source of employment in the Oklahoma City metropolitan area, representing 1 in 5 jobs. Currently, there are more than 119,000 federal, state, and local government jobs based in the metro. State and local employees comprise three of four public sector jobs in the region with
local governments employing slightly more workers than state government. Growth in state government jobs is expected to be very flat in 2012, while local governments throughout the seven county metro are expected to add only 680 jobs. Local governments have shed jobs in the two previous years and will only recover a portion of those positions in 2012. Tribal employment accounts for approximately 20% of all local government jobs statewide. The data is not available to clearly define how tribal employment has contributed to metro job gains or declines within the sector. Caution continues, but continued strength in sales tax collections will allow for local municipalities to add back essential personnel. In 2011, 900 jobs were shed by the Federal Government sector. Based upon historical trends, the Federal Government sector anticipates a similar decline of 3.6% or about 1,000 jobs in 2012. However, it is extremely difficult to forecast public sector employment due to challenges associated with anticipating the actions of policymaking bodies. Further federal budget cuts should be watched carefully.

2012 Oklahoma City MSA
17
OKC MSA Population
Growth expected to outpace both the state and nation
The metro population is
expected to grow by 1.4%
in 2012, once again
outpacing the nation. Over
the past 10 years, each
county in the Oklahoma
City MSA grew at a faster
rate than the state
average. Overall, the
metro area’s annual
population growth rate
was 45% more than the
nation from 2000 to 2010
(1.35% annual growth
compared to 0.93% annual growth for nation). While Oklahoma County continues to be the driving
engine for jobs, the fastest growing counties for population in the metro are Canadian, McClain, Logan,
and Cleveland counties (all above 2% annual growth, while Oklahoma County is under 1%). Commuting
patterns support those numbers and emphasize the importance of the 10 county regional partnership for
economic development purposes. MSA population is projected to exceed 1.3 million persons by 2013.
City of Oklahoma City Sales Tax Receipts
Surprising strength Sales tax receipts for the
City of Oklahoma City
were surprisingly strong
in FY2011. For FY2011,
sales tax receipts grew
by 11.9% over prior year.
In general, this was the
case for most
communities within the
Oklahoma City MSA.
Despite optimism over an
increase in sales tax
receipts, when adjusted
for inflation, levels are very comparable to FY2008-09. Oklahoma City enjoyed some very high profile
new to market retail openings or announcements in 2011, including the Outlet Shoppes at Oklahoma City,
Whole Foods, Sunflower Farmer’s Market and Anthropologie. In particular, the Outlet Shoppes at
Oklahoma City is considered to be a destination retail location drawing in visitors from multiple states and
communities. It reported $17.9 million in sales during the mall’s opening month, beating projections by
double digits. The new Whole Foods location tripled the projected number of customers in its first week
and prompted the hiring of an additional 40 people. Despite local optimism, the retail sector continues to
be dictated by national economic uncertainty.
Gross Receipts

2012 Oklahoma City MSA
18
For more information, contact: Eric Long Research Economist Economic Development Division (405) 297-8976
[email protected] A publication created by the Greater Oklahoma City Chamber exclusively for members and subscribers. The Greater Oklahoma City Chamber Economic Forecast is published annually by the Greater Oklahoma City Chamber.
Sector 2001 2002 2003 2004 2005 2006 2007 2008 2009 2010 2011e 2012f
Total 542.45 538.31 529.28 538.54 550.70 560.42 568.61 576.08 559.82 556.29 566.52 574.66
1.2% -0.8% -1.7% 1.8% 2.3% 1.8% 1.5% 1.3% -2.8% -0.6% 1.8% 1.4%
Natural Resources & Mining 7.47 7.47 7.93 9.05 10.52 12.75 14.43 16.02 13.38 14.32 15.85 16.14
12.4% -0.1% 6.2% 14.1% 16.3% 21.2% 13.2% 11.0% -16.5% 5.7% 10.7% 1.8%
Construction 23.28 22.00 22.70 23.51 25.20 26.43 26.55 27.65 25.82 24.84 24.73 24.79
3.3% -5.5% 3.2% 3.6% 7.2% 4.9% 0.4% 4.1% -6.6% -3.7% -0.4% 0.3%
Manufacturing 48.57 41.90 38.82 38.99 38.62 38.28 37.04 36.99 32.51 30.81 32.32 33.24
-6.4% -13.7% -7.3% 0.4% -0.9% -0.9% -3.2% -0.1% -12.1% -5.3% 4.9% 2.9%
Non-Durable Goods 12.72 12.02 11.28 11.48 11.64 11.27 9.57 9.25 8.95 9.13 9.31 9.37
-8.9% -5.6% -6.1% 1.8% 1.4% -3.2% -15.1% -3.3% -3.3% 1.6% 1.9% 0.7%
Durable Goods 35.85 29.88 27.54 27.51 26.98 27.01 27.48 27.74 23.55 21.68 23.01 23.87
-5.5% -16.7% -7.8% -0.1% -1.9% 0.1% 1.7% 1.0% -15.1% -7.9% 6.2% 3.7%
Trade, Transportation, & Utilities 100.71 99.12 96.97 96.82 98.99 100.30 101.21 100.72 97.25 96.58 98.91 99.93
-1.2% -1.6% -2.2% -0.2% 2.2% 1.3% 0.9% -0.5% -3.4% -1.0% 2.4% 1.0%
Wholesale Trade 21.72 21.42 21.03 21.00 21.71 22.74 22.92 22.95 21.87 21.76 22.03 22.53
-1.5% -1.4% -1.8% -0.2% 3.4% 4.7% 0.8% 0.1% -4.7% -0.7% 1.2% 2.3%
Retail Trade 61.65 61.50 60.63 60.39 61.42 61.55 61.99 62.29 59.88 59.76 61.66 62.03
-1.5% -0.2% -1.4% -0.4% 1.7% 0.2% 0.7% 0.5% -3.9% -0.7% 3.2% 0.6%
Transportation, Warehousing, & Utilities 17.34 16.20 15.32 15.43 15.87 16.02 16.29 15.47 15.50 15.07 15.22 15.37
0.3% -6.6% -5.4% 0.8% 2.8% 0.9% 1.7% -5.0% 0.2% -2.4% 1.0% 1.0%
Information 14.45 14.03 13.46 13.62 13.38 13.18 12.51 12.58 12.17 10.60 10.10 10.07
3.8% -2.9% -4.1% 1.2% -1.7% -1.5% -5.1% 0.6% -3.3% -9.7% -4.7% -0.3%
Financial Activities 34.36 35.33 34.88 35.38 34.51 34.47 34.36 34.18 32.98 32.75 32.76 32.94
1.9% 2.8% -1.3% 1.4% -2.5% -0.1% -0.3% -0.5% -3.5% -1.5% 0.0% 0.5%
Professional & Business Services 68.53 67.85 64.79 66.52 69.95 72.19 74.84 74.86 69.73 69.94 75.32 78.40
2.9% -1.0% -4.5% 2.7% 5.2% 3.2% 3.7% 0.0% -6.9% 0.8% 7.7% 4.1%
Education & Health Services 60.81 64.37 65.47 67.69 69.05 70.23 72.72 75.58 77.05 76.22 76.20 77.85
3.8% 5.9% 1.7% 3.4% 2.0% 1.7% 3.5% 3.9% 1.9% -0.1% 0.0% 2.2%
Educational Services 5.00 5.39 6.52 7.27 7.64 7.46 7.88 8.32 8.72 9.05 8.98 8.89
6.0% 7.9% 20.9% 11.5% 5.1% -2.4% 5.6% 5.7% 4.8% 2.9% -0.8% -1.1%
Health Care & Social Assistance 55.82 58.98 58.95 60.42 61.41 62.77 64.84 67.25 68.34 67.17 67.22 68.97
3.6% 5.7% -0.1% 2.5% 1.6% 2.2% 3.3% 3.7% 1.6% -0.5% 0.1% 2.1%
Leisure & Hospitality 50.88 51.74 52.01 53.43 55.09 55.82 55.94 57.06 57.17 57.23 58.93 60.27
3.6% 1.7% 0.5% 2.7% 3.1% 1.3% 0.2% 2.0% 0.2% -0.6% 3.0% 2.3%
Other Services 24.23 23.96 23.48 23.21 23.19 23.00 23.20 23.85 23.47 22.75 22.34 22.22
0.7% -1.1% -2.0% -1.1% -0.1% -0.8% 0.9% 2.8% -1.6% -2.4% -1.8% -0.5%
Total Government 109.13 110.53 108.76 110.34 112.19 113.75 115.81 116.58 118.31 120.26 119.07 118.81
2.3% 1.3% -1.6% 1.4% 1.7% 1.4% 1.8% 0.7% 1.5% 1.1% -1.0% -0.2%
Federal Government 27.08 27.15 26.86 26.93 26.56 26.43 26.30 25.71 25.97 28.20 27.29 26.30
-0.3% 0.2% -1.0% 0.3% -1.4% -0.5% -0.5% -2.3% 1.0% 7.7% -3.2% -3.6%
State & Local Government 82.05 83.38 81.90 83.40 85.63 87.32 89.51 90.87 92.36 92.06 91.77 92.51
3.2% 1.6% -1.8% 1.8% 2.7% 2.0% 2.5% 1.5% 1.6% -0.7% -0.3% 0.8%eEstimate
fForecast 2001 2002 2003 2004 2005 2006 2007 2008 2009 2010 2011e 2012f
Oklahoma City MSA Non-Farm Wage & Salary Employment(Seasonally adjusted, in Thousands)


![Deflection, disassociation, & acknowledgement: a content ... · earthquakes greater than magnitude 3.0 occurred in Oklahoma than in California [Terry-Cobo,2014]. In Oklahoma, the](https://img.pdfslide.net/doc/110x75/5f55fbefbba14e48d36a0801/deflection-disassociation-acknowledgement-a-content-earthquakes-greater.jpg)


![Towards a High Resolution Soil Moisture Map of Oklahoma...Forecast Center Stage IV data was made available by the Oklahoma Mesonet. [3] McPherson, R. A., et al., 2007: Statewide monitoring](https://img.pdfslide.net/doc/110x75/5f7f2b8c49c33b0eee7caf13/towards-a-high-resolution-soil-moisture-map-of-forecast-center-stage-iv-data.jpg)