Embed Size (px)
Citation preview

AT JUNE 30TH, 2012
HALF-YEAR FINANCIAL REPORT

Contents
Activity Report 21.1. The Group consolidated 21.2. Segment information 31.3. Important events during the period 61.4. Risk factors and transactions between related parties 71.5. Prospects 71.6. Subsequent events 7
Condensed consolidated fi nancial statements 82.1. Compared consolidated income statements 82.2. Consolidated statements of net profit and gains and losses recognised directly in equity 92.3. Compared consolidated balance sheets 102.4. Consolidated statements of changes in equity 112.5. Compared consolidated statements of cash flows 132.6. Notes to the condensed consolidated financial statements 14
Statutory Auditors’ review Report on the 2012 Half-year fi nancial information 28
Declaration by the person responsible for the Half-year Financial Report 29
Page
1
2
3
4

1L’ORÉAL HALF-YEAR FINANCIAL REPORT AT JUNE 30TH, 2012
Half-year situation at June 30th, 2012
The following statements have been examined by the Board of Directors of August 28th, 2012 and have been the object of a limited review by the Statutory Auditors.
This is a free translation into English of the L’Oréal 2012 Half-year Financial Report issued in the French language and is provided solely for the convenience of English speaking readers. In case of discrepancy the French version prevails.
Half-year Financial Report
at June 30th, 2012

2 L’ORÉAL HALF-YEAR FINANCIAL REPORT AT JUNE 30TH, 2012
It should be noted that L’Oréal’s half-year results are not representative of the full-year results.
Based on reported figures, the Group’s sales, at June 30th, 2012, amounted to 11.21 billion euros, an increase of +10.5%. Like-for-like, i.e. based on a comparable structure and identical exchange rates, the sales growth of the L’Oréal G roup was +6.0%. The net impact of changes in consolidation was +0.7%. Currency fluctuations had a positive impact of +3.8%. If the current exchange rates , i.e. €1 = $1.25 , are extrapolated up to December 31st, the impact of currency fluctuations on sales would be approximately +5.0 % for the whole of 2012.Growth at constant exchange rates was +6.7%.
1.1.1. Consolidated profit and loss accounts
Gross profit, at €7,966 million, grew strongly: +9.7%. It came out at 71.0% of sales, compared with 71.2% in 2011 and 71.5% in the first half of 2011.
The variation particularly reflects the exchange rate effect due to the weakening of the euro against the main currencies, and the impact of the consolidation of the American company Clarisonic. It also reflects a slight increase in customer allowances , in the context of arbitrage with advertising and promotion expenses.
Research and development expenses have remained stable as a percentage of sales, at 3.4%, and have grown strongly. This increase demonstrates the Group’s constant determination to support its investments in Research and Innovation.
Advertising and promotion expenses came out at 30.4% of sales, a level slightly below that recorded in the first half of 2011.
Selling, general and administrative expenses, at 20.3% of sales, were at a lower level than in the first half of 2011, confirming the fact that productivity efforts are continuing.
Operating profit grew by 11.4%, representing an improvement of 10 basis points compared with the first half of 2011, at 16.9%.
Overall finance costs, at €4.7 million, have fallen sharply compared with the first half of 2011, as a result of the significant decline in net debt.
The dividend received from Sanofi for 2011 amounted to €313 million, an increase of +6.0%.
Profit before tax excluding non-recurrent items amounted to €2,205.2 million, an increase of +10.9%.
Income tax amounted to €545million, representing a rate of 24.7%, slightly above the rate in the first half of 2011.
Net profit excluding non-recurring items after non-controlling interests amounted to €1,658.6 million, up by +10.1%. EPS amounted to €2.75, up by +8.9% compared with the first half of 2011.
After allowing for non-recurring items, linked mainly to industrial restructuring, net profit after non-controlling interests amounted to €1,625.2 million, an increase of +10.8%.
1.1.2. Cash flow statements/balance sheet
Gross cash flow amounted to €1,963 million, an increase of 9.3% compared with the first half of 2011.
The change in working capital has increased significantly, as is traditionally the case in the first half of the year.
Total cash flows from operating activities amounted to €1,251 million.
Investments amounted to €483 million, that is 4.3% of sales.
After payment of the dividend and equity investments, consisting mainly of the acquisition of Cadum, the residual cash flow came out at -€238 million.
At June 30th, 2012, cash net of financial debt was positive at €234 million.
The balance sheet structure, which was already robust, was further reinforced with shareholders’ equity representing 66% of total assets.
1.1. The Group consolidated
1Activity Report

Activity Report
3L’ORÉAL HALF-YEAR FINANCIAL REPORT AT JUNE 30TH, 2012
Segment information
1.2. Segment information
1.2.1. By branch
1.2.1.1. Cosmetics
52%
Consumer Products8%
Active Cosmetics
25%
L’Oréal Luxe
15%
Professional Products
The Professional Products Division posted growth of +2.9% like-for-like and +7.3% based on reported figures. The first-half highlight was the Division’s good performance in the New Markets, particularly in Asia and Eastern Europe.
♦ L’Oréal Professionnel is reinforcing its positions in hair colourants with the success of INOA 2, the arrival of Infinie Platine and the launch of Mythic Oil, a range of highly sensorial services. Kérastase is recording good growth, thanks in particular to the new Cristalliste line. Redken is launching Chromatics, a hair colourant with ODS 2. At Matrix, growth is being driven by haircare, with Total Results and the launch of Exquisite Oil, inspired by traditional Indian hair oil rituals. Essie professional nail care products, now launched in Europe, recorded good scores in the first half, and this was also the case for Kéraskin skincare.
♦ Across the geographic zones, the Division is maintaining its positions in Western Europe in a difficult market. In North America, the good results of Salon Centric enabled the Division to outperform the market. In the New Markets, countries such as India and China, along with Argentina, Russia and Poland, are contributing strongly to the Division’s growth.
The Consumer Products Division achieved sales growth of +4.7% like-for-like, and +8.1% based on reported figures, and made substantial market share gains in Western Europe and North America.
♦ L’Oréal Paris confirmed the success of Elvive Triple Resist enriched with Arginine and has launched Elvive ExtraOrdinary Oil. In make-up, Rouge Caresse lipstick has made a very good start, and the same is true of Color Riche nail varnish. The Youth Code Luminize and Revitalift BB Cream skincare lines are boosting facial skincare sales.
At Garnier, Miracle Skin Perfector (BB Cream) is continuing its spectacular success in Europe, and now in North America. Already a big hit in the United States, Dark Spot Corrector skincare is arriving in Europe. Ultra Doux and Fructis dry shampoos have made a promising start.For Maybelline, the first half has been marked by the launch of the new Superstay 14hr One Step lipstick technology in the United States and Fit me foundations in Europe.
♦ In Western Europe, in a flat market, the Division is making significant market share gains, particularly in France, Germany, Italy and the Scandinavian countries. In North America, the Division recorded strong growth in all categories.In the New Markets, all the regions are achieving positive growth.Eastern Europe has returned to growth, thanks to the new hair colourant Color Sensation and BB cream, both from Garnier, and to L’Oréal Paris Elvive Triple Resist enriched with Arginine haircare.In Latin America, the Division is confirming the dynamic sales trend in Mexico, Argentina and Chile, but is suffering from a highly competitive market in Brazil.Asia, Pacific is recording good scores in China, Thailand and Indonesia. Australia was affected by a one-off operational problem.Finally, the Africa, Middle East zone is growing strongly.
Sales of the L’Oréal Luxe Division increased by +10.4% like-for-like. Growth based on reported figures came out at +17.9%, reflecting the impact of the acquisition of Clarisonic. L’Oréal Luxe is growing in all categories, and is making substantial market share gains.

4 L’ORÉAL HALF-YEAR FINANCIAL REPORT AT JUNE 30TH, 2012
Activity ReportSegment information
♦ Lancôme had a very good first half, particularly in facial skincare with its two serums Génifique and Visionnaire, and the new and highly exclusive Absolue L’Extrait. In make-up, Rouge in love, and the long-lasting foundation Teint Idole Ultra 24h are continuing to prove successful.At Yves Saint Laurent, the strategic launch of Forever Youth Liberator facial skincare is driving the brand’s growth in Asia. Rouge Pur Couture lip varnish has been acknowledged as a major innovation.Giorgio Armani strengthened its position in men’s fragrances with the launch of Acqua di Giò Essenza, and continued its strategic advances in make-up and facial skincare.Kiehl’s is continuing its rapid growth on all continents. Clearly Corrective, a great innovation in anti-blemish skincare, has had a very good start.The Designer Fragrance brands had a very good first half: Ralph Lauren with The Big Pony Fragrance Collection for Women, Viktor & Rolf with Flowerbomb, and Spicebomb, one of this year’s biggest hits in men’s products.Clarisonic, acquired in December, continued to grow strongly in the United States.
♦ In Western Europe, in a slightly negative market, the Division is advancing and winning market share, particularly in France, Germany and the United Kingdom, thanks to Lancôme, Yves Saint Laurent, Kiehl’s and Diesel.In North America, L’Oréal Luxe recorded strong growth, driven by Clarisonic, Yves Saint Laurent, Ralph Lauren and Kiehl’s, along with Viktor & Rolf.In the New Markets, the Division achieved very strong growth, particularly in Asia where market share gains were significant. Lancôme is proving highly dynamic there, along with Yves Saint Laurent and Helena Rubinstein. Giorgio Armani is growing in the Middle East, with its premium fragrance line Armani Privé. In Latin America, Ralph Lauren is proving highly successful with The Big Pony Collection for Women and Kiehl’s is continuing its roll-out, particularly in Brazil.The Division’s sales in Travel Retail are dynamic.
In the first half, the Active Cosmetics Division delivered growth of +5.4% like-for-like and +6.6% based on reported figures. The Division’s sales are accelerating in North America and the New Markets.
♦ La Roche-Posay is continuing to expand strongly in all geographic zones, thanks to the whole of its product catalogue, including Cicaplast Baume B5 in the skin repair segment. Vichy is continuing its recovery, with a new marketing campaign and the success of Idealia, a new generation of facial skincare which transforms skin quality.Roger & Gallet is being rolled out in Europe, particularly with the launch of Eau des Bienfaits.Finally, SkinCeuticals is continuing to prove highly dynamic.
♦ At the end of the first-half 2012, all the geographic zones are growing. North America, Latin America, Asia and Africa, Middle East are continuing their very strong growth. Western Europe is improving its performance thanks to the advances made by Vichy.
1.2.1.2. The Body Shop
At end-June, The Body Shop recorded like-for-like growth at +5.4% and +10.8% based on reported figures.
The Body Shop is growing strongly in the New Markets, particularly in South-East Asia where the dynamic sales trend is continuing in India and Indonesia, and sales are accelerating in Russia and in Saudi Arabia. In the developed countries, the brand is feeling the impact of the tough environment in Southern Europe, but its performance in Northern Europe has been solid.
The brand has continued to recruit new customers and accelerate its development in e-commerce, and now has 20 online sales sites.
The Body Shop is continuing its policy of sensorial innovations and militant launches, with Beauty Oils, a range of bodycare oils with Community Fair Trade ingredients, and a new capsule collection created with Lily Cole for her “zero cruelty” make-up line.
In addition, the brand is successfully continuing the international roll-out of Pulse, its innovative store concept, focused on story-selling and a highly interactive consumer experience.
At June 30th, 2012, The Body Shop has a total of 2,781 stores.
1.2.1.3. Dermatology (Group share, i.e. 50%)
Galderma’s sales increased by +11.0% like-for-like, and +19.9% based on reported figures.
Oracea (rosacea), Azzalure (muscle relaxant for frown lines) and Cetaphil recorded very strong growth.
The Asia, Pacific and Latin America zones, with double-digit growth, were the main contributors to sales growth in the first half. Growth was particularly strong in Brazil and South Korea, where the product ranges in Galderma’s three fields of activity (prescription drugs, OTC drugs and aesthetic and corrective products) are proving highly successful with health professionals.
The situation in Europe reflected more marked contrasts, as the economic environment has not been conducive to growth in aesthetic and corrective products. Germany achieved strong growth, thanks to the very good performance of Loceryl (an over-the-counter treatment for nail mycosis).
In North America, growth was strong in Canada, thanks in particular to the launch of Epiduo (acne). In the United States, the good performances of Epiduo and Oracea partly offset the impact on growth of the arrival on the market of generics of Clobex lotion and shampoo (psoriasis).
5L’ORÉAL HALF-YEAR FINANCIAL REPORT AT JUNE 30TH, 2012
Activity ReportSegment information
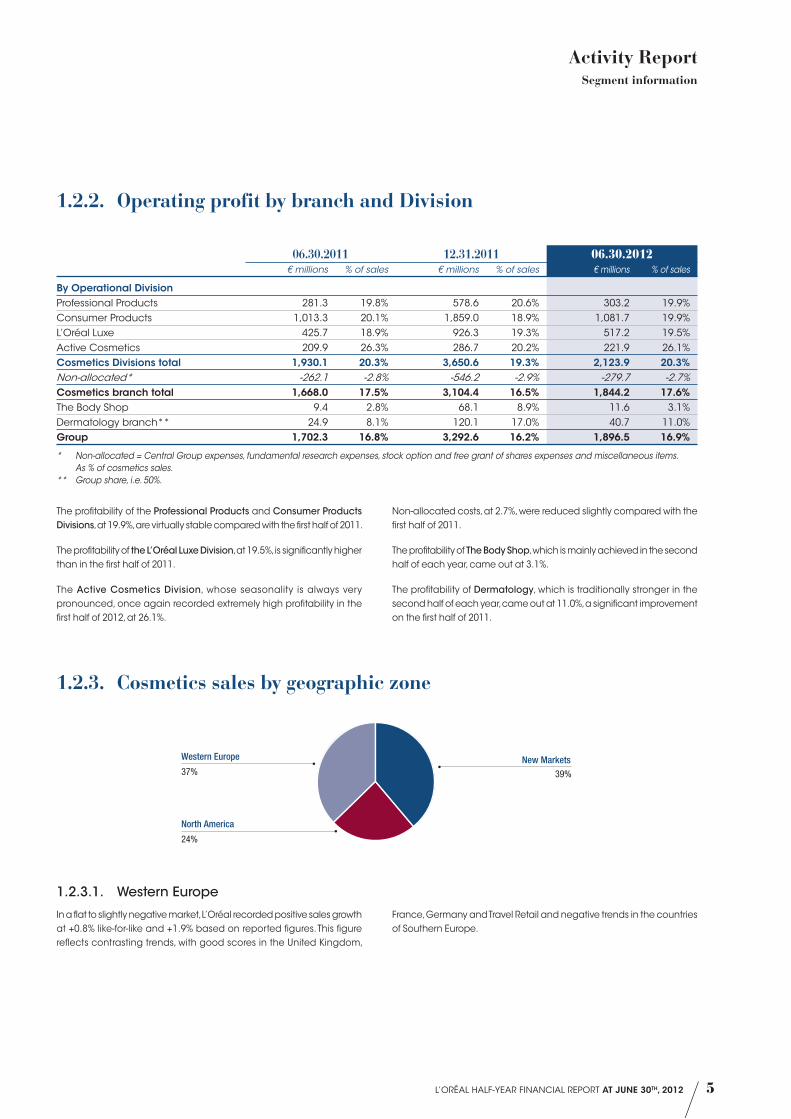
1.2.2. Operating profit by branch and Division
06.30.2011 12.31.2011 06.30.2012
€ millions % of sales € millions % of sales € millions % of sales
By Operational Division Professional Products 281.3 19.8% 578.6 20.6% 303.2 19.9%Consumer Products 1,013.3 20.1% 1,859.0 18.9% 1,081.7 19.9%L’Oréal Luxe 425.7 18.9% 926.3 19.3% 517.2 19.5%Active Cosmetics 209.9 26.3% 286.7 20.2% 221.9 26.1%Cosmetics Divisions total 1,930.1 20.3% 3,650.6 19.3% 2,123.9 20.3%Non-allocated* -262.1 -2.8% -546.2 -2.9% -279.7 -2.7%Cosmetics branch total 1,668.0 17.5% 3,104.4 16.5% 1,844.2 17.6%The Body Shop 9.4 2.8% 68.1 8.9% 11.6 3.1%Dermatology branch** 24.9 8.1% 120.1 17.0% 40.7 11.0%Group 1,702.3 16.8% 3,292.6 16.2% 1,896.5 16.9%
* Non-allocated = Central G roup expenses, fundamental research expenses, stock option and free grant of shares expenses and miscellaneous items. As % of cosmetics sales.
** Group share, i.e. 50%.
The profitability of the Professional Products and Consumer Products Divisions, at 19.9%, are virtually stable compared with the first half of 2011.
The profitability of the L’Oréal Luxe Division, at 19.5%, is significantly higher than in the first half of 2011.
The Active Cosmetics Division, whose seasonality is always very pronounced, once again recorded extremely high profitability in the first half of 2012, at 26.1%.
Non-allocated costs, at 2.7%, were reduced slightly compared with the first half of 2011.
The profitability of The Body Shop, which is mainly achieved in the second half of each year, came out at 3.1%.
The profitability of Dermatology, which is traditionally stronger in the second half of each year, came out at 11.0%, a significant improvement on the first half of 2011.
1.2.3. Cosmetics sales by geographic zone
39%
New Markets37%
Western Europe
24%
North America
1.2.3.1. Western Europe
In a flat to slightly negative market, L’Oréal recorded positive sales growth at +0.8% like-for-like and +1.9% based on reported figures. This figure reflects contrasting trends, with good scores in the United Kingdom,
France, Germany and Travel Retail and negative trends in the countries of Southern Europe.
6 L’ORÉAL HALF-YEAR FINANCIAL REPORT AT JUNE 30TH, 2012
Activity ReportImportant events during the period
1.2.3.2. North America
In North America, L’Oréal achieved growth of +7.3% like-for-like and +17.8% based on reported figures in the first half of 2012. L’Oréal Luxe made a very good start to the year, thanks to Yves Saint Laurent, the launch of The Big Pony Fragrance Collection for Women by Ralph Lauren and the integration of Clarisonic. The Consumer Products Division continued to make market share gains, particularly with Maybelline, L’Oréal Paris and Essie in make-up, and Garnier in facial skincare. The Professional Products Division is growing faster than the market, thanks to the good scores of Kérastase and the relaunch of Pureology. The Active Cosmetics Division is continuing its breakthrough in the United States, driven by SkinCeuticals.
1.2.3.3. New Markets
At end-June 2012, the New Markets recorded growth of +10.2% like-for-like and +14.2% based on reported figures.
♦ Asia, Pacific: L’Oréal recorded growth figures of +12.5% like-for-like and +21.9% based on reported figures. Despite a slowdown in South Korea and Taiwan, and to a lesser extent China, the Group’s sales trend remains lively, particularly in China, Hong Kong, Indonesia and Thailand. Japan meanwhile is recovering, following the disaster which hit the country in the spring of 2011. Overall, L’Oréal is continuing to outperform its market, strengthening its positions in this zone. All the Divisions are growing, particularly L’Oréal Luxe, with Kiehl’s, Lancôme and Yves Saint Laurent. At Consumer Products Maybelline is performing very well in China, in India and the ASEAN countries.
♦ Eastern Europe: With sales growth of +3.1% like-for-like at end-June, L’Oréal has returned to growth, particularly in Russia and Ukraine. Kazakhstan is still extremely dynamic. The Professional Products Division is continuing to win over new hair salons. The Consumer Products Division has introduced winning initiatives: the new hair colourant Color Sensation and BB Cream by Garnier; and Elvive Triple Resist enriched with Arginine haircare by L’Oréal Paris.
♦ Latin America: Latin America recorded first half growth of +8.2% like-for-like, driven by L’Oréal Luxe and Active Cosmetics. Trends were favourable in all the countries in this zone, particularly in Central America, Argentina and Mexico, thanks in particular to the dynamic sales trends of Maybelline and the success of Elvive Triple Resist enriched with Arginine by L’Oréal Paris. The trend in Brazil is still suffering from a very high comparison base, and stiffer competition in haircare.
♦ Africa, Middle East: In the first half, the zone recorded growth of +17.2% like-for-like, and +18.2% based on reported figures, boosted by the Consumer Products and L’Oréal Luxe Divisions, and by the good dynamics in the Middle East. Several countries in this zone are growing very strongly, particularly the United Arab Emirates, Saudi Arabia, Egypt, Turkey and Pakistan. The new L’Oréal subsidiary based in Kenya is beginning its expansion in East Africa.
1.3. Important events during the period
♦ On April 26th, 2012, L’Oréal closed the acquisition of 100% of Cadum, the majority of which had been held by investment fund Milestone.Cadum, which mainly markets hygiene and toiletry products, achieved consolidated sales of 58 million euros, mainly with the brand Cadum. This new business has joined France’s Consumer Products Division.
♦ On Tuesday 17th of April, 2012, the Annual General Meeting of L’Oréal shareholders, which was held under the chairmanship of Mr. Jean-Paul Agon, Chairman and Chief Executive Officer, appointed three new Directors, Mrs. Christiane Kuehne, Mr. Paul Bulcke and Mr. Jean-Victor Meyers, and renewed the tenure of two Directors, Mr. Bernard Kasriel and Mr. Jean-Pierre Meyers for a 4-year term.

7L’ORÉAL HALF-YEAR FINANCIAL REPORT AT JUNE 30TH, 2012
Activity ReportRisk factors and transactions between related parties / Prospects / Subsequent events
1.4. Risk factors and transactions between related parties
1.4.1. Risks factorsRisk factors are similar to those presented in the section 1.8 of the 2011 Registration Document (pages 17 to 24) and did not change significantly during the first half-year of 2012. The amounts relating to market and financial risks at June 30th, 2012 are described in notes 14 & 15 in the section “Notes to the condensed consolidated financial statements” of this R eport.
1.4.2. Transactions between related parties
Transactions between the companies consolidated on a proportional basis (no company consolidated under the equity method) don’t represent a significant amount at June 30th, 2012. Furthermore, during the first half-year of 2012, there was no significant transaction concluded with a member of the senior management or with a shareholder having a material influence on the Group.
1.5. Prospects
With strong growth in sales and results, the first half of 2012 confirms the Group’s good dynamics. L’Oréal is continuing to strengthen its positions, and is thus reinforcing its leadership of the worldwide cosmetics market.
Driven by an ambitious project, the universalisation of beauty and the conquest of the next billion consumers, the Group has continued to build the L’Oréal of tomorrow: dynamising its brands, strengthening its geographic footprint , rolling out its research laboratories, opening new industrial sites, and continuing efforts to raise the productivity of advertising and promotion business drivers and organisational structures.
The growth in results confirms the relevance of L’Oréal business model: although it is important to emphasise that half-year figures are not particularly representative, this performance reflects the Group’s ability to build solid and profitable growth.
Bolstered by these results, and despite the uncertainties of the economic environment, the Group confirms for 2012 its ambition to outperform the market, and achieve another year of growth in sales, results and profitability.
1.6. Subsequent events
On July 13th, 2012, L’Oréal announced that it has completed the sale of the home care business from the Cadum Group to Eau Ecarlate SAS. This business achieved a turnover of 17 million euros in 2011, two thirds of which in France.
The Board of Directors has decided, in application of the authorisation approved by the Annual General Meeting of April 17th, 2012, to buy back L’Oréal shares for a maximum amount of 500 million euros, by December 31st, 2012. The shares bought back will be cancelled (see share buyback programme, pages 213-214 in the 2011 Registration Document).

8 L’ORÉAL HALF-YEAR FINANCIAL REPORT AT JUNE 30TH, 2012
2.1. Compared consolidated income statements
2Condensed consolidated financial statements
€ millions Notes 1st half 2012 1st half 2011 2011Net sales 3 11,213.2 10,149.6 20,343.1Cost of sales -3,247.2 -2,889.5 -5,851.5Gross profit 7,966.0 7,260.1 14,491.6Research and development -386.5 -346.3 -720.5Advertising and promotion -3,403.6 -3,135.4 -6,291.6Selling, general and administrative expenses -2,279.4 -2,076.1 -4,186.9Operating profit 3 1,896.5 1,702.3 3,292.6Other income and expenses 6 -55.6 -62.6 -96.3Operational profit 1,840.9 1,639.7 3,196.3Finance costs on gross debt -18.7 -18.8 -48.1Finance income on cash and cash equivalents 16.3 12.7 28.5Finance costs, net -2.4 -6.1 -19.6Other financial income (expenses) -2.2 -3.2 -5.6Sanofi dividends 313.3 295.6 295.6Profit before tax and non-controlling interests 2,149.6 1,926.0 3,466.7Income tax -522.8 -457.9 -1,025.8Net profit 1,626.8 1,468.1 2,440.9attributable to:
- owners of the c ompany 1,625.2 1,466.6 2,438.4- non-controlling interests 1.6 1.5 2.5
Earnings per share attributable to owners of the company (euros) 7 2.72 2.48 4.11 Diluted earnings per share attributable to owners of the company (euros) 7 2.69 2.46 4.08 Earnings per share attributable to owners of the company excluding non-recurring items (euros) 7 2.78 2.55 4.36 Diluted earnings per share attributable to owners of the company excluding non-recurring items (euros) 7 2.75 2.52 4.32

Condensed consolidated fi nancial statements
9L’ORÉAL HALF-YEAR FINANCIAL REPORT AT JUNE 30TH, 2012
Consolidated statements of net profi t and gains and losses recognised directly in equity
2.2. Consolidated statements of net profit and gains and losses recognised directly in equity
€ millions Notes 1st half 2012 1st half 2011 2011Consolidated net profit for the period 1,626.8 1,468.1 2,440.9
Financial assets available for sale 353.5 896.7 1,051.6 Cash flow hedges 6.7 37.7 -6.0 Cumulative translation adjustments 98.6 -359.5 114.5 Income tax on items that may be reclassified to profit or loss (1) -13.7 -26.0 -62.8
Items that may be reclassified to profit or loss 445.1 548.9 1,097.3 Actuarial gains and losses 12.4 -410.3 -1.0 -172.4 Income tax on items that may not be reclassified to profit or loss (1) 142.5 0.2 56.2
Items that may not be reclassified to profit or loss -267.8 -0.8 -116.2 Changes in gains and losses recognised directly in equity 177.3 548.1 981.1 Total net profit and gains and losses recognised directly in equity 1,804.1 2,016.2 3,422.0 Attributable to:
- owners of the company 1,802.5 2,014.6 3,419.5 - non-controlling interests 1.6 1.6 2.5
(1) The tax effect is as follows:
€ millions 1st half 2012 1st half 2011 2011Financial assets available for sale -12.2 -15.2 -63.9 Cash flow hedges -1.5 -10.8 1.1
Items that may be reclassified to profit or loss -13.7 -26.0 -62.8 Actuarial gains and losses 142.5 0.2 56.2
Items that may not be reclassified to profit or loss 142.5 0.2 56.2 Total 128.8 -25.8 -6.6

10 L’ORÉAL HALF-YEAR FINANCIAL REPORT AT JUNE 30TH, 2012
Condensed consolidated fi nancial statementsCompared consolidated balance sheets
2.3. Compared consolidated balance sheets
€ millions Notes 06.30.2012 06.30.2011 12.31.2011
ASSETS Non-current assets 19,996.0 17,945.8 19,135.0 Goodwill 8 6,439.5 5,705.9 6,204.6 Other intangible assets 8 2,500.8 2,232.0 2,477.3 Property, plant and equipment 9 2,987.9 2,672.0 2,880.8 Non-current financial assets 10 7,254.8 6,729.0 6,900.9 Deferred tax assets 813.0 606.9 671.4 Current assets 8,233.5 7,230.2 7,722.6 Current assets excluding assets held for sale 8,202.5 7,230.2 7,722.6 Inventories 2,109.5 1,896.0 2,052.1 Trade accounts receivable 3,494.2 3,049.9 2,996.2 Other current assets 1,056.2 969.9 904.1 Current tax assets 74.0 60.0 118.0 Cash and cash equivalents 11 1,468.6 1,254.4 1,652.2 Assets held for sale 2.1 31.0 - -Total 28,229.5 25,176.0 26,857.6
€ millions Notes 06.30.2012 06.30.2011 12.31.2011
EQUITY & LIABILITIES Equity 12 18,683.2 16,118.3 17,637.5 Share capital 121.2 120.5 120.6 Additional paid-in capital 1,475.4 1,251.2 1,271.4 Other reserves 13,647.7 12,322.5 12,368.8 Items recognised directly in equity 2,133.4 2,095.6 2,054.7 Cumulative translation adjustments 123.5 -449.1 24.9 Treasury stock -445.8 -691.3 -644.4 Net profit attributable to owners of the company 1,625.2 1,466.6 2,438.4 Equity attributable to owners of the company 18,680.6 16,116.0 17,634.4 Non-controlling interests 2.6 2.3 3.1 Non-current liabilities 2,369.8 1,854.5 2,090.2 Provisions for employee retirement obligations and related benefits 12.4 1,472.3 1,012.0 1,128.9 Provisions for liabilities and charges 13 169.5 172.6 226.1 Deferred tax liabilities 673.9 506.1 677.7 Non-current borrowings and debt 14 54.1 163.8 57.5 Current liabilities 7,176.5 7,203.2 7,129.9 Trade accounts payable 3,210.8 2,997.3 3,247.7 Provisions for liabilities and charges 13 552.9 517.0 500.7 Other current liabilities 2,022.5 1,905.8 2,066.7 Income tax 210.1 166.4 224.0 Current borrowings and debt 14 1,180.2 1,616.7 1,090.8 Total 28,229.5 25,176.0 26,857.6
11L’ORÉAL HALF-YEAR FINANCIAL REPORT AT JUNE 30TH, 2012
Condensed consolidated fi nancial statementsConsolidated statements of changes in equity
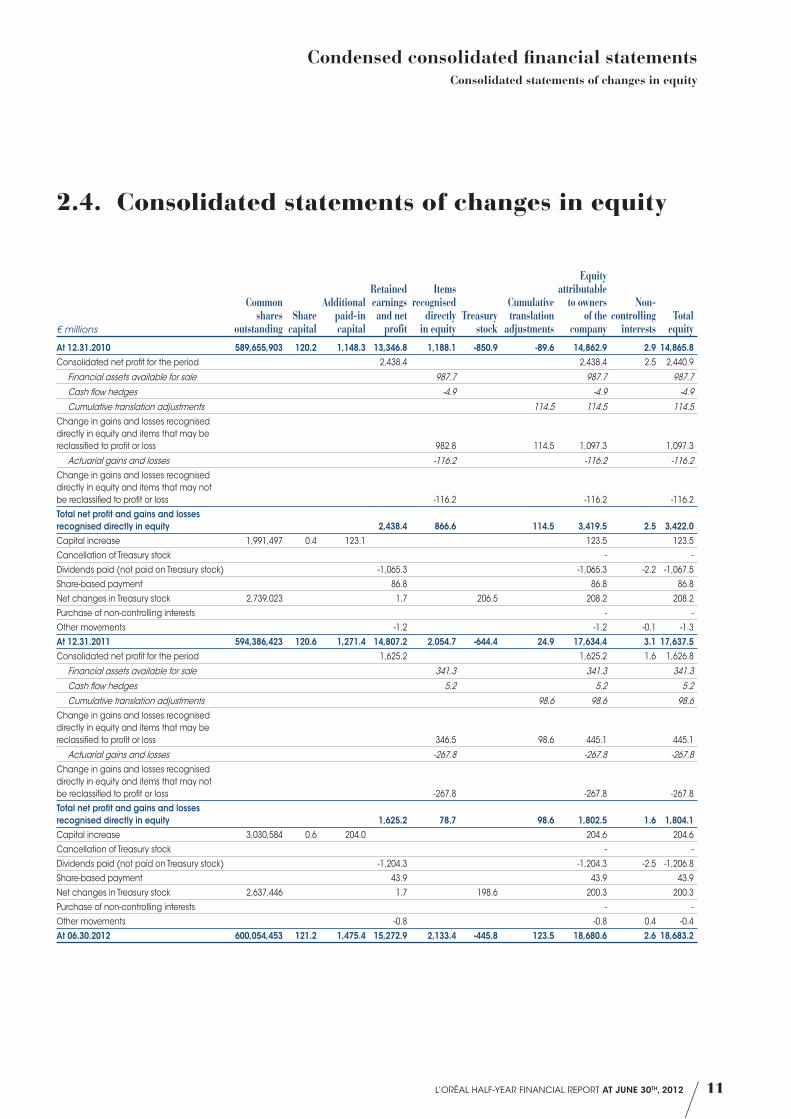
2.4. Consolidated statements of changes in equity
€ millions
Common shares
outstandingShare
capital
Additional paid-in capital
Retained earnings and net
profit
Items recognised
directly in equity
Treasury stock
Cumulative translation
adjustments
Equity attributable
to owners of the
company
Non-controlling
interestsTotal
equity
At 12.31.2010 589,655,903 120.2 1,148.3 13,346.8 1,188.1 -850.9 -89.6 14,862.9 2.9 14,865.8Consolidated net profit for the period 2,438.4 2,438.4 2.5 2,440.9
Financial assets available for sale 987.7 987.7 987.7
Cash flow hedges -4.9 -4.9 -4.9
Cumulative translation adjustments 114.5 114.5 114.5Change in gains and losses recognised directly in equity and items that may be reclassified to profit or loss 982.8 114.5 1,097.3 1,097.3
Actuarial gains and losses -116.2 -116.2 -116.2Change in gains and losses recognised directly in equity and items that may not be reclassified to profit or loss -116.2 -116.2 -116.2
Total net profit and gains and losses recognised directly in equity 2,438.4 866.6 114.5 3,419.5 2.5 3,422.0Capital increase 1,991,497 0.4 123.1 123.5 123.5
Cancellation of Treasury stock - -
Dividends paid (not paid on Treasury stock) -1,065.3 -1,065.3 -2.2 -1,067.5
Share-based payment 86.8 86.8 86.8
Net changes in Treasury stock 2,739,023 1.7 206.5 208.2 208.2
Purchase of non-controlling interests - -
Other movements -1.2 -1.2 -0.1 -1.3
At 12.31.2011 594,386,423 120.6 1,271.4 14,807.2 2,054.7 -644.4 24.9 17,634.4 3.1 17,637.5Consolidated net profit for the period 1,625.2 1,625.2 1.6 1,626.8
Financial assets available for sale 341.3 341.3 341.3
Cash flow hedges 5.2 5.2 5.2
Cumulative translation adjustments 98.6 98.6 98.6Change in gains and losses recognised directly in equity and items that may be reclassified to profit or loss 346.5 98.6 445.1 445.1
Actuarial gains and losses -267.8 -267.8 -267.8Change in gains and losses recognised directly in equity and items that may not be reclassified to profit or loss -267.8 -267.8 -267.8
Total net profit and gains and losses recognised directly in equity 1,625.2 78.7 98.6 1,802.5 1.6 1,804.1Capital increase 3,030,584 0.6 204.0 204.6 204.6
Cancellation of Treasury stock - -
Dividends paid (not paid on Treasury stock) -1,204.3 -1,204.3 -2.5 -1,206.8
Share-based payment 43.9 43.9 43.9
Net changes in Treasury stock 2,637,446 1.7 198.6 200.3 200.3
Purchase of non-controlling interests - -
Other movements -0.8 -0.8 0.4 -0.4
At 06.30.2012 600,054,453 121.2 1,475.4 15,272.9 2,133.4 -445.8 123.5 18,680.6 2.6 18,683.2
12 L’ORÉAL HALF-YEAR FINANCIAL REPORT AT JUNE 30TH, 2012
Condensed consolidated fi nancial statementsConsolidated statements of changes in equity
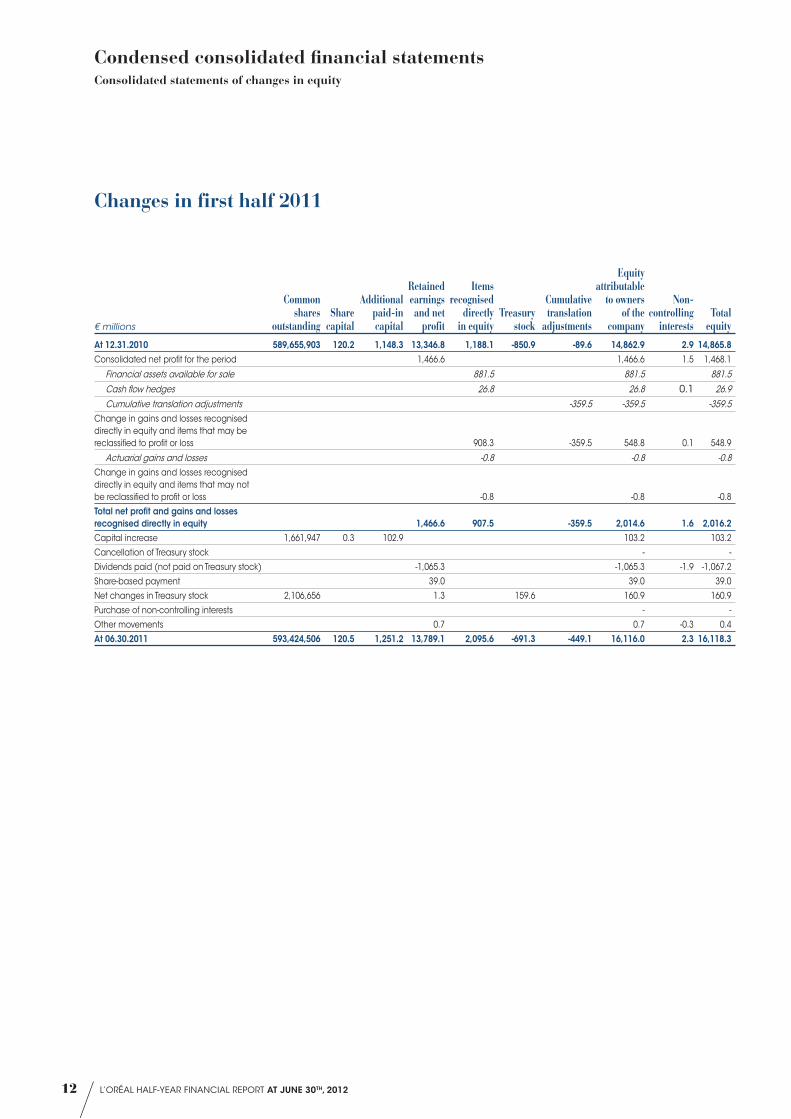
Changes in first half 2011
€ millions
Common shares
outstandingShare
capital
Additional paid-in capital
Retained earnings and net
profit
Items recognised
directly in equity
Treasury stock
Cumulative translation
adjustments
Equity attributable
to owners of the
company
Non-controlling
interestsTotal
equity
At 12.31.2010 589,655,903 120.2 1,148.3 13,346.8 1,188.1 -850.9 -89.6 14,862.9 2.9 14,865.8Consolidated net profit for the period 1,466.6 1,466.6 1.5 1,468.1
Financial assets available for sale 881.5 881.5 881.5
Cash flow hedges 26.8 26.8 0.1 26.9
Cumulative translation adjustments -359.5 -359.5 -359.5Change in gains and losses recognised directly in equity and items that may be reclassified to profit or loss 908.3 -359.5 548.8 0.1 548.9
Actuarial gains and losses -0.8 -0.8 -0.8Change in gains and losses recognised directly in equity and items that may not be reclassified to profit or loss -0.8 -0.8 -0.8
Total net profit and gains and losses recognised directly in equity 1,466.6 907.5 -359.5 2,014.6 1.6 2,016.2Capital increase 1,661,947 0.3 102.9 103.2 103.2
Cancellation of Treasury stock - -
Dividends paid (not paid on Treasury stock) -1,065.3 -1,065.3 -1.9 -1,067.2
Share-based payment 39.0 39.0 39.0
Net changes in Treasury stock 2,106,656 1.3 159.6 160.9 160.9
Purchase of non-controlling interests - -
Other movements 0.7 0.7 -0.3 0.4
At 06.30.2011 593,424,506 120.5 1,251.2 13,789.1 2,095.6 -691.3 -449.1 16,116.0 2.3 16,118.3
13L’ORÉAL HALF-YEAR FINANCIAL REPORT AT JUNE 30TH, 2012
Condensed consolidated fi nancial statementsCompared consolidated statements of cash fl ows
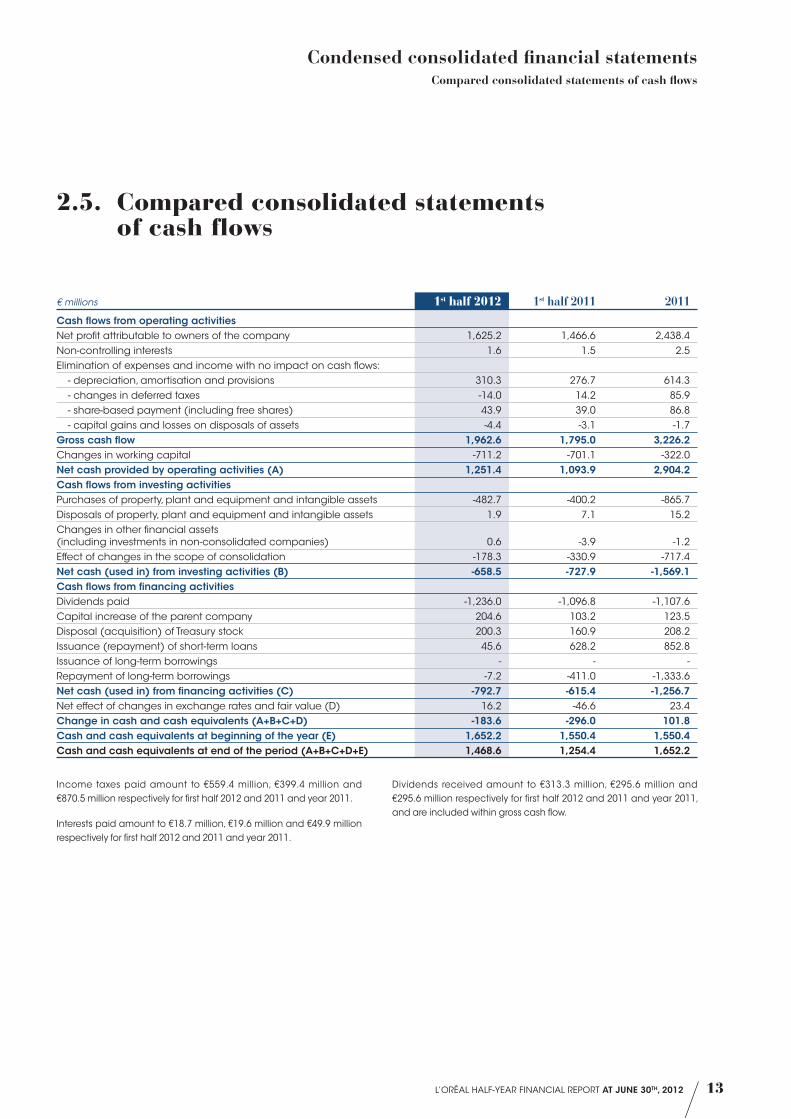
2.5. Compared consolidated statements of cash flows
€ millions 1st half 2012 1st half 2011 2011Cash flows from operating activities Net profit attributable to owners of the company 1,625.2 1,466.6 2,438.4 Non-controlling interests 1.6 1.5 2.5 Elimination of expenses and income with no impact on cash flows:
- depreciation, amortisation and provisions 310.3 276.7 614.3 - changes in deferred taxes -14.0 14.2 85.9 - share-based payment (including free shares) 43.9 39.0 86.8 - capital gains and losses on disposals of assets -4.4 -3.1 -1.7
Gross cash flow 1,962.6 1,795.0 3,226.2 Changes in working capital -711.2 -701.1 -322.0 Net cash provided by operating activities (A) 1,251.4 1,093.9 2,904.2 Cash flows from investing activities Purchases of property, plant and equipment and intangible assets -482.7 -400.2 -865.7 Disposals of property, plant and equipment and intangible assets 1.9 7.1 15.2 Changes in other financial assets (including investments in non-consolidated companies) 0.6 -3.9 -1.2 Effect of changes in the scope of consolidation -178.3 -330.9 -717.4 Net cash (used in) from investing activities (B) -658.5 -727.9 -1,569.1 Cash flows from financing activities Dividends paid -1,236.0 -1,096.8 -1,107.6 Capital increase of the parent company 204.6 103.2 123.5 Disposal (acquisition) of Treasury stock 200.3 160.9 208.2 Issuance (repayment) of short-term loans 45.6 628.2 852.8 Issuance of long-term borrowings - - -Repayment of long-term borrowings -7.2 -411.0 -1,333.6 Net cash (used in) from financing activities (C) -792.7 -615.4 -1,256.7 Net effect of changes in exchange rates and fair value (D) 16.2 -46.6 23.4 Change in cash and cash equivalents (A+B+C+D) -183.6 -296.0 101.8 Cash and cash equivalents at beginning of the year (E) 1,652.2 1,550.4 1,550.4 Cash and cash equivalents at end of the period (A+B+C+D+E) 1,468.6 1,254.4 1,652.2
Income taxes paid amount to €559.4 million, €399.4 million and €870.5 million respectively for first half 2012 and 2011 and year 2011.
Interests paid amount to €18.7 million, €19.6 million and €49.9 million respectively for first half 2012 and 2011 and year 2011.
Dividends received amount to €313.3 million, €295.6 million and €295.6 million respectively for first half 2012 and 2011 and year 2011, and are included within gross cash flow.
14 L’ORÉAL HALF-YEAR FINANCIAL REPORT AT JUNE 30TH, 2012
Condensed consolidated fi nancial statementsNotes to the condensed consolidated fi nancial statements
2.6. Notes to the condensed consolidated financial statements
NOTE 1 Accounting principles
The condensed half-year consolidated financial statements of L’Oréal and its subsidiaries (“the Group”) have been prepared in accordance with the international accounting standard IAS 34. As condensed financial statements, they do not include all the information required by IFRS for the preparation of the annual financial statements and must therefore be read in conjunction with the Group consolidated financial statements prepared in accordance with IFRS as adopted in the European Union for the year ending at December 31st, 2011.
The Board of Directors closed the condensed half-year consolidated financial statements as at June 30th, 2012 on August 28th, 2012.
The accounting policies applied are identical to those applied in the annual financial statements at December 31st, 2011, except for those relating to income tax.
The tax charge (current and deferred) is calculated for the half-year financial statements by applying to the profit for the period the estimated annual tax rate for the current tax year for each entity or tax group.
The Group has not applied any standards or interpretations whose application is not yet compulsory in 2012.
Standards or amendments to published standards effective January 1st, 2012 do not have any impact for the Group.
The Group will be concerned by the following new standards and amendments which are not yet applicable and two of which have not yet been adopted by the European Union:
♦ IFRS 9 “Financial instruments”;
♦ IFRS 11 “Joint arrangements”;
♦ IAS 19 revised “Employee benefits”, adopted by the European Union on June 5th, 2012 and applicable as from January 1st, 2013.
NOTE 2 Changes in the scope of consolidation
2.1. First half 2012On April 26th, 2012, L’Oréal announced the acquisition of 100% of Cadum the majority of which was held by investment fund Milestone.
In 2011, Cadum achieved consolidated sales of €58 million, €49 million of which in France, mainly with the brand Cadum. The acquisition has been fully consolidated since May 1st, 2012. Since the allocation of the acquisition cost to the acquiree’s identifiable assets and liabilities had not been completed at June 30th, 2012, the difference between the acquisition cost and the net equity acquired is shown as “goodwill” for its full amount (see note 8), i.e. €176.1 million.
The cost of this new acquisition amounts to approximately €170.5 million excluding net debt. The total amount of goodwill and other intangible assets resulting from this acquisition was provisionally estimated at €176.1 million.
The impact of that acquisition on net sales and profit for the half year amounts to €7.0 million and €0.3 million respectively.
L’Oréal plans on selling the assets and groups of assets relating to the IBA business within the next 12 months. These assets and groups of assets – which were acquired as part of this business combination – are booked as assets held for sale on a separate line in the consolidated balance sheet assets. (see note 16).
2.2. 2011On January 1st, 2011, Matrix Distribution GmbH, a wholly owned subsidiary of L’Oréal Deutschland GmbH, took over the cosmetic and scissors businesses of Germany-based company Arex GmbH.
Arex GmbH sells exclusive hairdressing brands and high quality scissors exclusively to hairdressers. Arex GmbH had sales of €7 million in 2010 and has been fully consolidated since January 1st, 2011
On December 13th, 2010, Galderma Holding AB, a wholly owned subsidiary of Galderma Pharma S.A., announced that it had launched a cash offer for Q-Med, a company listed on Nasdaq OMX Nordic in Stockholm.

15L’ORÉAL HALF-YEAR FINANCIAL REPORT AT JUNE 30TH, 2012
Condensed consolidated fi nancial statementsNotes to the condensed consolidated fi nancial statements
Created in 1987, Q-Med is a medical device company which develops, markets and sells high quality medical implants for aesthetic and medical use. The majority of its products are based on the company’s patented NASHA™ technology for the production of stabilized non-animal hyaluronic acid.
Among other products, its current product portfolio includes Restylane for smoothing out lines and improving facial contours, and the Macrolane injection for shaping the body.
Sales are made through the company’s own subsidiaries and distributors in over 70 countries. Q-Med has approximately 636 employees in 20 countries, including around 364 based at the company’s head office, R&D laboratories and production facility in Uppsala, Sweden.
In 2010, the company had total revenues of SEK1.5 billion and an operating profit of SEK287 million.
The acceptance period for the offer started on January 4th and ended on March 11th, 2011.
A price of SEK79.00 in cash was offered for each share, with the exception of shares owned by Q-Med founder Bengt Agerup, who sold his 47.5% stake at a price of SEK58.94 per share. An earn-out clause stipulates that the total price can under no circumstances exceed SEK74.96 per share.
On March 15th, 2011, Galderma declared the offer wholly unconditional and acquired 95,361,096 shares, representing 95.95% of the existing
issued share capital of Q-Med. Galderma decided to request compulsory acquisition of the remaining shares in Q-Med shares, which was obtained on November 15th, 2011.
Q-Med is proportionally consolidated as from March 1st, 2011.
On December 15th, 2011, L’Oréal announced the completed acquisition of Pacific Bioscience Laboratories Inc., the market leader in the rapidly growing area of sonic skin care devices. The move gives L’Oréal access to patented sonic skin care technology enabling the Company to acquire strategic positions in the booming skin care devices category.
Clarisonic® is sold mainly throughout the US and is also present in the UK, Australia, Mexico, Canada and the Far East. It is sold through a distribution network which includes dermatologists and cosmetic surgeons, spas, prestige retail, e-tail, television shopping and clarisonic.com. In full-year 2010, Clarisonic® delivered net sales of $105 million. It has been fully consolidated since December 15th, 2011.
The cost of these new acquisitions was €813.5 million. The total amount of goodwill and other intangible assets resulting from the acquisitions was provisionally estimated at €415.6 million and €320.8 million, respectively.
These acquisitions represent around €193 million in sales and €33 million in operating profit in 2011.
NOTE 3 Segment information
3.1. Segment informationThe Cosmetics branch is organised into four sectors, each operating with specific distribution channels:
♦ Professional Products Division: products used and sold in hair salons;
♦ Consumer Products Division: products sold in mass-market retail channels;
♦ L’Oréal Luxury Division: products sold in selective retail outlets, i.e. department stores, perfumeries, travel retail, the Group’s own boutiques and certain online sites;
♦ Active Cosmetics Division: products for “borderline” complexions (i.e. neither healthy nor problematic), sold through all health channels such as pharmacies, parapharmacies, drugstores and medispas.
The non-allocated item includes expenses incurred by the Functional Divisions, fundamental research and the costs of stock options and free shares not allocated to the Cosmetics Divisions. It also includes activities that are auxiliary to the Group’s core businesses, such as insurance, reinsurance and banking.
The “The Body Shop” branch: The Body Shop offers a wide range of naturally inspired cosmetics and toiletry products. The brand, originally created in the United Kingdom, distributes its products and expresses its values through a large multi-channel network of exclusive retail shops (in more than 60 countries), as well as through home and online sales. The Body Shop net sales and operating profit are characterised by strong seasonal fluctuations due to a high level of activity during the last few months of the year.
The Dermatology branch, consisting of Galderma, a joint venture between L’Oréal and Nestlé, meets the needs of dermatologists and their patients.
Data by branch and by Division are prepared using the same accounting principles as those used for the preparation of the consolidated financial statements.
The performance of each branch and Division is measured on the basis of operating profit.
16 L’ORÉAL HALF-YEAR FINANCIAL REPORT AT JUNE 30TH, 2012
Condensed consolidated fi nancial statementsNotes to the condensed consolidated fi nancial statements
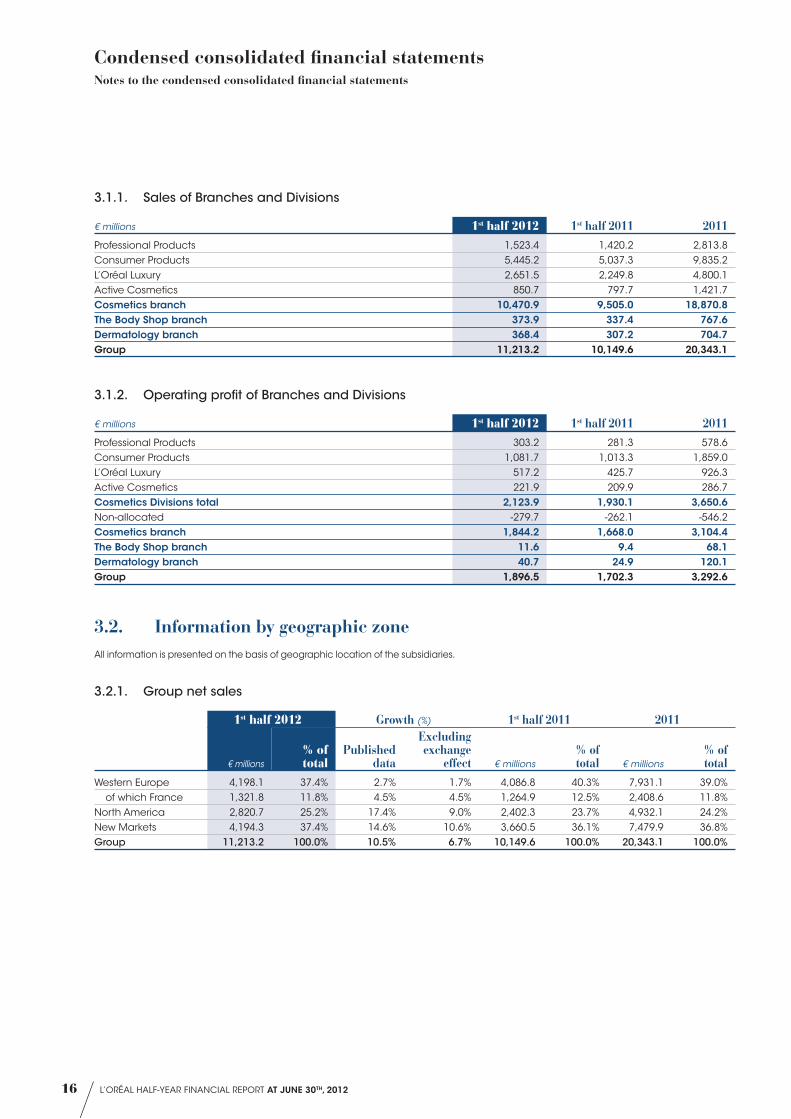
3.1.1. Sales of Branches and Divisions
€ millions 1st half 2012 1st half 2011 2011Professional Products 1,523.4 1,420.2 2,813.8 Consumer Products 5,445.2 5,037.3 9,835.2 L’Oréal Luxury 2,651.5 2,249.8 4,800.1 Active Cosmetics 850.7 797.7 1,421.7 Cosmetics branch 10,470.9 9,505.0 18,870.8The Body Shop branch 373.9 337.4 767.6 Dermatology branch 368.4 307.2 704.7 Group 11,213.2 10,149.6 20,343.1
3.1.2. Operating profit of Branches and Divisions
€ millions 1st half 2012 1st half 2011 2011Professional Products 303.2 281.3 578.6 Consumer Products 1,081.7 1,013.3 1,859.0 L’Oréal Luxury 517.2 425.7 926.3 Active Cosmetics 221.9 209.9 286.7 Cosmetics Divisions total 2,123.9 1,930.1 3,650.6 Non-allocated -279.7 -262.1 -546.2 Cosmetics branch 1,844.2 1,668.0 3,104.4 The Body Shop branch 11.6 9.4 68.1 Dermatology branch 40.7 24.9 120.1 Group 1,896.5 1,702.3 3,292.6
3.2. Information by geographic zoneAll information is presented on the basis of geographic location of the subsidiaries.
3.2.1. Group net sales
1st half 2012 Growth (%) 1st half 2011 2011
€ millions% of total
Published data
Excluding exchange
effect € millions% of total € millions
% of total
Western Europe 4,198.1 37.4% 2.7% 1.7% 4,086.8 40.3% 7,931.1 39.0%of which France 1,321.8 11.8% 4.5% 4.5% 1,264.9 12.5% 2,408.6 11.8%
North America 2,820.7 25.2% 17.4% 9.0% 2,402.3 23.7% 4,932.1 24.2%New Markets 4,194.3 37.4% 14.6% 10.6% 3,660.5 36.1% 7,479.9 36.8%Group 11,213.2 100.0% 10.5% 6.7% 10,149.6 100.0% 20,343.1 100.0%
17L’ORÉAL HALF-YEAR FINANCIAL REPORT AT JUNE 30TH, 2012
Condensed consolidated fi nancial statementsNotes to the condensed consolidated fi nancial statements
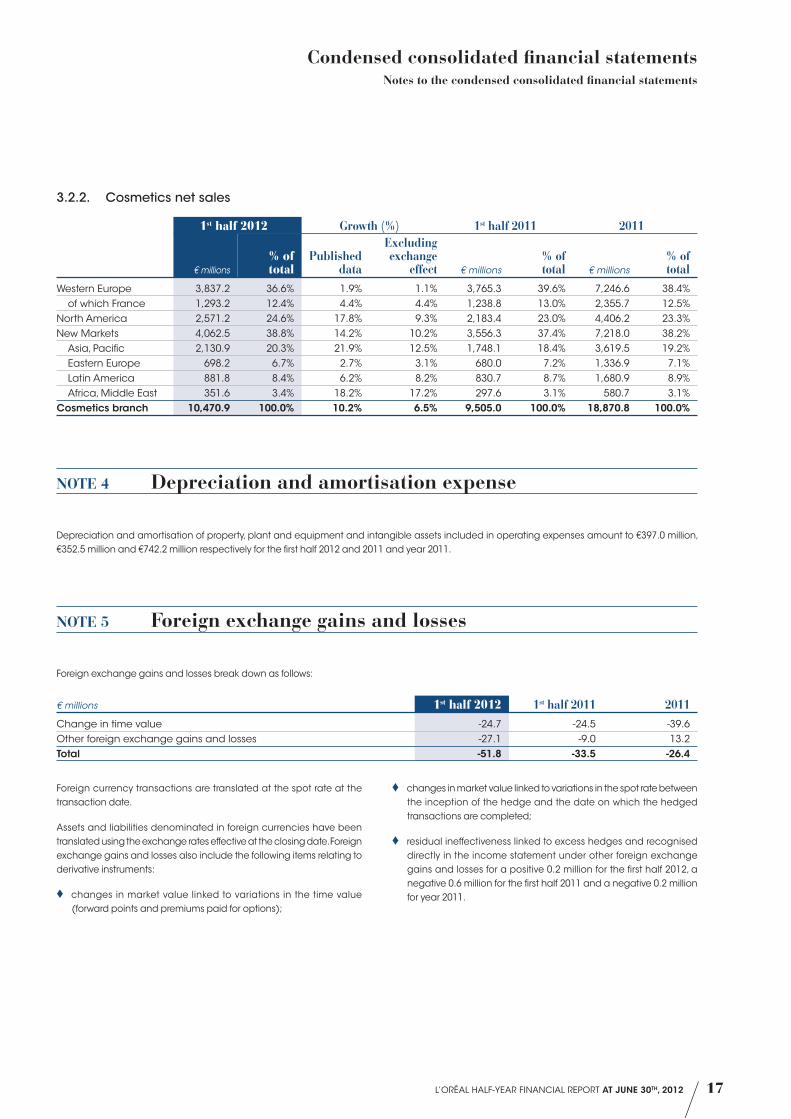
3.2.2. Cosmetics net sales
1st half 2012 Growth (%) 1st half 2011 2011
€ millions% of total
Published data
Excluding exchange
effect € millions% of total € millions
% of total
Western Europe 3,837.2 36.6% 1.9% 1.1% 3,765.3 39.6% 7,246.6 38.4%of which France 1,293.2 12.4% 4.4% 4.4% 1,238.8 13.0% 2,355.7 12.5%
North America 2,571.2 24.6% 17.8% 9.3% 2,183.4 23.0% 4,406.2 23.3%New Markets 4,062.5 38.8% 14.2% 10.2% 3,556.3 37.4% 7,218.0 38.2%
Asia, Pacific 2,130.9 20.3% 21.9% 12.5% 1,748.1 18.4% 3,619.5 19.2%Eastern Europe 698.2 6.7% 2.7% 3.1% 680.0 7.2% 1,336.9 7.1%Latin America 881.8 8.4% 6.2% 8.2% 830.7 8.7% 1,680.9 8.9%Africa, Middle East 351.6 3.4% 18.2% 17.2% 297.6 3.1% 580.7 3.1%
Cosmetics branch 10,470.9 100.0% 10.2% 6.5% 9,505.0 100.0% 18,870.8 100.0%
NOTE 4 Depreciation and amortisation expense
Depreciation and amortisation of property, plant and equipment and intangible assets included in operating expenses amount to €397.0 million, €352.5 million and €742.2 million respectively for the first half 2012 and 2011 and year 2011.
NOTE 5 Foreign exchange gains and losses
Foreign exchange gains and losses break down as follows:
€ millions 1st half 2012 1st half 2011 2011Change in time value -24.7 -24.5 -39.6Other foreign exchange gains and losses -27.1 -9.0 13.2Total -51.8 -33.5 -26.4
Foreign currency transactions are translated at the spot rate at the transaction date.
Assets and liabilities denominated in foreign currencies have been translated using the exchange rates effective at the closing date. Foreign exchange gains and losses also include the following items relating to derivative instruments:
♦ changes in market value linked to variations in the time value (forward points and premiums paid for options);
♦ changes in market value linked to variations in the spot rate between the inception of the hedge and the date on which the hedged transactions are completed;
♦ residual ineffectiveness linked to excess hedges and recognised directly in the income statement under other foreign exchange gains and losses for a positive 0.2 million for the first half 2012, a negative 0.6 million for the first half 2011 and a negative 0.2 million for year 2011.

18 L’ORÉAL HALF-YEAR FINANCIAL REPORT AT JUNE 30TH, 2012
Condensed consolidated fi nancial statementsNotes to the condensed consolidated fi nancial statements
These amounts are allocated to the appropriate operating expense items as follows:
€ millions 1st half 2012 1st half 2011 2011Cost of sales -45.6 -22.7 -15.2Research and development 3.9 -6.1 -8.0Advertising and promotion -6.6 -3.2 -2.1Selling, general and administrative expenses -3.5 -1.5 -1.1Foreign exchange gains and losses -51.8 -33.5 -26.4
NOTE 6 Other operational income and expenses
This item breaks down as follows:
€ millions 1st half 2012 1st half 2011 2011Capital gains and losses on disposals of property, plant and equipment and intangible assets 4.4 3.1 1.7Impairment of property, plant and equipment and intangible assets(1) - -39.7 -69.9Restructuring costs (2) -57.3 -34.2 -39.9Other(3) -2.7 8.3 11.8Total -55.6 -62.6 -96.3
(1) These impairment charges mainly relate to: ♦ in first-half 2011, the Softsheen Carson brand and goodwill for €21.6 million and €18.1 million, respectively; ♦ in 2011, the Softsheen Carson brand and goodwill for €32.8 million and €31.8 million respectively as well as Sanoflore goodwill for €5.3 million.
(2) Including: ♦ in first-half 2012, the specialisation of European factories for €13.2 million, sale force adjustment in Germany for €5.1 million and the reorganisation
of industrial operations within the Professional Products Division in the United States for €31.5 million; ♦ in first-half 2011, €31.0 million relating to the reorganisation of industrial operations in the United States; ♦ in 2011, the reorganisation of industrial operations in the United States for €34.6 million.
(3) In first-half 2012, acquisition related costs for €2.7 million.In first-half 2011, revision of risks relating to investigations carried out by competition authorities (see note 13.1) as well as costs relating to the acquisition of Q-Med.In 2011, the positive revision of risks relating to investigations carried out by competition authorities for €23 million (see note 13.1) as well as costs relating to the acquisition of Q-Med and Pacific Bioscience Laboratories Inc. for €9.6 million and revision of the earn out clause regarding Essie Cosmetics for €3.0 million.

19L’ORÉAL HALF-YEAR FINANCIAL REPORT AT JUNE 30TH, 2012
Condensed consolidated fi nancial statementsNotes to the condensed consolidated fi nancial statements
NOTE 7 Net profit attributable to owners of the company excluding non-recurring items – Earnings per share
7.1. Reconciliation with net profitNet profit attributable to owners of the company excluding non-recurring items reconciles as follows with net profit attributable to owners of the company:
€ millions 1st half 2012 1st half 2011 2011Net profit attributable to owners of the company 1,625.2 1,466.6 2,438.4Capital gains and losses on property, plant and equipment and intangible asset -4.4 -3.1 -1.7Impairment of property, plant and equipment and intangible assets - 39.7 69.9Restructuring costs 57.3 34.2 39.9Other 2.7 -8.3 -11.8Tax effect on non-recurring items -22.2 -22.7 -33.0Effect of changes in tax rates on the deferred tax liability arising on the remeasurement of Sanofi - - 62.0Tax effect on the acquisition of Pacific Bioscience Laboratories Inc. - - 19.2Net profit attributable to owners of the company excluding non-recurring items 1,658.6 1,506.4 2,582.9
7.2. Earnings per shareThe tables below set out earnings per share attributable to owners of the company:
1st half 2012
Net profit attributable to owners of the company
(€ millions) Number of shares
Earnings per share attributable of the company
(€)
Earnings per share 1,625.2 597,579,817 2.72Stock options - 4,792,358 Free shares - 1,012,720 Diluted earnings per share 1,625.2 603,384,895 2.69
1st half 2011
Net profit attributable to owners of the company
(€ millions) Number of shares
Earnings per share attributable to owners of the company
(€)
Earnings per share 1,466.6 591,277,366 2.48Stock options - 5,130,184 Free shares - 562,491 Diluted earnings per share 1,466.6 596,970,041 2.46
2011
Net profit attributable to owners of the company
(€ millions) Number of shares
Earnings per share attributable to owners of the company
(€)
Earnings per share 2,438.4 592,763,295 4.11Stock options - 4,247,654 Free shares - 622,154 Diluted earnings per share 2,438.4 597,633,103 4.08

20 L’ORÉAL HALF-YEAR FINANCIAL REPORT AT JUNE 30TH, 2012
Condensed consolidated fi nancial statementsNotes to the condensed consolidated fi nancial statements
7.3. Earnings per share excluding non-recurring itemsThe tables below set out in detail earnings per share attributable to owners of the company excluding non-recurring items:
1st half 2012
Net profit attributable to owners of the
company excluding non-recurring items
(€ millions) Number of shares
Earnings per share attributable to owners of
the company excluding non-recurring items
(€)
Earnings per share excluding non-recurring items 1,658.6 597,579,817 2.78Stock options - 4,792,358 Free shares - 1,012,720 Diluted earnings per share excluding non-recurring items 1,658.6 603,384,895 2.75
1st half 2011
Net profit attributable to owners of the
company excluding non-recurring items
(€ millions) Number of shares
Earnings per share attributable to owners of
the company excluding non-recurring items
(€)
Earnings per share excluding non-recurring items 1,506.4 591,277,366 2.55Stock options - 5,130,184 Free shares - 562,491 Diluted earnings per shareexcluding non-recurring items 1,506.4 596,970,041 2.52
2011
Net profit attributable to owners of the
company excluding non-recurring items
(€ millions) Number of shares
Earnings per share attributable to owners of
the company excluding non-recurring items
(€)
Earnings per share excluding non-recurring items 2,582.9 592,763,295 4.36Stock options 4,247,654 Free shares 622,154 Diluted earnings per share excluding non-recurring items 2,582.9 597,633,103 4.32
NOTE 8 Goodwill and other intangible assets
Impairment tests have been performed at June 30th, 2012 on the most sensitive Cash Generating Units. On this occasion, discount rates and cash flow forecasts were reviewed.
The €234.9 million increase in the “Goodwill” item results mainly from the acquisition of the period for €176.1 million and the positive variation in exchange rates for €54.7 million.
The full amount of the difference between the acquisition cost of Cadum and the net equity acquired has been provisionally allocated to the “Goodwill” line for €176.1 million pending final allocation to Cadum’s identifiable assets and liabilities.
No impairment of goodwill or other intangible assets was recognised in first-half 2012.
The €23.5 million increase in the “Other intangible assets” item results mainly from acquisitions in the period for €55.3 million and the positive variation in exchange rates representing €39.0 million, offset by the depreciation expense of the period.
21L’ORÉAL HALF-YEAR FINANCIAL REPORT AT JUNE 30TH, 2012
Condensed consolidated fi nancial statementsNotes to the condensed consolidated fi nancial statements
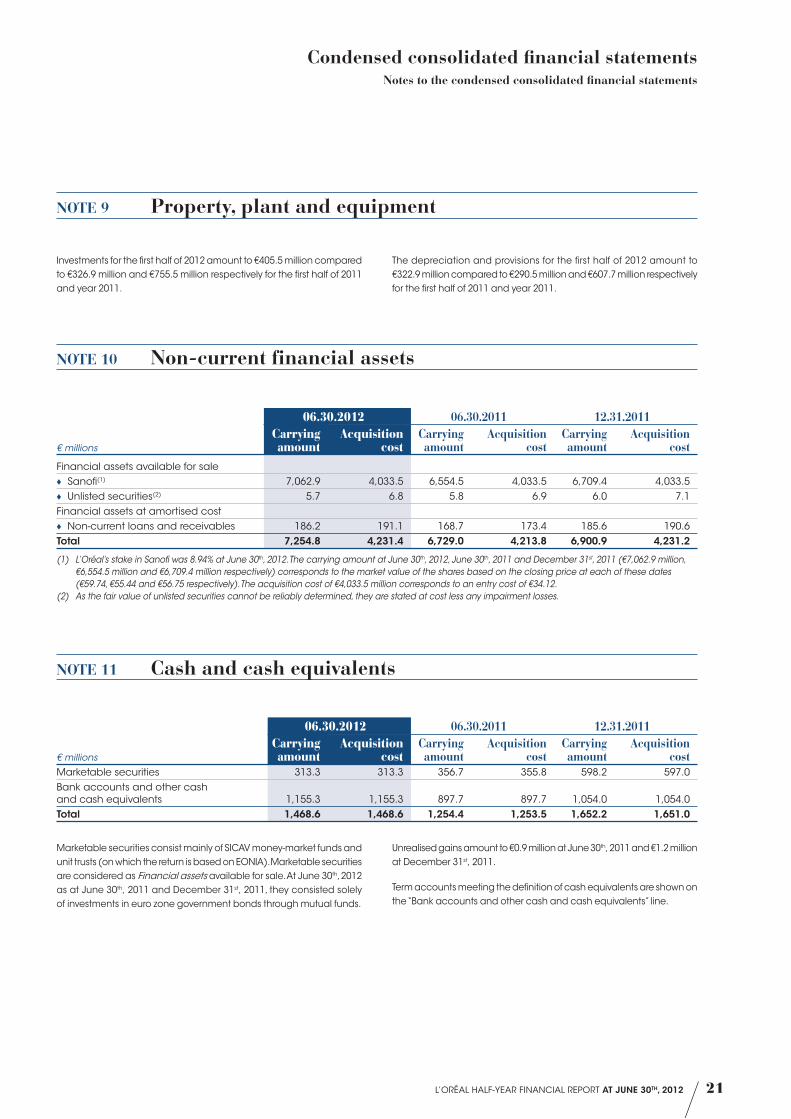
NOTE 9 Property, plant and equipment
Investments for the first half of 2012 amount to €405.5 million compared to €326.9 million and €755.5 million respectively for the first half of 2011 and year 2011.
The depreciation and provisions for the first half of 2012 amount to €322.9 million compared to €290.5 million and €607.7 million respectively for the first half of 2011 and year 2011.
NOTE 10 Non-current financial assets
€ millions
06.30.2012 06.30.2011 12.31.2011Carrying amount
Acquisition cost
Carrying amount
Acquisition cost
Carrying amount
Acquisition cost
Financial assets available for sale ♦ Sanofi(1) 7,062.9 4,033.5 6,554.5 4,033.5 6,709.4 4,033.5 ♦ Unlisted securities(2) 5.7 6.8 5.8 6.9 6.0 7.1
Financial assets at amortised cost ♦ Non-current loans and receivables 186.2 191.1 168.7 173.4 185.6 190.6
Total 7,254.8 4,231.4 6,729.0 4,213.8 6,900.9 4,231.2
(1) L’Oréal’s stake in Sanofi was 8.94% at June 30th, 2012. The carrying amount at June 30th, 2012, June 30th, 2011 and December 31 st , 2011 (€7,062.9 million, €6,554.5 million and €6,709.4 million respectively) corresponds to the market value of the shares based on the closing price at each of these dates (€59.74, €55.44 and €56.75 respectively). The acquisition cost of €4,033.5 million corresponds to an entry cost of €34.12.
(2) As the fair value of unlisted securities cannot be reliably determined, they are stated at cost less any impairment losses.
NOTE 11 Cash and cash equivalents
€ millions
06.30.2012 06.30.2011 12.31.2011Carrying amount
Acquisition cost
Carrying amount
Acquisition cost
Carrying amount
Acquisition cost
Marketable securities 313.3 313.3 356.7 355.8 598.2 597.0Bank accounts and other cash and cash equivalents 1,155.3 1,155.3 897.7 897.7 1,054.0 1,054.0Total 1,468.6 1,468.6 1,254.4 1,253.5 1,652.2 1,651.0
Marketable securities consist mainly of SICAV money-market funds and unit trusts (on which the return is based on EONIA). Marketable securities are considered as Financial assets available for sale. At June 30th, 2012 as at June 30th, 2011 and December 31st, 2011, they consisted solely of investments in euro zone government bonds through mutual funds.
Unrealised gains amount to €0.9 million at June 30th, 2011 and €1.2 million at December 31st, 2011.
Term accounts meeting the definition of cash equivalents are shown on the “Bank accounts and other cash and cash equivalents” line.

22 L’ORÉAL HALF-YEAR FINANCIAL REPORT AT JUNE 30TH, 2012
Condensed consolidated fi nancial statementsNotes to the condensed consolidated fi nancial statements
NOTE 12 Equity
12.1. Share capital and additional paid-in capital
Share capital consists of 606,014,666 shares with a par value of €0.20 at June 30th, 2012, compared with 602,654,532 shares at June 30th, 2011 and 602,984,082 shares at December 31st, 2011.
12.2. Treasury stockShares acquired under the shareholder-approved L’Oréal share buyback programme are deducted from consolidated equity. Capital gains or losses relating to these shares are also recorded in equity net of tax.
a) 1st half 2012
The change in the number of shares for the first half 2012 is as follows:
In shares Share capital Treasury stockCommon shares
outstandingAt 01.01.2012 602,984,082 -8,597,659 594,386,423Shares cancelled Options and free shares exercised 3,030,584 2,637,446 5,668,030Treasury stock purchased - At 06.30.2012 606,014,666 -5,960,213 600,054,453
The change in Treasury stock for the first half 2012 is as follows:
In sharesBuyback
programme
Allocated to stock options/free shares plans Total € millions
At 01.01.2012 - 8,597,659 8,597,659 644.4Shares cancelled Options and free shares exercised -2,637,446 -2,637,446 -198.6Treasury stock purchased - - -At 06.30.2012 - 5,960,213 5,960,213 445.8€ millions - 445.8 445.8
b) 2011
The change in the number of shares in 2011 was as follows:
In shares Share capital Treasury stockCommon shares
outstandingAt 01.01.2011 600,992,585 -11,336,682 589,655,903Shares cancelled -Options and free shares exercised 1,991,497 2,739,023 4,730,520Treasury stock purchased - At 12.31.2011 602,984,082 -8,597,659 594,386,423

23L’ORÉAL HALF-YEAR FINANCIAL REPORT AT JUNE 30TH, 2012
Condensed consolidated fi nancial statementsNotes to the condensed consolidated fi nancial statements
The change in Treasury stock in 2011 was as follows:
In sharesBuyback
programme
Allocated to stock options/free shares plans Total € millions
At 01.01.2011 - 11,336,682 11,336,682 850.9Shares cancelled Options and free shares exercised -2,739,023 -2,739,023 -206.5Treasury stock purchased - - -At 12.31.2011 - 8,597,659 8,597,659 644.4€ millions - 644.4 644.4
12.3. Free sharesOn April 17th, 2012 the Board of Directors decided to conditionally grant 1,325,050 free shares.
Vesting conditions
For the conditional grant of shares, the plan provides for a 4-year vesting period after which vesting is effective and final, subject to meeting the conditions of the plan. After this vesting period, a 2-year mandatory holding period applies for French residents, during which the shares cannot be sold.
The performance conditions concern:
♦ for 50% of shares granted, the increase in comparable Cosmetic revenues for the 2013, 2014 and 2015 fiscal years in relation to the growth in revenues for a panel of competitors;
♦ for 50% of shares granted, the increase over the same period in Group consolidated operating profit.
The calculation will be based on the arithmetic average of the performance in the 2013, 2014 and 2015 fiscal years and will use a predefined allocation scal based on the performance percentage achieved. No performance condition applies below a block of 200 shares.
Fair value of free shares granted
The fair value corresponds to the value of the share at the grant date, less dividends expected to be paid during the vesting period. The cost of the additional 2-year holding period applicable to French residents is determined based on the interest rate granted to the employee, considered equivalent to the rate which would be granted by a bank to a private individual customer with an average financial profile. The cost of the holding period amounts to 8.06% of the share value at the grant date.
On the basis of these assumptions, the fair values amount to €77.07 for French residents and to €84.62 for non-residents, compared to a share price of €93.68.
12.4. Actuarial gains and lossesThe sharp fall in the reference interest rates used to calculate the present value of the Group’s retirement obligations as from December 31st, 2011 led to a revaluation that increased the provisions for employee retirement obligations by an amount of €410.3 million and to the recognition of a corresponding deferred tax asset for €142.5 million, representing a net effect of €267.8 million on actuarial gains and losses.

24 L’ORÉAL HALF-YEAR FINANCIAL REPORT AT JUNE 30TH, 2012
Condensed consolidated fi nancial statementsNotes to the condensed consolidated fi nancial statements
NOTE 13 Provisions for liabilities and charges
13.1. Closing balances
€ millions 06.30.2012 06.30.2011 12.31.2011Non-current provisions for liabilities and charges 169.5 172.6 226.1Other non-current provisions(1) 169.5 172.6 226.1Current provisions for liabilities and charges 552.9 517.0 500.7Provisions for restructuring 133.4 97.9 93.6Provisions for product returns 240.5 208.5 219.2Other current provisions(1) (2) 179.0 210.6 187.9Total 722.4 689.6 726.8
(1) This item includes provisions for tax risks and litigation, industrial, environmental and commercial risks relating to operations (breach of contract), personnel-related costs and risks relating to investigations carried out by competition authorities.
(2) National competition authorities from several European countries have launched investigations focusing on the cosmetics industry.Notifications of complaints were sent to the Group’s subsidiaries in Germany, Spain, Italy, the Netherlands and Switzerland.In 2011, investigations that had been initiated and/or financial sanctions adopted against our subsidiaries in the Netherlands and Switzerland were abandoned. Spain received notification of a fine which it has provisioned and challenged on appeal. In Italy, the fine was paid to avoid any late-payment interest. The decision handed down on appeal in March 2012 reduced the fine by 25%. However, the proceedings are still in progress before the Conseil d’Etat (Italy’s Highest Administrative Court).In France on January 26th, 2012 the Paris Court of Appeal, to which the case was referred back following a decision by the Cour de Cassation (France’s highest civil court), upheld the decision of the French Competition Council of March 13th, 2006 resulting from its investigation of 13 suppliers and 3 distributors in the luxury perfumes and cosmetics industries between 1997 and 1999. The Appeal Court’s decision has been appealed against before the Cour de Cassation. The financial sanctions adopted against L’Oréal have already been provisioned and paid.Other requests for information have also been sent and investigations launched in Europe, although no notification of complaints had been received at June 30th, 2012.The provision amounts to €35.1 million at June 30th, 2012 and December 31st, 2011 and to €73.2 million at June 30th, 2011.
13.2. Changes in provisions for liabilities and charges during the period
€ millions 06.30.2011 12.31.2011 Charges(2)Reversals
(used)(2)Reversals
(not used)(2)
Impact of change in scope/Exchange
rate/Other(1) 06.30.2012
Provisions for restructuring 97.9 93.6 56.4 -18.4 -0.3 2.1 133.4Provisions for product returns 208.5 219.2 121.4 -90.0 -14.1 4.0 240.5Other provisions for liabilities and charges 383.2 414.0 80.3 -132.0 -14.4 0.6 348.5Total 689.6 726.8 258.1 -240.4 -28.8 6.7 722.4
(1) Mainly resulting from translation differences.(2) These figures can be analysed as follows:
€ millions ChargesReversals
(used)Reversals (not used)
♦ Other income and expenses 56.4 -18.4 -0.3 ♦ Operating profit 184.1 -152.3 -24.5 ♦ Financial (income)/expense 0.1 -0.1 - ♦ Income tax 17.5 -69.6 -4.0

25L’ORÉAL HALF-YEAR FINANCIAL REPORT AT JUNE 30TH, 2012
Condensed consolidated fi nancial statementsNotes to the condensed consolidated fi nancial statements
NOTE 14 Borrowings and debt
The Group uses bank loans for its medium-term financing needs and commercial paper issues in France and in the US for its short-term financing needs. None of these loans contain an early repayment clause linked to financial ratios (covenants).
14.1. Debt by type
€ millions
06.30.2012 06.30.2011 12.31.2011Non-
current CurrentNon-
current CurrentNon-
current CurrentShort-term paper - 799.6 - 524.4 - 795.7MLT bank loans - - 101.2 813.0 - -Debt on capital lease contracts 45.6 10.9 50.0 9.4 47.5 11.6Overdrafts - 32.9 - 35.5 - 10.3Other borrowings and debt 8.5 336.8 12.6 234.5 10.0 273.2Total 54.1 1,180.2 163.8 1,616.7 57.5 1,090.8
14.2. Debt by maturity date
€ millions 06.30.2012 06.30.2011 12.31.2011Under 1 year (1) 1,180.2 1,616.7 1,090.81 to 5 years 31.9 142.0 36.1Over 5 years 22.2 21.8 21.4Total 1,234.3 1,780.5 1,148.3
(1) The Group had confirmed undrawn credit lines for €2,589.4 million at June 30th, 2012.These lines were not subject to any covenants.
14.3. Debt by currency (after allowing for currency hedging instruments)
€ millions 06.30.2012 06.30.2011 12.31.2011US dollar (USD) 503.0 203.9 480.1Swiss Franc (CHF) 326.1 80.7 5.1Canadian dollar (CAD) 93.7 70.6 37.9Rouble (RUB) 61.8 98.6 14.6Yen (JPY) 52.1 52.0 45.0Brazilian Real (BRL) 45.2 39.5 55.6Swedish Krona (SEK) 3.4 371.4 344.4Euro (EUR) - 624.0 -Other 149.0 239.8 165.6Total 1,234.3 1,780.5 1,148.3
26 L’ORÉAL HALF-YEAR FINANCIAL REPORT AT JUNE 30TH, 2012
Condensed consolidated fi nancial statementsNotes to the condensed consolidated fi nancial statements
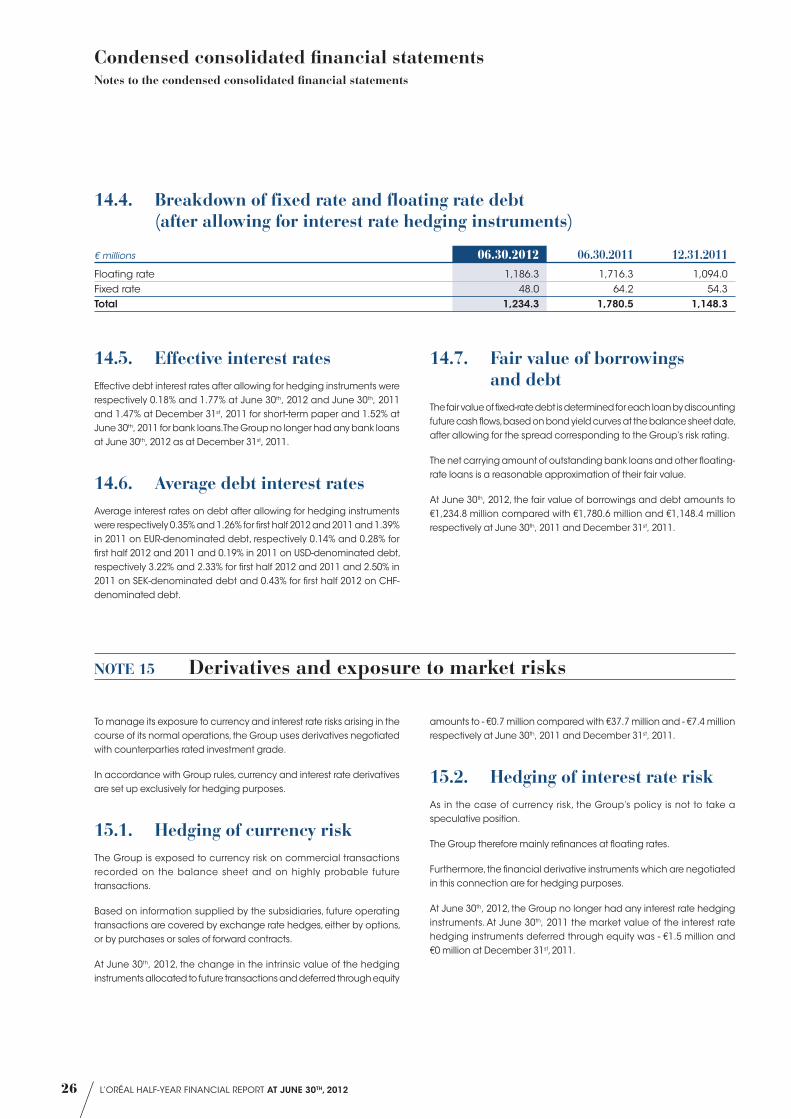
14.4. Breakdown of fixed rate and floating rate debt (after allowing for interest rate hedging instruments)
€ millions 06.30.2012 06.30.2011 12.31.2011Floating rate 1,186.3 1,716.3 1,094.0Fixed rate 48.0 64.2 54.3Total 1,234.3 1,780.5 1,148.3
14.5. Effective interest ratesEffective debt interest rates after allowing for hedging instruments were respectively 0.18% and 1.77% at June 30th, 2012 and June 30th, 2011 and 1.47% at December 31st, 2011 for short-term paper and 1.52% at June 30th, 2011 for bank loans. The Group no longer had any bank loans at June 30th, 2012 as at December 31st, 2011.
14.6. Average debt interest ratesAverage interest rates on debt after allowing for hedging instruments were respectively 0.35% and 1.26% for first half 2012 and 2011 and 1.39% in 2011 on EUR-denominated debt, respectively 0.14% and 0.28% for first half 2012 and 2011 and 0.19% in 2011 on USD-denominated debt, respectively 3.22% and 2.33% for first half 2012 and 2011 and 2.50% in 2011 on SEK-denominated debt and 0.43% for first half 2012 on CHF-denominated debt.
14.7. Fair value of borrowings and debt
The fair value of fixed-rate debt is determined for each loan by discounting future cash flows, based on bond yield curves at the balance sheet date, after allowing for the spread corresponding to the Group’s risk rating.
The net carrying amount of outstanding bank loans and other floating-rate loans is a reasonable approximation of their fair value.
At June 30th, 2012, the fair value of borrowings and debt amounts to €1,234.8 million compared with €1,780.6 million and €1,148.4 million respectively at June 30th, 2011 and December 31st, 2011.
NOTE 15 Derivatives and exposure to market risks
To manage its exposure to currency and interest rate risks arising in the course of its normal operations, the Group uses derivatives negotiated with counterparties rated investment grade.
In accordance with Group rules, currency and interest rate derivatives are set up exclusively for hedging purposes.
15.1. Hedging of currency riskThe Group is exposed to currency risk on commercial transactions recorded on the balance sheet and on highly probable future transactions.
Based on information supplied by the subsidiaries, future operating transactions are covered by exchange rate hedges, either by options, or by purchases or sales of forward contracts.
At June 30th, 2012, the change in the intrinsic value of the hedging instruments allocated to future transactions and deferred through equity
amounts to - €0.7 million compared with €37.7 million and - €7.4 million respectively at June 30th, 2011 and December 31st, 2011.
15.2. Hedging of interest rate riskAs in the case of currency risk, the Group’s policy is not to take a speculative position.
The Group therefore mainly refinances at floating rates.
Furthermore, the financial derivative instruments which are negotiated in this connection are for hedging purposes.
At June 30th, 2012, the Group no longer had any interest rate hedging instruments. At June 30th, 2011 the market value of the interest rate hedging instruments deferred through equity was - €1.5 million and €0 million at December 31st, 2011.

27L’ORÉAL HALF-YEAR FINANCIAL REPORT AT JUNE 30TH, 2012
Condensed consolidated fi nancial statementsNotes to the condensed consolidated fi nancial statements
15.3. Shareholding riskNo cash has been invested in shares.
Available cash is invested with top-ranking financial institutions in the form of non-speculative instruments which can be drawn in very short periods. At June 30th, 2012, cash was invested exclusively in E uro-zone government bonds through mutual funds.
At June 30th, 2012, the Group holds 118,227,307 Sanofi shares for an amount of €7,062.9 million (see note 10). A change of plus or minus 10% in the market price of these shares relative to the market price of €59.74 on June 30th, 2012 would have an impact of plus or minus €706.3 million before tax on Group equity.
If the share price were to fall significantly below €34.12 (the initial cost of the Sanofi shares), or fall below that price for a prolonged length of time, L’Oréal may have to recognise an impairment loss on its asset through profit or loss.
NOTE 16 Subsequent events
On July 13th, 2012, L’Oréal announced that it has completed the sale of the home care business from the Cadum Group to Eau Ecarlate SAS.
This business, which includes the brands Croc’Odor (odor neutralizers), Iba (air-fresheners), Zensect (moth-repellents) and Dr. Optic (optical lens cleaners), achieved a turnover of €17 million in 2011, two thirds of which in France.

28 L’ORÉAL HALF-YEAR FINANCIAL REPORT AT JUNE 30TH, 2012
(Six months ended June 30th, 2012)
This is a free translation into English of the Statutory Auditors’ review Report issued in French and is provided solely for the convenience of English speaking readers. This report should be read in conjunction with, and construed in accordance with, French law and professional auditing standards applicable in France.
In compliance with the assignment entrusted to us by your Shareholders’ Annual General Meeting and in accordance with the requirements of Article L. 451-1-2 III of the French Monetary and Financial Code (“Code monétaire et financier”), we hereby report to you on:
♦ the review of the accompanying condensed half-year consolidated financial statements of L’Oréal, for the six months ended June 30th, 2012;
♦ the verification of the information contained in the half-year Management Report.
These condensed half-year consolidated financial statements are the responsibility of the Board of Directors. Our role is to express a conclusion on these financial statements based on our review.
I. Conclusion on the financial statementsWe conducted our review in accordance with professional standards applicable in France. A review of half-year financial information consists of making inquiries, primarily of persons responsible for financial and accounting matters, and applying analytical and other review procedures. A review is substantially less in scope than an audit conducted in accordance with professional standards applicable in France and consequently does not enable us to obtain assurance that we would become aware of all significant matters that might be identified in an audit. Accordingly, we do not express an audit opinion.
Based on our review, nothing has come to our attention that causes us to believe that the accompanying condensed half-year consolidated financial statements are not prepared, in all material respects, in accordance with IAS 34 – standard of the IFRSs as adopted by the European Union applicable to interim financial information.
II. Specific verificationWe have also verified the information given in the half-year Management Report on the condensed half-year consolidated financial statements subject to our review.
We have no matters to report as to its fair presentation and consistency with the condensed half-year consolidated financial statements.
Neuilly-sur-Seine, August 28th, 2012The Statutory Auditors
French original signed by
PricewaterhouseCoopers AuditGérard Morin
Deloitte & AssociésDavid Dupont-Noel
3Statutory Auditors’ review Report on the 2012 Half-year financial information

29L’ORÉAL HALF-YEAR FINANCIAL REPORT AT JUNE 30TH, 2012
I declare that, to the best of my knowledge, the summary consolidated financial statements for the ending semester have been prepared in accordance with applicable accounting standards and give a true and fair view of the assets and liabilities, financial position and profit or loss of the Company and all the other companies included in the scope of consolidation, and that this half-year Activity Report includes a fair review of the important events which occurred during the first six months of the year, their impact on the half-year financial statements, and the main transactions between related parties, together with a description of the principal risks and uncertainties that they face in the remaining six months of the year.
Clichy, August 28th, 2012
On the authority of the Chairman and Chief Executive Officer,
Christian Mulliez,
Executive Vice-President, Administration and Finance
4Declaration by the person responsible for the Half-year Financial Report

Incorporated in Franceas a “Société Anonyme”with registered capitalof €120 596 816,40632 012 100 RCS Paris
Headquarters:41, rue Martre92117 Clichy CedexTel.: +33 1 47 56 70 00Fax: +33 1 47 56 86 42
Registered Office:14, rue Royale75008 Paris
www.loreal-finance.com