Embed Size (px)
Citation preview
© Thomson Reuters 2012. All rights reserved.
2012 LIPPER’S QUICK GUIDE TO OE FUND EXPENSES

© Thomson Reuters 2012. All Rights Reserved. This report is for informational purposes only, and does
not constitute investment advice or an offer to sell or the solicitation of an offer to buy any security of any
entity in any jurisdiction. No guarantee is made that the information in this report is accurate or complete
and no warranties are made with regard to the results to be obtained from its use. In addition, Lipper will
not be liable for any loss or damage resulting from information obtained from Lipper or any of its affiliates.
For immediate assistance, feel free to contact Lipper Client Services toll-free at 877.955.4773 or via email at
[email protected]. For more information about Lipper, please visit our website at
www.lipperweb.com.

2012 LIPPER’S QUICK GUIDE TO OE FUND EXPENSES
JUNE 2012
1
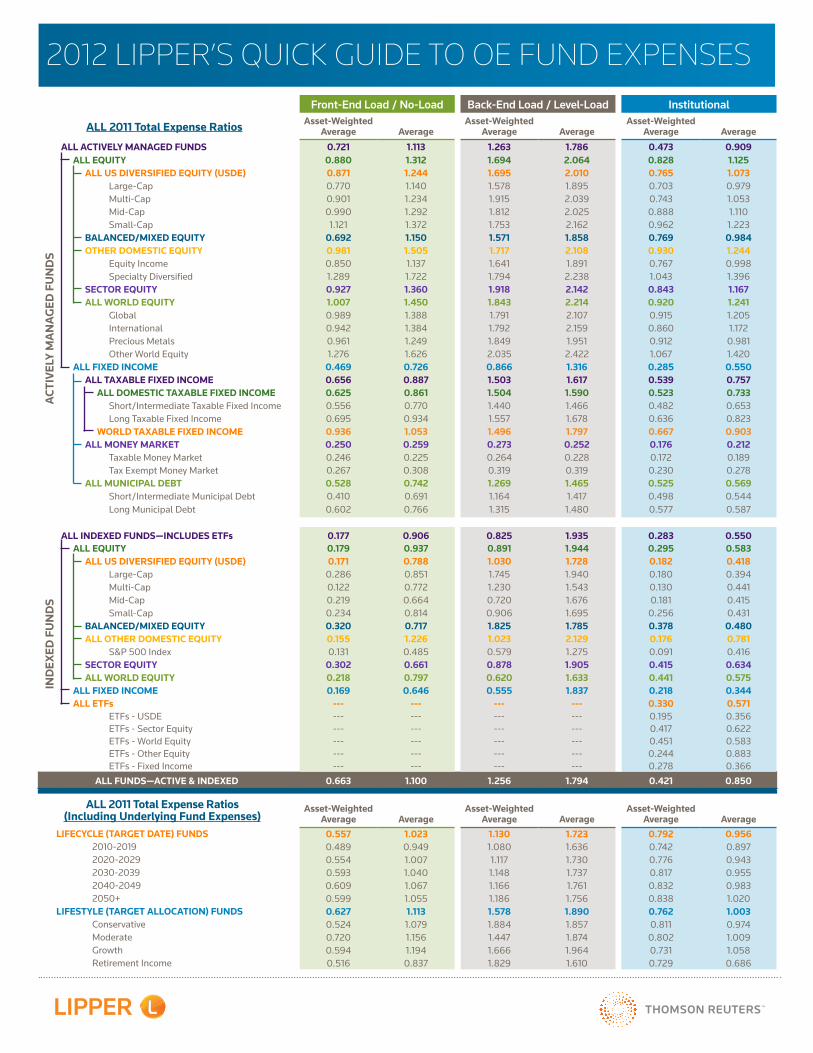
Each year, Lipper produces the “Lipper Quick Guide to OE Fund Expenses”. The report for open-end (OE) funds consists of a single table displaying the asset-weighted average and average total expense ratios by load type (front-end load/no-load, back-end load/level-load, and institutional), fund type (actively managed funds, index funds, exchange-traded funds, and funds of funds), and Lipper classifications/objectives1. The table provides a quick reference to total expense ratios and enables the reader to compare them between different groupings.
INTRODUCTION
1For more information on Lipper classifications/objectives, please go to www.lipperweb.com
Please note that the views expressed in this document are intended as nonconsultative and do not constitute
legal advice.
AUTHORED BY:PETER DE SOUSA BARROTEFIDUCIARY SERVICES SPECIALISTFIDUCIARY SERVICES, [email protected]
2
2012 LIPPER’S QUICK GUIDE TO OE FUND EXPENSES JUNE 2012
OVERALLOverall total expense ratios on average for (active and passive) open-end funds have decreased 3.4 basis points (bps) from 2010 to 2011. While actively managed funds have on average a total expense ratio reduction of 3.1 bps, index funds and exchange-traded funds together have declined 3.5 bps. Both equity and fixed income funds, within the actively managed fund grouping, have also dropped their average total expense ratios by 3.9 bps and 3.1 bps, respectively.
ALL GROUPSTwo patterns concerning total expense ratios are consistent across Lipper classifications/objectives and fund types. The first demonstrates that asset-weighted average total expense ratios tend to be lower than average total expense ratios. While the average total expense ratio computes the simple average for a set of funds, the asset-weighted average is computed differently and assigns an asset weight based on the average net assets of a fund. Higher weights are assigned to the expenses of the larger funds. For each fund, the expense ratio is multiplied by this weight and, subsequently, its asset-weighted total is summed to obtain the asset-weighted average for a set of funds. For example, large-cap institutional funds have an average total expense ratio of 0.979%, compared to an asset-weighted average ratio of 0.703%. Based on the different calculation methods, the variation between these two averages stems from economies of scale. Typically, as a fund grows in asset size, greater operational efficiencies may be achieved. However, economies of scale do not continue indefinitely; at a certain asset level economies of scale decrease at an increasing rate. At some point, large complexes may even experience scale diseconomies, whereby larger funds cost more to run. Weighting the expense ratio by the assets of the portfolio tends to equalize the discrepancy between small funds with higher expenses and larger funds, which can charge lower expenses.
FINDINGS
METHODOLOGYThe 2012 Lipper Quick Guide to OE Fund Expenses contains expense ratios for open-end funds with fiscal year-ends in 2011 and at least six months of operating expense data. Because Lipper only reports on audited fiscal expense data derived from each fund’s annual report (publicly available two months after the fiscal year end for each fund), actual reported fund expenses may appear sluggish in reacting to market conditions.
3
2012 LIPPER’S QUICK GUIDE TO OE FUND EXPENSES JUNE 2012
The second finding concerns load types. Institutional funds tend to have lower total expense ratios compared to front-end/no-load funds, while back-end/level-load funds typically have the highest average and asset-weighted average total expense ratios. For example, institutional long municipal debt funds’ average total expense ratio is 0.587%, compared to 0.766% for front-end load/no-load funds. Back-end load/level-load long municipal debt funds’ average total expense ratio is higher still at 1.480%. The expense differences between funds of different load types can be partly attributed to 12b-1 and non-12b-1 service fees incurred based on the method and type of distribution of the funds. Additionally, institutional funds may only be available to specific investors and, therefore, incur fewer advertising costs than their retail counterparts.
FUND TYPES—INDEX FUNDS AND EXCHANGE-TRADED FUNDSThis table displays several interesting findings across fund types. Index funds and exchange-traded funds (ETFs) are less expensive than actively managed open-end funds. For example, US diversified equity (USDE) institutional index funds and USDE ETFs have asset-weighted average total expense ratios of 0.162% and 0.195%, respectively, versus actively managed USDE institutional funds with expense ratios of 0.765%. This difference is mostly due to operating structure. Index funds and ETFs are designed to track an index; therefore, their management costs are lower than actively managed open-end mutual funds.
While not true in all cases, the impact of weighting total expense ratios by asset level generally produces significant variations in numbers for index funds due to the economies of scale. Often, nonmanagement expenses, such as transfer agent and custodian, more heavily drive economies of scale and, in the case of index funds, these nonmanagement expense components make up a significant portion of the total expense ratio, as management fees are already at a minimum due to the passive management style of index funds. Therefore, weighting the expense ratio by assets impacts index funds’ total expense ratio more than actively managed funds. For example, when considering actively managed front-end load/no-load sector equity funds, the asset-weighted average is 68% less than the average total expense ratio, compared to approximately 36% less for front-end load/no-load sector index funds.
FUNDS OF FUNDSThe asset-weighted average and average total expense ratios for funds of funds are difficult to compare to non-funds of funds due to differing expense structures. The fund of funds total expense ratios (displayed as lifecycle funds and lifestyle funds in the last lines of the table) contain expenses known as underlying fund expenses. Underlying fund expenses are incurred from a fund’s investments in its underlying funds. Comparing the total expense ratios for funds of funds and non-funds of funds entails comparing expenses containing different components. However, mixed-asset non-funds of funds do have similar average and asset-weighted average total expense ratios to lifestyle and lifecycle funds of funds. This is most likely because, despite the different expense components, they invest in a similar mix of equity and fixed income investments.
4
2012 LIPPER’S QUICK GUIDE TO OE FUND EXPENSES JUNE 2012
ACTIVELY MANAGED FUNDSAverage and asset-weighted average total expense ratios for actively managed funds vary by Lipper classification/objective. Equity funds are divided into five group categories: US diversified equity, balanced/mixed equity, other domestic equity, sector equity, and all world equity. These groups are further split into smaller subgroups. Across load types, other domestic equity, sector equity, and all world equity groups have the highest average and asset-weighted average total expense ratios. Within equity funds, the groupings are not consistently more expensive than one another; however, equity funds are more expensive than fixed income funds. The asset-weighted average for front-end and no-load equity funds is 0.880%, while the asset-weighted average for front-end/no-load fixed income funds is 0.469%.
Fixed income funds are divided into three group categories: taxable fixed income, money market, and municipal debt. Across all three load types, money market funds have the lowest average and asset-weighted average total expense ratios, ranging from 0.176% to 0.273%. The taxable fixed income group has the highest average and asset-weighted average total expense ratios across the three groupings of funds.
5
2012 LIPPER’S QUICK GUIDE TO OE FUND EXPENSES JUNE 2012
The 2012 Lipper Quick Guide to OE Fund Expenses shows that expense differences exist across load types, fund types, and Lipper classifications/objectives. Though the actual expense amounts for funds have changed from year to year, the general trends discussed in this paper have held true over parallel spans of time; this indicates that while actual expenses have changed, the trends surrounding them have not.
CONCLUSION
2012 LIPPER’S QUICK GUIDE TO OE FUND EXPENSESFront-End Load / No-Load Back-End Load / Level-Load Institutional
ALL 2011 Total Expense Ratios Asset-Weighted Average Average
Asset-Weighted Average Average
Asset-Weighted Average Average
ACT
IVEL
Y M
AN
AG
ED F
UN
DS
ALL ACTIVELY MANAGED FUNDS 0.721 1.113 1.263 1.786 0.473 0.909ALL EQUITY 0.880 1.312 1.694 2.064 0.828 1.125
ALL US DIVERSIFIED EQUITY (USDE) 0.871 1.244 1.695 2.010 0.765 1.073Large-Cap 0.770 1.140 1.578 1.895 0.703 0.979Multi-Cap 0.901 1.234 1.915 2.039 0.743 1.053Mid-Cap 0.990 1.292 1.812 2.025 0.888 1.110Small-Cap 1.121 1.372 1.753 2.162 0.962 1.223
BALANCED/MIXED EQUITY 0.692 1.150 1.571 1.858 0.769 0.984OTHER DOMESTIC EQUITY 0.981 1.505 1.717 2.108 0.930 1.244
Equity Income 0.850 1.137 1.641 1.891 0.767 0.998Specialty Diversified 1.289 1.722 1.794 2.238 1.043 1.396
SECTOR EQUITY 0.927 1.360 1.918 2.142 0.843 1.167ALL WORLD EQUITY 1.007 1.450 1.843 2.214 0.920 1.241
Global 0.989 1.388 1.791 2.107 0.915 1.205International 0.942 1.384 1.792 2.159 0.860 1.172Precious Metals 0.961 1.249 1.849 1.951 0.912 0.981Other World Equity 1.276 1.626 2.035 2.422 1.067 1.420
ALL FIXED INCOME 0.469 0.726 0.866 1.316 0.285 0.550ALL TAXABLE FIXED INCOME 0.656 0.887 1.503 1.617 0.539 0.757
ALL DOMESTIC TAXABLE FIXED INCOME 0.625 0.861 1.504 1.590 0.523 0.733Short/Intermediate Taxable Fixed Income 0.556 0.770 1.440 1.466 0.482 0.653Long Taxable Fixed Income 0.695 0.934 1.557 1.678 0.636 0.823
WORLD TAXABLE FIXED INCOME 0.936 1.053 1.496 1.797 0.667 0.903ALL MONEY MARKET 0.250 0.259 0.273 0.252 0.176 0.212
Taxable Money Market 0.246 0.225 0.264 0.228 0.172 0.189Tax Exempt Money Market 0.267 0.308 0.319 0.319 0.230 0.278
ALL MUNICIPAL DEBT 0.528 0.742 1.269 1.465 0.525 0.569Short/Intermediate Municipal Debt 0.410 0.691 1.164 1.417 0.498 0.544Long Municipal Debt 0.602 0.766 1.315 1.480 0.577 0.587
IND
EXED
FU
ND
S
ALL INDEXED FUNDS—INCLUDES ETFs 0.177 0.906 0.825 1.935 0.283 0.550ALL EQUITY 0.179 0.937 0.891 1.944 0.295 0.583
ALL US DIVERSIFIED EQUITY (USDE) 0.171 0.788 1.030 1.728 0.182 0.418Large-Cap 0.286 0.851 1.745 1.940 0.180 0.394Multi-Cap 0.122 0.772 1.230 1.543 0.130 0.441Mid-Cap 0.219 0.664 0.720 1.676 0.181 0.415Small-Cap 0.234 0.814 0.906 1.695 0.256 0.431
BALANCED/MIXED EQUITY 0.320 0.717 1.825 1.785 0.378 0.480ALL OTHER DOMESTIC EQUITY 0.155 1.226 1.023 2.129 0.176 0.781
S&P 500 Index 0.131 0.485 0.579 1.275 0.091 0.416SECTOR EQUITY 0.302 0.661 0.878 1.905 0.415 0.634ALL WORLD EQUITY 0.218 0.797 0.620 1.633 0.441 0.575
ALL FIXED INCOME 0.169 0.646 0.555 1.837 0.218 0.344ALL ETFs --- --- --- --- 0.330 0.571
ETFs - USDE --- --- --- --- 0.195 0.356ETFs - Sector Equity --- --- --- --- 0.417 0.622ETFs - World Equity --- --- --- --- 0.451 0.583ETFs - Other Equity --- --- --- --- 0.244 0.883ETFs - Fixed Income --- --- --- --- 0.278 0.366
ALL FUNDS—ACTIVE & INDEXED 0.663 1.100 1.256 1.794 0.421 0.850
ALL 2011 Total Expense Ratios (Including Underlying Fund Expenses)
Asset-Weighted Average Average
Asset-Weighted Average Average
Asset-Weighted Average Average
LIFECYCLE (TARGET DATE) FUNDS 0.557 1.023 1.130 1.723 0.792 0.9562010-2019 0.489 0.949 1.080 1.636 0.742 0.8972020-2029 0.554 1.007 1.117 1.730 0.776 0.9432030-2039 0.593 1.040 1.148 1.737 0.817 0.9552040-2049 0.609 1.067 1.166 1.761 0.832 0.9832050+ 0.599 1.055 1.186 1.756 0.838 1.020
LIFESTYLE (TARGET ALLOCATION) FUNDS 0.627 1.113 1.578 1.890 0.762 1.003Conservative 0.524 1.079 1.884 1.857 0.811 0.974Moderate 0.720 1.156 1.447 1.874 0.802 1.009Growth 0.594 1.194 1.666 1.964 0.731 1.058Retirement Income 0.516 0.837 1.829 1.610 0.729 0.686
LIPPER’S QUICK GUIDE TO OE FUND EXPENSES 2012
© Thomson Reuters 2012. All Rights Reserved. This report is for informational purposes only, and does not constitute investment advice or an offer to sell or the solicitation of an offer to buy any security of any entity in any jurisdiction. No guarantee is made that the information in this report is accurate or complete and no warranties are made with regard to the results to be obtained from its use. In addition, Lipper will not be liable for any loss or damage resulting from information obtained from Lipper or any of its affiliates.
Please see www.lipperweb.com for further information regarding Lipper calculation methodologies and Lipper fund classifications. For immediate assistance, feel free to contact Lipper Client Services toll-free at 877.955.4773 or via email at [email protected].
For institutional use only.
Asset-weighted averages represent the total expenses of each fund in the asset-class weighted by the average net assets of each fund. More weight is assigned to the expenses of the larger funds. It is intended to represent the expense ratio that is charged to the average dollar invested in the asset class. The simple average represents the average expenses of all funds in the asset-class. Under this calculation, each fund is assigned equal weight and the value reflects the average expense ratio that is charged by the average fund in the asset class. All funds that invest primarily in other investment companies (funds of funds) have been excluded from the data with the exception of the Lifecycle and Lifestyle funds. Total expense ratios for these funds include any estimated underlying fund expenses from each fund of fund’s most recent prospectus.