Embed Size (px)
Citation preview
MARKET COMMENTARY JANUARY 2013
Global equities rallied 13.4% in price in 2012, with the S&P 500 performing in line with the global average. China was the worst performing major market for the second consecutive year, advancing only 3.2%, while Germany surprisingly was the best performer at 29%. The European region as a whole rose 15.5%, with all of the advance taking place in the second half of the year after Mario Draghi’s promise that the ECB would do “whatever it takes” to preserve the Euro Zone. The U.S. market was almost the mirror image of Europe. The entire return for the year occurred in the first calendar quarter of 2012. Throughout the rest of the year the market proved resilient but see-sawed back and forth in response to macro concerns over the presidential election, a slowing global economy, the European crisis and recession, a hard landing in China, and the U.S. fiscal cliff.
The Great Monetary Expansion
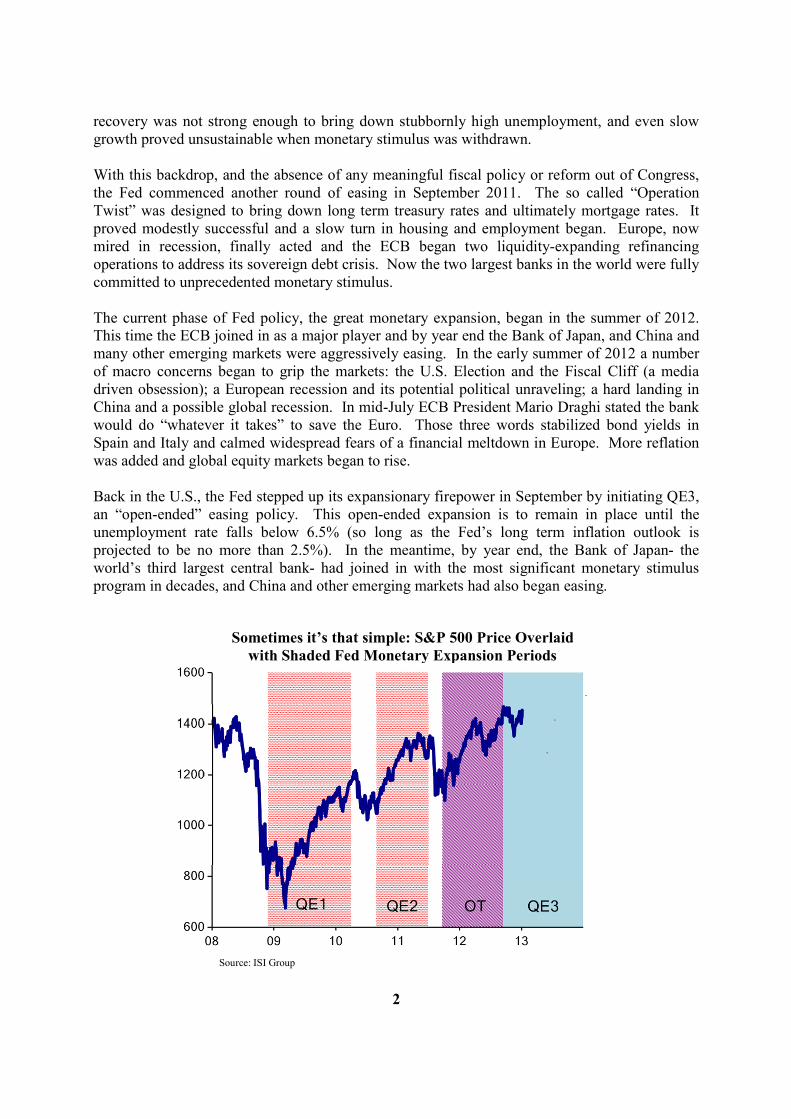
Expansionary monetary policy has been the most important catalyst for market stabilization and rising asset prices over the past few years. It began in the U.S. in November 2008 when, in response to the financial crisis, the Fed announced the first quantitative easing (QE1). Deflation was brought under control, the financial system stabilized, and ultimately equity prices and other assets responded. The U.S. economic recovery, however, proved tenuous and as 2010 unfolded Europe became a major concern. Fear crept back into the markets, deflation returned, driven this time by the European debt crisis which brought both recession and the risk of disintegration to the Eurozone. In response the Fed began a second round of quantitative easing (QE2) in the summer of 2010. It proved successful enough at stimulating reflation for a while, but the European Central Bank (ECB) refused to go along with the monetary policy experiment and even raised rates. The U.S.
2012 Market Returns* % Commodities Units Dec-11 Dec-12 % Change
United States S&P 500 13.4 WTI Crude $/Bbl 99.7 91.82 -7.9%
Dow 7.3 Brent Crude $/Bbl 106.51 111.11 4.3%
Nasdaq 15.9 Nat Gas $/Mmbtu 2.986 3.365 12.7%
Canada (TSX Comp) 4.0 Gold $/troy oz 1571 1675.8 6.7%
Brazil (Bospova) 7.4 Copper $/lb 3.454 3.6525 5.7%
Europe (DJ Euro Stox) 15.5 Iron Ore Fines $/net ton 142 136 -4.2%
Germany (Dax) 29.1
UK (FTSE) 8.2 Fixed Income Yields Dec-11 Dec-12
Australia (total stock) 13.5 10 Year US treasury 1.88 1.76
Japan (Topix TSE) 18.0 US AAA Corp 3.77 3.5
China (Shanghai Comp) 3.2 US BAA Corp 5.16 4.75
MSCI World Index 13.4% High Yield Index 8.65 7.5
*Index returns are price appreciation only
2
recovery was not strong enough to bring down stubbornly high unemployment, and even slow growth proved unsustainable when monetary stimulus was withdrawn. With this backdrop, and the absence of any meaningful fiscal policy or reform out of Congress, the Fed commenced another round of easing in September 2011. The so called “Operation Twist” was designed to bring down long term treasury rates and ultimately mortgage rates. It proved modestly successful and a slow turn in housing and employment began. Europe, now mired in recession, finally acted and the ECB began two liquidity-expanding refinancing operations to address its sovereign debt crisis. Now the two largest banks in the world were fully committed to unprecedented monetary stimulus. The current phase of Fed policy, the great monetary expansion, began in the summer of 2012. This time the ECB joined in as a major player and by year end the Bank of Japan, and China and many other emerging markets were aggressively easing. In the early summer of 2012 a number of macro concerns began to grip the markets: the U.S. Election and the Fiscal Cliff (a media driven obsession); a European recession and its potential political unraveling; a hard landing in China and a possible global recession. In mid-July ECB President Mario Draghi stated the bank would do “whatever it takes” to save the Euro. Those three words stabilized bond yields in Spain and Italy and calmed widespread fears of a financial meltdown in Europe. More reflation was added and global equity markets began to rise. Back in the U.S., the Fed stepped up its expansionary firepower in September by initiating QE3, an “open-ended” easing policy. This open-ended expansion is to remain in place until the unemployment rate falls below 6.5% (so long as the Fed’s long term inflation outlook is projected to be no more than 2.5%). In the meantime, by year end, the Bank of Japan- the world’s third largest central bank- had joined in with the most significant monetary stimulus program in decades, and China and other emerging markets had also began easing.
Source: ISI Group
Sometimes it’s that simple: S&P 500 Price Overlaid
with Shaded Fed Monetary Expansion Periods
3
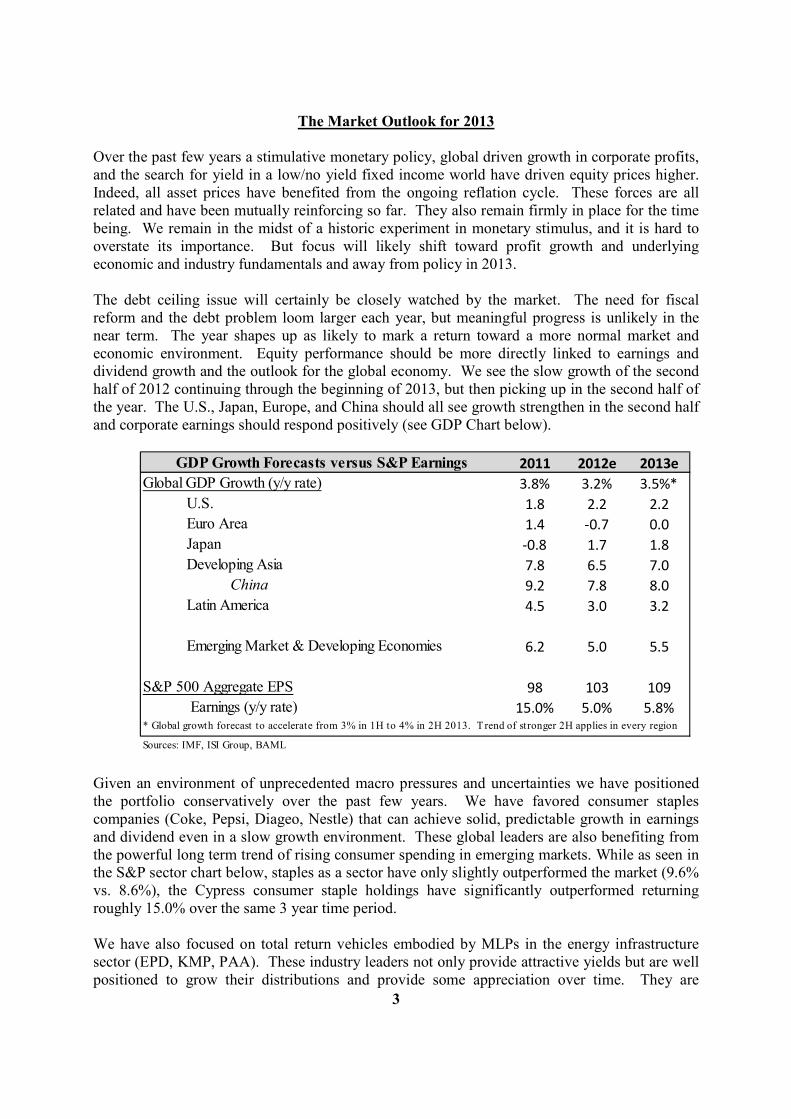
The Market Outlook for 2013 Over the past few years a stimulative monetary policy, global driven growth in corporate profits, and the search for yield in a low/no yield fixed income world have driven equity prices higher. Indeed, all asset prices have benefited from the ongoing reflation cycle. These forces are all related and have been mutually reinforcing so far. They also remain firmly in place for the time being. We remain in the midst of a historic experiment in monetary stimulus, and it is hard to overstate its importance. But focus will likely shift toward profit growth and underlying economic and industry fundamentals and away from policy in 2013. The debt ceiling issue will certainly be closely watched by the market. The need for fiscal reform and the debt problem loom larger each year, but meaningful progress is unlikely in the near term. The year shapes up as likely to mark a return toward a more normal market and economic environment. Equity performance should be more directly linked to earnings and dividend growth and the outlook for the global economy. We see the slow growth of the second half of 2012 continuing through the beginning of 2013, but then picking up in the second half of the year. The U.S., Japan, Europe, and China should all see growth strengthen in the second half and corporate earnings should respond positively (see GDP Chart below).
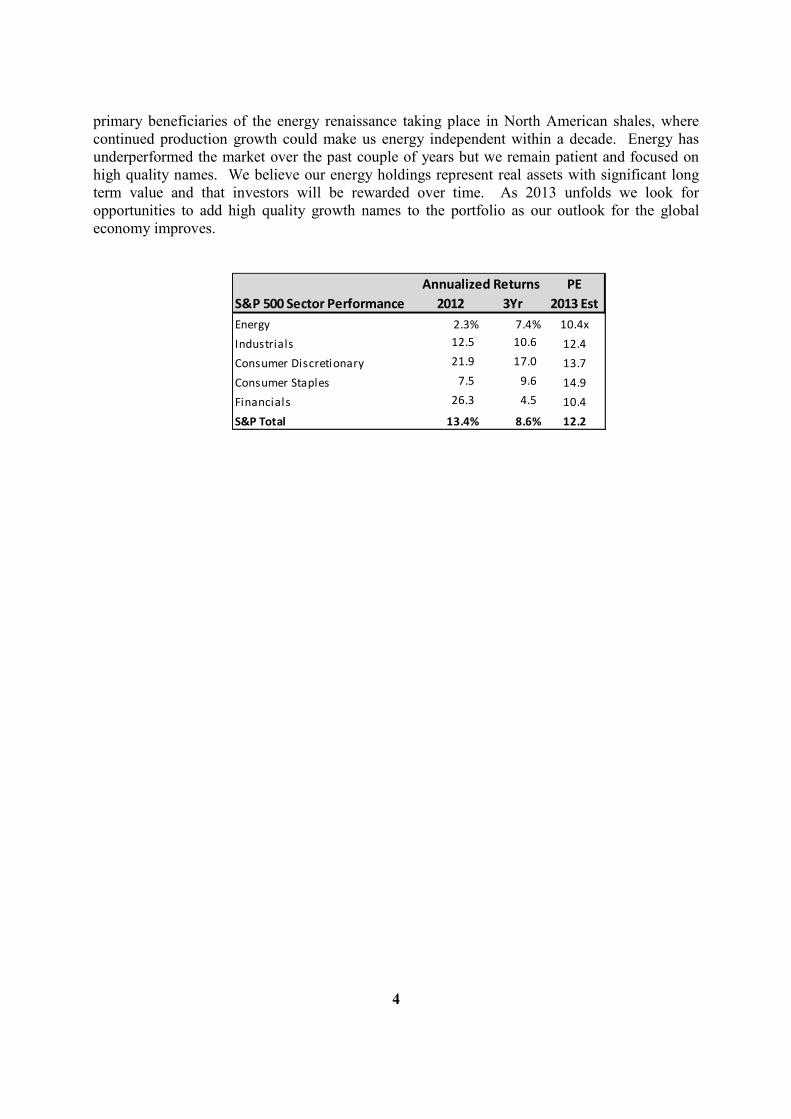
Given an environment of unprecedented macro pressures and uncertainties we have positioned the portfolio conservatively over the past few years. We have favored consumer staples companies (Coke, Pepsi, Diageo, Nestle) that can achieve solid, predictable growth in earnings and dividend even in a slow growth environment. These global leaders are also benefiting from the powerful long term trend of rising consumer spending in emerging markets. While as seen in the S&P sector chart below, staples as a sector have only slightly outperformed the market (9.6% vs. 8.6%), the Cypress consumer staple holdings have significantly outperformed returning roughly 15.0% over the same 3 year time period. We have also focused on total return vehicles embodied by MLPs in the energy infrastructure sector (EPD, KMP, PAA). These industry leaders not only provide attractive yields but are well positioned to grow their distributions and provide some appreciation over time. They are
GDP Growth Forecasts versus S&P Earnings 2011 2012e 2013e
Global GDP Growth (y/y rate) 3.8% 3.2% 3.5%*
U.S. 1.8 2.2 2.2
Euro Area 1.4 -0.7 0.0
Japan -0.8 1.7 1.8
Developing Asia 7.8 6.5 7.0
China 9.2 7.8 8.0
Latin America 4.5 3.0 3.2
Emerging Market & Developing Economies 6.2 5.0 5.5
S&P 500 Aggregate EPS 98 103 109
Earnings (y/y rate) 15.0% 5.0% 5.8%* Global growth forecast to accelerate from 3% in 1H to 4% in 2H 2013. T rend of stronger 2H applies in every region
Sources: IMF, ISI Group, BAML
4
primary beneficiaries of the energy renaissance taking place in North American shales, where continued production growth could make us energy independent within a decade. Energy has underperformed the market over the past couple of years but we remain patient and focused on high quality names. We believe our energy holdings represent real assets with significant long term value and that investors will be rewarded over time. As 2013 unfolds we look for opportunities to add high quality growth names to the portfolio as our outlook for the global economy improves.
PE
S&P 500 Sector Performance 2012 3Yr 2013 Est
Energy 2.3% 7.4% 10.4x
Industrials 12.5 10.6 12.4
Consumer Discretionary 21.9 17.0 13.7
Consumer Staples 7.5 9.6 14.9
Financials 26.3 4.5 10.4
S&P Total 13.4% 8.6% 12.2
Annualized Returns
5
MARKET OUTLOOK
Positives U.S. Economic Fundamentals Improving:
Housing has turned the corner and should enjoy a sustainable multi year recovery. Existing home sales and starts both trending higher; home prices finally turn up; mortgage rates at record lows. Housing price improvement may be even more important to overall economy than new house starts
Strong Domestic Auto Market Auto sales up 66% from 2008 recession low, reach recovery high of 15 million units in Q4
Energy & Manufacturing Renaissance in North America
• Increasing U.S. oil production and declining domestic oil consumption puts U.S. on the path to energy independence – essentially zero oil imports projected by decade end
• Record low natural gas prices benefit both U.S. consumers and manufacturers: U.S. natural gas prices are currently $3.30, prices in the rest of the world average about $12. Cheap natural gas a competitive advantage for U.S. manufacturers
America Feeds the world: U.S. farmers and farmland should continue to be primary beneficiaries of global agricultural bull market, one of the greatest bull markets in modern history…
Favorable demographics in the U.S. for growth versus the rest of the developed world
Attractive Equity Fundamentals:
• Strong Corporate Fundamentals: Cash, Cash Flow, and Profits at record levels and still growing
• Strong Dividend Growth: Dividends surged almost 20% in 2012 and are now well above prior peak. Even so, the payout ratio remains close to a record low, i.e. lots of room to grow
Stimulative Monetary & Fiscal Policy Wave:
• Wave of Stimulative Policy initiatives underway around the world (ISI counts more than 330 stimulative policy initiatives by governments around the world over the past 16 months)
• Accommodative Fed, ECB & BOJ (Bernanke announces “open ended” QE3; Draghi commits ECB to do “whatever it takes” to preserve Euro Zone; Abe elected Prime Minister on monetary and fiscal stimulus mandate, BOJ begins massive asset purchase and reflation campaign)
Stocks Remain Out of Favor:
The Great Re-Allocation Trade: 2012 bond fund inflows continue to average over $25 billion per month (extending what is already arguably a bubble), and equity flows remained negative. Early January 2013 equity inflows surge, highest in 5 years…have we reached a tipping point where investors re-allocate capital out of fixed income and into stocks?
Negatives
Global Growth Slowdown extends into
1H2013:
• Euro Zone Recession enters 2nd year: (Southern European Countries: Greece, Spain, Portugal, Italy in historic downturns)
• China economic challenges: China struggles to transition to a more consumer demand and domestic driven economy
• BRICs sputter: Emerging market growth slows in 2012 from China to India, Russia and Brazil but should start to pick up mid-2013
Higher Tax Rates in the U.S.:
• Income tax rates return to 39.6% for income above 450K (joint filers)
• Capital Gains & Dividends: Permanently set rate at 15% for incomes below 450K, and 23.4% for incomes above 450K (joint filers). Latter includes ACA tax
• Deductions are limited for higher incomes
U.S. federal debt crisis: Enters center stage with Debt Ceiling debate in early 2013:
• Growing federal debt and entitlements, if not addressed, will ultimately cripple the U.S. economy and fundamentally weaken the U.S. and its global leadership – see Europe
Macro Concerns:
European financial and banking crisis:
• Improving but still fragile.
Middle Eastern turmoil & Iran nuclear crisis


![Charles Shaw arXiv:1804.07978v2 [q-fin.ST] 24 Dec …arXiv:1804.07978v2 [q-fin.ST] 24 Dec 2018 Conditional heteroskedasticity in crypto-asset returns. Charles Shaw University of London,](https://img.pdfslide.net/doc/110x75/5ea519ad325bc42b5f772597/charles-shaw-arxiv180407978v2-q-finst-24-dec-arxiv180407978v2-q-finst.jpg)