Embed Size (px)
Citation preview

2012 Michigan Economic
COMPETITIVENESS STUDY
An analysis of issues to advance Michigan in a complex global economy
2012 Michigan Economic Competitiveness Study:
An analysis of issues to advance Michigan in a complex
global economy
Executive Brief

2012 Michigan Economic Competitiveness Study Executive Brief
Page 2 of 12
About the Michigan Chamber Foundation
The Michigan Chamber Foundation was established as a non-profit supporting organization to the Michigan Chamber of Commerce in 1985 for the following purposes:
• To plan and conduct nonpartisan public education programs regarding free enterprise, productivity and basic economic issues affecting the state of Michigan;
• To establish and operate a leadership institute designed to provide promising future leaders assessment of Michigan’s assets, challenges and opportunities to give participants the background and network of contacts necessary to make a positive impact on Michigan’s future;
• To conduct nonpartisan research and distribute policy studies on issues facing Michigan including, but not limited to taxation, government regulation, government spending, health care and transportation.
Michigan Chamber Foundation Board of Directors
Chair: Kelly Rossman-McKinney, Truscott Rossman
Vice Chair: John Schreuder, First National Bank of Michigan
President: Rich Studley, Michigan Chamber of Commerce
At-Large: Gordon Kummer, Lloyd & Mabel Johnson Foundation
Steve Mitchell, Mitchell Research & Communications
Dan Ponder, Franco Public Relations Group
Jon Sorber, TWO MEN AND A TRUCK/INTERNATIONAL, Inc.
Bill Woodbury, Auto-Owners Insurance
Executive Director: Bob Thomas
2012 Michigan Economic Competitiveness Study Executive Brief
Page 3 of 12
Acknowledgements
The Michigan Chamber Foundation (MCF) would like to thank Northwood University for agreeing to conduct this study and assembling a first class team of researchers to bring it to fruition. In particular, the MCF like to thank Northwood University President and CEO Dr. Keith A. Pretty; Study Director, Dr. Timothy G. Nash, Vice President for Strategic and Corporate Alliances and the David E. Fry Endowed Chair in Free Market Economics for shepherding the project from inception to completion. The chamber would also like to thank the research team led by Dr. Nash, which is a diverse and talented group of economists and public policy thinkers from across Michigan and nationally. Dr. Debasish Chakraborty, Professor of Economics, Central Michigan University; Dr. Richard Ebeling, Professor of Economics, Northwood University; Dr. Adam Guerrero, Associate Professor of Economics, Northwood University; Dr. John Grether, Professor of Economics, Northwood University; Dr. Adam Okulicz-Kozaryn, Associate Professor of Public Policy, Rutgers University; Adam N. Matzke, Economics and Finance graduate, Northwood University; Adam Pretty, Law student, University of Notre Dame; and Charles Ruger, graduate student in Economics, University of Detroit-Mercy.
Finally, we would like to thank Joseph T. Nash, Rita G. Nash, Jeffrey G. Phillips, Susan Woodcock, John Young and Rochelle Zimmerman for their assistance with the chart construction, editing, typing and researching of this project.

2012 Michigan Economic Competitiveness Study Executive Brief
Page 4 of 12
Introduction
The purpose of the study was to conduct a comprehensive analysis of the Michigan economy
and evaluate its rank and performance across a number of metrics including, but not limited to,
Gross State Product (GSP) growth, tax policy, regulatory policy, and cost of doing business.
Accordingly, the focus was primarily on the Michigan economy and its outlook for the future. It
accomplishes that objective by focusing on different aspects of the Michigan economy and
compares it with all other states within the United States. The study briefly outlines the current
state of U.S. competitiveness in the global economy and then focuses on Michigan’s economic
performance relative to national averages and the other 49 U.S. states. It is important to note
that the Michigan economy moved in tandem with the U.S. economy in the sense that both
experienced a decline in competitiveness relative to its competitors. In order to find answers
for what contributed to this decline, the study’s authors conducted a comprehensive survey of
the literature regarding sources of economic growth to determine what was absent from or
hindering the Michigan economy. The authors focused on productivity in Michigan and the
factors that impact productivity. Specifically, the study focused on tax structures, the
regulatory framework governing businesses, education and other components reflected of the
general business environment. With a focus on productivity, this study also analyzed the issue
of Right To Work legislation both at a theoretical and an empirical level. The results are
interesting to say the least. Although the topic is controversial in some quarters, the results
deserve serious attention and discussion at all levels of the public policy decision making
process in Michigan.
To begin, there is fundamental agreement among economists as to the sources that drive
economic growth. There are definite reasons why some nations grow and others don't. Robert
Barro (1991) in his seminal paper, “Economic Growth in a Cross Section of Countries,” tried to
answer that question. He studied the key economic and political factors that determined 98
countries’ competitiveness that led to economic growth and standards of living. It is clear from
his study and others that economic growth is helped by investments in human capital, lower tax
2012 Michigan Economic Competitiveness Study Executive Brief
Page 5 of 12
rates, a lower regulatory burden on businesses and emphasis on the overall human
development matrix. It is also clear that the U.S. has been steadily falling behind in these
critical investment areas, or at least unable to keep up with the investments vis-à-vis its
competitors. Also, government is becoming increasingly more important in the overall scheme
of things as compared to the private sector. In addition, the federal government budget deficit
and national debt is growing alarmingly high and the financing of the deficit has been
instrumental in increasing the cost of capital, making it difficult for private businesses to invest
in critical areas. Many economists would argue that this unprecedented increase in government
spending has been the primary reason behind the relative decline in American competitiveness.
In the appendix of the study, numerous tables and charts are provided that highlight this
decline in U.S. competitiveness.
The 20th century clearly was the “American Century.” The 1900’s saw the United States
become the world’s largest, most productive and most competitive economy while also
becoming the world leader in invention and innovation. However, towards the end of the 20th
century, grave concerns began to be voiced as to whether or not the U.S. could maintain its
standing in the global economy. Income growth and job growth began to slow toward the end
of the 20th century and has continued to slow into the 21st century. While this was happening,
it is also true that government was becoming more and more significant in the U.S. economy.
According to the Congressional Budget Office and the Heritage Foundation, government at all
levels in the United States consumed less than eight percent of GDP by expenditures in 1902
and today consumes more than 42 percent. The U.S. now has the highest corporate income tax
rate in the industrialized world at 39.2% (the industrialized world average is 24%) according to
the Tax Foundation, not because the U.S. has raised taxes, but rather because many of its
competitors have lowered their rates over the last decade. Based on 2010 data, the U.S. also
has among the highest long-term and integrated capital gains tax rates in the industrialized
world at 19% and 51.5% respectively. The U.S. tax system has become more and more
burdensome and has contributed to decline in U.S. competitiveness.
2012 Michigan Economic Competitiveness Study Executive Brief
Page 6 of 12
The 2012 Heritage Foundation/Wall Street Journal’s Index of Economic Freedom measures
political freedom, prosperity, and economic freedom across 10 metrics to gauge the economic
success of 184 countries around the world. In 1995, the U.S. was ranked fourth in the world on
the index and in 2012 the U.S. has dropped to tenth.
Over the last one hundred years, the United States as a country lost sight of what made it great.
The case is similar for Michigan. The U.S. economy’s pace for invention, innovation and new
business formation was staggering in the 1900’s, with Michigan at the epicenter of much of that
growth. Michigan-based companies like Amway, Chrysler, The Dow Chemical Company, The
Ford Motor Company, General Motors, Kellogg, Upjohn and Whirlpool were complemented and
supplemented by thousands of small and medium-sized entrepreneurial organizations making
Michigan a center for business excellence for much of the 20th century (U.S. Department of
Commerce Report, 2012). However, Michigan began to lose its competitive edge to lower-cost
U.S. states and foreign countries starting in the 1970’s and continuing into the twenty-first
century. Today, the Michigan economy is heavily dominated by the automobile industry and
has not attracted sufficient new businesses or developed home-grown entrepreneurs to ensure
strong economic growth and wide scale economic diversification.
The following are examples of the many factors used in this study to evaluate the
competitiveness of the Michigan economy relative to the U.S. as a whole, as well as Right To
Work (RTW) states and Non-Right-To-Work (NRTW) states:
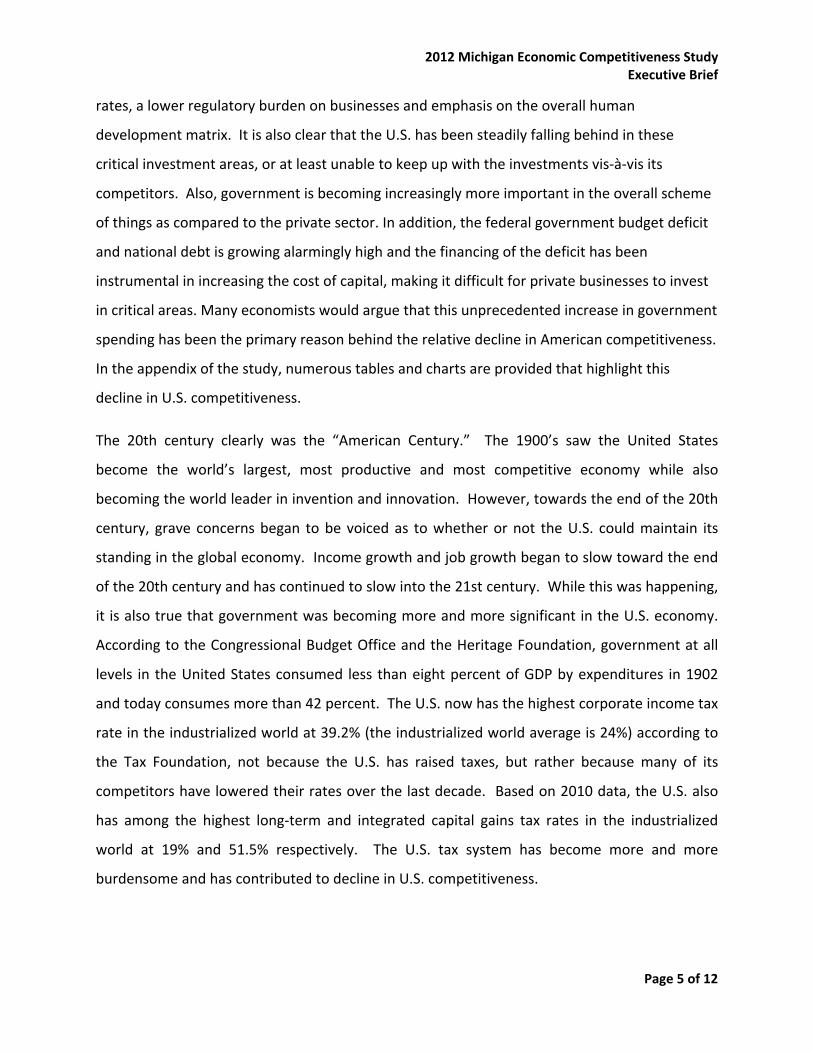
1. Growth in Personal Income
Personal income per capita
growth in Michigan grew 20.3%
from 2000-2010 while the U.S.
average income grew at 36.4%
over the same period. Personal
income growth over the period
grew at just under 40% in RTW
2012 Michigan Economic Competitiveness Study Executive Brief
Page 7 of 12
states and at 34.2% in NRTW states (see Exhibit 29).
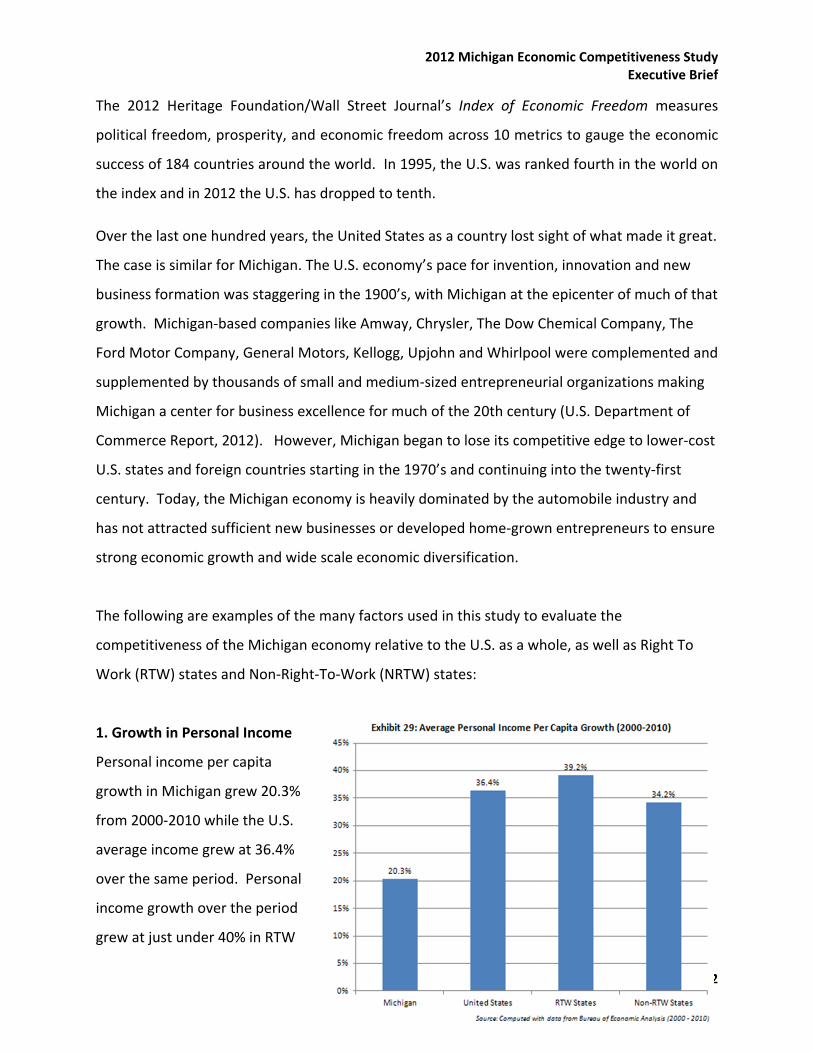
2. Real Gross State Product (GSP) Growth From 1998-2011 Michigan Real Gross
State Product (GSP) lagged the national
average significantly. While the U.S.
economy grew from an overall Gross
Domestic Product (GDP) level of more
than $8 trillion in 1998 to just under $15
trillion in 2011 or 71.5%, the Michigan
economy grew by only 26.5% over the
same period. Gross State Product grew at
an average rate of 85% over the same
period in RTW states while realizing a
slower growth rate in NRTW states of
64.2% (see Exhibit 17).
3. Net Population Migration
Michigan’s population net migration from
2000-2010 was among the worst in the
United States with a loss of 554,374 people.
Net migration is defined by the difference
in people leaving a state relative to people
migrating to a state over a given period of
time. The overall U.S. population net
migration for the same period was just
under 1,000,000 people net positive with
RTW states experiencing a positive net
migration total of just under 6,000,000 and
2012 Michigan Economic Competitiveness Study Executive Brief
Page 8 of 12
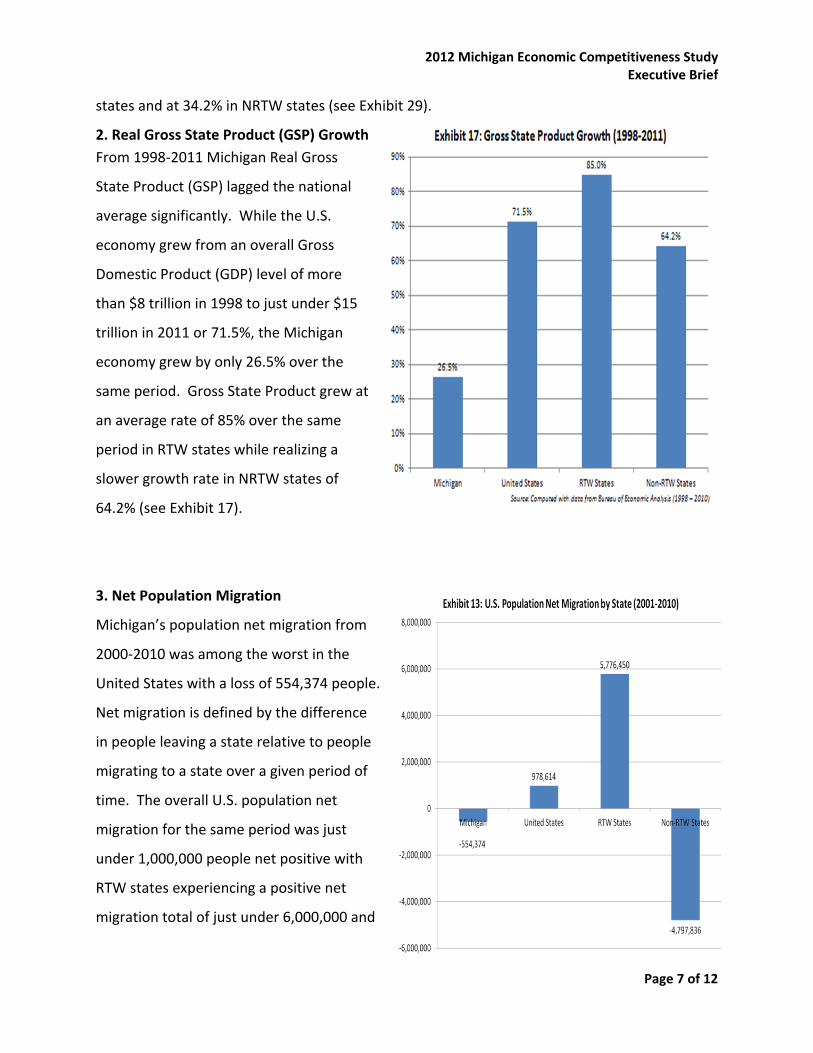
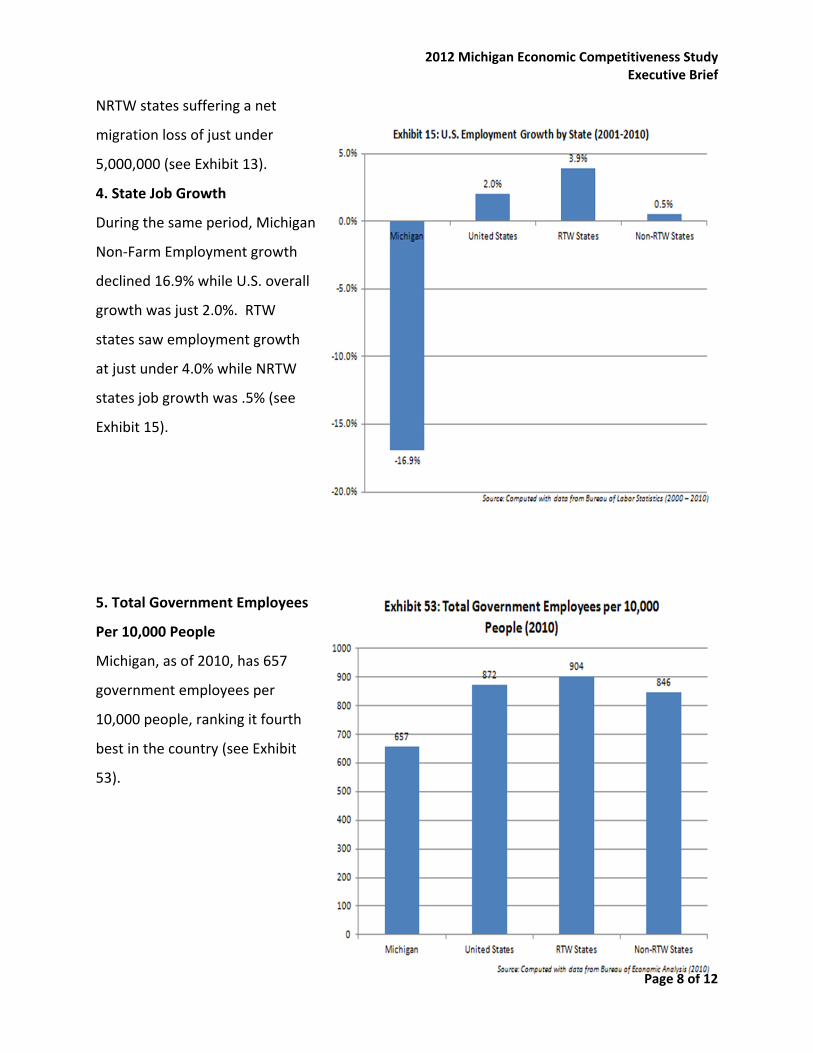
NRTW states suffering a net
migration loss of just under
5,000,000 (see Exhibit 13).
4. State Job Growth
During the same period, Michigan
Non-Farm Employment growth
declined 16.9% while U.S. overall
growth was just 2.0%. RTW
states saw employment growth
at just under 4.0% while NRTW
states job growth was .5% (see
Exhibit 15).
5. Total Government Employees
Per 10,000 People
Michigan, as of 2010, has 657
government employees per
10,000 people, ranking it fourth
best in the country (see Exhibit
53).
2012 Michigan Economic Competitiveness Study Executive Brief
Page 9 of 12
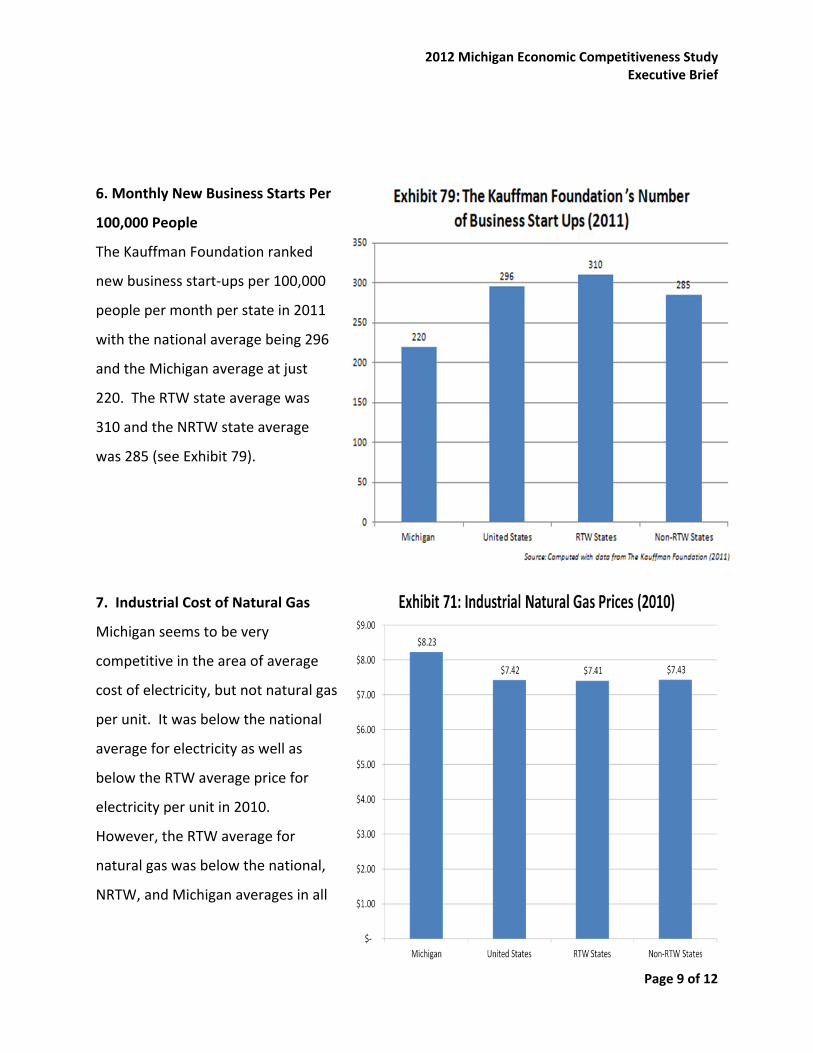
6. Monthly New Business Starts Per
100,000 People
The Kauffman Foundation ranked
new business start-ups per 100,000
people per month per state in 2011
with the national average being 296
and the Michigan average at just
220. The RTW state average was
310 and the NRTW state average
was 285 (see Exhibit 79).
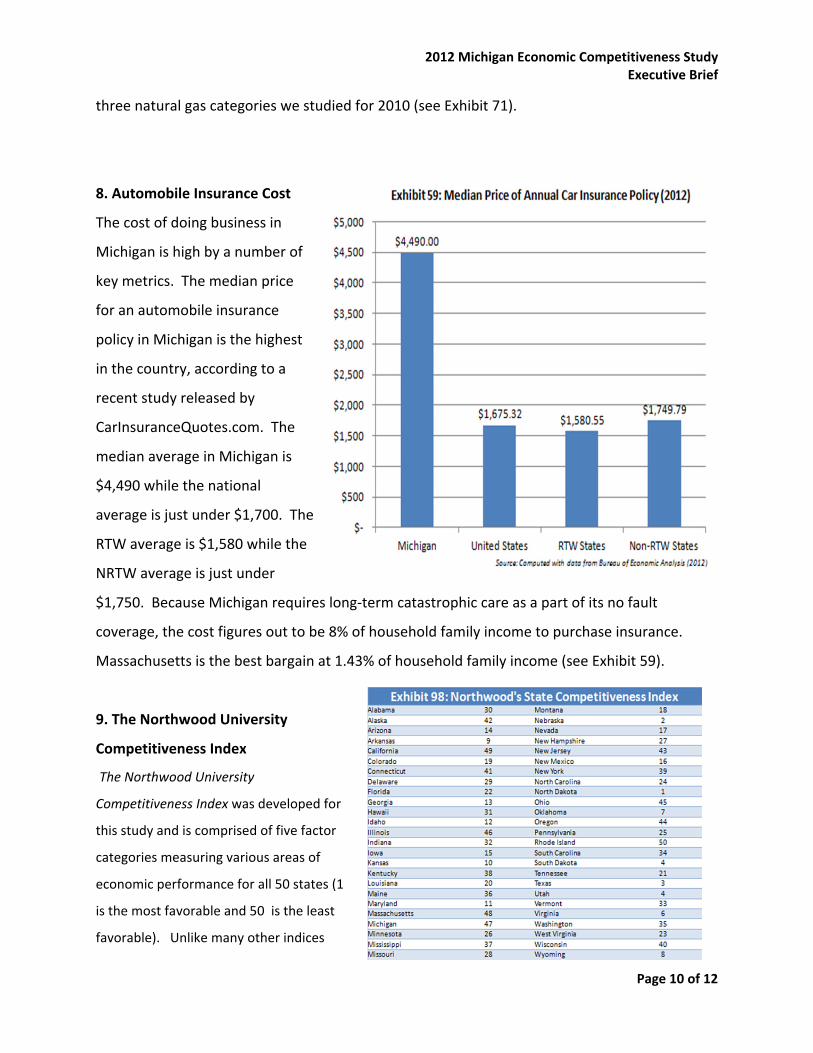
7. Industrial Cost of Natural Gas
Michigan seems to be very
competitive in the area of average
cost of electricity, but not natural gas
per unit. It was below the national
average for electricity as well as
below the RTW average price for
electricity per unit in 2010.
However, the RTW average for
natural gas was below the national,
NRTW, and Michigan averages in all
2012 Michigan Economic Competitiveness Study Executive Brief
Page 10 of 12
three natural gas categories we studied for 2010 (see Exhibit 71).
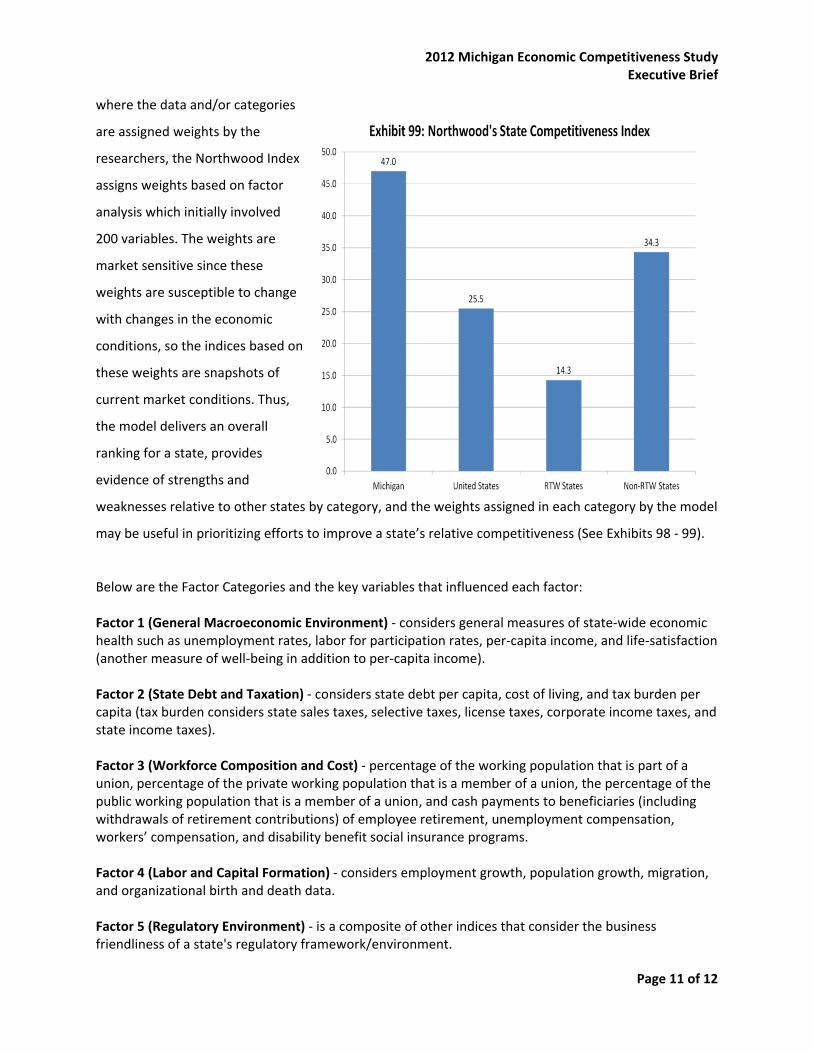
8. Automobile Insurance Cost
The cost of doing business in
Michigan is high by a number of
key metrics. The median price
for an automobile insurance
policy in Michigan is the highest
in the country, according to a
recent study released by
CarInsuranceQuotes.com. The
median average in Michigan is
$4,490 while the national
average is just under $1,700. The
RTW average is $1,580 while the
NRTW average is just under
$1,750. Because Michigan requires long-term catastrophic care as a part of its no fault
coverage, the cost figures out to be 8% of household family income to purchase insurance.
Massachusetts is the best bargain at 1.43% of household family income (see Exhibit 59).
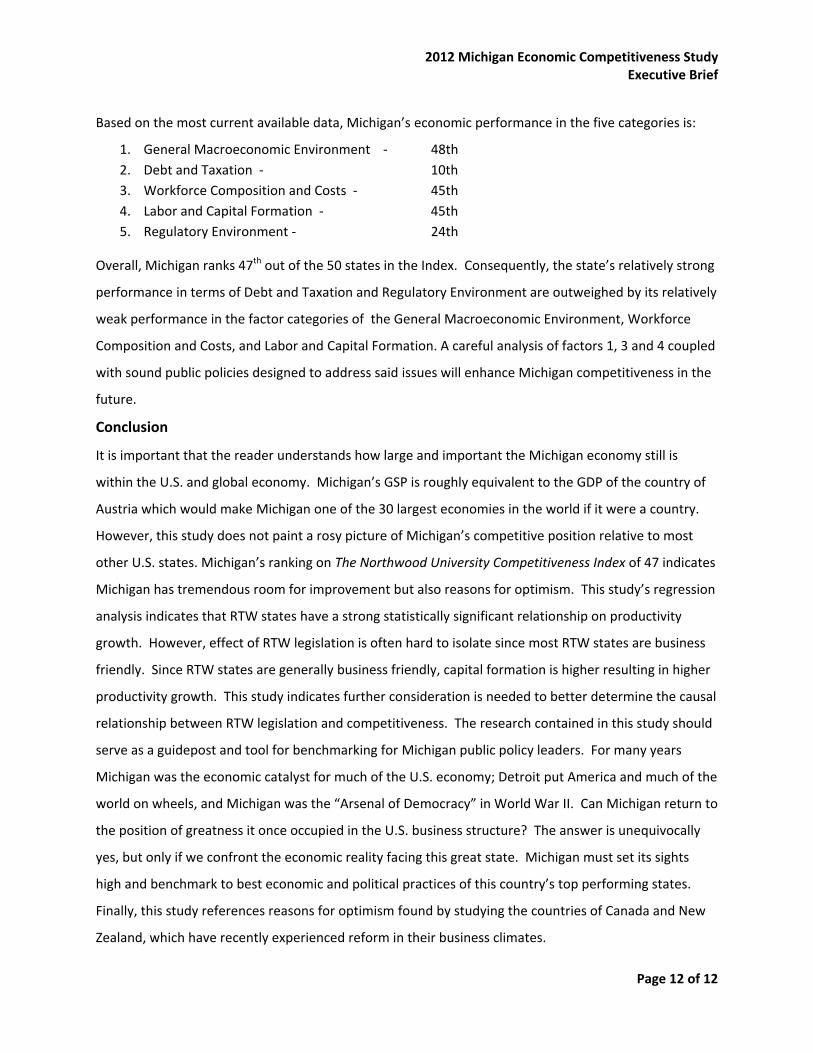
9. The Northwood University
Competitiveness Index
The Northwood University
Competitiveness Index was developed for
this study and is comprised of five factor
categories measuring various areas of
economic performance for all 50 states (1
is the most favorable and 50 is the least
favorable). Unlike many other indices
2012 Michigan Economic Competitiveness Study Executive Brief
Page 11 of 12
where the data and/or categories
are assigned weights by the
researchers, the Northwood Index
assigns weights based on factor
analysis which initially involved
200 variables. The weights are
market sensitive since these
weights are susceptible to change
with changes in the economic
conditions, so the indices based on
these weights are snapshots of
current market conditions. Thus,
the model delivers an overall
ranking for a state, provides
evidence of strengths and
weaknesses relative to other states by category, and the weights assigned in each category by the model
may be useful in prioritizing efforts to improve a state’s relative competitiveness (See Exhibits 98 - 99).
Below are the Factor Categories and the key variables that influenced each factor: Factor 1 (General Macroeconomic Environment) - considers general measures of state-wide economic health such as unemployment rates, labor for participation rates, per-capita income, and life-satisfaction (another measure of well-being in addition to per-capita income). Factor 2 (State Debt and Taxation) - considers state debt per capita, cost of living, and tax burden per capita (tax burden considers state sales taxes, selective taxes, license taxes, corporate income taxes, and state income taxes). Factor 3 (Workforce Composition and Cost) - percentage of the working population that is part of a union, percentage of the private working population that is a member of a union, the percentage of the public working population that is a member of a union, and cash payments to beneficiaries (including withdrawals of retirement contributions) of employee retirement, unemployment compensation, workers’ compensation, and disability benefit social insurance programs. Factor 4 (Labor and Capital Formation) - considers employment growth, population growth, migration, and organizational birth and death data. Factor 5 (Regulatory Environment) - is a composite of other indices that consider the business friendliness of a state's regulatory framework/environment.
2012 Michigan Economic Competitiveness Study Executive Brief
Page 12 of 12
Based on the most current available data, Michigan’s economic performance in the five categories is:
1. General Macroeconomic Environment - 48th 2. Debt and Taxation - 10th 3. Workforce Composition and Costs - 45th 4. Labor and Capital Formation - 45th 5. Regulatory Environment - 24th
Overall, Michigan ranks 47th out of the 50 states in the Index. Consequently, the state’s relatively strong
performance in terms of Debt and Taxation and Regulatory Environment are outweighed by its relatively
weak performance in the factor categories of the General Macroeconomic Environment, Workforce
Composition and Costs, and Labor and Capital Formation. A careful analysis of factors 1, 3 and 4 coupled
with sound public policies designed to address said issues will enhance Michigan competitiveness in the
future.
Conclusion
It is important that the reader understands how large and important the Michigan economy still is
within the U.S. and global economy. Michigan’s GSP is roughly equivalent to the GDP of the country of
Austria which would make Michigan one of the 30 largest economies in the world if it were a country.
However, this study does not paint a rosy picture of Michigan’s competitive position relative to most
other U.S. states. Michigan’s ranking on The Northwood University Competitiveness Index of 47 indicates
Michigan has tremendous room for improvement but also reasons for optimism. This study’s regression
analysis indicates that RTW states have a strong statistically significant relationship on productivity
growth. However, effect of RTW legislation is often hard to isolate since most RTW states are business
friendly. Since RTW states are generally business friendly, capital formation is higher resulting in higher
productivity growth. This study indicates further consideration is needed to better determine the causal
relationship between RTW legislation and competitiveness. The research contained in this study should
serve as a guidepost and tool for benchmarking for Michigan public policy leaders. For many years
Michigan was the economic catalyst for much of the U.S. economy; Detroit put America and much of the
world on wheels, and Michigan was the “Arsenal of Democracy” in World War II. Can Michigan return to
the position of greatness it once occupied in the U.S. business structure? The answer is unequivocally
yes, but only if we confront the economic reality facing this great state. Michigan must set its sights
high and benchmark to best economic and political practices of this country’s top performing states.
Finally, this study references reasons for optimism found by studying the countries of Canada and New
Zealand, which have recently experienced reform in their business climates.
1
Introduction
The following research and conclusions emanate from a series of meetings and discussions between the study authors and members of the Michigan Chamber Foundation board and staff. The study has been conceived and is designed to take a careful and unbiased look at economic competitiveness in general and the U.S. and Michigan economies in detail.
The U.S., and therefore the Michigan economy, is part of a highly complex global economy which faces constant and often radical change. The study briefly outlines the current state of U.S. competitiveness in the global economy and then focuses on Michigan’s economic performance relative to the other 49 U.S. states. The purpose of the study is to conduct a comprehensive analysis of the Michigan economy and evaluate its rank and performance across a number of metrics including but not limited to Gross State Product (GSP) growth, tax policy, regulatory policy, and cost of doing business.
This study also focuses on the issue of Right to Work legislation at both a theoretical and an empirical level. The results are interesting to say the least. Although the topic is controversial in some quarters, it deserves serious discussions at all levels of the decision making process. After comparing Michigan to many national norms, the same details were used to compare Michigan’s performance to Right to Work (RTW) states and Non-Right to Work (NRTW) states to see if there might be significant differences relative to this metric as well. The results are interesting and unique and make a compelling case for bi-partisan discussion, action and objective pro-business reforms.
The U.S. in a Complex Global Economy
Economists fundamentally agree about the source of economic growth. There are definite reasons why some nations grow and others don't. Robert Barro (1991) in his seminal paper “Economic Growth in a Cross Section of Countries” tried to answer that question. He studied the key economic and political factors that determined 98 countries’ competitiveness that led to economic growth and improved standards of living. It is clear from his studies and others that economic growth is helped by investments in human capital, lower tax rate, less regulatory burden on businesses and emphasis on the overall human development matrix. It is also clear that U.S. has been steadily falling behind in these critical investment areas, or at least unable to keep up with the investments vis-à-vis many of its competitors. Also, government is becoming
2
increasingly more important in the overall scheme of things as compared to the private sector. In addition, the federal government budget deficit and national debt have grown alarmingly high, and the financing of the deficit, along with additional post-recession banking regulation, has been instrumental in decreasing the cost of capital, making it difficult for private businesses to invest in critical areas. Many economists argue that these unprecedented increases in government spending and new regulation have been the main reasons behind the relative decline in American competitiveness. In the appendix of this paper tables and charts are provided that highlight this decline in US competitiveness across a variety of factors.
It is important to note that the 20th century was clearly was the “American Century.” The 1900s saw the United States become the world’s largest, most productive and most competitive economy while also becoming the world leader in invention and innovation. The U.S. was the envy of the world, producing new technologies and abandoning old ones while successfully commercializing the best at a rate the rest of the world could only dream of (see Exhibit 1). While the American competitive free enterprise system produced individual giants like Ford, GM, Standard Oil and U.S. Steel and billionaires named Rockefeller, Carnegie and Ford, the educated middle class realized rapid income growth and soaring standards of living that was the U.S. hallmark during this time (U.S. Department of Commerce, 2012).
U.S. economic performance was nothing short of exceptional during the 20th century driven by inventors and innovators. The U.S. became the world’s most entrepreneurial, most educated and most competitive economy and remained that way throughout most of the century. This creation of millions of jobs and newly founded businesses and industries, combined with phenomenal economic performance allowed America to comfortably shoulder the burden of World War I and II and to realize a 213 % increase in real disposable personal income from $9,240 in 1950 to $28,899 in 2010 (U.S. Bureau of Economic Analysis, 2010).
Toward the end of the 20th century grave concerns were voiced as to whether or not the U.S. could or would remain in its position of prominence atop the global economy. Income growth and job growth began to slow toward the end of the 20th century and have continued to slow into the 21st century (U.S. Department of Commerce, 2012). Simultaneously other countries began to appear on the global economic stage as viable competitors to the United States. Over the last decade or more, evidence of a decline in American competitiveness has continued to mount. As an example, U.S. 15 year olds ranked just 25th in math among the 34 industrialized countries that make up the Organization for Economic Cooperation and Development (OECD) countries and scored in the middle in science and reading on the Program for International Student Assessment (PISA) test given to students in more than 70 countries in 2009 as reported in December, 2010. The test is given every three years with the Shanghai region of China finishing number one among the 72 countries taking the exam (see Exhibit 2). In response to
3
this report, U.S. Secretary of Education Arne Duncan stated that “the brutal fact here is there are many countries that are far ahead of the U.S. and improving more rapidly than we are. This should be a massive wake-up call to the entire country” (Bloomberg, 2010).
In addition, according to the Congressional Budget Office and the Heritage Foundation, government at all levels in the United States consumed less than 8 % of GDP by expenditures in 1902 and today consumes more than 42 % (see Exhibit 3). We believe that 8 % government expenditures as a percent of GDP is unrealistically too low in today’s complex global economy; yet we also believe that 42 % is excessively high, creating a crushing burden on business and economic growth in the United States.
Additionally, The U.S. tax system is becoming more and more burdensome to U.S. competitiveness relative to the rest of the world. According to the Tax Foundation, the U.S. now has the highest corporate income tax rate in the industrialized world at 39.2 %, not because the U.S. has raised taxes but rather because many of its competitors have lowered their rates over the last decade (see Exhibit 4). The U.S. also has among the highest long-term and integrated capital gains tax rates in the industrialized world at 19 % and 51 % respectively (see Exhibit 5).
In reviewing the 16 key indicators (including the number of scientists and engineers, corporate and government R&D, venture capital, productivity, trade performance and others) contained in the July 2011 Atlantic Century (Atkinson, 2011) report, the results show the U.S. ranked number four behind Singapore, Finland and Sweden.
While a fourth place ranking doesn’t appear to be too bad, additional studies and data sources paint a picture of a less nimble and less competitive U.S. economy and business environment. The 2012 Heritage Foundation/Wall Street Journal’s Index of Economic Freedom measures political freedom, prosperity, and economic freedom across 10 metrics to gauge the economic success of 184 countries around the world. In 1995 the U.S. was ranked 4th in the world on the index, and in 2012 the U.S. dropped to 10th (see Exhibit 6). Another measure of economic competitiveness is the highly regarded International Institute for Management Development’s (IMD) Global Competitiveness Index, which consists of 323 variables and four sub-indices (Economic Performance, Government Efficiency, Business Efficiency and Infrastructure) and measures the competitiveness of nations by analyzing how they create a competitive business environment. The U.S. has dropped from being ranked number one on the 1999-2000 index to number five on the 2011-12 index behind Switzerland, Singapore, Sweden and Finland (see Exhibit 7).
U.S. competitiveness is being adversely impacted by a number of factors, including a mounting national debt which now stands at $16 trillion and is greater than 100% of projected 2012 GDP.
4
The national debt of the United States took more than 205 years to reach the one trillion dollar mark, and in roughly 30 years it increased 15 fold (see Exhibit 8). According to the U.S. Department of the Treasury and the U.S. Congressional Budget Office (CBO), U.S. gross interest rate payments on treasury debt securities in 2011 was $454 billion dollars (more than the total GDP of some of the most advanced economies in the world). It is also important to note that the debt was serviced at a historically low average interest rate of just 2.62 % (see Exhibit 9). There is concern with the future burden of gross interest rate payments in the United States if the economy recovers or if it enters an inflationary spiral; in either case, interest rates will rise as will the cost of servicing the national debt.
Many believe that the solution to the U.S. deficit problem is simply to raise taxes, especially on those in the top 1 % on personal income and on corporations. According to the Tax Foundation in 2009 (the most recent tax data available), the top 1 % of income earners paid 36.7 % of total U.S. personal income taxes while the top 10 % percent paid 70.5 % (Tax Foundation, 2012). Additionally, in 2012 the U.S. gained the dubious distinction of having the highest corporate income tax rate in the industrialized world, making the U.S. and the North American region less competitive (see Exhibit 10).
Somewhere over the last one hundred years the United States as a country has lost sight of what made it great. There is less understanding of the contributions of (a) economic and political freedom and (b) entrepreneurship and investment to (c) business success, infrastructure development and rising standards of living. Productivity and wealth generated by a free and dynamic business sector allow for households to prosper and government to exist and operate and play a vital role in the economy. All three of the macro flow variables (households, business and government) are important (see Exhibit 11). The mix of resource allocation among households, businesses, and government needs to be closely reexamined as government is consuming an ever-increasing share of U.S. GDP thus thwarting U.S. competitiveness and growth.
Michigan in a Changing U.S. Economy
The U.S. economy’s pace for invention, innovation and new business formation was staggering throughout the 20th century, and Michigan was at the epicenter of much of that growth. Michigan- based companies like Amway, Chrysler, The Dow Chemical Company, The Ford Motor Company, General Motors, Kellogg, Upjohn and Whirlpool were complemented and supplemented by thousands of small and medium-sized entrepreneurial organizations, making Michigan a center for business excellence (U.S. Department of Commerce Report, 2012). A
5
further measure of Michigan’s success in that period is the fact that Detroit had the highest per capita average income in the United States in 1950 (Skorup, 2009)
However, Michigan began to lose its competitive edge to lower-cost U.S. states and foreign countries starting in the 1970s and continuing into the 21st century. Today, the Michigan economy is still heavily reliant upon the automobile industry and has not attracted sufficient new businesses to the state or developed home-grown entrepreneurs to ensure strong economic growth and wide scale economic diversification. The following analysis will shed some light on the factors impeding economic growth in Michigan while comparing Michigan to numerous national averages and the average for U.S. Right to Work (RTW) states and U.S. Non-Right to Work (NRTW) states.
Population, Employment and GDP Growth in Michigan and the United States
Michigan’s U.S. population net migration from 2000-2010 was among the worst in the United States with a net loss of 554,374 people. Net migration is defined as the difference in people leaving a state relative to people migrating to a state over a given period of time. The overall U.S. population net migration for the same period was just under 1,000,000 people net positive with RTW states experiencing a positive net migration total of just under 6,000,000 and NRTW states suffering a net migration loss of just under 5,000,000 (see Exhibits 12 and 13). During the same period, Michigan Non-Farm Employment growth declined 16.9% while the U.S. overall average grew just 2.0 %. RTW states saw employment growth at just under 4.0 % while NRTW states’ job growth was 0.5 % (see Exhibits 14 and 15).
From 1998-2011 Michigan Gross State Product (GSP) lagged the national average significantly. While the U.S. economy grew from an overall Gross Domestic Product (GDP) level of more than $8 trillion in 1998 to just under $15 trillion in 2011 or 71.5 %, the Michigan economy grew by only 26.5 % over the same period. Gross State Product grew at an average rate of 85 % over the same period in RTW states while realizing a slower growth rate in NRTW states of 64.2 % (see Exhibits 16-21). As one should expect, poor growth or negative growth in GSP is generally correlated with higher levels of unemployment. From 2000-10, the average unemployment rate in Michigan was 7.23 % while the average for the United States was 5.49 %. Somewhat surprising is the fact that average unemployment in RTW states was 5.55 % while NRTW states averaged 5.44 % over the same period (see Exhibits 22 and 23).
Employment growth in the Non-Farm segment of the U.S. economy from 2000-2010 averaged just 2.0 %, as noted earlier. Michigan’s job creation was negative, ranked dead last out of the fifty states for job growth during this period. The average rank for job growth in RTW states over the same period was 21.3 while the average rate out of 50 states for NRTW states was 28.8 (see Exhibits 24-27). In addition, Michigan was the only state to realize net population loss
6
based on the 2010 U.S. Census. Michigan clearly underperformed versus the U.S. and RTW averages in the areas of economic growth, population, migration, and job creation.
Household Income Growth and Minimum Wage in Michigan and the United States
Personal income per capita growth in Michigan grew 20.3 % from 2000-2010 while the U.S. average income grew at 36.4 % over the same period. Personal income growth over the period grew at just under 40 % in RTW states and at 34.2 % in NRTW states (see Exhibits 28 and 29).
Household income can be measured by median income (generally the parent or parents in the household). Michigan lags the national average while having roughly the same averages as the RTW states. NRTW states have higher average incomes, but the margin is narrowing relative to RTW states due to more rapid income growth and GSP growth in RTW states over the past decade (see Exhibits 30-31).
Minimum wage rates are often considered to be a barrier to entry for young and/or unskilled workers who either lack necessary skills or job experience or both. The U.S. federally mandated minimum wage floor is $7.25, thus no state may set their minimum wage below this rate. The Michigan minimum wage for 2012 is $7.40. Michigan is $.07 below the national average and only $.07 above the RTW average. There is a $.26 differential premium between RTW and NRTW states regarding minimum wage rates (see Exhibits 32 and 33).
Assessing the Cost of Government in Michigan and the United States
Tax burdens, especially on business, have a generally negative effect on job creation, job growth and in attracting new businesses. The average state and local income tax burden as a % of income in Michigan in 2010 was 9.7 % with the U.S. average at 9.4 %. The average in RTW states was 8.8 % while the average in NRTW states was 9.9 %, more than a full point higher (see Exhibits 34 and 35). The average combined state and local tax rate on corporations in Michigan in 2010 was 5 % (see Exhibit 36-41).
Like the federal government and many other states, Michigan’s state debt as a % of Michigan Gross State Product (GSP) is a problem and is slightly above the national average of 8.35% of GSP. This compares to 5.31 % on average in RTW states and 10.39 % in NRTW states (see Exhibits 42 and 43). State debt per capita in Michigan is relatively low compared to NRTW states at $2,915 per capita, with the U.S. average at $3,449 and the NRTW state average at $4539 . However, the RTW average is considerably lower at $2,061 (see Exhibit 44 and 45). In examining state debt as a % of tax revenue, Michigan fared well with the national average at
7
160.37 % and the Michigan average at 144.77 %, while RTW states’ state debt as a share of tax revenue was just over 117.15 % and NRTW states average 194.32 % (see Exhibits 46 and 47). Michigan’s debt service as a share of GDP tax revenue is also below the national average at 5.37 % and below the RTW average at 5.08 % (see Exhibits 48 and 49).
Michigan’s state liability ranking is 30 out of 50 with RTW states average rank at 23.6 and NRTW states at 27 (see Exhibits 50 and 51). The effects of a challenging economy in Michigan have caused the state to see a reduction in the number of government employees at all levels over the past decade (citation). As of 2010 Michigan has 657 government employees per 10,000 people, ranking it fourth lowest in the country (see Exhibits 52 and 53). Looking at state and local government employees alone, Michigan ranks among the ten leanest-government states in the country (see Exhibits 54 and 55).
Government operating efficiencies notwithstanding, Michigan received the highest level of federal bailout funds per capita associated with the financial crisis of 2008-2009. It can be argued that without said funds, the economic downturn in Michigan and in the U.S. automobile industry would have been dramatically worse, yet many debate the long-term effect the bailout will have on the competitiveness of both Michigan and the U.S. automobile industry (see Exhibits 56 and 57).
Cost of Key Goods and Services in Michigan and Nationally
The cost of doing business in Michigan is high by a number of key metrics. The median price for an automobile insurance policy in Michigan is the highest in the country, according to a recent study released by CarInsuranceQuotes.com (Johnson, 2012). The median average in Michigan is $4,490 while the national average is just under $1,700. The RTW average is $1,580 while the NRTW average is just under $1,750. Because Michigan requires long term catastrophic care as a part of its no fault coverage, the cost figures out to be 8 % of household family income to purchase insurance. Massachusetts is the best bargain at 1.43 % of household family income (see Exhibits 58-61).
Michigan seems to be very competitive in the area of average cost of electricity, but not natural gas per unit or gasoline taxes. It was below the national average for electricity as well as below the RTW average price for electricity per unit in 2010. However, in 2012 Michigan’s gasoline tax is well above the national, NTRW, and RTW state averages with the fourth highest total gasoline tax in the nation. Moreover, the RTW average for natural gas was below the national, NRTW, and Michigan averages in all three natural gas categories studied for 2010 (see Exhibits 62-71).
8
Finally, the average insurance trust expenditure in Michigan was among the highest in the country at $1,018.18 per capita in 2010. The national average was less than $600 while the RTW cost was above the NRTW level, which was a rare occurrence in this study (see Exhibits 72-75).
Competitiveness Metrics in Michigan and the United States
In this section a number of measurement tools related to the business environment and business competitiveness of a state and the subsequent rankings are compiled. They are broken-down to compare Michigan with RTW and NRTW states.
A study by hospitality marketing research firm Cvent noted the top 50 cities for meetings and conventions, and Michigan did not have one city in the top 50 (see Exhibit 76 and 77). Also, the Kauffman Foundation ranked new business start-ups per 100,000 people per month per state in 2011 with the national average being 296 and the Michigan average at just 220. The RTW state average was 310 and the NRTW state average was 285 (see Exhibits 78 and 79). There is some interesting data on business births and deaths from 2002-2007. Michigan trails the national average and the RTW average in births. RTW states are producing new organizations at a faster pace than NRTW states as well (See exhibits 80-87).
Professors from the University of Warwick in England and Hamilton College in New York have done some path-breaking work trying to measure happiness and quality of life, having published it in the journal Science. The survey rankings from 2005-2008 were used to compare Michigan to RTW and NRTW states. Michigan ranked 48th or third “least happy” overall with RTW states citizens seeming to be much happier at an average rank of 16.95 while NRTW states had an average happiness rank of 32.71 (see Exhibits 88 and 89).
The American Legislative Exchange Council annually ranks states on economic performance considering seven factors ranging from corporate tax rates and GSP growth to non-farm payroll growth and population growth. The 2011 rankings of the above variables showed that Michigan ranked dead last at 50 in economic performance with the average ranking for RTW states being 18.27 and NRTW states averaging 31.18 (see Exhibits 90 and 91).
The 2011 Forbes Best States for Business Index and broke it down to compare Michigan to RTW and NRTW states. The Forbes Index considers seven variables ranging from business costs and the regulatory environment to the economic climate and a state’s growth prospects. Michigan ranked 47 overall out of 50 with 1 being the highest and 50 being the lowest. RTW states average 17.64 on the Forbes Index while NRTW states measured 31.64 (see Exhibits 92 and 93). A similar analysis was conducted with data from the 2011 CNBC Index of America’s Top States
9
for Business. The ten general variables used by CNBC range from education and infrastructure to cost of living and cost of business. Michigan fared a little better here with an overall rank of 34 out of 50 (50 being least favorable) with RTW states averaging just under 21 and NRTW states averaging 29 (see Exhibits 94 and 95). Michigan fared best on the Beacon Hill Institute’s Competitiveness Index which includes government and fiscal policy, security, infrastructure, human resources, technology, business incubation, openness, and environmental policy factors with a ranking of 25 (1 being most favorable) while RTW states averaged just below than 24 and NRTW states averaged just under 27 (see Exhibits 96 and 97).
The Northwood University Competitiveness Index
Michigan does not fare well in most measures of competitiveness on any of the indices or in the studies mentioned above for happiness, business climate, competitiveness, or economic performance in general. To define the combined effects of the data, roughly 200 variables were examined in this study for all 50 states and a factor analysis was conducted to find five categories or aggregate factors.
Unlike many other indices where the data and/or categories are assigned weights by the researchers, the Northwood Index assigns weights based on factor analysis. The weights are market sensitive since they change with changes in the economic conditions, and the indices are therefore subject to change as the values of the data change over time. Thus, the model delivers an overall ranking for a state, provides evidence of strengths and weaknesses relative to other states by category, and the weights assigned in each category by the model may be useful in prioritizing efforts to improve a state’s relative competiveness.
The Factor Categories and the key variables that influenced each factor are:
Factor 1 (General Macroeconomic Environment) - considers general measures of state-wide economic health such as unemployment rates, labor force participation rates, per-capita income, and life-satisfaction (another measure of well-being in addition to per-capital income).
Factor 2 (State Debt and Taxation) - considers state debt per capita, cost of living, and tax burden per capita (tax burden considers state sales taxes, selective taxes, license taxes, corporate income taxes, and state income taxes).
Factor 3 (Workforce Composition and Cost) – considers % of the working population that is part of a union, % of the private working population that is a member of a union, the % of the public working population that is a member of a union, and cash payments to beneficiaries (including withdrawals of retirement contributions) of employee retirement, unemployment compensation, workers’ compensation, and disability benefit social insurance programs.
10
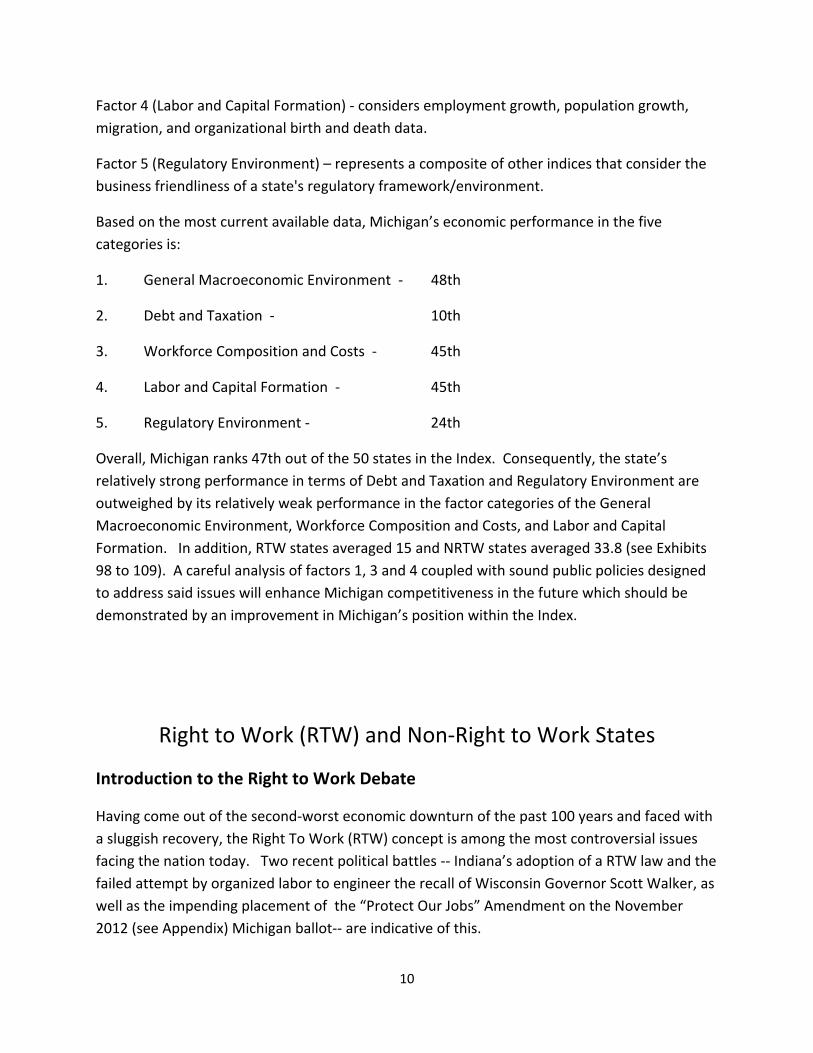
Factor 4 (Labor and Capital Formation) - considers employment growth, population growth, migration, and organizational birth and death data.
Factor 5 (Regulatory Environment) – represents a composite of other indices that consider the business friendliness of a state's regulatory framework/environment.
Based on the most current available data, Michigan’s economic performance in the five categories is:
1. General Macroeconomic Environment - 48th
2. Debt and Taxation - 10th
3. Workforce Composition and Costs - 45th
4. Labor and Capital Formation - 45th
5. Regulatory Environment - 24th
Overall, Michigan ranks 47th out of the 50 states in the Index. Consequently, the state’s relatively strong performance in terms of Debt and Taxation and Regulatory Environment are outweighed by its relatively weak performance in the factor categories of the General Macroeconomic Environment, Workforce Composition and Costs, and Labor and Capital Formation. In addition, RTW states averaged 15 and NRTW states averaged 33.8 (see Exhibits 98 to 109). A careful analysis of factors 1, 3 and 4 coupled with sound public policies designed to address said issues will enhance Michigan competitiveness in the future which should be demonstrated by an improvement in Michigan’s position within the Index.
Right to Work (RTW) and Non-Right to Work States
Introduction to the Right to Work Debate
Having come out of the second-worst economic downturn of the past 100 years and faced with a sluggish recovery, the Right To Work (RTW) concept is among the most controversial issues facing the nation today. Two recent political battles -- Indiana’s adoption of a RTW law and the failed attempt by organized labor to engineer the recall of Wisconsin Governor Scott Walker, as well as the impending placement of the “Protect Our Jobs” Amendment on the November 2012 (see Appendix) Michigan ballot-- are indicative of this.
11
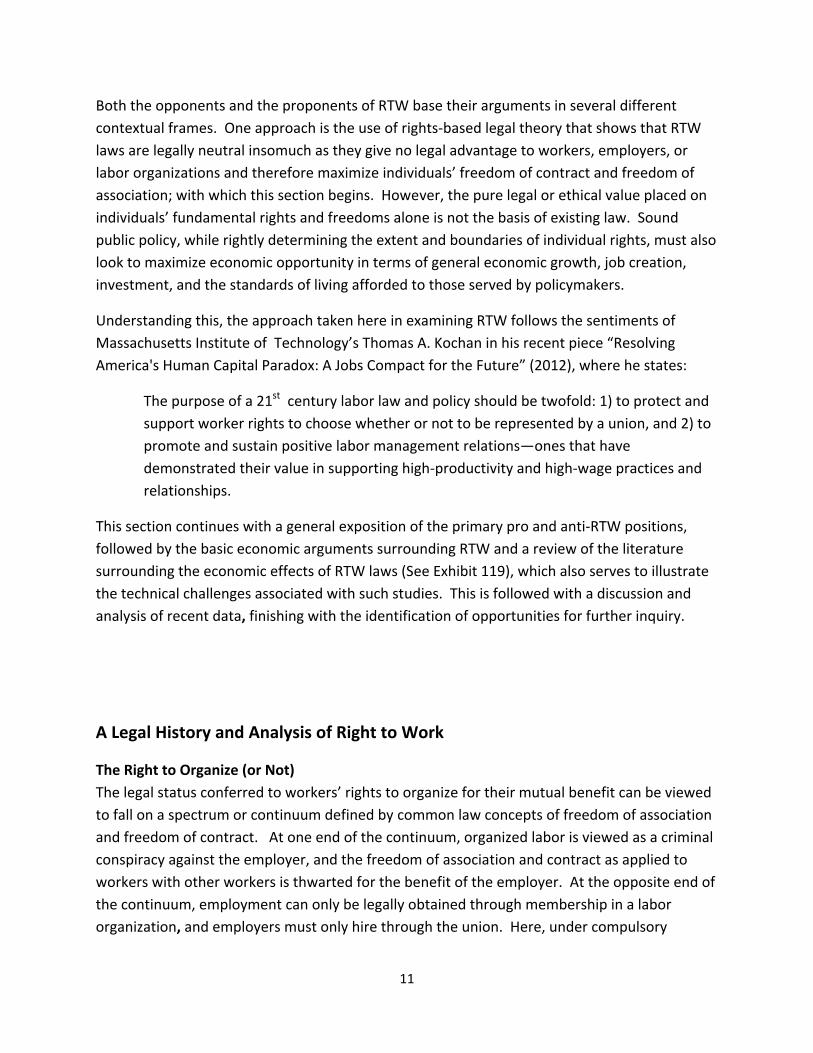
Both the opponents and the proponents of RTW base their arguments in several different contextual frames. One approach is the use of rights-based legal theory that shows that RTW laws are legally neutral insomuch as they give no legal advantage to workers, employers, or labor organizations and therefore maximize individuals’ freedom of contract and freedom of association; with which this section begins. However, the pure legal or ethical value placed on individuals’ fundamental rights and freedoms alone is not the basis of existing law. Sound public policy, while rightly determining the extent and boundaries of individual rights, must also look to maximize economic opportunity in terms of general economic growth, job creation, investment, and the standards of living afforded to those served by policymakers.
Understanding this, the approach taken here in examining RTW follows the sentiments of Massachusetts Institute of Technology’s Thomas A. Kochan in his recent piece “Resolving America's Human Capital Paradox: A Jobs Compact for the Future” (2012), where he states:
The purpose of a 21st century labor law and policy should be twofold: 1) to protect and support worker rights to choose whether or not to be represented by a union, and 2) to promote and sustain positive labor management relations—ones that have demonstrated their value in supporting high-productivity and high-wage practices and relationships.
This section continues with a general exposition of the primary pro and anti-RTW positions, followed by the basic economic arguments surrounding RTW and a review of the literature surrounding the economic effects of RTW laws (See Exhibit 119), which also serves to illustrate the technical challenges associated with such studies. This is followed with a discussion and analysis of recent data, finishing with the identification of opportunities for further inquiry.
A Legal History and Analysis of Right to Work
The Right to Organize (or Not) The legal status conferred to workers’ rights to organize for their mutual benefit can be viewed to fall on a spectrum or continuum defined by common law concepts of freedom of association and freedom of contract. At one end of the continuum, organized labor is viewed as a criminal conspiracy against the employer, and the freedom of association and contract as applied to workers with other workers is thwarted for the benefit of the employer. At the opposite end of the continuum, employment can only be legally obtained through membership in a labor organization, and employers must only hire through the union. Here, under compulsory
12
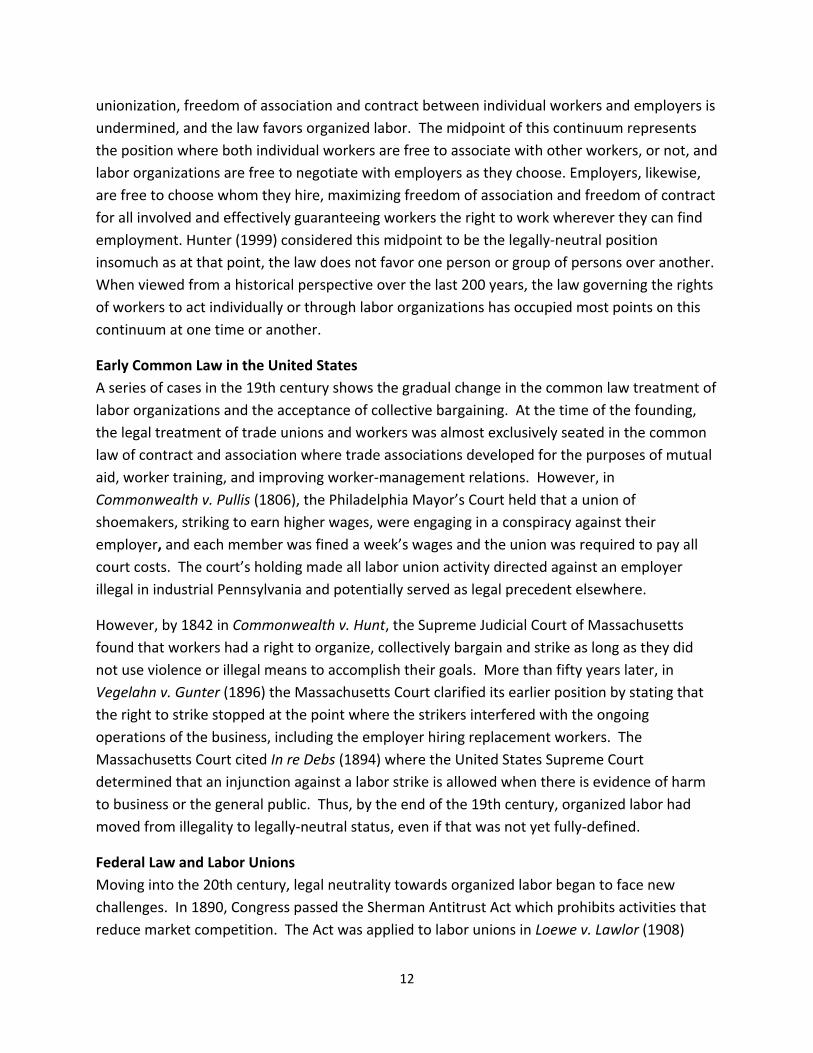
unionization, freedom of association and contract between individual workers and employers is undermined, and the law favors organized labor. The midpoint of this continuum represents the position where both individual workers are free to associate with other workers, or not, and labor organizations are free to negotiate with employers as they choose. Employers, likewise, are free to choose whom they hire, maximizing freedom of association and freedom of contract for all involved and effectively guaranteeing workers the right to work wherever they can find employment. Hunter (1999) considered this midpoint to be the legally-neutral position insomuch as at that point, the law does not favor one person or group of persons over another. When viewed from a historical perspective over the last 200 years, the law governing the rights of workers to act individually or through labor organizations has occupied most points on this continuum at one time or another.
Early Common Law in the United States A series of cases in the 19th century shows the gradual change in the common law treatment of labor organizations and the acceptance of collective bargaining. At the time of the founding, the legal treatment of trade unions and workers was almost exclusively seated in the common law of contract and association where trade associations developed for the purposes of mutual aid, worker training, and improving worker-management relations. However, in Commonwealth v. Pullis (1806), the Philadelphia Mayor’s Court held that a union of shoemakers, striking to earn higher wages, were engaging in a conspiracy against their employer, and each member was fined a week’s wages and the union was required to pay all court costs. The court’s holding made all labor union activity directed against an employer illegal in industrial Pennsylvania and potentially served as legal precedent elsewhere.
However, by 1842 in Commonwealth v. Hunt, the Supreme Judicial Court of Massachusetts found that workers had a right to organize, collectively bargain and strike as long as they did not use violence or illegal means to accomplish their goals. More than fifty years later, in Vegelahn v. Gunter (1896) the Massachusetts Court clarified its earlier position by stating that the right to strike stopped at the point where the strikers interfered with the ongoing operations of the business, including the employer hiring replacement workers. The Massachusetts Court cited In re Debs (1894) where the United States Supreme Court determined that an injunction against a labor strike is allowed when there is evidence of harm to business or the general public. Thus, by the end of the 19th century, organized labor had moved from illegality to legally-neutral status, even if that was not yet fully-defined.
Federal Law and Labor Unions Moving into the 20th century, legal neutrality towards organized labor began to face new challenges. In 1890, Congress passed the Sherman Antitrust Act which prohibits activities that reduce market competition. The Act was applied to labor unions in Loewe v. Lawlor (1908)
13
where the United States Supreme Court found that union strikes, boycotts and secondary boycotts (of suppliers or customers) were illegal if they interfered with interstate commerce by limiting competition. The court also found that individual union members could be charged under the Act if it could be shown they had engaged in conspiracy to cause such interference.
In response to the Loewe decision, labor unions successfully lobbied Congress to exempt union activities from the Sherman Act through passage of the Clayton Act in 1914. While further defining additional illegal activities in restraint of trade, Section 6 of the Clayton Act allows labor unions the right to boycott, peacefully strike and picket, and engage in collective bargaining regardless of any effect on interstate commerce. In subsequent cases the Supreme Court further clarified the extent to which Section 6 of the Clayton Act protected organized labor activities.
In 1921, the Supreme Court heard the case of Duplex Printing Press Co. v. Deering. In this case, the Court found that even under Section 6, secondary boycotts and other activities directed towards a company with which the union was not directly concerned were in violation of the Sherman Act. A year later, the Court expanded this ruling to apply to union activities directed at non-union companies in the same industry in United Mine Workers v. Coronado Coal (1922).
In addition to these adjustments to the legal standing of organized labor, federal rules surrounding collective bargaining began to take shape. During the First World War, President Woodrow Wilson created the National War Labor Board to direct various national resources to the war effort. The general principle followed by the Board was that in exchange for giving up the right to strike, unions would be guaranteed the right to good-faith collective bargaining with employers through “arbitration, mediation, and conciliation” providing a mechanism to mend labor-management disputes that might have otherwise interfered with war production.
After the Sherman and Clayton Acts, their interpretation by the Supreme Court, and moving towards the Great Depression and the New Deal, the legal status of labor unions remained largely in the position of legal neutrality. Individuals and unions both had the right to seek work from employers and employers retained the right to deal with unions or not. Unions were not only allowed but guaranteed the right to collectively bargain under certain circumstances and to recruit new members as long as these activities did not interfere with individual choice or restrain trade.
The only exceptions to unions’ general legal status heading into the New Deal were the railroad workers’ unions. As early as the Erdman Act of 1898, Congress created the means for the railroads and the railroad workers’ unions to settle labor disputes without interruption to rail services, which were seen as vital to the functioning of the economy. The Erdman Act allowed voluntary but binding arbitration, enforceable in federal court. Moreover, in 1920 Congress
14
passed the Esch–Cummins Act, (otherwise known as the Railroad Transportation Act), establishing the Railroad Labor Board which in turn granted railroad unions exclusive representation in labor disputes and disallowed individuals’ rights to negotiate for themselves. However, in Davis v. Wechsler (1923), the Supreme Court held that it was unconstitutional to deny individuals the right to negotiate with the railroads independently from the union.
In 1926 in response to the Davis decision, Congress passed the Railway Labor Act. The Act explicitly granted workers the right to organize and created for the railroad companies a legal “duty to bargain” with railroad unions. The Act was amended to include airlines in 1936. In 1951, the Act was once again amended to permit compulsory unionization, making it illegal for a railroad or airline to hire outside the labor unions representing their workers. These provisions are still in effect today. These amendments notwithstanding, the “new” requirements under the Railway Labor Act would set the stage for additional federal regulation regarding the rights of unions moving into the Great Depression.
In 1932, President Herbert Hoover signed the Norris-LaGuardia Act. In general, the Act limited the legal power of employers over labor unions as opposed to directly empowering unions. It prohibited the creation of worker agreements to refrain from future union membership (so-called “yellow-dog contracts”) and it disallowed such agreements already in existence from being entered into the record in a federal case. It also exempted unions from potential violations of antitrust law under the Sherman Act. The Act furthermore prohibited employers from filing private damage suits arising from or injunctions against striking labor unions.
A year later, the National Industrial Recovery Act (NIRA) was signed into law by President Franklin Roosevelt. NIRA was intended as a general plan to promote economic recovery and only a small part of it, Title I, Section 7(a) applied directly to labor unions. That section gave all workers statutory rights to organize labor unions and bargain collectively. In Schechter Poultry Corp. v. United States (1935), the Supreme Court found NIRA unconstitutional on the grounds that Title I was vague in its construction and delegated overbroad authority to the executive branch, but the language in Title I, Section 7(a) was never specifically cited in the Court’s opinion, leaving the labor issue open for further legislation.
The Wagner Act The basis of all modern federal law regarding the legal status of organized labor in the private sector is the National Labor Relations Act, often referred to as the NLRA or Wagner Act. The Act was passed by Congress and signed into law by President Roosevelt in early July 1935, roughly six weeks after the Court’s decision in Schechter. The NLRA created legal rights and obligations for both employers and unions. For employers it became an “unfair labor practice” to fail to “bargain in good faith,” or to interfere with 1) workers organizing into labor unions, 2)
15
workers engaging in collective bargaining through labor unions, and 3) concerted labor activities such as striking and picketing.
For unions, the NLRA established a process for workers to adopt membership in a particular union. If a majority of workers voted in favor of union representation, the elected union was allowed to establish one of three different worker-union relationships. The first, referred to as a “closed shop,” required workers to be a member of the union prior to employment. Second, unions could establish a “union shop” by allowing companies to hire non-union members, but requiring those workers to join the union within some set time following their hiring. Third, the union could declare itself an “agency shop” where union membership is not required but where all workers are required to pay dues for all union activities through which they receive benefit. In addition, a new federal agency, the National Labor Relations Board (NLRB), was created to oversee the enactment of the NLRA and enforce its various provisions.
As a result (with the single exception of the railroad industry), the common-law based legal foundation of business-labor relations that had emerged through the common law over one hundred years was largely discarded. By allowing unions to operate closed shops, union membership could become compulsory, employees could be denied access to jobs and employers would have no opportunity to contract with workers of their own choosing.
The Taft-Hartley Act The NLRA operated as the law of the land from its passage until after World War II. In 1947, Congress enacted the Labor-Management Relations Act (commonly known as the Taft-Hartley Act), by overriding President Harry S. Truman’s veto. The goal of the Act was to amend the NLRA to reduce the degree of power afforded labor unions by re-establishing legal rights of individual workers and mandating administrative changes within the NLRB. The major provisions the Taft-Hartley amendments were nearly as broad if not as deep as the NLRA itself.
First, Taft-Hartley recognizes the right of individual workers to refrain from union activities. Second, the Act adds prohibitions on unfair union labor practices and further defines requirements for both unions and businesses in collective bargaining. Third, it specifically prohibits coercive conduct against neutral persons in certain circumstances such as disputes among two or more unions at a workplace regarding work assignments, and prescribes standards for injunctive relief in such circumstances. Fourth, the Act allows both labor and management to file suit for breach of a labor contract. Fifth, it eliminates the closed-shop option for union organization but still allows for union and agency shop arrangements.
Last, and most importantly, section 14 (b) of the Taft-Hartley Act states that the act “shall not be construed as authorizing the execution or application of agreements requiring membership
16
in a labor organization as a condition of employment in any State or Territory in which such execution or application is prohibited by State or Territorial law.”
The language of section 14(b) allows the individual states to “opt out” of the union shop requirements of the NLRA, effectively making the agency shop structure the only legal method of union organization within those states. In opting out, and disallowing a union membership requirement for purposes of employment, several states took the opportunity to re-establish the legal neutrality and maximum freedom of association and contract that have become known as the “right to work.”
The Right to Work States In 1944, three years prior to the passage of the Taft-Hartley Act, Florida and Arkansas established right to work provisions in their state constitutions, expressly forbidding employers from hiring workers based on their status as a member or non-member of a labor union, even though these provisions were contrary to existing federal law under the Wagner Act. In 1946, three states, Arizona, Nebraska, and South Dakota, adopted similar constitutional provisions. Both before and after passage of Taft –Hartley in 1947, the legislatures of six additional states-- Georgia, Iowa, North Carolina, Texas, Tennessee and Virginia--enacted right to work statutes.
Various organized labor groups in Arizona, Nebraska and North Carolina challenged the state laws almost immediately upon passage in their respective state courts where they were all upheld. The state cases from Nebraska and North Carolina reached the United States Supreme Court on appeal in late 1948 in Lincoln Federal Labor Union v. Northwestern Iron & Metal Co. where the Court held that state laws can forbid union membership as a requirement for employment when they create equal rights to employment for both union and non-union workers.
Since 1947, twelve additional states have enacted right to work laws either through statute, constitutional amendment in the case of Oklahoma and Kansas, or in the case of Mississippi, first by statue and later by constitutional amendment. Chronologically, they are: North Dakota (1948), Nevada (1952), Alabama (1953), South Carolina (1954), Mississippi (1954, 1960), Utah (1955), Kansas (1958), Wyoming (1963), Louisiana (1976), Idaho (1985), Oklahoma (2001), and most recently, Indiana (2012). In addition to these states, the Territory of Guam adopted right to work legislation in 2001.
Indiana is the only state to have had right to work legislation implemented and then repealed. As summarized by Vedder, et al. (2011), the state originally passed right to work legislation in 1957, but in the time between its enactment and when it was scheduled to go into effect, several unions negotiated contract extensions that would be honored under the law until they expired. Union leaders then brought suit against the state, arguing that agency shop contracts
17
that charged workers dues but that did not require union membership were permitted under state law. In 1959 the Indiana Court of Appeals ruled in favor of the unions in Meade Electric Co. v. Hagberg. This decision ostensibly resulted in no greater employment opportunity for individual workers under the law than under a union shop setting, and as a consequence the law was repealed in 1965.
The Right to Work in Michigan Michigan workers played a central role in the development of labor unions in the interwar period and have held a position of power in the state since the 1940s. It has only been in the face of a weakened economy and job losses in the automobile industry that right to work legislation under the provisions of section 14(b) of Taft-Hartley has been considered.
On March 13, 2007, Representative Jacob Hoogendyk, et al., introduced House Bill 4457 “The right work law”(see Exhibit 117), described in its preamble as:
A bill to prohibit employers from placing certain conditions on employment; to grant rights to employees; to impose duties and responsibilities on certain state and local officers; to make certain agreements unlawful; and to provide remedies and penalties.
Upon introduction the bill was referred to the House Committee on Labor, where it was never opened for comment or discussion. Senate Bill 0607 (2007) with identical language was introduced by Senator Nancy Cassis and assigned to the Senate Committee on Commerce and Tourism on June 26, 2007. This Committee also failed to take up the bill for discussion. On December 2, 2008, the bill was dismissed on an adverse roll call vote, maintaining the status quo with Michigan workers and employers continuing to abide by the union-shop provisions of the Wagner Act.
More recently, organized labor has promoted a ballot initiative known as the “Protect Our Jobs” amendment to the Michigan Constitution for November 2012 election (see Exhibit 118). The amendment as currently written would establish a Constitutional right for both private and public workers to organize, forgo binding arbitration for the settlement of disputes with management, and bargain to have their dues withheld and submitted to their union by their employer. The language of the amendment would apply retroactively. Critics of the amendment claim that its enactment would affect between 80 and 120 current laws, most of which would need to be reevaluated in the courts, prompting a spate of lawsuits. The State Board of Canvassers declined to put the proposal on the November ballot primarily because it believed that the ballot language needed to discuss this impact on existing laws. Supporters of the proposal challenged the Board, and on August 27, 2012 the Michigan Court of Appeals decided that this was not a requirement for a valid ballot initiative. Upon review, the Michigan Supreme Court agreed with Court of Appeals on September 6, 2012.
18
Review of the Economic Literature on Right to Work
As outlined in the previous section, an underlying and fundamental principle in the American political and economic system is the idea of freedom of association. Individuals should have the personal liberty to freely associate with any other members of society for lawful and commonly shared goals, purposes, and activities. This principle also implies the opposite: that individuals may not be compelled or coerced into joining or participating in any association without their voluntary consent. The underlying premise of a free society is the right of individuals to say, “No,” whether this involves joining a church, entering into a contract, participating in any social club or group, or membership in a labor union (Baird, 1988). Broadly, the arguments against an individual employee’s right to work without membership in a union have been of three general types: First, only unified union membership can protect all workers against the superior bargaining power of the employer; Second, only compulsory membership can protect other workers from the “unfair” competition of non-union members that may result in the wages of all workers in that industry being pushed below their “fair market value”; and third, only mandatory union membership (and dues paying) prevents non-union members from a “free ride” at the expense of union workers in a company or industry. The Superior Bargaining Power of the Employer The inferior position of the individual worker is claimed to be due to a number of factors. First, it is argued that the individual worker must accept the wage offered by the employer, since if she or he does not accept it, there are always many other workers looking for jobs ready to take that place. This ignores the fact that competition is two-sided in virtually every modern, developed market, and especially in a country like the United States. Any employer who fails to offer a wage tending to reflect the anticipated value that the worker contributes to a company’s profitability runs the risk that the potential employee with useful and productive skills will search out alternative employment where those skills are more highly valued by another employer wishing to get ahead of the competition. The same applies to currently employed workers who, if they believe that they are not receiving a wage commensurate with their actual market value, will see the advantage of changing employers in the same or a related market. This forces any employer attempting to “low ball” workers to raise the wage offers, or run the risk of losing a growing number of qualified workers without whom she or he may not be able to retain the market position relative to his or her rivals.
19
Another argument claims that the individual worker has an inferior bargaining position because the individual worker cannot “wait” to look for a better job. First, if the worker does not earn wages she or he cannot eat. The employer can wait to find a worker willing to take any salary she or he wishes to offer because, she or he has “capital” to live off until such a worker comes along who will accept the lower wage the employer wishes to pay. Second, it is stated that labor is a perishable “commodity.” It cannot be “stored” to sell on another day. So if the worker does not take the wage offered that lost day’s labor can never be regained. However, there are limits to any such claimed “waiting” advantage on the part of the employer. First, every day of less output produced because needed workers are not yet hired is a day with lost sales revenues resulting from reduced output that could have been produced and sold on the market. Thus, waiting to find workers who might be willing to accept wages less than their real market value imposes a cost on the employer in the form of smaller profits and less market share that could have been acquired, if a wage more in line with workers’ worth was offered and accepted. Second, financial capital may be “stored” rather than invested in hiring workers and producing output. It can be held as cash or loaned out (short-term) for some interest return. However, delaying the hiring of workers who would otherwise have gladly worked at reasonable market-valued wages results in prospective employers earning neither profit nor interest if a part of his or her financial capital is held as cash. And even if lent out to earn short-term interest, the potential employer loses every day the difference between the interest s/he may earn and the greater profits that could have been had by not delaying hiring needed workers for production that could have been manufactured and sold (Hutt, 1954; 1973, pp. 61-76; Machlup, 1952, pp. 348-352; Chamberlin, 1951, pp. 168-187).
Unions Protect Wages from Unfair Non-Union Competition It is argued that unions are able to collectively negotiate wages above what individual workers were individually could negotiate on their own. If non-union workers could compete for union jobs, those union-secured, higher wages would be competed down. Thus, all workers will be better off if required to join and jointly negotiate through the representing union. Labor, however, like every other good or service offered on the market, is subject to the law of supply and demand. If a union successfully negotiates a wage above the one that would have been competitively established on the market, fewer workers may be employed, since the higher the wage the less profitable the number of workers potential employers find it attractive to hire (or retain). In other words, wages that compulsory unions may successfully impose runs the risk of pricing some workers out of the labor market (Velasco, 1973).
20
In this instance, the “conflict” is not between “labor” and “management,” but instead between union workers and non-union workers. The union “locks out” members of the labor force who would have been willing to work for prospective employers on terms mutually attractive to the two sides. This forces the locked out and displaced workers to search out alternative gainful employment in jobs and with employers who may be less well paying and not as attractive. The union members’ gains are, as a consequence, at the expense of other workers, who must find employment in other markets. As non-union workers fill these other markets, wages in that alternative part of the labor market fall below what would have prevailed if the all the jobs had been available to all the workers. This process can and often does entail workers having to migrate out of the state where they had previously found work, or where they would have chosen to reside, if not for compulsory union membership rules pushing non-union workers out of that part of the labor market, and that part of the country in which “closed shop” conditions prevail (Hayek, 1960, pp. 267-284; Knight, 1959, pp. 21-45).
The Need for Union Membership to Avoid Non-Union Free Riders It has been argued that the higher wages and better working conditions negotiated by a labor union benefit not only the union members but all other workers in the company or industry who are covered by the union terms of employment. If non-union members are able to benefit from the “positive” results of union activities, it is only reasonable that they should be required to bear a part of the costs of obtaining those favorable work conditions and wages. Thus, non-union workers should, if not required to join the union, to be at least obligated to pay union dues to assist in defraying the organizational and related expenses to provide those benefits. At the same time, the potential for “free riding” reduces the incentive to belong to a union, and thus may result in fewer union members and weaker unions unable to effectively negotiate on behalf of workers’ interest (Ickniowski and Zax, 1991). The free rider problem can only arise when the gains from the actions of some cannot be prevented from benefiting others who have not participated in covering the costs that have generated those “positive” results. However, excludability is possible in the case of union-generated wages or work conditions by simply stipulating in the negotiated union contract that the terms of that contract apply only to union members. If non-union workers are unable to obtain from the employers wages and work conditions equal to or better than those arranged by the union, that will act as a positive incentive for non-union employees to join the union. If, however, non-union employees are able to negotiate for themselves wages and work conditions not much different from (or even superior to) those
21
covered by the union contract, it would demonstrate clearly that union membership and dues are superfluous (Baird, p. 37).
In addition to the economic considerations raised by organized labor, a number of arguments have been offered in support of Right-to-Work Laws, among them: the case for personal freedom; the gains from competition; the benefits from labor mobility and workplace flexibility; and the efficient use of scarce resources for improved productivity. The Case for Personal Freedom The hallmark of a free society is the extent to which the individual has the liberty to make decisions guiding his or her own life, including the occupation or profession she or he chooses to follow to earn a living and that gives meaning and enjoyment to his or her daily activities. By definition then, union shops exclude workers who would otherwise find gainful employment on the basis of free and voluntary contract between themselves and willing employers. This is a restraint not only on trade in general, but a restriction on the personal freedom of workers to enter into consensual association with others for peaceful and lawful mutual benefit. The same applies to compulsory payment of union dues as a “tribute” to a union for the right to work for a particular employer or in a specific industry. Indeed, it can be argued that it is a form of imposed tax for the privilege of working within the “jurisdiction” over which the union claims authority (Richberg, 1957, pp. 114- 126).
The Gains from Labor Market Competition “Closed shops” have historically had one essential goal, anti-competitive and monopoly restriction on segments of the labor market (Simons, 1944, pp. 121-159). The purpose is to limit the supply in various occupations, professions, and trades as a means to raise the price of labor above the levels at which the free interactions of market supply and demand would have set wages. Companies or cartels that attempt to act monopolistically bear the cost of leaving a portion of their capital and equipment idle precisely to withhold potential output with the hope of deriving higher profits by selling less output at a higher price. They must weigh the cost of underutilized plant and equipment relative to the higher price with the decreased output. Compulsory unions, however, restrict entry into their market to reduce the supply and raise the price of labor – wages – but bear no such cost. Their responsibility and “costs” extend no further than a weighing of the advantages and disadvantages to the workers who remain employed under the union wage and work condition rules negotiated on the basis of collective bargaining. Those workers priced out of employment in the closed shop are no longer voting or dues-paying members, and therefore no longer of an element in the union leadership’s decision-making. The burden of the compulsory union’s actions, therefore, falls on the
22
shoulders of the excluded workers. They bear a cost they had not bargained for or agreed to. Thus, the unemployment or less valued employment that these displaced workers now face exists as a cost that these unions impose on others without their agreement or consent. Right-to-Work Laws therefore may serve to reduce the unions’ anti-competitive and potentially monopolist practices in the labor market. The number of workers employed in an industry, occupation and trade reflects the consumer demand for the products workers can produce. As long as the value of the product is greater than workers’ opportunity costs of being employed in some other way of earning a living, the supply of workers will increase, the output of the desired goods and services will expand in supply and the prices at which those goods are offered to consumers on the market will decline. The Benefits from Labor Mobility and Workplace Flexibility Compulsory unionism and the closed shop tend to reduce and limit labor mobility between industries and regions of the country. Competitive markets normally experience constant change requiring continual adjustment and adaptation to new circumstances. Consumer demands change, resource availabilities are modified, and capital investments shift from one line of production to another and technological innovations transform how and where goods and services can be profitably supplied and in what amounts. Some union restrictions inhibit the required adaptations and adjustments that must constantly be undertaken in different ways and different places if markets are to be continuously moving in the direction of sustainable balance and stability. Under Right-to-Work Laws, workers and employers have the flexibility and openness to find the “right” patterns of worker employment, to perform the tasks and types of work in and between industries that the shifting conditions of market supply and demand suggest are the most profitable and advantageous for both employees and employers. This also means that more flexible labor markets, like those where Right-to-Work Laws are present, are likely to offer the flexibility and profitableness to attract more industry into regions and states, allowing more adaptive labor markets to effectively function. At the same time, a more competitive labor market also is likely to attract qualified and energetic workers from other areas who are looking for more attractive and gainful employment.
More Efficient and Productive labor Right-to-Work environments enable labor and other resources and capital to be better allocated and employed where business judgments suggest it should in a world that is always changing and therefore contains an irreducible amount of uncertainty and risk. This is not to
23
infer that managers never get it “wrong” or workers never have second thoughts about jobs they’ve taken. It is rather that given the inescapable fact that some decisions will always turn out to be wrong, labor markets, as well as all other resource and capital markets, must have the greatest potential to readjust and transform what, how, and where production is undertaken and which job opportunities exist. It has become a cliché to say that America now exists in a far more competitive, global economy. It is nonetheless very true. Any state such as Michigan that wishes to meet this challenge, not only by retaining businesses and jobs within this part of the country, but also wants to attract new investment and an expanding workforce, needs to offer businesspeople and workers the type of economic environment that makes that state a magnet.
In spite of the impressions sometimes created, Right-to-Work Laws are not “anti-labor” or “anti-union.” The theoretical literature simply suggests that worker opportunities for the greatest number of people in a place such as Michigan and the country as a whole are most likely to be present in an “open shop” market-setting, rather than in labor markets that are “closed.” The flexibility and adaptability in labor markets that come with “Right-to-Work” legislation can serve as an important aspect of a policy focused on job maintenance and job creation, when combined with other policy reforms in the wider setting of fiscal and regulatory policy in the state of Michigan. Determining the Cause and Effect of Right to Work Laws Revisiting the case made by organized labor and applying simple economics (supply and demand analysis), it is clear that “Right to Work” laws make it more expensive for unions to provide its services to members because of the free-rider problem. In terms of demand and supply of union services, this reduces the supply of union services, thereby increasing the price of union services and reducing the quantity of union services. It is also true that very often RTW legislation passes in states where the support for unions is very thin. So in most RTW states, public attitudes towards unions are likely already very low, and this is reflected by a reduction in the demand for union services. This reduction in the demand for union services also results in reducing the quantity of union services being offered to the labor market.
Thus the following key question must be answered correctly to ascertain the true effects of the RTW legislation: Is the level of unionization lower in RTW states because of the passage of the law or because of the negative attitude citizens of that state have about unions? This is precisely why it is difficult to assess the economic effects of RTW legislation. Specifically, the inability to control for many systematic observed and unobserved differences across states makes it very difficult to assess the economic effects of RTW legislation as compared to other relevant state characteristics. Since RTW states are often unsupportive of unions and are
24
considered to be “business friendly,” they have a lower corporate tax rate, lower regulations, less absenteeism, and sometimes higher subsidies for businesses. Thus the beneficial effects of RTW on employment and wages could also be the effects of those pro-business policies. In that case RTW is just symptomatic of the pro-business attributes of the state. In the absence of an effective control for these across-state differences, any empirical analysis might lead to spurious and unreliable estimates.
Therefore, determining the effects of the RTW legislation on wages, employment and location decisions of businesses is crucially dependent on the nature and type of controls that are applied in different studies. It must be recognized that a whole range of variables may contribute to differences in employment and wages across states and regions. What specifically can be attributed solely to RTW depends on how successful the studies are in controlling these other factors. There is a need to treat descriptive comparisons based on raw numbers with skepticism because there are many observed and unobserved factors that influence those numbers.
In all the papers dealing with the effects of RTW legislation, four central questions have emerged as important:
1. Does RTW legislation inhibit union growth? 2. Does RTW legislation inhibit union bargaining strength? 3. Does RTW legislation drive location decisions of businesses? 4. Does RTW legislation impact employment, wage and growth in Gross State Product
(GSP)?
Meyers (1959) argued that RTW proposals are of much less importance than either side to the controversy has been willing to admit. This issue is a symbolic one. He argued that “what is at stake is the political power and public support of management and unions.” Meyers argued that RTW itself had very minor effects on union growth or union power. Kuhn (1961) concluded that RTW did inhibit union growth. Barkin (1961) also concluded that RTW provided legal confirmation to anti- union movement. It contributed to decline in union membership and also weakened bargaining power of existing unions. Marshall (1963) concluded that the only impact of RTW was political. It showed the political weakness of the union. Shister (1968), on the other hand, concluded that RTW did inhibit both union growth and union bargaining power, but its impact on union growth was substantially higher than its impact on union bargaining power.
A comprehensive model trying to analyze the effects of “Right To Work” Legislation was developed by Ashenfelter and Pancavel (1969) and Pancavel (1971). They developed a formal model of Demand and Supply of union services to explain three competing hypotheses about the effects of RTW legislation on union membership and bargaining rights of unions. Three
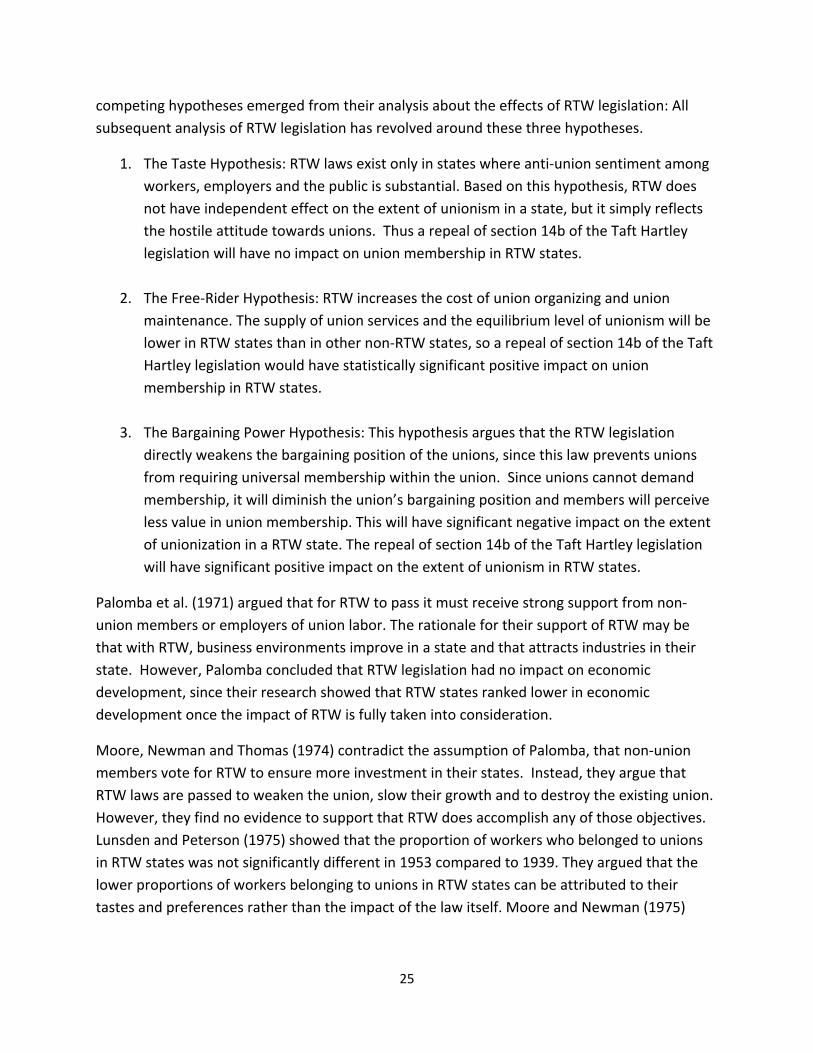
25
competing hypotheses emerged from their analysis about the effects of RTW legislation: All subsequent analysis of RTW legislation has revolved around these three hypotheses.
1. The Taste Hypothesis: RTW laws exist only in states where anti-union sentiment among workers, employers and the public is substantial. Based on this hypothesis, RTW does not have independent effect on the extent of unionism in a state, but it simply reflects the hostile attitude towards unions. Thus a repeal of section 14b of the Taft Hartley legislation will have no impact on union membership in RTW states.
2. The Free-Rider Hypothesis: RTW increases the cost of union organizing and union maintenance. The supply of union services and the equilibrium level of unionism will be lower in RTW states than in other non-RTW states, so a repeal of section 14b of the Taft Hartley legislation would have statistically significant positive impact on union membership in RTW states.
3. The Bargaining Power Hypothesis: This hypothesis argues that the RTW legislation directly weakens the bargaining position of the unions, since this law prevents unions from requiring universal membership within the union. Since unions cannot demand membership, it will diminish the union’s bargaining position and members will perceive less value in union membership. This will have significant negative impact on the extent of unionization in a RTW state. The repeal of section 14b of the Taft Hartley legislation will have significant positive impact on the extent of unionism in RTW states.
Palomba et al. (1971) argued that for RTW to pass it must receive strong support from non-union members or employers of union labor. The rationale for their support of RTW may be that with RTW, business environments improve in a state and that attracts industries in their state. However, Palomba concluded that RTW legislation had no impact on economic development, since their research showed that RTW states ranked lower in economic development once the impact of RTW is fully taken into consideration.
Moore, Newman and Thomas (1974) contradict the assumption of Palomba, that non-union members vote for RTW to ensure more investment in their states. Instead, they argue that RTW laws are passed to weaken the union, slow their growth and to destroy the existing union. However, they find no evidence to support that RTW does accomplish any of those objectives. Lunsden and Peterson (1975) showed that the proportion of workers who belonged to unions in RTW states was not significantly different in 1953 compared to 1939. They argued that the lower proportions of workers belonging to unions in RTW states can be attributed to their tastes and preferences rather than the impact of the law itself. Moore and Newman (1975)
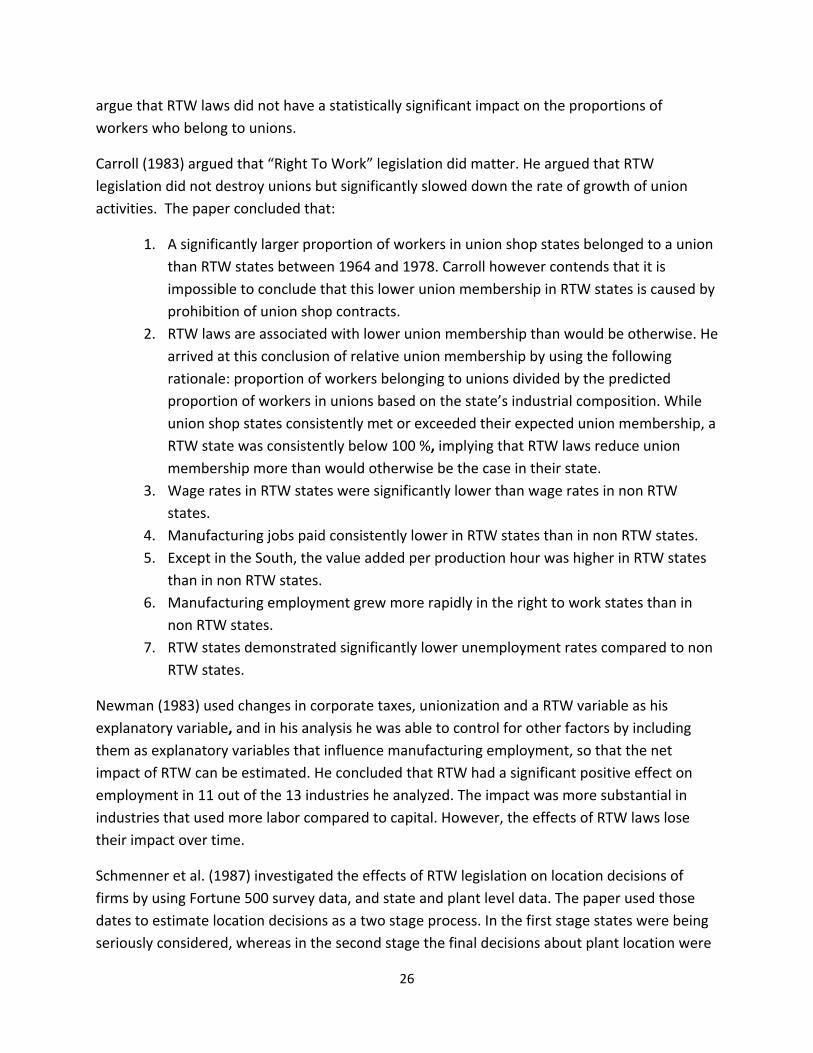
26
argue that RTW laws did not have a statistically significant impact on the proportions of workers who belong to unions.
Carroll (1983) argued that “Right To Work” legislation did matter. He argued that RTW legislation did not destroy unions but significantly slowed down the rate of growth of union activities. The paper concluded that:
1. A significantly larger proportion of workers in union shop states belonged to a union than RTW states between 1964 and 1978. Carroll however contends that it is impossible to conclude that this lower union membership in RTW states is caused by prohibition of union shop contracts.
2. RTW laws are associated with lower union membership than would be otherwise. He arrived at this conclusion of relative union membership by using the following rationale: proportion of workers belonging to unions divided by the predicted proportion of workers in unions based on the state’s industrial composition. While union shop states consistently met or exceeded their expected union membership, a RTW state was consistently below 100 %, implying that RTW laws reduce union membership more than would otherwise be the case in their state.
3. Wage rates in RTW states were significantly lower than wage rates in non RTW states.
4. Manufacturing jobs paid consistently lower in RTW states than in non RTW states. 5. Except in the South, the value added per production hour was higher in RTW states
than in non RTW states. 6. Manufacturing employment grew more rapidly in the right to work states than in
non RTW states. 7. RTW states demonstrated significantly lower unemployment rates compared to non
RTW states.
Newman (1983) used changes in corporate taxes, unionization and a RTW variable as his explanatory variable, and in his analysis he was able to control for other factors by including them as explanatory variables that influence manufacturing employment, so that the net impact of RTW can be estimated. He concluded that RTW had a significant positive effect on employment in 11 out of the 13 industries he analyzed. The impact was more substantial in industries that used more labor compared to capital. However, the effects of RTW laws lose their impact over time.
Schmenner et al. (1987) investigated the effects of RTW legislation on location decisions of firms by using Fortune 500 survey data, and state and plant level data. The paper used those dates to estimate location decisions as a two stage process. In the first stage states were being seriously considered, whereas in the second stage the final decisions about plant location were
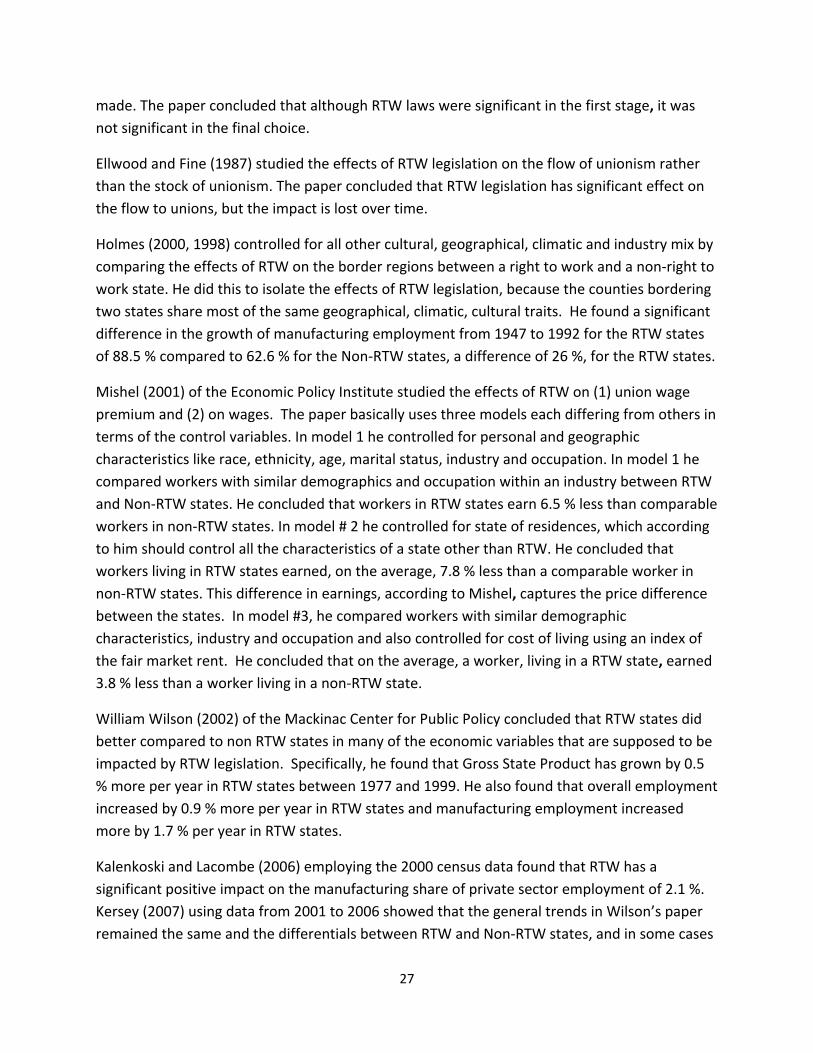
27
made. The paper concluded that although RTW laws were significant in the first stage, it was not significant in the final choice.
Ellwood and Fine (1987) studied the effects of RTW legislation on the flow of unionism rather than the stock of unionism. The paper concluded that RTW legislation has significant effect on the flow to unions, but the impact is lost over time.
Holmes (2000, 1998) controlled for all other cultural, geographical, climatic and industry mix by comparing the effects of RTW on the border regions between a right to work and a non-right to work state. He did this to isolate the effects of RTW legislation, because the counties bordering two states share most of the same geographical, climatic, cultural traits. He found a significant difference in the growth of manufacturing employment from 1947 to 1992 for the RTW states of 88.5 % compared to 62.6 % for the Non-RTW states, a difference of 26 %, for the RTW states.
Mishel (2001) of the Economic Policy Institute studied the effects of RTW on (1) union wage premium and (2) on wages. The paper basically uses three models each differing from others in terms of the control variables. In model 1 he controlled for personal and geographic characteristics like race, ethnicity, age, marital status, industry and occupation. In model 1 he compared workers with similar demographics and occupation within an industry between RTW and Non-RTW states. He concluded that workers in RTW states earn 6.5 % less than comparable workers in non-RTW states. In model # 2 he controlled for state of residences, which according to him should control all the characteristics of a state other than RTW. He concluded that workers living in RTW states earned, on the average, 7.8 % less than a comparable worker in non-RTW states. This difference in earnings, according to Mishel, captures the price difference between the states. In model #3, he compared workers with similar demographic characteristics, industry and occupation and also controlled for cost of living using an index of the fair market rent. He concluded that on the average, a worker, living in a RTW state, earned 3.8 % less than a worker living in a non-RTW state.
William Wilson (2002) of the Mackinac Center for Public Policy concluded that RTW states did better compared to non RTW states in many of the economic variables that are supposed to be impacted by RTW legislation. Specifically, he found that Gross State Product has grown by 0.5 % more per year in RTW states between 1977 and 1999. He also found that overall employment increased by 0.9 % more per year in RTW states and manufacturing employment increased more by 1.7 % per year in RTW states.
Kalenkoski and Lacombe (2006) employing the 2000 census data found that RTW has a significant positive impact on the manufacturing share of private sector employment of 2.1 %. Kersey (2007) using data from 2001 to 2006 showed that the general trends in Wilson’s paper remained the same and the differentials between RTW and Non-RTW states, and in some cases
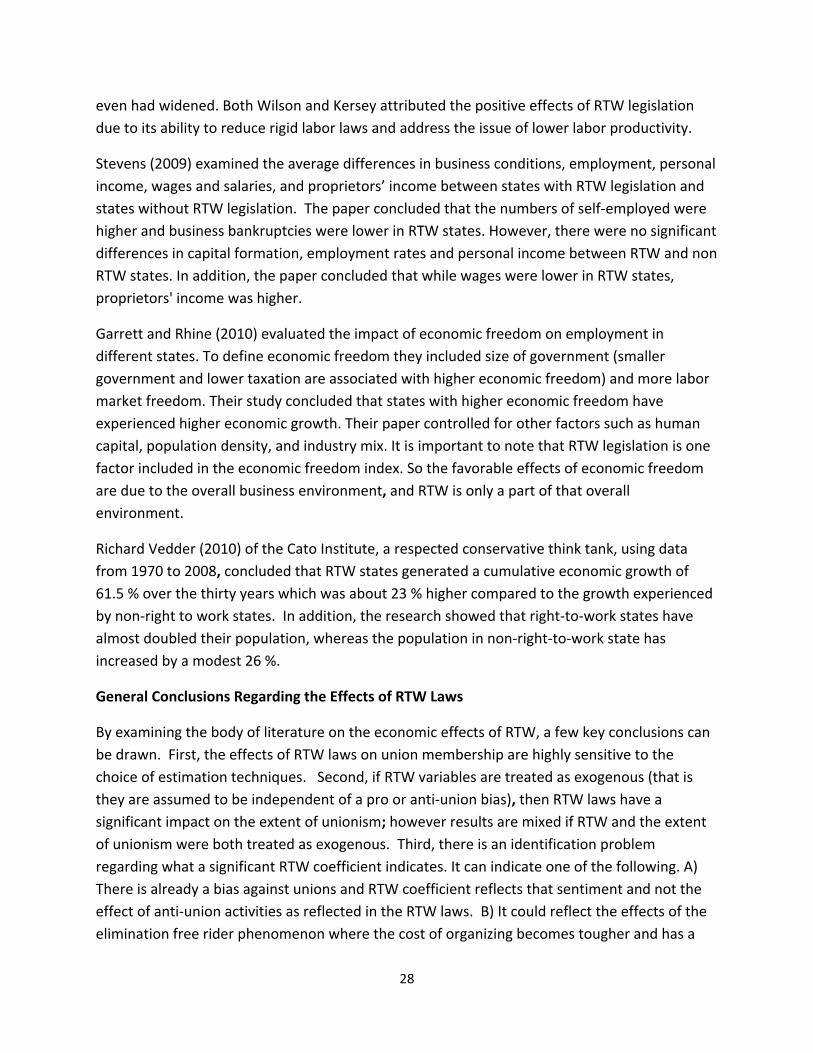
28
even had widened. Both Wilson and Kersey attributed the positive effects of RTW legislation due to its ability to reduce rigid labor laws and address the issue of lower labor productivity.
Stevens (2009) examined the average differences in business conditions, employment, personal income, wages and salaries, and proprietors’ income between states with RTW legislation and states without RTW legislation. The paper concluded that the numbers of self-employed were higher and business bankruptcies were lower in RTW states. However, there were no significant differences in capital formation, employment rates and personal income between RTW and non RTW states. In addition, the paper concluded that while wages were lower in RTW states, proprietors' income was higher.
Garrett and Rhine (2010) evaluated the impact of economic freedom on employment in different states. To define economic freedom they included size of government (smaller government and lower taxation are associated with higher economic freedom) and more labor market freedom. Their study concluded that states with higher economic freedom have experienced higher economic growth. Their paper controlled for other factors such as human capital, population density, and industry mix. It is important to note that RTW legislation is one factor included in the economic freedom index. So the favorable effects of economic freedom are due to the overall business environment, and RTW is only a part of that overall environment.
Richard Vedder (2010) of the Cato Institute, a respected conservative think tank, using data from 1970 to 2008, concluded that RTW states generated a cumulative economic growth of 61.5 % over the thirty years which was about 23 % higher compared to the growth experienced by non-right to work states. In addition, the research showed that right-to-work states have almost doubled their population, whereas the population in non-right-to-work state has increased by a modest 26 %.
General Conclusions Regarding the Effects of RTW Laws
By examining the body of literature on the economic effects of RTW, a few key conclusions can be drawn. First, the effects of RTW laws on union membership are highly sensitive to the choice of estimation techniques. Second, if RTW variables are treated as exogenous (that is they are assumed to be independent of a pro or anti-union bias), then RTW laws have a significant impact on the extent of unionism; however results are mixed if RTW and the extent of unionism were both treated as exogenous. Third, there is an identification problem regarding what a significant RTW coefficient indicates. It can indicate one of the following. A) There is already a bias against unions and RTW coefficient reflects that sentiment and not the effect of anti-union activities as reflected in the RTW laws. B) It could reflect the effects of the elimination free rider phenomenon where the cost of organizing becomes tougher and has a
29
negative consequence on the extent of unionism. C) It could reflect the effects of the diminished bargaining power of the union and its consequent effects on the level of unionism. Thus it is very important to attempt to isolate these independent effects and actually assess the effects of RTW legislation on the extent of unionism. The fourth conclusion is that there seems to be evidence of a strong and significant slowing down of union organizing with the passage of RTW laws.
The effects of RTW on wages are also mixed. It is clear that states with RTW laws have a lower average wage than states without RTW legislation. Yet RTW states have experienced significantly greater wage rate growth in the last decade (2000-10). However, while the causality for either is not well-established, there is evidence to suggest that union wage premiums are significantly higher in RTW states than in non-RTW states.
The effect of RTW legislation on choice of location by industry is functionally dependent upon the employers’ perception whether the effect of RTW legislation on the extent of unionism is real or symbolic. If it is real then the decision to relocate is a result of a cost benefit analysis of the benefits of reduced union activities compared to the cost of relocation. If on the other hand the benefits of RTW legislation are merely symbolic, then the movement of industries to states with RTW legislation would be severely restricted.
It is clear that RTW states have a negative impact on the extent of unionism. It is also clear that the extent of unionization has a significant impact on the existence of RTW legislation. Some economists have tried to estimate simultaneous equation models to determine jointly unionization level and the presence / absence of RTW laws, but determining cause and effect is difficult.
Cobb-Douglas Analysis The difficulty of assessing whether RTW laws are a cause or effect requires the use of a different approach towards identifying whether RTW matters with regard to a state’s economic performance. In this study, regression analysis was used to estimate a standard Cobb-Douglas production function. The Cobb-Douglas production function is a tool used by economists to examine the dependency between economic output and inputs such as capital, labor, and technology.
The percentage changes in state gross domestic product, employment, and organizational births were used to measure output, labor, and capital formation in the Cobb-Douglas function. It was from this equation a measure for technological formation was derived, a proxy for business competitiveness. A series of regression models were then estimated to examine the relationship between business competitiveness and whether a state had in place RTW legislation, controlling for factors including, but not limited to, state-by-state union
30
participation rates, government expenditures, and tax policy. In all of the models estimated, empirical support was provided for the notion that Right-To-Work states are more economically competitive. All of the results were statistically significant at 99 % level of confidence. (See Exhibit 110-116)
Conclusion
The Michigan economy still is very large and important within the U.S. and global economy. Michigan’s GSP is roughly equivalent to the GDP of the country of Austria which would make Michigan one of the 30 largest economies in the world if it were a country. However, this study does not paint a rosy picture of Michigan’s competitive position relative to most other U.S. states. Michigan’s ranking on The Northwood University Competitiveness Index of 47 indicates Michigan has tremendous room for improvement but also reasons for optimism. The study’s regression analysis indicates that RTW states have a strong and statistically significant relationship on productivity growth. However, effects of RTW legislation are often hard to isolate since most RTW states are business friendly. Since RTW states are generally business friendly, capital formation is higher resulting in higher productivity growth. The study indicates further consideration is needed to better determine the causal relationship between RTW legislation and competitiveness.
There are also recent historical examples of policy changes leading to economic recovery and accelerated growth. In a recent Cato Institute policy report, entitled “We can cut government, Canada did,” the authors outlined Canada’s economic reforms since the 1980s which have been comprehensive and effective.
The examples and processes used in the following reforms implemented in Canada might be considered by policymakers at the federal level in the United States or at the state level here in Michigan. Canada has reformed its trade policy, engaged in privatization of many government programs and services, cut spending, maintained a sound monetary policy, cut corporate tax rates, reformed the personal income tax code, balanced its federal budget, and reduced the size of its central government. In fact, Canadian federal spending was cut from 23.3 % of GDP in 1993 to 16.5 % by 2000. Canadian spending cuts of the 1990s were coincident with the beginning of a 15 year economic boom. (Edwards, 2012).
A similar story can be told regarding the economy of New Zealand. John McMillan, in an article entitled, “Managing Economic Change: Lessons from New Zealand,” points out that New Zealand saw vast economic improvement from the early 1980s to the late 1990s by
31
transforming New Zealand from one of the most regulated of the developed world economies to one of the least regulated (McMillan, 1998).
The research contained in this study should serve as a guidepost and tool for benchmarking for Michigan public policy leaders. For many years Michigan was the economic catalyst for much of the U.S. economy, Detroit put America and much of the world on wheels, and Michigan was the “Arsenal of Democracy” in World War II. Can Michigan return to the position of greatness it once occupied in the U.S. business structure? The answer is unequivocally yes, but only if Michigan confronts the economic reality facing this great state. Michigan must set its sights high and benchmark to the best economic and political practices of this country’s top performing states.
32
References Ala. Code§ § 25-7-30 through 35 (1953).
Ariz. Const. art. XXV (1946).
Ark. Const. amend. 34 (1944).
Atkinson, Robert D. & Andes, Scott M. (2011) The Atlantic Century II: Benchmarking U.S. and
E.U. Competitiveness. European-American Business Council and the Information
Technology and Innovation Foundation. Retrieved from http://www.itif.org/files/2011-
atlantic- century.pdf.
Baird, C.W. (1988). Varieties of ‘right to work’. Managerial and Decision Economics, Winter, 33-
43.
Barro, R. (1991). Economic Growth in a Cross-Section of Countries. The Quarterly Journal of
Economics 106, No.2, 407-433.no.
Carroll, T. M. (1986). Do right to work laws matter? Reply. Southern Economic Journal, Vol. 53,
No. 2, Oct., 525-528.
Carroll, T.M. (1983). Right to work laws do matter. Southern Economic Journal, Vol. 50, No. 2,
Oct., 494-509.
Chamberlin, Edward H. (1951) “The Monopoly Power of Labor,” in David McCord Wright, ed.,
The Impact of the Union. New York: Harcourt, Brace.
Clayton Act, 38 Stat. 730 (1914), 15 U.S.C. §§ 12–27 (2011).
33
Commonwealth v. Hunt, 45 Mass. 111 (1842).
Commonwealth v. Pullis, Mayor's Court of Philadelphia (1806) in David P. Twomey (2009).
Labor & Employment Law: Text and Cases, 14th ed. South-Western / West.
Davis v. Wechsler, 263 U.S. 22 (1923).
Dickman, Howard. (1987), Industrial Democracy in America: Ideological Origins of National
Labor Relations Policy. La Salle, Ill.: Open Court.
Duplex Printing Press Co. v. Deering, 254 U.S. 443 (1921).
Edwards, C. (2012). We can cut government: Canada did. Cato Policy Report, Vol. XXIV, No. 3
Ellwood, D. & Fine, G. (1987). The impact of right to work laws on union organizing.
Journal of Political Economy 250-273.
Erdman Act, 30 Stat. 424 (1898).
Esch-Cummins Act, 41 Stat. 456 (1920).
Fla. Const. Article 1, § 6 (1944).
Garett, T. & Rhine, R. (2011). Economic freedom and employment growth in U.S. states, Federal
Reserve Bank of St. Louis Review, January/February 93(1), 1-18.
Guam Code Ann., Title 22, Div. 1, Ch. 4 (22 G.C.A. §§ 4101 et seq.)(2001).
H.Enr.Act 1001.1.1 to Ind. Code 22-6-6 §§ 1-13 (2012).
Hartley, Fred A. (1947). Our New Labor Relations Policy. New York: Funk & Wagnall.
Hayek, Friedrich A. (1960). The Constitution of Liberty. Chicago: University of Chicago Press.
Holmes, T. J. (1998). The Effects of State Policies on the location of Manufacturing: Evidence for
State Borders. Journal of Political Economy, Vol, 106, no 4 August, 667-705.
34
Hunter, R.P. (1999) Michigan Labor Law: What Every Citizen Should Know. Mackinac Center for
Public Policy, Midland, Michigan, retrieved from http://www.mackinac.org/2286.
Hutt, W. H. (1973), The Strike-Threat System: The Economic Consequences of Collective
Bargaining. New Rochelle, N.Y.: Arlington House.
Hutt, W. H. (1954). The Theory of Collective Bargaining. Glencoe, Ill.: Free Press.
Ichniowski, C. & Zax, J. S. (1991), “Right-to-Work Laws, Free Riders, and Unionization in the
Local Public Sector,” Journal of Labor Economics, vol. 9, No. 3.
Idaho Code §§ 44-2001 through 44-2011 (1986).
In re Debs, 158 U.S. 564 (1895).
Iowa Code Ann. §§ 20.8, 20.10, 731.1 through 731.8. (1947).
Johnson, Allie. (2012) 10 states where car insurance really bites your budget. Retrieved from:
http://www.carinsurancequotes.com/car_insurance-costs.
Kalenkoski, C.M. & Lacombe D.J. (2006). Right to work laws and manufacturing employment:
The importance of spatial dependence. Southern Economic Journal (2006) 73(2) 402-
418.
Kan. Const. art. 15, § 12 (1958).
Kersey. P (2007). The economic effects of right to work laws. Mackinac Center for Public Policy.
Kuhn, J. W. (1961). Right to work laws-symbols or substance?. Industrial and Labor Relations
Review, Vol. 14 no. 4, July, 587-594.
35
Knight, F. H. (1959), “Wages and Labor Union Action in the Light of Economic Analysis,” in Philip
D. Bradley, ed., The Public Stake in Union Power. Charlottesville, VA: University Press of
Virginia.
Kochan, Thomas A. (2012). Resolving America's Human Capital Paradox: A Jobs Compact for the
Future. Policy Paper No. 2012-011. Kalamazoo, MI: W.E. Upjohn Institute for
Employment Research. Retrieved from http://research.upjohn.org/up_policypapers/11.
Labor-Management Relations Act (Taft-Hartley), 61 Stat. 136 (1947), 29 U.S.C. §§ 151-169
(2011).
Lincoln Union v. Northwestern Co., 335 U.S. 525 (1949).
Loewe v. Lawlor, 208 U.S. 274 (1908).
La. Rev. Stat. Ann. §§ 23:981-987 (1976).
Lumsden K. & Petersen, C. (1975). The effect of right to work laws on unionization in the United
States. Journal of Political Economy, Vol 83, no 6.
Machlup, F. (1952), The Political Economy of Monopoly. Baltimore, MD: The Johns Hopkins
University Press.
McMillan, J. (1998). Managing economic change: lessons from New Zealand. Working paper
University of California San Diego.
Meade Electric Co. v. Hagberg, 129 Ind. App. 631, 159 N.E.2d 408 (1959).
Meyers, F. (1955). Effects of “right to work” laws: a study of the Texas act. Industrial and Labor
Relations Review, Vol. 9, No. 1, Oct., 77-84.
36
Michigan House Bill 4454 §§1-13(2007). Retrieved from
http://www.legislature.mi.gov/documents/2007-2008/billintroduced/House/pdf/2007-
HIB-4454.pdf.
Michigan Protect our Jobs Amendment. Retrieved from
http://www.miaaup.org/index.php?option=com_content&view=article&id=156:protect-
our-jobs-petition-campaign&catid=38:2011-news&Itemid=223.
Mishel, L. (2001).The wage penalty of right to work. Economic Policy Institute. August 2001.
Miss. Code Ann. § 71-1-47 (1954).
Miss. Const. art. 7 § 198-A (1960).
Moore, W.J. & Newman, R. J. (1985). The effects of right to work laws: a review of the
literature. Industrial and Labor Relations Review, Vol. 38, No. 4 July, 571-585.
Moore, W. J., Newman, R. J. & William, T. R. (1974). Determinants of the passages of right to
work laws: an alternative Interpretation" Journal of Law and Economics, Vol. 17, No 1
Apr., 197-211.
Moore, W.J., Dunlevy, J. & Newman R. (1986). Do right to work laws matter? comment.
Southern Economic Journal, Vol. 53, No. 2, 515-524.
National Industrial Recovery Act, 48 Stat. 195 (1933), repealed.
National Labor Relations Act (Wagner), 49 Stat. 452 (1935), 29 U.S.C. §§ 151-169 (2011).
N.C. Gen. Stat. §§ 95-78 through 84 (1947).
37
N.D. Cent. Code §§ 34.01.14 (1948).
Neb. Const. Art. XV, §§ 13, 14, 15 (1946).
Nev. Rev. Stat. §§ 613.230, 613.250 - 613.300 (1952).
Norris-LaGuardia Act, 47 Stat. 70 (1932), 29 U.S.C. 102 et seq. (2011).
O.C.G.A § 34-6, et seq. (1947) (2011).
Okla. Const. art. XXIII (2001).
Palomba, C.A. & Palomba N. A. (1971). Right to work laws: a suggested economic rationale.
Journal of Law and Economics, Vol. 14, No. 2, 475-483.
Pancavel, J.H. (1971).The demand for union services: an exercise. Industrial and Labor Relations
Review, 180-190.
Petro, Sylvester. (1957), The Labor Policy of the Free Society. New York: The Ronald Press.
Principles and Rules of the National War Labor Board, United States Government Printing
Office, Washington D.C. (1919), http://play.google.com/books/reader, retrieved
February 27, 2012.
Reynolds, Morgan O. (1984), Power and Privilege: Labor Unions in America. New York: Universe
Books.
Richberg, Donald R. (1957), Labor Union Monopoly. Chicago: Henry Regnery.
Railway Labor Act, 44 Stat. 577 (1926), 45 U.S.C. 151 et seq. (2011).
38
S.C. Code Ann. §§ 41-7-10 through 90 (1954).
S.D. Const. art. VI, § 2 (1946).
Schechter Poultry Corp. v. United States, 295 U.S. 495 (1935).
Schmenner, R.W., Huber, J. & Cook, R.L. (1987). Geographic differences and the location of new
manufacturing facilities. Journal of Urban Economics 21(1), 83-104.
Schmidt, Emerson P. (1971), Union Power and the Public Interest. Los Angeles: Nash Publishing.
Sherman Act, 26 Stat. 209 (1890), 15 U.S.C. §§1-7 (2011).
Simons, Henry. ([1944] 1948), “Some Reflections on Syndicalism” in Economic Policy for a Free
Society. Chicago: University of Chicago Press.
Stevans, L.K. (2009). The effect of endogenous right to work laws on business and economic
conditions in the United States: a multivariate approach. Review of Law and Economics
5(1), 596-614.
Skorup, J. (2009). Detroit: the triumph of progressive public policy. Mackinac Center for Public
Policy. Retrieved from http://www.mackinac.org/10743
Tenn. Code Ann. §§ 50-1-201 through 204 (1947).
Texas Codes Ann. Title 3 §§ 101.003, 004, 052, 053 (1947).
U.S. Department of Commerce (2012). U.S. Competitiveness and Innovative Capacity Report.
U.S. Bureau of Economic Analysis. (2010). Survey of Current Businesses.
United Mine Workers v. Coronado Coal Co., 259 U.S. 344 (1922).
Utah Code Ann. §§ 34-34-1 through 34-17 (1955).
Va. Code Ann. §§ 40.1-58 through 40.1-69 (1947).
39
Vedder, R., Denhart, M. & Robe, J (2011). Right-to-Work and Indiana’s Economic Future
Vedder R. (2010). Right to work laws: Liberty, prosperity and quality of life. Cato Journal, 30(1)
171-180.
Vegelahn v. Gunter, 167 Mass. 92; 44 N.E. 1077 (1896).
Velasco, Gustavo R. (1973), Labor Legislation from an Economic Point of View. Indianapolis, IN:
Liberty Fund.
Wilson, W. (2002). The Effect of right to work laws on economic development” Mackinac
Center for Public Policy, Midland, Michigan.
Witney, F. (1958). The Indiana Right-to-Work Law. Industrial and Labor Relations Review, Vol.
11, No. 4, 506-517.
Wyo. Stat. Ann. §§ 27-7-108 through 115 (1963).

40
Exhibits
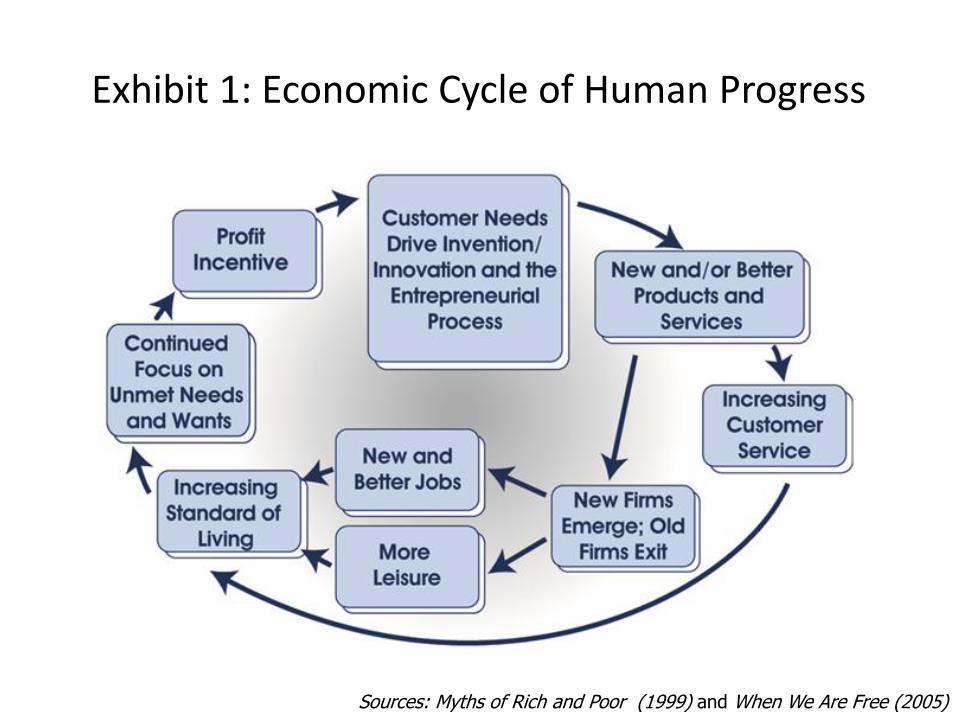
Exhibit 1: Economic Cycle of Human Progress
Sources: Myths of Rich and Poor (1999) and When We Are Free (2005)
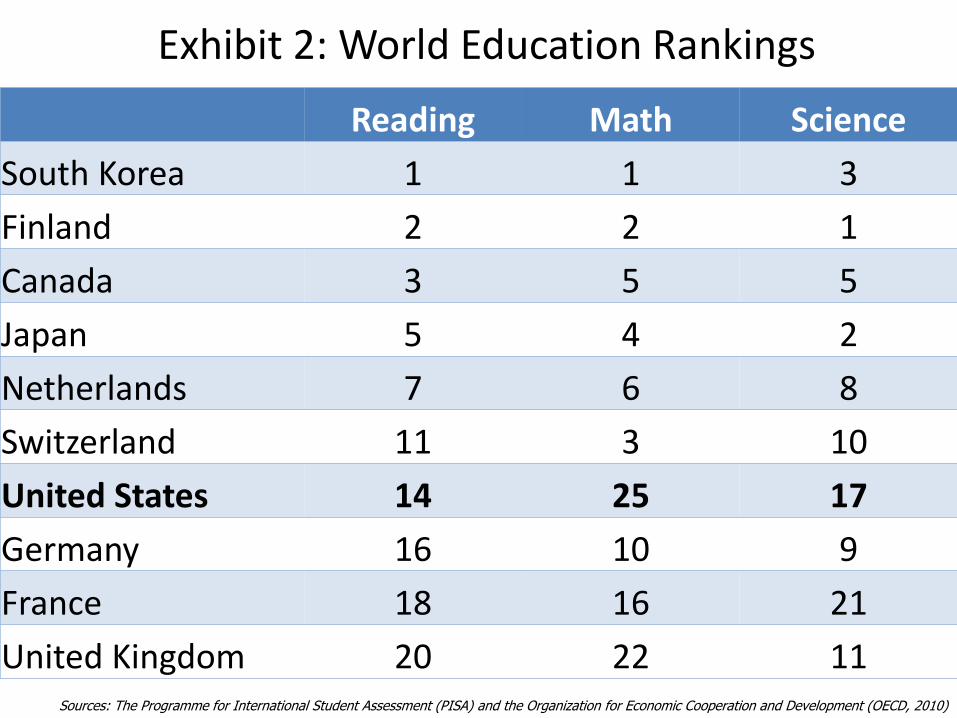
Exhibit 2: World Education Rankings
Reading Math Science
South Korea 1 1 3
Finland 2 2 1
Canada 3 5 5
Japan 5 4 2
Netherlands 7 6 8
Switzerland 11 3 10
United States 14 25 17
Germany 16 10 9
France 18 16 21
United Kingdom 20 22 11Sources: The Programme for International Student Assessment (PISA) and the Organization for Economic Cooperation and Development (OECD, 2010)
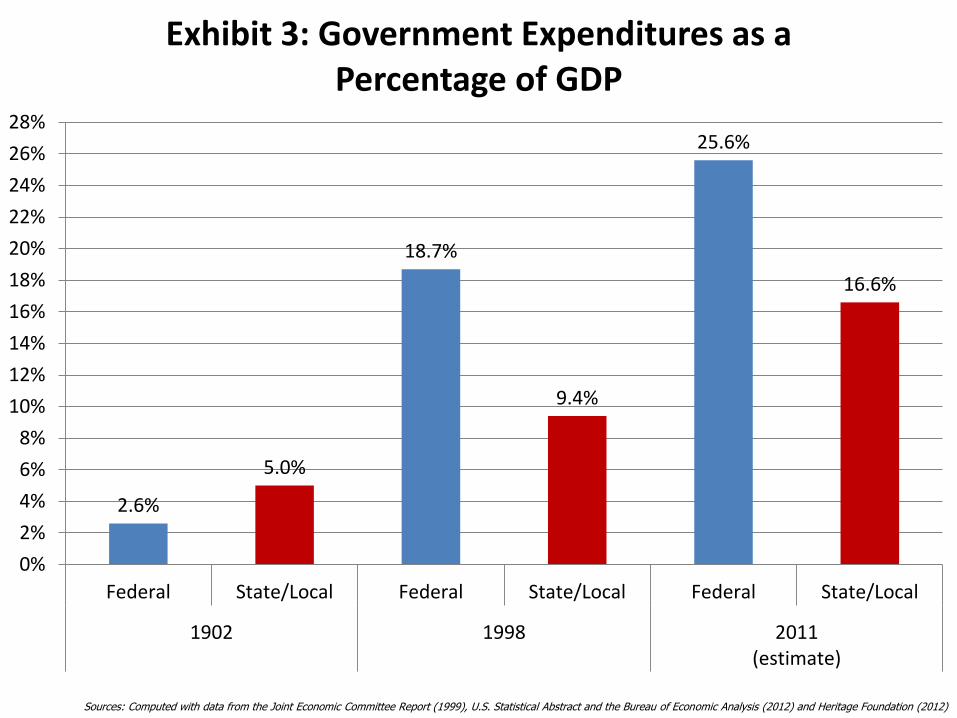
Sources: Computed with data from the Joint Economic Committee Report (1999), U.S. Statistical Abstract and the Bureau of Economic Analysis (2012) and Heritage Foundation (2012)
2.6%
5.0%
18.7%
9.4%
25.6%
16.6%
0%
2%
4%
6%
8%
10%
12%
14%
16%
18%
20%
22%
24%
26%
28%
Federal State/Local Federal State/Local Federal State/Local
1902 1998 2011(estimate)
Exhibit 3: Government Expenditures as a Percentage of GDP
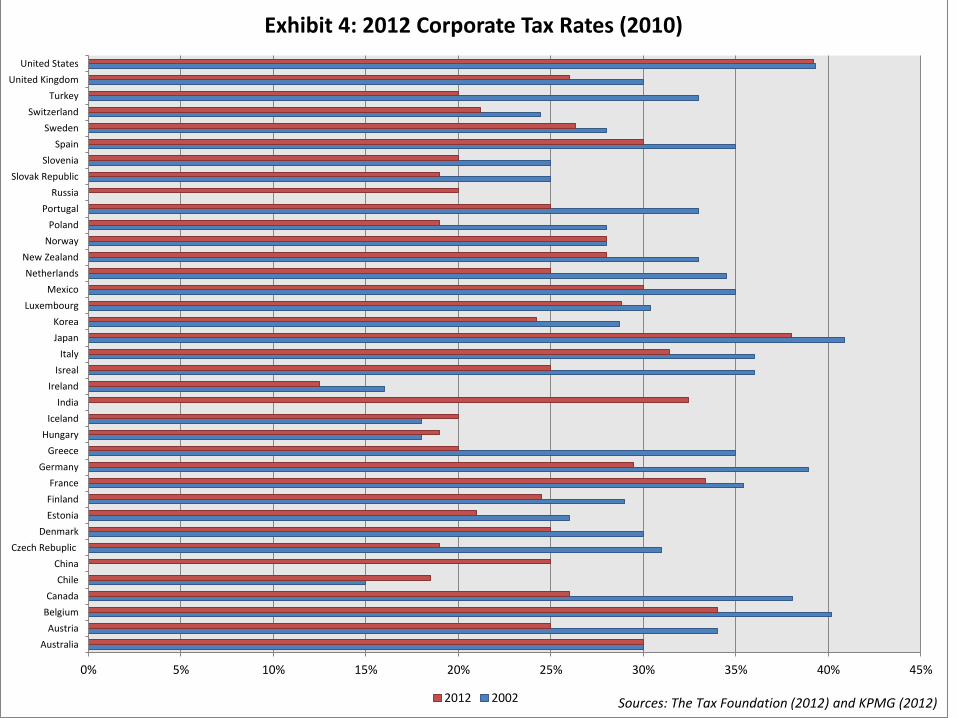
0% 5% 10% 15% 20% 25% 30% 35% 40% 45%
Australia
Austria
Belgium
Canada
Chile
China
Czech Rebuplic
Denmark
Estonia
Finland
France
Germany
Greece
Hungary
Iceland
India
Ireland
Isreal
Italy
Japan
Korea
Luxembourg
Mexico
Netherlands
New Zealand
Norway
Poland
Portugal
Russia
Slovak Republic
Slovenia
Spain
Sweden
Switzerland
Turkey
United Kingdom
United States
Exhibit 4: 2012 Corporate Tax Rates (2010)
2012 2002 Sources: The Tax Foundation (2012) and KPMG (2012)
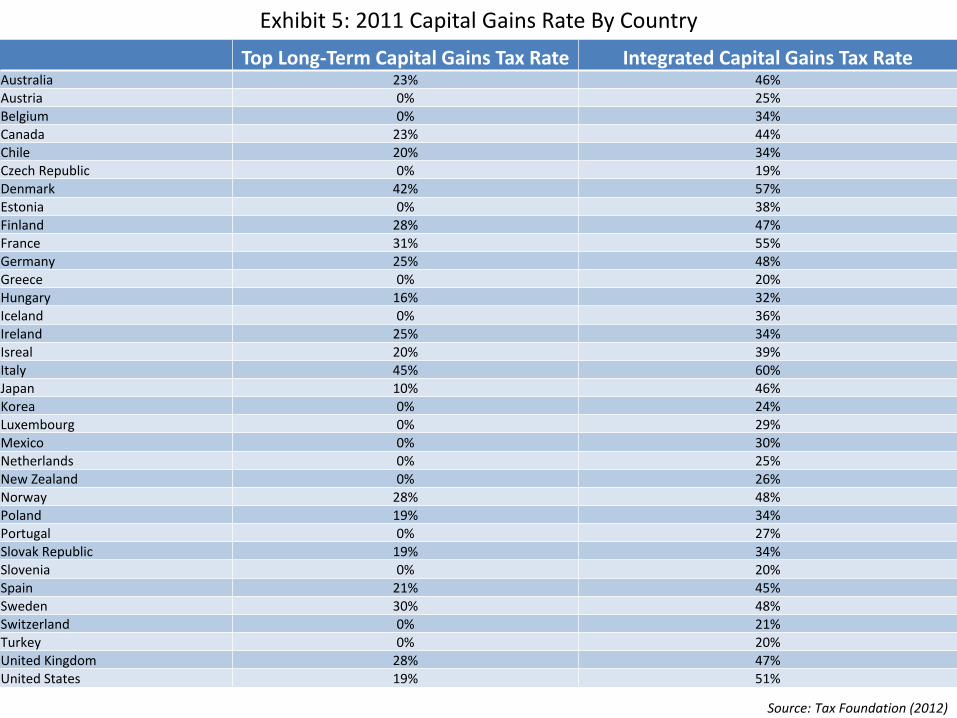
Top Long-Term Capital Gains Tax Rate Integrated Capital Gains Tax RateAustralia 23% 46%Austria 0% 25%Belgium 0% 34%Canada 23% 44%Chile 20% 34%Czech Republic 0% 19%Denmark 42% 57%Estonia 0% 38%Finland 28% 47%France 31% 55%Germany 25% 48%Greece 0% 20%Hungary 16% 32%Iceland 0% 36%Ireland 25% 34%Isreal 20% 39%Italy 45% 60%Japan 10% 46%Korea 0% 24%Luxembourg 0% 29%Mexico 0% 30%Netherlands 0% 25%New Zealand 0% 26%Norway 28% 48%Poland 19% 34%Portugal 0% 27%Slovak Republic 19% 34%Slovenia 0% 20%Spain 21% 45%Sweden 30% 48%Switzerland 0% 21%Turkey 0% 20%United Kingdom 28% 47%United States 19% 51%
Exhibit 5: 2011 Capital Gains Rate By Country
Source: Tax Foundation (2012)
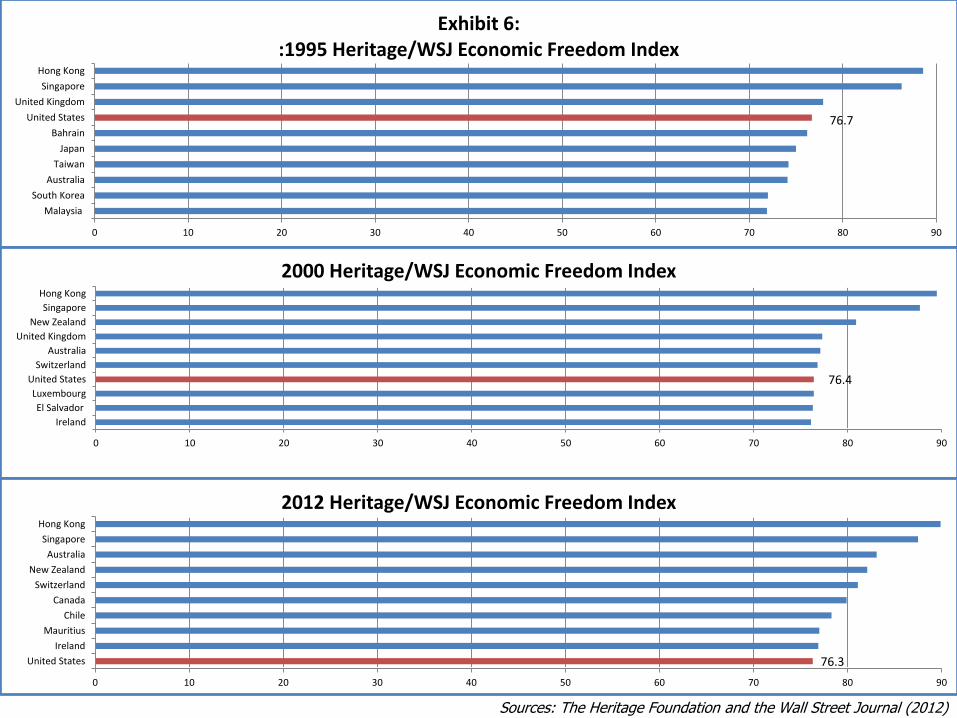
76.7
0 10 20 30 40 50 60 70 80 90
Malaysia
South Korea
Australia
Taiwan
Japan
Bahrain
United States
United Kingdom
Singapore
Hong Kong
Exhibit 6::1995 Heritage/WSJ Economic Freedom Index
76.4
0 10 20 30 40 50 60 70 80 90
Ireland
El Salvador
Luxembourg
United States
Switzerland
Australia
United Kingdom
New Zealand
Singapore
Hong Kong
2000 Heritage/WSJ Economic Freedom Index
Sources: The Heritage Foundation and the Wall Street Journal (2012)
76.3
0 10 20 30 40 50 60 70 80 90
United States
Ireland
Mauritius
Chile
Canada
Switzerland
New Zealand
Australia
Singapore
Hong Kong
2012 Heritage/WSJ Economic Freedom Index
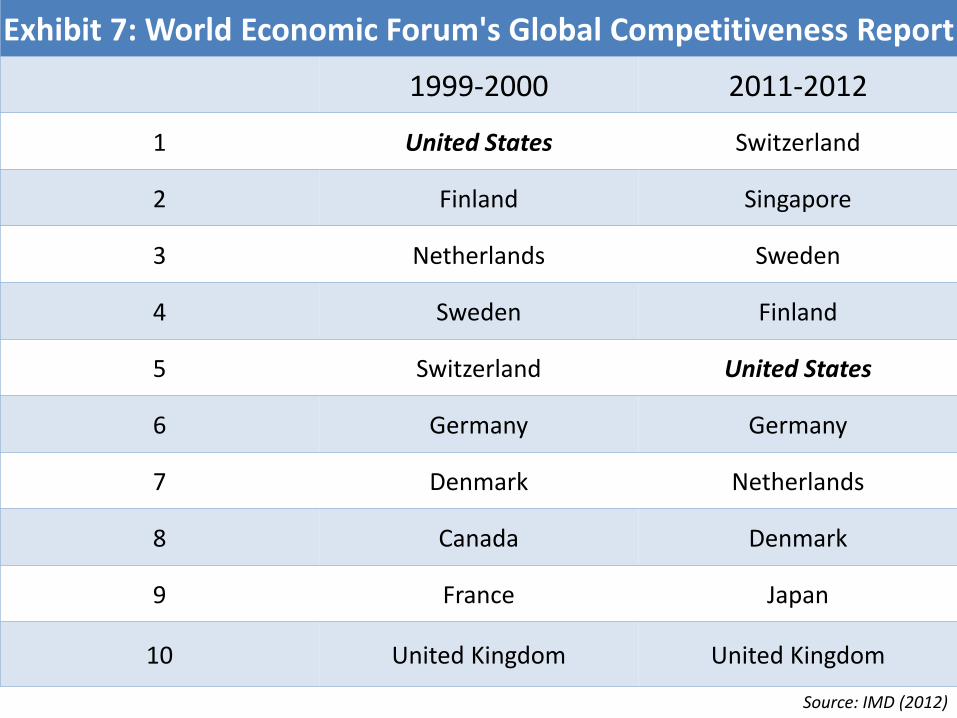
Exhibit 7: World Economic Forum's Global Competitiveness Report
1999-2000 2011-2012
1 United States Switzerland
2 Finland Singapore
3 Netherlands Sweden
4 Sweden Finland
5 Switzerland United States
6 Germany Germany
7 Denmark Netherlands
8 Canada Denmark
9 France Japan
10 United Kingdom United Kingdom
Source: IMD (2012)
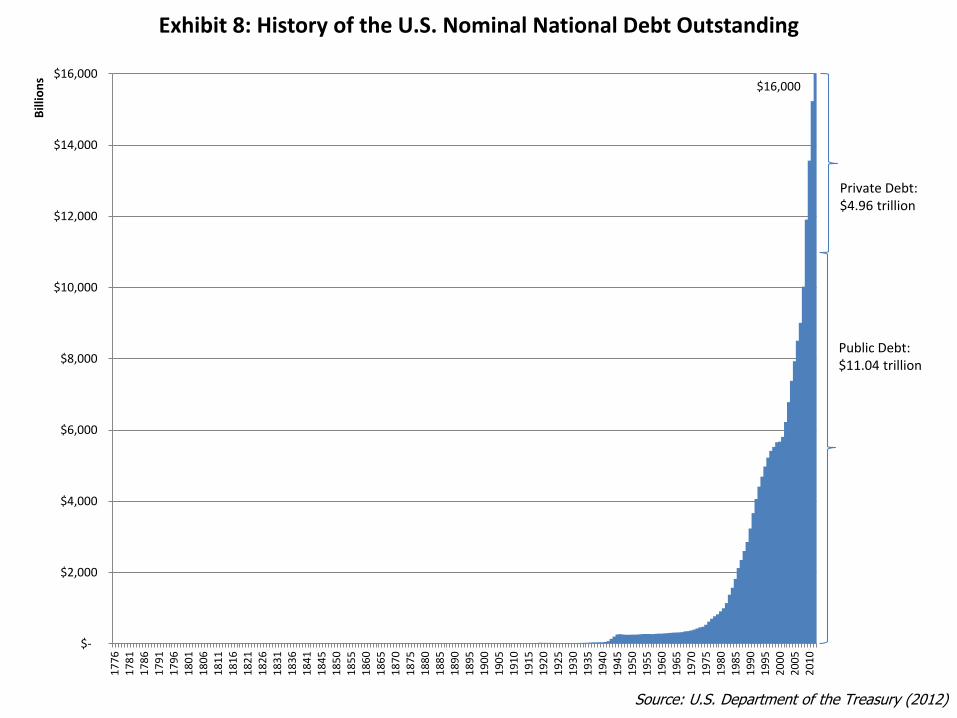
Source: U.S. Department of the Treasury (2012)
$16,000
$-
$2,000
$4,000
$6,000
$8,000
$10,000
$12,000
$14,000
$16,000
17
76
17
81
17
86
17
91
17
96
18
01
18
06
18
11
18
16
18
21
18
26
18
31
18
36
18
41
18
45
18
50
18
55
18
60
18
65
18
70
18
75
18
80
18
85
18
90
18
95
19
00
19
05
19
10
19
15
19
20
19
25
19
30
19
35
19
40
19
45
19
50
19
55
19
60
19
65
19
70
19
75
19
80
19
85
19
90
19
95
20
00
20
05
20
10
Bill
ion
sExhibit 8: History of the U.S. Nominal National Debt Outstanding
Private Debt:$4.96 trillion
Public Debt:$11.04 trillion
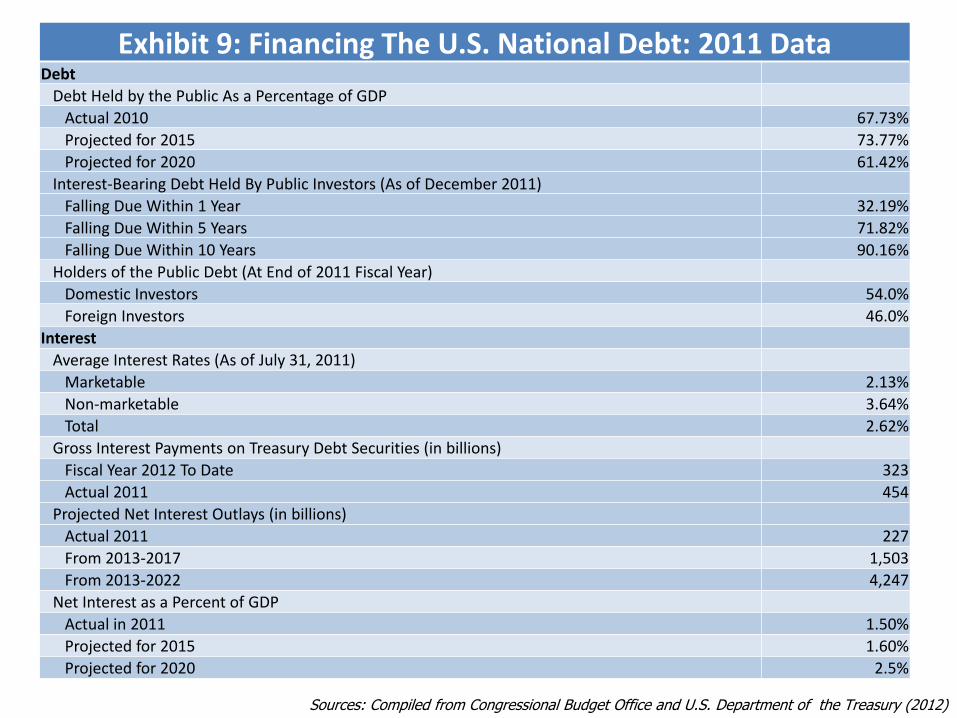
Sources: Compiled from Congressional Budget Office and U.S. Department of the Treasury (2012)
Exhibit 9: Financing The U.S. National Debt: 2011 DataDebt
Debt Held by the Public As a Percentage of GDP
Actual 2010 67.73%
Projected for 2015 73.77%
Projected for 2020 61.42%
Interest-Bearing Debt Held By Public Investors (As of December 2011)
Falling Due Within 1 Year 32.19%
Falling Due Within 5 Years 71.82%
Falling Due Within 10 Years 90.16%
Holders of the Public Debt (At End of 2011 Fiscal Year)
Domestic Investors 54.0%
Foreign Investors 46.0%
Interest
Average Interest Rates (As of July 31, 2011)
Marketable 2.13%
Non-marketable 3.64%
Total 2.62%
Gross Interest Payments on Treasury Debt Securities (in billions)
Fiscal Year 2012 To Date 323
Actual 2011 454
Projected Net Interest Outlays (in billions)
Actual 2011 227
From 2013-2017 1,503
From 2013-2022 4,247
Net Interest as a Percent of GDP
Actual in 2011 1.50%
Projected for 2015 1.60%
Projected for 2020 2.5%
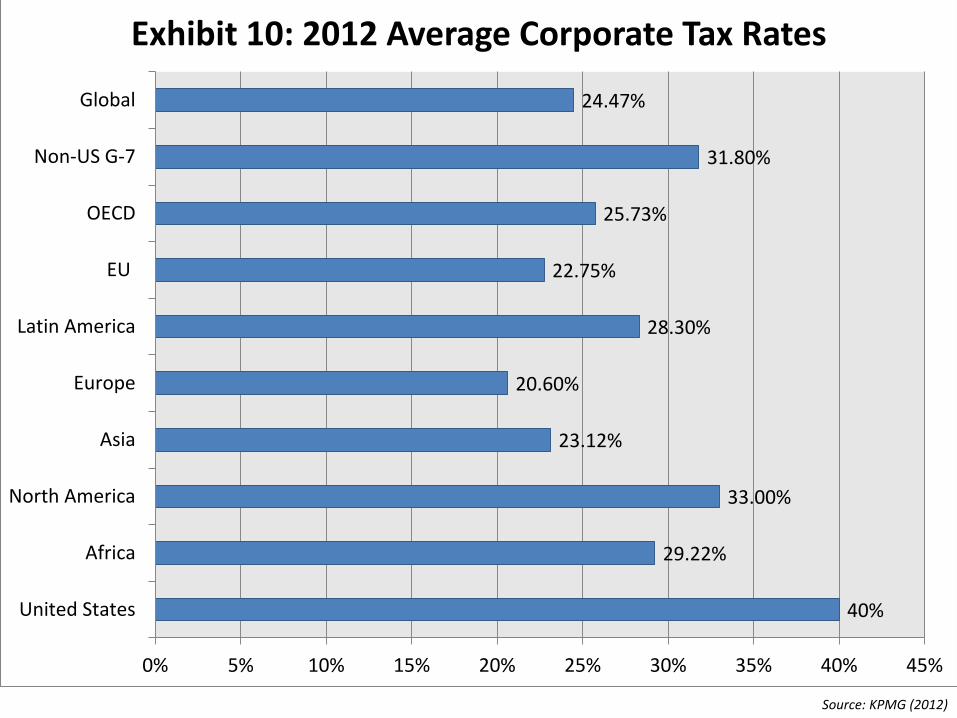
Source: KPMG (2012)
40%
29.22%
33.00%
23.12%
20.60%
28.30%
22.75%
25.73%
31.80%
24.47%
0% 5% 10% 15% 20% 25% 30% 35% 40% 45%
United States
Africa
North America
Asia
Europe
Latin America
EU
OECD
Non-US G-7
Global
Exhibit 10: 2012 Average Corporate Tax Rates

Exhibit 11: The Circular Flow Model
Source: IRS.GOV (2012)
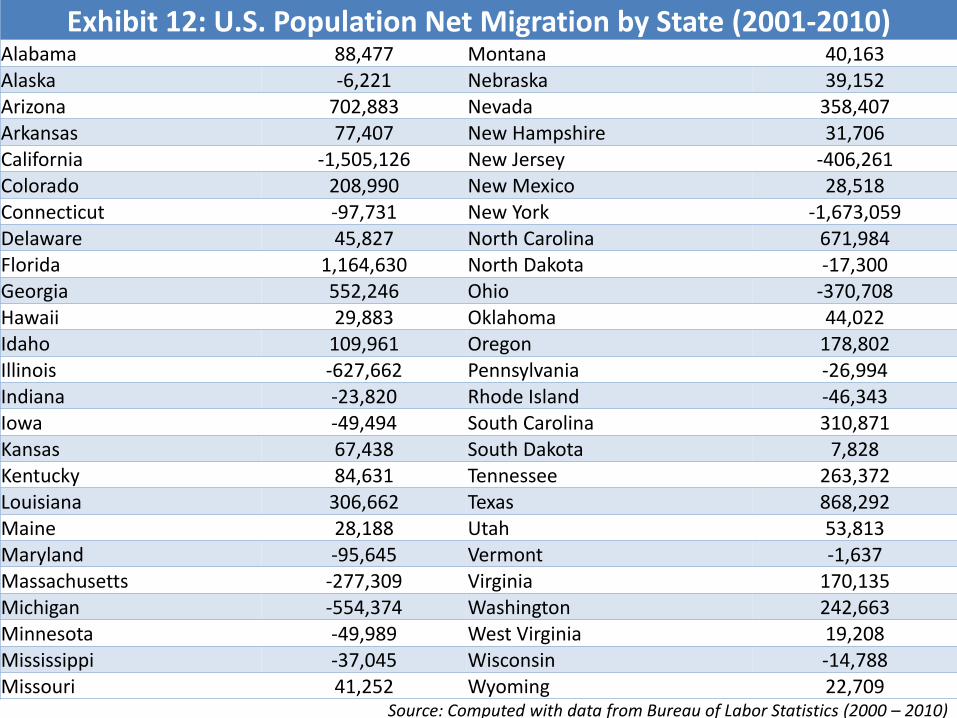
Exhibit 12: U.S. Population Net Migration by State (2001-2010)Alabama 88,477 Montana 40,163Alaska -6,221 Nebraska 39,152Arizona 702,883 Nevada 358,407Arkansas 77,407 New Hampshire 31,706California -1,505,126 New Jersey -406,261Colorado 208,990 New Mexico 28,518Connecticut -97,731 New York -1,673,059Delaware 45,827 North Carolina 671,984Florida 1,164,630 North Dakota -17,300Georgia 552,246 Ohio -370,708Hawaii 29,883 Oklahoma 44,022Idaho 109,961 Oregon 178,802Illinois -627,662 Pennsylvania -26,994Indiana -23,820 Rhode Island -46,343Iowa -49,494 South Carolina 310,871Kansas 67,438 South Dakota 7,828Kentucky 84,631 Tennessee 263,372Louisiana 306,662 Texas 868,292Maine 28,188 Utah 53,813Maryland -95,645 Vermont -1,637Massachusetts -277,309 Virginia 170,135Michigan -554,374 Washington 242,663Minnesota -49,989 West Virginia 19,208Mississippi -37,045 Wisconsin -14,788Missouri 41,252 Wyoming 22,709
Source: Computed with data from Bureau of Labor Statistics (2000 – 2010)
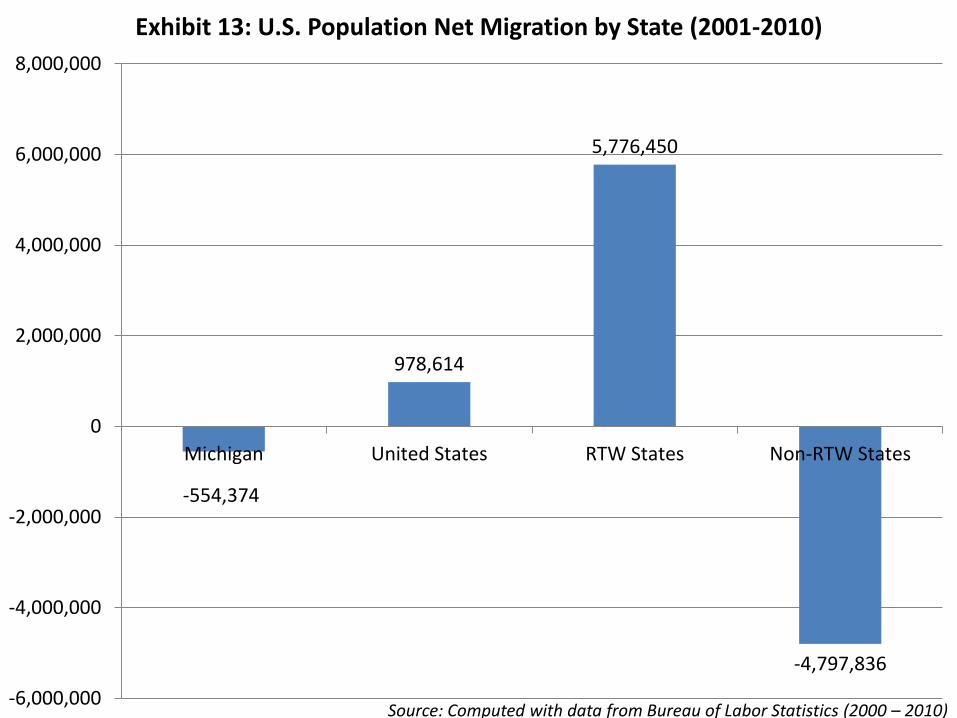
-554,374
978,614
5,776,450
-4,797,836
-6,000,000
-4,000,000
-2,000,000
0
2,000,000
4,000,000
6,000,000
8,000,000
Michigan United States RTW States Non-RTW States
Exhibit 13: U.S. Population Net Migration by State (2001-2010)
Source: Computed with data from Bureau of Labor Statistics (2000 – 2010)

Exhibit 14: U.S. Employment Growth by State (2000-2010)Alabama -3.2% Montana 9.8%Alaska 16.9% Nebraska 3.6%Arizona 7.1% Nevada 9.9%Arkansas 1.1% New Hampshire 1.5%California -2.5% New Jersey -3.0%Colorado 1.9% New Mexico 8.2%Connecticut -4.0% New York 0.0%Delaware -1.2% North Carolina -0.9%Florida 2.9% North Dakota 16.8%Georgia -2.3% Ohio -10.4%Hawaii 8.7% Oklahoma 3.5%Idaho 9.5% Oregon 0.0%Illinois -6.6% Pennsylvania -0.4%Indiana -7.1% Rhode Island -3.2%Iowa -0.5% South Carolina -2.6%Kansas -1.4% South Dakota 6.9%Kentucky -2.4% Tennessee -3.8%Louisiana -1.3% Texas 11.2%Maine -1.0% Utah 11.3%Maryland 3.6% Vermont 0.3%Massachusetts -3.1% Virginia 4.5%Michigan -16.9% Washington 31.1%Minnesota -0.6% West Virginia 2.2%Mississippi -5.4% Wisconsin -3.0%Missouri -3.7% Wyoming 19.1%
Source: Computed with data from Bureau of Labor Statistics (2000 – 2010)
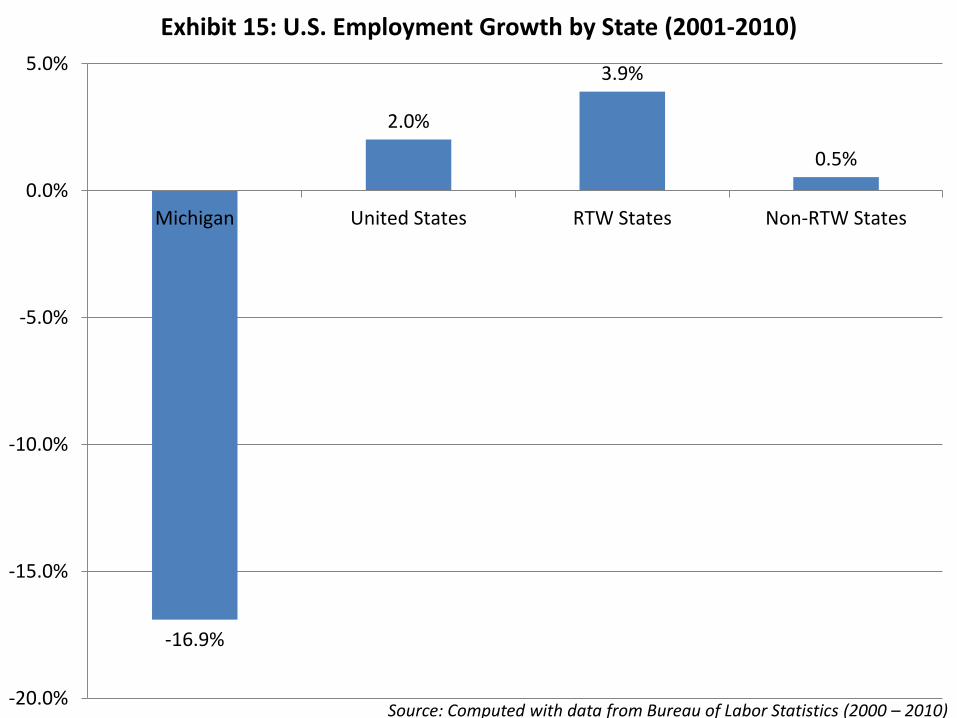
-16.9%
2.0%
3.9%
0.5%
-20.0%
-15.0%
-10.0%
-5.0%
0.0%
5.0%
Michigan United States RTW States Non-RTW States
Exhibit 15: U.S. Employment Growth by State (2001-2010)
Source: Computed with data from Bureau of Labor Statistics (2000 – 2010)
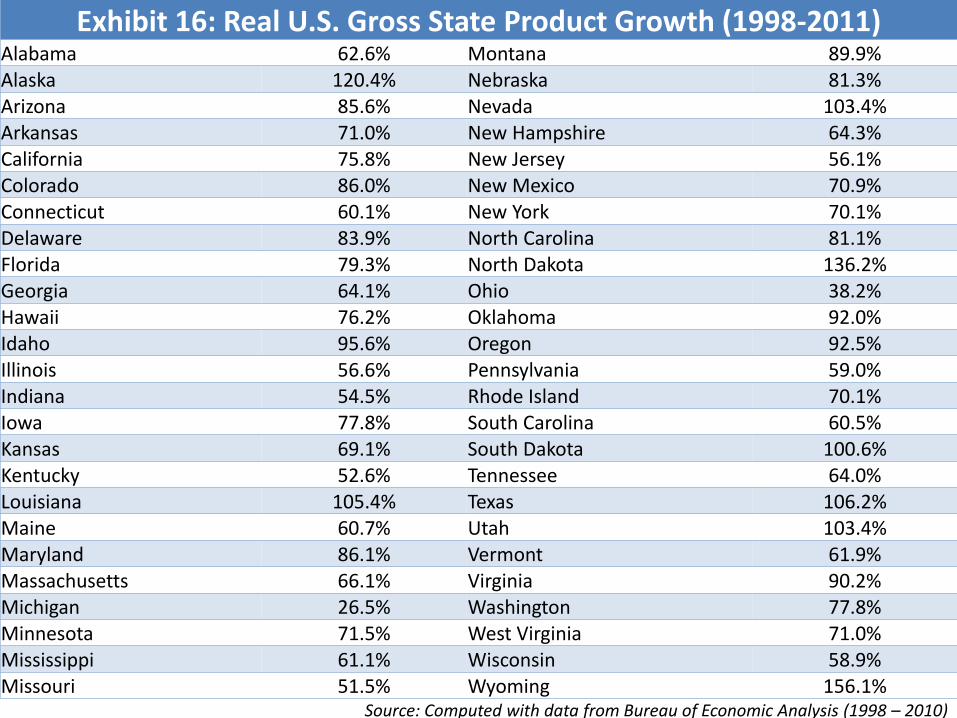
Exhibit 16: Real U.S. Gross State Product Growth (1998-2011)Alabama 62.6% Montana 89.9%Alaska 120.4% Nebraska 81.3%Arizona 85.6% Nevada 103.4%Arkansas 71.0% New Hampshire 64.3%California 75.8% New Jersey 56.1%Colorado 86.0% New Mexico 70.9%Connecticut 60.1% New York 70.1%Delaware 83.9% North Carolina 81.1%Florida 79.3% North Dakota 136.2%Georgia 64.1% Ohio 38.2%Hawaii 76.2% Oklahoma 92.0%Idaho 95.6% Oregon 92.5%Illinois 56.6% Pennsylvania 59.0%Indiana 54.5% Rhode Island 70.1%Iowa 77.8% South Carolina 60.5%Kansas 69.1% South Dakota 100.6%Kentucky 52.6% Tennessee 64.0%Louisiana 105.4% Texas 106.2%Maine 60.7% Utah 103.4%Maryland 86.1% Vermont 61.9%Massachusetts 66.1% Virginia 90.2%Michigan 26.5% Washington 77.8%Minnesota 71.5% West Virginia 71.0%Mississippi 61.1% Wisconsin 58.9%Missouri 51.5% Wyoming 156.1%
Source: Computed with data from Bureau of Economic Analysis (1998 – 2010)
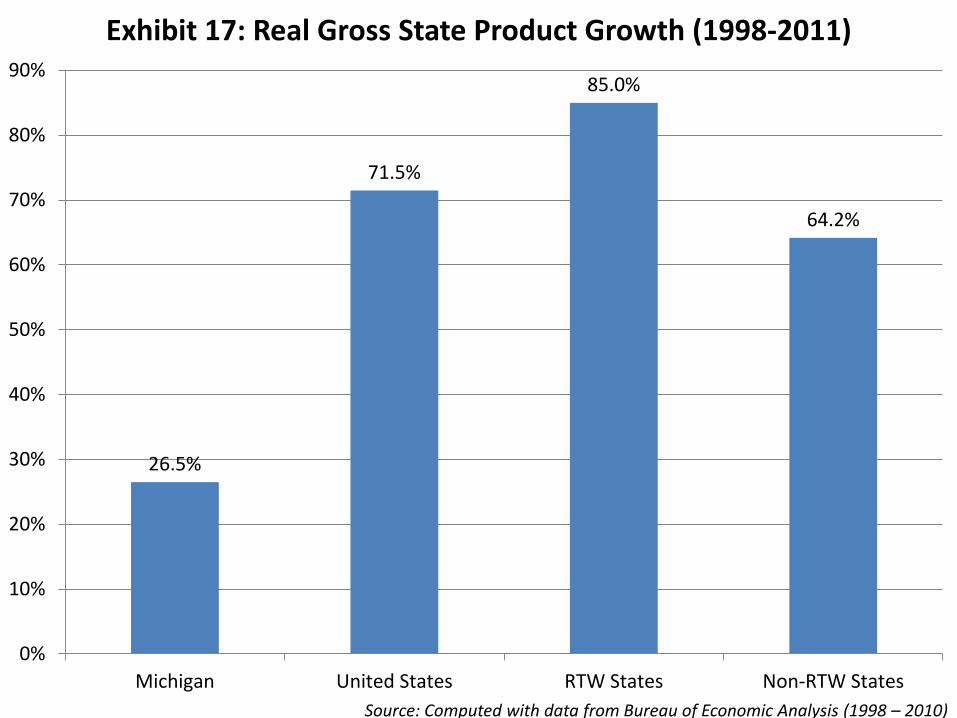
26.5%
71.5%
85.0%
64.2%
0%
10%
20%
30%
40%
50%
60%
70%
80%
90%
Michigan United States RTW States Non-RTW States
Exhibit 17: Real Gross State Product Growth (1998-2011)
Source: Computed with data from Bureau of Economic Analysis (1998 – 2010)
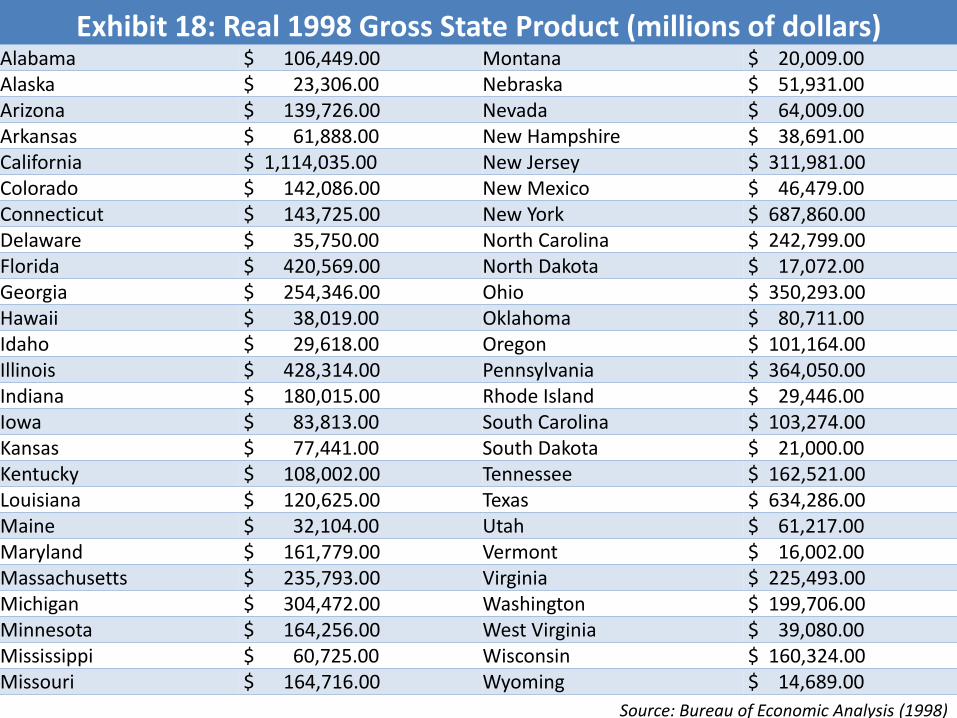
Exhibit 18: Real 1998 Gross State Product (millions of dollars)Alabama $ 106,449.00 Montana $ 20,009.00 Alaska $ 23,306.00 Nebraska $ 51,931.00 Arizona $ 139,726.00 Nevada $ 64,009.00 Arkansas $ 61,888.00 New Hampshire $ 38,691.00 California $ 1,114,035.00 New Jersey $ 311,981.00 Colorado $ 142,086.00 New Mexico $ 46,479.00 Connecticut $ 143,725.00 New York $ 687,860.00 Delaware $ 35,750.00 North Carolina $ 242,799.00 Florida $ 420,569.00 North Dakota $ 17,072.00 Georgia $ 254,346.00 Ohio $ 350,293.00 Hawaii $ 38,019.00 Oklahoma $ 80,711.00 Idaho $ 29,618.00 Oregon $ 101,164.00 Illinois $ 428,314.00 Pennsylvania $ 364,050.00 Indiana $ 180,015.00 Rhode Island $ 29,446.00 Iowa $ 83,813.00 South Carolina $ 103,274.00 Kansas $ 77,441.00 South Dakota $ 21,000.00 Kentucky $ 108,002.00 Tennessee $ 162,521.00 Louisiana $ 120,625.00 Texas $ 634,286.00 Maine $ 32,104.00 Utah $ 61,217.00 Maryland $ 161,779.00 Vermont $ 16,002.00 Massachusetts $ 235,793.00 Virginia $ 225,493.00 Michigan $ 304,472.00 Washington $ 199,706.00 Minnesota $ 164,256.00 West Virginia $ 39,080.00 Mississippi $ 60,725.00 Wisconsin $ 160,324.00 Missouri $ 164,716.00 Wyoming $ 14,689.00
Source: Bureau of Economic Analysis (1998)
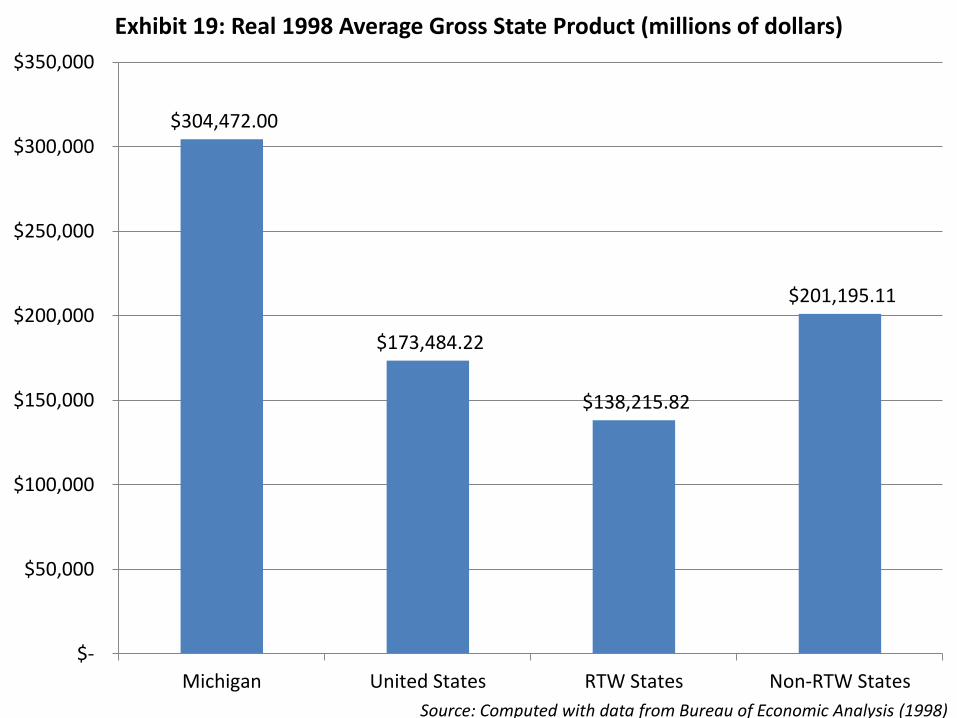
$304,472.00
$173,484.22
$138,215.82
$201,195.11
$-
$50,000
$100,000
$150,000
$200,000
$250,000
$300,000
$350,000
Michigan United States RTW States Non-RTW States
Exhibit 19: Real 1998 Average Gross State Product (millions of dollars)
Source: Computed with data from Bureau of Economic Analysis (1998)
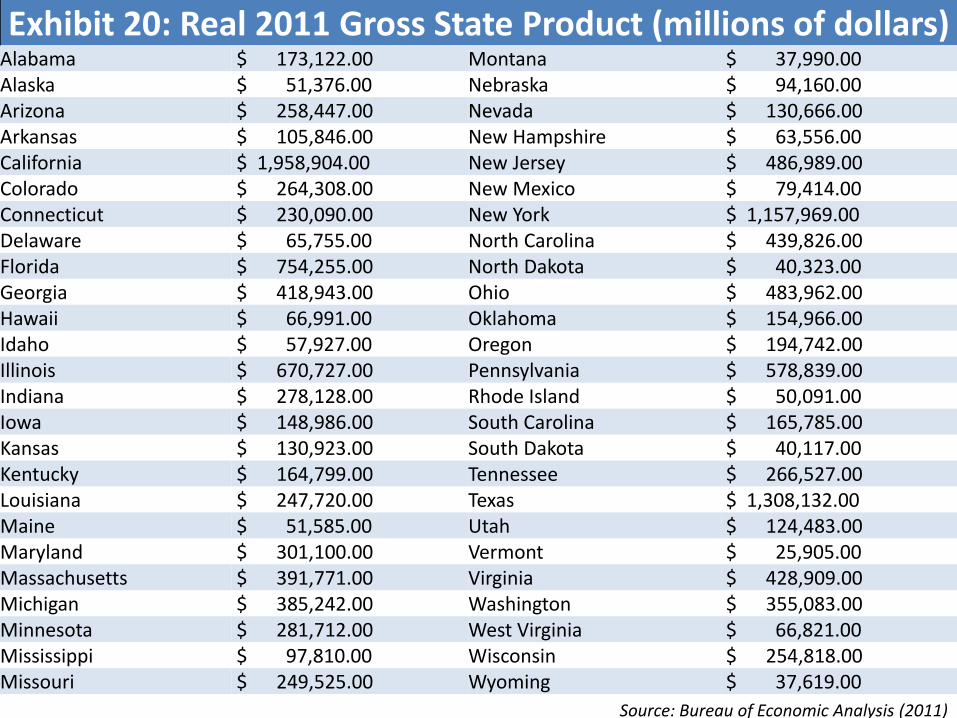
Exhibit 20: Real 2011 Gross State Product (millions of dollars)Alabama $ 173,122.00 Montana $ 37,990.00 Alaska $ 51,376.00 Nebraska $ 94,160.00 Arizona $ 258,447.00 Nevada $ 130,666.00 Arkansas $ 105,846.00 New Hampshire $ 63,556.00 California $ 1,958,904.00 New Jersey $ 486,989.00 Colorado $ 264,308.00 New Mexico $ 79,414.00 Connecticut $ 230,090.00 New York $ 1,157,969.00 Delaware $ 65,755.00 North Carolina $ 439,826.00 Florida $ 754,255.00 North Dakota $ 40,323.00 Georgia $ 418,943.00 Ohio $ 483,962.00 Hawaii $ 66,991.00 Oklahoma $ 154,966.00 Idaho $ 57,927.00 Oregon $ 194,742.00 Illinois $ 670,727.00 Pennsylvania $ 578,839.00 Indiana $ 278,128.00 Rhode Island $ 50,091.00 Iowa $ 148,986.00 South Carolina $ 165,785.00 Kansas $ 130,923.00 South Dakota $ 40,117.00 Kentucky $ 164,799.00 Tennessee $ 266,527.00 Louisiana $ 247,720.00 Texas $ 1,308,132.00 Maine $ 51,585.00 Utah $ 124,483.00 Maryland $ 301,100.00 Vermont $ 25,905.00 Massachusetts $ 391,771.00 Virginia $ 428,909.00 Michigan $ 385,242.00 Washington $ 355,083.00 Minnesota $ 281,712.00 West Virginia $ 66,821.00 Mississippi $ 97,810.00 Wisconsin $ 254,818.00 Missouri $ 249,525.00 Wyoming $ 37,619.00
Source: Bureau of Economic Analysis (2011)
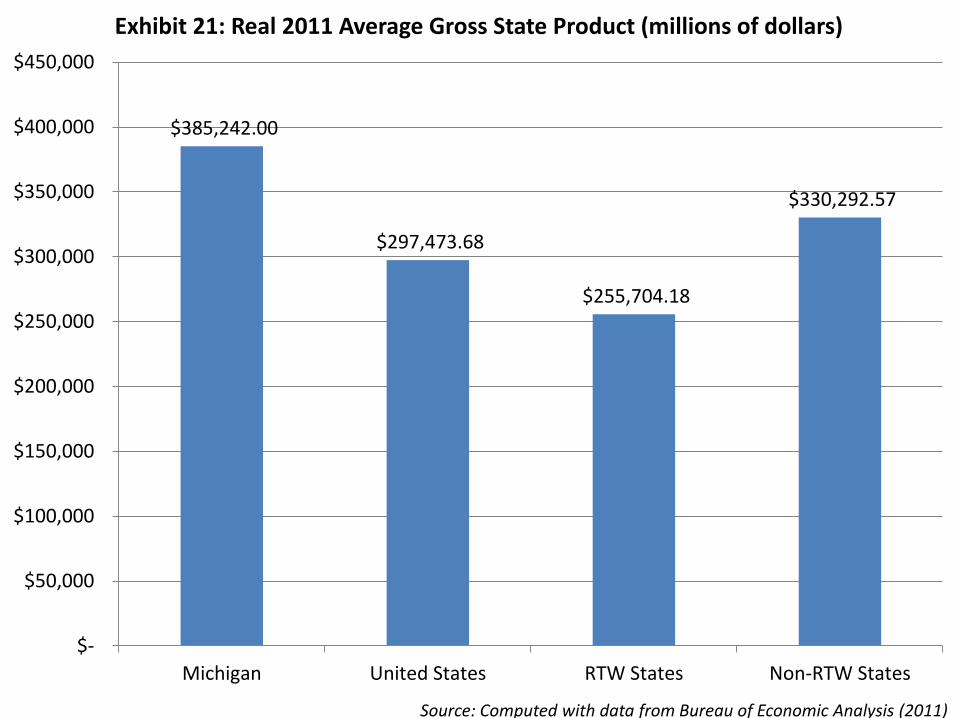
$385,242.00
$297,473.68
$255,704.18
$330,292.57
$-
$50,000
$100,000
$150,000
$200,000
$250,000
$300,000
$350,000
$400,000
$450,000
Michigan United States RTW States Non-RTW States
Exhibit 21: Real 2011 Average Gross State Product (millions of dollars)
Source: Computed with data from Bureau of Economic Analysis (2011)
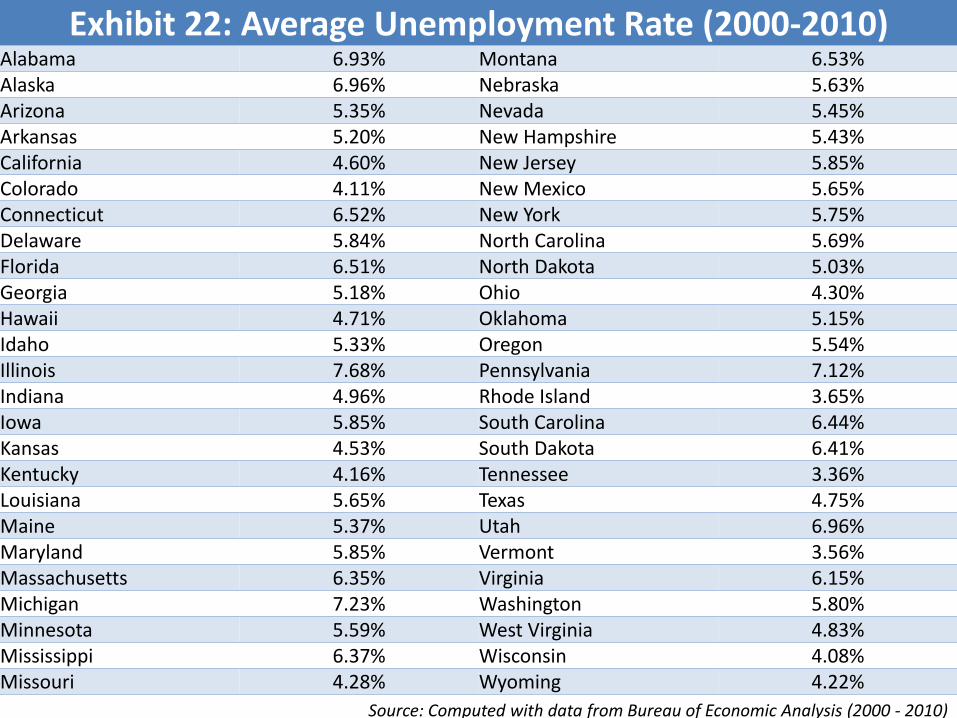
Exhibit 22: Average Unemployment Rate (2000-2010)Alabama 6.93% Montana 6.53%Alaska 6.96% Nebraska 5.63%Arizona 5.35% Nevada 5.45%Arkansas 5.20% New Hampshire 5.43%California 4.60% New Jersey 5.85%Colorado 4.11% New Mexico 5.65%Connecticut 6.52% New York 5.75%Delaware 5.84% North Carolina 5.69%Florida 6.51% North Dakota 5.03%Georgia 5.18% Ohio 4.30%Hawaii 4.71% Oklahoma 5.15%Idaho 5.33% Oregon 5.54%Illinois 7.68% Pennsylvania 7.12%Indiana 4.96% Rhode Island 3.65%Iowa 5.85% South Carolina 6.44%Kansas 4.53% South Dakota 6.41%Kentucky 4.16% Tennessee 3.36%Louisiana 5.65% Texas 4.75%Maine 5.37% Utah 6.96%Maryland 5.85% Vermont 3.56%Massachusetts 6.35% Virginia 6.15%Michigan 7.23% Washington 5.80%Minnesota 5.59% West Virginia 4.83%Mississippi 6.37% Wisconsin 4.08%Missouri 4.28% Wyoming 4.22%
Source: Computed with data from Bureau of Economic Analysis (2000 - 2010)
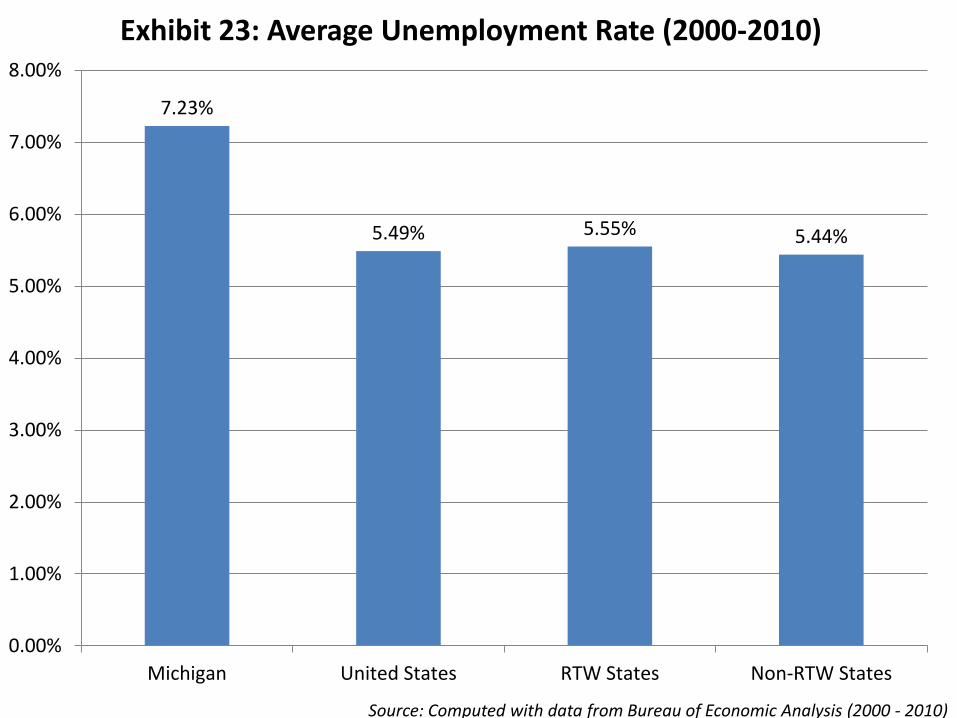
7.23%
5.49% 5.55% 5.44%
0.00%
1.00%
2.00%
3.00%
4.00%
5.00%
6.00%
7.00%
8.00%
Michigan United States RTW States Non-RTW States
Exhibit 23: Average Unemployment Rate (2000-2010)
Source: Computed with data from Bureau of Economic Analysis (2000 - 2010)

Exhibit 24: Non-farm Payroll Employment Growth Rank (2001-2010)Alabama 42 Montana 8Alaska 3 Nebraska 16Arizona 12 Nevada 7Arkansas 22 New Hampshire 21California 36 New Jersey 38Colorado 20 New Mexico 11Connecticut 45 New York 25Delaware 31 North Carolina 29Florida 18 North Dakota 4Georgia 34 Ohio 49Hawaii 10 Oklahoma 17Idaho 9 Oregon 24Illinois 47 Pennsylvania 26Indiana 48 Rhode Island 41Iowa 27 South Carolina 37Kansas 33 South Dakota 13Kentucky 35 Tennessee 44Louisiana 32 Texas 6Maine 30 Utah 5Maryland 15 Vermont 23Massachusetts 40 Virginia 14Michigan 50 Washington 1Minnesota 28 West Virginia 19Mississippi 46 Wisconsin 39Missouri 43 Wyoming 2
Source: Computed with data from Bureau of Economic Analysis (2001 - 2010)
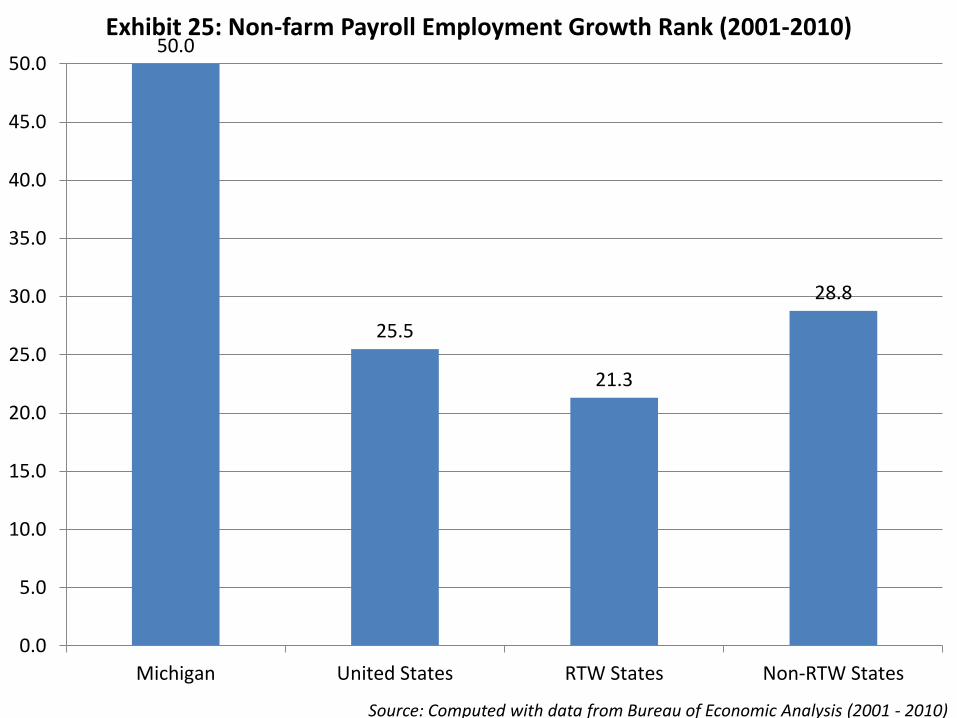
50.0
25.5
21.3
28.8
0.0
5.0
10.0
15.0
20.0
25.0
30.0
35.0
40.0
45.0
50.0
Michigan United States RTW States Non-RTW States
Exhibit 25: Non-farm Payroll Employment Growth Rank (2001-2010)
Source: Computed with data from Bureau of Economic Analysis (2001 - 2010)
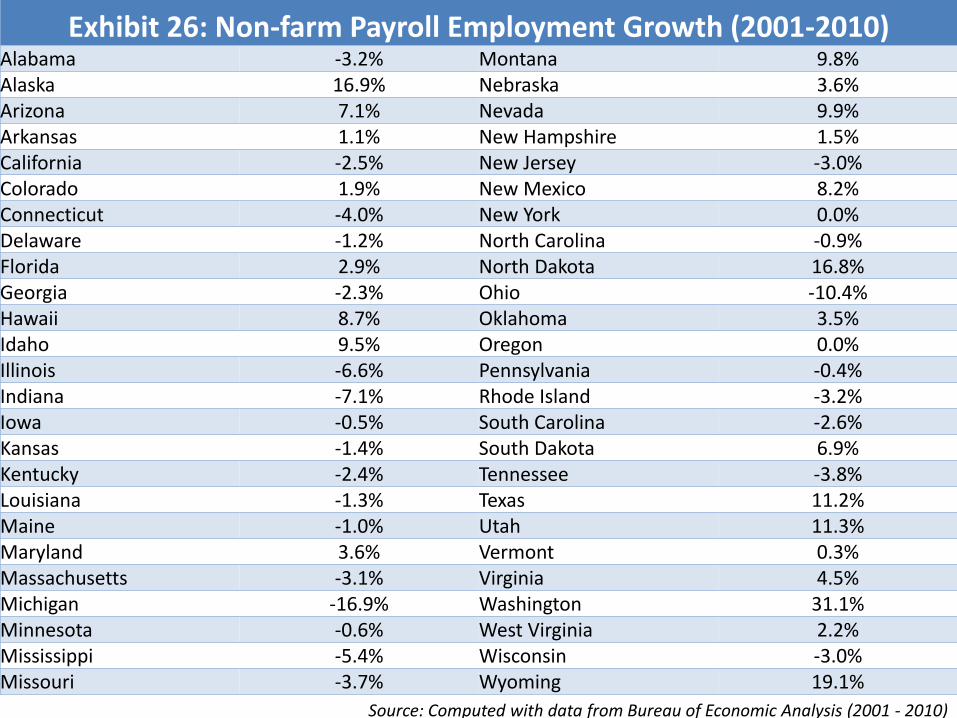
Exhibit 26: Non-farm Payroll Employment Growth (2001-2010)Alabama -3.2% Montana 9.8%Alaska 16.9% Nebraska 3.6%Arizona 7.1% Nevada 9.9%Arkansas 1.1% New Hampshire 1.5%California -2.5% New Jersey -3.0%Colorado 1.9% New Mexico 8.2%Connecticut -4.0% New York 0.0%Delaware -1.2% North Carolina -0.9%Florida 2.9% North Dakota 16.8%Georgia -2.3% Ohio -10.4%Hawaii 8.7% Oklahoma 3.5%Idaho 9.5% Oregon 0.0%Illinois -6.6% Pennsylvania -0.4%Indiana -7.1% Rhode Island -3.2%Iowa -0.5% South Carolina -2.6%Kansas -1.4% South Dakota 6.9%Kentucky -2.4% Tennessee -3.8%Louisiana -1.3% Texas 11.2%Maine -1.0% Utah 11.3%Maryland 3.6% Vermont 0.3%Massachusetts -3.1% Virginia 4.5%Michigan -16.9% Washington 31.1%Minnesota -0.6% West Virginia 2.2%Mississippi -5.4% Wisconsin -3.0%Missouri -3.7% Wyoming 19.1%
Source: Computed with data from Bureau of Economic Analysis (2001 - 2010)
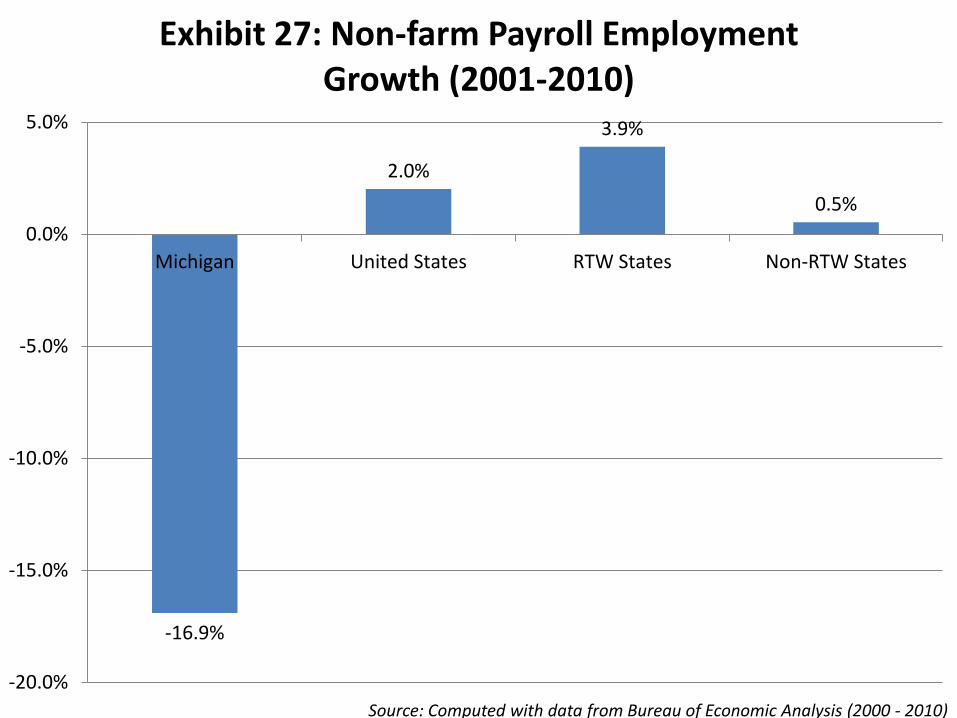
-16.9%
2.0%
3.9%
0.5%
-20.0%
-15.0%
-10.0%
-5.0%
0.0%
5.0%
Michigan United States RTW States Non-RTW States
Exhibit 27: Non-farm Payroll Employment Growth (2001-2010)
Source: Computed with data from Bureau of Economic Analysis (2000 - 2010)
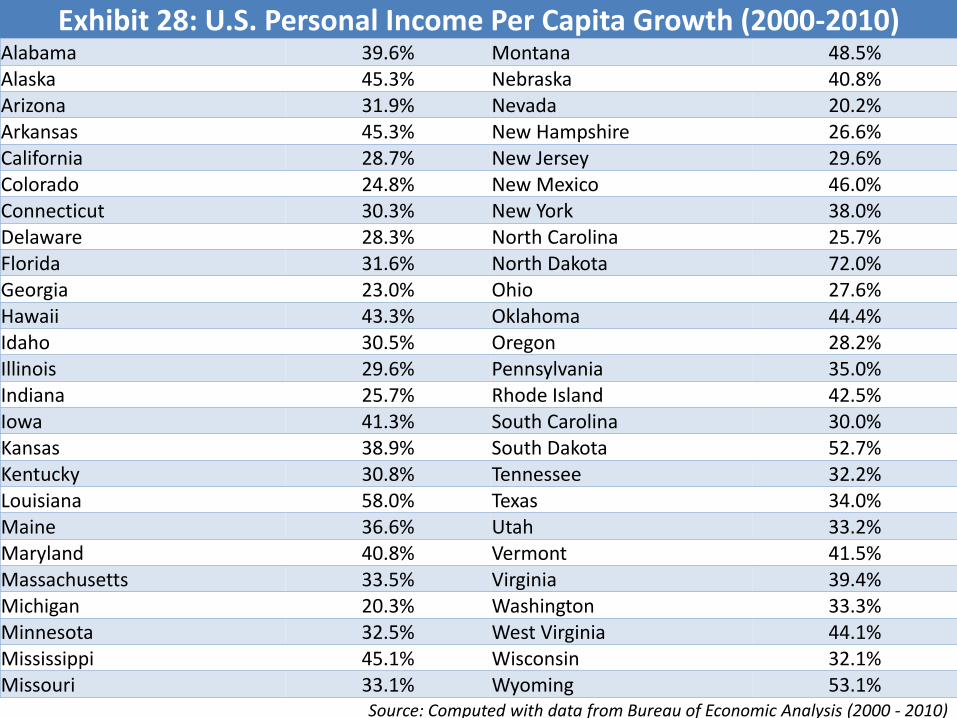
Exhibit 28: U.S. Personal Income Per Capita Growth (2000-2010)Alabama 39.6% Montana 48.5%Alaska 45.3% Nebraska 40.8%Arizona 31.9% Nevada 20.2%Arkansas 45.3% New Hampshire 26.6%California 28.7% New Jersey 29.6%Colorado 24.8% New Mexico 46.0%Connecticut 30.3% New York 38.0%Delaware 28.3% North Carolina 25.7%Florida 31.6% North Dakota 72.0%Georgia 23.0% Ohio 27.6%Hawaii 43.3% Oklahoma 44.4%Idaho 30.5% Oregon 28.2%Illinois 29.6% Pennsylvania 35.0%Indiana 25.7% Rhode Island 42.5%Iowa 41.3% South Carolina 30.0%Kansas 38.9% South Dakota 52.7%Kentucky 30.8% Tennessee 32.2%Louisiana 58.0% Texas 34.0%Maine 36.6% Utah 33.2%Maryland 40.8% Vermont 41.5%Massachusetts 33.5% Virginia 39.4%Michigan 20.3% Washington 33.3%Minnesota 32.5% West Virginia 44.1%Mississippi 45.1% Wisconsin 32.1%Missouri 33.1% Wyoming 53.1%
Source: Computed with data from Bureau of Economic Analysis (2000 - 2010)
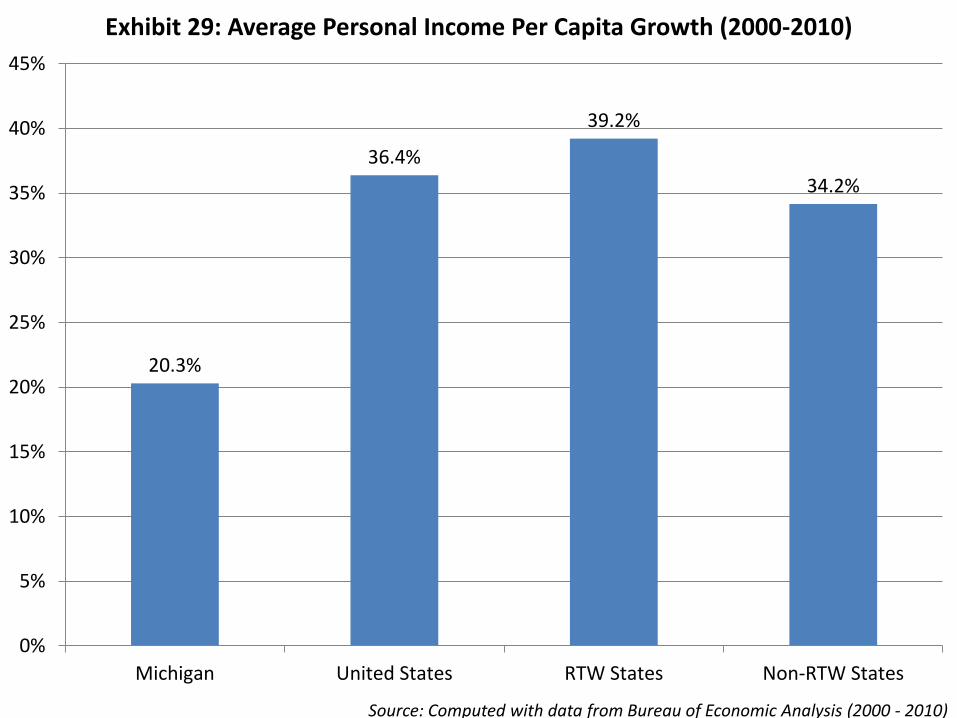
20.3%
36.4%
39.2%
34.2%
0%
5%
10%
15%
20%
25%
30%
35%
40%
45%
Michigan United States RTW States Non-RTW States
Exhibit 29: Average Personal Income Per Capita Growth (2000-2010)
Source: Computed with data from Bureau of Economic Analysis (2000 - 2010)
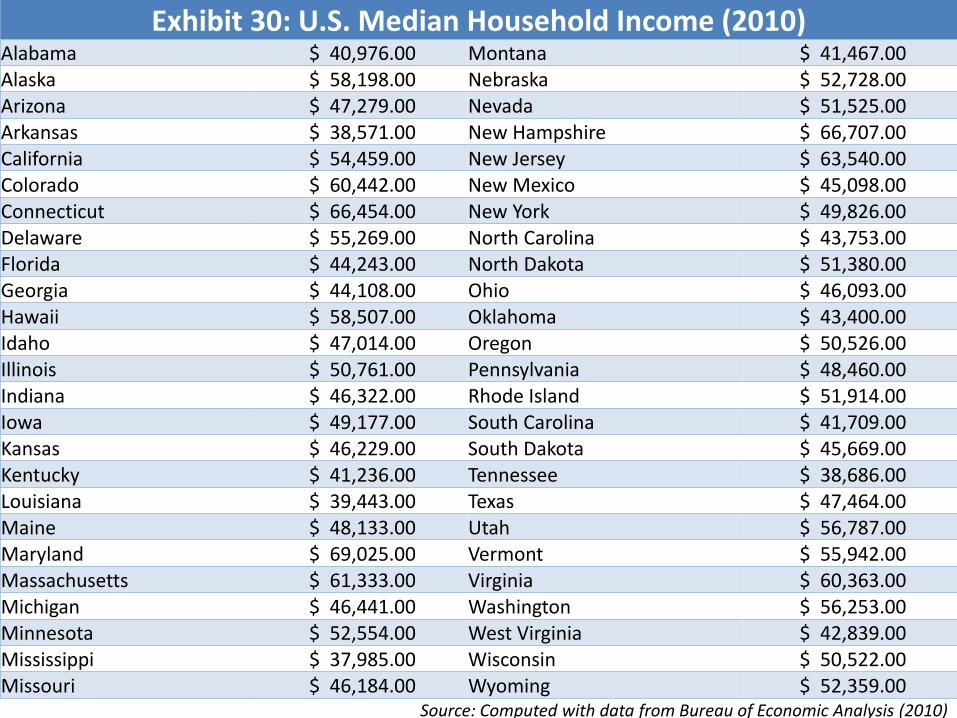
Exhibit 30: U.S. Median Household Income (2010)Alabama $ 40,976.00 Montana $ 41,467.00 Alaska $ 58,198.00 Nebraska $ 52,728.00 Arizona $ 47,279.00 Nevada $ 51,525.00 Arkansas $ 38,571.00 New Hampshire $ 66,707.00 California $ 54,459.00 New Jersey $ 63,540.00 Colorado $ 60,442.00 New Mexico $ 45,098.00 Connecticut $ 66,454.00 New York $ 49,826.00 Delaware $ 55,269.00 North Carolina $ 43,753.00 Florida $ 44,243.00 North Dakota $ 51,380.00 Georgia $ 44,108.00 Ohio $ 46,093.00 Hawaii $ 58,507.00 Oklahoma $ 43,400.00 Idaho $ 47,014.00 Oregon $ 50,526.00 Illinois $ 50,761.00 Pennsylvania $ 48,460.00 Indiana $ 46,322.00 Rhode Island $ 51,914.00 Iowa $ 49,177.00 South Carolina $ 41,709.00 Kansas $ 46,229.00 South Dakota $ 45,669.00 Kentucky $ 41,236.00 Tennessee $ 38,686.00 Louisiana $ 39,443.00 Texas $ 47,464.00 Maine $ 48,133.00 Utah $ 56,787.00 Maryland $ 69,025.00 Vermont $ 55,942.00 Massachusetts $ 61,333.00 Virginia $ 60,363.00 Michigan $ 46,441.00 Washington $ 56,253.00 Minnesota $ 52,554.00 West Virginia $ 42,839.00 Mississippi $ 37,985.00 Wisconsin $ 50,522.00 Missouri $ 46,184.00 Wyoming $ 52,359.00
Source: Computed with data from Bureau of Economic Analysis (2010)
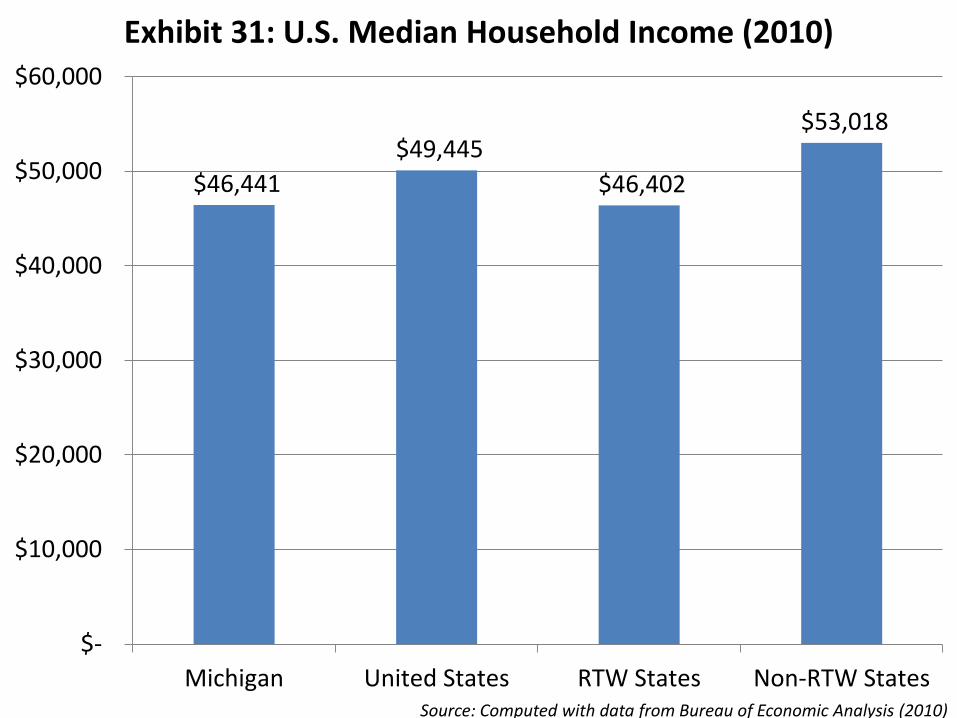
$46,441
$49,445
$46,402
$53,018
$-
$10,000
$20,000
$30,000
$40,000
$50,000
$60,000
Michigan United States RTW States Non-RTW States
Exhibit 31: U.S. Median Household Income (2010)
Source: Computed with data from Bureau of Economic Analysis (2010)
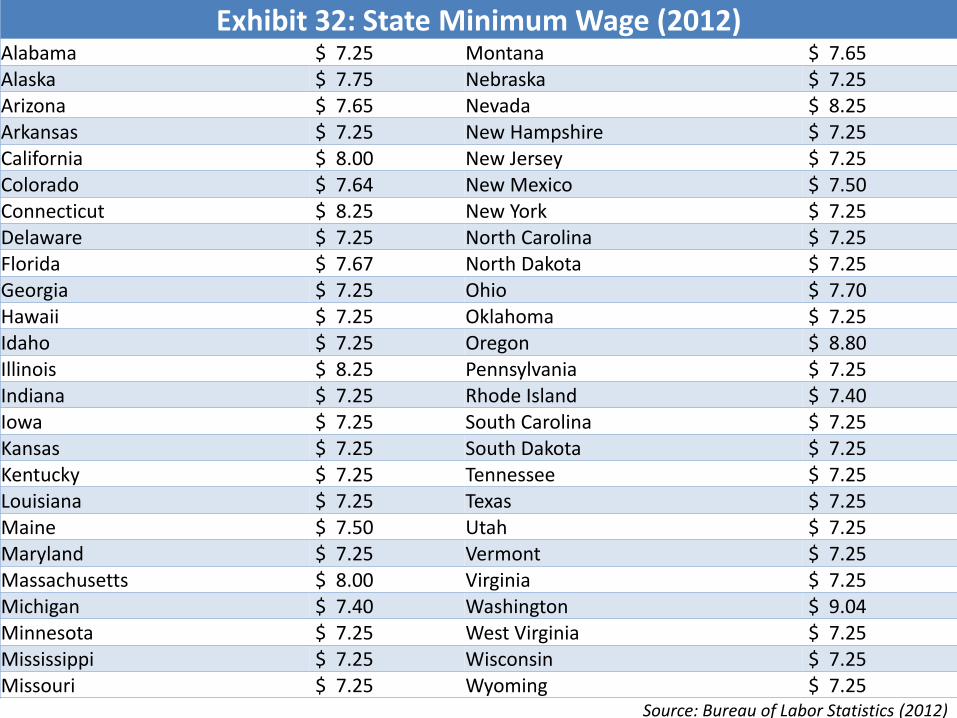
Exhibit 32: State Minimum Wage (2012)Alabama $ 7.25 Montana $ 7.65 Alaska $ 7.75 Nebraska $ 7.25 Arizona $ 7.65 Nevada $ 8.25 Arkansas $ 7.25 New Hampshire $ 7.25 California $ 8.00 New Jersey $ 7.25 Colorado $ 7.64 New Mexico $ 7.50 Connecticut $ 8.25 New York $ 7.25 Delaware $ 7.25 North Carolina $ 7.25 Florida $ 7.67 North Dakota $ 7.25 Georgia $ 7.25 Ohio $ 7.70 Hawaii $ 7.25 Oklahoma $ 7.25 Idaho $ 7.25 Oregon $ 8.80 Illinois $ 8.25 Pennsylvania $ 7.25 Indiana $ 7.25 Rhode Island $ 7.40 Iowa $ 7.25 South Carolina $ 7.25 Kansas $ 7.25 South Dakota $ 7.25 Kentucky $ 7.25 Tennessee $ 7.25 Louisiana $ 7.25 Texas $ 7.25 Maine $ 7.50 Utah $ 7.25 Maryland $ 7.25 Vermont $ 7.25 Massachusetts $ 8.00 Virginia $ 7.25 Michigan $ 7.40 Washington $ 9.04 Minnesota $ 7.25 West Virginia $ 7.25 Mississippi $ 7.25 Wisconsin $ 7.25 Missouri $ 7.25 Wyoming $ 7.25
Source: Bureau of Labor Statistics (2012)
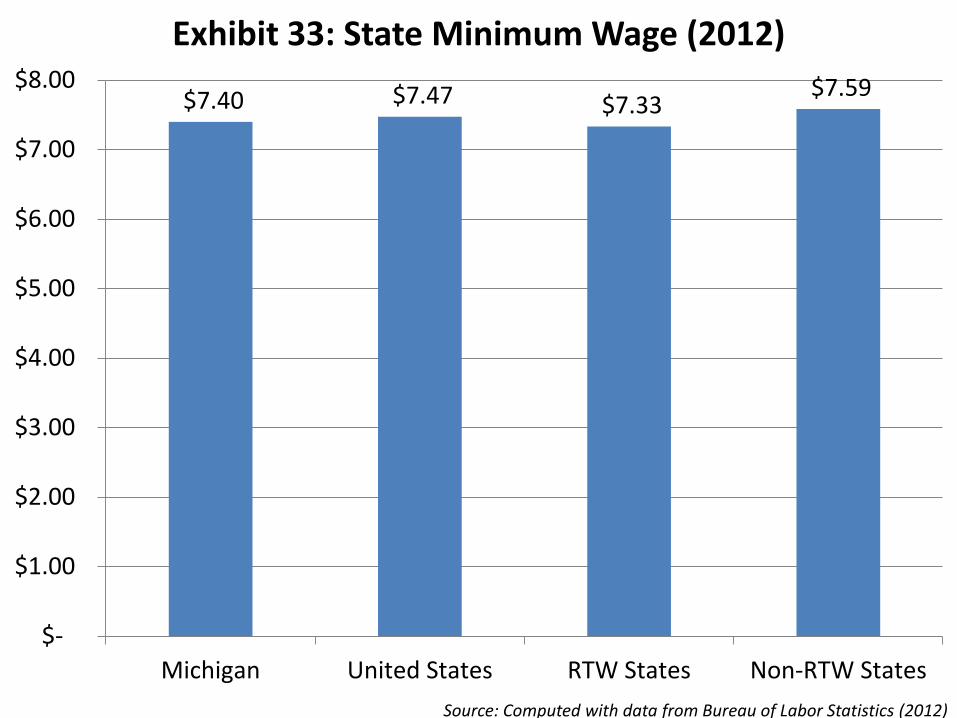
$7.40 $7.47 $7.33 $7.59
$-
$1.00
$2.00
$3.00
$4.00
$5.00
$6.00
$7.00
$8.00
Michigan United States RTW States Non-RTW States
Exhibit 33: State Minimum Wage (2012)
Source: Computed with data from Bureau of Labor Statistics (2012)
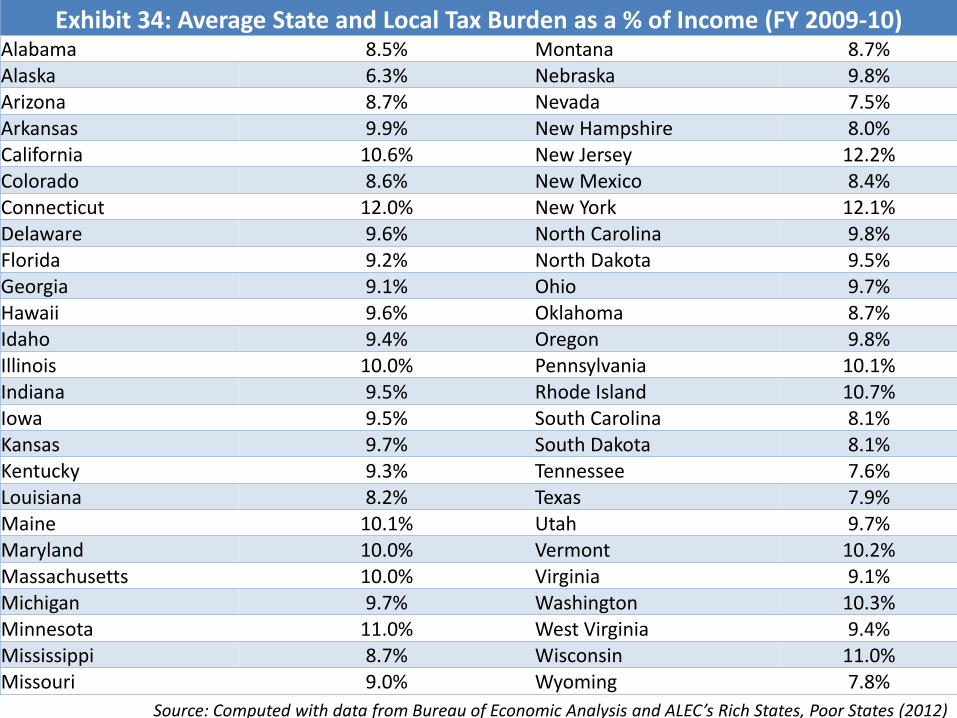
Exhibit 34: Average State and Local Tax Burden as a % of Income (FY 2009-10) Alabama 8.5% Montana 8.7%Alaska 6.3% Nebraska 9.8%Arizona 8.7% Nevada 7.5%Arkansas 9.9% New Hampshire 8.0%California 10.6% New Jersey 12.2%Colorado 8.6% New Mexico 8.4%Connecticut 12.0% New York 12.1%Delaware 9.6% North Carolina 9.8%Florida 9.2% North Dakota 9.5%Georgia 9.1% Ohio 9.7%Hawaii 9.6% Oklahoma 8.7%Idaho 9.4% Oregon 9.8%Illinois 10.0% Pennsylvania 10.1%Indiana 9.5% Rhode Island 10.7%Iowa 9.5% South Carolina 8.1%Kansas 9.7% South Dakota 8.1%Kentucky 9.3% Tennessee 7.6%Louisiana 8.2% Texas 7.9%Maine 10.1% Utah 9.7%Maryland 10.0% Vermont 10.2%Massachusetts 10.0% Virginia 9.1%Michigan 9.7% Washington 10.3%Minnesota 11.0% West Virginia 9.4%Mississippi 8.7% Wisconsin 11.0%Missouri 9.0% Wyoming 7.8%
Source: Computed with data from Bureau of Economic Analysis and ALEC’s Rich States, Poor States (2012)
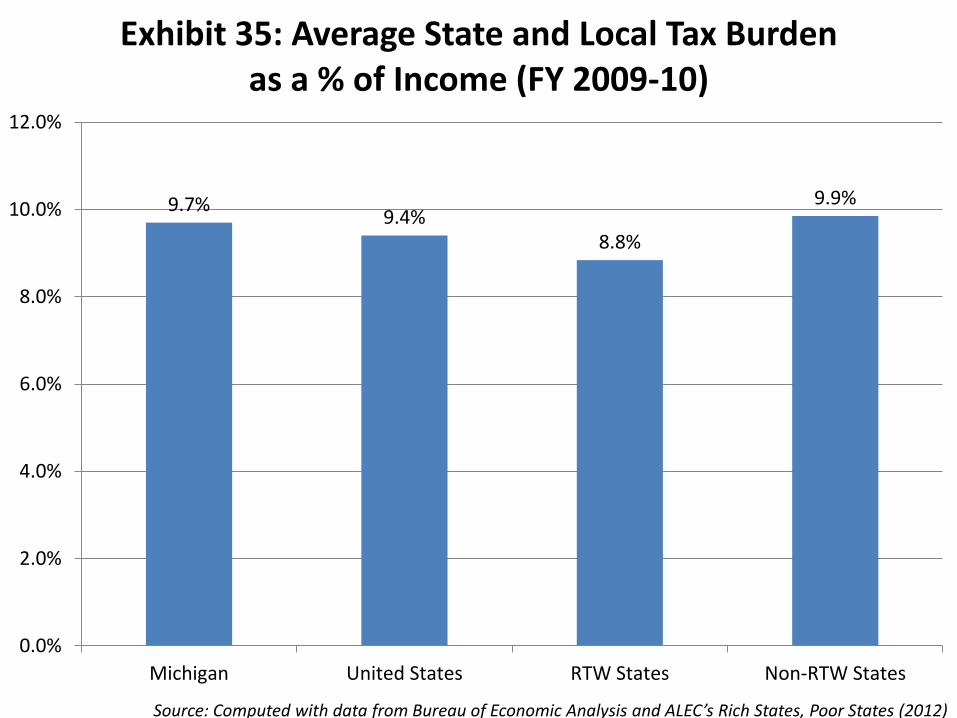
9.7%9.4%
8.8%
9.9%
0.0%
2.0%
4.0%
6.0%
8.0%
10.0%
12.0%
Michigan United States RTW States Non-RTW States
Exhibit 35: Average State and Local Tax Burden as a % of Income (FY 2009-10)
Source: Computed with data from Bureau of Economic Analysis and ALEC’s Rich States, Poor States (2012)
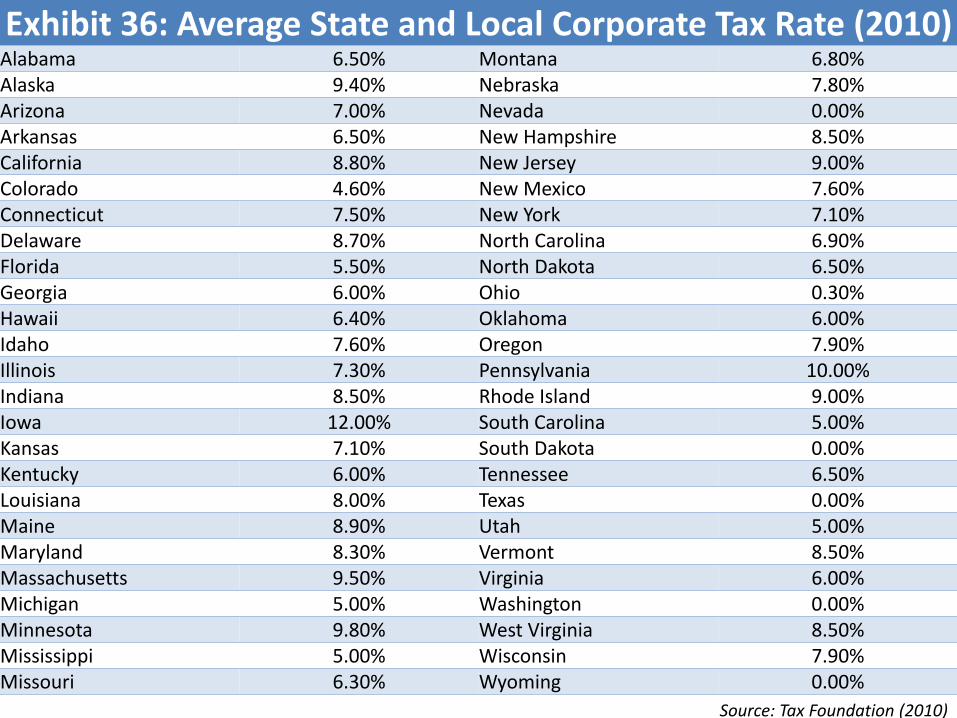
Source: Tax Foundation (2010)
Exhibit 36: Average State and Local Corporate Tax Rate (2010)Alabama 6.50% Montana 6.80%Alaska 9.40% Nebraska 7.80%Arizona 7.00% Nevada 0.00%Arkansas 6.50% New Hampshire 8.50%California 8.80% New Jersey 9.00%Colorado 4.60% New Mexico 7.60%Connecticut 7.50% New York 7.10%Delaware 8.70% North Carolina 6.90%Florida 5.50% North Dakota 6.50%Georgia 6.00% Ohio 0.30%Hawaii 6.40% Oklahoma 6.00%Idaho 7.60% Oregon 7.90%Illinois 7.30% Pennsylvania 10.00%Indiana 8.50% Rhode Island 9.00%Iowa 12.00% South Carolina 5.00%Kansas 7.10% South Dakota 0.00%Kentucky 6.00% Tennessee 6.50%Louisiana 8.00% Texas 0.00%Maine 8.90% Utah 5.00%Maryland 8.30% Vermont 8.50%Massachusetts 9.50% Virginia 6.00%Michigan 5.00% Washington 0.00%Minnesota 9.80% West Virginia 8.50%Mississippi 5.00% Wisconsin 7.90%Missouri 6.30% Wyoming 0.00%
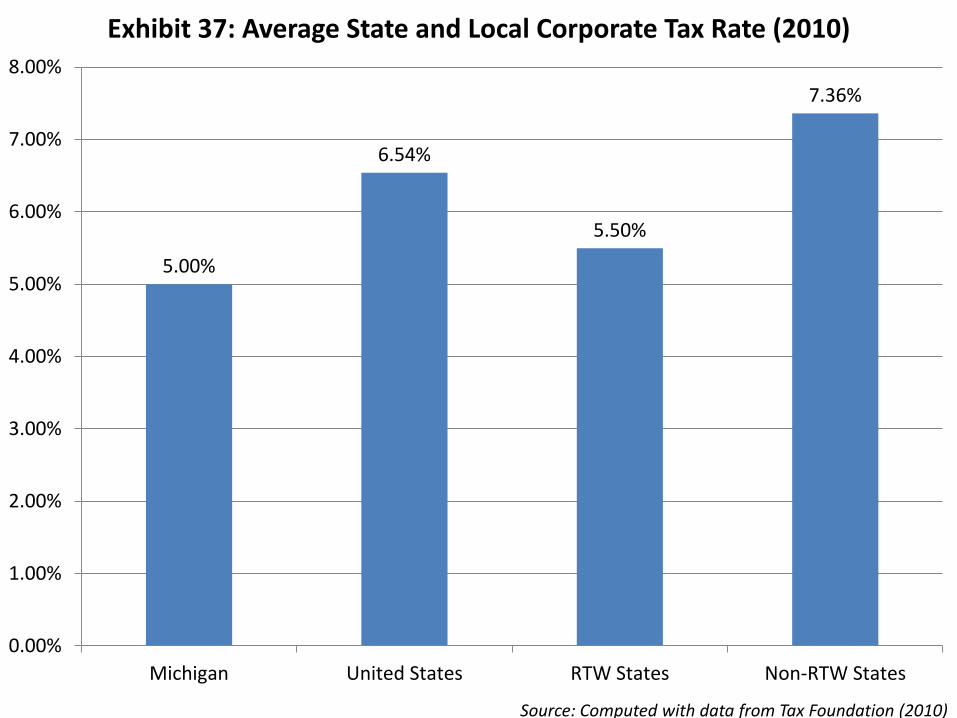
Source: Computed with data from Tax Foundation (2010)
5.00%
6.54%
5.50%
7.36%
0.00%
1.00%
2.00%
3.00%
4.00%
5.00%
6.00%
7.00%
8.00%
Michigan United States RTW States Non-RTW States
Exhibit 37: Average State and Local Corporate Tax Rate (2010)
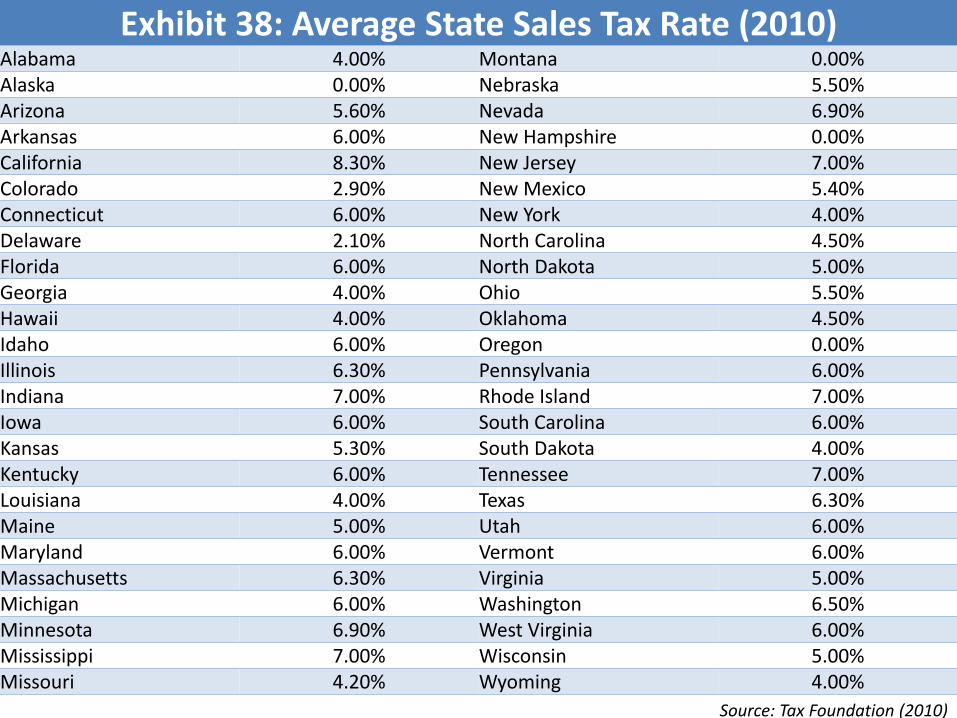
Source: Tax Foundation (2010)
Exhibit 38: Average State Sales Tax Rate (2010)Alabama 4.00% Montana 0.00%Alaska 0.00% Nebraska 5.50%Arizona 5.60% Nevada 6.90%Arkansas 6.00% New Hampshire 0.00%California 8.30% New Jersey 7.00%Colorado 2.90% New Mexico 5.40%Connecticut 6.00% New York 4.00%Delaware 2.10% North Carolina 4.50%Florida 6.00% North Dakota 5.00%Georgia 4.00% Ohio 5.50%Hawaii 4.00% Oklahoma 4.50%Idaho 6.00% Oregon 0.00%Illinois 6.30% Pennsylvania 6.00%Indiana 7.00% Rhode Island 7.00%Iowa 6.00% South Carolina 6.00%Kansas 5.30% South Dakota 4.00%Kentucky 6.00% Tennessee 7.00%Louisiana 4.00% Texas 6.30%Maine 5.00% Utah 6.00%Maryland 6.00% Vermont 6.00%Massachusetts 6.30% Virginia 5.00%Michigan 6.00% Washington 6.50%Minnesota 6.90% West Virginia 6.00%Mississippi 7.00% Wisconsin 5.00%Missouri 4.20% Wyoming 4.00%
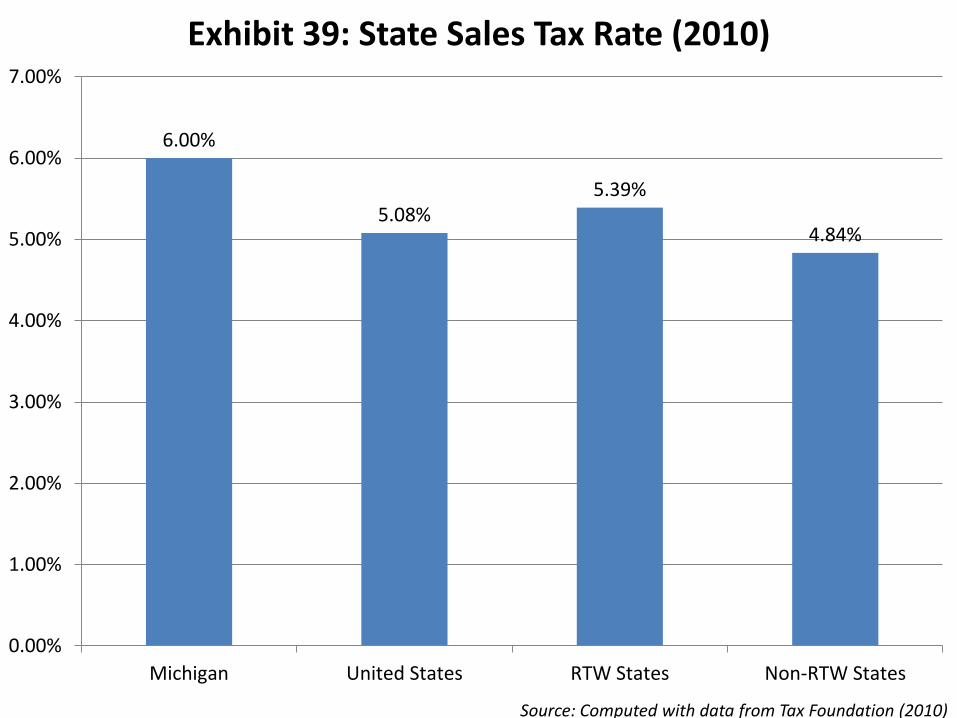
6.00%
5.08%5.39%
4.84%
0.00%
1.00%
2.00%
3.00%
4.00%
5.00%
6.00%
7.00%
Michigan United States RTW States Non-RTW States
Exhibit 39: State Sales Tax Rate (2010)
Source: Computed with data from Tax Foundation (2010)
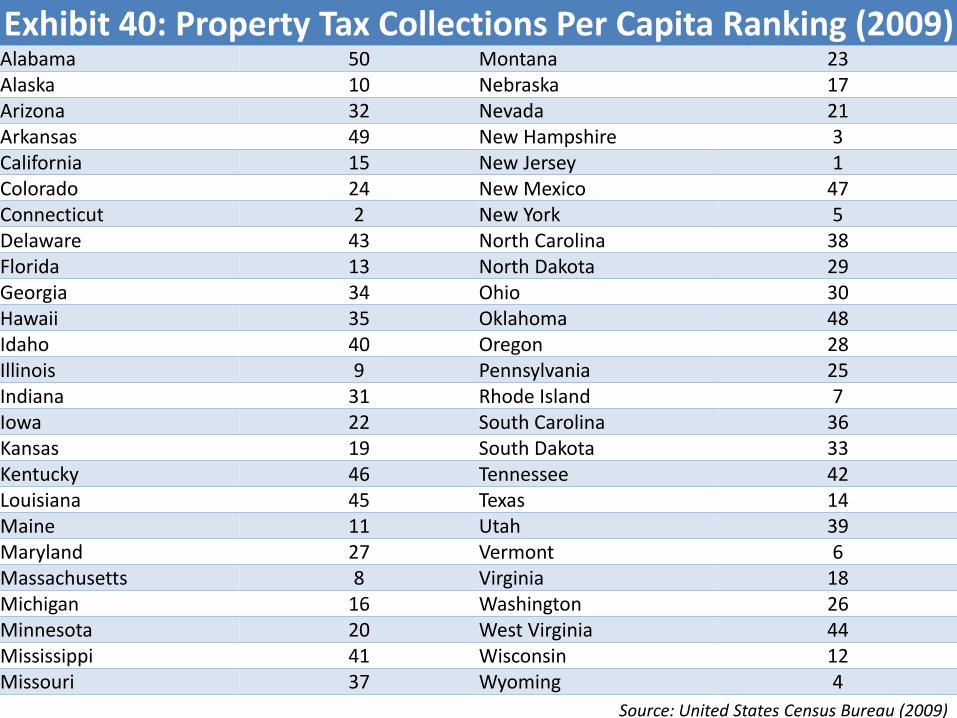
Source: United States Census Bureau (2009)
Exhibit 40: Property Tax Collections Per Capita Ranking (2009)Alabama 50 Montana 23Alaska 10 Nebraska 17Arizona 32 Nevada 21Arkansas 49 New Hampshire 3California 15 New Jersey 1Colorado 24 New Mexico 47Connecticut 2 New York 5Delaware 43 North Carolina 38Florida 13 North Dakota 29Georgia 34 Ohio 30Hawaii 35 Oklahoma 48Idaho 40 Oregon 28Illinois 9 Pennsylvania 25Indiana 31 Rhode Island 7Iowa 22 South Carolina 36Kansas 19 South Dakota 33Kentucky 46 Tennessee 42Louisiana 45 Texas 14Maine 11 Utah 39Maryland 27 Vermont 6Massachusetts 8 Virginia 18Michigan 16 Washington 26Minnesota 20 West Virginia 44Mississippi 41 Wisconsin 12Missouri 37 Wyoming 4
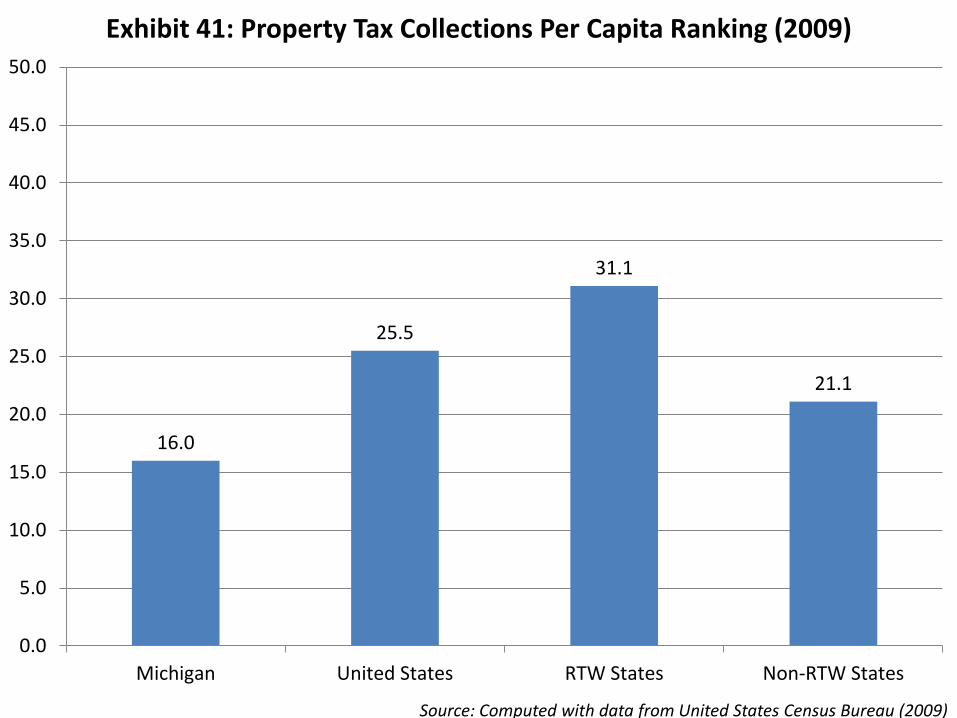
Source: Computed with data from United States Census Bureau (2009)
16.0
25.5
31.1
21.1
0.0
5.0
10.0
15.0
20.0
25.0
30.0
35.0
40.0
45.0
50.0
Michigan United States RTW States Non-RTW States
Exhibit 41: Property Tax Collections Per Capita Ranking (2009)
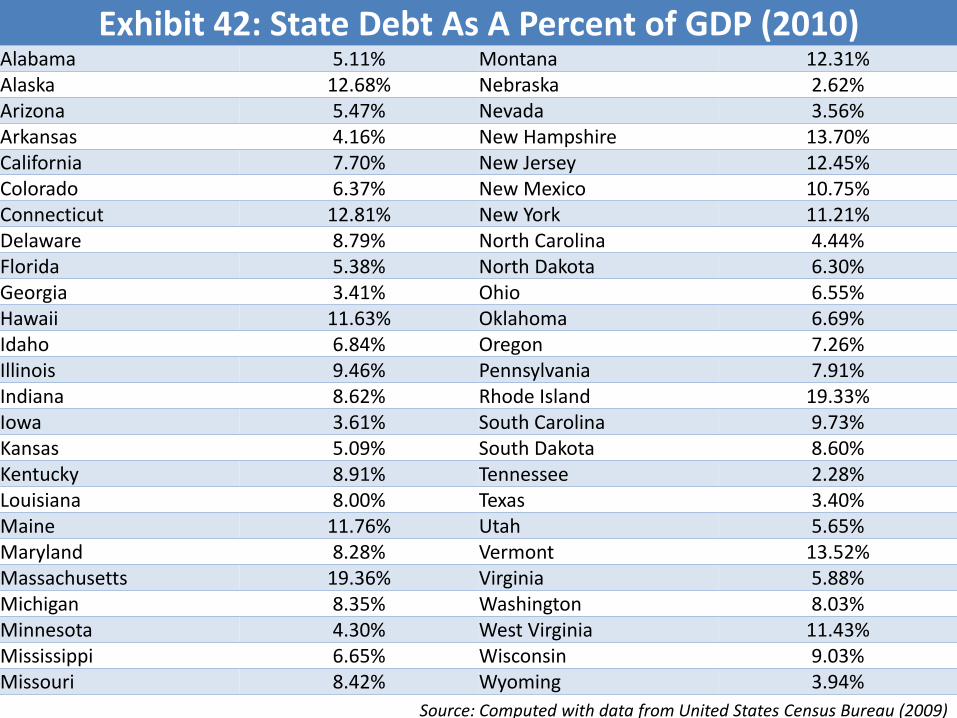
Exhibit 42: State Debt As A Percent of GDP (2010)Alabama 5.11% Montana 12.31%Alaska 12.68% Nebraska 2.62%Arizona 5.47% Nevada 3.56%Arkansas 4.16% New Hampshire 13.70%California 7.70% New Jersey 12.45%Colorado 6.37% New Mexico 10.75%Connecticut 12.81% New York 11.21%Delaware 8.79% North Carolina 4.44%Florida 5.38% North Dakota 6.30%Georgia 3.41% Ohio 6.55%Hawaii 11.63% Oklahoma 6.69%Idaho 6.84% Oregon 7.26%Illinois 9.46% Pennsylvania 7.91%Indiana 8.62% Rhode Island 19.33%Iowa 3.61% South Carolina 9.73%Kansas 5.09% South Dakota 8.60%Kentucky 8.91% Tennessee 2.28%Louisiana 8.00% Texas 3.40%Maine 11.76% Utah 5.65%Maryland 8.28% Vermont 13.52%Massachusetts 19.36% Virginia 5.88%Michigan 8.35% Washington 8.03%Minnesota 4.30% West Virginia 11.43%Mississippi 6.65% Wisconsin 9.03%Missouri 8.42% Wyoming 3.94%
Source: Computed with data from United States Census Bureau (2009)
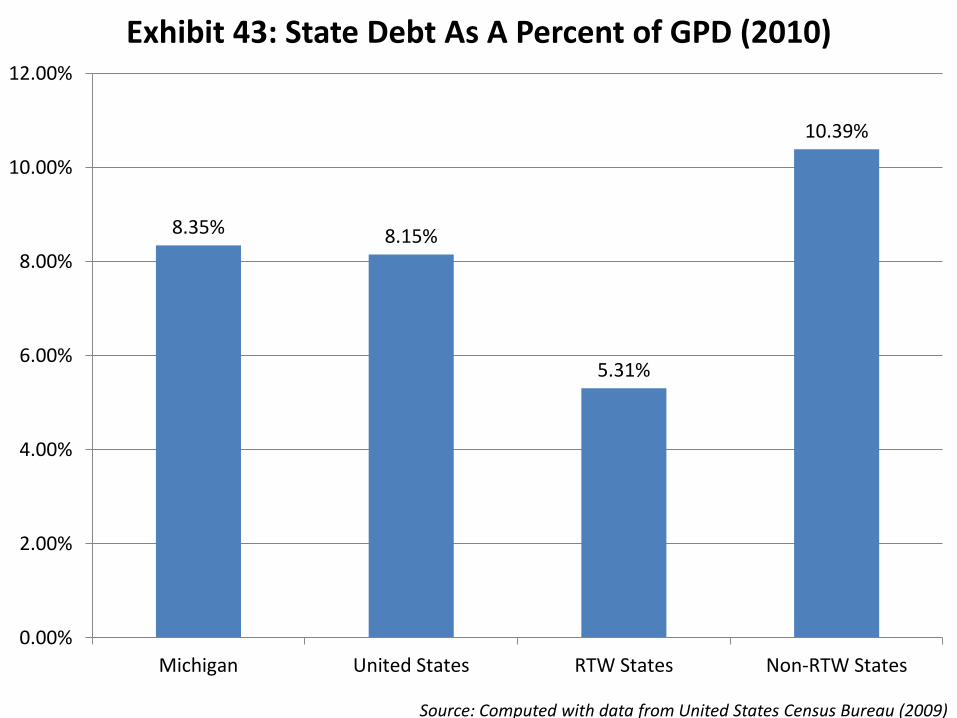
8.35% 8.15%
5.31%
10.39%
0.00%
2.00%
4.00%
6.00%
8.00%
10.00%
12.00%
Michigan United States RTW States Non-RTW States
Exhibit 43: State Debt As A Percent of GPD (2010)
Source: Computed with data from United States Census Bureau (2009)
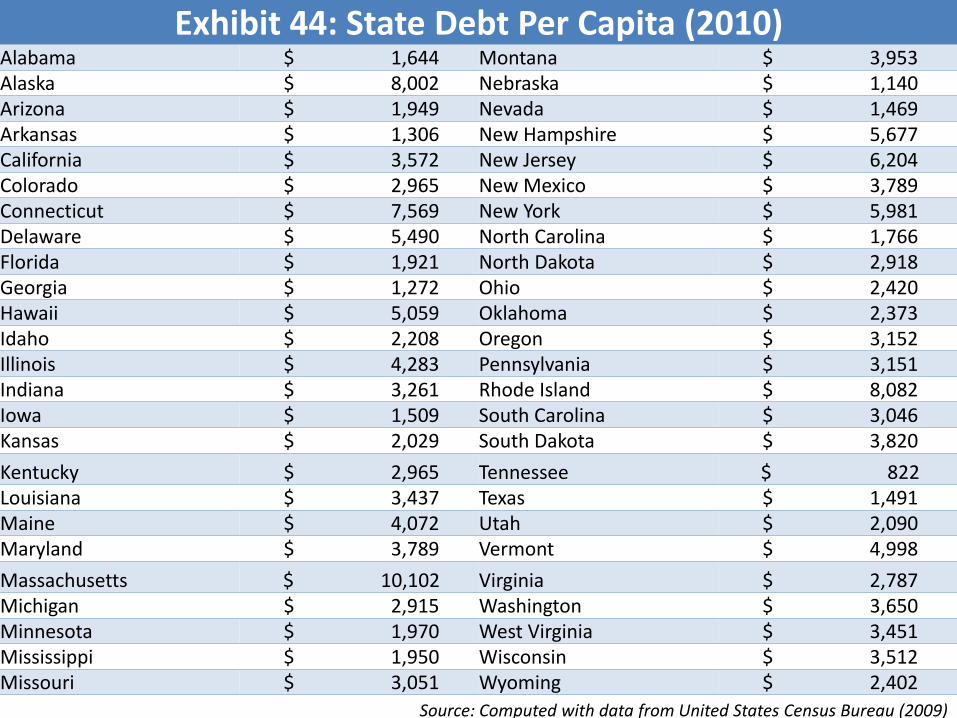
Exhibit 44: State Debt Per Capita (2010)Alabama $ 1,644 Montana $ 3,953 Alaska $ 8,002 Nebraska $ 1,140 Arizona $ 1,949 Nevada $ 1,469 Arkansas $ 1,306 New Hampshire $ 5,677 California $ 3,572 New Jersey $ 6,204 Colorado $ 2,965 New Mexico $ 3,789 Connecticut $ 7,569 New York $ 5,981 Delaware $ 5,490 North Carolina $ 1,766 Florida $ 1,921 North Dakota $ 2,918 Georgia $ 1,272 Ohio $ 2,420 Hawaii $ 5,059 Oklahoma $ 2,373 Idaho $ 2,208 Oregon $ 3,152 Illinois $ 4,283 Pennsylvania $ 3,151 Indiana $ 3,261 Rhode Island $ 8,082 Iowa $ 1,509 South Carolina $ 3,046 Kansas $ 2,029 South Dakota $ 3,820
Kentucky $ 2,965 Tennessee $ 822 Louisiana $ 3,437 Texas $ 1,491 Maine $ 4,072 Utah $ 2,090 Maryland $ 3,789 Vermont $ 4,998
Massachusetts $ 10,102 Virginia $ 2,787 Michigan $ 2,915 Washington $ 3,650 Minnesota $ 1,970 West Virginia $ 3,451 Mississippi $ 1,950 Wisconsin $ 3,512 Missouri $ 3,051 Wyoming $ 2,402
Source: Computed with data from United States Census Bureau (2009)
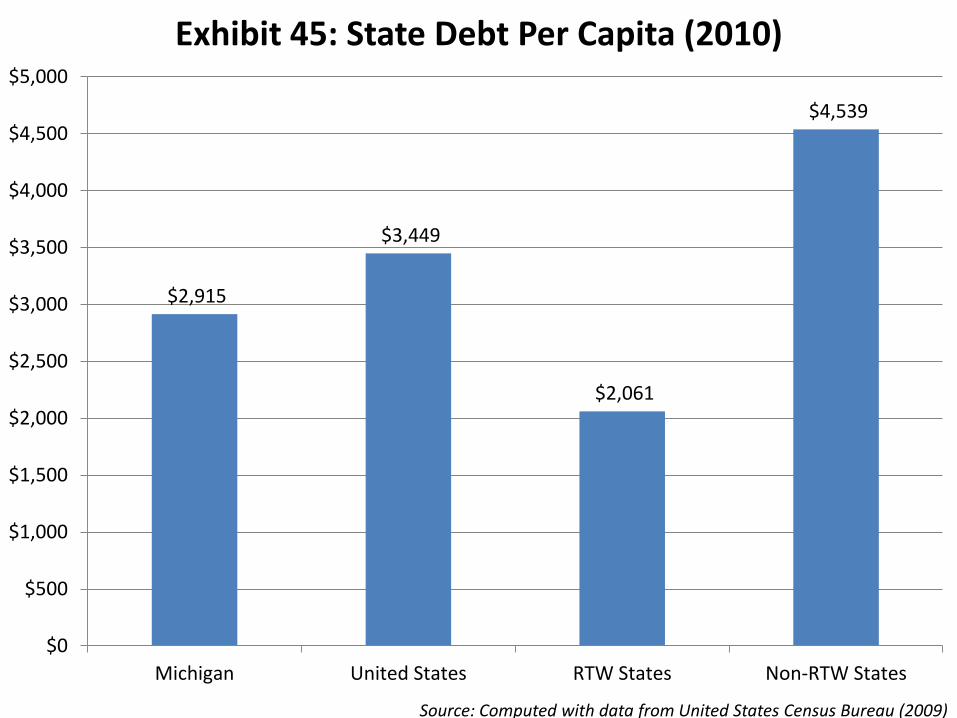
$2,915
$3,449
$2,061
$4,539
$0
$500
$1,000
$1,500
$2,000
$2,500
$3,000
$3,500
$4,000
$4,500
$5,000
Michigan United States RTW States Non-RTW States
Exhibit 45: State Debt Per Capita (2010)
Source: Computed with data from United States Census Bureau (2009)
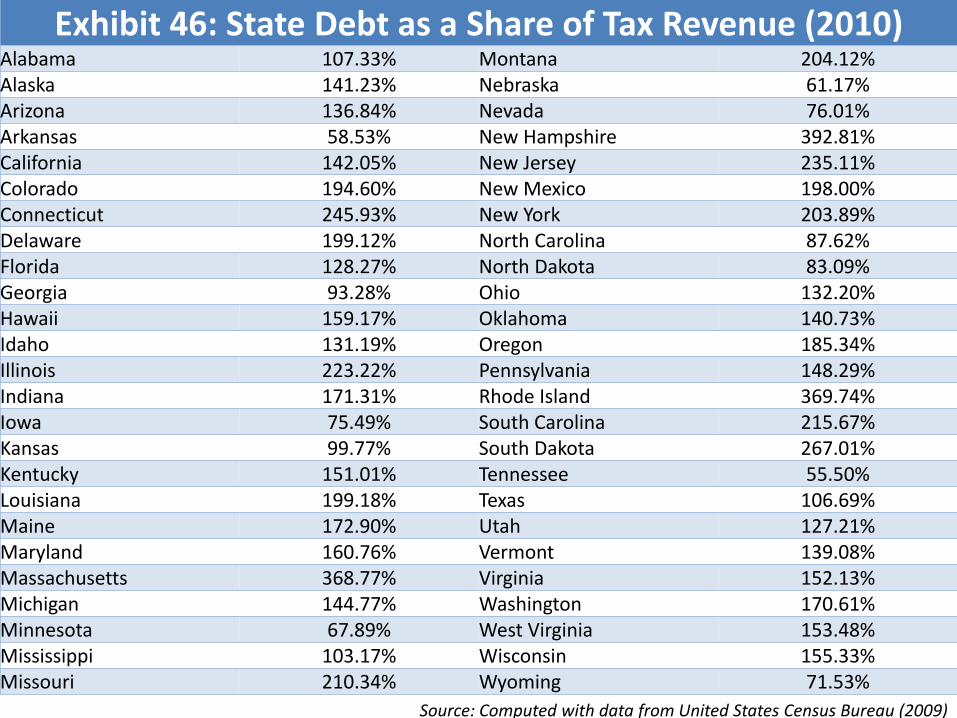
Exhibit 46: State Debt as a Share of Tax Revenue (2010)Alabama 107.33% Montana 204.12%Alaska 141.23% Nebraska 61.17%Arizona 136.84% Nevada 76.01%Arkansas 58.53% New Hampshire 392.81%California 142.05% New Jersey 235.11%Colorado 194.60% New Mexico 198.00%Connecticut 245.93% New York 203.89%Delaware 199.12% North Carolina 87.62%Florida 128.27% North Dakota 83.09%Georgia 93.28% Ohio 132.20%Hawaii 159.17% Oklahoma 140.73%Idaho 131.19% Oregon 185.34%Illinois 223.22% Pennsylvania 148.29%Indiana 171.31% Rhode Island 369.74%Iowa 75.49% South Carolina 215.67%Kansas 99.77% South Dakota 267.01%Kentucky 151.01% Tennessee 55.50%Louisiana 199.18% Texas 106.69%Maine 172.90% Utah 127.21%Maryland 160.76% Vermont 139.08%Massachusetts 368.77% Virginia 152.13%Michigan 144.77% Washington 170.61%Minnesota 67.89% West Virginia 153.48%Mississippi 103.17% Wisconsin 155.33%Missouri 210.34% Wyoming 71.53%
Source: Computed with data from United States Census Bureau (2009)
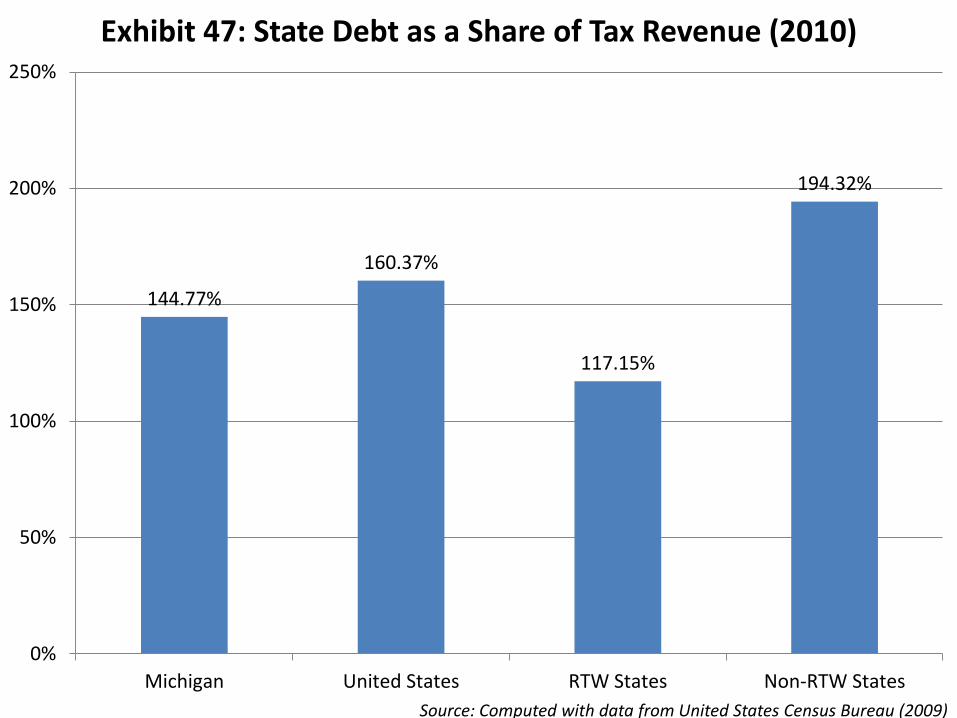
144.77%
160.37%
117.15%
194.32%
0%
50%
100%
150%
200%
250%
Michigan United States RTW States Non-RTW States
Exhibit 47: State Debt as a Share of Tax Revenue (2010)
Source: Computed with data from United States Census Bureau (2009)
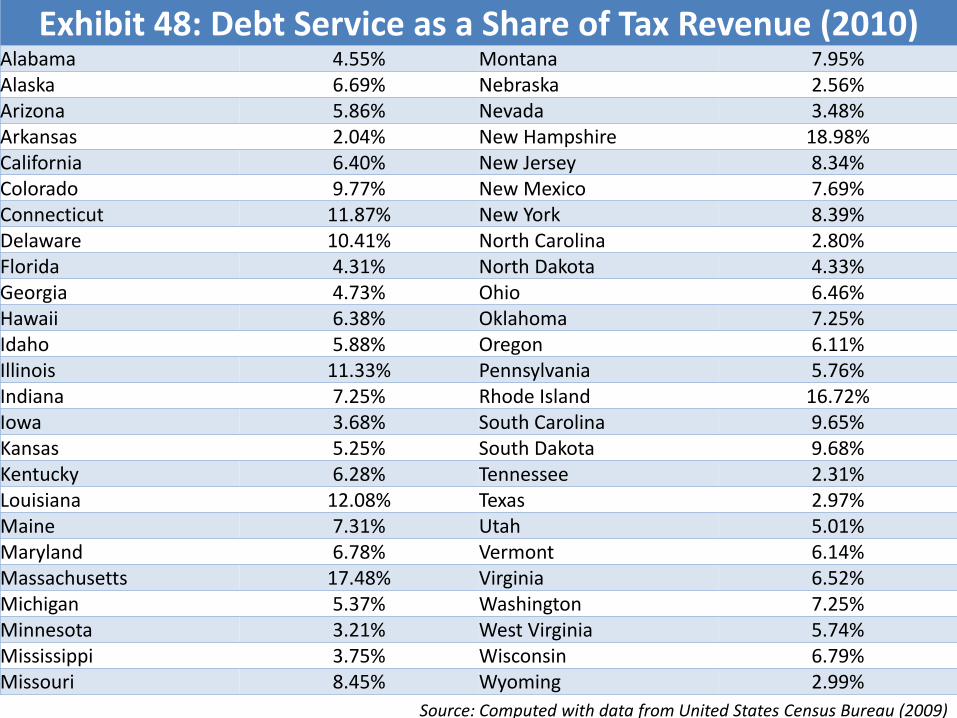
Exhibit 48: Debt Service as a Share of Tax Revenue (2010)Alabama 4.55% Montana 7.95%Alaska 6.69% Nebraska 2.56%Arizona 5.86% Nevada 3.48%Arkansas 2.04% New Hampshire 18.98%California 6.40% New Jersey 8.34%Colorado 9.77% New Mexico 7.69%Connecticut 11.87% New York 8.39%Delaware 10.41% North Carolina 2.80%Florida 4.31% North Dakota 4.33%Georgia 4.73% Ohio 6.46%Hawaii 6.38% Oklahoma 7.25%Idaho 5.88% Oregon 6.11%Illinois 11.33% Pennsylvania 5.76%Indiana 7.25% Rhode Island 16.72%Iowa 3.68% South Carolina 9.65%Kansas 5.25% South Dakota 9.68%Kentucky 6.28% Tennessee 2.31%Louisiana 12.08% Texas 2.97%Maine 7.31% Utah 5.01%Maryland 6.78% Vermont 6.14%Massachusetts 17.48% Virginia 6.52%Michigan 5.37% Washington 7.25%Minnesota 3.21% West Virginia 5.74%Mississippi 3.75% Wisconsin 6.79%Missouri 8.45% Wyoming 2.99%
Source: Computed with data from United States Census Bureau (2009)
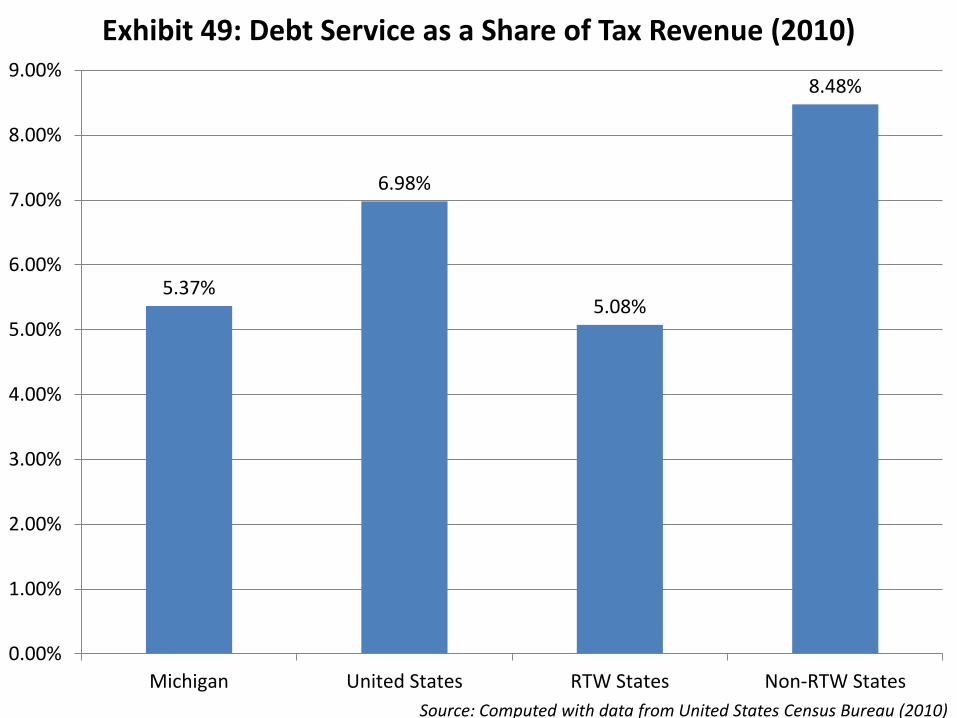
5.37%
6.98%
5.08%
8.48%
0.00%
1.00%
2.00%
3.00%
4.00%
5.00%
6.00%
7.00%
8.00%
9.00%
Michigan United States RTW States Non-RTW States
Exhibit 49: Debt Service as a Share of Tax Revenue (2010)
Source: Computed with data from United States Census Bureau (2010)
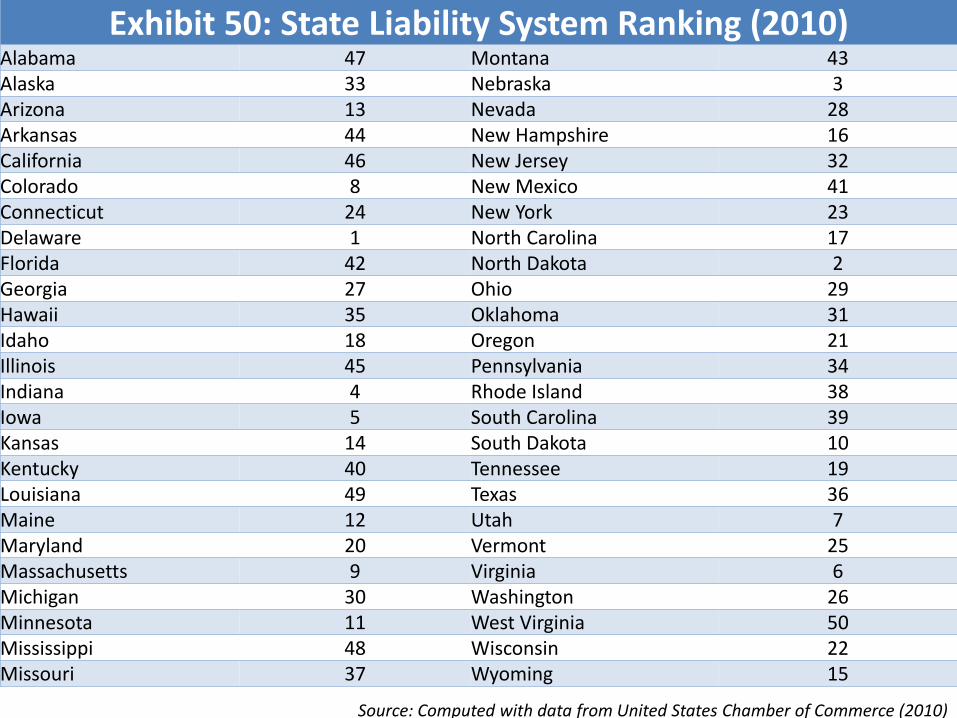
Exhibit 50: State Liability System Ranking (2010)Alabama 47 Montana 43Alaska 33 Nebraska 3Arizona 13 Nevada 28Arkansas 44 New Hampshire 16California 46 New Jersey 32Colorado 8 New Mexico 41Connecticut 24 New York 23Delaware 1 North Carolina 17Florida 42 North Dakota 2Georgia 27 Ohio 29Hawaii 35 Oklahoma 31Idaho 18 Oregon 21Illinois 45 Pennsylvania 34Indiana 4 Rhode Island 38Iowa 5 South Carolina 39Kansas 14 South Dakota 10Kentucky 40 Tennessee 19Louisiana 49 Texas 36Maine 12 Utah 7Maryland 20 Vermont 25Massachusetts 9 Virginia 6Michigan 30 Washington 26Minnesota 11 West Virginia 50Mississippi 48 Wisconsin 22Missouri 37 Wyoming 15
Source: Computed with data from United States Chamber of Commerce (2010)
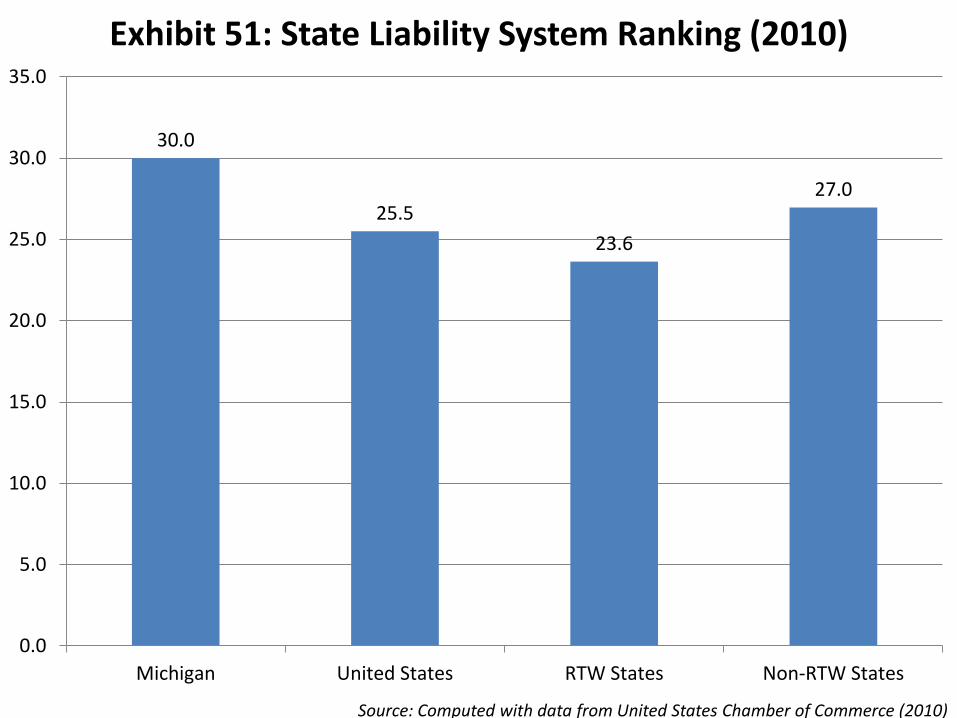
30.0
25.5
23.6
27.0
0.0
5.0
10.0
15.0
20.0
25.0
30.0
35.0
Michigan United States RTW States Non-RTW States
Exhibit 51: State Liability System Ranking (2010)
Source: Computed with data from United States Chamber of Commerce (2010)
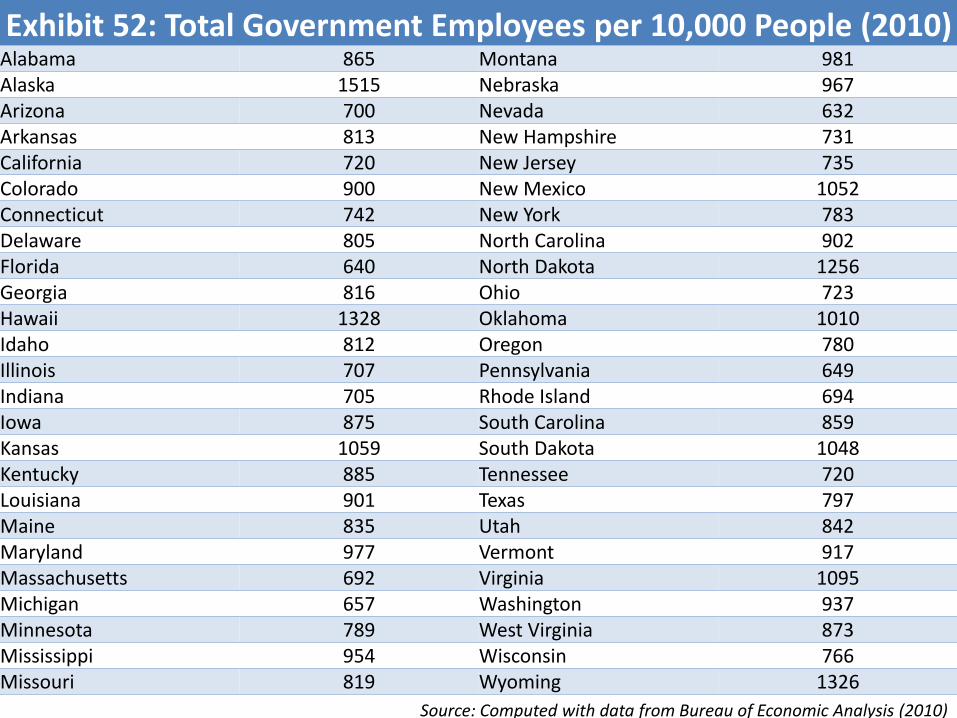
Exhibit 52: Total Government Employees per 10,000 People (2010)Alabama 865 Montana 981Alaska 1515 Nebraska 967Arizona 700 Nevada 632Arkansas 813 New Hampshire 731California 720 New Jersey 735Colorado 900 New Mexico 1052Connecticut 742 New York 783Delaware 805 North Carolina 902Florida 640 North Dakota 1256Georgia 816 Ohio 723Hawaii 1328 Oklahoma 1010Idaho 812 Oregon 780Illinois 707 Pennsylvania 649Indiana 705 Rhode Island 694Iowa 875 South Carolina 859Kansas 1059 South Dakota 1048Kentucky 885 Tennessee 720Louisiana 901 Texas 797Maine 835 Utah 842Maryland 977 Vermont 917Massachusetts 692 Virginia 1095Michigan 657 Washington 937Minnesota 789 West Virginia 873Mississippi 954 Wisconsin 766Missouri 819 Wyoming 1326
Source: Computed with data from Bureau of Economic Analysis (2010)
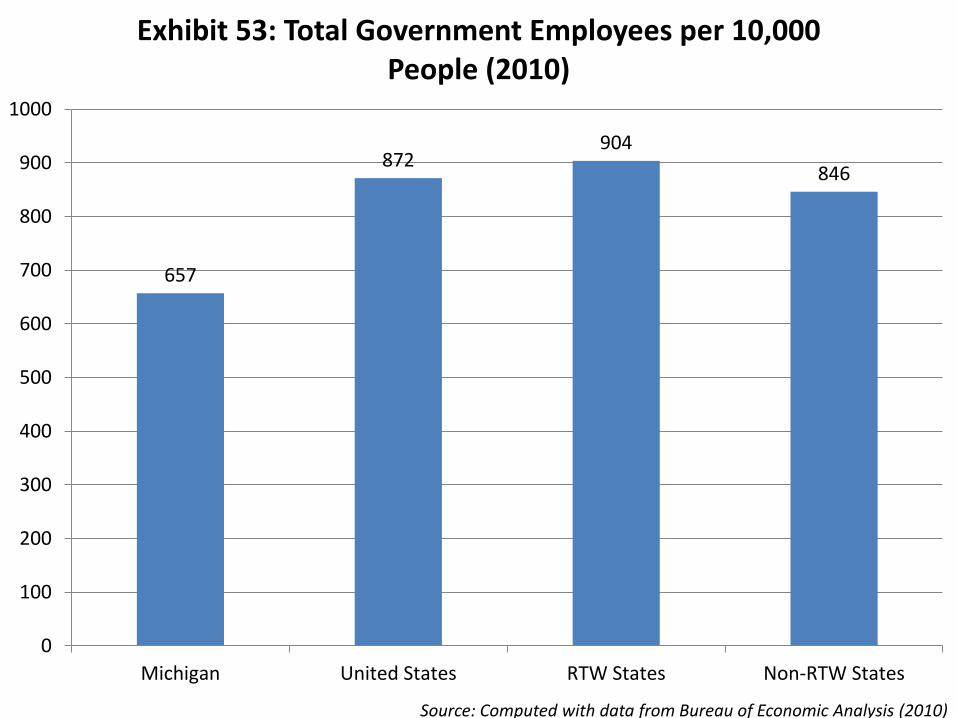
657
872904
846
0
100
200
300
400
500
600
700
800
900
1000
Michigan United States RTW States Non-RTW States
Exhibit 53: Total Government Employees per 10,000 People (2010)
Source: Computed with data from Bureau of Economic Analysis (2010)
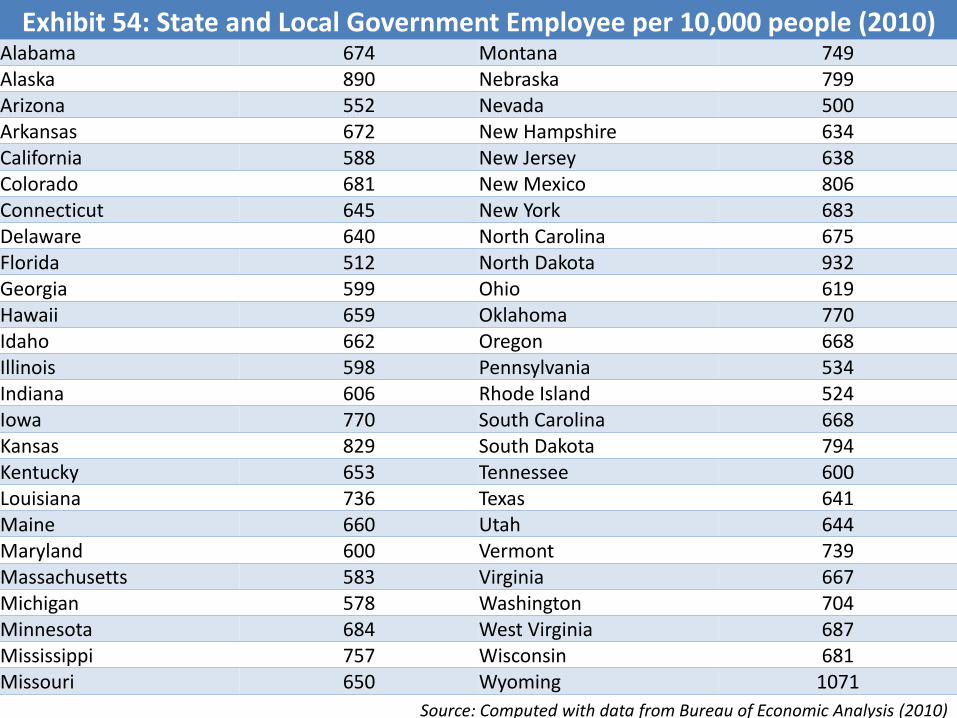
Exhibit 54: State and Local Government Employee per 10,000 people (2010)Alabama 674 Montana 749Alaska 890 Nebraska 799Arizona 552 Nevada 500Arkansas 672 New Hampshire 634California 588 New Jersey 638Colorado 681 New Mexico 806Connecticut 645 New York 683Delaware 640 North Carolina 675Florida 512 North Dakota 932Georgia 599 Ohio 619Hawaii 659 Oklahoma 770Idaho 662 Oregon 668Illinois 598 Pennsylvania 534Indiana 606 Rhode Island 524Iowa 770 South Carolina 668Kansas 829 South Dakota 794Kentucky 653 Tennessee 600Louisiana 736 Texas 641Maine 660 Utah 644Maryland 600 Vermont 739Massachusetts 583 Virginia 667Michigan 578 Washington 704Minnesota 684 West Virginia 687Mississippi 757 Wisconsin 681Missouri 650 Wyoming 1071
Source: Computed with data from Bureau of Economic Analysis (2010)
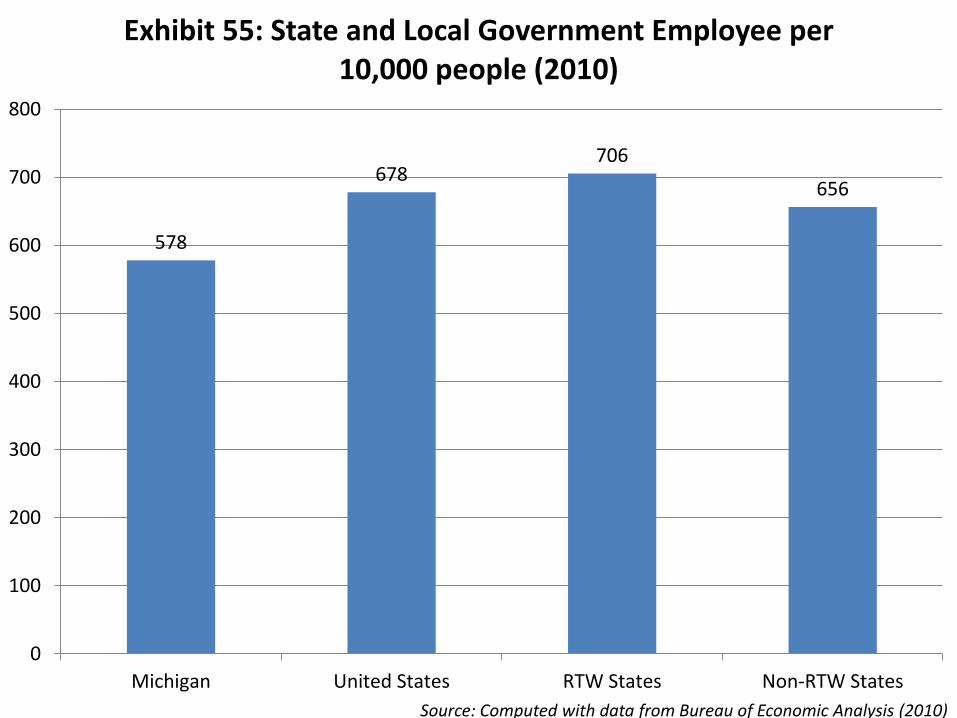
578
678706
656
0
100
200
300
400
500
600
700
800
Michigan United States RTW States Non-RTW States
Exhibit 55: State and Local Government Employee per 10,000 people (2010)
Source: Computed with data from Bureau of Economic Analysis (2010)
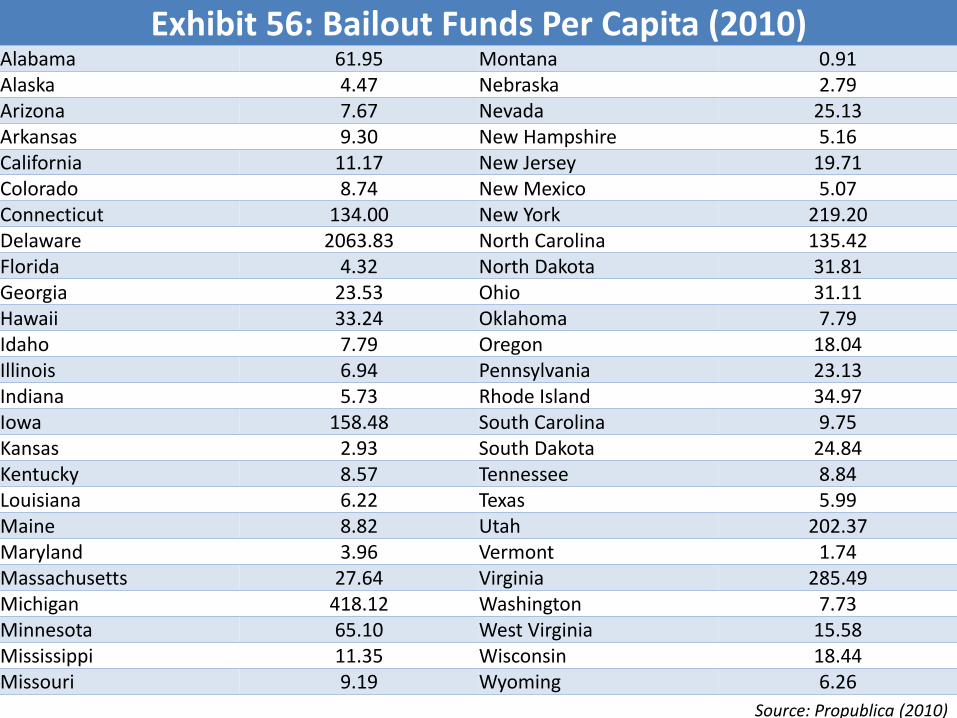
Exhibit 56: Bailout Funds Per Capita (2010) Alabama 61.95 Montana 0.91Alaska 4.47 Nebraska 2.79Arizona 7.67 Nevada 25.13Arkansas 9.30 New Hampshire 5.16California 11.17 New Jersey 19.71Colorado 8.74 New Mexico 5.07Connecticut 134.00 New York 219.20Delaware 2063.83 North Carolina 135.42Florida 4.32 North Dakota 31.81Georgia 23.53 Ohio 31.11Hawaii 33.24 Oklahoma 7.79Idaho 7.79 Oregon 18.04Illinois 6.94 Pennsylvania 23.13Indiana 5.73 Rhode Island 34.97Iowa 158.48 South Carolina 9.75Kansas 2.93 South Dakota 24.84Kentucky 8.57 Tennessee 8.84Louisiana 6.22 Texas 5.99Maine 8.82 Utah 202.37Maryland 3.96 Vermont 1.74Massachusetts 27.64 Virginia 285.49Michigan 418.12 Washington 7.73Minnesota 65.10 West Virginia 15.58Mississippi 11.35 Wisconsin 18.44Missouri 9.19 Wyoming 6.26
Source: Propublica (2010)
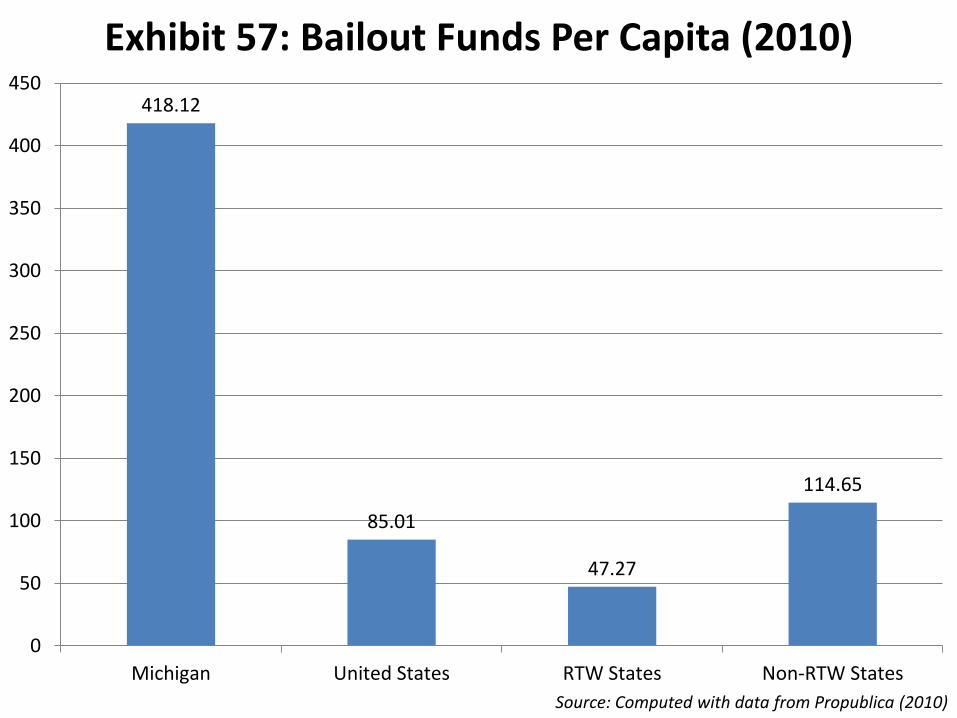
418.12
85.01
47.27
114.65
0
50
100
150
200
250
300
350
400
450
Michigan United States RTW States Non-RTW States
Exhibit 57: Bailout Funds Per Capita (2010)
Source: Computed with data from Propublica (2010)
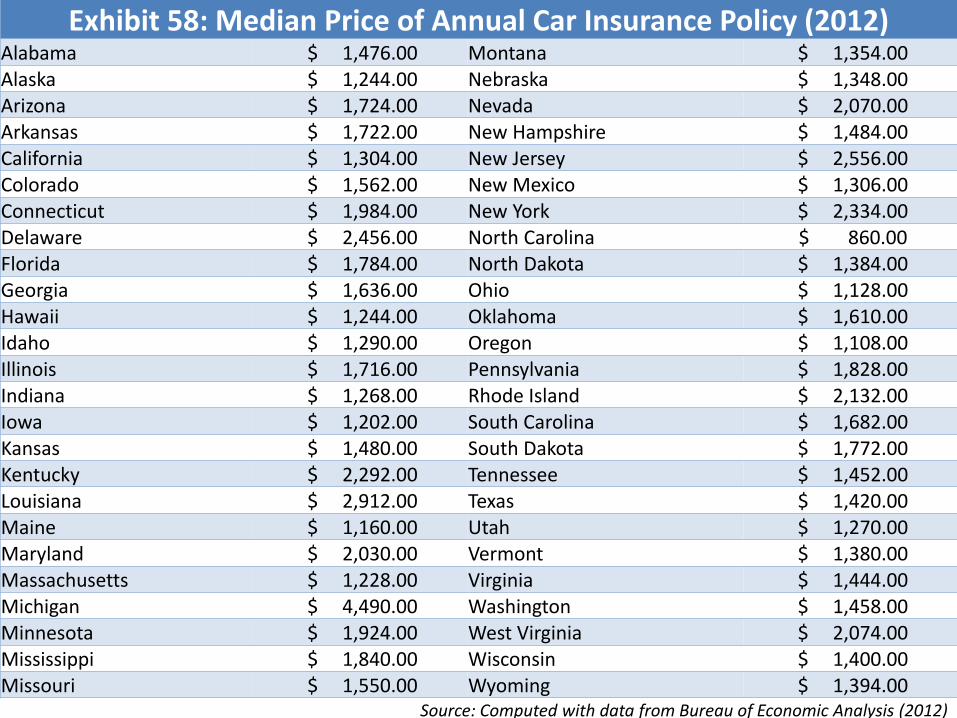
Exhibit 58: Median Price of Annual Car Insurance Policy (2012)Alabama $ 1,476.00 Montana $ 1,354.00 Alaska $ 1,244.00 Nebraska $ 1,348.00 Arizona $ 1,724.00 Nevada $ 2,070.00 Arkansas $ 1,722.00 New Hampshire $ 1,484.00 California $ 1,304.00 New Jersey $ 2,556.00 Colorado $ 1,562.00 New Mexico $ 1,306.00 Connecticut $ 1,984.00 New York $ 2,334.00 Delaware $ 2,456.00 North Carolina $ 860.00 Florida $ 1,784.00 North Dakota $ 1,384.00 Georgia $ 1,636.00 Ohio $ 1,128.00 Hawaii $ 1,244.00 Oklahoma $ 1,610.00 Idaho $ 1,290.00 Oregon $ 1,108.00 Illinois $ 1,716.00 Pennsylvania $ 1,828.00 Indiana $ 1,268.00 Rhode Island $ 2,132.00 Iowa $ 1,202.00 South Carolina $ 1,682.00 Kansas $ 1,480.00 South Dakota $ 1,772.00 Kentucky $ 2,292.00 Tennessee $ 1,452.00 Louisiana $ 2,912.00 Texas $ 1,420.00 Maine $ 1,160.00 Utah $ 1,270.00 Maryland $ 2,030.00 Vermont $ 1,380.00 Massachusetts $ 1,228.00 Virginia $ 1,444.00 Michigan $ 4,490.00 Washington $ 1,458.00 Minnesota $ 1,924.00 West Virginia $ 2,074.00 Mississippi $ 1,840.00 Wisconsin $ 1,400.00 Missouri $ 1,550.00 Wyoming $ 1,394.00
Source: Computed with data from Bureau of Economic Analysis (2012)
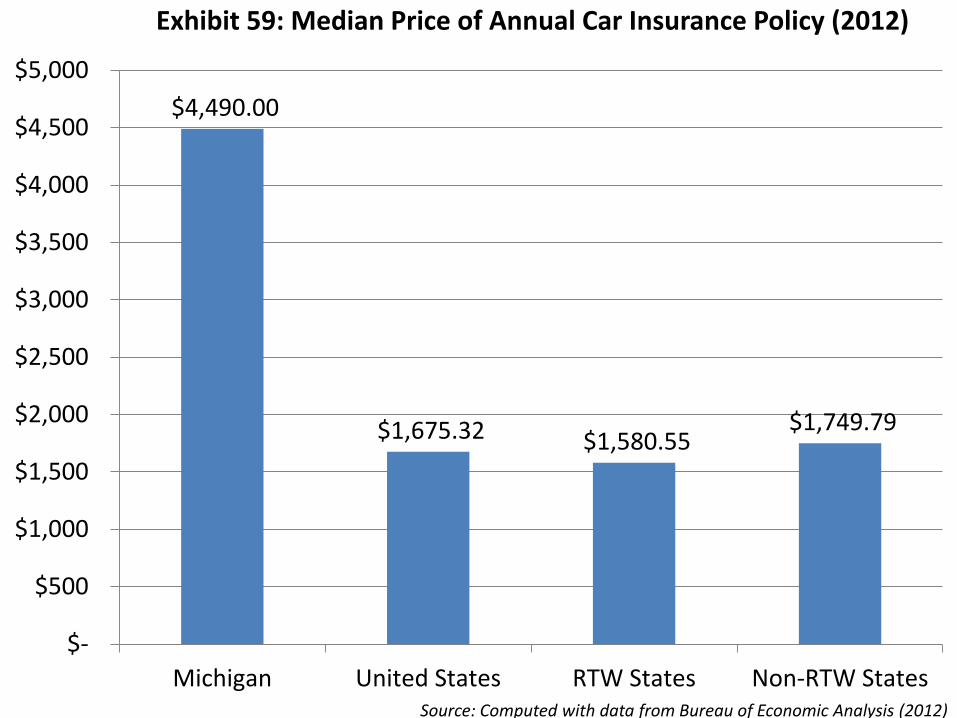
$4,490.00
$1,675.32 $1,580.55 $1,749.79
$-
$500
$1,000
$1,500
$2,000
$2,500
$3,000
$3,500
$4,000
$4,500
$5,000
Michigan United States RTW States Non-RTW States
Exhibit 59: Median Price of Annual Car Insurance Policy (2012)
Source: Computed with data from Bureau of Economic Analysis (2012)
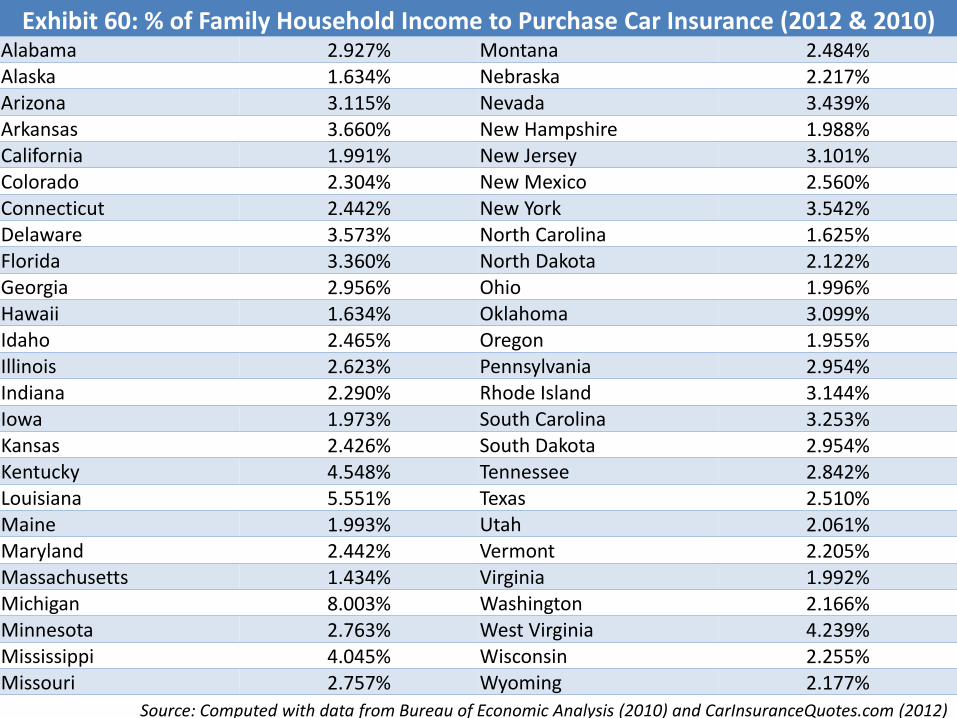
Exhibit 60: % of Family Household Income to Purchase Car Insurance (2012 & 2010)Alabama 2.927% Montana 2.484%Alaska 1.634% Nebraska 2.217%Arizona 3.115% Nevada 3.439%Arkansas 3.660% New Hampshire 1.988%California 1.991% New Jersey 3.101%Colorado 2.304% New Mexico 2.560%Connecticut 2.442% New York 3.542%Delaware 3.573% North Carolina 1.625%Florida 3.360% North Dakota 2.122%Georgia 2.956% Ohio 1.996%Hawaii 1.634% Oklahoma 3.099%Idaho 2.465% Oregon 1.955%Illinois 2.623% Pennsylvania 2.954%Indiana 2.290% Rhode Island 3.144%Iowa 1.973% South Carolina 3.253%Kansas 2.426% South Dakota 2.954%Kentucky 4.548% Tennessee 2.842%Louisiana 5.551% Texas 2.510%Maine 1.993% Utah 2.061%Maryland 2.442% Vermont 2.205%Massachusetts 1.434% Virginia 1.992%Michigan 8.003% Washington 2.166%Minnesota 2.763% West Virginia 4.239%Mississippi 4.045% Wisconsin 2.255%Missouri 2.757% Wyoming 2.177%
Source: Computed with data from Bureau of Economic Analysis (2010) and CarInsuranceQuotes.com (2012)
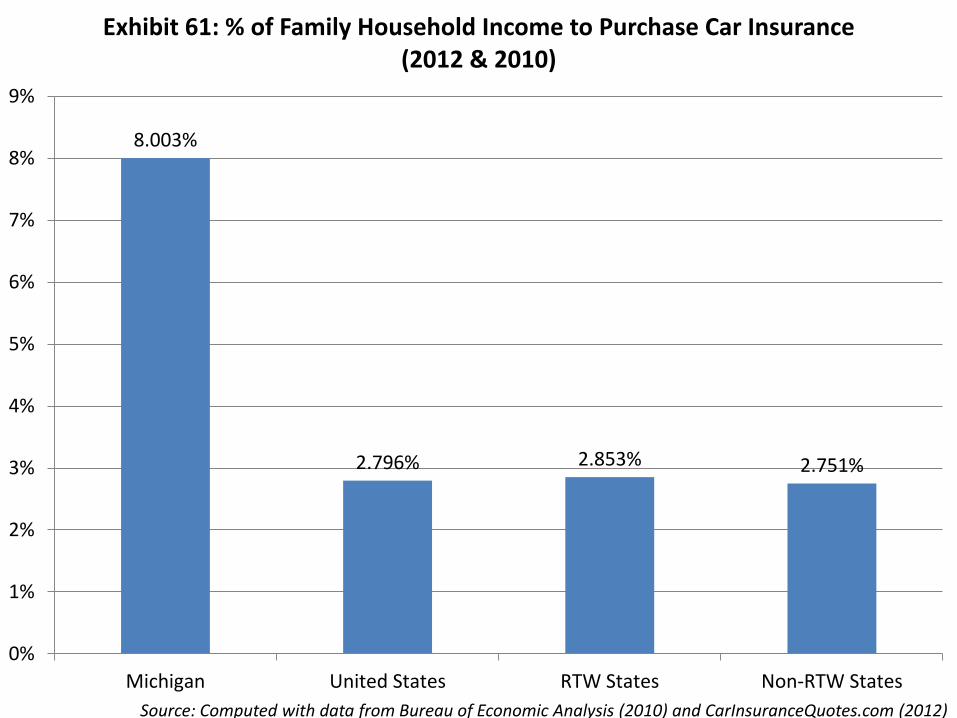
8.003%
2.796% 2.853% 2.751%
0%
1%
2%
3%
4%
5%
6%
7%
8%
9%
Michigan United States RTW States Non-RTW States
Exhibit 61: % of Family Household Income to Purchase Car Insurance (2012 & 2010)
Source: Computed with data from Bureau of Economic Analysis (2010) and CarInsuranceQuotes.com (2012)
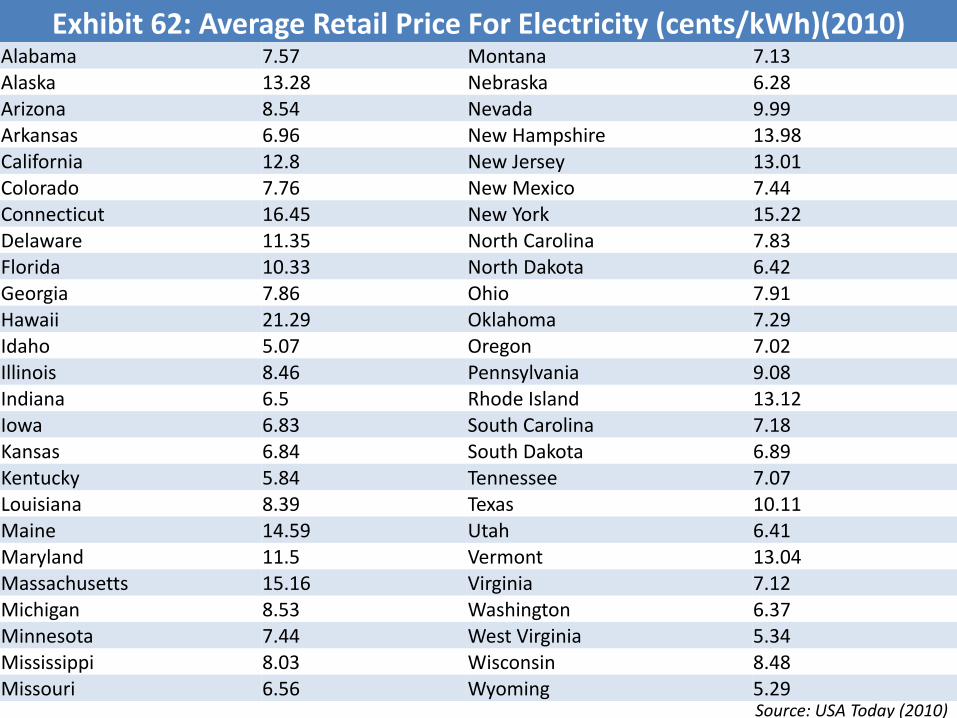
Exhibit 62: Average Retail Price For Electricity (cents/kWh)(2010)Alabama 7.57 Montana 7.13Alaska 13.28 Nebraska 6.28Arizona 8.54 Nevada 9.99Arkansas 6.96 New Hampshire 13.98California 12.8 New Jersey 13.01Colorado 7.76 New Mexico 7.44Connecticut 16.45 New York 15.22Delaware 11.35 North Carolina 7.83Florida 10.33 North Dakota 6.42Georgia 7.86 Ohio 7.91Hawaii 21.29 Oklahoma 7.29Idaho 5.07 Oregon 7.02Illinois 8.46 Pennsylvania 9.08Indiana 6.5 Rhode Island 13.12Iowa 6.83 South Carolina 7.18Kansas 6.84 South Dakota 6.89Kentucky 5.84 Tennessee 7.07Louisiana 8.39 Texas 10.11Maine 14.59 Utah 6.41Maryland 11.5 Vermont 13.04Massachusetts 15.16 Virginia 7.12Michigan 8.53 Washington 6.37Minnesota 7.44 West Virginia 5.34Mississippi 8.03 Wisconsin 8.48Missouri 6.56 Wyoming 5.29
Source: USA Today (2010)
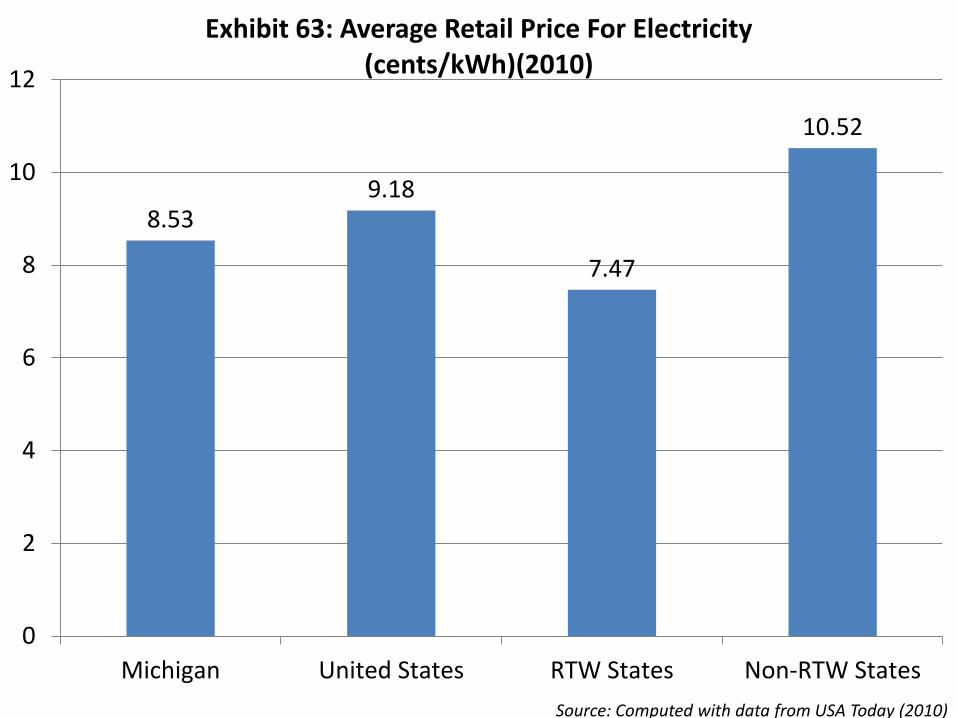
8.539.18
7.47
10.52
0
2
4
6
8
10
12
Michigan United States RTW States Non-RTW States
Exhibit 63: Average Retail Price For Electricity (cents/kWh)(2010)
Source: Computed with data from USA Today (2010)
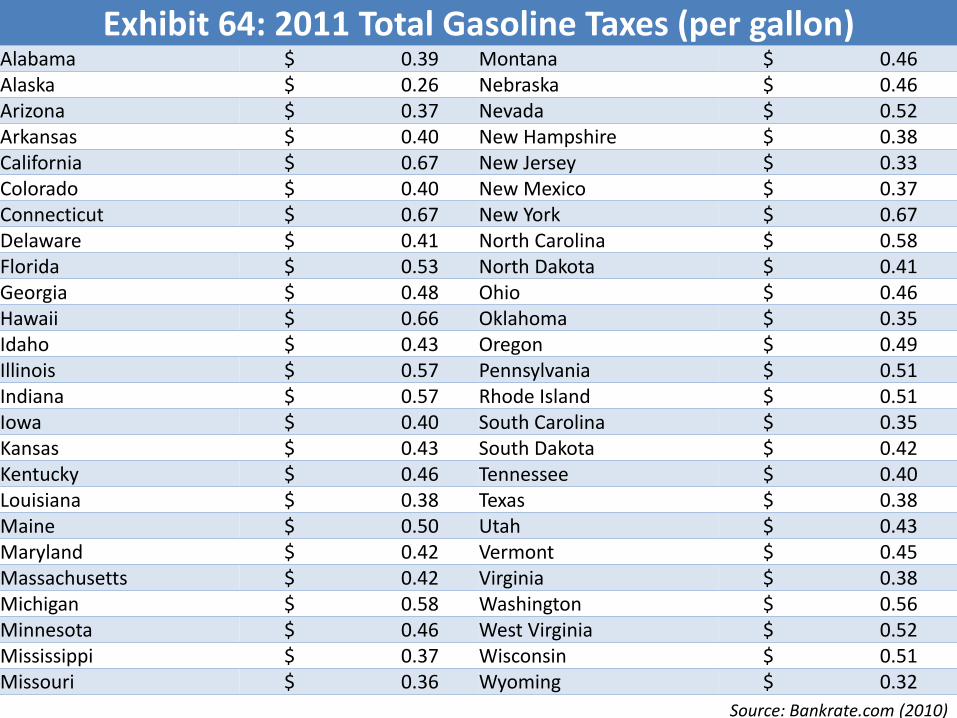
Source: Bankrate.com (2010)
Exhibit 64: 2011 Total Gasoline Taxes (per gallon)Alabama $ 0.39 Montana $ 0.46 Alaska $ 0.26 Nebraska $ 0.46 Arizona $ 0.37 Nevada $ 0.52 Arkansas $ 0.40 New Hampshire $ 0.38 California $ 0.67 New Jersey $ 0.33 Colorado $ 0.40 New Mexico $ 0.37 Connecticut $ 0.67 New York $ 0.67 Delaware $ 0.41 North Carolina $ 0.58 Florida $ 0.53 North Dakota $ 0.41 Georgia $ 0.48 Ohio $ 0.46 Hawaii $ 0.66 Oklahoma $ 0.35 Idaho $ 0.43 Oregon $ 0.49 Illinois $ 0.57 Pennsylvania $ 0.51 Indiana $ 0.57 Rhode Island $ 0.51 Iowa $ 0.40 South Carolina $ 0.35 Kansas $ 0.43 South Dakota $ 0.42 Kentucky $ 0.46 Tennessee $ 0.40 Louisiana $ 0.38 Texas $ 0.38 Maine $ 0.50 Utah $ 0.43 Maryland $ 0.42 Vermont $ 0.45 Massachusetts $ 0.42 Virginia $ 0.38 Michigan $ 0.58 Washington $ 0.56 Minnesota $ 0.46 West Virginia $ 0.52 Mississippi $ 0.37 Wisconsin $ 0.51 Missouri $ 0.36 Wyoming $ 0.32
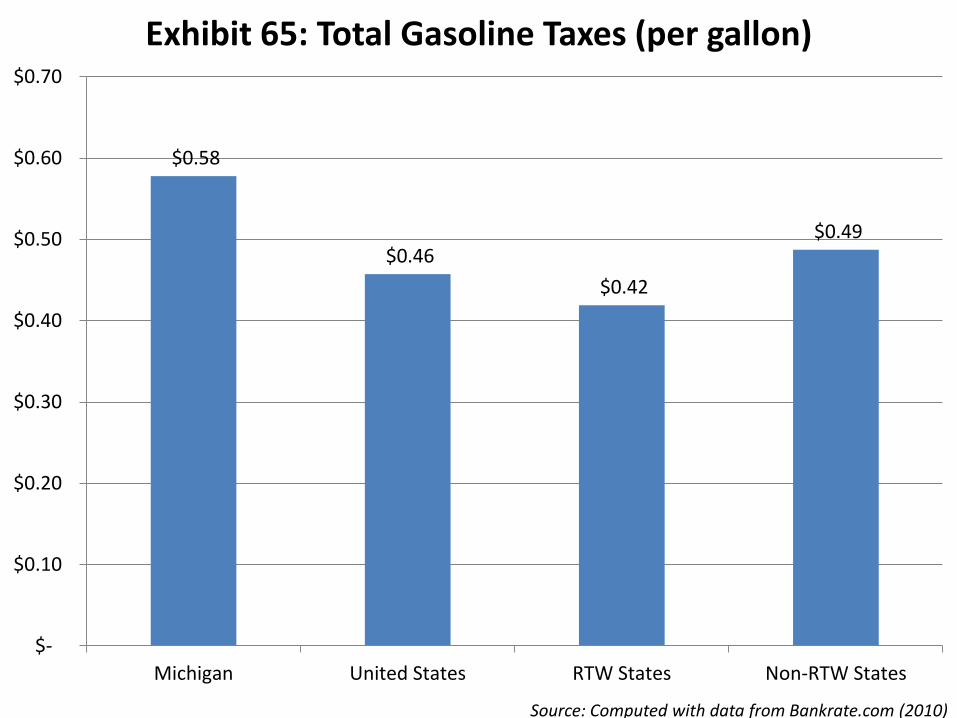
Source: Computed with data from Bankrate.com (2010)
$0.58
$0.46
$0.42
$0.49
$-
$0.10
$0.20
$0.30
$0.40
$0.50
$0.60
$0.70
Michigan United States RTW States Non-RTW States
Exhibit 65: Total Gasoline Taxes (per gallon)
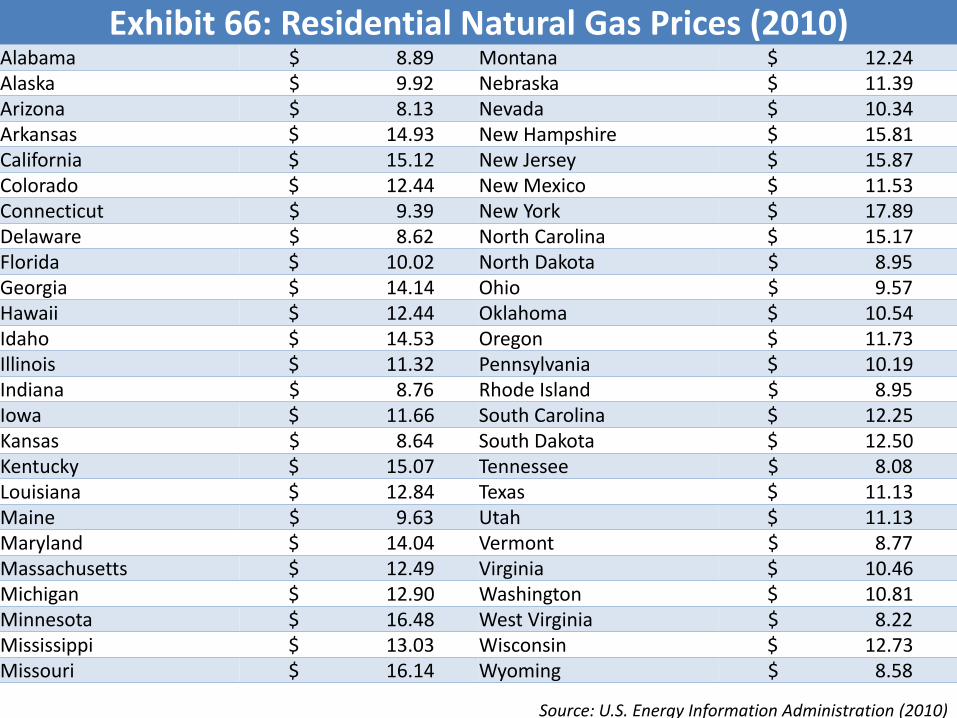
Source: U.S. Energy Information Administration (2010)
Exhibit 66: Residential Natural Gas Prices (2010)Alabama $ 8.89 Montana $ 12.24 Alaska $ 9.92 Nebraska $ 11.39 Arizona $ 8.13 Nevada $ 10.34 Arkansas $ 14.93 New Hampshire $ 15.81 California $ 15.12 New Jersey $ 15.87 Colorado $ 12.44 New Mexico $ 11.53 Connecticut $ 9.39 New York $ 17.89 Delaware $ 8.62 North Carolina $ 15.17 Florida $ 10.02 North Dakota $ 8.95 Georgia $ 14.14 Ohio $ 9.57 Hawaii $ 12.44 Oklahoma $ 10.54 Idaho $ 14.53 Oregon $ 11.73 Illinois $ 11.32 Pennsylvania $ 10.19 Indiana $ 8.76 Rhode Island $ 8.95 Iowa $ 11.66 South Carolina $ 12.25 Kansas $ 8.64 South Dakota $ 12.50 Kentucky $ 15.07 Tennessee $ 8.08 Louisiana $ 12.84 Texas $ 11.13 Maine $ 9.63 Utah $ 11.13 Maryland $ 14.04 Vermont $ 8.77 Massachusetts $ 12.49 Virginia $ 10.46 Michigan $ 12.90 Washington $ 10.81 Minnesota $ 16.48 West Virginia $ 8.22 Mississippi $ 13.03 Wisconsin $ 12.73 Missouri $ 16.14 Wyoming $ 8.58
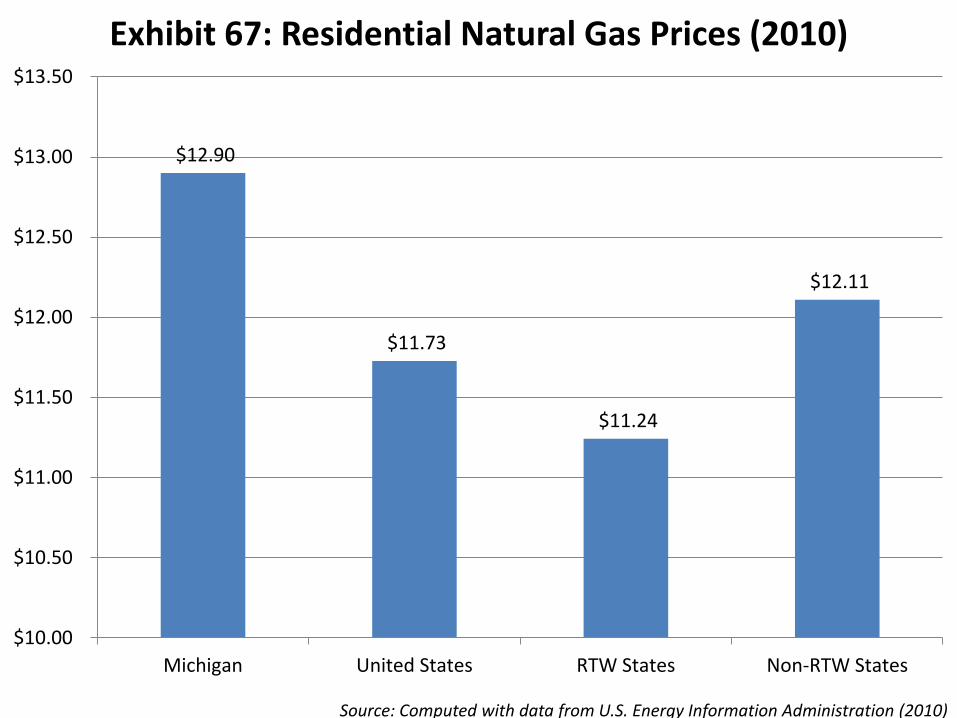
$12.90
$11.73
$11.24
$12.11
$10.00
$10.50
$11.00
$11.50
$12.00
$12.50
$13.00
$13.50
Michigan United States RTW States Non-RTW States
Exhibit 67: Residential Natural Gas Prices (2010)
Source: Computed with data from U.S. Energy Information Administration (2010)
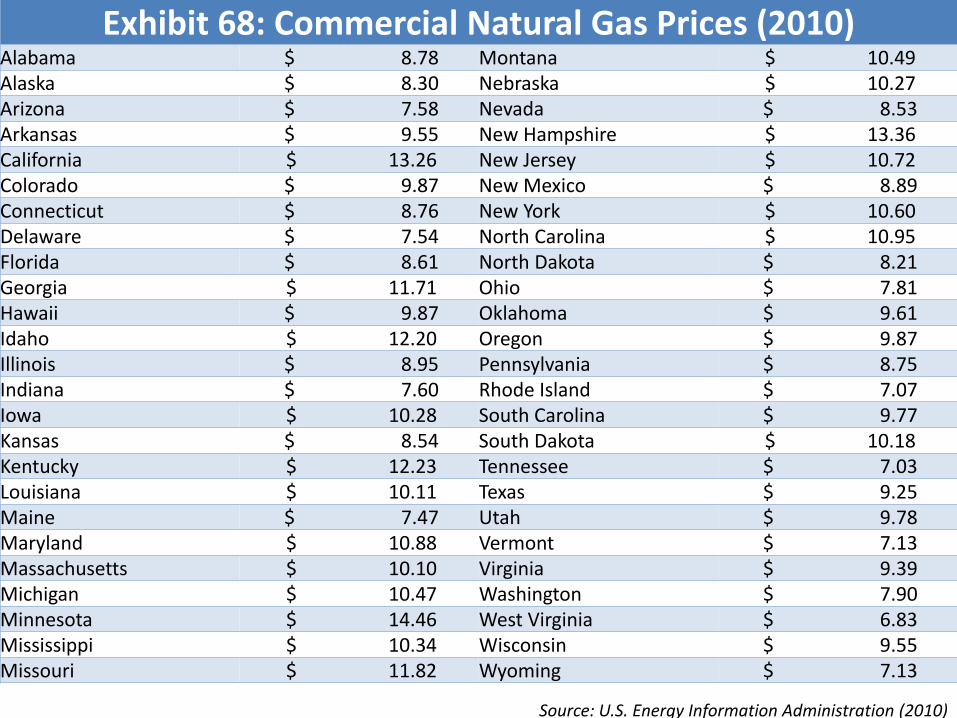
Exhibit 68: Commercial Natural Gas Prices (2010)Alabama $ 8.78 Montana $ 10.49 Alaska $ 8.30 Nebraska $ 10.27 Arizona $ 7.58 Nevada $ 8.53 Arkansas $ 9.55 New Hampshire $ 13.36 California $ 13.26 New Jersey $ 10.72 Colorado $ 9.87 New Mexico $ 8.89 Connecticut $ 8.76 New York $ 10.60 Delaware $ 7.54 North Carolina $ 10.95 Florida $ 8.61 North Dakota $ 8.21 Georgia $ 11.71 Ohio $ 7.81 Hawaii $ 9.87 Oklahoma $ 9.61 Idaho $ 12.20 Oregon $ 9.87 Illinois $ 8.95 Pennsylvania $ 8.75 Indiana $ 7.60 Rhode Island $ 7.07 Iowa $ 10.28 South Carolina $ 9.77 Kansas $ 8.54 South Dakota $ 10.18 Kentucky $ 12.23 Tennessee $ 7.03 Louisiana $ 10.11 Texas $ 9.25 Maine $ 7.47 Utah $ 9.78 Maryland $ 10.88 Vermont $ 7.13 Massachusetts $ 10.10 Virginia $ 9.39 Michigan $ 10.47 Washington $ 7.90 Minnesota $ 14.46 West Virginia $ 6.83 Mississippi $ 10.34 Wisconsin $ 9.55 Missouri $ 11.82 Wyoming $ 7.13
Source: U.S. Energy Information Administration (2010)
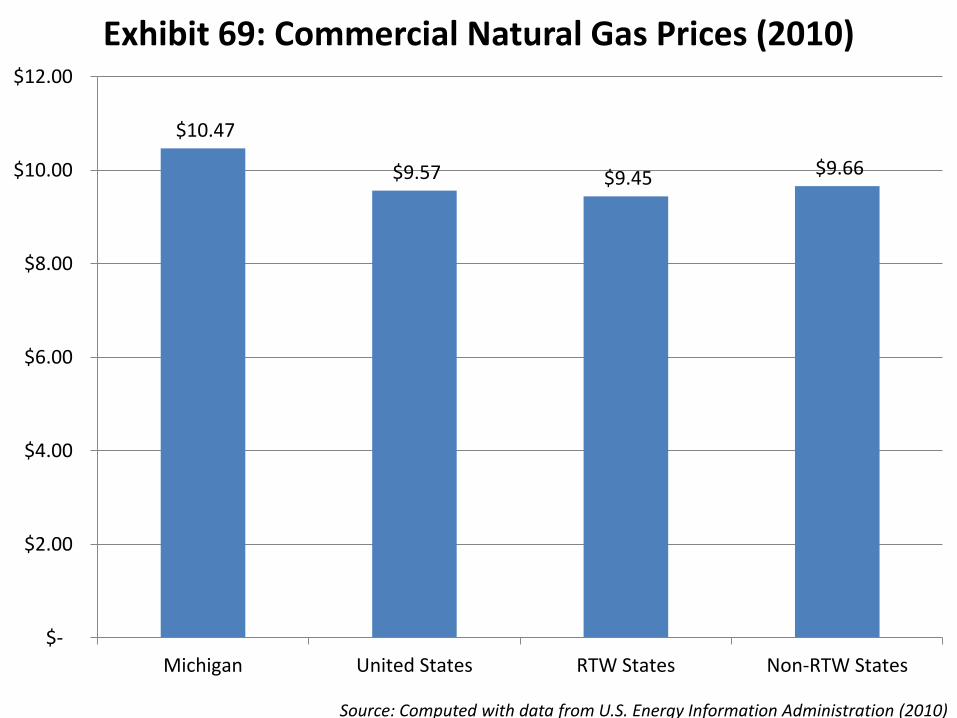
$10.47
$9.57 $9.45 $9.66
$-
$2.00
$4.00
$6.00
$8.00
$10.00
$12.00
Michigan United States RTW States Non-RTW States
Exhibit 69: Commercial Natural Gas Prices (2010)
Source: Computed with data from U.S. Energy Information Administration (2010)
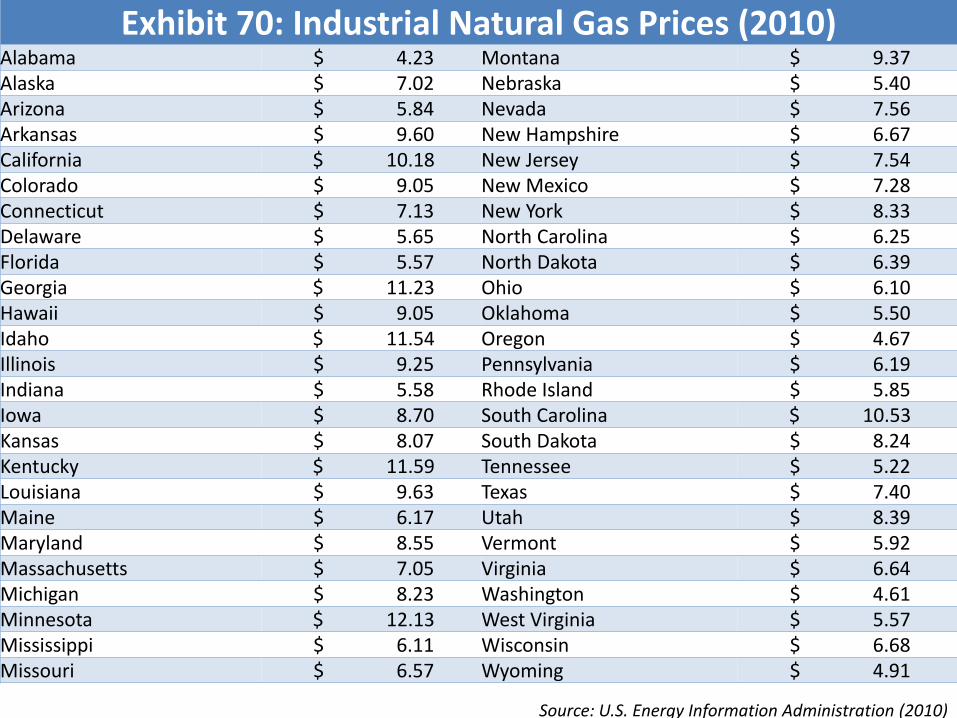
Exhibit 70: Industrial Natural Gas Prices (2010)Alabama $ 4.23 Montana $ 9.37 Alaska $ 7.02 Nebraska $ 5.40 Arizona $ 5.84 Nevada $ 7.56 Arkansas $ 9.60 New Hampshire $ 6.67 California $ 10.18 New Jersey $ 7.54 Colorado $ 9.05 New Mexico $ 7.28 Connecticut $ 7.13 New York $ 8.33 Delaware $ 5.65 North Carolina $ 6.25 Florida $ 5.57 North Dakota $ 6.39 Georgia $ 11.23 Ohio $ 6.10 Hawaii $ 9.05 Oklahoma $ 5.50 Idaho $ 11.54 Oregon $ 4.67 Illinois $ 9.25 Pennsylvania $ 6.19 Indiana $ 5.58 Rhode Island $ 5.85 Iowa $ 8.70 South Carolina $ 10.53 Kansas $ 8.07 South Dakota $ 8.24 Kentucky $ 11.59 Tennessee $ 5.22 Louisiana $ 9.63 Texas $ 7.40 Maine $ 6.17 Utah $ 8.39 Maryland $ 8.55 Vermont $ 5.92 Massachusetts $ 7.05 Virginia $ 6.64 Michigan $ 8.23 Washington $ 4.61 Minnesota $ 12.13 West Virginia $ 5.57 Mississippi $ 6.11 Wisconsin $ 6.68 Missouri $ 6.57 Wyoming $ 4.91
Source: U.S. Energy Information Administration (2010)
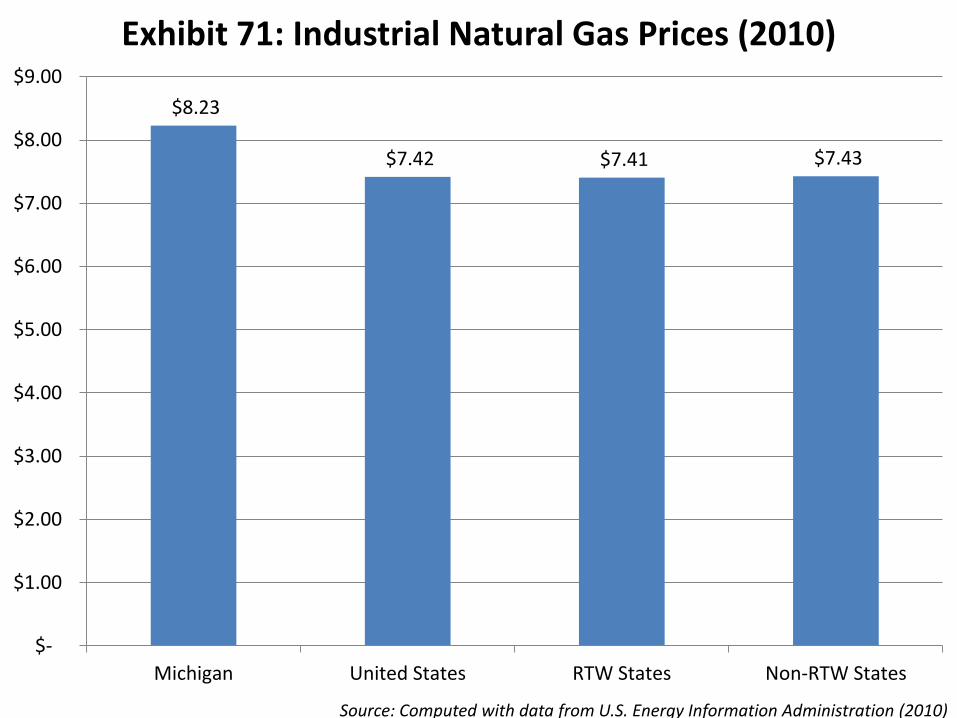
$8.23
$7.42 $7.41 $7.43
$-
$1.00
$2.00
$3.00
$4.00
$5.00
$6.00
$7.00
$8.00
$9.00
Michigan United States RTW States Non-RTW States
Exhibit 71: Industrial Natural Gas Prices (2010)
Source: Computed with data from U.S. Energy Information Administration (2010)
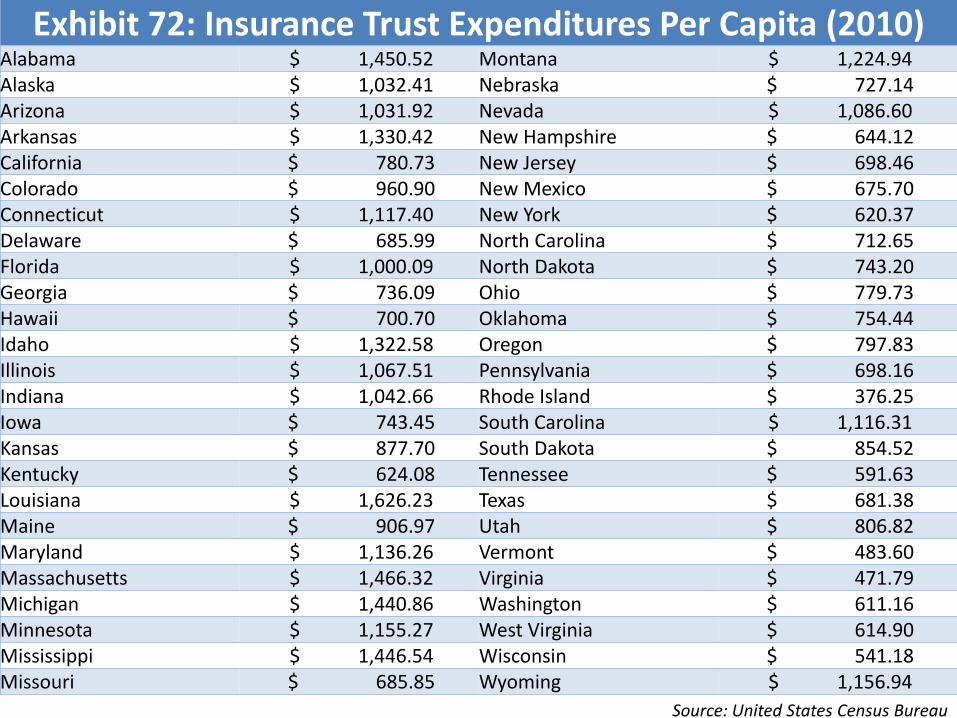
Exhibit 72: Insurance Trust Expenditures Per Capita (2010)Alabama $ 1,450.52 Montana $ 1,224.94 Alaska $ 1,032.41 Nebraska $ 727.14 Arizona $ 1,031.92 Nevada $ 1,086.60 Arkansas $ 1,330.42 New Hampshire $ 644.12 California $ 780.73 New Jersey $ 698.46 Colorado $ 960.90 New Mexico $ 675.70 Connecticut $ 1,117.40 New York $ 620.37 Delaware $ 685.99 North Carolina $ 712.65 Florida $ 1,000.09 North Dakota $ 743.20 Georgia $ 736.09 Ohio $ 779.73 Hawaii $ 700.70 Oklahoma $ 754.44 Idaho $ 1,322.58 Oregon $ 797.83 Illinois $ 1,067.51 Pennsylvania $ 698.16 Indiana $ 1,042.66 Rhode Island $ 376.25 Iowa $ 743.45 South Carolina $ 1,116.31 Kansas $ 877.70 South Dakota $ 854.52 Kentucky $ 624.08 Tennessee $ 591.63 Louisiana $ 1,626.23 Texas $ 681.38 Maine $ 906.97 Utah $ 806.82 Maryland $ 1,136.26 Vermont $ 483.60 Massachusetts $ 1,466.32 Virginia $ 471.79 Michigan $ 1,440.86 Washington $ 611.16 Minnesota $ 1,155.27 West Virginia $ 614.90 Mississippi $ 1,446.54 Wisconsin $ 541.18 Missouri $ 685.85 Wyoming $ 1,156.94
Source: United States Census Bureau
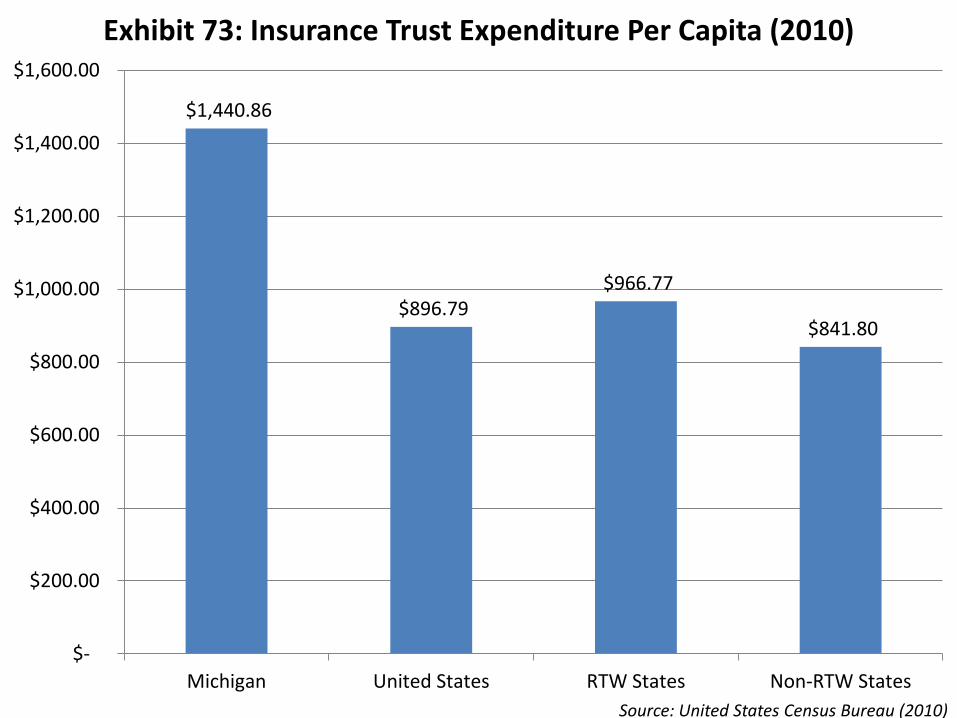
$1,440.86
$896.79 $966.77
$841.80
$-
$200.00
$400.00
$600.00
$800.00
$1,000.00
$1,200.00
$1,400.00
$1,600.00
Michigan United States RTW States Non-RTW States
Exhibit 73: Insurance Trust Expenditure Per Capita (2010)
Source: United States Census Bureau (2010)
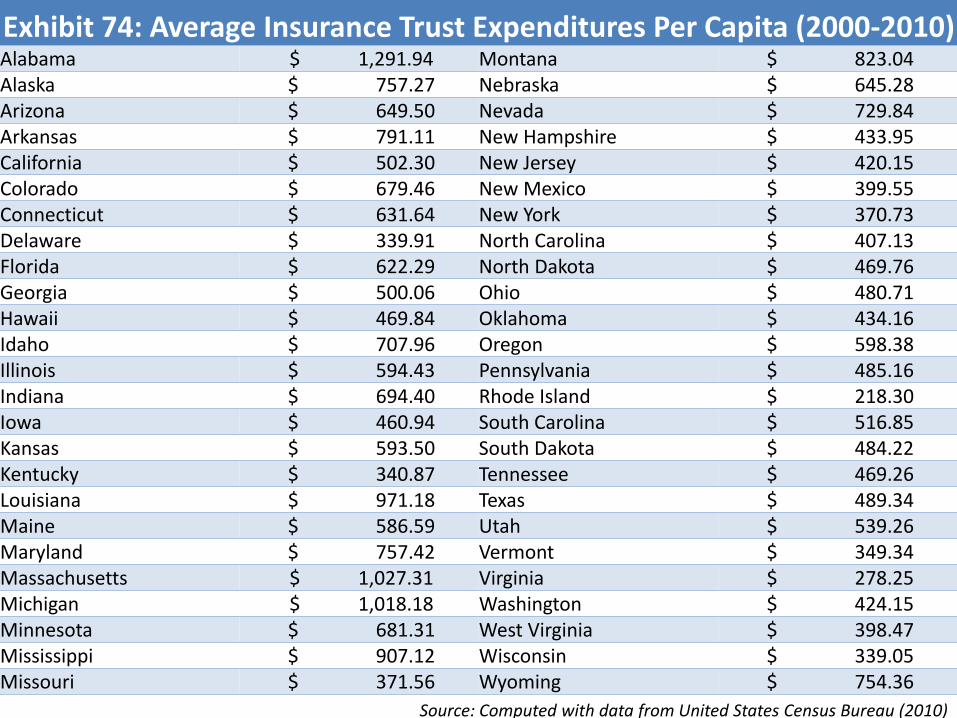
Exhibit 74: Average Insurance Trust Expenditures Per Capita (2000-2010)Alabama $ 1,291.94 Montana $ 823.04 Alaska $ 757.27 Nebraska $ 645.28 Arizona $ 649.50 Nevada $ 729.84 Arkansas $ 791.11 New Hampshire $ 433.95 California $ 502.30 New Jersey $ 420.15 Colorado $ 679.46 New Mexico $ 399.55 Connecticut $ 631.64 New York $ 370.73 Delaware $ 339.91 North Carolina $ 407.13 Florida $ 622.29 North Dakota $ 469.76 Georgia $ 500.06 Ohio $ 480.71 Hawaii $ 469.84 Oklahoma $ 434.16 Idaho $ 707.96 Oregon $ 598.38 Illinois $ 594.43 Pennsylvania $ 485.16 Indiana $ 694.40 Rhode Island $ 218.30 Iowa $ 460.94 South Carolina $ 516.85 Kansas $ 593.50 South Dakota $ 484.22 Kentucky $ 340.87 Tennessee $ 469.26 Louisiana $ 971.18 Texas $ 489.34 Maine $ 586.59 Utah $ 539.26 Maryland $ 757.42 Vermont $ 349.34 Massachusetts $ 1,027.31 Virginia $ 278.25 Michigan $ 1,018.18 Washington $ 424.15 Minnesota $ 681.31 West Virginia $ 398.47 Mississippi $ 907.12 Wisconsin $ 339.05 Missouri $ 371.56 Wyoming $ 754.36
Source: Computed with data from United States Census Bureau (2010)
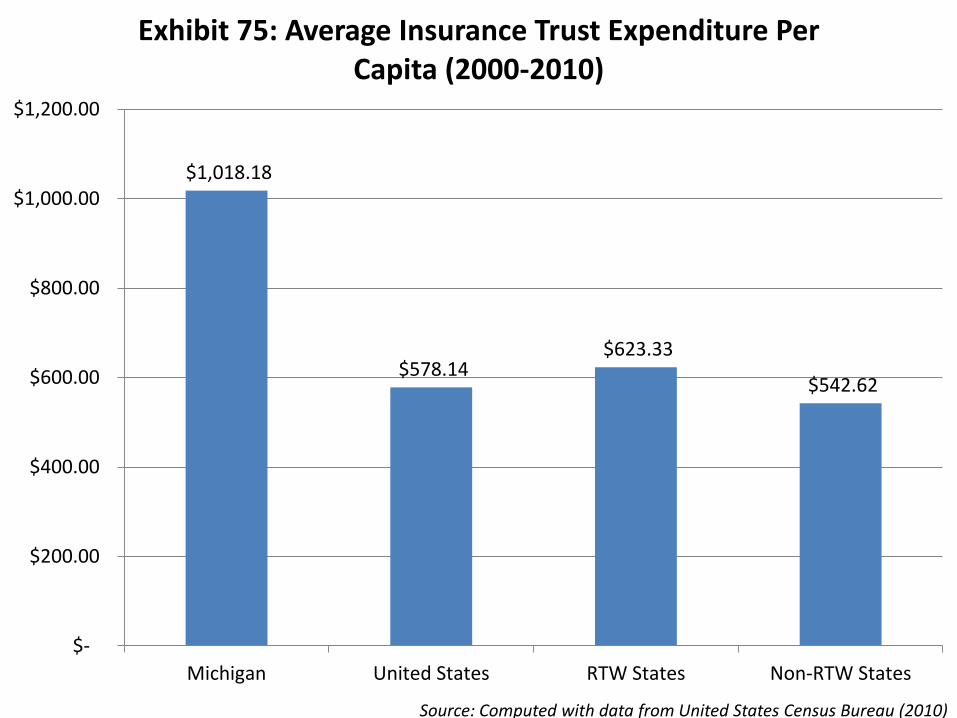
$1,018.18
$578.14 $623.33
$542.62
$-
$200.00
$400.00
$600.00
$800.00
$1,000.00
$1,200.00
Michigan United States RTW States Non-RTW States
Exhibit 75: Average Insurance Trust Expenditure Per Capita (2000-2010)
Source: Computed with data from United States Census Bureau (2010)
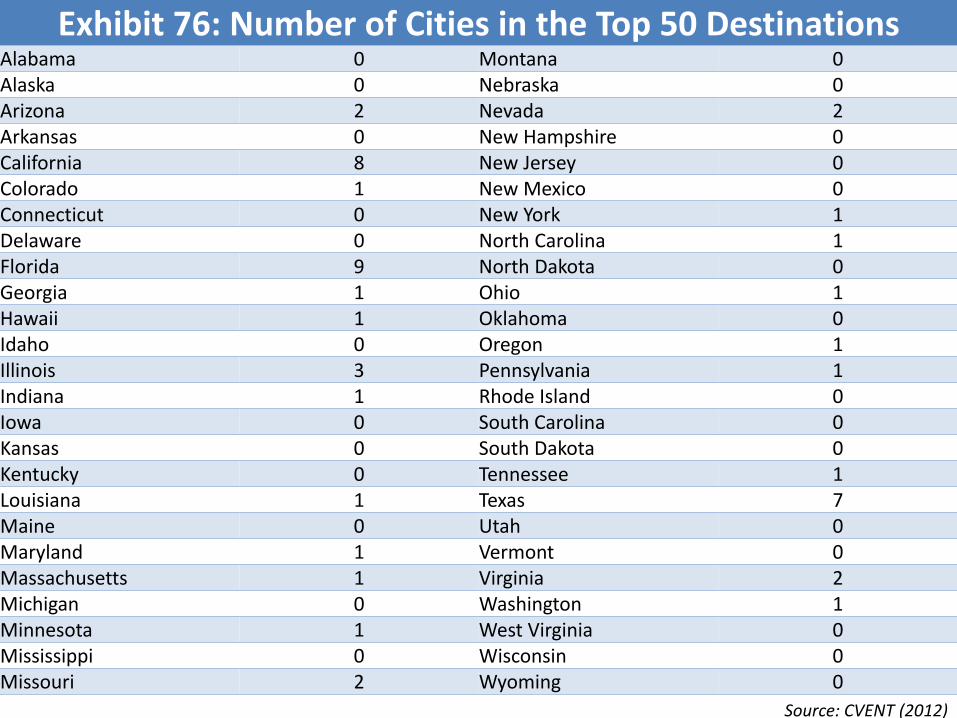
Exhibit 76: Number of Cities in the Top 50 DestinationsAlabama 0 Montana 0Alaska 0 Nebraska 0Arizona 2 Nevada 2Arkansas 0 New Hampshire 0California 8 New Jersey 0Colorado 1 New Mexico 0Connecticut 0 New York 1Delaware 0 North Carolina 1Florida 9 North Dakota 0Georgia 1 Ohio 1Hawaii 1 Oklahoma 0Idaho 0 Oregon 1Illinois 3 Pennsylvania 1Indiana 1 Rhode Island 0Iowa 0 South Carolina 0Kansas 0 South Dakota 0Kentucky 0 Tennessee 1Louisiana 1 Texas 7Maine 0 Utah 0Maryland 1 Vermont 0Massachusetts 1 Virginia 2Michigan 0 Washington 1Minnesota 1 West Virginia 0Mississippi 0 Wisconsin 0Missouri 2 Wyoming 0
Source: CVENT (2012)
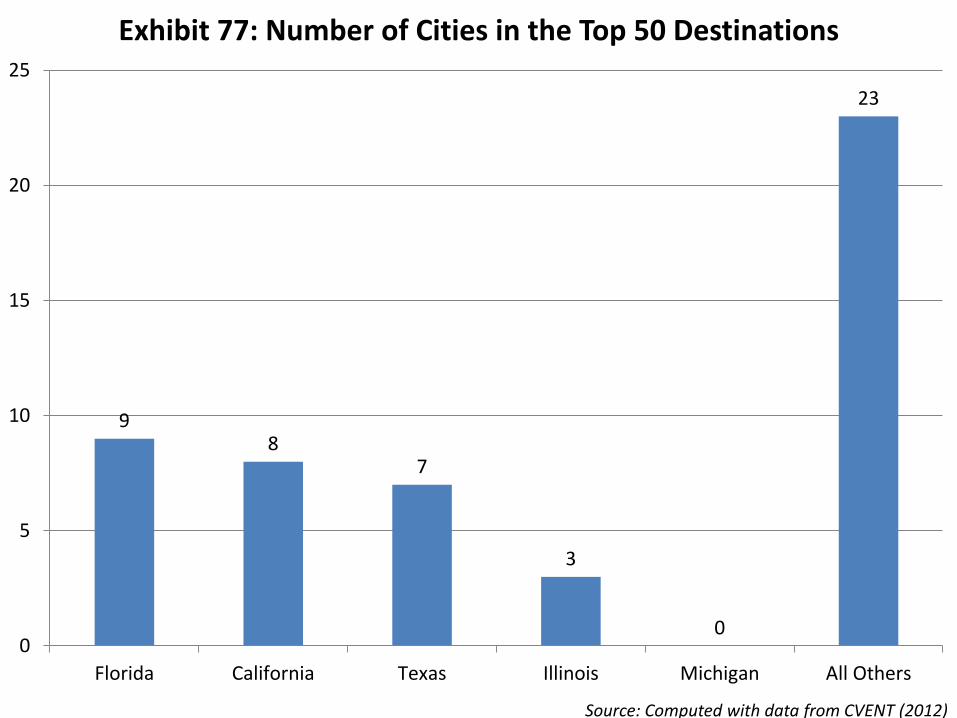
98
7
3
0
23
0
5
10
15
20
25
Florida California Texas Illinois Michigan All Others
Exhibit 77: Number of Cities in the Top 50 Destinations
Source: Computed with data from CVENT (2012)
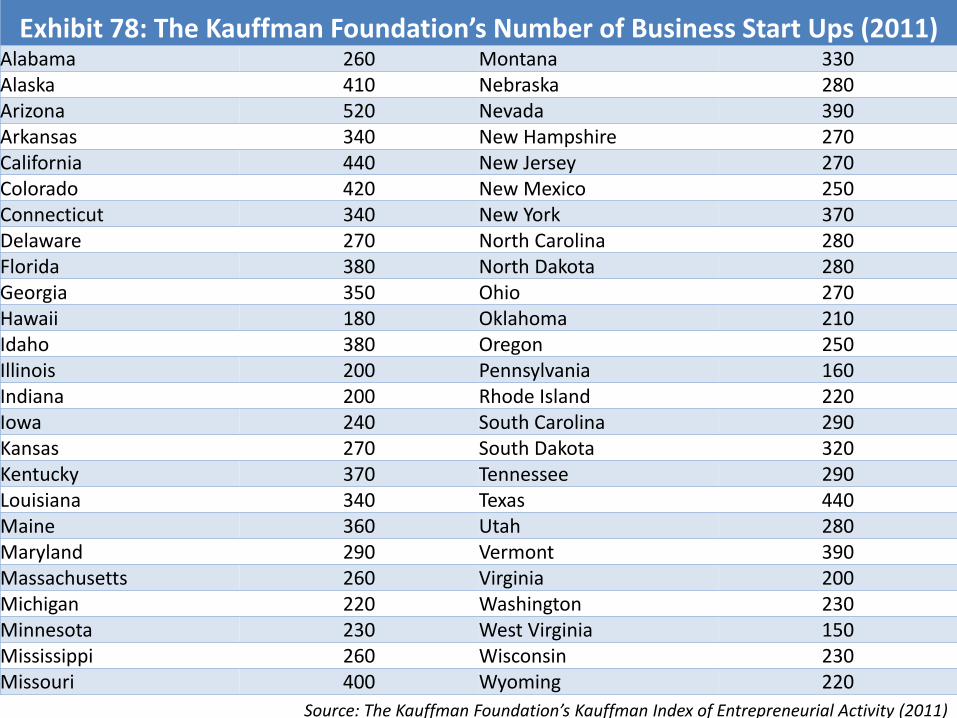
Exhibit 78: The Kauffman Foundation’s Number of Business Start Ups (2011)Alabama 260 Montana 330Alaska 410 Nebraska 280Arizona 520 Nevada 390Arkansas 340 New Hampshire 270California 440 New Jersey 270Colorado 420 New Mexico 250Connecticut 340 New York 370Delaware 270 North Carolina 280Florida 380 North Dakota 280Georgia 350 Ohio 270Hawaii 180 Oklahoma 210Idaho 380 Oregon 250Illinois 200 Pennsylvania 160Indiana 200 Rhode Island 220Iowa 240 South Carolina 290Kansas 270 South Dakota 320Kentucky 370 Tennessee 290Louisiana 340 Texas 440Maine 360 Utah 280Maryland 290 Vermont 390Massachusetts 260 Virginia 200Michigan 220 Washington 230Minnesota 230 West Virginia 150Mississippi 260 Wisconsin 230Missouri 400 Wyoming 220
Source: The Kauffman Foundation’s Kauffman Index of Entrepreneurial Activity (2011)
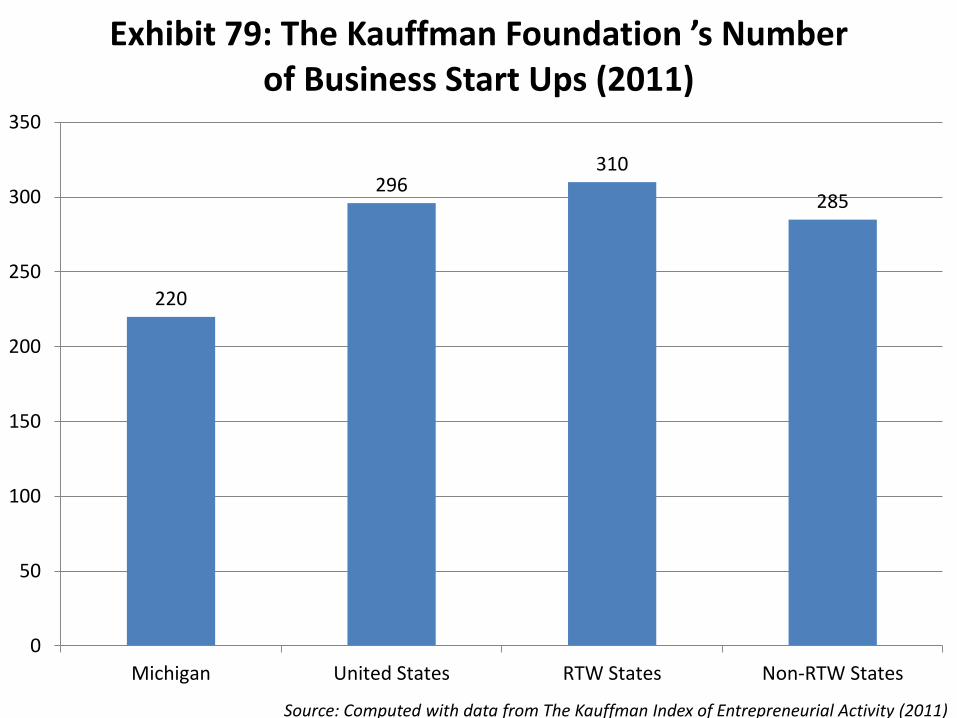
220
296310
285
0
50
100
150
200
250
300
350
Michigan United States RTW States Non-RTW States
Exhibit 79: The Kauffman Foundation ’s Number of Business Start Ups (2011)
Source: Computed with data from The Kauffman Index of Entrepreneurial Activity (2011)
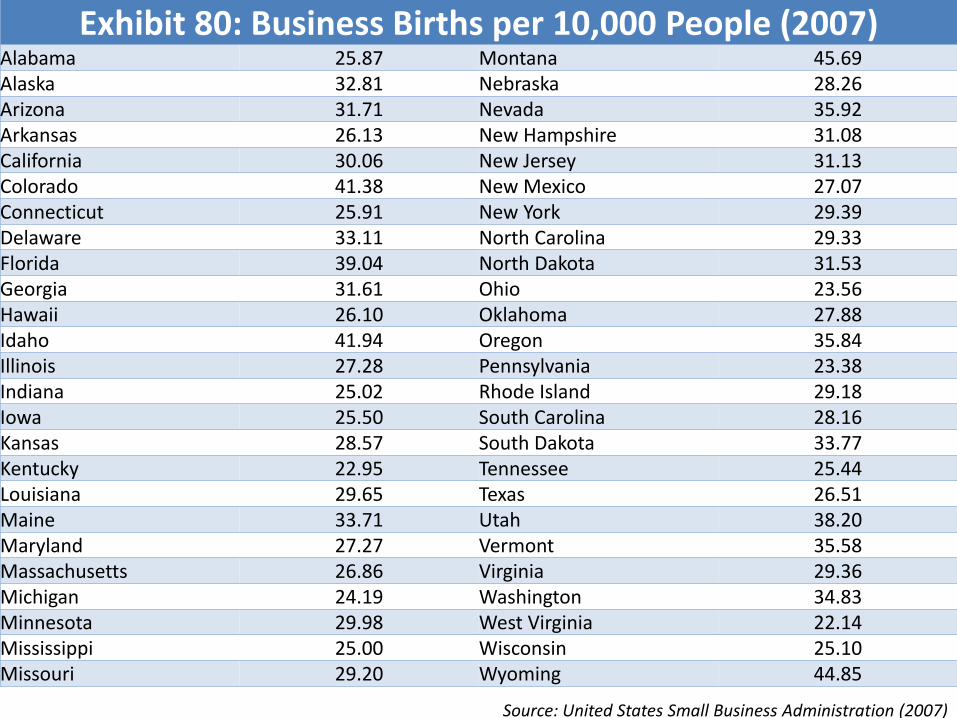
Exhibit 80: Business Births per 10,000 People (2007)Alabama 25.87 Montana 45.69Alaska 32.81 Nebraska 28.26Arizona 31.71 Nevada 35.92Arkansas 26.13 New Hampshire 31.08California 30.06 New Jersey 31.13Colorado 41.38 New Mexico 27.07Connecticut 25.91 New York 29.39Delaware 33.11 North Carolina 29.33Florida 39.04 North Dakota 31.53Georgia 31.61 Ohio 23.56Hawaii 26.10 Oklahoma 27.88Idaho 41.94 Oregon 35.84Illinois 27.28 Pennsylvania 23.38Indiana 25.02 Rhode Island 29.18Iowa 25.50 South Carolina 28.16Kansas 28.57 South Dakota 33.77Kentucky 22.95 Tennessee 25.44Louisiana 29.65 Texas 26.51Maine 33.71 Utah 38.20Maryland 27.27 Vermont 35.58Massachusetts 26.86 Virginia 29.36Michigan 24.19 Washington 34.83Minnesota 29.98 West Virginia 22.14Mississippi 25.00 Wisconsin 25.10Missouri 29.20 Wyoming 44.85
Source: United States Small Business Administration (2007)
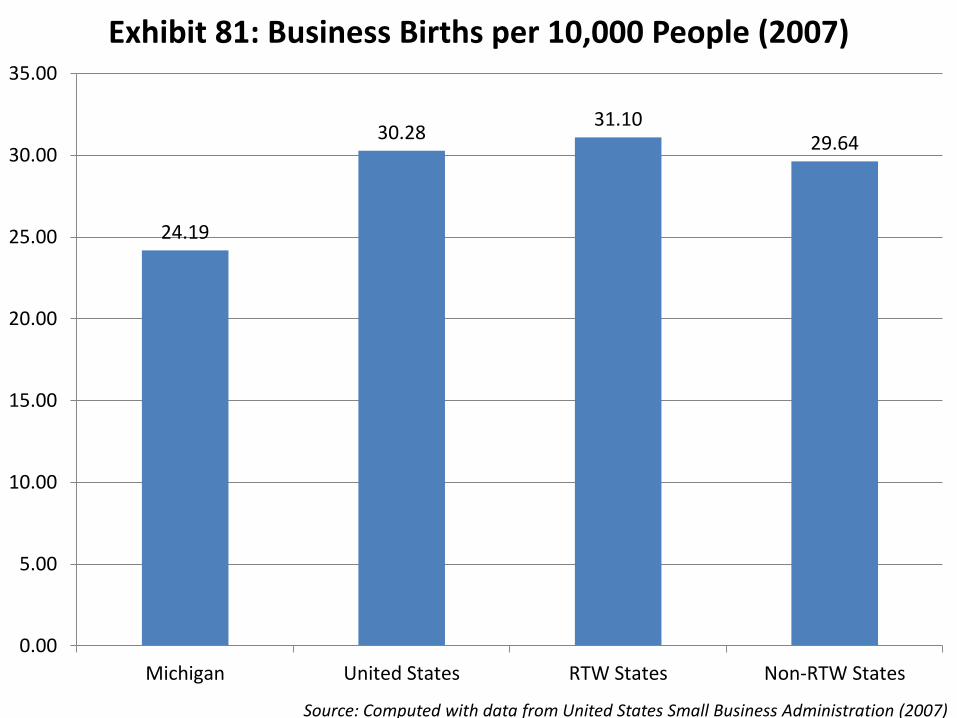
24.19
30.2831.10
29.64
0.00
5.00
10.00
15.00
20.00
25.00
30.00
35.00
Michigan United States RTW States Non-RTW States
Exhibit 81: Business Births per 10,000 People (2007)
Source: Computed with data from United States Small Business Administration (2007)
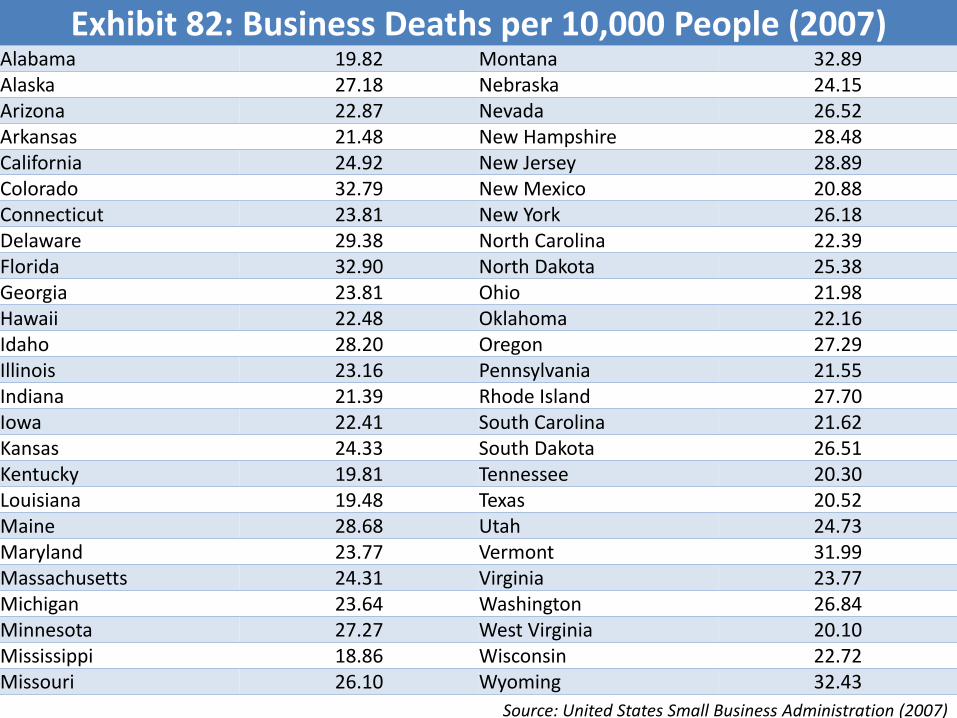
Exhibit 82: Business Deaths per 10,000 People (2007)Alabama 19.82 Montana 32.89Alaska 27.18 Nebraska 24.15Arizona 22.87 Nevada 26.52Arkansas 21.48 New Hampshire 28.48California 24.92 New Jersey 28.89Colorado 32.79 New Mexico 20.88Connecticut 23.81 New York 26.18Delaware 29.38 North Carolina 22.39Florida 32.90 North Dakota 25.38Georgia 23.81 Ohio 21.98Hawaii 22.48 Oklahoma 22.16Idaho 28.20 Oregon 27.29Illinois 23.16 Pennsylvania 21.55Indiana 21.39 Rhode Island 27.70Iowa 22.41 South Carolina 21.62Kansas 24.33 South Dakota 26.51Kentucky 19.81 Tennessee 20.30Louisiana 19.48 Texas 20.52Maine 28.68 Utah 24.73Maryland 23.77 Vermont 31.99Massachusetts 24.31 Virginia 23.77Michigan 23.64 Washington 26.84Minnesota 27.27 West Virginia 20.10Mississippi 18.86 Wisconsin 22.72Missouri 26.10 Wyoming 32.43
Source: United States Small Business Administration (2007)
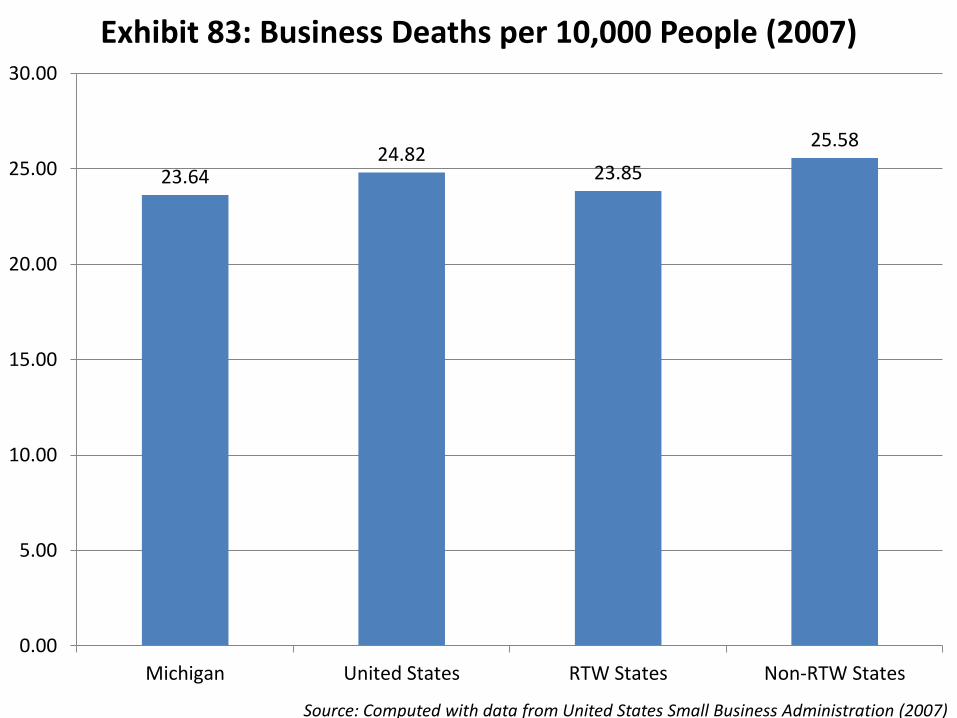
23.6424.82
23.85
25.58
0.00
5.00
10.00
15.00
20.00
25.00
30.00
Michigan United States RTW States Non-RTW States
Exhibit 83: Business Deaths per 10,000 People (2007)
Source: Computed with data from United States Small Business Administration (2007)
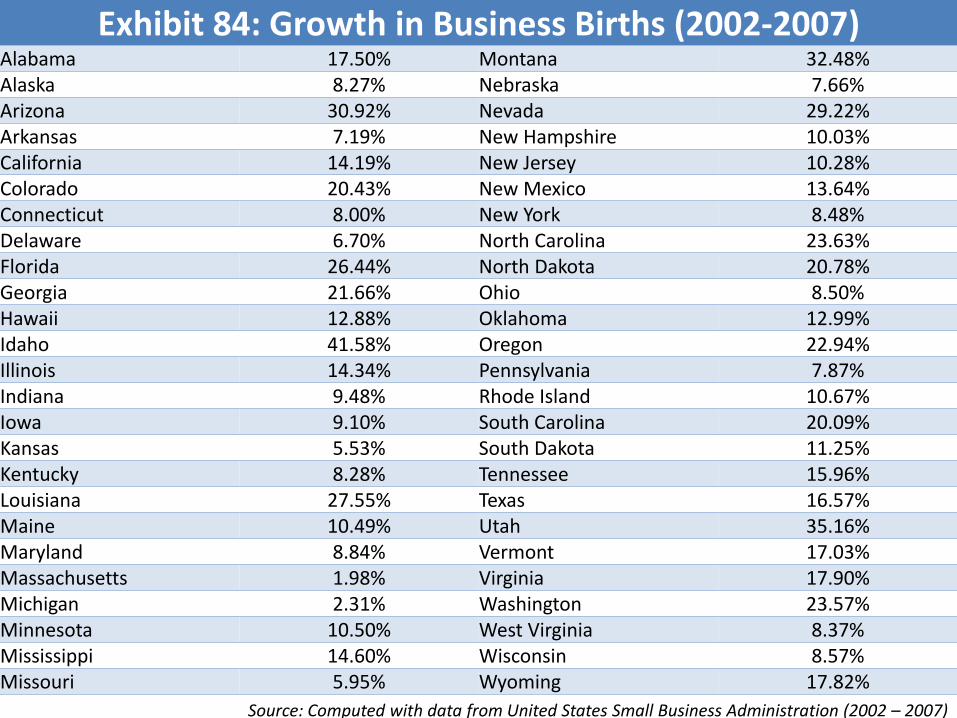
Exhibit 84: Growth in Business Births (2002-2007)Alabama 17.50% Montana 32.48%Alaska 8.27% Nebraska 7.66%Arizona 30.92% Nevada 29.22%Arkansas 7.19% New Hampshire 10.03%California 14.19% New Jersey 10.28%Colorado 20.43% New Mexico 13.64%Connecticut 8.00% New York 8.48%Delaware 6.70% North Carolina 23.63%Florida 26.44% North Dakota 20.78%Georgia 21.66% Ohio 8.50%Hawaii 12.88% Oklahoma 12.99%Idaho 41.58% Oregon 22.94%Illinois 14.34% Pennsylvania 7.87%Indiana 9.48% Rhode Island 10.67%Iowa 9.10% South Carolina 20.09%Kansas 5.53% South Dakota 11.25%Kentucky 8.28% Tennessee 15.96%Louisiana 27.55% Texas 16.57%Maine 10.49% Utah 35.16%Maryland 8.84% Vermont 17.03%Massachusetts 1.98% Virginia 17.90%Michigan 2.31% Washington 23.57%Minnesota 10.50% West Virginia 8.37%Mississippi 14.60% Wisconsin 8.57%Missouri 5.95% Wyoming 17.82%
Source: Computed with data from United States Small Business Administration (2002 – 2007)
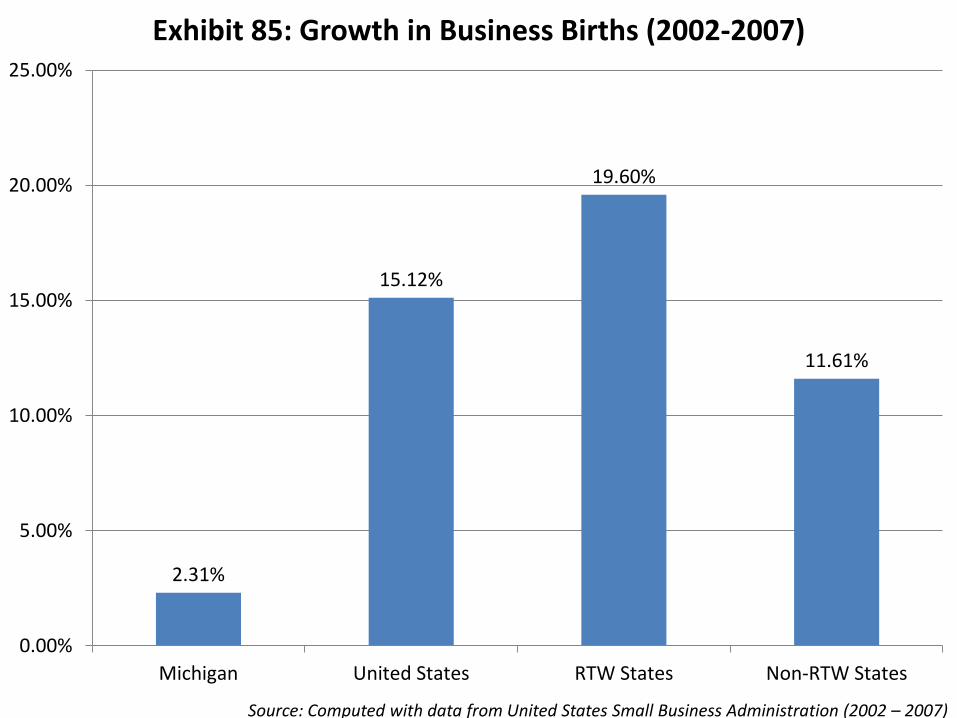
2.31%
15.12%
19.60%
11.61%
0.00%
5.00%
10.00%
15.00%
20.00%
25.00%
Michigan United States RTW States Non-RTW States
Exhibit 85: Growth in Business Births (2002-2007)
Source: Computed with data from United States Small Business Administration (2002 – 2007)
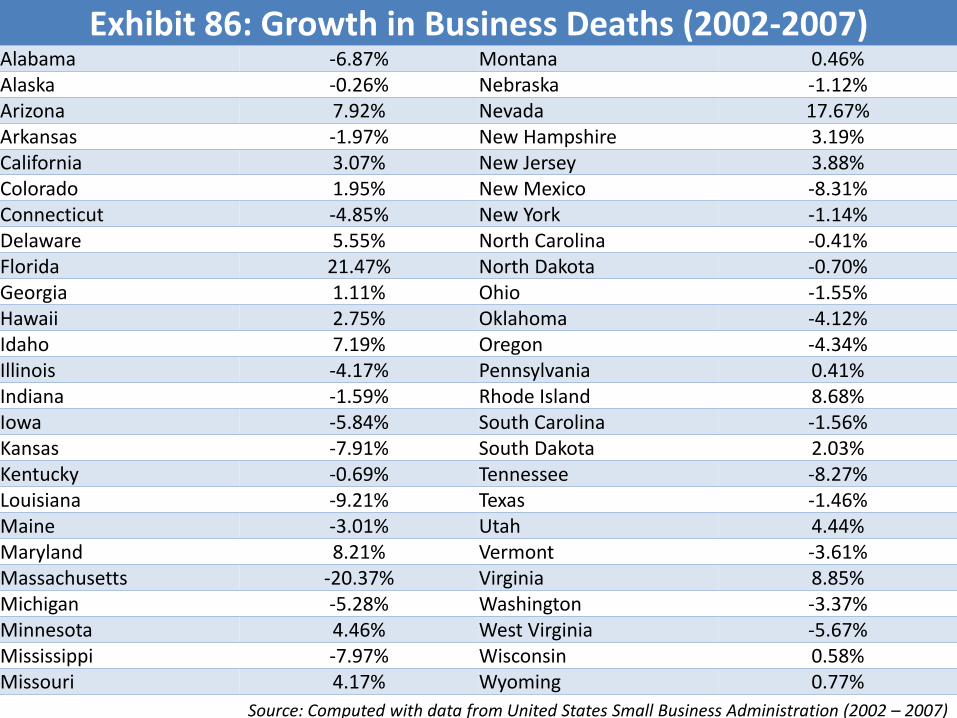
Exhibit 86: Growth in Business Deaths (2002-2007)Alabama -6.87% Montana 0.46%Alaska -0.26% Nebraska -1.12%Arizona 7.92% Nevada 17.67%Arkansas -1.97% New Hampshire 3.19%California 3.07% New Jersey 3.88%Colorado 1.95% New Mexico -8.31%Connecticut -4.85% New York -1.14%Delaware 5.55% North Carolina -0.41%Florida 21.47% North Dakota -0.70%Georgia 1.11% Ohio -1.55%Hawaii 2.75% Oklahoma -4.12%Idaho 7.19% Oregon -4.34%Illinois -4.17% Pennsylvania 0.41%Indiana -1.59% Rhode Island 8.68%Iowa -5.84% South Carolina -1.56%Kansas -7.91% South Dakota 2.03%Kentucky -0.69% Tennessee -8.27%Louisiana -9.21% Texas -1.46%Maine -3.01% Utah 4.44%Maryland 8.21% Vermont -3.61%Massachusetts -20.37% Virginia 8.85%Michigan -5.28% Washington -3.37%Minnesota 4.46% West Virginia -5.67%Mississippi -7.97% Wisconsin 0.58%Missouri 4.17% Wyoming 0.77%
Source: Computed with data from United States Small Business Administration (2002 – 2007)
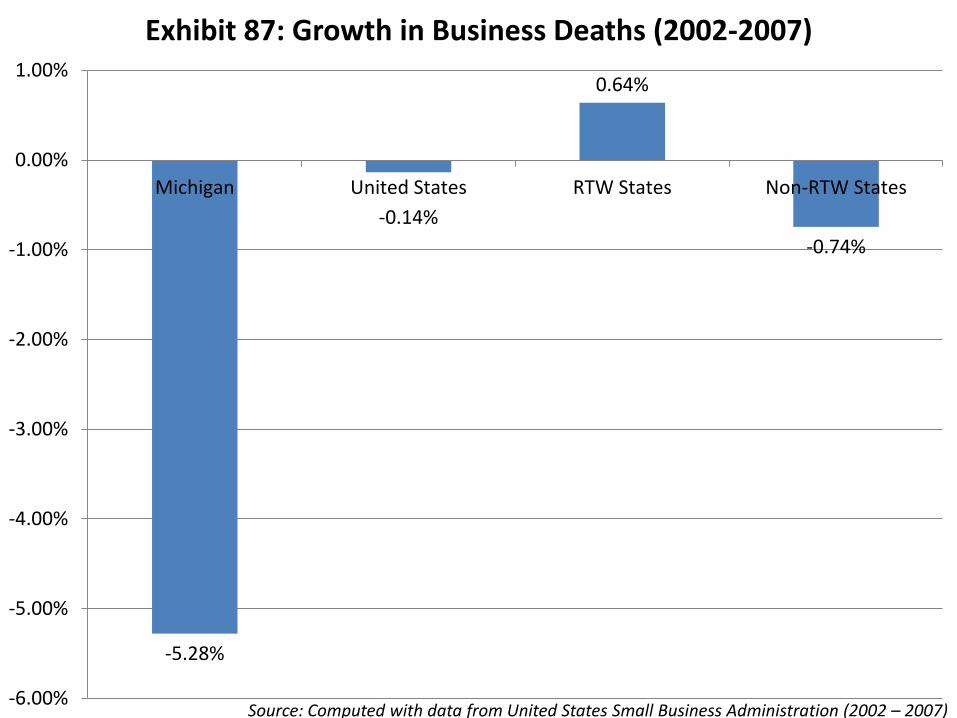
-5.28%
-0.14%
0.64%
-0.74%
-6.00%
-5.00%
-4.00%
-3.00%
-2.00%
-1.00%
0.00%
1.00%
Michigan United States RTW States Non-RTW States
Exhibit 87: Growth in Business Deaths (2002-2007)
Source: Computed with data from United States Small Business Administration (2002 – 2007)
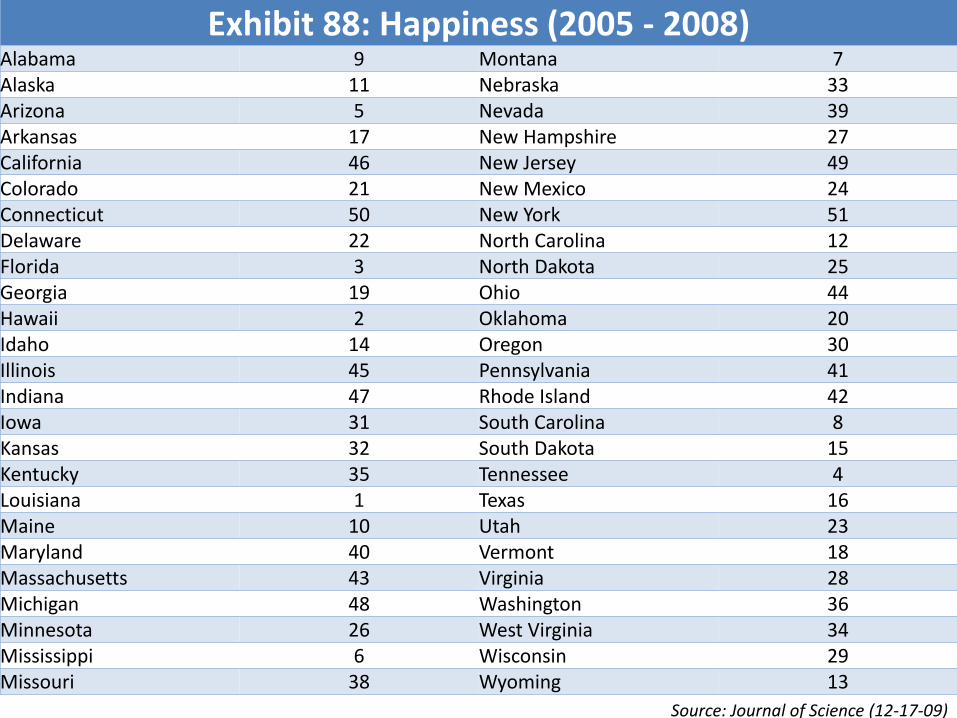
Exhibit 88: Happiness (2005 - 2008)Alabama 9 Montana 7Alaska 11 Nebraska 33Arizona 5 Nevada 39Arkansas 17 New Hampshire 27California 46 New Jersey 49Colorado 21 New Mexico 24Connecticut 50 New York 51Delaware 22 North Carolina 12Florida 3 North Dakota 25Georgia 19 Ohio 44Hawaii 2 Oklahoma 20Idaho 14 Oregon 30Illinois 45 Pennsylvania 41Indiana 47 Rhode Island 42Iowa 31 South Carolina 8Kansas 32 South Dakota 15Kentucky 35 Tennessee 4Louisiana 1 Texas 16Maine 10 Utah 23Maryland 40 Vermont 18Massachusetts 43 Virginia 28Michigan 48 Washington 36Minnesota 26 West Virginia 34Mississippi 6 Wisconsin 29Missouri 38 Wyoming 13
Source: Journal of Science (12-17-09)
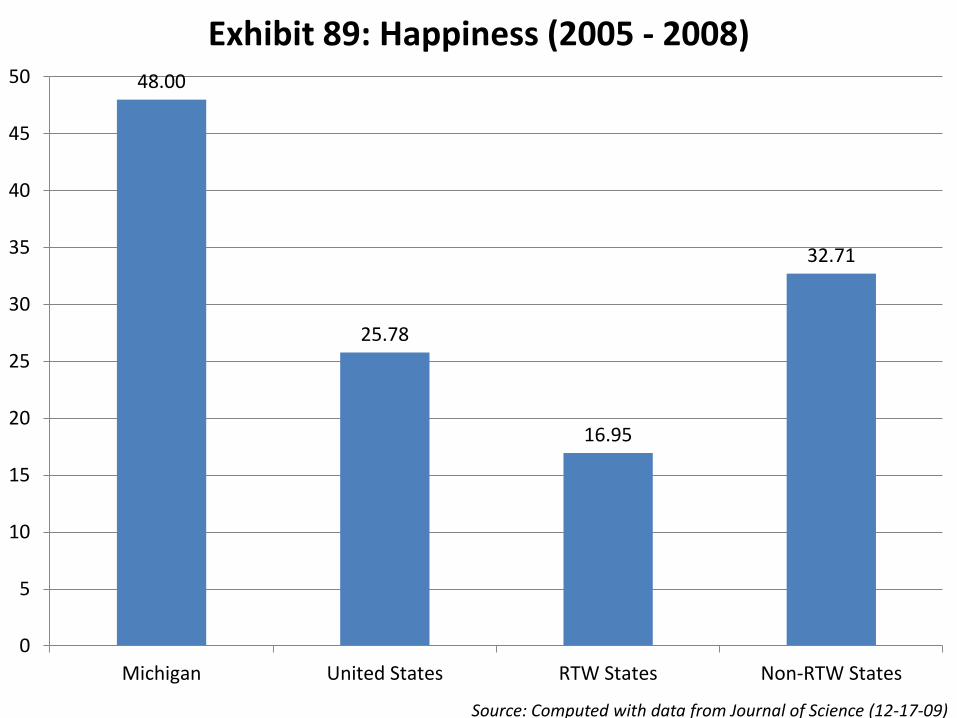
48.00
25.78
16.95
32.71
0
5
10
15
20
25
30
35
40
45
50
Michigan United States RTW States Non-RTW States
Exhibit 89: Happiness (2005 - 2008)
Source: Computed with data from Journal of Science (12-17-09)
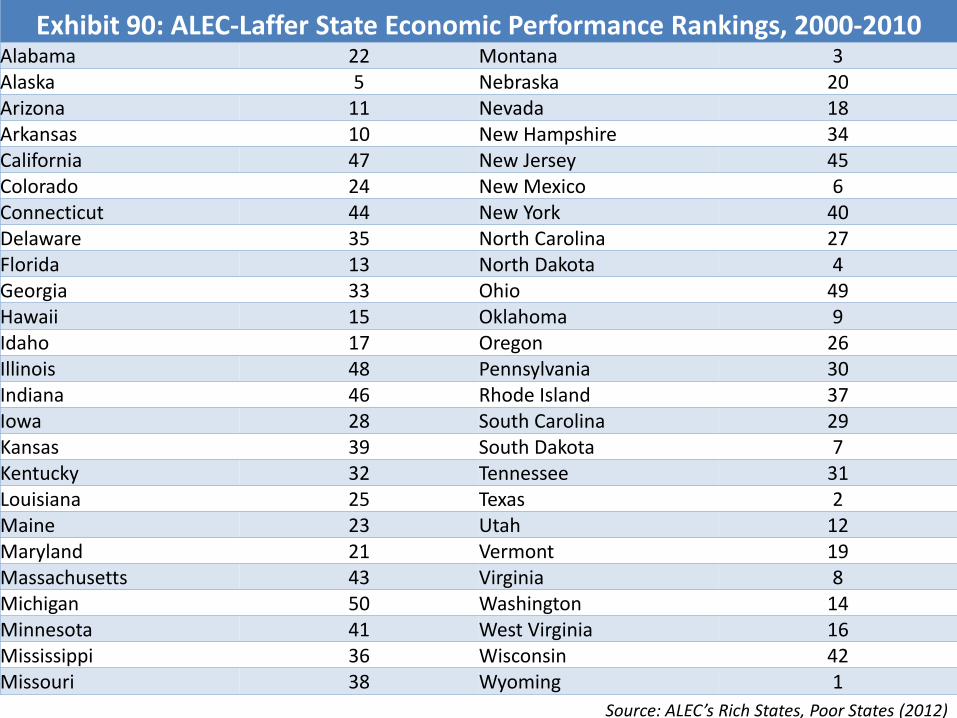
Exhibit 90: ALEC-Laffer State Economic Performance Rankings, 2000-2010 Alabama 22 Montana 3Alaska 5 Nebraska 20Arizona 11 Nevada 18Arkansas 10 New Hampshire 34California 47 New Jersey 45Colorado 24 New Mexico 6Connecticut 44 New York 40Delaware 35 North Carolina 27Florida 13 North Dakota 4Georgia 33 Ohio 49Hawaii 15 Oklahoma 9Idaho 17 Oregon 26Illinois 48 Pennsylvania 30Indiana 46 Rhode Island 37Iowa 28 South Carolina 29Kansas 39 South Dakota 7Kentucky 32 Tennessee 31Louisiana 25 Texas 2Maine 23 Utah 12Maryland 21 Vermont 19Massachusetts 43 Virginia 8Michigan 50 Washington 14Minnesota 41 West Virginia 16Mississippi 36 Wisconsin 42Missouri 38 Wyoming 1
Source: ALEC’s Rich States, Poor States (2012)
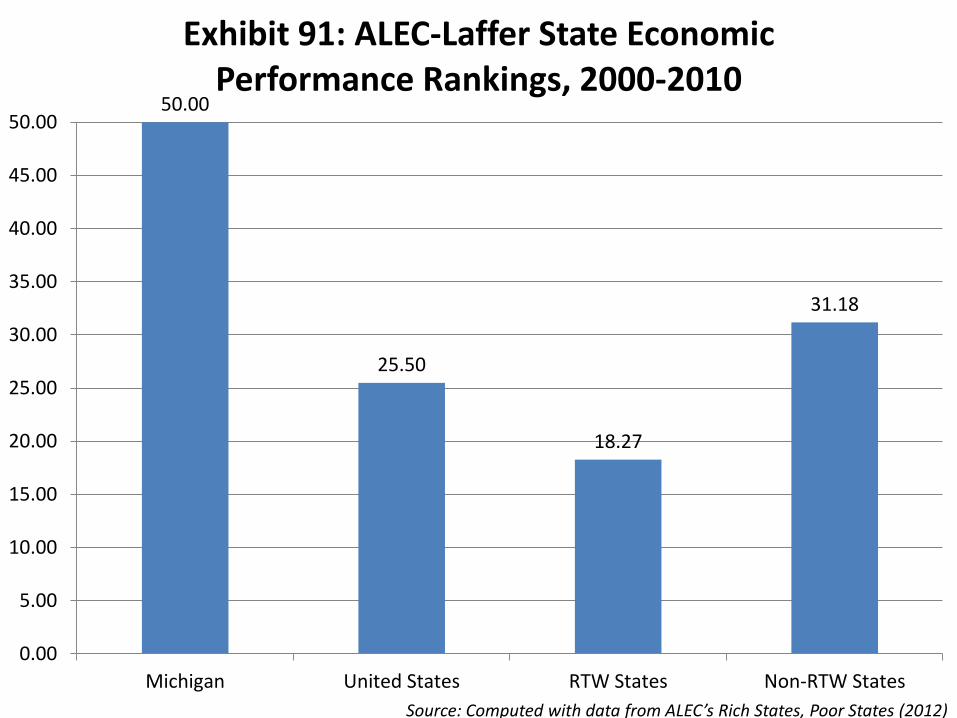
50.00
25.50
18.27
31.18
0.00
5.00
10.00
15.00
20.00
25.00
30.00
35.00
40.00
45.00
50.00
Michigan United States RTW States Non-RTW States
Exhibit 91: ALEC-Laffer State Economic Performance Rankings, 2000-2010
Source: Computed with data from ALEC’s Rich States, Poor States (2012)
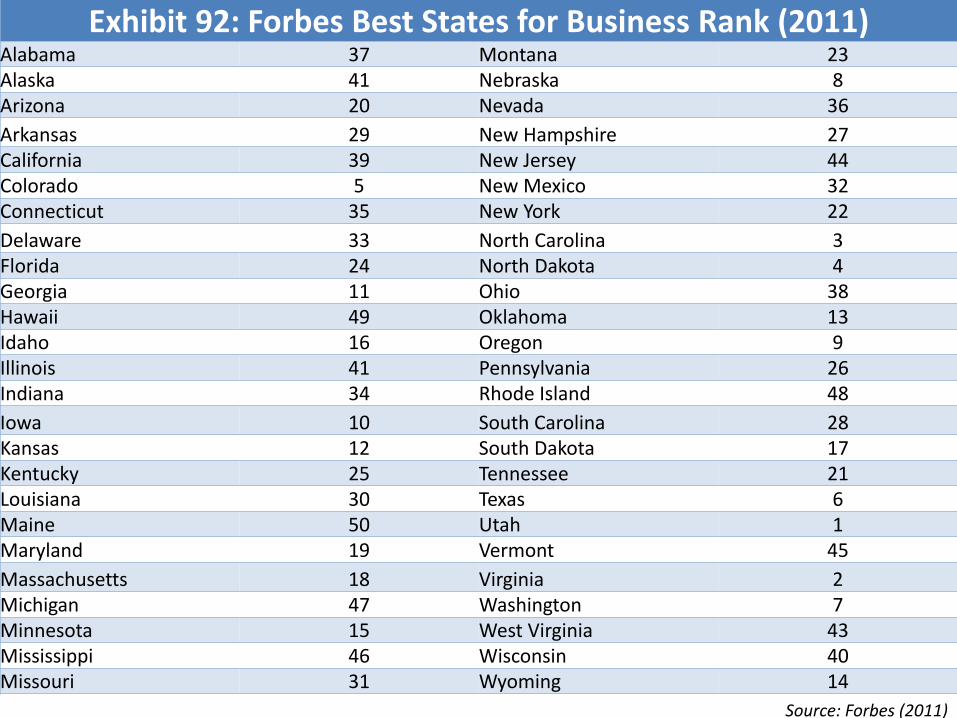
Exhibit 92: Forbes Best States for Business Rank (2011)Alabama 37 Montana 23Alaska 41 Nebraska 8Arizona 20 Nevada 36
Arkansas 29 New Hampshire 27California 39 New Jersey 44Colorado 5 New Mexico 32Connecticut 35 New York 22
Delaware 33 North Carolina 3Florida 24 North Dakota 4Georgia 11 Ohio 38Hawaii 49 Oklahoma 13Idaho 16 Oregon 9Illinois 41 Pennsylvania 26Indiana 34 Rhode Island 48
Iowa 10 South Carolina 28Kansas 12 South Dakota 17Kentucky 25 Tennessee 21Louisiana 30 Texas 6Maine 50 Utah 1Maryland 19 Vermont 45
Massachusetts 18 Virginia 2Michigan 47 Washington 7Minnesota 15 West Virginia 43Mississippi 46 Wisconsin 40Missouri 31 Wyoming 14
Source: Forbes (2011)
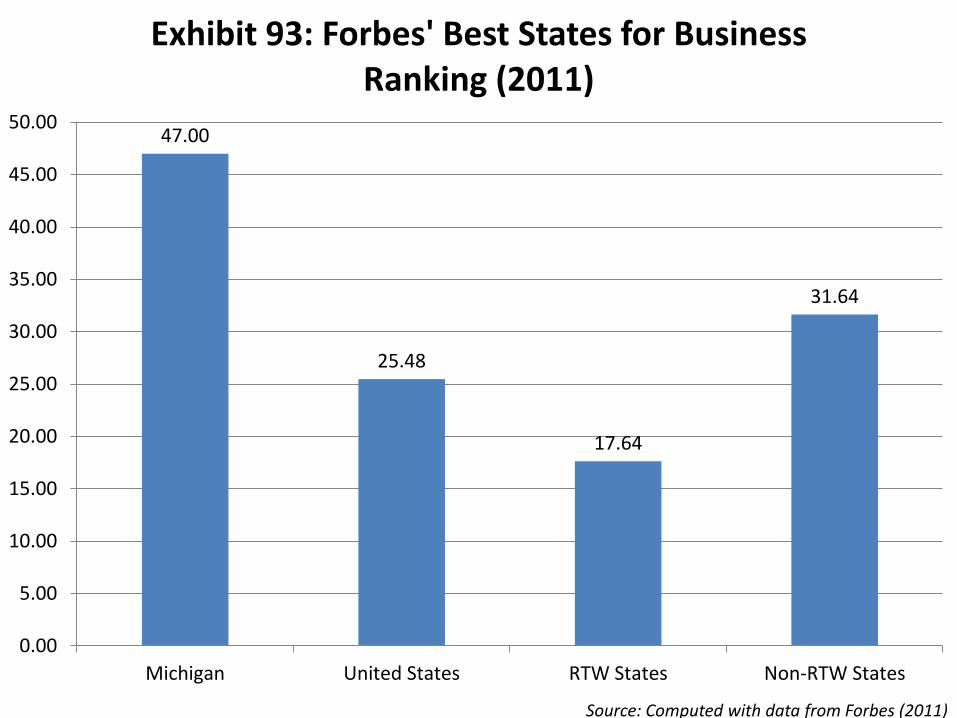
47.00
25.48
17.64
31.64
0.00
5.00
10.00
15.00
20.00
25.00
30.00
35.00
40.00
45.00
50.00
Michigan United States RTW States Non-RTW States
Exhibit 93: Forbes' Best States for Business Ranking (2011)
Source: Computed with data from Forbes (2011)
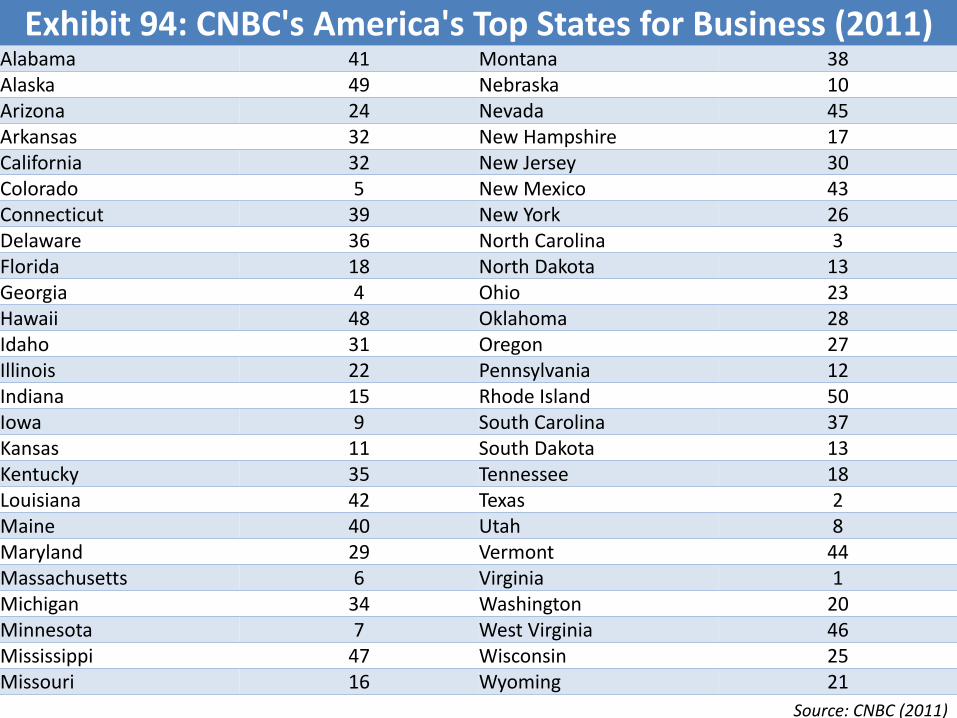
Exhibit 94: CNBC's America's Top States for Business (2011)Alabama 41 Montana 38Alaska 49 Nebraska 10Arizona 24 Nevada 45Arkansas 32 New Hampshire 17California 32 New Jersey 30Colorado 5 New Mexico 43Connecticut 39 New York 26Delaware 36 North Carolina 3Florida 18 North Dakota 13Georgia 4 Ohio 23Hawaii 48 Oklahoma 28Idaho 31 Oregon 27Illinois 22 Pennsylvania 12Indiana 15 Rhode Island 50Iowa 9 South Carolina 37Kansas 11 South Dakota 13Kentucky 35 Tennessee 18Louisiana 42 Texas 2Maine 40 Utah 8Maryland 29 Vermont 44Massachusetts 6 Virginia 1Michigan 34 Washington 20Minnesota 7 West Virginia 46Mississippi 47 Wisconsin 25Missouri 16 Wyoming 21
Source: CNBC (2011)
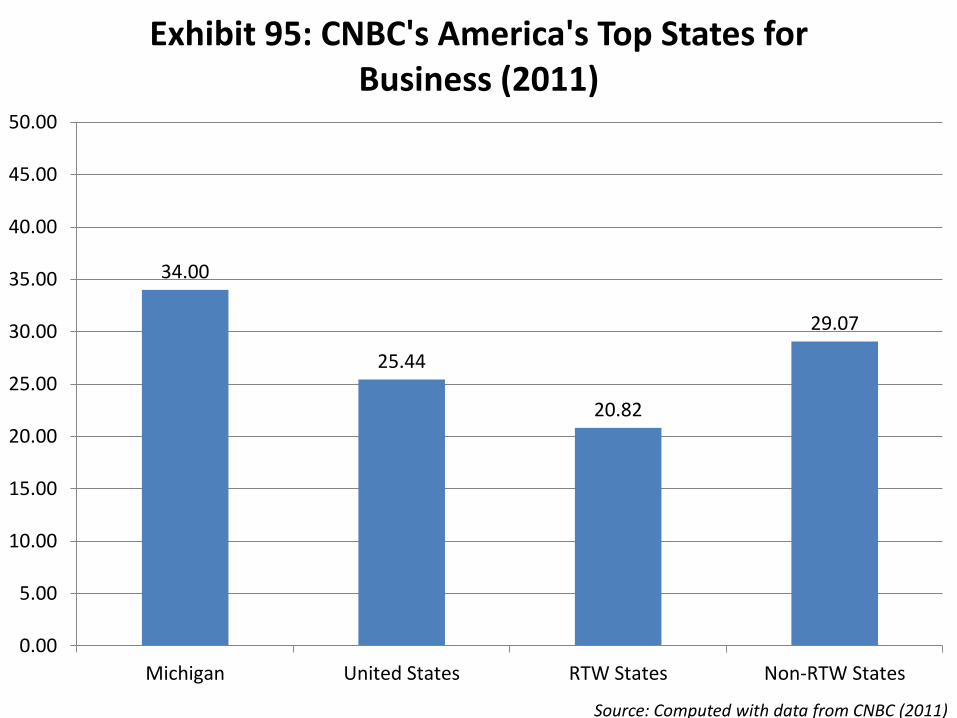
34.00
25.44
20.82
29.07
0.00
5.00
10.00
15.00
20.00
25.00
30.00
35.00
40.00
45.00
50.00
Michigan United States RTW States Non-RTW States
Exhibit 95: CNBC's America's Top States for Business (2011)
Source: Computed with data from CNBC (2011)
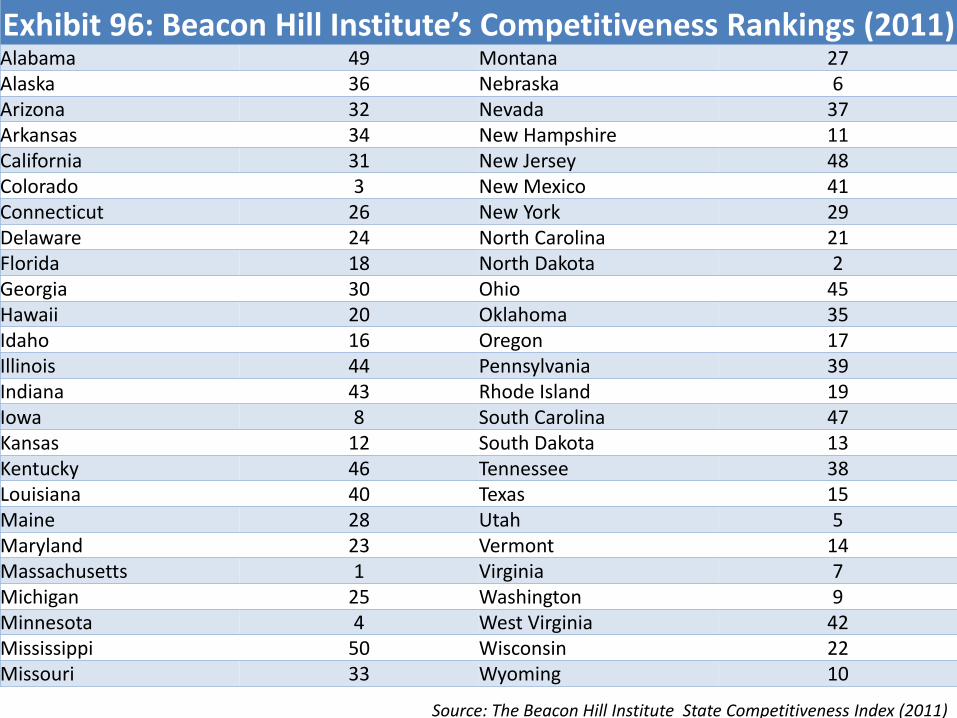
Exhibit 96: Beacon Hill Institute’s Competitiveness Rankings (2011)Alabama 49 Montana 27Alaska 36 Nebraska 6Arizona 32 Nevada 37Arkansas 34 New Hampshire 11California 31 New Jersey 48Colorado 3 New Mexico 41Connecticut 26 New York 29Delaware 24 North Carolina 21Florida 18 North Dakota 2Georgia 30 Ohio 45Hawaii 20 Oklahoma 35Idaho 16 Oregon 17Illinois 44 Pennsylvania 39Indiana 43 Rhode Island 19Iowa 8 South Carolina 47Kansas 12 South Dakota 13Kentucky 46 Tennessee 38Louisiana 40 Texas 15Maine 28 Utah 5Maryland 23 Vermont 14Massachusetts 1 Virginia 7Michigan 25 Washington 9Minnesota 4 West Virginia 42Mississippi 50 Wisconsin 22Missouri 33 Wyoming 10
Source: The Beacon Hill Institute State Competitiveness Index (2011)
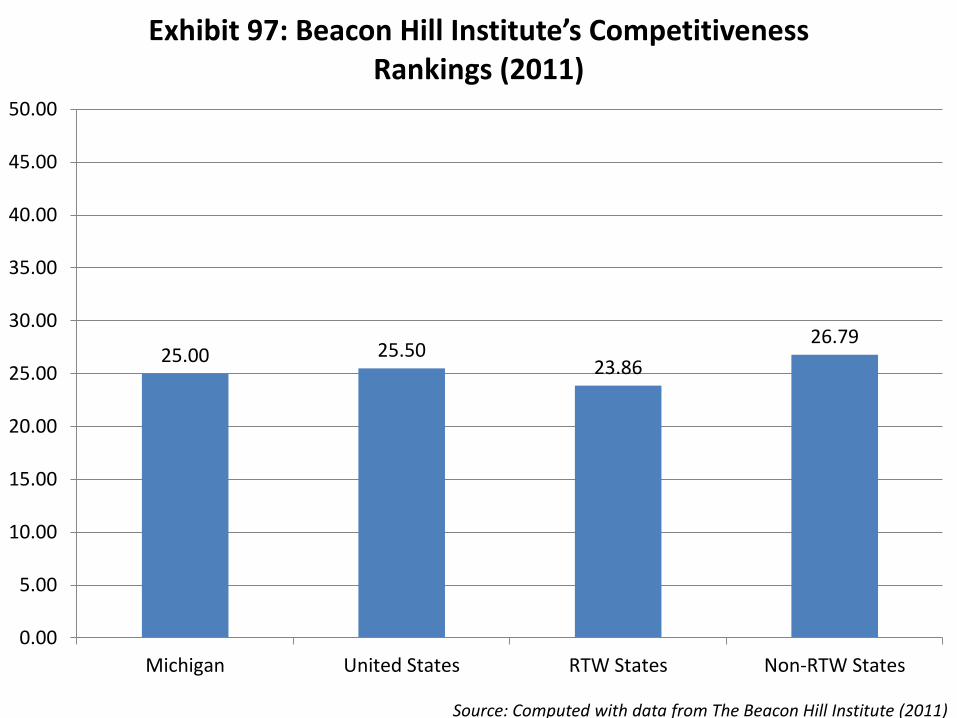
25.00 25.5023.86
26.79
0.00
5.00
10.00
15.00
20.00
25.00
30.00
35.00
40.00
45.00
50.00
Michigan United States RTW States Non-RTW States
Exhibit 97: Beacon Hill Institute’s Competitiveness Rankings (2011)
Source: Computed with data from The Beacon Hill Institute (2011)
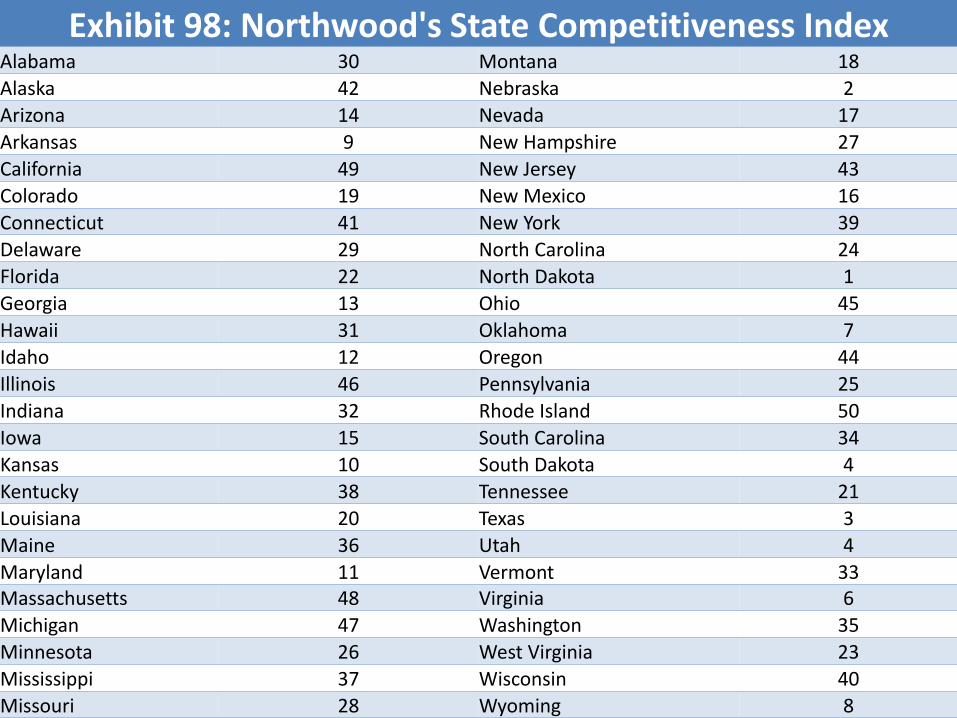
Exhibit 98: Northwood's State Competitiveness IndexAlabama 30 Montana 18
Alaska 42 Nebraska 2
Arizona 14 Nevada 17
Arkansas 9 New Hampshire 27
California 49 New Jersey 43
Colorado 19 New Mexico 16
Connecticut 41 New York 39
Delaware 29 North Carolina 24
Florida 22 North Dakota 1
Georgia 13 Ohio 45
Hawaii 31 Oklahoma 7
Idaho 12 Oregon 44
Illinois 46 Pennsylvania 25
Indiana 32 Rhode Island 50
Iowa 15 South Carolina 34
Kansas 10 South Dakota 4
Kentucky 38 Tennessee 21
Louisiana 20 Texas 3
Maine 36 Utah 4
Maryland 11 Vermont 33Massachusetts 48 Virginia 6
Michigan 47 Washington 35
Minnesota 26 West Virginia 23
Mississippi 37 Wisconsin 40
Missouri 28 Wyoming 8
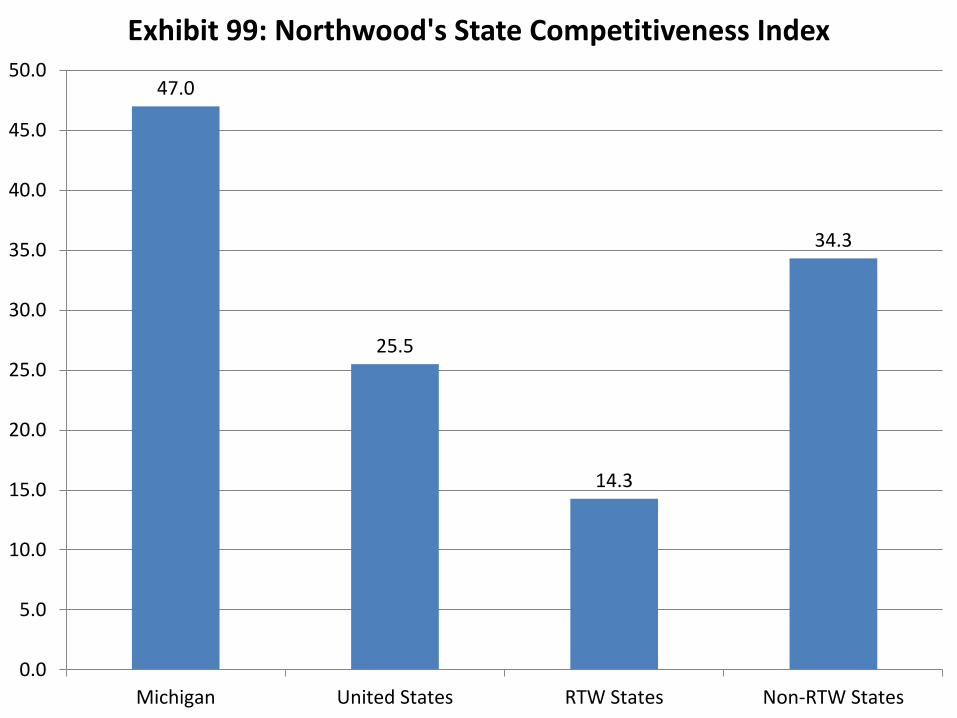
47.0
25.5
14.3
34.3
0.0
5.0
10.0
15.0
20.0
25.0
30.0
35.0
40.0
45.0
50.0
Michigan United States RTW States Non-RTW States
Exhibit 99: Northwood's State Competitiveness Index
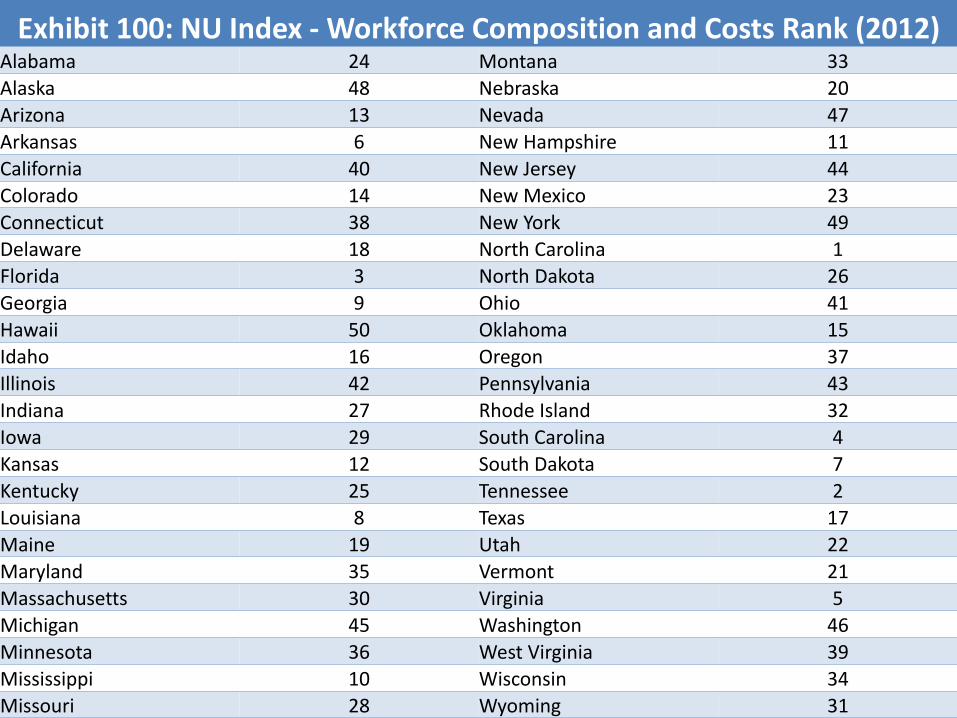
Exhibit 100: NU Index - Workforce Composition and Costs Rank (2012)Alabama 24 Montana 33
Alaska 48 Nebraska 20
Arizona 13 Nevada 47
Arkansas 6 New Hampshire 11
California 40 New Jersey 44
Colorado 14 New Mexico 23
Connecticut 38 New York 49
Delaware 18 North Carolina 1
Florida 3 North Dakota 26
Georgia 9 Ohio 41
Hawaii 50 Oklahoma 15
Idaho 16 Oregon 37
Illinois 42 Pennsylvania 43
Indiana 27 Rhode Island 32
Iowa 29 South Carolina 4
Kansas 12 South Dakota 7
Kentucky 25 Tennessee 2
Louisiana 8 Texas 17
Maine 19 Utah 22
Maryland 35 Vermont 21
Massachusetts 30 Virginia 5
Michigan 45 Washington 46
Minnesota 36 West Virginia 39
Mississippi 10 Wisconsin 34
Missouri 28 Wyoming 31
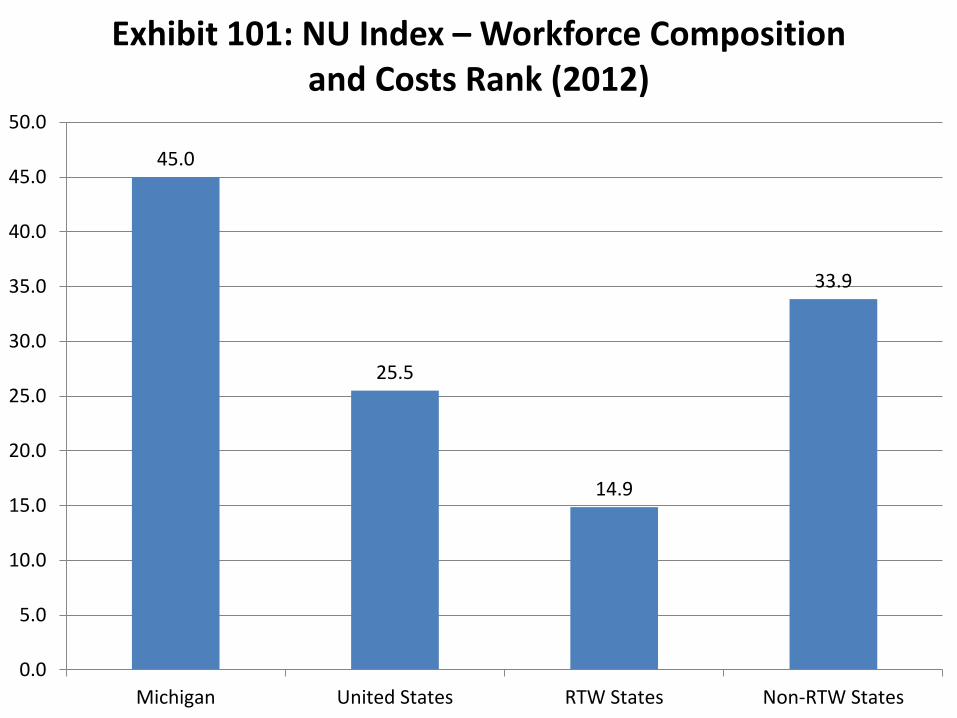
45.0
25.5
14.9
33.9
0.0
5.0
10.0
15.0
20.0
25.0
30.0
35.0
40.0
45.0
50.0
Michigan United States RTW States Non-RTW States
Exhibit 101: NU Index – Workforce Composition and Costs Rank (2012)
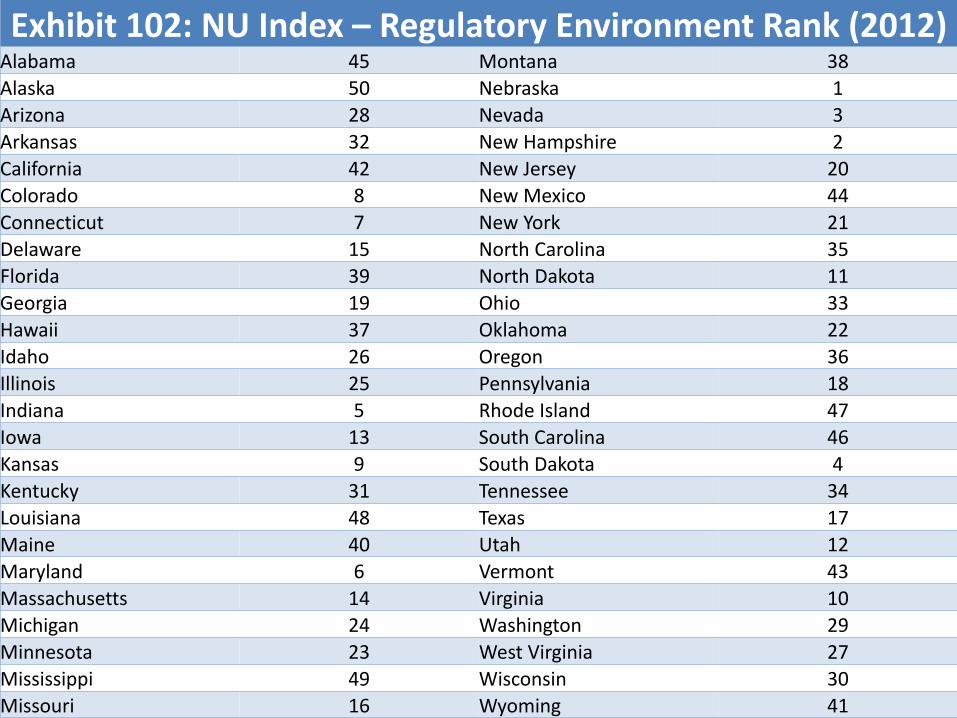
Exhibit 102: NU Index – Regulatory Environment Rank (2012)Alabama 45 Montana 38
Alaska 50 Nebraska 1
Arizona 28 Nevada 3
Arkansas 32 New Hampshire 2
California 42 New Jersey 20
Colorado 8 New Mexico 44
Connecticut 7 New York 21
Delaware 15 North Carolina 35
Florida 39 North Dakota 11
Georgia 19 Ohio 33
Hawaii 37 Oklahoma 22
Idaho 26 Oregon 36
Illinois 25 Pennsylvania 18
Indiana 5 Rhode Island 47
Iowa 13 South Carolina 46
Kansas 9 South Dakota 4
Kentucky 31 Tennessee 34
Louisiana 48 Texas 17
Maine 40 Utah 12
Maryland 6 Vermont 43
Massachusetts 14 Virginia 10
Michigan 24 Washington 29
Minnesota 23 West Virginia 27
Mississippi 49 Wisconsin 30
Missouri 16 Wyoming 41
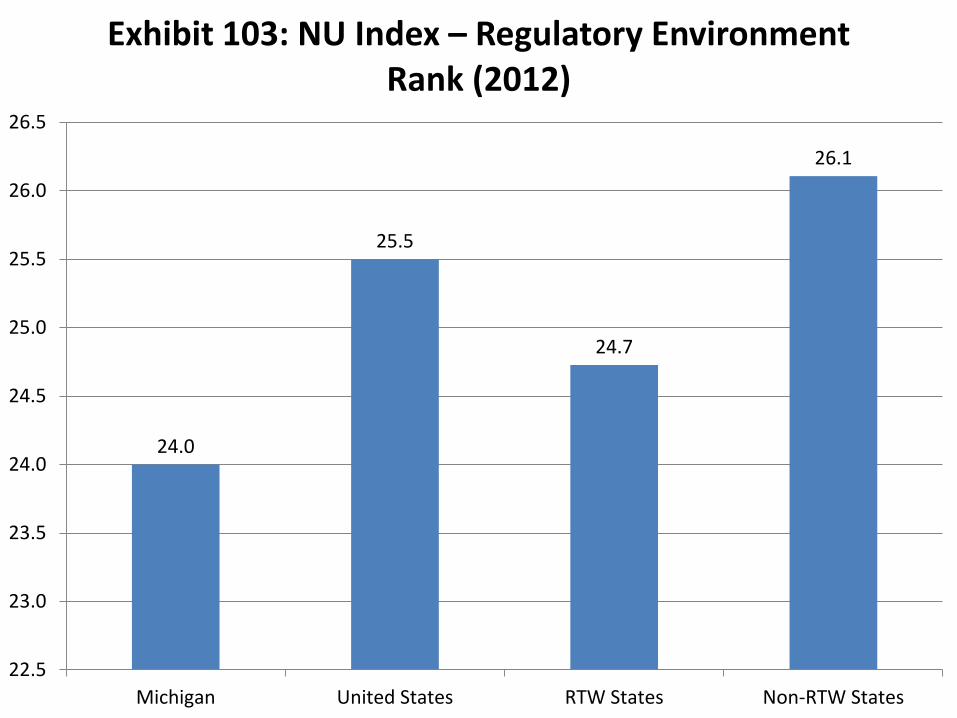
24.0
25.5
24.7
26.1
22.5
23.0
23.5
24.0
24.5
25.0
25.5
26.0
26.5
Michigan United States RTW States Non-RTW States
Exhibit 103: NU Index – Regulatory Environment Rank (2012)
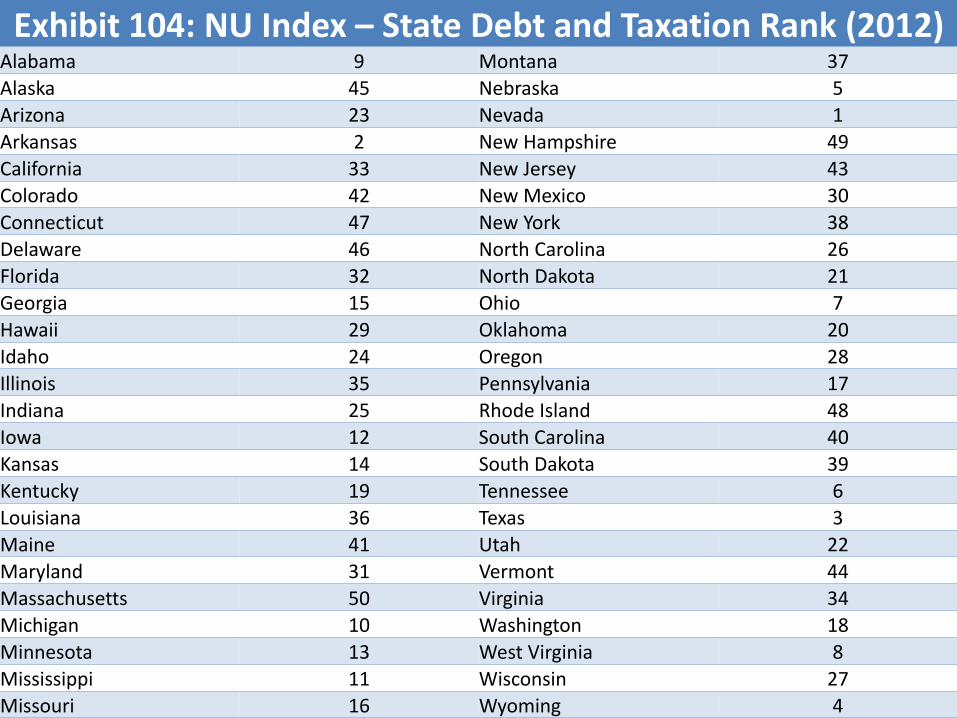
Exhibit 104: NU Index – State Debt and Taxation Rank (2012)Alabama 9 Montana 37
Alaska 45 Nebraska 5
Arizona 23 Nevada 1
Arkansas 2 New Hampshire 49
California 33 New Jersey 43
Colorado 42 New Mexico 30
Connecticut 47 New York 38
Delaware 46 North Carolina 26
Florida 32 North Dakota 21
Georgia 15 Ohio 7
Hawaii 29 Oklahoma 20
Idaho 24 Oregon 28
Illinois 35 Pennsylvania 17
Indiana 25 Rhode Island 48
Iowa 12 South Carolina 40
Kansas 14 South Dakota 39
Kentucky 19 Tennessee 6
Louisiana 36 Texas 3
Maine 41 Utah 22
Maryland 31 Vermont 44
Massachusetts 50 Virginia 34
Michigan 10 Washington 18
Minnesota 13 West Virginia 8
Mississippi 11 Wisconsin 27
Missouri 16 Wyoming 4
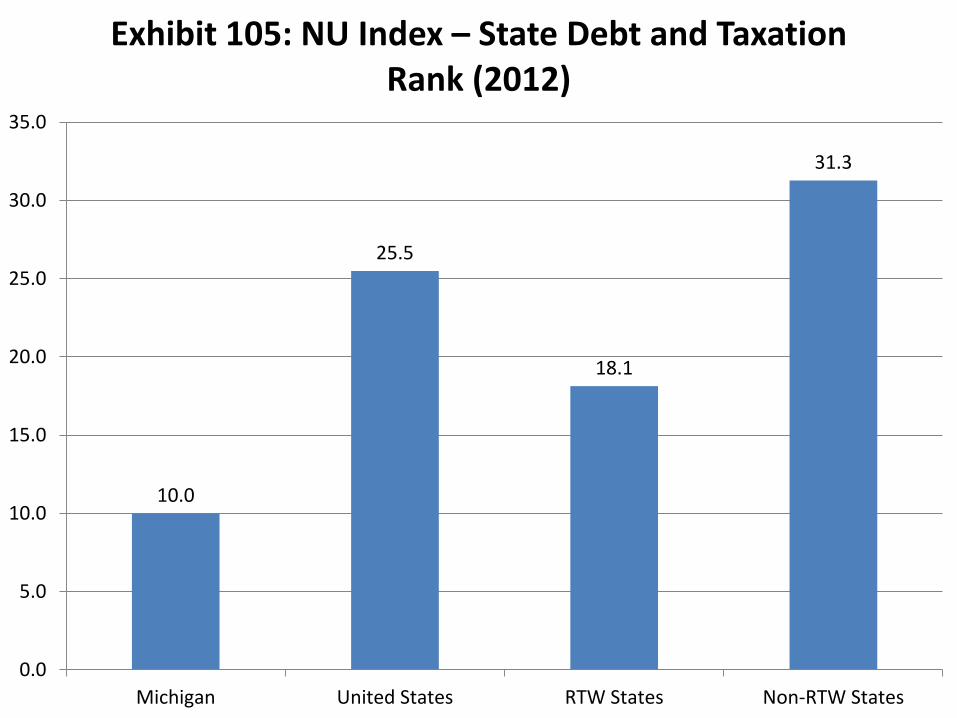
10.0
25.5
18.1
31.3
0.0
5.0
10.0
15.0
20.0
25.0
30.0
35.0
Michigan United States RTW States Non-RTW States
Exhibit 105: NU Index – State Debt and Taxation Rank (2012)
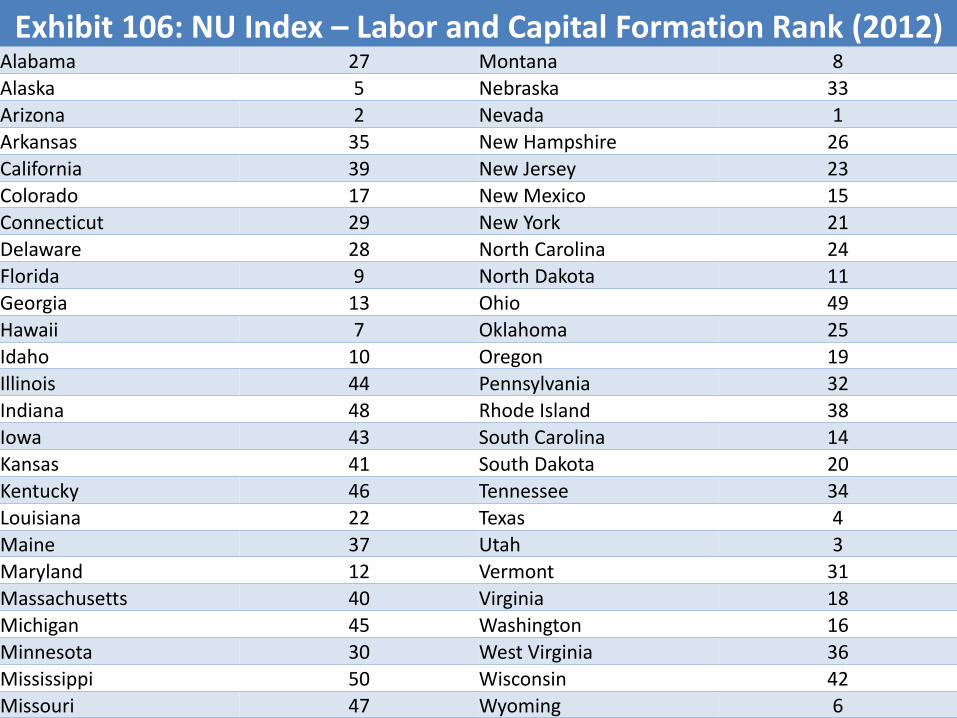
Exhibit 106: NU Index – Labor and Capital Formation Rank (2012)Alabama 27 Montana 8
Alaska 5 Nebraska 33
Arizona 2 Nevada 1
Arkansas 35 New Hampshire 26
California 39 New Jersey 23
Colorado 17 New Mexico 15
Connecticut 29 New York 21
Delaware 28 North Carolina 24
Florida 9 North Dakota 11
Georgia 13 Ohio 49
Hawaii 7 Oklahoma 25
Idaho 10 Oregon 19
Illinois 44 Pennsylvania 32
Indiana 48 Rhode Island 38
Iowa 43 South Carolina 14
Kansas 41 South Dakota 20
Kentucky 46 Tennessee 34
Louisiana 22 Texas 4
Maine 37 Utah 3
Maryland 12 Vermont 31
Massachusetts 40 Virginia 18
Michigan 45 Washington 16
Minnesota 30 West Virginia 36
Mississippi 50 Wisconsin 42
Missouri 47 Wyoming 6
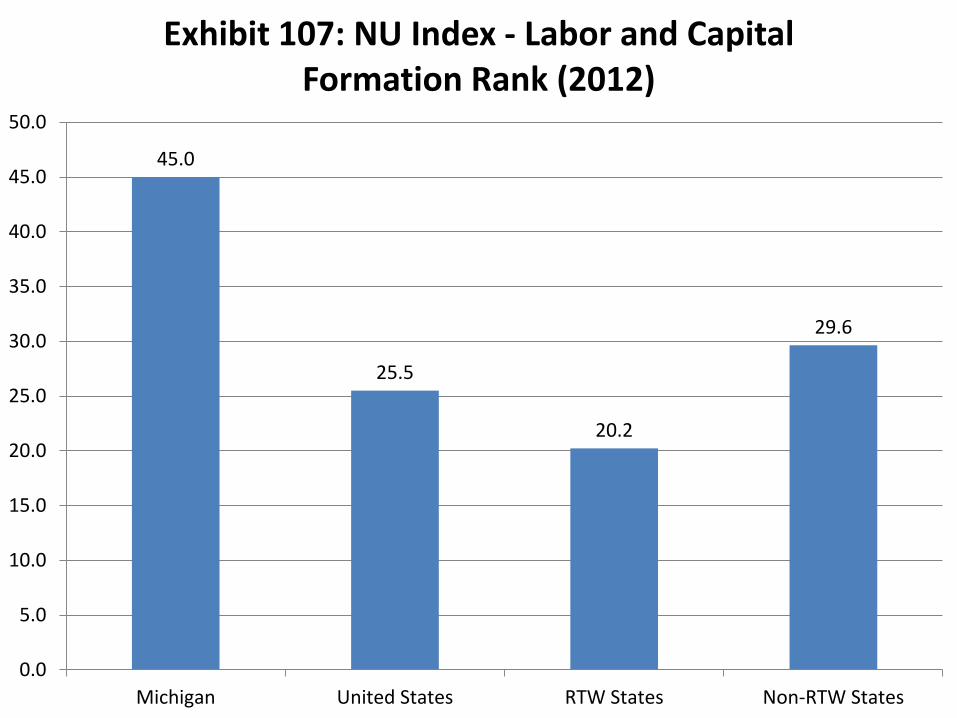
45.0
25.5
20.2
29.6
0.0
5.0
10.0
15.0
20.0
25.0
30.0
35.0
40.0
45.0
50.0
Michigan United States RTW States Non-RTW States
Exhibit 107: NU Index - Labor and Capital Formation Rank (2012)
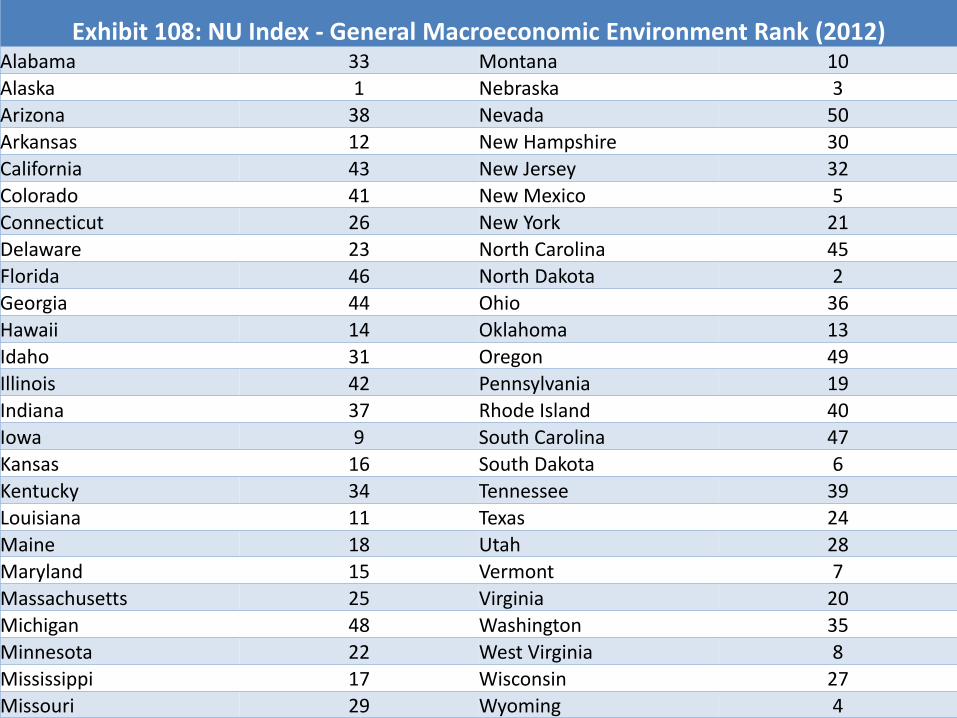
Exhibit 108: NU Index - General Macroeconomic Environment Rank (2012)Alabama 33 Montana 10
Alaska 1 Nebraska 3
Arizona 38 Nevada 50
Arkansas 12 New Hampshire 30
California 43 New Jersey 32
Colorado 41 New Mexico 5
Connecticut 26 New York 21
Delaware 23 North Carolina 45
Florida 46 North Dakota 2
Georgia 44 Ohio 36
Hawaii 14 Oklahoma 13
Idaho 31 Oregon 49
Illinois 42 Pennsylvania 19
Indiana 37 Rhode Island 40
Iowa 9 South Carolina 47
Kansas 16 South Dakota 6
Kentucky 34 Tennessee 39
Louisiana 11 Texas 24
Maine 18 Utah 28
Maryland 15 Vermont 7
Massachusetts 25 Virginia 20
Michigan 48 Washington 35
Minnesota 22 West Virginia 8
Mississippi 17 Wisconsin 27
Missouri 29 Wyoming 4
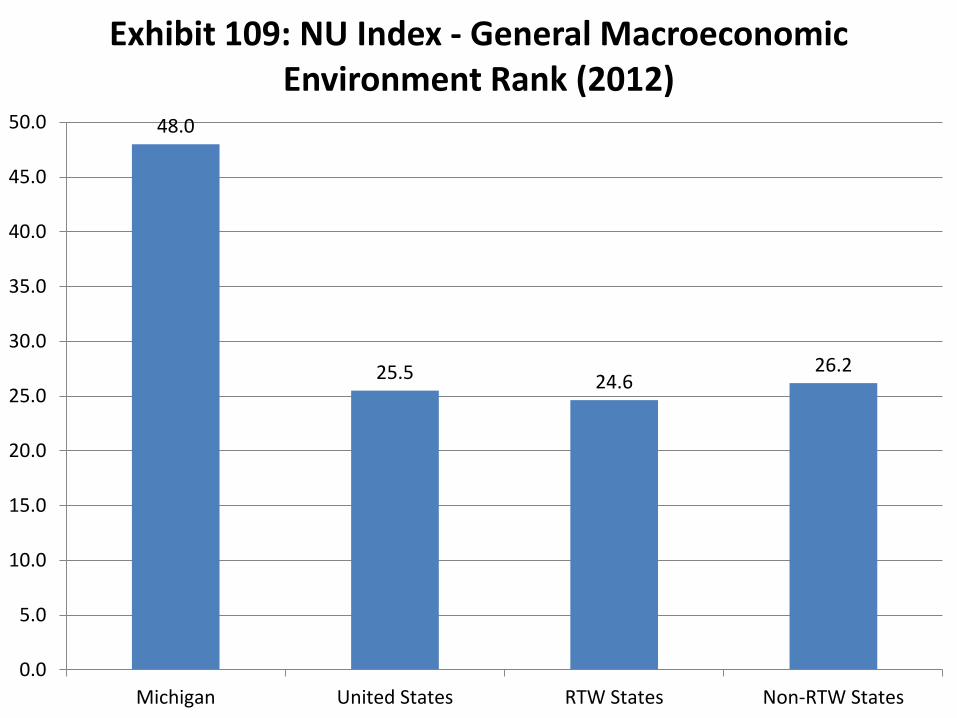
48.0
25.5 24.626.2
0.0
5.0
10.0
15.0
20.0
25.0
30.0
35.0
40.0
45.0
50.0
Michigan United States RTW States Non-RTW States
Exhibit 109: NU Index - General Macroeconomic Environment Rank (2012)
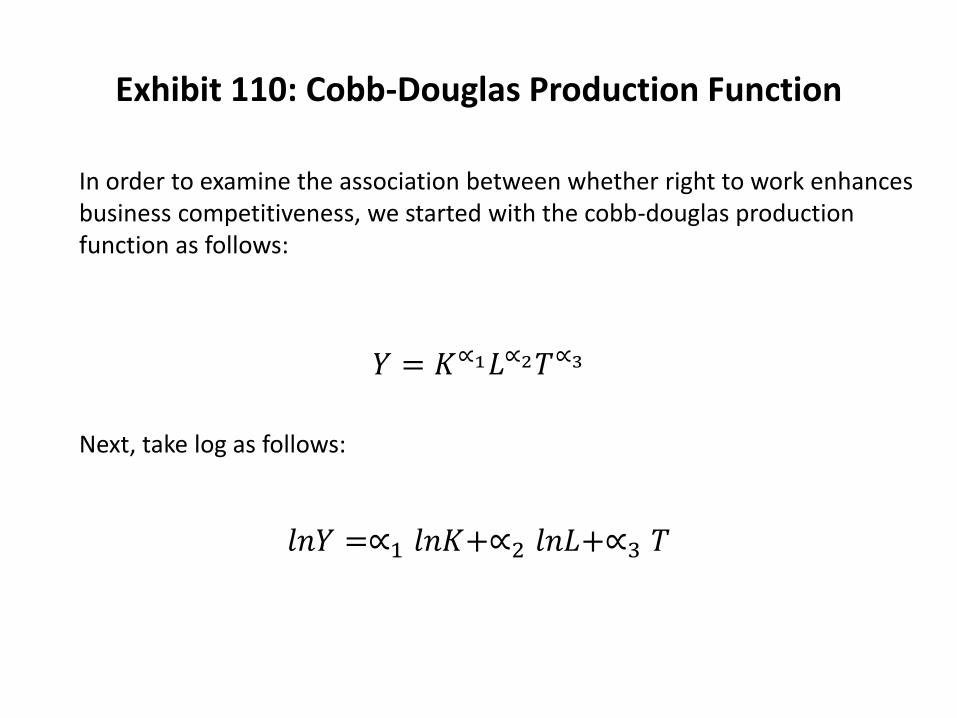
Exhibit 110: Cobb-Douglas Production Function
In order to examine the association between whether right to work enhances business competitiveness, we started with the cobb-douglas production function as follows:
Next, take log as follows:
𝑙𝑛𝑌 =∝1 𝑙𝑛𝐾+∝2 𝑙𝑛𝐿+∝3 𝑇
𝑌 = 𝐾∝1𝐿∝2𝑇∝3
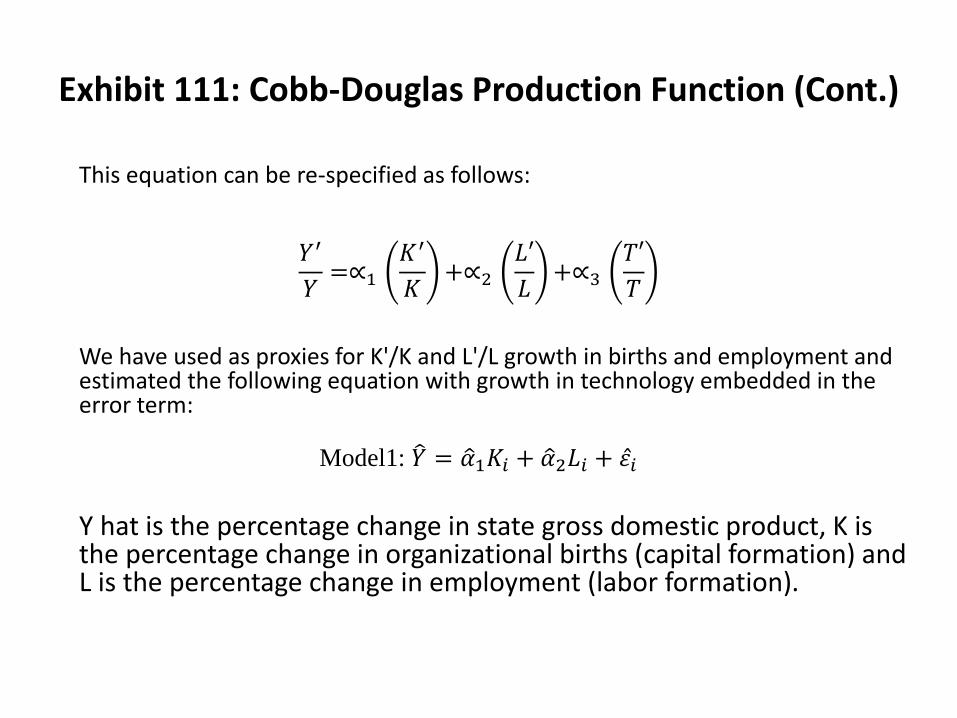
Exhibit 111: Cobb-Douglas Production Function (Cont.)
This equation can be re-specified as follows:
𝑌′
𝑌=∝1
𝐾′
𝐾+∝2
𝐿′
𝐿+∝3
𝑇′
𝑇
We have used as proxies for K'/K and L'/L growth in births and employment and estimated the following equation with growth in technology embedded in the error term:
Model1: 𝑌 = 𝛼1𝐾𝑖 + 𝛼2𝐿𝑖 + 𝜀𝑖
Y hat is the percentage change in state gross domestic product, K is the percentage change in organizational births (capital formation) and L is the percentage change in employment (labor formation).
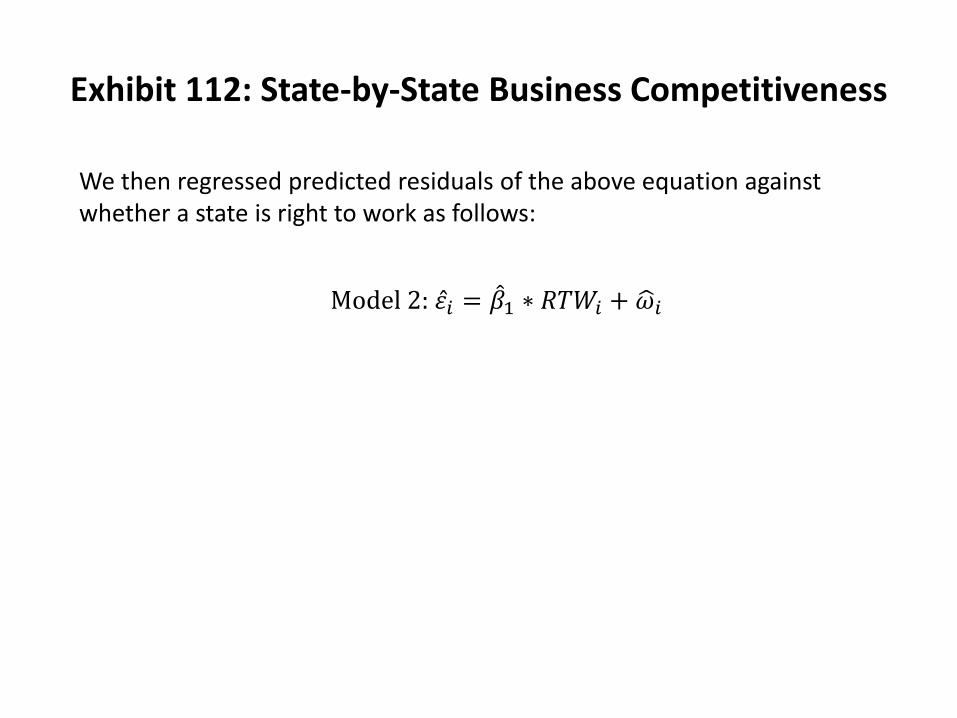
Exhibit 112: State-by-State Business Competitiveness
We then regressed predicted residuals of the above equation against whether a state is right to work as follows:
Model 2: 𝜀𝑖 = 𝛽1 ∗ 𝑅𝑇𝑊𝑖 + 𝜔𝑖
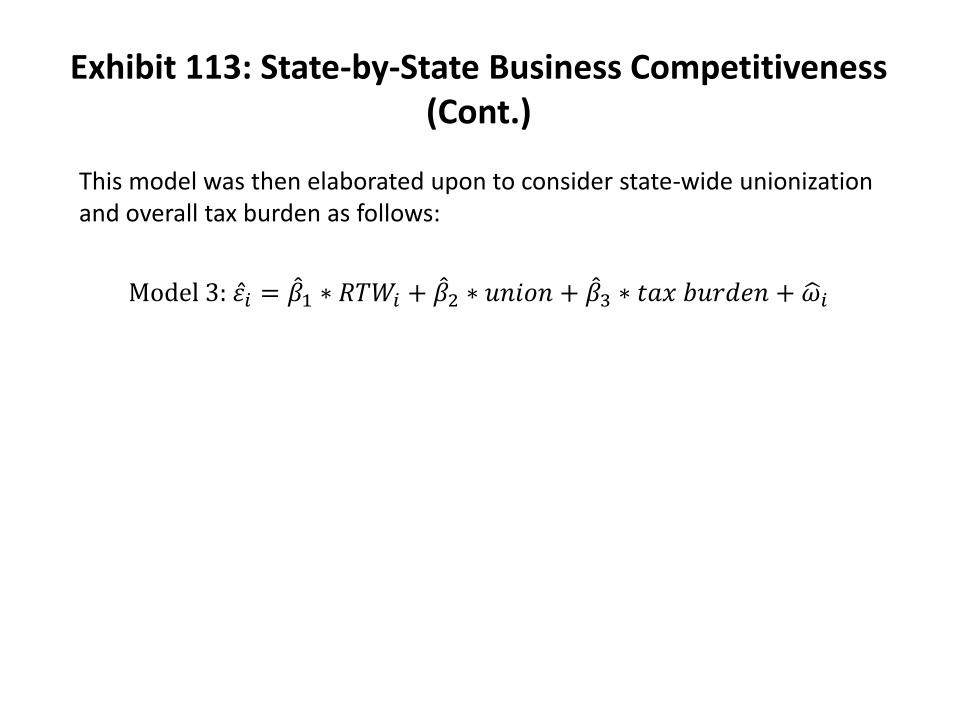
Exhibit 113: State-by-State Business Competitiveness (Cont.)
This model was then elaborated upon to consider state-wide unionization and overall tax burden as follows:
Model 3: 𝜀𝑖 = 𝛽1 ∗ 𝑅𝑇𝑊𝑖 + 𝛽2 ∗ 𝑢𝑛𝑖𝑜𝑛 + 𝛽3 ∗ 𝑡𝑎𝑥 𝑏𝑢𝑟𝑑𝑒𝑛 + 𝜔𝑖
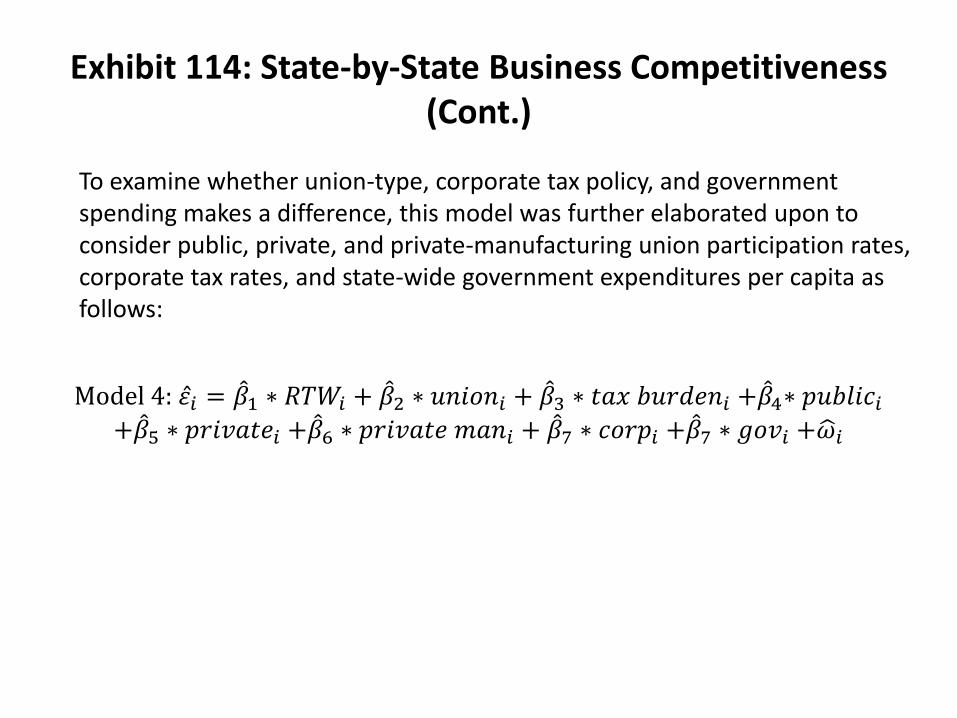
Exhibit 114: State-by-State Business Competitiveness (Cont.)
To examine whether union-type, corporate tax policy, and government spending makes a difference, this model was further elaborated upon to consider public, private, and private-manufacturing union participation rates, corporate tax rates, and state-wide government expenditures per capita as follows:
Model 4: 𝜀𝑖 = 𝛽1 ∗ 𝑅𝑇𝑊𝑖 + 𝛽2 ∗ 𝑢𝑛𝑖𝑜𝑛𝑖 + 𝛽3 ∗ 𝑡𝑎𝑥 𝑏𝑢𝑟𝑑𝑒𝑛𝑖 + 𝛽4∗ 𝑝𝑢𝑏𝑙𝑖𝑐𝑖
+ 𝛽5 ∗ 𝑝𝑟𝑖𝑣𝑎𝑡𝑒𝑖 + 𝛽6 ∗ 𝑝𝑟𝑖𝑣𝑎𝑡𝑒 𝑚𝑎𝑛𝑖 + 𝛽7 ∗ 𝑐𝑜𝑟𝑝𝑖 + 𝛽7 ∗ 𝑔𝑜𝑣𝑖 + 𝜔𝑖
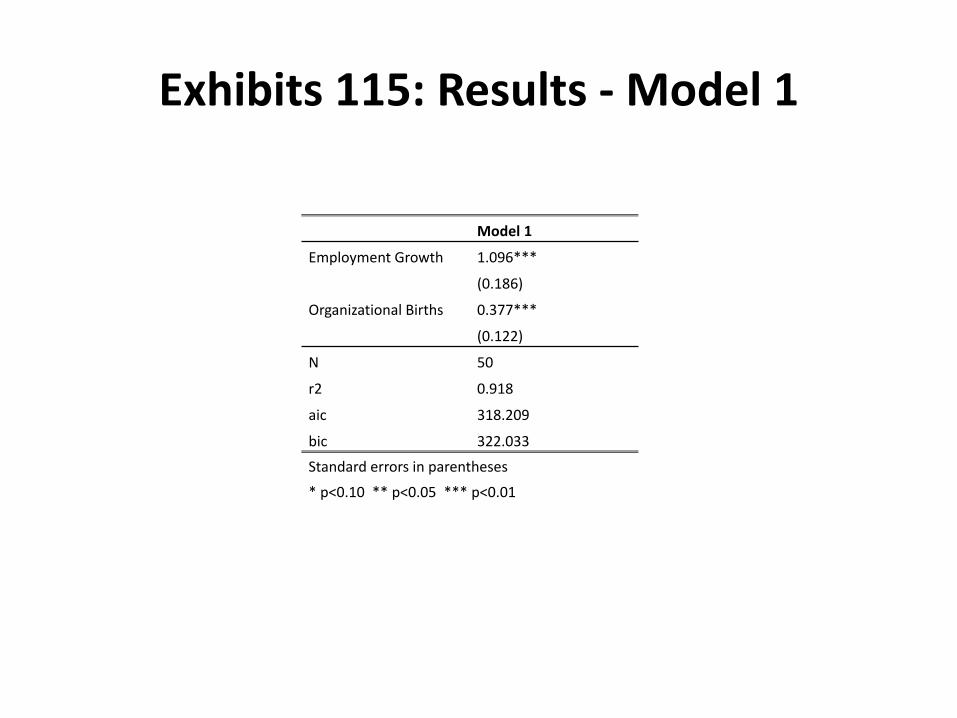
Exhibits 115: Results - Model 1
Model 1
Employment Growth 1.096***
(0.186)
Organizational Births 0.377***
(0.122)
N 50
r2 0.918
aic 318.209
bic 322.033
Standard errors in parentheses
* p<0.10 ** p<0.05 *** p<0.01
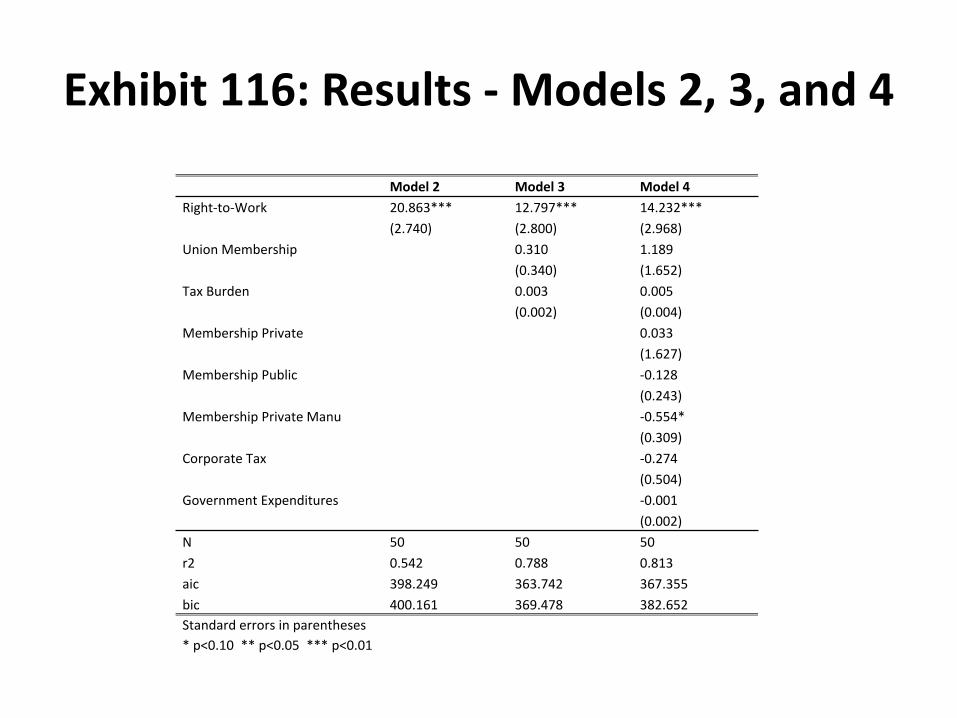
Exhibit 116: Results - Models 2, 3, and 4
Model 2 Model 3 Model 4
Right-to-Work 20.863*** 12.797*** 14.232***
(2.740) (2.800) (2.968)
Union Membership 0.310 1.189
(0.340) (1.652)
Tax Burden 0.003 0.005
(0.002) (0.004)
Membership Private 0.033
(1.627)
Membership Public -0.128
(0.243)
Membership Private Manu -0.554*
(0.309)
Corporate Tax -0.274
(0.504)
Government Expenditures -0.001
(0.002)
N 50 50 50
r2 0.542 0.788 0.813
aic 398.249 363.742 367.355
bic 400.161 369.478 382.652
Standard errors in parentheses
* p<0.10 ** p<0.05 *** p<0.01
Exhibit 117
Michigan HB 4454 (2007)
“A bill to prohibit employers from placing certain conditions on employment; to grant rights to employees; to impose duties and responsibilities on certain state and local officers; to make certain agreements unlawful; and to provide remedies and penalties.”
THE PEOPLE OF THE STATE OF MICHIGAN ENACT:
Sec. 1. This act shall be known and may be cited as the "right to work law".
Sec. 3. As used in this act:
(a) "Employer" means a person or entity that pays 1 or more individuals under an express or implied contract of hire.
(b) "Labor organization" means an organization of any kind, an agency or employee representation committee, group, association, or plan in which employees participate and which exists for the purpose, in whole or in part, of dealing with employers concerning grievances, labor disputes, wages, rates of pay, hours, or other terms or conditions of employment.
Sec. 5. Except as provided in section 13, a person shall not require an employee to do any of the following as a condition of employment or continued employment:
(a) Become or remain a member of a labor organization.
(b) Pay dues, fees, assessments, or other similar charges to a labor organization.
(c) Pay to a charity or other third party an amount equivalent to or pro rata portion of dues, fees, assessments, or other charges required of members of a labor organization.
Sec. 7. Except as provided in section 13, an agreement, understanding, or practice between a labor organization and employer that violates employee rights granted under this act is unlawful and unenforceable.
Sec. 9. A person who suffers an injury or a threatened injury from a violation of this act may bring a civil action for damages, injunctive relief, or both. The court may award a prevailing plaintiff costs and reasonable attorney fees. The civil remedy is independent of, and in addition to, any criminal proceeding or sanction prescribed for a violation of this act.
Sec. 11. A person who violates this act is guilty of a misdemeanor. The prosecuting attorney of the county or the attorney general shall investigate each complaint of a violation of this act and shall prosecute the criminal case if credible evidence of a violation exists.
Sec. 13. This act does not apply to any of the following:
(a) An employer or employee covered by the federal railway labor act, 45 USC 151 to 188.
(b) A federal employer or employee.
(c) An employer or employee at an exclusively federal enclave.
(d) An employment contract entered into before the effective date of this act, except that this act applies to a contract renewal or extension that takes effect after the effective date of this act.
(e) A situation in which it would conflict with, or be preempted by, federal law.
Enacting section 1. This act does not take effect unless Senate Bill No. ______ or House Bill No. 4455(request no. 00764'07 a) of the 94th Legislature is enacted into law.
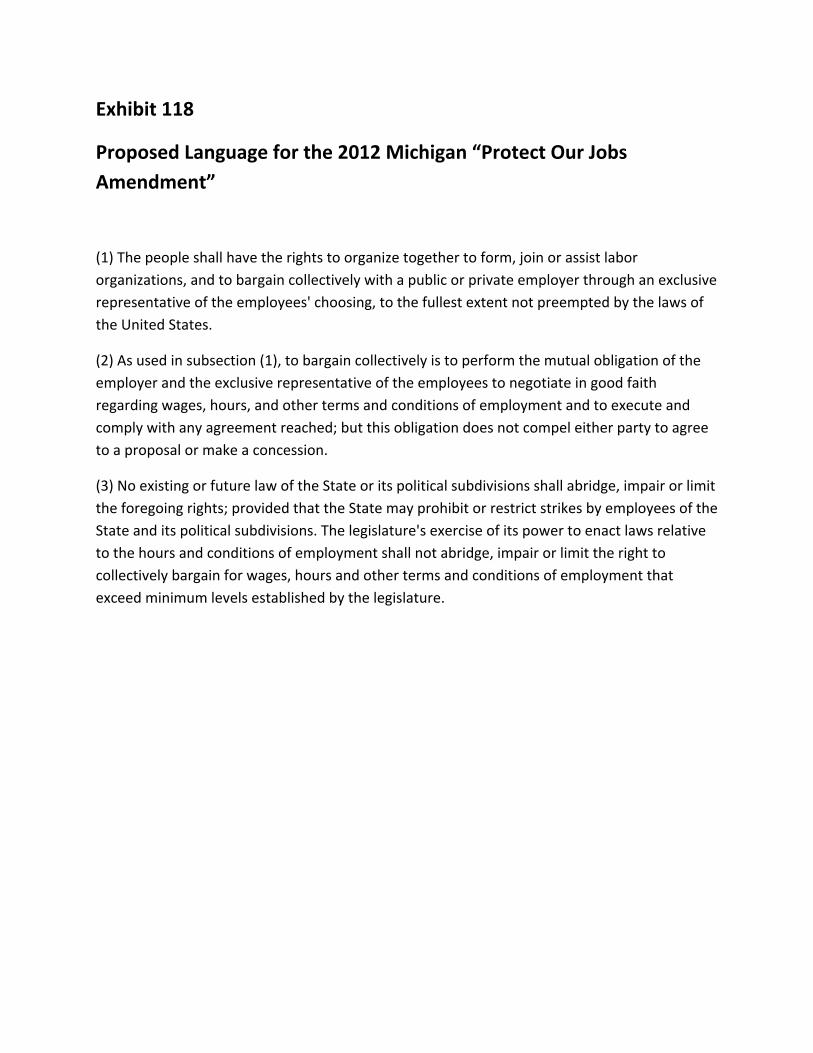
Exhibit 118
Proposed Language for the 2012 Michigan “Protect Our Jobs Amendment”
(1) The people shall have the rights to organize together to form, join or assist labor organizations, and to bargain collectively with a public or private employer through an exclusive representative of the employees' choosing, to the fullest extent not preempted by the laws of the United States.
(2) As used in subsection (1), to bargain collectively is to perform the mutual obligation of the employer and the exclusive representative of the employees to negotiate in good faith regarding wages, hours, and other terms and conditions of employment and to execute and comply with any agreement reached; but this obligation does not compel either party to agree to a proposal or make a concession.
(3) No existing or future law of the State or its political subdivisions shall abridge, impair or limit the foregoing rights; provided that the State may prohibit or restrict strikes by employees of the State and its political subdivisions. The legislature's exercise of its power to enact laws relative to the hours and conditions of employment shall not abridge, impair or limit the right to collectively bargain for wages, hours and other terms and conditions of employment that exceed minimum levels established by the legislature.
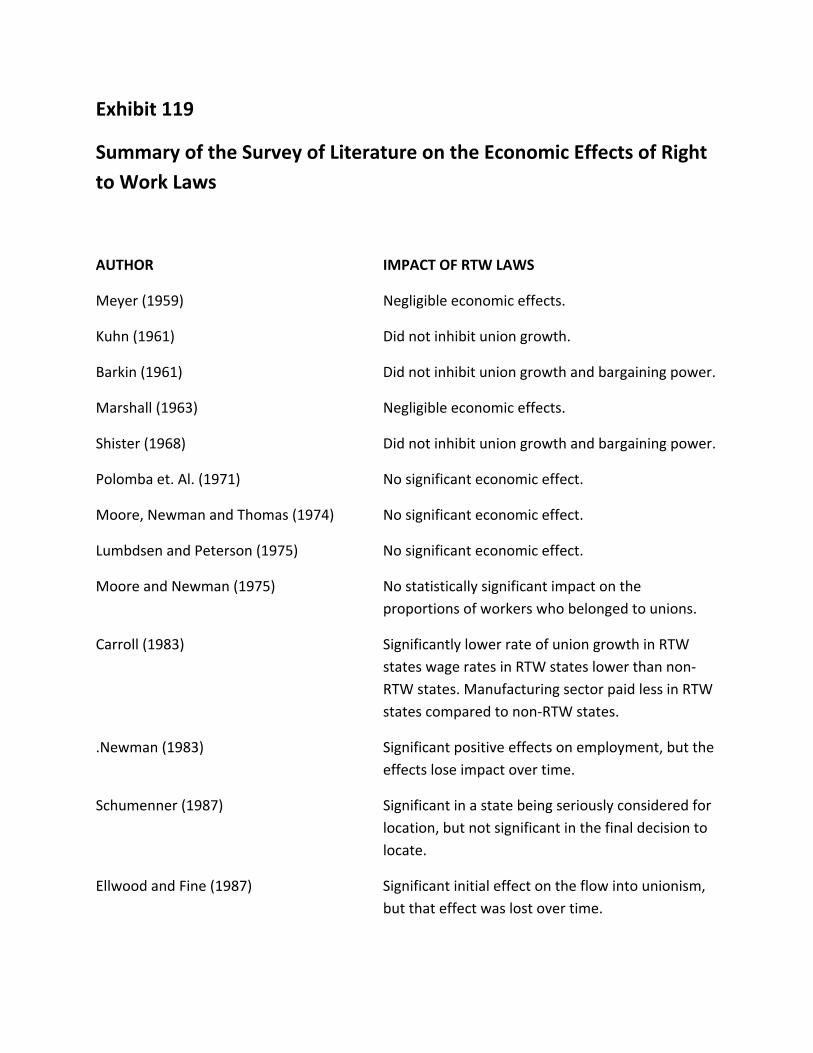
Exhibit 119
Summary of the Survey of Literature on the Economic Effects of Right to Work Laws
AUTHOR IMPACT OF RTW LAWS
Meyer (1959) Negligible economic effects.
Kuhn (1961) Did not inhibit union growth.
Barkin (1961) Did not inhibit union growth and bargaining power.
Marshall (1963) Negligible economic effects.
Shister (1968) Did not inhibit union growth and bargaining power.
Polomba et. Al. (1971) No significant economic effect.
Moore, Newman and Thomas (1974) No significant economic effect.
Lumbdsen and Peterson (1975) No significant economic effect.
Moore and Newman (1975) No statistically significant impact on the proportions of workers who belonged to unions.
Carroll (1983) Significantly lower rate of union growth in RTW states wage rates in RTW states lower than non-RTW states. Manufacturing sector paid less in RTW states compared to non-RTW states.
.Newman (1983) Significant positive effects on employment, but the effects lose impact over time.
Schumenner (1987) Significant in a state being seriously considered for location, but not significant in the final decision to locate.
Ellwood and Fine (1987) Significant initial effect on the flow into unionism, but that effect was lost over time.
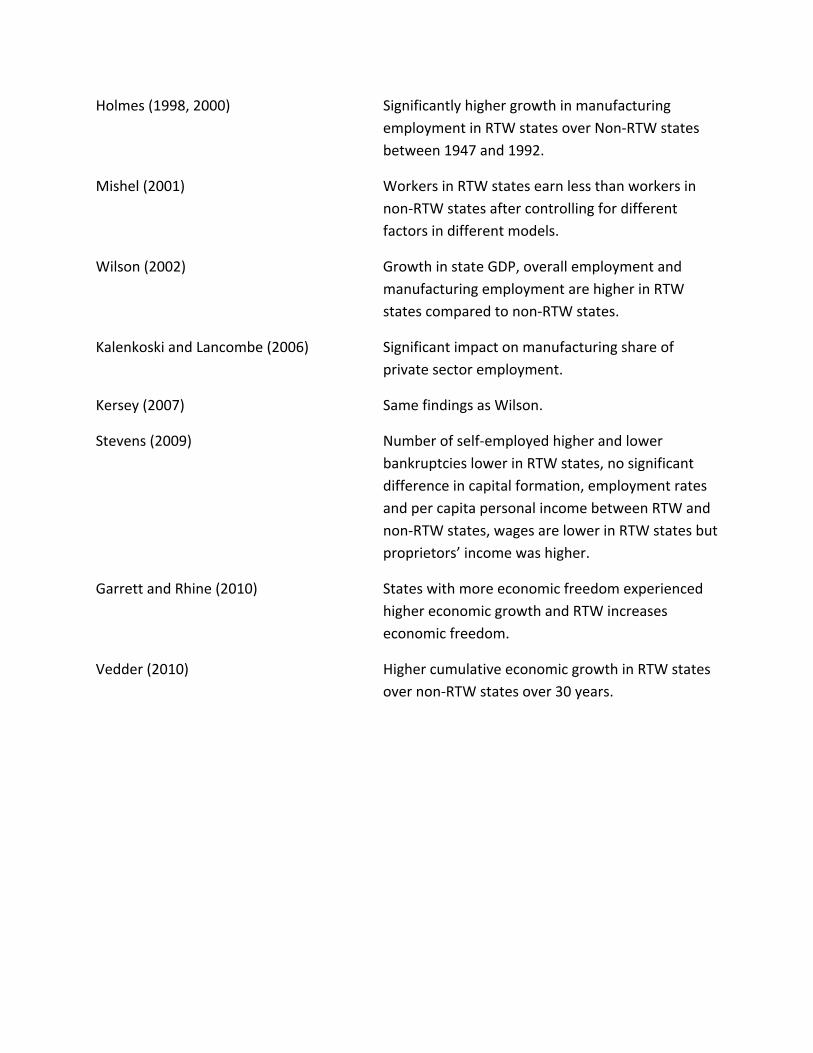
Holmes (1998, 2000) Significantly higher growth in manufacturing employment in RTW states over Non-RTW states between 1947 and 1992.
Mishel (2001) Workers in RTW states earn less than workers in non-RTW states after controlling for different factors in different models.
Wilson (2002) Growth in state GDP, overall employment and manufacturing employment are higher in RTW states compared to non-RTW states.
Kalenkoski and Lancombe (2006) Significant impact on manufacturing share of private sector employment.
Kersey (2007) Same findings as Wilson.
Stevens (2009) Number of self-employed higher and lower bankruptcies lower in RTW states, no significant difference in capital formation, employment rates and per capita personal income between RTW and non-RTW states, wages are lower in RTW states but proprietors’ income was higher.
Garrett and Rhine (2010) States with more economic freedom experienced higher economic growth and RTW increases economic freedom.
Vedder (2010) Higher cumulative economic growth in RTW states over non-RTW states over 30 years.

Northwood University is accredited by the Higher Learning Commission and is a member of the North Central Association (800-621-7440; higherlearningcommission.org). Northwood University is committed to a policy of nondiscrimination and equal opportunity for all persons regardless of race, gender, color, religion, creed, national origin
or ancestry, age, marital status, disability or veteran status. The University also is committed to compliance with all applicable laws regarding nondiscrimination.