Embed Size (px)
Citation preview
2012 NATIONAL SURVEY OF
SCIENCE AND MATHEMATICS EDUCATION
STATUS OF HIGH SCHOOL PHYSICS
SEPTEMBER 2013
ERIC R. BANILOWER
HORIZON RESEARCH, INC. CHAPEL HILL, NC

Horizon Research, Inc. ii September 2013
Disclaimer The 2012 National Survey of Science and Mathematics Education: Status of High School Physics was prepared with support from the National Science Foundation under grant number DRL-1008228. Any opinions, findings, and conclusions or recommendations expressed in this material are those of the authors and do not necessarily reflect the views of the National Science Foundation. Suggested Citation Banilower, E. B. (2013). 2012 National Survey of Science and Mathematics Education: Status of high school physics. Chapel Hill, NC: Horizon Research, Inc.
Horizon Research, Inc. iii September 2013
TABLE OF CONTENTS
Page List of Tables .................................................................................................................................. v Introduction ..................................................................................................................................... 1 Characteristics of the High School Physics Teaching Force .......................................................... 2 General Demographics........................................................................................................ 2 Content Preparedness .......................................................................................................... 4 Pedagogical Beliefs ............................................................................................................. 6 Pedagogical Preparedness ................................................................................................... 7 Professional Development of High School Physics Teachers ........................................................ 8 High School Physics Classes Offered ........................................................................................... 12 High School Physics Instruction ................................................................................................... 14 Teachers’ Perceptions of Their Decision Making Autonomy .......................................... 14 Instructional Objectives .................................................................................................... 15 Class Activities ................................................................................................................. 16 Homework and Assessment Practices .............................................................................. 18 Resources Available for High School Physics Instruction ........................................................... 20 Instructional Materials ...................................................................................................... 20 Facilities and Equipment................................................................................................... 24 Factors Affecting High School Physics Instruction ...................................................................... 26 Summary ....................................................................................................................................... 28 Appendix

Horizon Research, Inc. iv September 2013
Horizon Research, Inc. v September 2013
LIST OF TABLES
Page 1 Characteristics of the High School Science Teaching Force ........................................................................... 3 2 High School Science Teacher Degrees ............................................................................................................ 3 3 High School Science Teachers’ Paths to Certification .................................................................................... 4 4 High School Science Teachers with Varying Levels of Background in the Subject of
Randomly Selected Class ......................................................................................................................... 4 5 High School Science Teachers Completing Various College Courses ............................................................ 5 6 High School Physics Teachers’ Perceptions of Preparedness to Teach Each of a Number
of Topics .................................................................................................................................................. 5 7 High School Science Teacher Mean Scores for the Perceptions of Preparedness to Teach
Science Content Composite ..................................................................................................................... 6 8 High School Science Teachers Agreeing with Various Statements about Teaching and
Learning ................................................................................................................................................... 7 9 High School Science Teachers Considering Themselves Very Well Prepared for Each of
a Number of Tasks ................................................................................................................................... 8 10 High School Science Classes in which Teachers Feel Very Well Prepared for Each of a
Number of Tasks in the Most Recent Unit ............................................................................................... 8 11 High School Science Teachers’ Most Recent Participation in Science-Focused
Professional Development........................................................................................................................ 9 12 Time Spent on Professional Development in the Last Three Years ................................................................ 9 13 High School Science Teachers Participating in Various Professional Development
Activities in the Last Three Years ............................................................................................................ 9 14 High School Science Teachers Whose Professional Development in the Last Three Years
Had Each of a Number of Characteristics to a Substantial Extend ........................................................ 10 15 High School Science Teachers’ Most Recent College Coursework in Field ................................................. 11 16 High School Science Teachers Reporting that their Professional Development/
Coursework in the Last Three Years Gave Heavy Emphasis to Various Areas ..................................... 12 17 High School Science Teachers Serving in Various Leadership Roles in the Last Three
Years ...................................................................................................................................................... 12 18 Availability of Physics Courses at High Schools .......................................................................................... 13 19 Most Commonly Offered High School Science Courses .............................................................................. 13 20 Demographics of Students in 1st Year High School Science Courses ........................................................... 14 21 Prior-Achievement Grouping in 1st Year High School Science Classes ....................................................... 14 22 High School Science Classes in which Teachers Report Having Strong Control Over
Various Curriculum and Instruction Decisions ...................................................................................... 15 23 High School Science Class Mean Scores for Curriculum Control and Pedagogical Control
Composites ............................................................................................................................................. 15 24 High School Science Classes with Heavy Emphasis on Various Instructional Objectives ........................... 16 25 High School Science Classes in which Teachers Report Using Various Activities at Least
Once a Week .......................................................................................................................................... 17
Horizon Research, Inc. vi September 2013
26 High School Science Classes in which Teachers Report that Students Use Various
Instructional Technologies at Least Once a Week ................................................................................. 17 27 High School Science Classes Participating in Various Activities in the Most Recent
Lesson .................................................................................................................................................... 18 28 Average Percentage of Time Spent on Different Activities in the Most Recent High
School Science Lesson ........................................................................................................................... 18 29 Amount of Homework Assigned in High School Science Classes per Week ............................................... 19 30 High School Science Classes in which Teachers Report Assessing Students Using
Various Methods in the Most Recent Unit ............................................................................................. 20 31 Frequency of Required External Testing in High School Science Classes ................................................... 20 32 High School Science Classes Using Commercially Published Instructional Materials ................................. 21 33 Instructional Materials Used in High School Science Classes ...................................................................... 21 34 Publication Year of Instructional Materials in High School Science Classes ............................................... 22 35 Perceived Quality of Instructional Materials Used in High School Science Classes .................................... 22 36 Percentage of Instructional Materials Covered during High School Science Courses .................................. 22 37 Percentage of Instructional Time Spent Using Instructional Materials during High School
Science Courses ..................................................................................................................................... 23 38 Ways High School Science Teachers Substantially Used their Instructional Materials in
the Most Recent Unit ............................................................................................................................. 23 39 Reasons Why High School Science Instructional Materials Are Supplemented ........................................... 24 40 Reasons Why Parts of the High School Science Instructional Materials Are Skipped ................................. 24 41 Availability of Instructional Technologies in High School Science Classes ................................................. 25 42 Expectations that Students will Provide their Own Instructional Technologies ............................................ 25 43 High School Science Classes with Adequate Resources for Instruction ....................................................... 26 44 Class Mean Scores of the Adequacy of Resources for Instruction ................................................................ 26 45 Factors Seen as Promoting Effective Instruction in High School Science Classes ....................................... 27 46 Extent to which Technology Quality Is a Serious Problem for Instruction in the
Randomly Selected High School Science Class ..................................................................................... 27 47 Class Mean Scores for the Factors Affecting Instruction Composites .......................................................... 28 Appendix A-1 Teacher Mean Scores for Composites A-2 Class Mean Scores for Composites
Horizon Research, Inc. 1 September 2013
INTRODUCTION The 2012 National Survey of Science and Mathematics Education was designed to provide up-to-date information and to identify trends in the areas of teacher background and experience, curriculum and instruction, and the availability and use of instructional resources. A total of 7,752 science and mathematics teachers in schools across the United States participated in this survey, a response rate of 77 percent. The research questions addressed by the study are:
1. To what extent do science and mathematics instruction and ongoing assessment mirror current understanding of learning?
2. What influences teachers’ decisions about content and pedagogy?
3. What are the characteristics of the science/mathematics teaching force in terms of race, gender, age, content background, beliefs about teaching and learning, and perceptions of preparedness?
4. What are the most commonly used textbooks/programs, and how are they used?
5. What formal and informal opportunities do science/mathematics teachers have for ongoing development of their knowledge and skills?
6. How are resources for science/mathematics education, including well-prepared teachers and course offerings, distributed among schools in different types of communities and different socioeconomic levels?
The 2012 National Survey is based on a national probability sample of schools and science and mathematics teachers in grades K–12 in the 50 states and the District of Columbia. The sample was designed to allow national estimates of science and mathematics course offerings and enrollment; teacher background preparation; textbook usage; instructional techniques; and availability and use of science and mathematics facilities and equipment. Every eligible school and teacher in the target population had a known, positive probability of being drawn into the sample. Because biology is by far the most common science course at the high school level, selecting a random sample of science teachers would result in a much larger number of biology teachers than chemistry or physics teachers. In order to ensure that the sample would include a sufficient number of chemistry and physics teachers for separate analysis, information on teaching assignments was used to create a separate domain for these teachers, and sampling rates were adjusted by domain. This report describes the status of high school (grades 9–12) physics instruction based on the responses of 472 physics teachers.1 For comparison purposes, many of the tables include data 1 A physics teacher is defined as someone who teaches at least one class of non-college prep, 1st year college prep, or 2nd year advanced physics.
Horizon Research, Inc. 2 September 2013
from the 1,246 respondents who do not teach physics; i.e., all other high school science teachers. These data include responses from high school biology, chemistry, Earth science, and physical science teachers. Technical detail on the survey sample design, as well as data collection and analysis procedures, is included in the Report of the 2012 National Survey of Science and Mathematics Education.2 The standard errors for the estimates presented in this report are included in parentheses in the tables. The narrative sections of the report generally point out only those differences that are substantial as well as statistically significant at the 0.05 level. This status report of high school physics teaching is organized into major topical areas:
• Characteristics of the physics teaching force; • Professional development of physics teachers; • Physics classes offered; • Physics instruction, in terms of time spent, objectives, and activities; • Resources available for physics instruction; and • Factors affecting physics instruction.
CHARACTERISTICS OF THE HIGH SCHOOL PHYSICS TEACHING FORCE
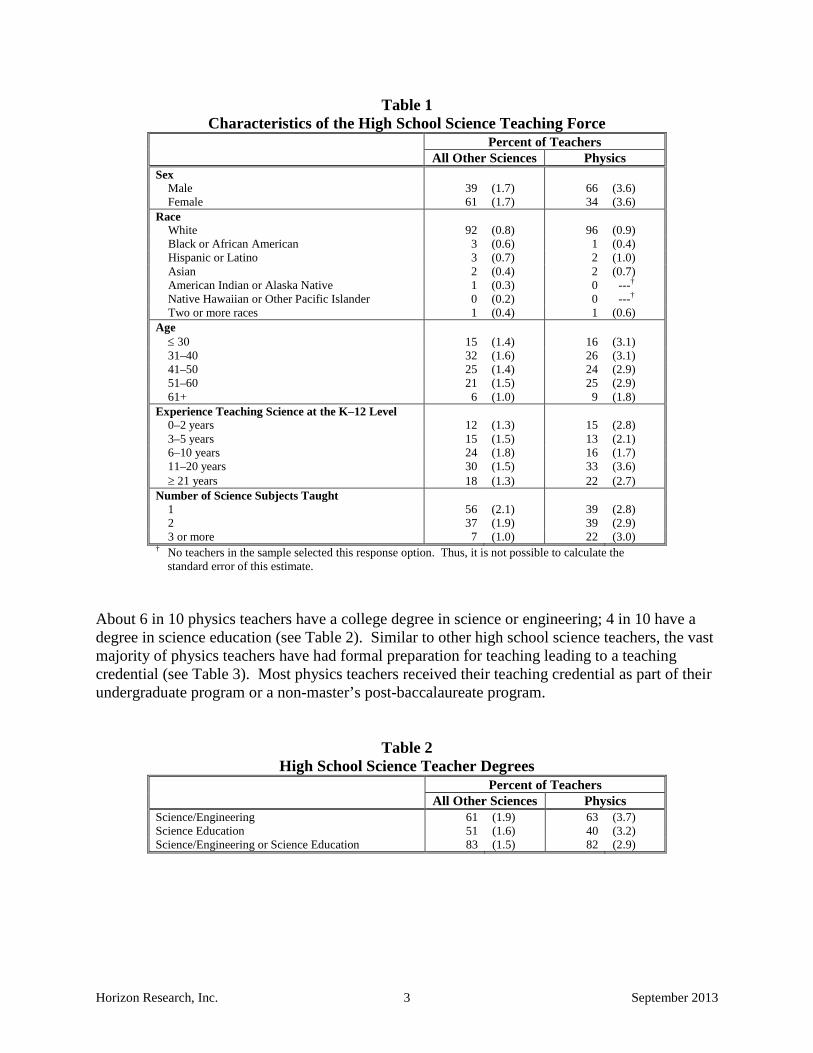
General Demographics Compared to teachers of the other sciences, physics teachers are much more likely to be male than female (see Table 1). Similar to the other sciences, the overwhelming majority are white. Judging by the age of physics teachers, it appears that as many as one-third may be nearing retirement in the next 10 years. Physics teachers are more likely to teach multiple subjects (e.g., biology, chemistry, physics) within science than are other high school science teachers; only 39 percent of physics teachers have one preparation compared to 56 percent of all other high school science teachers. This difference is likely due to the fact that most schools offer a smaller number of physics courses than biology and chemistry courses.
2 Banilower, E. R., Smith, P. S., Weiss, I. R., Malzahn, K. A., Campbell, K. M., & Weis, A. M. (2013). Report of the 2012 national survey of science and mathematics education. Chapel Hill, NC: Horizon Research, Inc.
Horizon Research, Inc. 3 September 2013
Table 1 Characteristics of the High School Science Teaching Force
Percent of Teachers All Other Sciences Physics
Sex Male 39 (1.7) 66 (3.6) Female 61 (1.7) 34 (3.6)
Race White 92 (0.8) 96 (0.9) Black or African American 3 (0.6) 1 (0.4) Hispanic or Latino 3 (0.7) 2 (1.0) Asian 2 (0.4) 2 (0.7) American Indian or Alaska Native 1 (0.3) 0 ---† Native Hawaiian or Other Pacific Islander 0 (0.2) 0 ---† Two or more races 1 (0.4) 1 (0.6)
Age ≤ 30 15 (1.4) 16 (3.1) 31–40 32 (1.6) 26 (3.1) 41–50 25 (1.4) 24 (2.9) 51–60 21 (1.5) 25 (2.9) 61+ 6 (1.0) 9 (1.8)
Experience Teaching Science at the K–12 Level 0–2 years 12 (1.3) 15 (2.8) 3–5 years 15 (1.5) 13 (2.1) 6–10 years 24 (1.8) 16 (1.7) 11–20 years 30 (1.5) 33 (3.6) ≥ 21 years 18 (1.3) 22 (2.7)
Number of Science Subjects Taught 1 56 (2.1) 39 (2.8) 2 37 (1.9) 39 (2.9) 3 or more 7 (1.0) 22 (3.0)
† No teachers in the sample selected this response option. Thus, it is not possible to calculate the standard error of this estimate.
About 6 in 10 physics teachers have a college degree in science or engineering; 4 in 10 have a degree in science education (see Table 2). Similar to other high school science teachers, the vast majority of physics teachers have had formal preparation for teaching leading to a teaching credential (see Table 3). Most physics teachers received their teaching credential as part of their undergraduate program or a non-master’s post-baccalaureate program.
Table 2 High School Science Teacher Degrees
Percent of Teachers All Other Sciences Physics Science/Engineering 61 (1.9) 63 (3.7) Science Education 51 (1.6) 40 (3.2) Science/Engineering or Science Education 83 (1.5) 82 (2.9)
Horizon Research, Inc. 4 September 2013
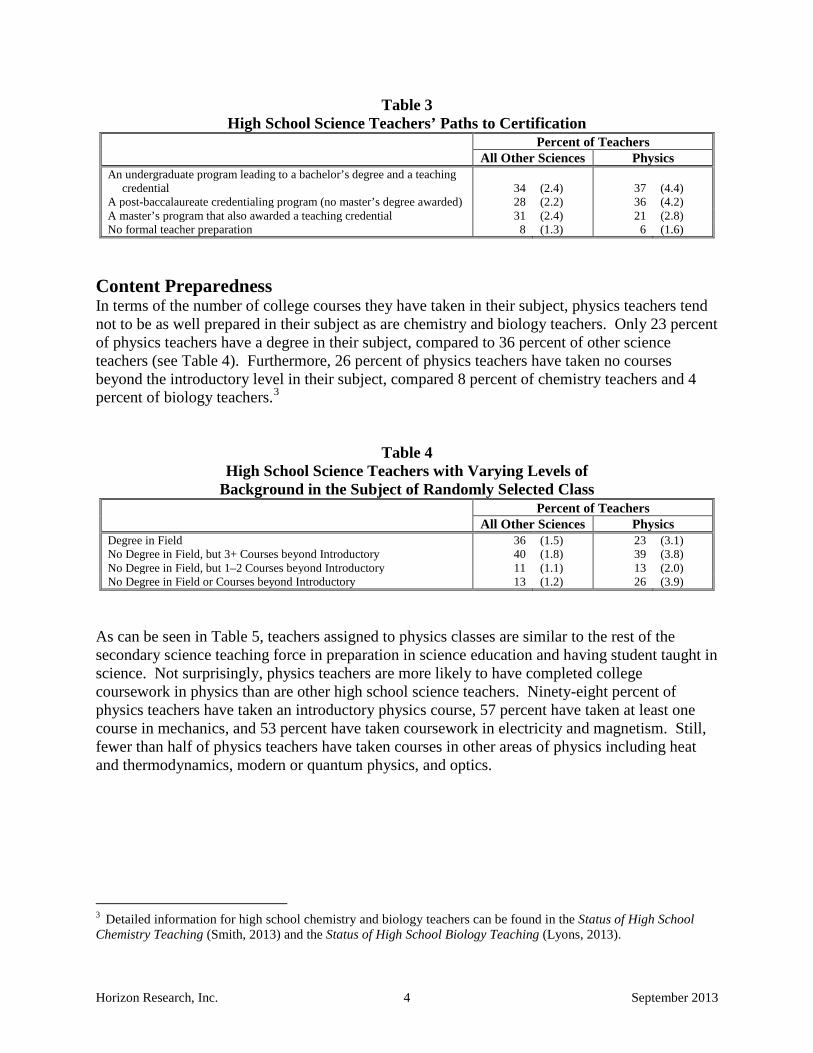
Table 3 High School Science Teachers’ Paths to Certification
Percent of Teachers All Other Sciences Physics An undergraduate program leading to a bachelor’s degree and a teaching
credential 34 (2.4) 37 (4.4) A post-baccalaureate credentialing program (no master’s degree awarded) 28 (2.2) 36 (4.2) A master’s program that also awarded a teaching credential 31 (2.4) 21 (2.8) No formal teacher preparation 8 (1.3) 6 (1.6)
Content Preparedness In terms of the number of college courses they have taken in their subject, physics teachers tend not to be as well prepared in their subject as are chemistry and biology teachers. Only 23 percent of physics teachers have a degree in their subject, compared to 36 percent of other science teachers (see Table 4). Furthermore, 26 percent of physics teachers have taken no courses beyond the introductory level in their subject, compared 8 percent of chemistry teachers and 4 percent of biology teachers.3
Table 4 High School Science Teachers with Varying Levels of
Background in the Subject of Randomly Selected Class
Percent of Teachers All Other Sciences Physics Degree in Field 36 (1.5) 23 (3.1) No Degree in Field, but 3+ Courses beyond Introductory 40 (1.8) 39 (3.8) No Degree in Field, but 1–2 Courses beyond Introductory 11 (1.1) 13 (2.0) No Degree in Field or Courses beyond Introductory 13 (1.2) 26 (3.9)
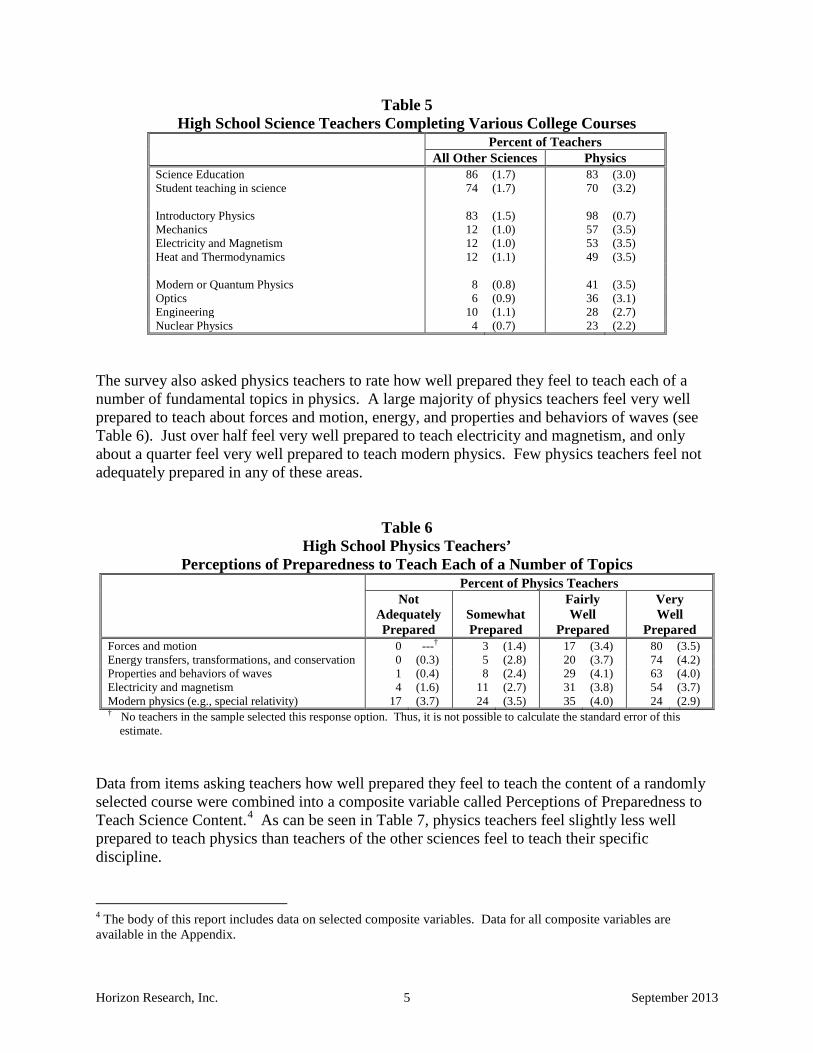
As can be seen in Table 5, teachers assigned to physics classes are similar to the rest of the secondary science teaching force in preparation in science education and having student taught in science. Not surprisingly, physics teachers are more likely to have completed college coursework in physics than are other high school science teachers. Ninety-eight percent of physics teachers have taken an introductory physics course, 57 percent have taken at least one course in mechanics, and 53 percent have taken coursework in electricity and magnetism. Still, fewer than half of physics teachers have taken courses in other areas of physics including heat and thermodynamics, modern or quantum physics, and optics.
3 Detailed information for high school chemistry and biology teachers can be found in the Status of High School Chemistry Teaching (Smith, 2013) and the Status of High School Biology Teaching (Lyons, 2013).
Horizon Research, Inc. 5 September 2013
Table 5 High School Science Teachers Completing Various College Courses
Percent of Teachers All Other Sciences Physics Science Education 86 (1.7) 83 (3.0) Student teaching in science 74 (1.7) 70 (3.2) Introductory Physics 83 (1.5) 98 (0.7) Mechanics 12 (1.0) 57 (3.5) Electricity and Magnetism 12 (1.0) 53 (3.5) Heat and Thermodynamics 12 (1.1) 49 (3.5) Modern or Quantum Physics 8 (0.8) 41 (3.5) Optics 6 (0.9) 36 (3.1) Engineering 10 (1.1) 28 (2.7) Nuclear Physics 4 (0.7) 23 (2.2)
The survey also asked physics teachers to rate how well prepared they feel to teach each of a number of fundamental topics in physics. A large majority of physics teachers feel very well prepared to teach about forces and motion, energy, and properties and behaviors of waves (see Table 6). Just over half feel very well prepared to teach electricity and magnetism, and only about a quarter feel very well prepared to teach modern physics. Few physics teachers feel not adequately prepared in any of these areas.
Table 6 High School Physics Teachers’
Perceptions of Preparedness to Teach Each of a Number of Topics Percent of Physics Teachers
Not Adequately Prepared
Somewhat Prepared
Fairly Well
Prepared
Very Well
Prepared Forces and motion 0 ---† 3 (1.4) 17 (3.4) 80 (3.5) Energy transfers, transformations, and conservation 0 (0.3) 5 (2.8) 20 (3.7) 74 (4.2) Properties and behaviors of waves 1 (0.4) 8 (2.4) 29 (4.1) 63 (4.0) Electricity and magnetism 4 (1.6) 11 (2.7) 31 (3.8) 54 (3.7) Modern physics (e.g., special relativity) 17 (3.7) 24 (3.5) 35 (4.0) 24 (2.9) † No teachers in the sample selected this response option. Thus, it is not possible to calculate the standard error of this
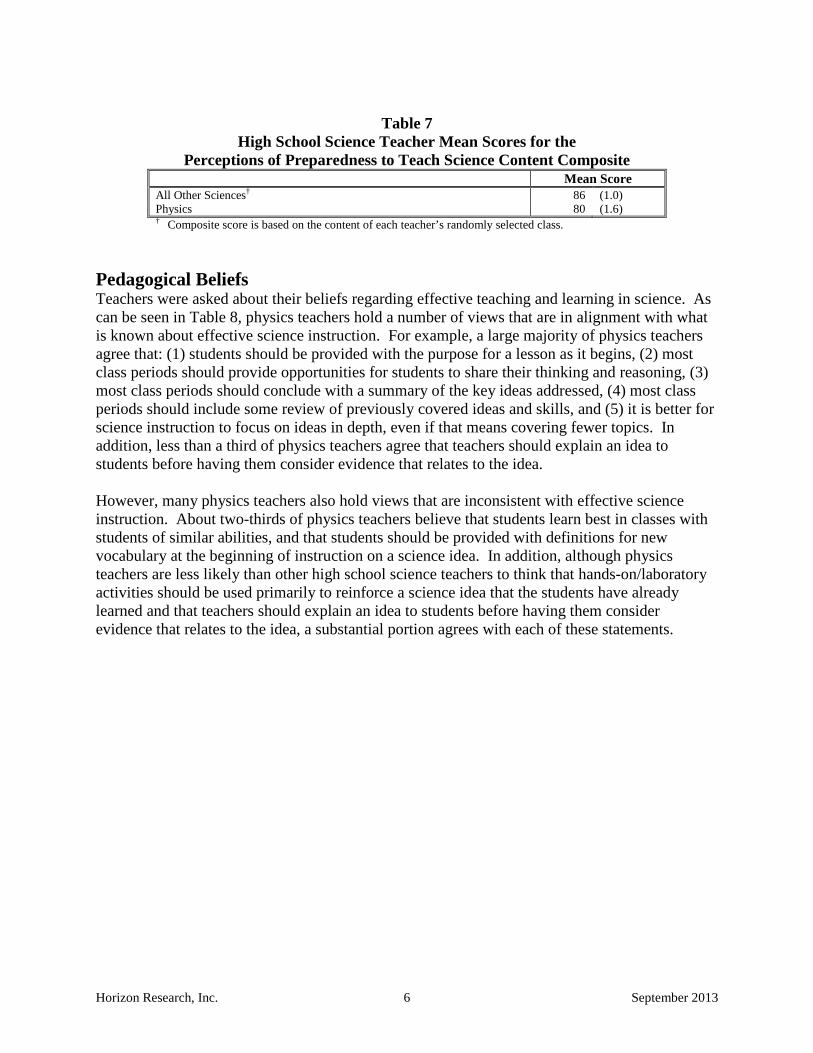
estimate. Data from items asking teachers how well prepared they feel to teach the content of a randomly selected course were combined into a composite variable called Perceptions of Preparedness to Teach Science Content.4 As can be seen in Table 7, physics teachers feel slightly less well prepared to teach physics than teachers of the other sciences feel to teach their specific discipline.
4 The body of this report includes data on selected composite variables. Data for all composite variables are available in the Appendix.
Horizon Research, Inc. 6 September 2013
Table 7
High School Science Teacher Mean Scores for the Perceptions of Preparedness to Teach Science Content Composite
Mean Score All Other Sciences† 86 (1.0) Physics 80 (1.6) † Composite score is based on the content of each teacher’s randomly selected class.
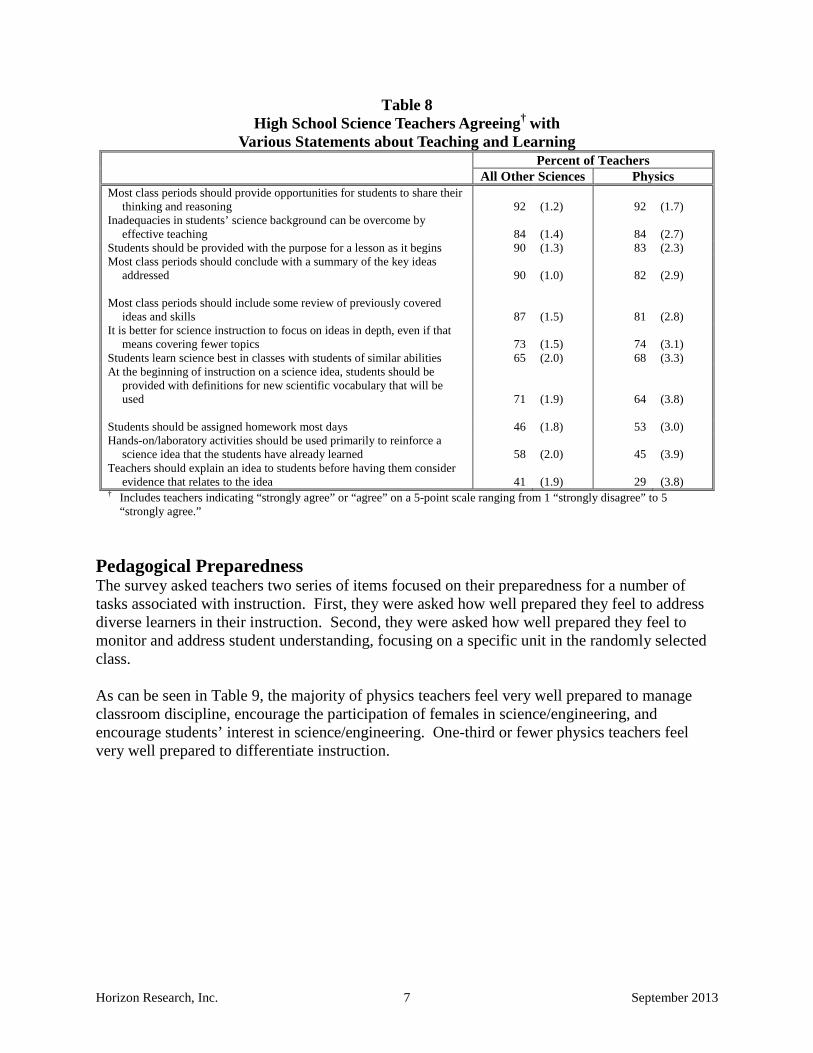
Pedagogical Beliefs Teachers were asked about their beliefs regarding effective teaching and learning in science. As can be seen in Table 8, physics teachers hold a number of views that are in alignment with what is known about effective science instruction. For example, a large majority of physics teachers agree that: (1) students should be provided with the purpose for a lesson as it begins, (2) most class periods should provide opportunities for students to share their thinking and reasoning, (3) most class periods should conclude with a summary of the key ideas addressed, (4) most class periods should include some review of previously covered ideas and skills, and (5) it is better for science instruction to focus on ideas in depth, even if that means covering fewer topics. In addition, less than a third of physics teachers agree that teachers should explain an idea to students before having them consider evidence that relates to the idea. However, many physics teachers also hold views that are inconsistent with effective science instruction. About two-thirds of physics teachers believe that students learn best in classes with students of similar abilities, and that students should be provided with definitions for new vocabulary at the beginning of instruction on a science idea. In addition, although physics teachers are less likely than other high school science teachers to think that hands-on/laboratory activities should be used primarily to reinforce a science idea that the students have already learned and that teachers should explain an idea to students before having them consider evidence that relates to the idea, a substantial portion agrees with each of these statements.
Horizon Research, Inc. 7 September 2013
Table 8 High School Science Teachers Agreeing† with
Various Statements about Teaching and Learning Percent of Teachers All Other Sciences Physics Most class periods should provide opportunities for students to share their
thinking and reasoning 92 (1.2) 92 (1.7) Inadequacies in students’ science background can be overcome by
effective teaching 84 (1.4) 84 (2.7) Students should be provided with the purpose for a lesson as it begins 90 (1.3) 83 (2.3) Most class periods should conclude with a summary of the key ideas
addressed 90 (1.0) 82 (2.9) Most class periods should include some review of previously covered
ideas and skills 87 (1.5) 81 (2.8) It is better for science instruction to focus on ideas in depth, even if that
means covering fewer topics 73 (1.5) 74 (3.1) Students learn science best in classes with students of similar abilities 65 (2.0) 68 (3.3) At the beginning of instruction on a science idea, students should be
provided with definitions for new scientific vocabulary that will be used 71 (1.9) 64 (3.8)
Students should be assigned homework most days 46 (1.8) 53 (3.0) Hands-on/laboratory activities should be used primarily to reinforce a
science idea that the students have already learned 58 (2.0) 45 (3.9) Teachers should explain an idea to students before having them consider
evidence that relates to the idea 41 (1.9) 29 (3.8) † Includes teachers indicating “strongly agree” or “agree” on a 5-point scale ranging from 1 “strongly disagree” to 5
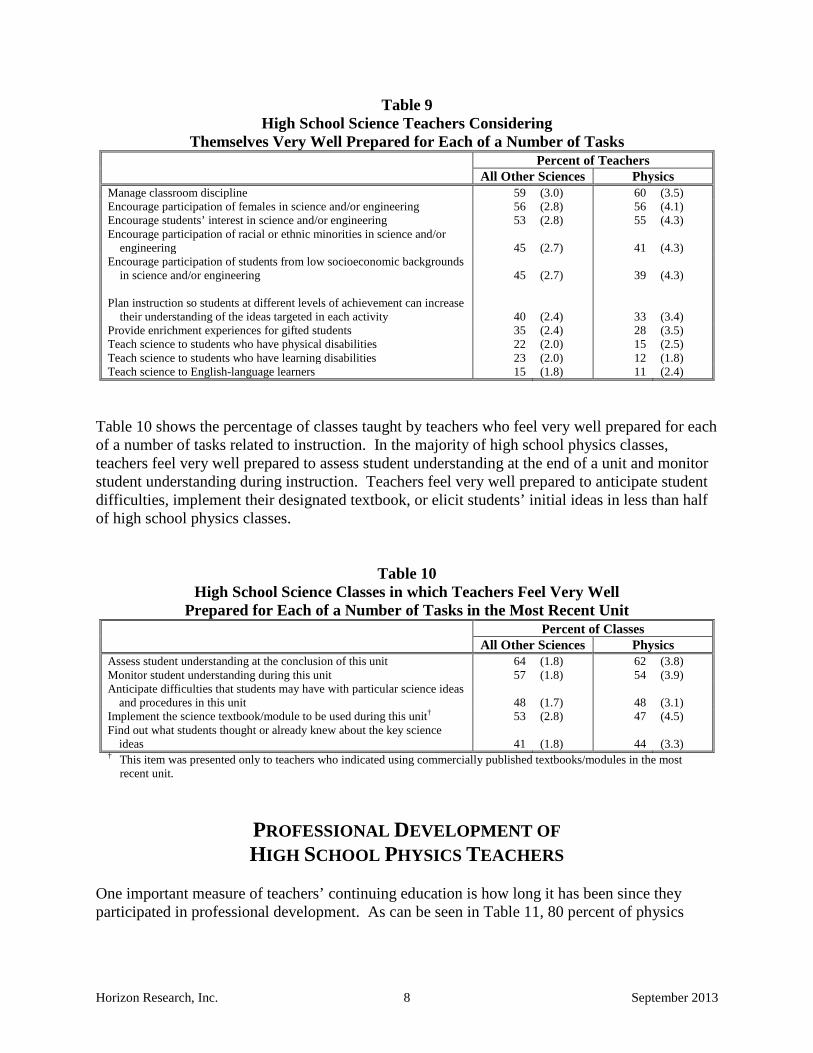
“strongly agree.” Pedagogical Preparedness The survey asked teachers two series of items focused on their preparedness for a number of tasks associated with instruction. First, they were asked how well prepared they feel to address diverse learners in their instruction. Second, they were asked how well prepared they feel to monitor and address student understanding, focusing on a specific unit in the randomly selected class. As can be seen in Table 9, the majority of physics teachers feel very well prepared to manage classroom discipline, encourage the participation of females in science/engineering, and encourage students’ interest in science/engineering. One-third or fewer physics teachers feel very well prepared to differentiate instruction.
Horizon Research, Inc. 8 September 2013
Table 9 High School Science Teachers Considering
Themselves Very Well Prepared for Each of a Number of Tasks Percent of Teachers All Other Sciences Physics Manage classroom discipline 59 (3.0) 60 (3.5) Encourage participation of females in science and/or engineering 56 (2.8) 56 (4.1) Encourage students’ interest in science and/or engineering 53 (2.8) 55 (4.3) Encourage participation of racial or ethnic minorities in science and/or
engineering 45 (2.7) 41 (4.3) Encourage participation of students from low socioeconomic backgrounds
in science and/or engineering 45 (2.7) 39 (4.3) Plan instruction so students at different levels of achievement can increase
their understanding of the ideas targeted in each activity 40 (2.4) 33 (3.4) Provide enrichment experiences for gifted students 35 (2.4) 28 (3.5) Teach science to students who have physical disabilities 22 (2.0) 15 (2.5) Teach science to students who have learning disabilities 23 (2.0) 12 (1.8) Teach science to English-language learners 15 (1.8) 11 (2.4)
Table 10 shows the percentage of classes taught by teachers who feel very well prepared for each of a number of tasks related to instruction. In the majority of high school physics classes, teachers feel very well prepared to assess student understanding at the end of a unit and monitor student understanding during instruction. Teachers feel very well prepared to anticipate student difficulties, implement their designated textbook, or elicit students’ initial ideas in less than half of high school physics classes.
Table 10 High School Science Classes in which Teachers Feel Very Well
Prepared for Each of a Number of Tasks in the Most Recent Unit Percent of Classes All Other Sciences Physics Assess student understanding at the conclusion of this unit 64 (1.8) 62 (3.8) Monitor student understanding during this unit 57 (1.8) 54 (3.9) Anticipate difficulties that students may have with particular science ideas
and procedures in this unit 48 (1.7) 48 (3.1) Implement the science textbook/module to be used during this unit† 53 (2.8) 47 (4.5) Find out what students thought or already knew about the key science
ideas 41 (1.8) 44 (3.3) † This item was presented only to teachers who indicated using commercially published textbooks/modules in the most
recent unit.
PROFESSIONAL DEVELOPMENT OF HIGH SCHOOL PHYSICS TEACHERS
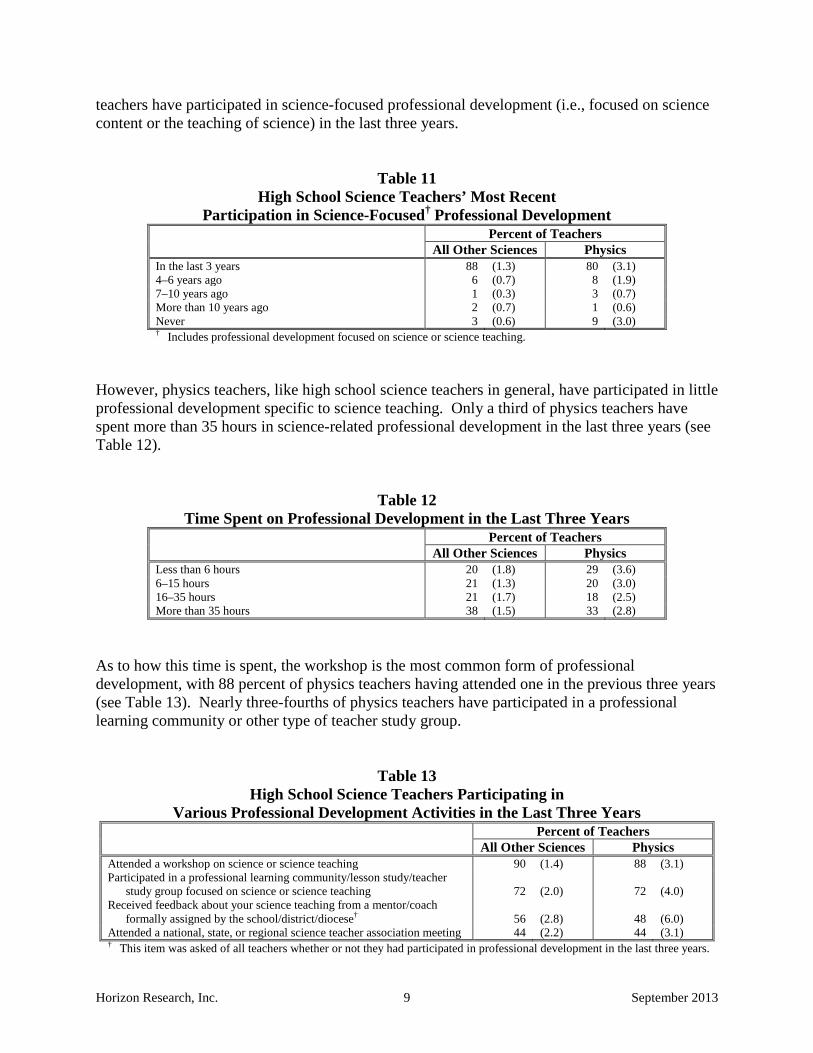
One important measure of teachers’ continuing education is how long it has been since they participated in professional development. As can be seen in Table 11, 80 percent of physics
Horizon Research, Inc. 9 September 2013
teachers have participated in science-focused professional development (i.e., focused on science content or the teaching of science) in the last three years.
Table 11 High School Science Teachers’ Most Recent
Participation in Science-Focused† Professional Development Percent of Teachers All Other Sciences Physics In the last 3 years 88 (1.3) 80 (3.1) 4–6 years ago 6 (0.7) 8 (1.9) 7–10 years ago 1 (0.3) 3 (0.7) More than 10 years ago 2 (0.7) 1 (0.6) Never 3 (0.6) 9 (3.0) † Includes professional development focused on science or science teaching.
However, physics teachers, like high school science teachers in general, have participated in little professional development specific to science teaching. Only a third of physics teachers have spent more than 35 hours in science-related professional development in the last three years (see Table 12).
Table 12 Time Spent on Professional Development in the Last Three Years
Percent of Teachers All Other Sciences Physics Less than 6 hours 20 (1.8) 29 (3.6) 6–15 hours 21 (1.3) 20 (3.0) 16–35 hours 21 (1.7) 18 (2.5) More than 35 hours 38 (1.5) 33 (2.8)
As to how this time is spent, the workshop is the most common form of professional development, with 88 percent of physics teachers having attended one in the previous three years (see Table 13). Nearly three-fourths of physics teachers have participated in a professional learning community or other type of teacher study group.
Table 13 High School Science Teachers Participating in
Various Professional Development Activities in the Last Three Years Percent of Teachers All Other Sciences Physics Attended a workshop on science or science teaching 90 (1.4) 88 (3.1) Participated in a professional learning community/lesson study/teacher
study group focused on science or science teaching 72 (2.0) 72 (4.0) Received feedback about your science teaching from a mentor/coach
formally assigned by the school/district/diocese† 56 (2.8) 48 (6.0) Attended a national, state, or regional science teacher association meeting 44 (2.2) 44 (3.1) † This item was asked of all teachers whether or not they had participated in professional development in the last three years.
Horizon Research, Inc. 10 September 2013
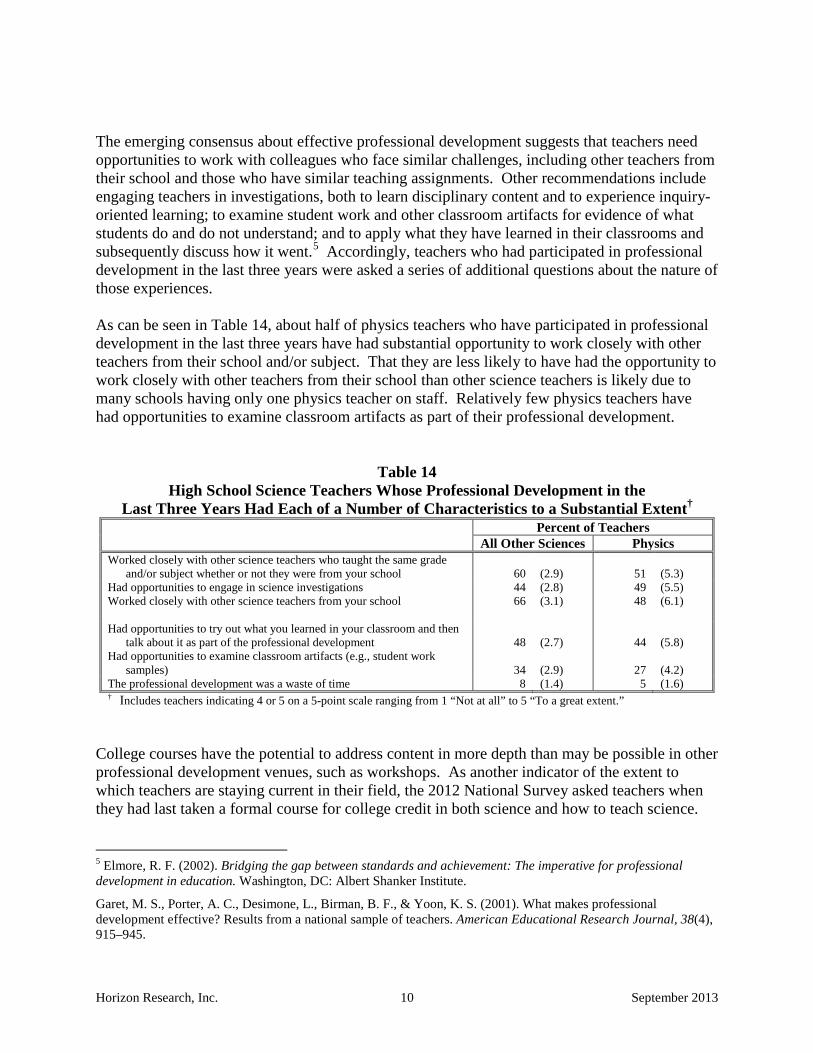
The emerging consensus about effective professional development suggests that teachers need opportunities to work with colleagues who face similar challenges, including other teachers from their school and those who have similar teaching assignments. Other recommendations include engaging teachers in investigations, both to learn disciplinary content and to experience inquiry-oriented learning; to examine student work and other classroom artifacts for evidence of what students do and do not understand; and to apply what they have learned in their classrooms and subsequently discuss how it went.5 Accordingly, teachers who had participated in professional development in the last three years were asked a series of additional questions about the nature of those experiences. As can be seen in Table 14, about half of physics teachers who have participated in professional development in the last three years have had substantial opportunity to work closely with other teachers from their school and/or subject. That they are less likely to have had the opportunity to work closely with other teachers from their school than other science teachers is likely due to many schools having only one physics teacher on staff. Relatively few physics teachers have had opportunities to examine classroom artifacts as part of their professional development.
Table 14 High School Science Teachers Whose Professional Development in the
Last Three Years Had Each of a Number of Characteristics to a Substantial Extent† Percent of Teachers All Other Sciences Physics Worked closely with other science teachers who taught the same grade
and/or subject whether or not they were from your school 60 (2.9) 51 (5.3) Had opportunities to engage in science investigations 44 (2.8) 49 (5.5) Worked closely with other science teachers from your school 66 (3.1) 48 (6.1) Had opportunities to try out what you learned in your classroom and then
talk about it as part of the professional development 48 (2.7) 44 (5.8) Had opportunities to examine classroom artifacts (e.g., student work
samples) 34 (2.9) 27 (4.2) The professional development was a waste of time 8 (1.4) 5 (1.6) † Includes teachers indicating 4 or 5 on a 5-point scale ranging from 1 “Not at all” to 5 “To a great extent.”
College courses have the potential to address content in more depth than may be possible in other professional development venues, such as workshops. As another indicator of the extent to which teachers are staying current in their field, the 2012 National Survey asked teachers when they had last taken a formal course for college credit in both science and how to teach science.
5 Elmore, R. F. (2002). Bridging the gap between standards and achievement: The imperative for professional development in education. Washington, DC: Albert Shanker Institute.
Garet, M. S., Porter, A. C., Desimone, L., Birman, B. F., & Yoon, K. S. (2001). What makes professional development effective? Results from a national sample of teachers. American Educational Research Journal, 38(4), 915–945.
Horizon Research, Inc. 11 September 2013
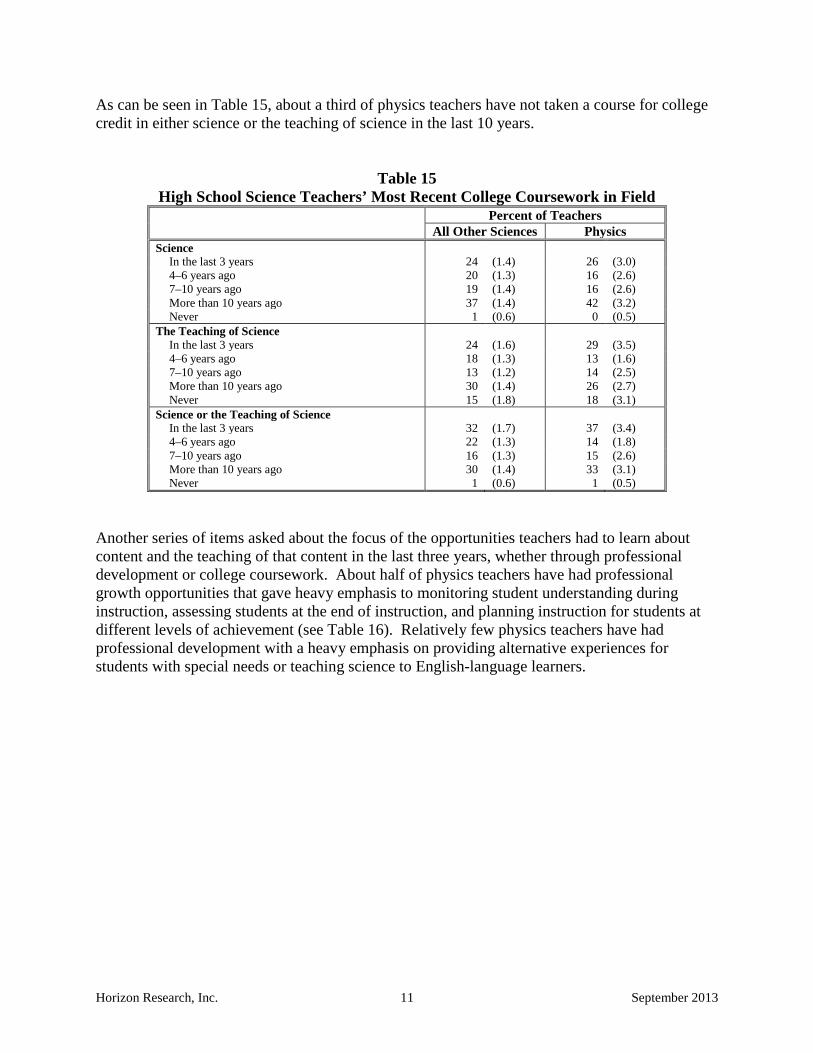
As can be seen in Table 15, about a third of physics teachers have not taken a course for college credit in either science or the teaching of science in the last 10 years.
Table 15 High School Science Teachers’ Most Recent College Coursework in Field
Percent of Teachers All Other Sciences Physics Science
In the last 3 years 24 (1.4) 26 (3.0) 4–6 years ago 20 (1.3) 16 (2.6) 7–10 years ago 19 (1.4) 16 (2.6) More than 10 years ago 37 (1.4) 42 (3.2) Never 1 (0.6) 0 (0.5)
The Teaching of Science In the last 3 years 24 (1.6) 29 (3.5) 4–6 years ago 18 (1.3) 13 (1.6) 7–10 years ago 13 (1.2) 14 (2.5) More than 10 years ago 30 (1.4) 26 (2.7) Never 15 (1.8) 18 (3.1)
Science or the Teaching of Science In the last 3 years 32 (1.7) 37 (3.4) 4–6 years ago 22 (1.3) 14 (1.8) 7–10 years ago 16 (1.3) 15 (2.6) More than 10 years ago 30 (1.4) 33 (3.1) Never 1 (0.6) 1 (0.5)
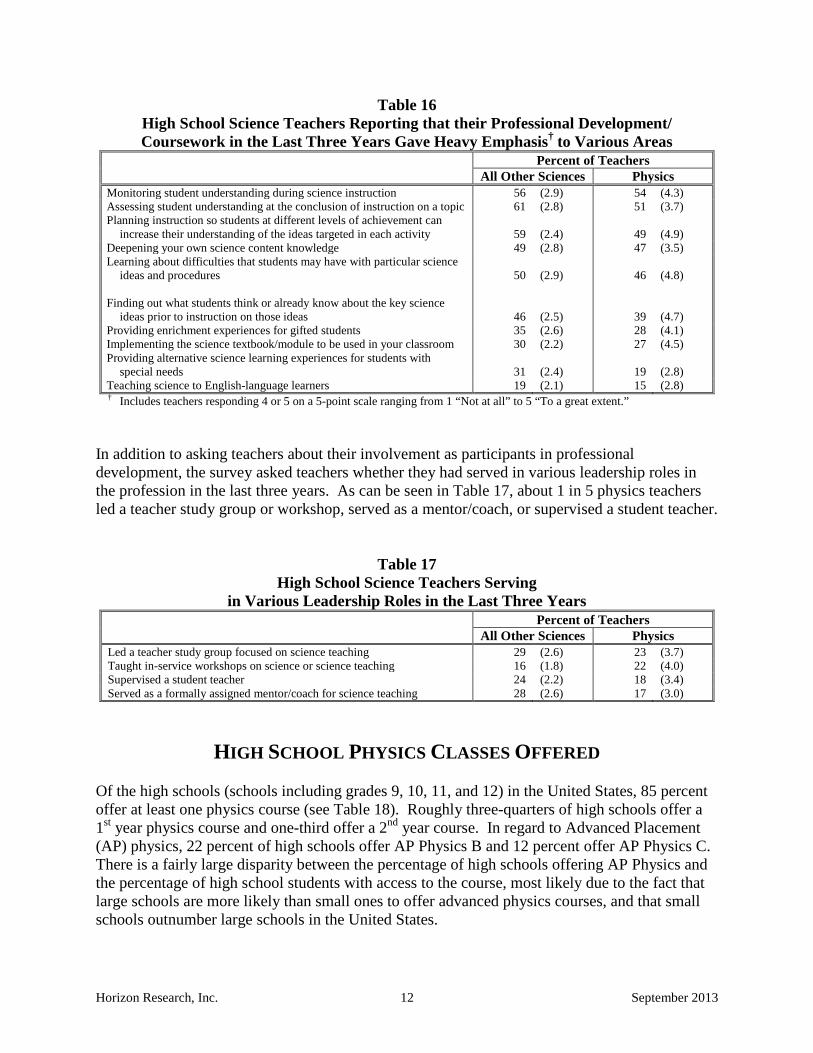
Another series of items asked about the focus of the opportunities teachers had to learn about content and the teaching of that content in the last three years, whether through professional development or college coursework. About half of physics teachers have had professional growth opportunities that gave heavy emphasis to monitoring student understanding during instruction, assessing students at the end of instruction, and planning instruction for students at different levels of achievement (see Table 16). Relatively few physics teachers have had professional development with a heavy emphasis on providing alternative experiences for students with special needs or teaching science to English-language learners.
Horizon Research, Inc. 12 September 2013
Table 16 High School Science Teachers Reporting that their Professional Development/ Coursework in the Last Three Years Gave Heavy Emphasis† to Various Areas
Percent of Teachers All Other Sciences Physics Monitoring student understanding during science instruction 56 (2.9) 54 (4.3) Assessing student understanding at the conclusion of instruction on a topic 61 (2.8) 51 (3.7) Planning instruction so students at different levels of achievement can
increase their understanding of the ideas targeted in each activity 59 (2.4) 49 (4.9) Deepening your own science content knowledge 49 (2.8) 47 (3.5) Learning about difficulties that students may have with particular science
ideas and procedures 50 (2.9) 46 (4.8) Finding out what students think or already know about the key science
ideas prior to instruction on those ideas 46 (2.5) 39 (4.7) Providing enrichment experiences for gifted students 35 (2.6) 28 (4.1) Implementing the science textbook/module to be used in your classroom 30 (2.2) 27 (4.5) Providing alternative science learning experiences for students with
special needs 31 (2.4) 19 (2.8) Teaching science to English-language learners 19 (2.1) 15 (2.8) † Includes teachers responding 4 or 5 on a 5-point scale ranging from 1 “Not at all” to 5 “To a great extent.”
In addition to asking teachers about their involvement as participants in professional development, the survey asked teachers whether they had served in various leadership roles in the profession in the last three years. As can be seen in Table 17, about 1 in 5 physics teachers led a teacher study group or workshop, served as a mentor/coach, or supervised a student teacher.
Table 17 High School Science Teachers Serving
in Various Leadership Roles in the Last Three Years Percent of Teachers All Other Sciences Physics Led a teacher study group focused on science teaching 29 (2.6) 23 (3.7) Taught in-service workshops on science or science teaching 16 (1.8) 22 (4.0) Supervised a student teacher 24 (2.2) 18 (3.4) Served as a formally assigned mentor/coach for science teaching 28 (2.6) 17 (3.0)
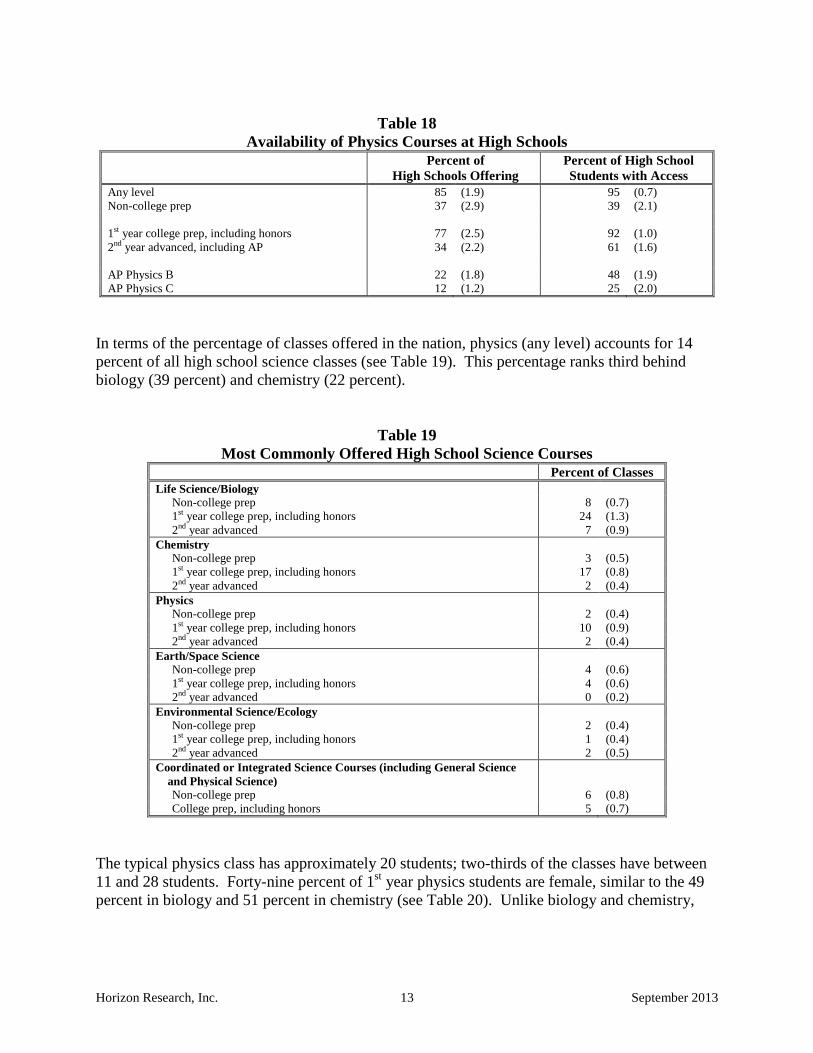
HIGH SCHOOL PHYSICS CLASSES OFFERED Of the high schools (schools including grades 9, 10, 11, and 12) in the United States, 85 percent offer at least one physics course (see Table 18). Roughly three-quarters of high schools offer a 1st year physics course and one-third offer a 2nd year course. In regard to Advanced Placement (AP) physics, 22 percent of high schools offer AP Physics B and 12 percent offer AP Physics C. There is a fairly large disparity between the percentage of high schools offering AP Physics and the percentage of high school students with access to the course, most likely due to the fact that large schools are more likely than small ones to offer advanced physics courses, and that small schools outnumber large schools in the United States.
Horizon Research, Inc. 13 September 2013
Table 18
Availability of Physics Courses at High Schools Percent of
High Schools Offering Percent of High School Students with Access
Any level 85 (1.9) 95 (0.7) Non-college prep 37 (2.9) 39 (2.1) 1st year college prep, including honors 77 (2.5) 92 (1.0) 2nd year advanced, including AP 34 (2.2) 61 (1.6) AP Physics B 22 (1.8) 48 (1.9) AP Physics C 12 (1.2) 25 (2.0)
In terms of the percentage of classes offered in the nation, physics (any level) accounts for 14 percent of all high school science classes (see Table 19). This percentage ranks third behind biology (39 percent) and chemistry (22 percent).
Table 19 Most Commonly Offered High School Science Courses
Percent of Classes Life Science/Biology
Non-college prep 8 (0.7) 1st year college prep, including honors 24 (1.3) 2nd year advanced 7 (0.9)
Chemistry Non-college prep 3 (0.5) 1st year college prep, including honors 17 (0.8) 2nd year advanced 2 (0.4)
Physics Non-college prep 2 (0.4) 1st year college prep, including honors 10 (0.9) 2nd year advanced 2 (0.4)
Earth/Space Science Non-college prep 4 (0.6) 1st year college prep, including honors 4 (0.6) 2nd year advanced 0 (0.2)
Environmental Science/Ecology Non-college prep 2 (0.4) 1st year college prep, including honors 1 (0.4) 2nd year advanced 2 (0.5)
Coordinated or Integrated Science Courses (including General Science and Physical Science) Non-college prep 6 (0.8) College prep, including honors 5 (0.7)
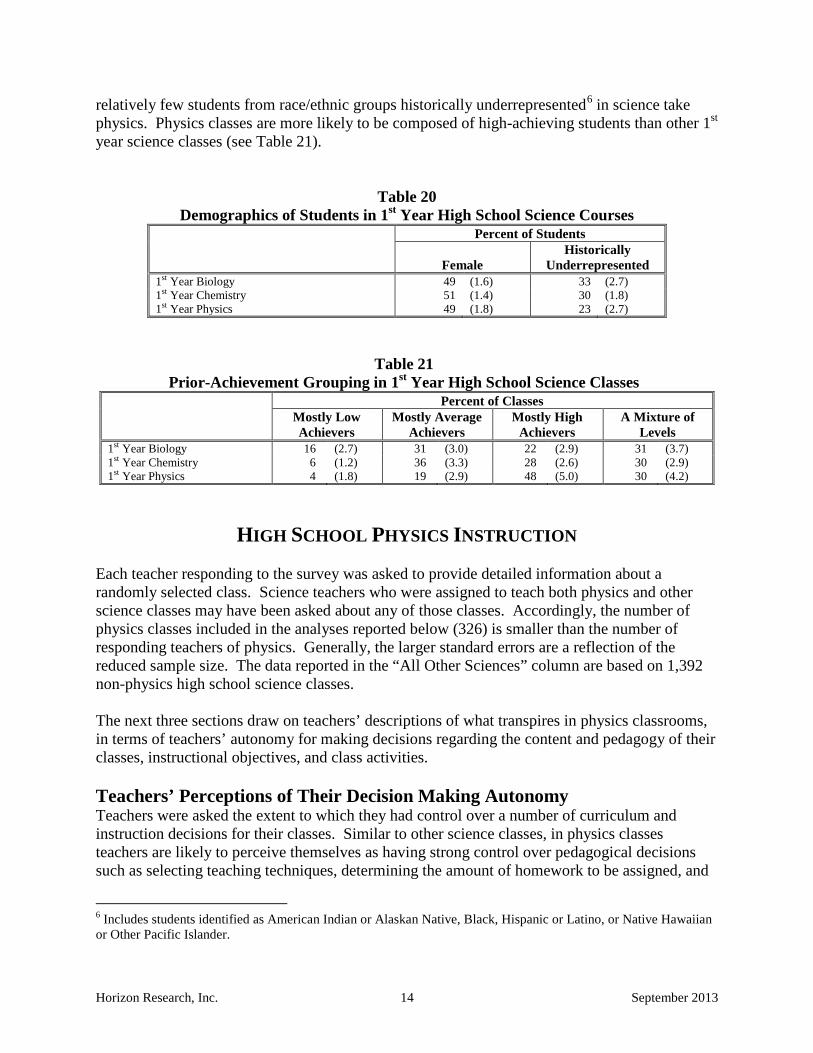
The typical physics class has approximately 20 students; two-thirds of the classes have between 11 and 28 students. Forty-nine percent of 1st year physics students are female, similar to the 49 percent in biology and 51 percent in chemistry (see Table 20). Unlike biology and chemistry,
Horizon Research, Inc. 14 September 2013
relatively few students from race/ethnic groups historically underrepresented6 in science take physics. Physics classes are more likely to be composed of high-achieving students than other 1st year science classes (see Table 21).
Table 20 Demographics of Students in 1st Year High School Science Courses
Percent of Students
Female Historically
Underrepresented 1st Year Biology 49 (1.6) 33 (2.7) 1st Year Chemistry 51 (1.4) 30 (1.8) 1st Year Physics 49 (1.8) 23 (2.7)
Table 21 Prior-Achievement Grouping in 1st Year High School Science Classes
Percent of Classes Mostly Low
Achievers Mostly Average
Achievers Mostly High
Achievers A Mixture of
Levels 1st Year Biology 16 (2.7) 31 (3.0) 22 (2.9) 31 (3.7) 1st Year Chemistry 6 (1.2) 36 (3.3) 28 (2.6) 30 (2.9) 1st Year Physics 4 (1.8) 19 (2.9) 48 (5.0) 30 (4.2)
HIGH SCHOOL PHYSICS INSTRUCTION Each teacher responding to the survey was asked to provide detailed information about a randomly selected class. Science teachers who were assigned to teach both physics and other science classes may have been asked about any of those classes. Accordingly, the number of physics classes included in the analyses reported below (326) is smaller than the number of responding teachers of physics. Generally, the larger standard errors are a reflection of the reduced sample size. The data reported in the “All Other Sciences” column are based on 1,392 non-physics high school science classes. The next three sections draw on teachers’ descriptions of what transpires in physics classrooms, in terms of teachers’ autonomy for making decisions regarding the content and pedagogy of their classes, instructional objectives, and class activities. Teachers’ Perceptions of Their Decision Making Autonomy Teachers were asked the extent to which they had control over a number of curriculum and instruction decisions for their classes. Similar to other science classes, in physics classes teachers are likely to perceive themselves as having strong control over pedagogical decisions such as selecting teaching techniques, determining the amount of homework to be assigned, and
6 Includes students identified as American Indian or Alaskan Native, Black, Hispanic or Latino, or Native Hawaiian or Other Pacific Islander.
Horizon Research, Inc. 15 September 2013
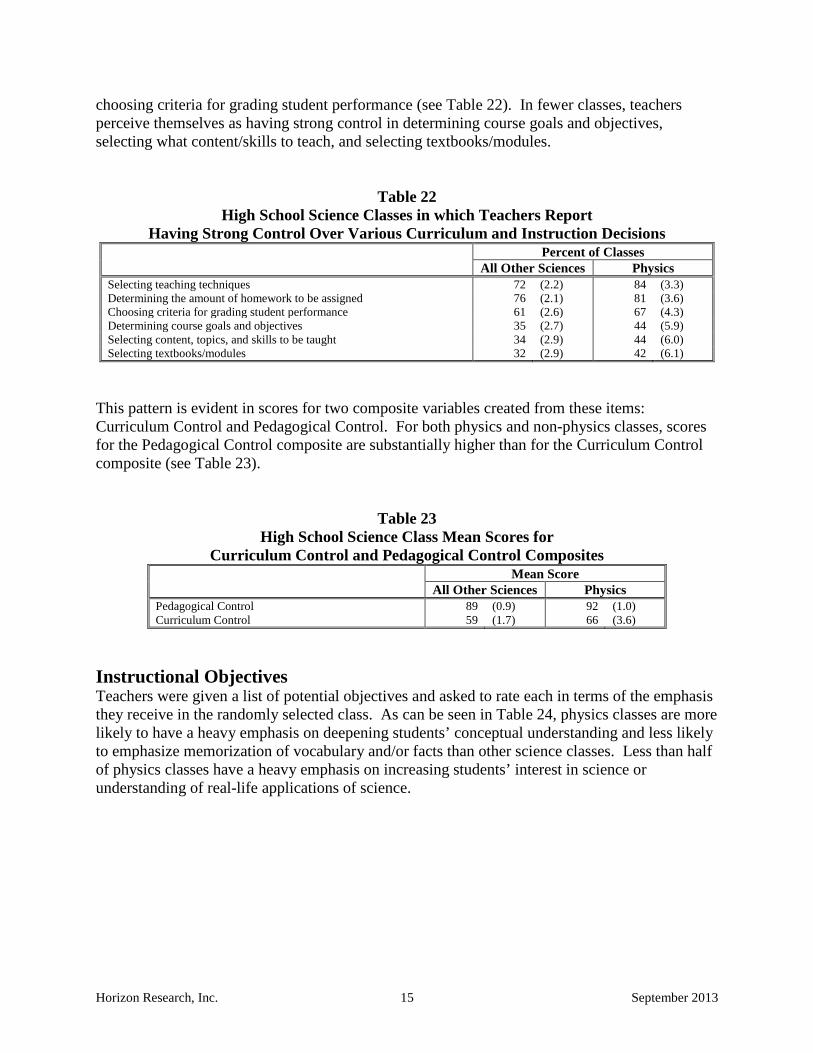
choosing criteria for grading student performance (see Table 22). In fewer classes, teachers perceive themselves as having strong control in determining course goals and objectives, selecting what content/skills to teach, and selecting textbooks/modules.
Table 22 High School Science Classes in which Teachers Report
Having Strong Control Over Various Curriculum and Instruction Decisions Percent of Classes All Other Sciences Physics Selecting teaching techniques 72 (2.2) 84 (3.3) Determining the amount of homework to be assigned 76 (2.1) 81 (3.6) Choosing criteria for grading student performance 61 (2.6) 67 (4.3) Determining course goals and objectives 35 (2.7) 44 (5.9) Selecting content, topics, and skills to be taught 34 (2.9) 44 (6.0) Selecting textbooks/modules 32 (2.9) 42 (6.1)
This pattern is evident in scores for two composite variables created from these items: Curriculum Control and Pedagogical Control. For both physics and non-physics classes, scores for the Pedagogical Control composite are substantially higher than for the Curriculum Control composite (see Table 23).
Table 23 High School Science Class Mean Scores for
Curriculum Control and Pedagogical Control Composites Mean Score All Other Sciences Physics Pedagogical Control 89 (0.9) 92 (1.0) Curriculum Control 59 (1.7) 66 (3.6)
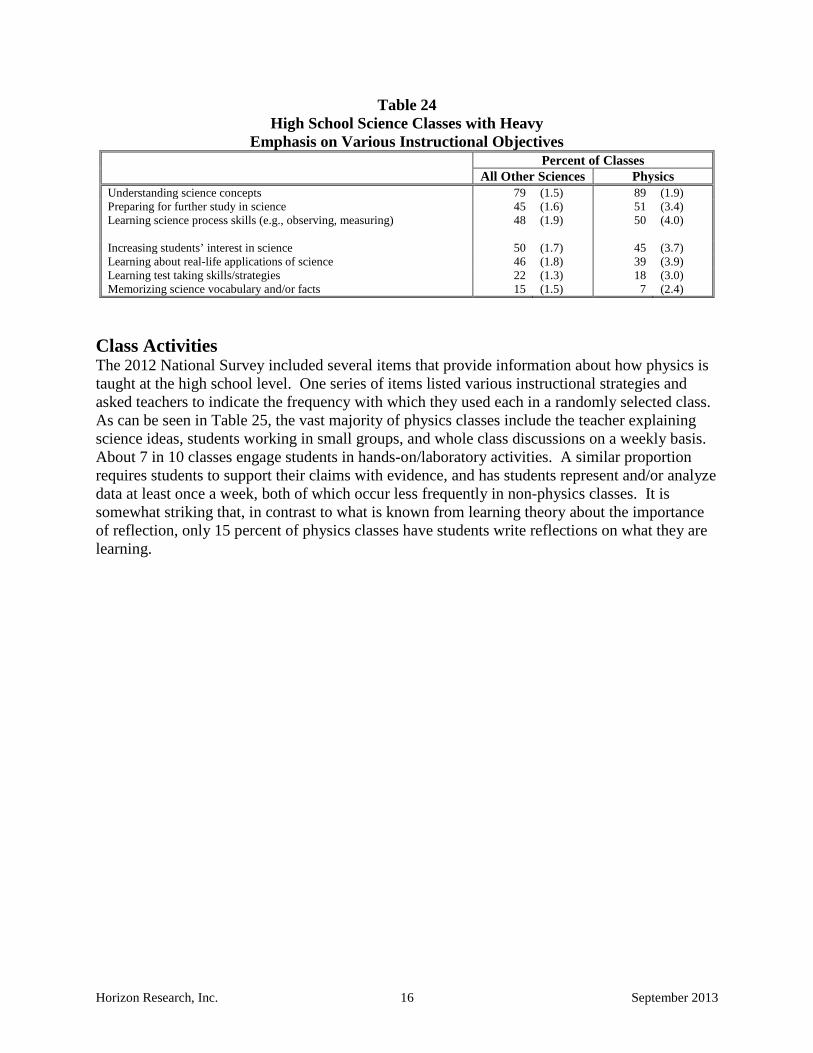
Instructional Objectives Teachers were given a list of potential objectives and asked to rate each in terms of the emphasis they receive in the randomly selected class. As can be seen in Table 24, physics classes are more likely to have a heavy emphasis on deepening students’ conceptual understanding and less likely to emphasize memorization of vocabulary and/or facts than other science classes. Less than half of physics classes have a heavy emphasis on increasing students’ interest in science or understanding of real-life applications of science.
Horizon Research, Inc. 16 September 2013
Table 24 High School Science Classes with Heavy
Emphasis on Various Instructional Objectives Percent of Classes All Other Sciences Physics Understanding science concepts 79 (1.5) 89 (1.9) Preparing for further study in science 45 (1.6) 51 (3.4) Learning science process skills (e.g., observing, measuring) 48 (1.9) 50 (4.0) Increasing students’ interest in science 50 (1.7) 45 (3.7) Learning about real-life applications of science 46 (1.8) 39 (3.9) Learning test taking skills/strategies 22 (1.3) 18 (3.0) Memorizing science vocabulary and/or facts 15 (1.5) 7 (2.4)
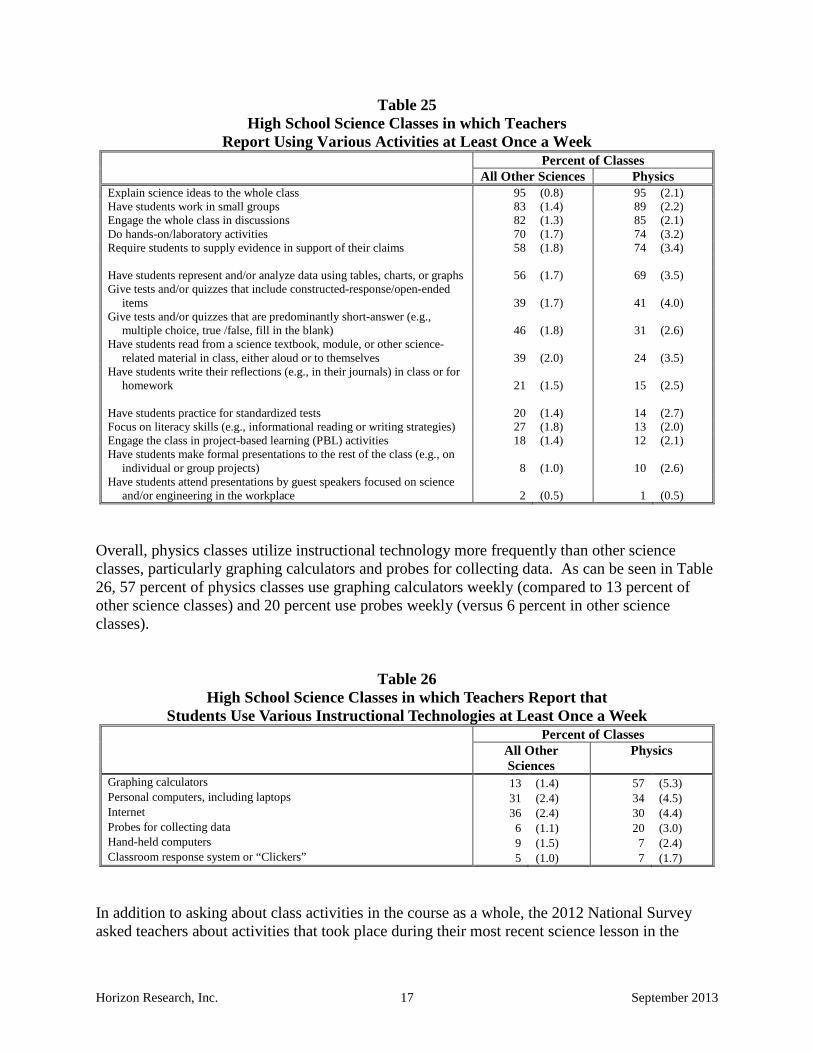
Class Activities The 2012 National Survey included several items that provide information about how physics is taught at the high school level. One series of items listed various instructional strategies and asked teachers to indicate the frequency with which they used each in a randomly selected class. As can be seen in Table 25, the vast majority of physics classes include the teacher explaining science ideas, students working in small groups, and whole class discussions on a weekly basis. About 7 in 10 classes engage students in hands-on/laboratory activities. A similar proportion requires students to support their claims with evidence, and has students represent and/or analyze data at least once a week, both of which occur less frequently in non-physics classes. It is somewhat striking that, in contrast to what is known from learning theory about the importance of reflection, only 15 percent of physics classes have students write reflections on what they are learning.
Horizon Research, Inc. 17 September 2013
Table 25 High School Science Classes in which Teachers
Report Using Various Activities at Least Once a Week Percent of Classes All Other Sciences Physics Explain science ideas to the whole class 95 (0.8) 95 (2.1) Have students work in small groups 83 (1.4) 89 (2.2) Engage the whole class in discussions 82 (1.3) 85 (2.1) Do hands-on/laboratory activities 70 (1.7) 74 (3.2) Require students to supply evidence in support of their claims 58 (1.8) 74 (3.4) Have students represent and/or analyze data using tables, charts, or graphs 56 (1.7) 69 (3.5) Give tests and/or quizzes that include constructed-response/open-ended
items 39 (1.7) 41 (4.0) Give tests and/or quizzes that are predominantly short-answer (e.g.,
multiple choice, true /false, fill in the blank) 46 (1.8) 31 (2.6) Have students read from a science textbook, module, or other science-
related material in class, either aloud or to themselves 39 (2.0) 24 (3.5) Have students write their reflections (e.g., in their journals) in class or for
homework 21 (1.5) 15 (2.5) Have students practice for standardized tests 20 (1.4) 14 (2.7) Focus on literacy skills (e.g., informational reading or writing strategies) 27 (1.8) 13 (2.0) Engage the class in project-based learning (PBL) activities 18 (1.4) 12 (2.1) Have students make formal presentations to the rest of the class (e.g., on
individual or group projects) 8 (1.0) 10 (2.6) Have students attend presentations by guest speakers focused on science
and/or engineering in the workplace 2 (0.5) 1 (0.5) Overall, physics classes utilize instructional technology more frequently than other science classes, particularly graphing calculators and probes for collecting data. As can be seen in Table 26, 57 percent of physics classes use graphing calculators weekly (compared to 13 percent of other science classes) and 20 percent use probes weekly (versus 6 percent in other science classes).
Table 26 High School Science Classes in which Teachers Report that
Students Use Various Instructional Technologies at Least Once a Week Percent of Classes All Other
Sciences Physics
Graphing calculators 13 (1.4) 57 (5.3) Personal computers, including laptops 31 (2.4) 34 (4.5) Internet 36 (2.4) 30 (4.4) Probes for collecting data 6 (1.1) 20 (3.0) Hand-held computers 9 (1.5) 7 (2.4) Classroom response system or “Clickers” 5 (1.0) 7 (1.7)
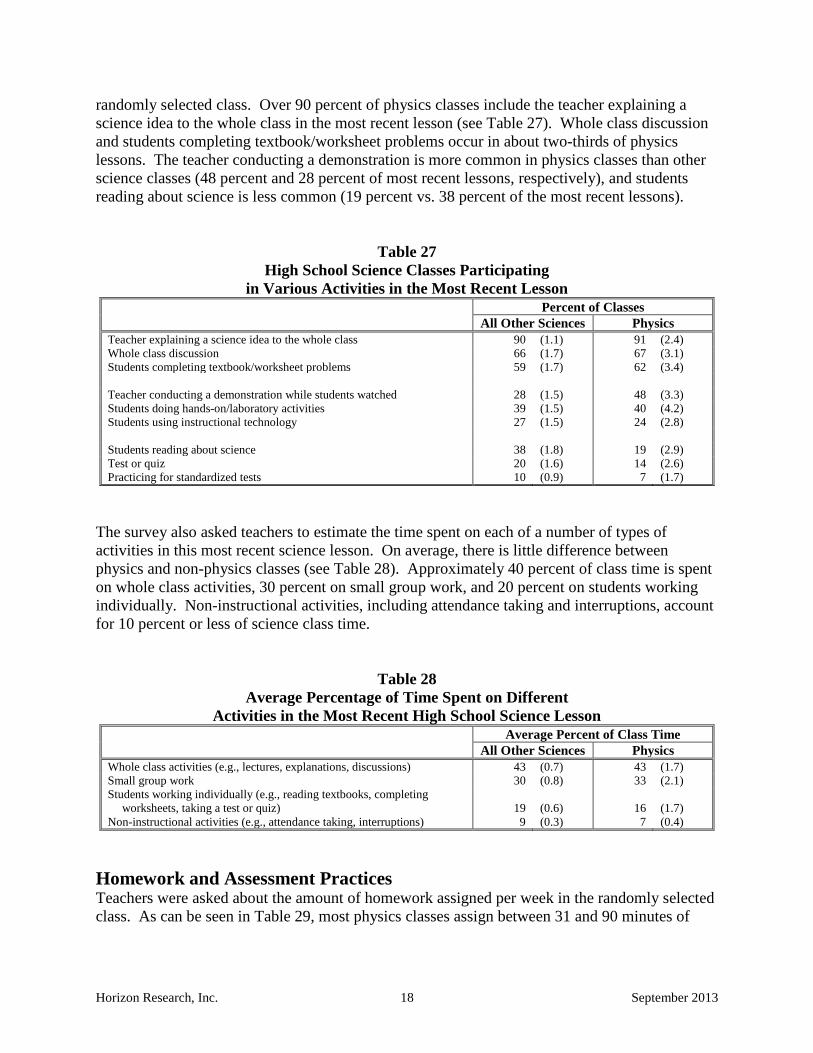
In addition to asking about class activities in the course as a whole, the 2012 National Survey asked teachers about activities that took place during their most recent science lesson in the
Horizon Research, Inc. 18 September 2013
randomly selected class. Over 90 percent of physics classes include the teacher explaining a science idea to the whole class in the most recent lesson (see Table 27). Whole class discussion and students completing textbook/worksheet problems occur in about two-thirds of physics lessons. The teacher conducting a demonstration is more common in physics classes than other science classes (48 percent and 28 percent of most recent lessons, respectively), and students reading about science is less common (19 percent vs. 38 percent of the most recent lessons).
Table 27 High School Science Classes Participating
in Various Activities in the Most Recent Lesson Percent of Classes All Other Sciences Physics Teacher explaining a science idea to the whole class 90 (1.1) 91 (2.4) Whole class discussion 66 (1.7) 67 (3.1) Students completing textbook/worksheet problems 59 (1.7) 62 (3.4) Teacher conducting a demonstration while students watched 28 (1.5) 48 (3.3) Students doing hands-on/laboratory activities 39 (1.5) 40 (4.2) Students using instructional technology 27 (1.5) 24 (2.8) Students reading about science 38 (1.8) 19 (2.9) Test or quiz 20 (1.6) 14 (2.6) Practicing for standardized tests 10 (0.9) 7 (1.7)
The survey also asked teachers to estimate the time spent on each of a number of types of activities in this most recent science lesson. On average, there is little difference between physics and non-physics classes (see Table 28). Approximately 40 percent of class time is spent on whole class activities, 30 percent on small group work, and 20 percent on students working individually. Non-instructional activities, including attendance taking and interruptions, account for 10 percent or less of science class time.
Table 28 Average Percentage of Time Spent on Different
Activities in the Most Recent High School Science Lesson Average Percent of Class Time All Other Sciences Physics Whole class activities (e.g., lectures, explanations, discussions) 43 (0.7) 43 (1.7) Small group work 30 (0.8) 33 (2.1) Students working individually (e.g., reading textbooks, completing
worksheets, taking a test or quiz) 19 (0.6) 16 (1.7) Non-instructional activities (e.g., attendance taking, interruptions) 9 (0.3) 7 (0.4)
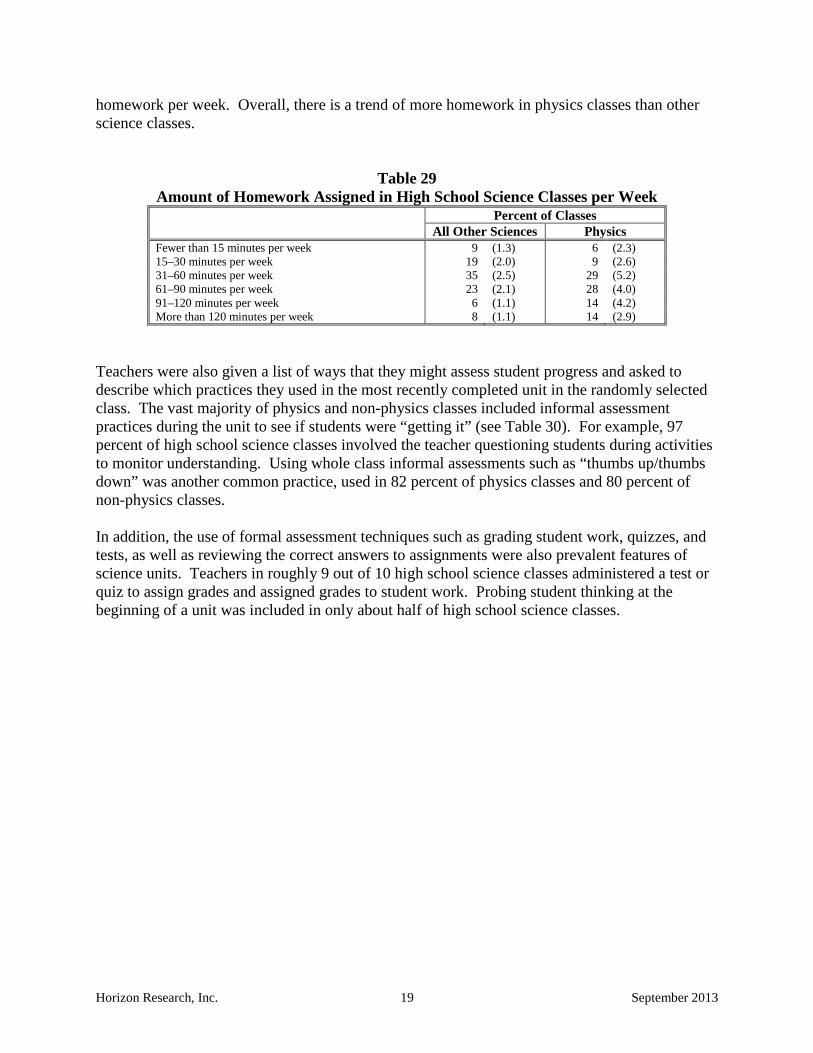
Homework and Assessment Practices Teachers were asked about the amount of homework assigned per week in the randomly selected class. As can be seen in Table 29, most physics classes assign between 31 and 90 minutes of
Horizon Research, Inc. 19 September 2013
homework per week. Overall, there is a trend of more homework in physics classes than other science classes.
Table 29 Amount of Homework Assigned in High School Science Classes per Week Percent of Classes All Other Sciences Physics Fewer than 15 minutes per week 9 (1.3) 6 (2.3) 15–30 minutes per week 19 (2.0) 9 (2.6) 31–60 minutes per week 35 (2.5) 29 (5.2) 61–90 minutes per week 23 (2.1) 28 (4.0) 91–120 minutes per week 6 (1.1) 14 (4.2) More than 120 minutes per week 8 (1.1) 14 (2.9)
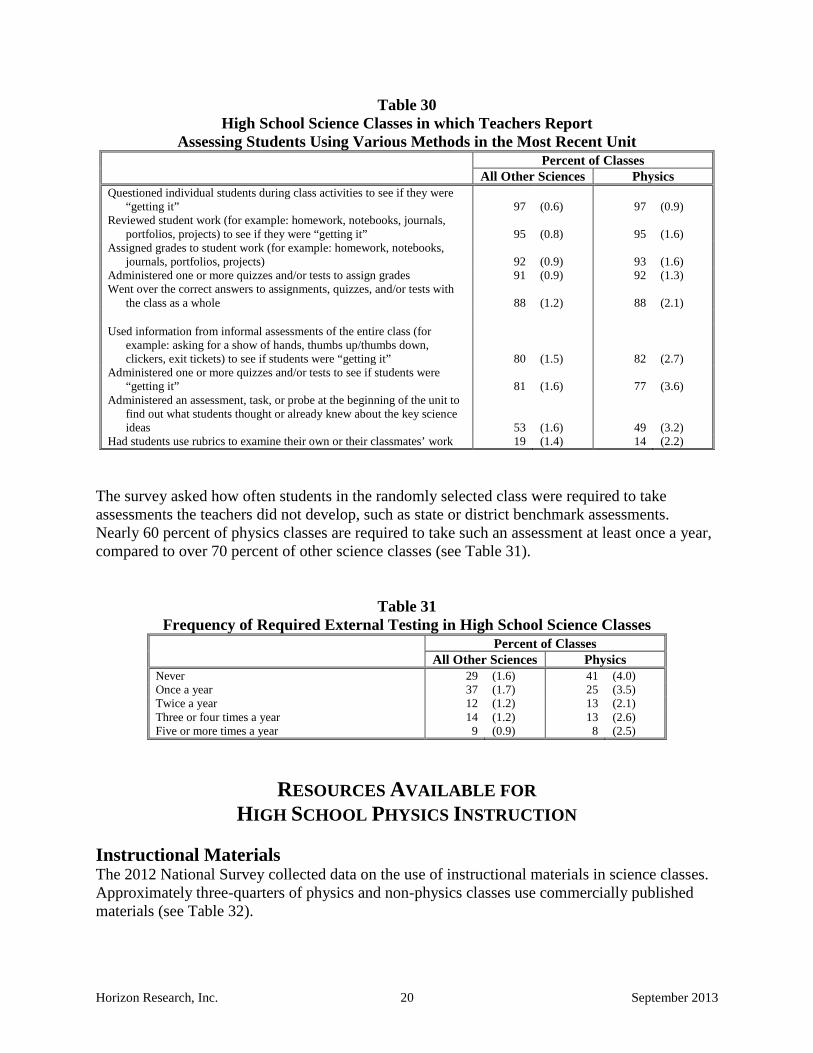
Teachers were also given a list of ways that they might assess student progress and asked to describe which practices they used in the most recently completed unit in the randomly selected class. The vast majority of physics and non-physics classes included informal assessment practices during the unit to see if students were “getting it” (see Table 30). For example, 97 percent of high school science classes involved the teacher questioning students during activities to monitor understanding. Using whole class informal assessments such as “thumbs up/thumbs down” was another common practice, used in 82 percent of physics classes and 80 percent of non-physics classes. In addition, the use of formal assessment techniques such as grading student work, quizzes, and tests, as well as reviewing the correct answers to assignments were also prevalent features of science units. Teachers in roughly 9 out of 10 high school science classes administered a test or quiz to assign grades and assigned grades to student work. Probing student thinking at the beginning of a unit was included in only about half of high school science classes.
Horizon Research, Inc. 20 September 2013
Table 30 High School Science Classes in which Teachers Report
Assessing Students Using Various Methods in the Most Recent Unit Percent of Classes All Other Sciences Physics Questioned individual students during class activities to see if they were
“getting it” 97 (0.6) 97 (0.9) Reviewed student work (for example: homework, notebooks, journals,
portfolios, projects) to see if they were “getting it” 95 (0.8) 95 (1.6) Assigned grades to student work (for example: homework, notebooks,
journals, portfolios, projects) 92 (0.9) 93 (1.6) Administered one or more quizzes and/or tests to assign grades 91 (0.9) 92 (1.3) Went over the correct answers to assignments, quizzes, and/or tests with
the class as a whole 88 (1.2) 88 (2.1) Used information from informal assessments of the entire class (for
example: asking for a show of hands, thumbs up/thumbs down, clickers, exit tickets) to see if students were “getting it” 80 (1.5) 82 (2.7)
Administered one or more quizzes and/or tests to see if students were “getting it” 81 (1.6) 77 (3.6)
Administered an assessment, task, or probe at the beginning of the unit to find out what students thought or already knew about the key science ideas 53 (1.6) 49 (3.2)
Had students use rubrics to examine their own or their classmates’ work 19 (1.4) 14 (2.2) The survey asked how often students in the randomly selected class were required to take assessments the teachers did not develop, such as state or district benchmark assessments. Nearly 60 percent of physics classes are required to take such an assessment at least once a year, compared to over 70 percent of other science classes (see Table 31).
Table 31 Frequency of Required External Testing in High School Science Classes
Percent of Classes All Other Sciences Physics Never 29 (1.6) 41 (4.0) Once a year 37 (1.7) 25 (3.5) Twice a year 12 (1.2) 13 (2.1) Three or four times a year 14 (1.2) 13 (2.6) Five or more times a year 9 (0.9) 8 (2.5)
RESOURCES AVAILABLE FOR HIGH SCHOOL PHYSICS INSTRUCTION
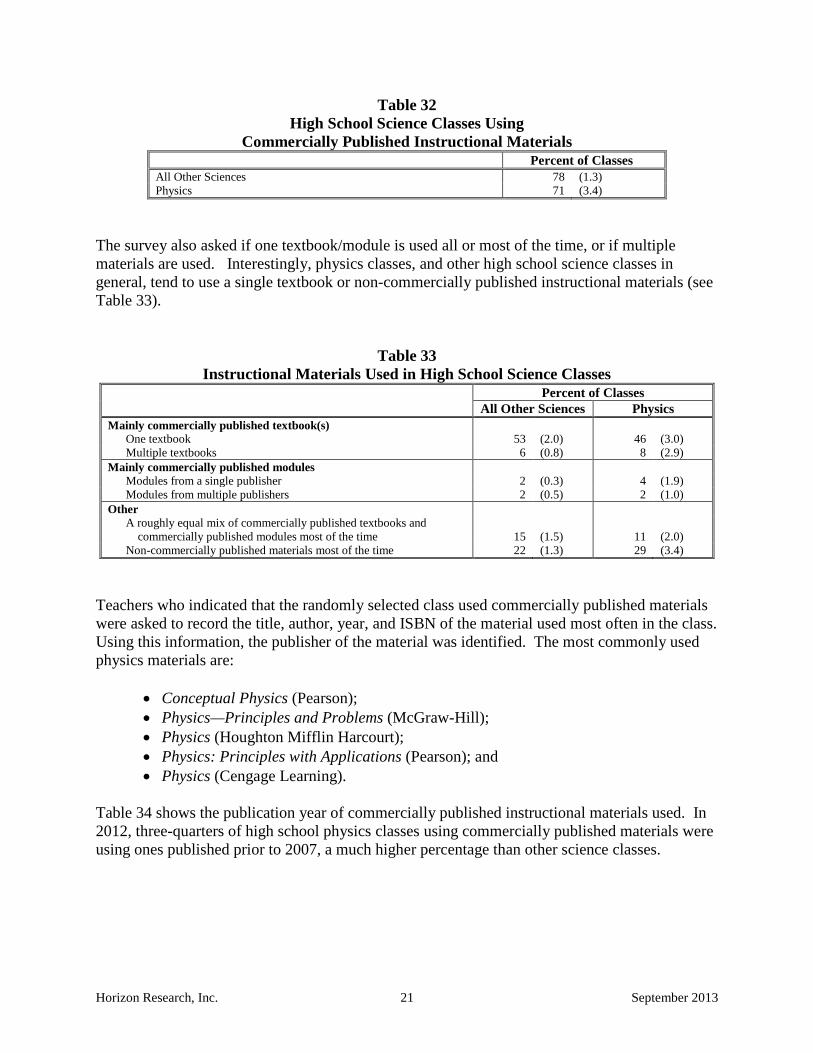
Instructional Materials The 2012 National Survey collected data on the use of instructional materials in science classes. Approximately three-quarters of physics and non-physics classes use commercially published materials (see Table 32).
Horizon Research, Inc. 21 September 2013
Table 32 High School Science Classes Using
Commercially Published Instructional Materials Percent of Classes All Other Sciences 78 (1.3) Physics 71 (3.4)
The survey also asked if one textbook/module is used all or most of the time, or if multiple materials are used. Interestingly, physics classes, and other high school science classes in general, tend to use a single textbook or non-commercially published instructional materials (see Table 33).
Table 33 Instructional Materials Used in High School Science Classes
Percent of Classes All Other Sciences Physics Mainly commercially published textbook(s)
One textbook 53 (2.0) 46 (3.0) Multiple textbooks 6 (0.8) 8 (2.9)
Mainly commercially published modules Modules from a single publisher 2 (0.3) 4 (1.9) Modules from multiple publishers 2 (0.5) 2 (1.0)
Other A roughly equal mix of commercially published textbooks and
commercially published modules most of the time 15 (1.5) 11 (2.0) Non-commercially published materials most of the time 22 (1.3) 29 (3.4)
Teachers who indicated that the randomly selected class used commercially published materials were asked to record the title, author, year, and ISBN of the material used most often in the class. Using this information, the publisher of the material was identified. The most commonly used physics materials are:
• Conceptual Physics (Pearson); • Physics—Principles and Problems (McGraw-Hill); • Physics (Houghton Mifflin Harcourt); • Physics: Principles with Applications (Pearson); and • Physics (Cengage Learning).
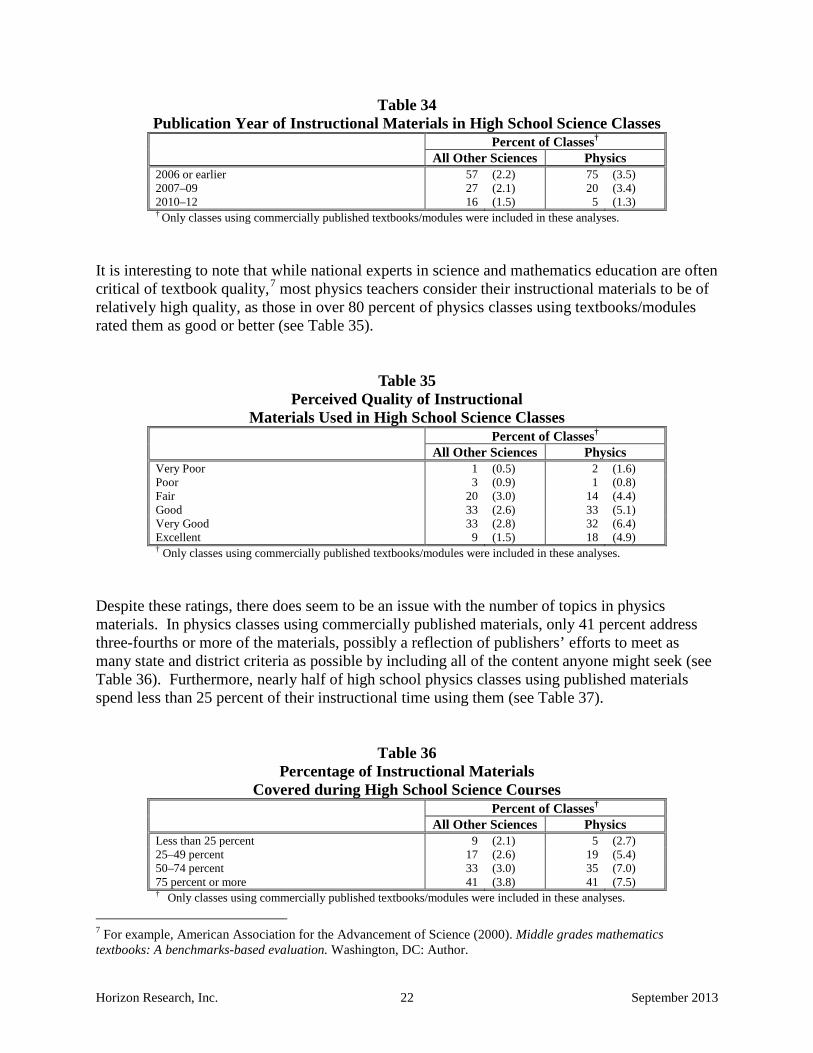
Table 34 shows the publication year of commercially published instructional materials used. In 2012, three-quarters of high school physics classes using commercially published materials were using ones published prior to 2007, a much higher percentage than other science classes.
Horizon Research, Inc. 22 September 2013
Table 34 Publication Year of Instructional Materials in High School Science Classes Percent of Classes† All Other Sciences Physics 2006 or earlier 57 (2.2) 75 (3.5) 2007–09 27 (2.1) 20 (3.4) 2010–12 16 (1.5) 5 (1.3) † Only classes using commercially published textbooks/modules were included in these analyses.
It is interesting to note that while national experts in science and mathematics education are often critical of textbook quality,7 most physics teachers consider their instructional materials to be of relatively high quality, as those in over 80 percent of physics classes using textbooks/modules rated them as good or better (see Table 35).
Table 35 Perceived Quality of Instructional
Materials Used in High School Science Classes Percent of Classes† All Other Sciences Physics Very Poor 1 (0.5) 2 (1.6) Poor 3 (0.9) 1 (0.8) Fair 20 (3.0) 14 (4.4) Good 33 (2.6) 33 (5.1) Very Good 33 (2.8) 32 (6.4) Excellent 9 (1.5) 18 (4.9) † Only classes using commercially published textbooks/modules were included in these analyses.
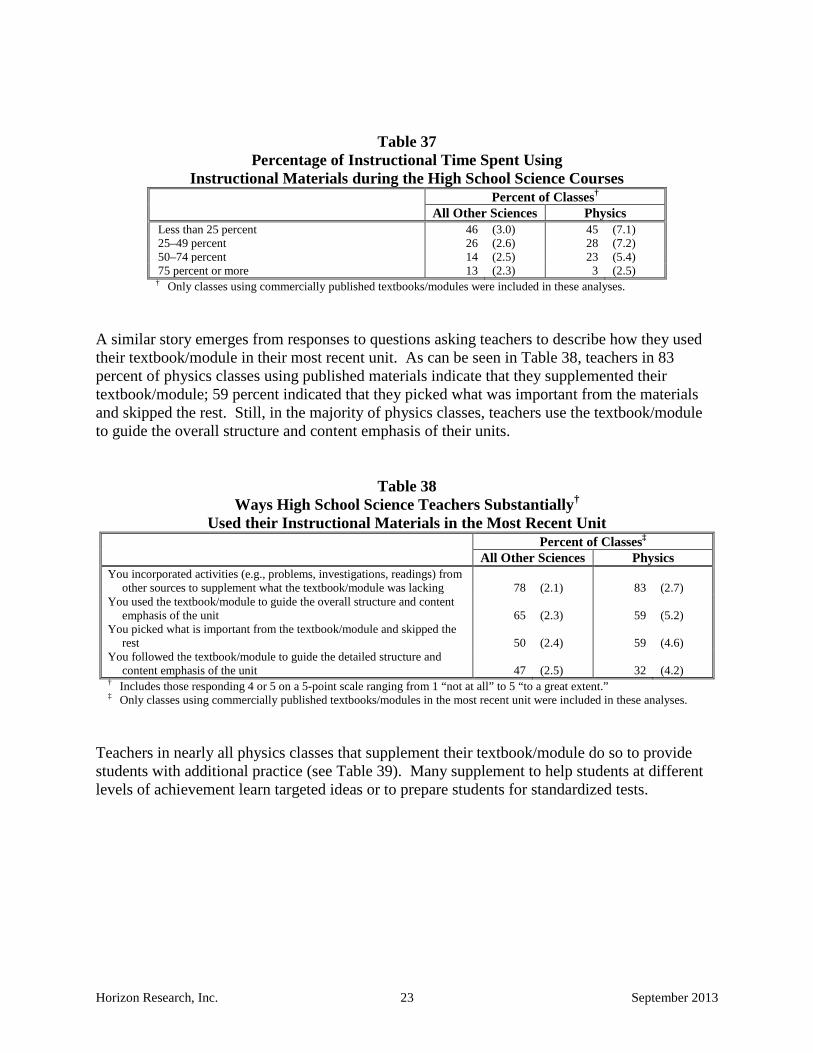
Despite these ratings, there does seem to be an issue with the number of topics in physics materials. In physics classes using commercially published materials, only 41 percent address three-fourths or more of the materials, possibly a reflection of publishers’ efforts to meet as many state and district criteria as possible by including all of the content anyone might seek (see Table 36). Furthermore, nearly half of high school physics classes using published materials spend less than 25 percent of their instructional time using them (see Table 37).
Table 36 Percentage of Instructional Materials
Covered during High School Science Courses Percent of Classes† All Other Sciences Physics Less than 25 percent 9 (2.1) 5 (2.7) 25–49 percent 17 (2.6) 19 (5.4) 50–74 percent 33 (3.0) 35 (7.0) 75 percent or more 41 (3.8) 41 (7.5) † Only classes using commercially published textbooks/modules were included in these analyses.
7 For example, American Association for the Advancement of Science (2000). Middle grades mathematics textbooks: A benchmarks-based evaluation. Washington, DC: Author.
Horizon Research, Inc. 23 September 2013
Table 37 Percentage of Instructional Time Spent Using
Instructional Materials during the High School Science Courses Percent of Classes† All Other Sciences Physics Less than 25 percent 46 (3.0) 45 (7.1) 25–49 percent 26 (2.6) 28 (7.2) 50–74 percent 14 (2.5) 23 (5.4) 75 percent or more 13 (2.3) 3 (2.5)
† Only classes using commercially published textbooks/modules were included in these analyses. A similar story emerges from responses to questions asking teachers to describe how they used their textbook/module in their most recent unit. As can be seen in Table 38, teachers in 83 percent of physics classes using published materials indicate that they supplemented their textbook/module; 59 percent indicated that they picked what was important from the materials and skipped the rest. Still, in the majority of physics classes, teachers use the textbook/module to guide the overall structure and content emphasis of their units.
Table 38 Ways High School Science Teachers Substantially†
Used their Instructional Materials in the Most Recent Unit
Percent of Classes‡ All Other Sciences Physics You incorporated activities (e.g., problems, investigations, readings) from
other sources to supplement what the textbook/module was lacking 78 (2.1) 83 (2.7) You used the textbook/module to guide the overall structure and content
emphasis of the unit 65 (2.3) 59 (5.2) You picked what is important from the textbook/module and skipped the
rest 50 (2.4) 59 (4.6) You followed the textbook/module to guide the detailed structure and
content emphasis of the unit 47 (2.5) 32 (4.2) † Includes those responding 4 or 5 on a 5-point scale ranging from 1 “not at all” to 5 “to a great extent.” ‡ Only classes using commercially published textbooks/modules in the most recent unit were included in these analyses.
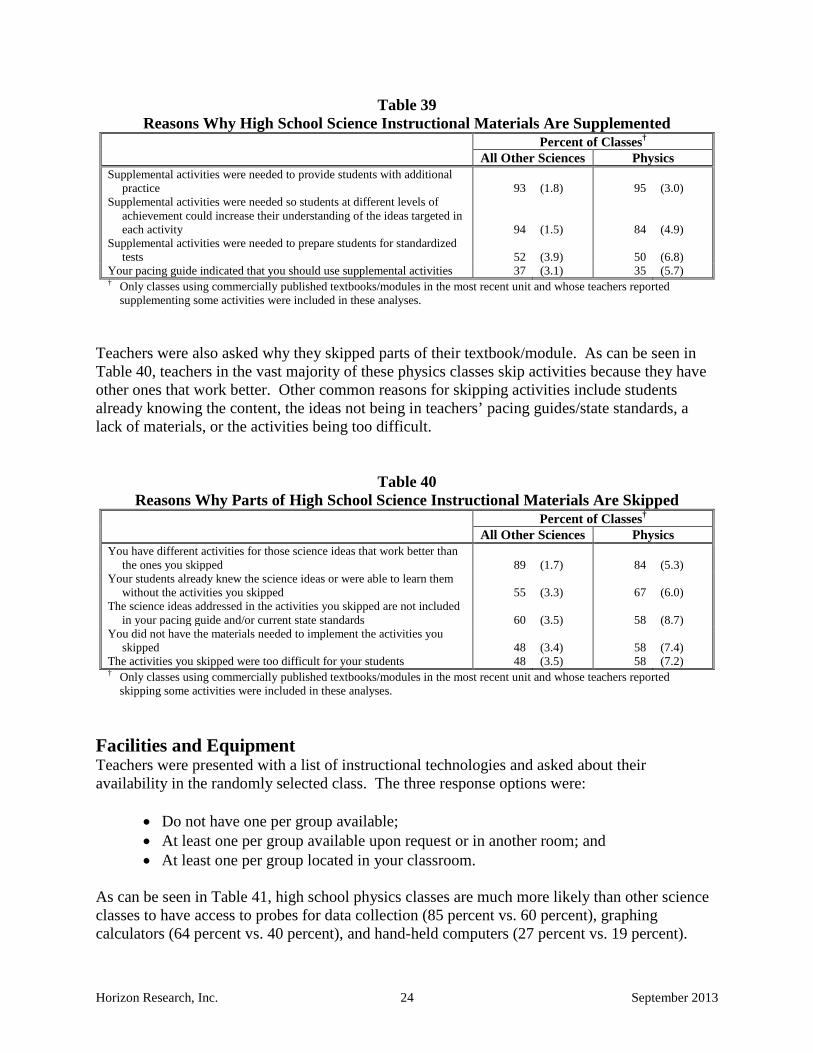
Teachers in nearly all physics classes that supplement their textbook/module do so to provide students with additional practice (see Table 39). Many supplement to help students at different levels of achievement learn targeted ideas or to prepare students for standardized tests.
Horizon Research, Inc. 24 September 2013
Table 39 Reasons Why High School Science Instructional Materials Are Supplemented
Percent of Classes† All Other Sciences Physics Supplemental activities were needed to provide students with additional
practice 93 (1.8) 95 (3.0) Supplemental activities were needed so students at different levels of
achievement could increase their understanding of the ideas targeted in each activity 94 (1.5) 84 (4.9)
Supplemental activities were needed to prepare students for standardized tests 52 (3.9) 50 (6.8)
Your pacing guide indicated that you should use supplemental activities 37 (3.1) 35 (5.7) † Only classes using commercially published textbooks/modules in the most recent unit and whose teachers reported
supplementing some activities were included in these analyses. Teachers were also asked why they skipped parts of their textbook/module. As can be seen in Table 40, teachers in the vast majority of these physics classes skip activities because they have other ones that work better. Other common reasons for skipping activities include students already knowing the content, the ideas not being in teachers’ pacing guides/state standards, a lack of materials, or the activities being too difficult.
Table 40 Reasons Why Parts of High School Science Instructional Materials Are Skipped
Percent of Classes† All Other Sciences Physics You have different activities for those science ideas that work better than
the ones you skipped 89 (1.7) 84 (5.3) Your students already knew the science ideas or were able to learn them
without the activities you skipped 55 (3.3) 67 (6.0) The science ideas addressed in the activities you skipped are not included
in your pacing guide and/or current state standards 60 (3.5) 58 (8.7) You did not have the materials needed to implement the activities you
skipped 48 (3.4) 58 (7.4) The activities you skipped were too difficult for your students 48 (3.5) 58 (7.2) † Only classes using commercially published textbooks/modules in the most recent unit and whose teachers reported
skipping some activities were included in these analyses. Facilities and Equipment Teachers were presented with a list of instructional technologies and asked about their availability in the randomly selected class. The three response options were:
• Do not have one per group available; • At least one per group available upon request or in another room; and • At least one per group located in your classroom.
As can be seen in Table 41, high school physics classes are much more likely than other science classes to have access to probes for data collection (85 percent vs. 60 percent), graphing calculators (64 percent vs. 40 percent), and hand-held computers (27 percent vs. 19 percent).
Horizon Research, Inc. 25 September 2013
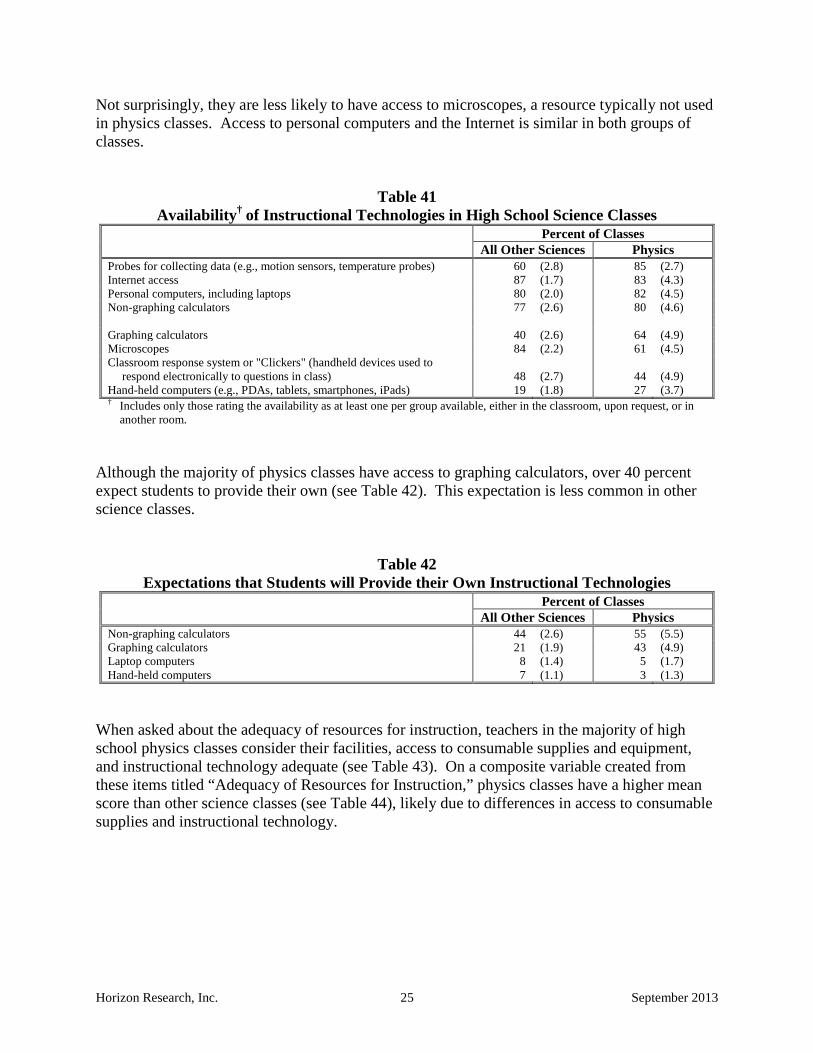
Not surprisingly, they are less likely to have access to microscopes, a resource typically not used in physics classes. Access to personal computers and the Internet is similar in both groups of classes.
Table 41 Availability† of Instructional Technologies in High School Science Classes
Percent of Classes All Other Sciences Physics Probes for collecting data (e.g., motion sensors, temperature probes) 60 (2.8) 85 (2.7) Internet access 87 (1.7) 83 (4.3) Personal computers, including laptops 80 (2.0) 82 (4.5) Non-graphing calculators 77 (2.6) 80 (4.6) Graphing calculators 40 (2.6) 64 (4.9) Microscopes 84 (2.2) 61 (4.5) Classroom response system or "Clickers" (handheld devices used to
respond electronically to questions in class) 48 (2.7) 44 (4.9) Hand-held computers (e.g., PDAs, tablets, smartphones, iPads) 19 (1.8) 27 (3.7) † Includes only those rating the availability as at least one per group available, either in the classroom, upon request, or in
another room. Although the majority of physics classes have access to graphing calculators, over 40 percent expect students to provide their own (see Table 42). This expectation is less common in other science classes.
Table 42 Expectations that Students will Provide their Own Instructional Technologies
Percent of Classes All Other Sciences Physics Non-graphing calculators 44 (2.6) 55 (5.5) Graphing calculators 21 (1.9) 43 (4.9) Laptop computers 8 (1.4) 5 (1.7) Hand-held computers 7 (1.1) 3 (1.3)
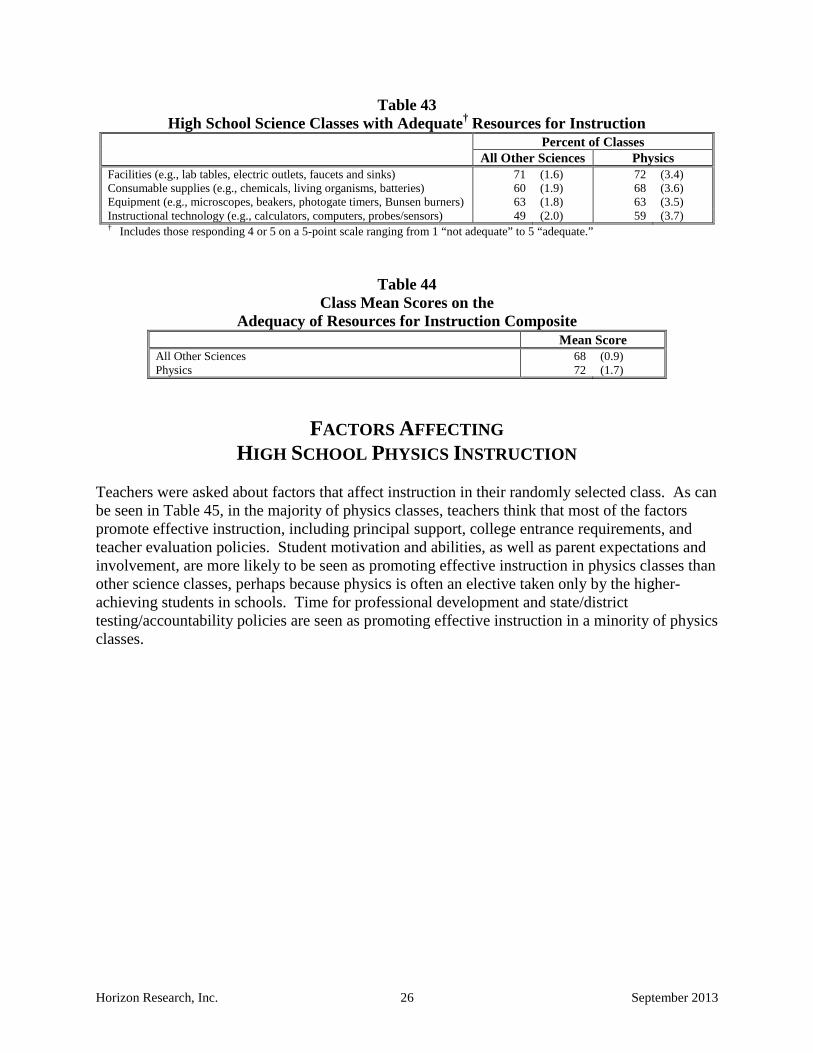
When asked about the adequacy of resources for instruction, teachers in the majority of high school physics classes consider their facilities, access to consumable supplies and equipment, and instructional technology adequate (see Table 43). On a composite variable created from these items titled “Adequacy of Resources for Instruction,” physics classes have a higher mean score than other science classes (see Table 44), likely due to differences in access to consumable supplies and instructional technology.
Horizon Research, Inc. 26 September 2013
Table 43 High School Science Classes with Adequate† Resources for Instruction
Percent of Classes All Other Sciences Physics Facilities (e.g., lab tables, electric outlets, faucets and sinks) 71 (1.6) 72 (3.4) Consumable supplies (e.g., chemicals, living organisms, batteries) 60 (1.9) 68 (3.6) Equipment (e.g., microscopes, beakers, photogate timers, Bunsen burners) 63 (1.8) 63 (3.5) Instructional technology (e.g., calculators, computers, probes/sensors) 49 (2.0) 59 (3.7) † Includes those responding 4 or 5 on a 5-point scale ranging from 1 “not adequate” to 5 “adequate.”
Table 44 Class Mean Scores on the
Adequacy of Resources for Instruction Composite Mean Score All Other Sciences 68 (0.9) Physics 72 (1.7)
FACTORS AFFECTING HIGH SCHOOL PHYSICS INSTRUCTION
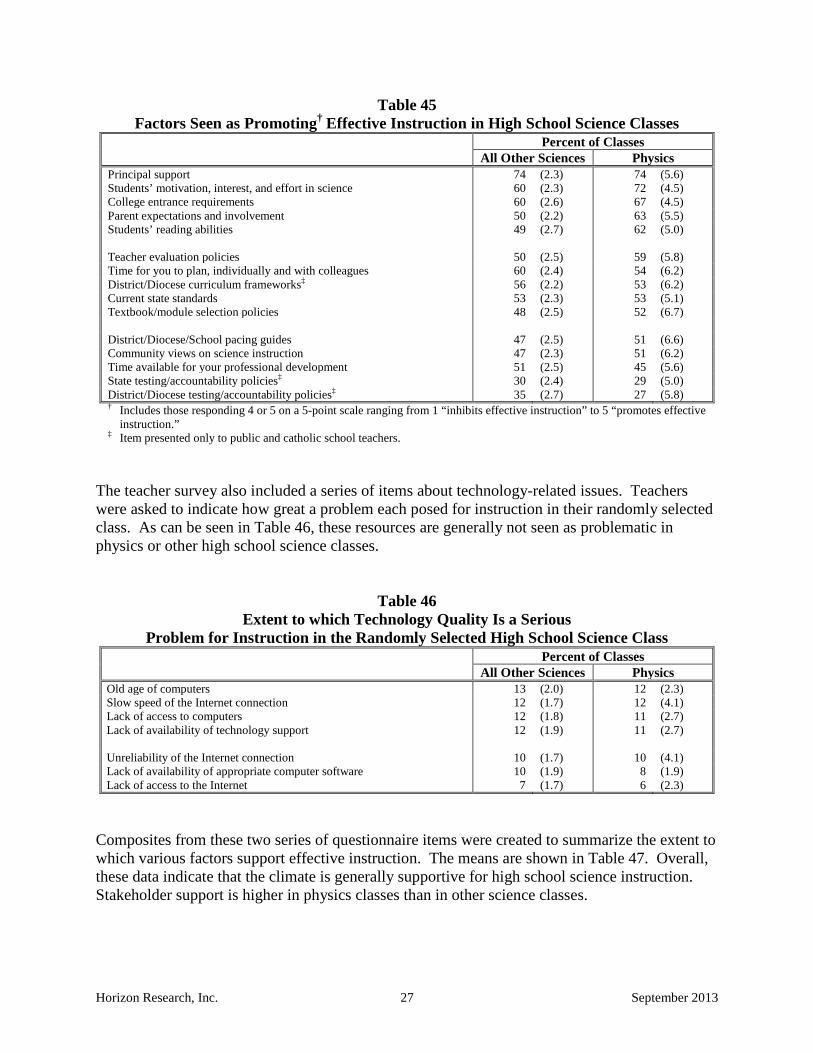
Teachers were asked about factors that affect instruction in their randomly selected class. As can be seen in Table 45, in the majority of physics classes, teachers think that most of the factors promote effective instruction, including principal support, college entrance requirements, and teacher evaluation policies. Student motivation and abilities, as well as parent expectations and involvement, are more likely to be seen as promoting effective instruction in physics classes than other science classes, perhaps because physics is often an elective taken only by the higher-achieving students in schools. Time for professional development and state/district testing/accountability policies are seen as promoting effective instruction in a minority of physics classes.
Horizon Research, Inc. 27 September 2013
Table 45 Factors Seen as Promoting† Effective Instruction in High School Science Classes
Percent of Classes All Other Sciences Physics Principal support 74 (2.3) 74 (5.6) Students’ motivation, interest, and effort in science 60 (2.3) 72 (4.5) College entrance requirements 60 (2.6) 67 (4.5) Parent expectations and involvement 50 (2.2) 63 (5.5) Students’ reading abilities 49 (2.7) 62 (5.0) Teacher evaluation policies 50 (2.5) 59 (5.8) Time for you to plan, individually and with colleagues 60 (2.4) 54 (6.2) District/Diocese curriculum frameworks‡ 56 (2.2) 53 (6.2) Current state standards 53 (2.3) 53 (5.1) Textbook/module selection policies 48 (2.5) 52 (6.7) District/Diocese/School pacing guides 47 (2.5) 51 (6.6) Community views on science instruction 47 (2.3) 51 (6.2) Time available for your professional development 51 (2.5) 45 (5.6) State testing/accountability policies‡ 30 (2.4) 29 (5.0) District/Diocese testing/accountability policies‡ 35 (2.7) 27 (5.8) † Includes those responding 4 or 5 on a 5-point scale ranging from 1 “inhibits effective instruction” to 5 “promotes effective
instruction.” ‡ Item presented only to public and catholic school teachers.
The teacher survey also included a series of items about technology-related issues. Teachers were asked to indicate how great a problem each posed for instruction in their randomly selected class. As can be seen in Table 46, these resources are generally not seen as problematic in physics or other high school science classes.
Table 46 Extent to which Technology Quality Is a Serious
Problem for Instruction in the Randomly Selected High School Science Class Percent of Classes All Other Sciences Physics Old age of computers 13 (2.0) 12 (2.3) Slow speed of the Internet connection 12 (1.7) 12 (4.1) Lack of access to computers 12 (1.8) 11 (2.7) Lack of availability of technology support 12 (1.9) 11 (2.7) Unreliability of the Internet connection 10 (1.7) 10 (4.1) Lack of availability of appropriate computer software 10 (1.9) 8 (1.9) Lack of access to the Internet 7 (1.7) 6 (2.3)
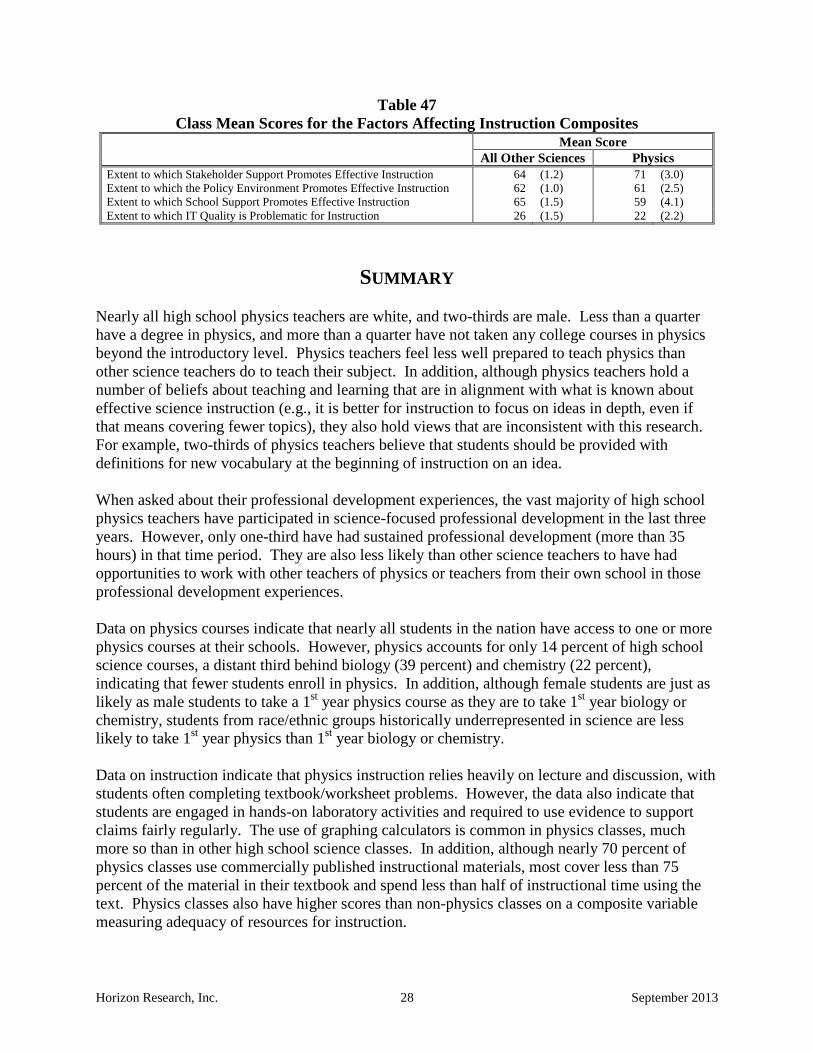
Composites from these two series of questionnaire items were created to summarize the extent to which various factors support effective instruction. The means are shown in Table 47. Overall, these data indicate that the climate is generally supportive for high school science instruction. Stakeholder support is higher in physics classes than in other science classes.
Horizon Research, Inc. 28 September 2013
Table 47 Class Mean Scores for the Factors Affecting Instruction Composites
Mean Score All Other Sciences Physics Extent to which Stakeholder Support Promotes Effective Instruction 64 (1.2) 71 (3.0) Extent to which the Policy Environment Promotes Effective Instruction 62 (1.0) 61 (2.5) Extent to which School Support Promotes Effective Instruction 65 (1.5) 59 (4.1) Extent to which IT Quality is Problematic for Instruction 26 (1.5) 22 (2.2)
SUMMARY Nearly all high school physics teachers are white, and two-thirds are male. Less than a quarter have a degree in physics, and more than a quarter have not taken any college courses in physics beyond the introductory level. Physics teachers feel less well prepared to teach physics than other science teachers do to teach their subject. In addition, although physics teachers hold a number of beliefs about teaching and learning that are in alignment with what is known about effective science instruction (e.g., it is better for instruction to focus on ideas in depth, even if that means covering fewer topics), they also hold views that are inconsistent with this research. For example, two-thirds of physics teachers believe that students should be provided with definitions for new vocabulary at the beginning of instruction on an idea. When asked about their professional development experiences, the vast majority of high school physics teachers have participated in science-focused professional development in the last three years. However, only one-third have had sustained professional development (more than 35 hours) in that time period. They are also less likely than other science teachers to have had opportunities to work with other teachers of physics or teachers from their own school in those professional development experiences. Data on physics courses indicate that nearly all students in the nation have access to one or more physics courses at their schools. However, physics accounts for only 14 percent of high school science courses, a distant third behind biology (39 percent) and chemistry (22 percent), indicating that fewer students enroll in physics. In addition, although female students are just as likely as male students to take a 1st year physics course as they are to take 1st year biology or chemistry, students from race/ethnic groups historically underrepresented in science are less likely to take 1st year physics than 1st year biology or chemistry. Data on instruction indicate that physics instruction relies heavily on lecture and discussion, with students often completing textbook/worksheet problems. However, the data also indicate that students are engaged in hands-on laboratory activities and required to use evidence to support claims fairly regularly. The use of graphing calculators is common in physics classes, much more so than in other high school science classes. In addition, although nearly 70 percent of physics classes use commercially published instructional materials, most cover less than 75 percent of the material in their textbook and spend less than half of instructional time using the text. Physics classes also have higher scores than non-physics classes on a composite variable measuring adequacy of resources for instruction.
Horizon Research, Inc. September 2013
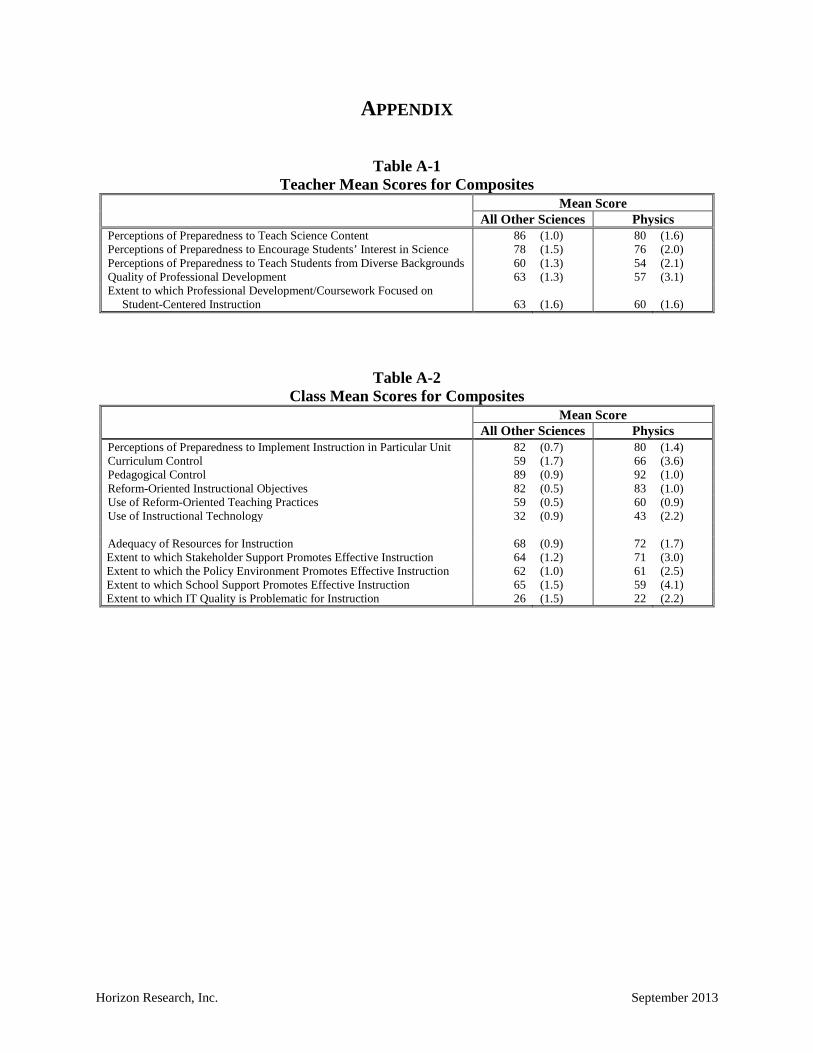
APPENDIX
Table A-1 Teacher Mean Scores for Composites
Mean Score All Other Sciences Physics Perceptions of Preparedness to Teach Science Content 86 (1.0) 80 (1.6) Perceptions of Preparedness to Encourage Students’ Interest in Science 78 (1.5) 76 (2.0) Perceptions of Preparedness to Teach Students from Diverse Backgrounds 60 (1.3) 54 (2.1) Quality of Professional Development 63 (1.3) 57 (3.1) Extent to which Professional Development/Coursework Focused on
Student-Centered Instruction 63 (1.6) 60 (1.6)
Table A-2 Class Mean Scores for Composites
Mean Score All Other Sciences Physics Perceptions of Preparedness to Implement Instruction in Particular Unit 82 (0.7) 80 (1.4) Curriculum Control 59 (1.7) 66 (3.6) Pedagogical Control 89 (0.9) 92 (1.0) Reform-Oriented Instructional Objectives 82 (0.5) 83 (1.0) Use of Reform-Oriented Teaching Practices 59 (0.5) 60 (0.9) Use of Instructional Technology 32 (0.9) 43 (2.2) Adequacy of Resources for Instruction 68 (0.9) 72 (1.7) Extent to which Stakeholder Support Promotes Effective Instruction 64 (1.2) 71 (3.0) Extent to which the Policy Environment Promotes Effective Instruction 62 (1.0) 61 (2.5) Extent to which School Support Promotes Effective Instruction 65 (1.5) 59 (4.1) Extent to which IT Quality is Problematic for Instruction 26 (1.5) 22 (2.2)