Embed Size (px)
Citation preview

2012 RCH Culture Survey Organisational Results Report
Part 1: Introduction & Summary

Section 1: Introduction Page 2
Organisational Results Report
This report presents the results of the 2012 RCH Culture Survey, conducted online in November-December
2012. It is divided into three parts (of which this document is Part 1). To understand the survey results and
their implications quickly, we recommend reading the Executive Summary (Section 1). Sections 2 and 3
provide a more in-depth look at the context of the survey, and how to interpret the results contained in Part 2.
The more detailed sections of the report in Parts 2 and 3 provide a reference to understand the detail behind
the key findings and directional recommendations, and can be used to inform communications and initiatives
over the coming months.
In this document
Section Contents Page
Part One: Introduction & Summary
Section 1: Executive Summary The Executive summary provides an overview of the response rates, engagement levels, strengths, areas to monitor and areas to address. It also contains a set of directional recommendations, covering the interventions that the survey results suggest will do most to address staff concerns and raise engagement.
3
Section 2A: Survey Context This section provides important context around how the culture survey was conducted and the constructs behind the content of the items used in the survey.
10
Section 2B: Guide to Interpreting the Results
Section 2B provides practical guidance on how to interpret the results in all other sections of this report.
17
In the accompanying reports
Section Contents
Part Two: Detailed Survey Reporting
Section 3: Survey Demographics Section 3 provides detailed information on the numbers of people who participated in the survey, broken down by all the demographic categories used to track responses.
Section 4: Engagement The Engagement section contains the organisation-wide results for all the survey items in the Engagement category (see Section 1 for a discussion of the construct of Engagement and its importance for organisational performance and sustainability).
Section 5: Relationship between Engagement and Drivers of Engagement
Section 5 presents the extent of the relationship between ‘engagement driver’ survey item categories (all items not directly asking about engagement) and engagement, and the results for those categories. As this analysis combines favourability with importance to engagement, it provides the most complete way of determining which aspects of the organisation from a staff perspective are strengths to consolidate or issues of importance to address.
Section 6: Drivers of Engagement Detail
Section 6 provides detail down to the survey item level on the results for all engagement driver items.
Section 7: Highest and Lowest Rated Items
Section 7 lists the 15 highest (by percentage of positive responses) and 15 lowest (by percentage of negative responses) survey items, along with the highest and lowest performing Divisions and Departmental Groupings (departments grouped together according to management structure and with at least 30 completed surveys).
Section 8: Detailed Results for All Survey Items
Section 8 provides a complete reference of survey results for each item in the survey, including the distribution of ratings, breakdown by all demographics and correlation with other items.
Part Three: Respondent Comments
Section 9: Comments by Division Section 9 contains a verbatim record of the comments made in the survey’s free text question. These are included by Division, and ordered according to the respondent’s level of engagement (their aggregate response across all the engagement items in the survey).

Section 1: Introduction Page 3
Part 1: Introduction & Summary
Section 1: Executive Summary
Response Rates
The culture survey achieved an overall response rate of 35%. Response rates were higher for fulltime (48%),
than part-time staff (35%). Only 6% of casual staff responded. The highest response rate by division was for
People & Culture / Marketing and Comms (70%), while Medical Services and Nursing & Allied Health were the
lowest (both with 25%).
There are a few points to note regarding these response rates:
In Bendelta’s view, a rate less than 50% is not ideal; this is based on what is desirable (that the
majority of the population’s views are obtained) and what is realistic (for example, a recent meta-
analysis of 152 organisations, the average response rate was 53%1). However, the benchmark for an
acceptable response rate varies by organisation type, and for healthcare the response rates tend to
be lower (for example, a recent meta-analysis of employee engagement across 25,000 employees in
16 North American hospitals yielded a response rate of 46%2.
With lower (i.e. sub 50%) response rates, the possibility of nonresponse bias exists3, where research
suggests that respondents (when compared to non-respondents) tend to take more interest in their
work environment. However, this does not mean that respondents are necessarily more engaged (in
the sense of being positive about their work environment, satisfied with their role or likely to
advocate for the organisation). There are a number of reasons why we think, for most parts of RCH,
such a bias does not cast doubt on the validity of the results:
o There is no relationship between response rate and the level of engagement – by division,
departmental, age, length of service or employment type.
o Respondents have differentiated their ratings across the survey items - there is no ‘halo’
effect.
o Respondents have made frank (and mostly balanced) comments.
Where particularly low response rates are achieved (i.e. below 25%), even if there is no evidence of
survey bias, the results cannot be taken as representative, and any conclusions that are drawn from
the results that are specific to these areas must be validated before any decisions are taken about
how to act upon the results. This is true of Casual staff and certain departmental groupings:
o We expect rates for casual staff to be lower (because casual staff have less time to
participate, often less access to computers). Practical barriers to survey participation also
apply for part-time staff, but to a lesser degree, and we consider the part-time response rate
of 35% to be acceptable, although (as noted above) not ideal.
o Response rates for Nurse Bank (8%) and Medical Workforce Unit (14%), and Support Services
as a profession (13%) merit further investigation. Anecdotal evidence suggests that cynicism
around the value of completing surveys may have been a significant factor in the low
response rates.
1 Baruch, Y and B. C. Holtom. 2008. “Survey Response Levels and Trends in Organizational Research.” Human Relations 61 (8): 1139-60
2 Lowe, G 2012. “How Employee Engagement matters for Hospital Performance” Healthcare Quarterly 15 (2): 29-39
3 Rogelberg S. and J. M. Stanton 2007. “Understanding and Dealing with Organizational Survey Nonresponse”. Organizational Research
Methods 10 (2) 195-209

Section 1: Introduction Page 4
Engagement Levels at the RCH
Engagement is a description of how connected an individual feels to the goals, values and outcomes of their
organisation, both in a general sense and through their own role. Employee engagement encompasses the
extent to which staff are motivated to exert discretionary effort, are proud advocates of their work and
organisation, and intend to remain with their organisation. See page 13 for a full description of Bendelta’s
model of engagement.
How are engagement levels determined?
Survey respondents rated all items in the survey on a continuous scale from Strongly Disagree to Strongly Agree. For reporting on engagement items, responses on this scale have been mapped onto a 5-point engagement scale, based on an individual’s aggregate response across items in the engagement category (Advocacy, Pride, Commitment and Satisfaction).
The overall RCH engagement result of
81% compares favourably with any
external benchmark, as illustrated right.
The majority of engaged respondents
(58% of respondents) are highly
engaged. 13% are Unengaged,
essentially a neutral response.
Conversely, only 7% are disengaged.
71% of staff would recommend the hospital as a good place to work, and 87% are proud to work at the
RCH.
80% get enjoyment from their work, and 70% report being satisfied in their current role.
83% would like to be working at the hospital in 12 months’ time.
Over 50% of the workforce feels that their level of engagement has increased over the past year.
Given that research4 indicates a strong relationship between engagement and staff performance, this level of
engagement is a great strength, both in terms of what the hospital can achieve, and its ability to attract, retain
and motivate its employees. This level of engagement may also represent a buffer against any difficulties or
frustrations that staff face.. It is notable that RCH staff can be highly engaged and yet still report on significant
elements of their working experience that they find frustrating (see Areas to Address on page 7 for a summary
of these elements). This suggests a level of intrinsic engagement (which we hypothesise would be particularly
strong in paediatric healthcare) is a great advantage, but it does not prevent the frustrations identified from
having a negative impact on staff members’ ability to perform to their potential, and therefore from having an
impact on the hospital’s effectiveness and efficiency.
The factors that drive engagement (represented by survey items covering Role, Team, Manager, Senior
Leadership, Organisational Effectiveness and Organisation Ethos) and that are of concern to staff are largely
consistent between the different levels of engagement – i.e. what is important and of concern to highly
engaged staff is also important and of concern to unengaged and disengaged staff. Exceptions include team
morale and bullying, which are more likely to be the lowest scoring items for disengaged and unengaged staff,
and work ethic (whether people can get away with not doing their best), which is more likely to be lower rated
for more engaged staff.
4 See McLeod, D and N Clarke. 2012. “Engaging for success: enhancing performance through employee engagement. A report for the UK Government” for a meta-analysis of international engagement research, illustrating the links between engagement and performance.

Section 1: Introduction Page 5
Strengths, Areas to Monitor and Areas of Concern
The following tables document the key findings from the survey. They are divided into those areas that are
clearly strengths (and that may be leveraged or consolidated), those areas that merit improvement (but are
not, at a hospital-wide level, having a major impact on engagement and work culture) and those that are
impacting engagement and work culture (and so should be prioritised).
Strengths
Generally speaking, survey areas with over 60% of the population giving a positive rating are considered
strengths, provided that the proportion of negative ratings is low (i.e. does not exceed 15%). In the leftmost
column, the darker the indicator, the greater the strength. Note that these strengths are in addition to staff
engagement overall, which was covered in the preceding section.
Indicator Area Evidence
Values driven employees
93% of staff indicated a strong commitment to the RCH values, the majority of these being very positive. It may appear that commitment to organisational values would be a given, but we note that the RCH result is stronger than the global healthcare benchmark of 77%. In Bendelta’s experience, a values-driven culture is a great asset and the optimal foundation for driving improvements.
Clarity of role and expectations
The vast majority of staff know what is expected of them in their roles (87% positive) and feel that their roles make good use of their abilities (74% positive). Moreover, the majority report achievement of their learning and development goals (62% positive). As with values, these are core strengths that provide a solid foundation for improvement.
Collegiality Staff report universally that co-workers are very helpful when solving work problems (82%
positive) and that, at the department/ward level, there is a strong focus on doing things better (69% positive)
Recognition of individual and team performance
Staff feel that team performance appropriately recognised (67% positive) and that their own performance is assessed fairly and transparently (61% positive).
Immediate manager performance and support
Day-to-day support from immediate management is generally strong with a significant majority reporting that their manager/supervisor is accessible (73%) and gives them sufficient face-time (66% positive). While the results for generating enthusiasm and commitment (63% positive) and preparedness to have difficult conversations about work performance (61%) are not quite as strong, Bendelta views these as higher-order qualities, ones that often result in significantly lower ratings than those seen here. Therefore, these results should also be viewed as significant strengths.
Effective management of the move to the new hospital
61% of respondents felt that the move to the new hospital was managed effectively. Given the scale and complexity of the move, this is a strong result. However, it should be noted that results were lower for Doctors and Nurses (56% and 55% positive respectively) and many comments reflected noted frustrations with particular aspects of the new environment that they feel has negatively affected their working environment. Bendelta’s view is that these should be reviewed on a case by case basis to determine what improvements can be made and lessons learned. Note that results for the effective management of ongoing change are significantly lower – see the Change Management entry in Areas of Concern.

Section 1: Introduction Page 6
Areas to Monitor
Areas to monitor are those with moderate to weak results at the organisational level (i.e. typically with
positive results for between 40% and 60% of the population, and negative results up to 20% of the
population). Unless noted otherwise, these areas have a moderate to strong correlation with staff
engagement levels. In the leftmost column, the darker the indicator, the weaker the results, and potentially
the need to investigate and monitor more closely.
Indicator Area Evidence
Bullying and harassment across the organisation
Results relating to the tolerance of bullying and harassment are not especially weak (70% positive, 16% neutral, 14% negative), however the fact that 30% of the population is not convinced that bullying and harassment are not tolerated may be a concern, especially in areas where the negative percentage is higher (e.g. Medical Imaging m with 29% Negative). These results correlate strongly with managers’ ability to deal with workplace conflict effectively, which suggests one potential means of improvement. Bullying was a feature of some comments, especially amongst the small number of disengaged respondents
Workload and stress
While results for We support a balance between work and personal life were quite positive (58% positive, 16% negative), results for The level of stress associated with doing my job is reasonable (44% positive, 24% negative) and I am able to manage project work in addition to my substantive role (40% positive, 28% negative) suggest that many staff feel under pressure with the volume of work. High levels of workload and stress were a feature of respondent comments, and were as likely to come from very engaged staff as any other level of engagement.
Executive Director role-modelling and visibility
Results for My Executive Director is visible in the workplace (40% positive, 36% negative) and My Executive Director knows who I am (54% positive, 32% negative) are weak. However, it is worth noting that these items show little or no correlation with engagement. However, the result for My executive director is an effective role model (45% positive and 26% negative), where role-modelling clearly requires executive director visibility, does have a stronger correlation with engagement and is relatively weak. Unengaged and disengaged respondents were more likely to comment negatively on the accessibility and lack of support from the executive and senior leadership levels.
Selection and promotion processes (or the perception of)
Results for In my Division the selection and promotion processes are based on merit and equity principles (43% positive, 23% negative) suggest the perception that objective performance, whether recognised or not, does not necessarily translate into advancement decisions. Those who manage people were more positive about this (50% positive) compared to those who do not (38% positive).
Career Development and feedback
The value of manager feedback to skill development was a relatively weak area (53% positive) and the extent to which staff are informed and encouraged to pursue career development opportunities (49% positive, 25% negative) was weak overall and weaker in Operations and People & Culture / Marketing & Comms (46% and 41% positive respectively).
Administration, systems and processes
A major theme from respondent comments related to frustration with administrative systems and processes. This covered certain policies, IT, communication and other practices. Access to HR, and HR services more generally, have been cited as problematic; in particular, a number of respondents noted difficulties with payroll. These were issues for staff regardless of their level of engagement. Staff rate the accessibility, clarify and usefulness of work processes and procedures within their department/ward moderately highly (59% positive), but divisional processes less so (47% positive). This difference, taken with the comments made, suggests that it is inter-departmental and organisational processes that cause greater frustration than those within departments and wards, where perhaps staff feel they have more control.

Section 1: Introduction Page 7
Areas to Address
Areas to address are those with both a high correlation with staff engagement, and where the results show
room for significant improvement (generally with a proportion of positive responses less than 50%) and/or a
significant proportion of negative responses (typically 25% or more). In the leftmost column, the darker the
indicator, the weaker the results, and potentially the need to address is more compelling.
Indicator Area Evidence
Openness, transparency and the communication of significant decisions
The majority of staff either disagree or are neutral in response to the item There is a culture of openness and transparency at RCH (30% positive, 32% negative). The result is lowest amongst Doctors and Nurses (36 and 34% negative respectively), and lower as age and length of service increase. Results for Significant decisions are made in a rational, transparent manner (30% Negative, 30% positive with doctors the most negative demographic at 34%) give an indication of potential reason for this perception around the culture, although it may indicate more general concerns. Results for I am informed about how major decisions will affect my role (29% negative versus 36% positive) provide further insight into what staff feel may be lacking in this regard. All the items noted above correlated strongly with engagement, which provides a compelling argument for making transparency around communication a focus for improvement. Lack of transparency from senior leadership was also a feature of comments from both engaged and unengaged respondents.
Improvement and Innovation
The degree of encouragement and support to implement new ideas features as both strongly linked to engagement and also as an area of relative weakness for the RCH:
At RCH, people are encouraged to propose new ideas (45% positive, 19% negative)
At RCH, people are given practical support to implement new ideas (34% positive, 28% negative). This result was lowest in Medicine & Surgery and Medical Services (34% negative), and amongst Doctors and Ancillary staff. Perhaps surprisingly, the result improves with Age and Length of Service, which may indicate a link to seniority.
There is a culture of continuous, incremental improvement (43% positive, 19% negative) Many of the comments made by respondents (regardless of level of engagement) centred on frustrations about the inability to implement ideas for improvements, and more generally about what they consider to be obvious inefficiencies in existing practices, processes and systems that should be targets of improvement.
Accountability for underperformance
Results for People cannot get away with doing less than their best were negative (29% positive, 38% negative with 33% neutral) and, taken with Staff are held accountable for underperformance in my work team (46% positive, 23% negative) indicate that a significant proportion of staff perceive that underperformance exists and is often not dealt with appropriately. These items correlate highly, and for both the results are poorest in Operations and amongst Ancillary staff. These items are more likely to be amongst the lowest rated items for Engaged and Highly Engaged staff.
Team morale Perhaps surprisingly, given the strong results for engagement, collegiality, immediate manager
support and the recognition of team performance, team morale is weak (45% positive, 26% negative). In particular, results are lowest in Operating Theatres (44% negative), 34% in Medical Imaging (34% negative) and Neonatal Services (33% negative). Team morale correlates most strongly with fair distribution of work, and empowerment to drive change and acknowledgement of success.
Project Resourcing and project management capability
Staff largely feel that projects are not adequately resourced – RCH projects are resourced adequately to achieve their objectives (27% positive, 33% negative). This, combined with results noted earlier around individual workload (and also that individual project management capability is not seen as strength), suggest this is an area of concern.
Change Management In terms of ongoing change, results indicate that implementation is still seen as a weakness by a large proportion of staff: In my Division ongoing changes at the new hospital are implemented effectively (39% positive, 24% negative).
Effectiveness of business planning
Results for In my Division the annual business planning process is effective (33% positive, 25% negative) indicate that operational planning, as well as project and change related planning, is an area for improvement.

Section 1: Introduction Page 8
Potential high-impact interventions
Given the areas outlined above, in particular in the Areas to Address table, Bendelta has compiled a summary
of where interventions – either new or as refinements or augmentations of existing initiatives – will have the
most benefit on both engagement and organisational performance.
1. Deliver prompt, frank communication of survey results through multiple channels.
Given the weak results for openness and transparency, and Bendelta’s understanding that previous
survey results may not have been communicated and acted on fully, we recommend a prompt
programme of communication to staff to acknowledge the results. The content of this
communication would:
a. Give balanced coverage of strengths and areas of concern
b. Acknowledge the main themes from respondent comments
c. Present a commitment to openness and transparency
Ongoing communications would then tie in with particular initiatives developed in response to the
survey findings. This approach should increase buy-in by reiterating that changes are being made in
response to staff feedback, which in turn should lead to greater response rates in subsequent surveys.
2. Establish mechanisms (or enhance existing ones) to encourage, acknowledge, review and (if
appropriate) implement ideas for improving efficiency and effectiveness. There is a two-fold
objective here: to improve practices and processes, and to increase the degree of staff involvement
and efficacy in the generation and implementation of innovations and improvements.
a. Get staff heavily involved in the development of action proposals for issues raised in this
survey.
b. Establish (or augment the role of) a process improvement team to capture, assess and
support the implementation of staff-originated improvements and innovations.
3. Revise the approach to communicating significant decisions and changes – their rationale and their
implications. This would include:
Clear communication on both the process (how and when decisions are made) as well as the
outcome (what decisions are made). This tends to build trust as it becomes less about
individuals making decisions and more about a decision making process
A detailed communication plan for significant decisions (which channels, when, what style of
message etc.), that directly addresses any practical or cultural constraints or challenges.
The provision of tools for managers to share information with their people as often and in as
much detail as needed.
4. Develop a longer-term strategy for creating an environment of greater openness and transparency
Openness and transparency is not only process driven, but also behavioural. Typically leadership and
executive development should seek to improve these behaviours and practices, including programs,
coaching, mentoring and development centre work for management. A good 360 degree assessment
for leaders should also cover behaviours needed for improved communication, transparency,
innovation and change leadership.

Section 1: Introduction Page 9
5. Use the survey results to direct the emphasis and content of manager/supervisor development
programs and support tools. Based on the survey results, these might include:
a. Recognising and dealing with underperformance
b. Providing development and career path advice to staff
c. Business planning and project management
d. Identifying and managing conflict, bullying and harassment
e. Communicating key decisions and their potential impact
f. Assessing staff performance and making promotion decisions
6. Establish a ‘task-force’ to examine ways to raise team morale in parts of RCH where it is particularly
low. This may be able to link in with recommendation 2. above.
7. Review change management and planning policies and practices to ensure that they represent best
practice, and look for ways to further increase the proportion of staff with project management
capabilities.
8. Review the portfolio of significant projects in design or implementation phase, to identify any
resourcing constraints and explore options for addressing them at the most critical phases of each
project.
9. Review advancement protocols, and potentially refine and re-communicate to address perceptions
that they are not merit-based.
Section 1: Introduction Page 10
Section 2A: Survey context and content
The Survey The RCH Culture Survey was conducted online in November-December 2012, and gave employees at all levels
an opportunity to provide their views on a range of topics relating to their experience of the culture and work
environment at the RCH. Of 4614 invited respondents, 1617 people completed the survey, giving a total
response rate of 35%. Ideally, response rates should represent the majority (e.g. over 50%) of the
organisation, but we recognise that access to computers and other work factors, such as shift work and a large
part time workforce, may have contributed to the response rate.
The survey used two mechanisms to gather feedback from staff:
1. A series of items that the respondents were asked to indicate their agreement with on a sliding scale
from Strongly Disagree to Strongly Agree;
2. A free text field that allowed respondents to provide their views in answer to the question.
This report focuses on the quantitative results. A separate comments report provides an anonymous,
verbatim record of the comments and suggestions that respondents made.
Demographics 4614 individual invitations were sent to RCH staff using unique URLs. This allowed Bendelta’s survey system to
track responses against a range of demographics from the Chris21 HR system. These demographics comprised
the following categories:
Demographic Category
Division Corporate, Medical Services, Medicine & Surgery, Nursing & Allied Health, Operations, People & Culture / Marketing & Communications (these last two combined into one category)
Departmental Grouping
Within each Division, Departments were grouped according to the existing management structure and to maximise the chance of having enough respondents in each grouping to allow the grouping to be reported separately. The threshold for separate reporting has been set at 30 completed surveys. See Section 3: Survey Demographics for a summary of the Departmental Groupings.
Profession Allied Health, Ancillary, Corporate, Doctor, Nurse, Support Services
Employment Full-time, Part-time, Casual
Gender Female, Male
Age 18-25, 26-35, 36-45, 46-55, 56+
Length of Service Less than 1 year, 1-2 years, 3-5 years, 6-10 years, 11+ years
Manager of People
Yes or No (this question was asked in the survey, rather than using Chris21 data)
Also asked as part of the survey was which of the Divisions the employee felt they belonged to. There are
significant discrepancies between the answer to this and the data held in Chris21 for Medicine & Surgery,
Medical Services and Operations. Information about those differences can be found on Page 7 of Part 2:
Section 4. The Chris21 data is used to generate Divisional for all reporting purposes.
What does the survey measure and why? The RCH Culture Survey allows staff to contribute their views on a comprehensive array of organisational
facets. The principal aim of the survey is to obtain information about the strengths and weaknesses of the

Section 1: Introduction Page 11
organisation as staff perceive them, in order to identify and act on areas improvement, and leverage strengths
in certain areas to the whole organisation. Further to this, the fact that the survey provides a forum for staff
to contribute is a benefit in itself, although the value of this is dependent on the results being communicated
promptly, and acted on where appropriate. The comprehensive survey data gathered in 2012 also provides a
detailed baseline against which to measure the impact of changes at the hospital, particularly those designed
to address issues identified through the survey.
Bendelta provided a library of potential survey items to the RCH, from which a subset was selected that
covered the desired range of organisational facets. In addition a number of survey items were included to
target specific questions, such as staff perceptions of hospital security functions and the recent move to new
premises.
Bendelta’s approach to the design of culture surveys is to look at the staff perception of the organisation in
terms of those factors that indicate how engaged staff are, and those that indicate how they feel about
specific aspects of their experience at work. The ability to combine this information – to see how perception
of a range of organisational aspects is related to their overall experience of working at the hospital and their
commitment to it – is a powerful way to analyse the results and identify not only which areas are strengths
and which are weaknesses, but which changes are most likely to lead to a more engaged, productive
workforce.
What is engagement?
Engagement is a description of how connected an individual feels to the goals, values and outcomes of their
organisation, both in a general sense and through their own role. Employee engagement encompasses the
extent to which staff are motivated to exert discretionary effort, are proud advocates of their work and
organisation, and intend to remain with their organisation.

Section 1: Introduction Page 12
In terms of organisational culture, why is engagement important?

Section 1: Introduction Page 13
Bendelta’s Model of Culture & Engagement There a number of different models of engagement that have been developed through a combination of
academic research and public and private sector application. Bendelta’s model is consistent with generally
accepted dimensions of engagement, such as employees’ willingness to apply discretionary effort, to take
responsibility for solving problems, to advocate for the organisation and to see it as a long term career choice.
A key characterising of this model is that it includes both aspects of engagement and the broader
organisational dimensions that research has shown to be able to drive engagement levels. These drivers of
engagement are important in their own right – it is only through them that we can understand how particular
aspects of the culture and operation of the hospital are perceived by staff. The results presented in this report
looks at these drivers from both perspectives – how strongly they relate to Engagement and whether they
paint a positive, neutral or negative picture of that particular aspect of the RCH.
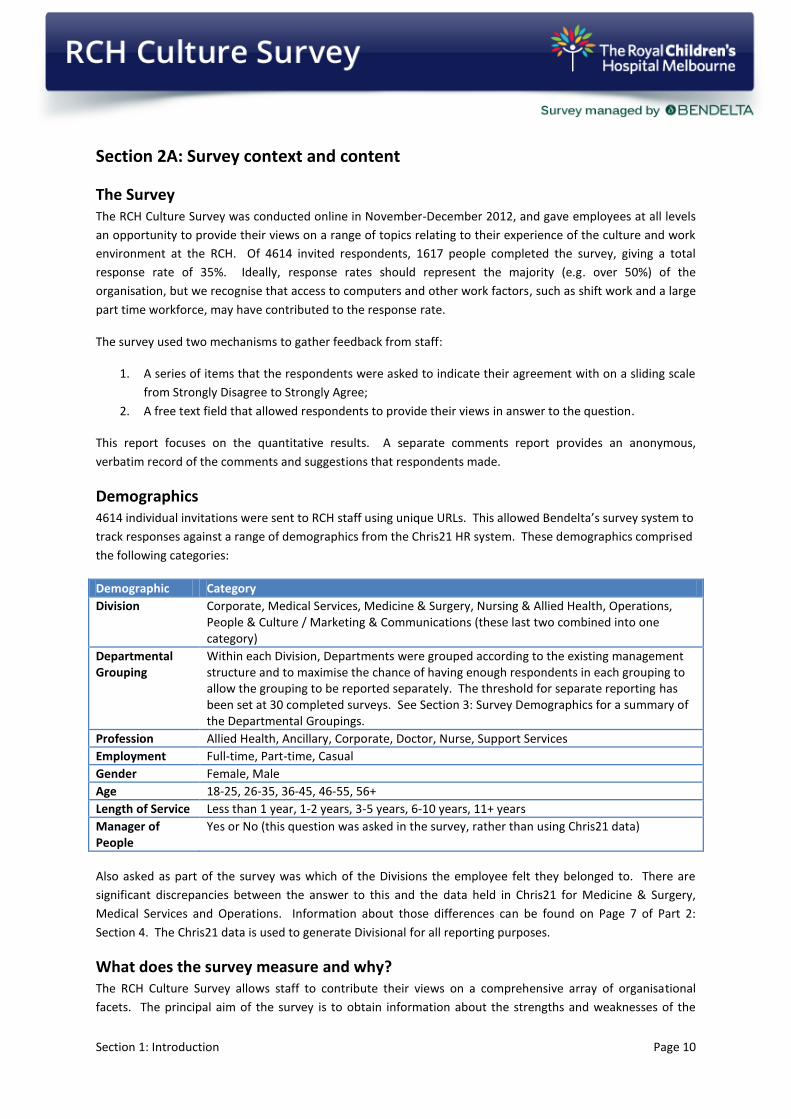
The diagram below provides an overview of the different components of Bendelta’s engagement model. At
the top of the pyramid is the outcome - the performance and sustainability of the organisation. Engagement,
as discussed earlier, has a direct bearing on those outcomes, and in turn the drivers of engagement influence
engagement. Those drivers of engagement also drive performance directly (e.g. through efficient and effective
practices) so we are interested in both the extent to which these factors drive engagement, and what they can
tell us more generally about the strengths and weaknesses of the RCH from the staff perspective.
Figure 1: Bendelta Culture & Engagement Model

Section 1: Introduction Page 14
Aspects of Engagement
As engagement is a broad construct, it is helpful to focus on dimensions that allow us to ask specific rather
than general questions about engagement. The following table reflect Bendelta’s perspective on the four
indicators used in this survey:
Aspect Description Survey Items
Advocacy Advocacy is an expression of an individual’s action or intent to support the hospital, specifically in this context to promote it as a good place to work.
I would recommend the Royal Children’s Hospital as a good place to work
Commitment Commitment covers an employee’s willingness to put effort into their work, their intention or desire to stay with the organisation, and commitment to acting in a way consistent with the values of the organisation.
In my job I am often motivated to make a greater effort than I need to I would still like to be working at RCH in 12 months’ time I am committed to the RCH Values and Behaviours of Unity, Respect, Integrity and Excellence
Satisfaction Satisfaction is perhaps the most basic aspect of engagement, an indication that the employee is in a fulfilling role and more than ‘just a job’.
My work gives me a sense of personal enjoyment – it is more than just a job Overall I am satisfied in my current job
Pride Pride covers the degree to which an employee is proud of the institution, and the fact that they work within it.
I am proud to work for the Royal Children’s Hospital
In addition, a further item about engagement change was included in the survey: My engagement has
increased since last year. As this does not indicate current engagement levels, it is not included in any of the
engagement analyses. This is, however, a useful indicator of how engagement is trending. Were the survey to
be conducted in future years, this item would be replaced by an analysis of the actual change in engagement
scores over the last two years.

Section 1: Introduction Page 15
Organisational Culture - Drivers of Engagement
The following table outlines the different areas of organisational performance on which staff were asked to
rate items in the survey. These represent a comprehensive selection of the organisational factors known to
influence engagement and generally be of interest and importance to staff in organisations of all types and
sizes.
Category Sub-categories Survey Items
Role Capability & Fit My job makes good use of my skills and abilities I have a sound understanding of project management principles
Clarity & Consistency I know what is expected of me in my role There is a strong link between the content of my performance plan (PDAP) and what I actually do/experience during the year
Development I am actively informed and encouraged to pursue opportunities to develop my career I usually achieve my learning and development goals in my performance plan
Empowerment & Efficacy I am empowered to make decisions I have access to the facilities I need to do my job properly My performance on the job is assessed fairly and transparently
Workload & Stress The level of stress associated with my job is reasonable I am able to manage project work in addition to my substantive role
Team Team Environment Bullying and harassment are not tolerated in my work team In my work team, my co-workers are very helpful when I have a work problem Morale is very good in my work team We support a balance between work and personal life in my work team
Team Empowerment Our team is empowered to drive necessary change
Accountability & Recognition
Performance of the team as a whole is appropriately recognised in my work team
Manager Support I am satisfied with how frequently I meet with my manager to discuss my work role I have sufficient face-to-face time with my immediate supervisor / manager My immediate supervisor/ manager is accessible The feedback I receive from my manager is useful in assisting my skill development
Managing the team My immediate supervisor/ manager deals with workplace conflict effectively My immediate supervisor/ manager is prepared to have difficult conversations about individual work performance
Inspiring the team My immediate supervisor/ manager generates enthusiasm and commitment to achieving our goals

Section 1: Introduction Page 16
Category Sub-categories Survey Items
Senior Leadership
Role-Modelling In my Division our Values are modelled effectively by senior managers My Executive Director is an effective role model
Visibility My Executive Director is visible in the workplace My Executive Director knows who I am
Organisational Effectiveness
Advancement In my Division the selection and promotion processes are based on merit and equity principles
Communication I am informed about how major decisions will affect my role I know where to look to find out the information I need Internal communications enable me to keep informed about what’s happening at the hospital and why
Improvement At RCH, there is a culture of continuous, incremental improvement In my Department/Ward there is a strong focus on continually doing things better
Innovation At RCH, people are encouraged to propose new ideas At RCH, people are given practical support to implement new ideas
Planning & Change Management
As changes are implemented, I know what is happening and why In my Division, ongoing changes at the hospital are implemented effectively In my Division, the annual business and operational planning process is effective Significant decisions are made in a rational, transparent manner at RCH The move to the new hospital was managed effectively
Resourcing RCH projects are resourced adequately to achieve their objectives
Security I am aware of how to minimise security risks at RCH I know where to find information about RCH security policy and procedures
Systems & Processes In my Department/ward our work processes, policies and procedures are accessible, clear and helpful In my Division, the processes we use to work together are effective
Organisational Ethos
Openness & Transparency There is a culture of openness and transparency at RCH
Work Ethic People cannot get away with doing less than their best at RCH

Section 1: Introduction Page 17
Section 2B: Interpreting the Results
Understanding the ratings
Respondents were able to rate their agreement with each statement in the survey on a continuous scale, as
pictured below:
There are a number of reasons why the continuous scale was used for this survey. The scale:
Encourages immediate response, as respondents are able to go with their gut feeling, rather than
make a forced choice between distinct ratings
Removes the possibility of misinterpretation of scale terms like Somewhat, Slightly or Moderately.
Affords a much finer-grained analysis of results where appropriate. It yields more reliable
correlations and gives a more accurate picture of how results are distributed across the population,
allowing for more subtle analysis of data over multiple years.
As all the items in the survey were worded positively (i.e. they represent desirable characteristics of an
organisation), we can interpret Strongly Disagree to Strongly Agree dimension as a Negative to Positive
dimension. Therefore, throughout the report, we refer to the ratings as ranging from Negative to Positive
For many of the results presented in this report, we have made it easier to understand the implications at a
glance by interpreting the results on a 5-point (Very Negative to Very Positive) or 3-point (Negative to Positive)
scale. Remember that these scales are reporting the same underlying data, only at a reduced level of detail to
facilitate easy interpretation.
The 3-point scale is useful to give an immediate view on strengths, areas for improvement and areas of
concern, while the 5-point scale provides additional information about the strength of feeling in both the
positive and negative directions.
If you consider the continuous rating scale as ranging from 0 to 100%, the 5 and 3 point scales translate as
follows:
5-point scale (Very Negative to Very Positive)
Very Negative Negative Neutral Positive Very Positive
0 5 10 15 20 25 30 35 40 45 50 55 60 65 70 75 80 85 90 95 100
3-point scale (Negative to Positive)
Negative Neutral Positive
0 5 10 15 20 25 30 35 40 45 50 55 60 65 70 75 80 85 90 95 100
Section 8: Detailed Results for All Survey Items has the full distribution of results for each survey item.

Section 1: Introduction Page 18
Understanding the 5 engagement levels
As well as presenting data on each survey statement, we use the items within the Engagement Category
(except My engagement has increased compared to last year, which is useful to determine how engagement
may have changed over the preceding 12-months, but does not help understand current engagement levels)
as a means of categorising staff according to their overall level of engagement. For this, we look at an
employee’s average response across all the items that comprise Advocacy, Pride, Commitment and
Satisfaction. The averages are then translated onto the five point scale, using the following headings:
Very Disengaged
Disengaged Unengaged Engaged Very Engaged
0 5 10 15 20 25 30 35 40 45 50 55 60 65 70 75 80 85 90 95 100
We use Unengaged rather than Neutral as the term to cover mid-range responses, as this is a fair reflection of,
for example, someone who is at best only moderately agreeing with the statement ‘I am proud to work for the
RCH’ or ‘Overall I am satisfied in my current job.
Interpreting the relationship between drivers of engagement items and engagement
We look at the correlation between responses for individual items with all the Advocacy, Pride, Commitment
and Satisfaction items. The correlation coefficient tells us the degree to which two variables share a linear
relationship – that is, that when one of the variables changes or has a different value, the other variable moves
by a proportional amount in a consistent direction. It does not prove a causal relationship itself, but given that
it is much more likely, for example, that having access to the facilities and resources needed to do one’s job
will drive satisfaction rather than the other way around, it is reasonable to presume that correlation is a good
indicator of the influence of some organisation factor (in this case access to facilities and resources) on
engagement.
The aim of this analysis is not to provide scientific exactitude – we are, after all, assessing subjective views –
but to provide a means of highlighting which items (and therefore areas) have the strongest relationship with
staff engagement.
We use the following guide to help understand the relative importance of the relationship between items or
categories of items and engagement:
Strength of relationship Correlation Coefficient
Very Strong 0.60 +
Strong 0.50 +
Moderate 0.40 +
Weak Below 0.40
Using these relative indicators as a guide, we can then state which items or constructs are most likely to
influence the level of engagement, and so which, especially if the results indicate significant room for
improvement, are most likely to point towards areas that should be addressed as part of the strategic
response to the survey results.

Section 1: Introduction Page 19
What represents a good result?
Nearly all results in this report are expressed in terms of the percentage of the population that registered
ratings at each point on the 3- or 5-point scale. For example 55% positive means that 55% of the population
responded within the positive range (as per the ranges on the previous page). Conversely, 20% negative
simply indicates that 20% of responses were within the negative range. With this in mind, there are a number
of factors to consider when determining whether a result for a particular item or group of items can be
considered ‘good’ in the sense of an organisational strength that requires no intervention to address (other
than what might exist or be put in place to consolidate or maintain it):
Take each result on its merit, because the percentage positive that we consider to be a good result
will vary from item to item. For example, we would expect that nearly everybody completing the
survey would express commitment to the RCH values. And indeed 86% of respondents were within
the positive range, 5% are in the Neutral range and 1% in the negative range. It is for this reason that
Bendelta uses external benchmarks sparingly – they include data from organisations operating in
different contexts, with different goals, and at different stages in addressing particular issue.
Consider results relative to each other. For example, if all of an organisation’s results were
considered satisfactory, that organisation would still be well-served by focusing on a few areas to
improve, rather than resting on its laurels. And conversely, were an organisation’s results all deemed
poor, it would still need to prioritise its actions.
Notwithstanding these points, there are still rules of thumb that can be applied to gain an initial understanding
of the results, and therefore the scale and urgency of any changes to be considered:
The majority of the population responded in the positive range – i.e. most people agree with the
statement in the survey – more people than in the Negative and Neutral ranges combined. Bendelta
considers 70%+ to be a strong result, especially if the Negative proportion is less than 10%. Again it
needs to be stressed that this should be viewed in the context of the item.
The percentage responding in the negative range is small or very small – i.e. people who actively
disagree with the statement are in a small minority, i.e. 10%. If the percentage increases from that to,
say, 15% it is worthy of further investigation, and above 25% is a cause for concern.
The percentage of responses in the neutral range is significantly smaller than the percentage of
responses in the positive range. For example, if 40% of respondents are in the neutral range, this
suggests an area that a large proportion of people feel ambivalent about. Depending upon the item,
this may be a cause for concern.
Once a baseline has been established (the 2012 RCH Culture survey will provide such a baseline, should the
same or very similar items be used in future surveys), survey results can be interpreted through another lens:
the degree of improvement, expressed as both the change in overall percentages in each range and the
percentage of people completing the survey on both occasions who have rated higher in subsequent surveys.

Section 2: Summary of Findings and Directional Recommendations Page 20