Embed Size (px)
Citation preview

2012 Special Reliability Assessment Interim Report:
Effects of Geomagnetic Disturbances on the Bulk Power System
February 2012 Embargoed until 12pm EST February 29, 2012

This page intentionally left blank
Preface
GMDTF Interim Report: Affects of Geomagnetic Disturbances on the Bulk Power System–February 2012
FRCC Florida Reliability Coordinating Council
MRO Midwest Reliability Organization
NPCC Northeast Power Coordinating Council
RFC ReliabilityFirst Corporation
SERC SERC Reliability Corporation
SPP Southwest Power Pool Regional Entity
TRE Texas Reliability Entity
WECC Western Electricity Coordinating Council
Preface The North American Electric Reliability Corporation (NERC) has prepared the following assessment in accordance with the Energy Policy Act of 2005, in which the United States Congress directed NERC to conduct periodic assessments of the reliability and adequacy of the bulk power system of North America.1,2 NERC operates under similar obligations in many Canadian provinces, as well as a portion of Baja California Norte, México.
NERC Mission The North American Electric Reliability Corporation (NERC) is an international regulatory authority established to evaluate reliability of the bulk power system in North America. NERC develops and enforces reliability standards; assesses reliability annually via a 10‐year assessment, and winter and summer seasonal assessments; monitors the bulk power system; and educates, trains, and certifies industry personnel. NERC is the Electric Reliability Organization for North America, subject to oversight by the U.S. Federal Energy Regulatory Commission (FERC) and governmental authorities in Canada.3
NERC assesses and reports on the reliability and adequacy of the North American bulk power system, which is divided into eight regional areas, as shown in the map (Figure A) and corresponding table (Table A). The users, owners, and operators of the bulk power system within these areas account for virtually all the electricity supplied in the United States, Canada, and a portion of Baja California Norte, México.
1 H.R. 6 as approved by of the One Hundred Ninth Congress of the United States, the Energy Policy Act of 2005: http://www.gpo.gov/fdsys/pkg/BILLS‐109hr6enr/pdf/BILLS‐109hr6enr.pdf
2 The NERC Rules of Procedure, Section 800, further detail the Objectives, Scope, Data and Information requirements, and Reliability Assessment Process requiring annual seasonal and long‐term reliability assessments.
3 As of June 18, 2007, the U.S. Federal Energy Regulatory Commission (FERC) granted NERC the legal authority to enforce Reliability Standards with all U.S. users, owners, and operators of the bulk power system, and made compliance with those standards mandatory and enforceable. In Canada, NERC presently has memorandums of understanding in place with provincial authorities in Ontario, New Brunswick, Nova Scotia, Québec, and Saskatchewan, and with the Canadian National Energy Board. NERC standards are mandatory and enforceable in British Columbia, Ontario, New Brunswick, and Nova Scotia. NERC has an agreement with Manitoba Hydro making reliability standards mandatory for that entity, and Manitoba has adopted legislation setting out a framework for standards to become mandatory for users, owners, and operators in the province. In addition, NERC has been designated as the “electric reliability organization” under Alberta’s Transportation Regulation, and certain reliability standards have been approved in that jurisdiction; others are pending. NERC and NPCC have been recognized as standards‐setting bodies by the Régie de l’énergie of Québec, and Québec has the framework in place for reliability standards to become mandatory and enforceable in that jurisdiction.
Table A: NERC Regional Entities Figure A: NERC Regional Entities
Note: The highlighted area between SPP and SERC denotes overlapping Regional area boundaries.
Table of Contents
Effects of Geomagnetic Disturbances on the Bulk Power System–February 2012
Table of Contents
Report
Executive Summary .......................................................................................................................... i
1. Space Weather and the Power System ................................................................................... 1
2. Monitoring and Predicting Space Weather ............................................................................ 8
3. Existing Response Capability ................................................................................................. 14
4. Credible Threat Concept and GIC Calculation....................................................................... 16
5. Power Transformers ............................................................................................................. 25
6. Protection and Control ......................................................................................................... 48
7. Other Equipment .................................................................................................................. 58
8. Power System Analysis .......................................................................................................... 62
9. Grid Monitoring Enhancement ............................................................................................. 71
10. GIC Reduction Devices .......................................................................................................... 73
11. Operating Procedures to Mitigate GIC ................................................................................. 79
12. Managing Geomagnetic Disturbance Risks .......................................................................... 82
13. Recommendations ................................................................................................................ 85
Appendices
Attachment 1: Acronyms .............................................................................................................. 96
Attachment 2: April 2011 NOAA SWPC Workshop ....................................................................... 98
Attachment 3: NERC Industry Alert ............................................................................................ 102
Attachment 4: Public GMD Response Procedures ..................................................................... 104
Attachment 5: Public OEM Documentation on GMD ................................................................. 105
Attachment 6: Monitoring and Measurement Architecture ...................................................... 106
Attachment 7: View on Risk Management ................................................................................. 109
Attachment 8: Example of GIC Calculations ............................................................................... 118
Attachment 9: NERC GMDTF Roster ........................................................................................... 128
North American Electric Reliability Corporation Staff ................................................................ 137

Executive Summary
i GMDTF Interim Report: Affects of Geomagnetic Disturbances on the Bulk Power System–February 2012
I. Executive Summary The highly complex, interconnected North American power grid has provided a long record of reliable, secure delivery of electric power. However, solar storm or geomagnetic disturbance (GMD) events have demonstrated their ability to disrupt the normal operations of the power grid. The most recent example in North America occurred in March 1989, when a GMD led to the collapse of the Hydro‐Québec system, leaving more than six million people without power for nine hours. Figure ES‐1 below shows the March 1989 storm over North America. Understanding the effects of GMD on bulk power systems and the ability of the industry to mitigate their effects are important to managing system reliability.
Figure ES‐1: Geomagnetic intensity–March 1989 storm
NERC conducted this assessment in response to findings in the High Impact, Low Frequency Event Risk to the North American Bulk Power System (March 2010)4 report, which found the best approach to HILF events was through an organized combination of industry‐led task forces and initiatives. The GMD Task Force implemented that approach for study of geomagnetic disturbances. The breadth of subject matter expertise is shown by the listing of the task force leadership, members, and observers in Attachment 9.
I.1 The GMD Phenomena GMD emanate from the sun (see Figure ES‐2). According to scientists, solar coronal holes and coronal mass ejections (CME) are the two main categories of solar activity that drive solar magnetic disturbances on Earth. CME create a large mass of charged solar energetic particles
4 NERC/US Department of Energy, June 2010: High Impact, Low Frequency Event Risk to the Bulk Power System of North
America: http://www.nerc.com/files/hilf.pdf

Executive Summary
GMDTF Interim Report: Affects of Geomagnetic Disturbances on the Bulk Power System–February 2012 ii
that escape from the sun’s halo (corona), traveling to Earth between 14 and 96 hours.5 These high‐energy particles consist of electrons, along with coronal and solar wind ions.6 Geomagnetic induced currents (GICs) that interact with the power system appear to be produced when a large CME occurs and are directed at Earth.
Figure ES‐2: Storm interaction with Earth and transmission lines
Charged particles from the CME interact with Earth’s magnetosphere‐ionosphere and produce ionospheric currents, called electrojets. Typically millions of amperes in magnitude, electrojets perturb Earth’s geomagnetic field, inducing voltage potential at Earth’s surface and resulting in GIC. Long man‐made conducting paths, such as transmission lines, metallic pipelines, cables, and railways, can act as “antennae” (depending on the impedance), that allow the quasi‐DC currents to enter and exit the power system at transformer grounds, disrupt the normal operation of the power system and, in some cases, cause damage to equipment. Current is also induced on the transmission lines through voltage induction on the loop formed by the grounded transmission line and earth. Induction can occur along a loop of transmission lines, which are connected by grounding.
I.2 Monitoring and Predicting Space Weather In the United States, the responsibility for monitoring and forecasting space weather rests with the National Oceanographic and Atmospheric Administration (NOAA) Space Weather Prediction Center (SWPC).7 In the United States, magnetometers, which gather data on Earth’s geomagnetic field, are operated by the United States Geological Survey (USGS). In Canada, the
5 G.S. Lakhina et al., “Research on Historical Records of Geomagnetic Storms,” International Astronomical Union, 2005, http://journals.cambridge.org/download.php?file=%2FIAU%2FIAU2004_IAUS226%2FS1743921305000074a.pdf&code=8b385987fda8f5858eb4aa14d4bda045.
6 Centra Technology, Inc., “Geomagnetic Storms,” produced for the OECD/IFP Futures Project on “Future Global Shocks,” January 14, 2011, http://www.oecd.org/dataoecd/57/25/46891645.pdf
7 The SWPC is part of the National Weather Service of the United States Government Department of Commerce and is one of the nine National Centers for Environmental Prediction. The SWPC is based in Boulder, Colorado, USA
t
B
E

Executive Summary
iii GMDTF Interim Report: Affects of Geomagnetic Disturbances on the Bulk Power System–February 2012
Canadian Space Weather Forecast Centre (CSWFC) is responsible for monitoring and providing services on space weather.8,9 Both North American space weather centers gather the available data in real time describing the state of the sun, heliosphere, magnetosphere, and ionosphere forming a picture of the environment between the sun and Earth. With this information, forecasts, watches, warnings, and alerts are prepared and issued to those impacted by space weather. Scientists and technicians use a variety of ground‐ and space‐based sensors, as well as imaging systems, to view activity at various locations. This report includes more information on monitoring and predicting space weather in Chapter 2 (Monitoring and Predicting Space Weather).
I.3 Two Risks There are two risks that result from the introduction of GICs to the bulk power system:
1) Damage to bulk power system assets, typically associated with transformers, and
2) Loss of reactive power support, which could lead to voltage instability and power system collapse.
For extra high voltage (EHV) transformers, the effects of GIC include half‐cycle saturation that results in: 1) harmonic currents, 2) fringing magnetic fields (flux that flows outside the core), and 3) increased reactive power (VAr) consumption. Harmonic currents can cause relays to trip needed equipment; fringing fields can create heating in transformers which, if sufficiently high and sustained for a relatively long duration, can lead to their reduced life; and VAr consumption can cause the system to collapse due to voltage instability. Furthermore, loss‐of‐life to transformers results from insulation breakdown and can be detected by measuring dissolved gas in the insulating oil. The magnitude, frequency, and duration of GICs, as well as the geology and transformer design are key considerations in determining the amount of heating that develops in the windings and structural parts of a transformer. The effect of this heating on the condition, performance, and insulation life of the transformer is also a function of a transformer’s design and operational loading during a GMD event. For example, the failure of the Salem No.1 Nuclear Generator Step‐Up Unit shell‐type transformer attributed to the March 1989 GMD storm, was due to the development of high circulating currents in the series connections of the low‐voltage windings (See Chapter 5, Section 5.3.1 for more information). Replacing failed EHV transformers is not a small undertaking, as it may require long lead‐time for design, engineering, and manufacturing, unless a spare transformer is located nearby. The loss of a few EHV transformers (greater than 345 kV on the high side) – either closely located or more distant – would rarely challenge bulk power system reliability. More background and information on the impacts to transformers from GIC is included in Chapter 5 (Power Transformers). 8 The Canadian Space Weather Forecast Centre is located in Ottawa, Ontario and Space Weather Canada can be accessed at: http://www.spaceweather.ca/index‐eng.php
9 The CSWFC is part of Natural Resources Canada (NRCan). Natural Resources Canada can be accessed at: http://www.nrcan.gc.ca/home

Executive Summary
GMDTF Interim Report: Affects of Geomagnetic Disturbances on the Bulk Power System–February 2012 iv
The most likely consequence of a strong GMD and the accompanying GIC is the increase of reactive power consumption and the loss of voltage stability. The stability of the bulk power system can be affected by changes in reactive power profiles and extensive waveform distortions from harmonics of alternating current (AC) from half‐cycle saturated high voltage transformers. The potential effects include overheating of auxiliary transformers, improper operation of relays, and heating of generator stators, along with potential damage to reactive power devices and filters for high‐voltage DC lines. GIC can lead to half‐cycle saturation of power transformers and generate significant amounts of odd and even harmonic distortions in the system current and voltages. When transformers are half‐cycle saturated from GIC, protection and control devices may experience elevated harmonic distortion and increase the risk of current‐transformer saturation, which can lead to incorrect or undesired operation of protection and control devices unintentionally isolating equipment at times when it provides critical support to the system. Isolating components, such as transmission lines, transformers, capacitor banks and static VAr compensators (SVCs), may reduce margins further, moving the system closer to voltage collapse. Devices such as SVCs and capacitor banks are also vulnerable to harmonics if the protection device operates on peak or root‐mean‐square quantities, instead of only fundamental quantities. These reactive power devices are critical to maintaining system stability during GMD events when VAr demand is high. More information on the impacts to reliable operation of the bulk power system from a GMD event is included in Chapter 6 (Protection and Control), Chapter 7 (Other Equipment), and Chapter 8 (Power System Analysis). Restoration times of the power system from these two risks are significantly different. For example, restoration times from system collapse due to voltage instability would be a matter of hours to days, while replacing transformers requires long‐lead times (a number of months) to replace or move spares into place, unless they are in a nearby location. Therefore, the failure of a large numbers of transformers would have considerable impacts on portions of the system.
I.4 Existing Response Capability A number of systems in North America have GMD event operating procedures that are triggered by forecast information and/or field GIC sensors. However, NERC’s May 2011 background document, Preparing for Geomagnetic Disturbances alert, indicates “severe GMD events present risks and vulnerabilities that may not be fully addressed in conventional bulk power system planning, design, and operating processes.”10 Existing operating procedures generally focus on adding more reactive power capability and unloading key equipment at the onset of a GMD event. However, more tools are needed for planners and operators to determine the best operating procedures to address specific system configurations. Harmonic overloading of SVCs and capacitor banks, at a time when reactive compensation needs are high due to reactive power absorption from transformer half–cycle saturation, can
10 NERC, “Background for Alert: Preparing for Geomagnetic Disturbances,” http://www.nerc.com/docs/pc/gmdtf/GMD_Background_Draft_05062011_CLEAN.pdf.

Executive Summary
v GMDTF Interim Report: Affects of Geomagnetic Disturbances on the Bulk Power System–February 2012
make maintaining system voltage problematic. Extensive monitoring and simulation models are not widely available, and therefore, the existing operating procedures may not be sufficient to respond to large GMD events. This report recommends development of operational planning and operator visualization tools to enhance situational awareness of GMD impacts. More information on potential GIC mitigation operating procedures is covered in Chapter 12.
I.5 Modeling Power Systems for GMD Analysis Significant work in the past two decades has been devoted to the modeling of GIC flows in a high voltage power network. However, modeling the effects on a power apparatus (e.g., transformers) and system performance (e.g., voltage stability) during a GMD event are not as well developed. GIC flows are highly dependent on the power system’s electrical characteristics and geology. Modeling GIC flows is vital to permit planners and operators to evaluate appropriate combinations of mitigation equipment and operational procedures. This report provides modeling suggestions to guide power system engineers studying GIC to ensure planning of the bulk power system for a GMD event provides sufficient system margin needed by operators to maintain the reliability of the bulk power system. More information on power system modeling and analysis relating to GMD can be found in Chapter 9.
I.6 Monitoring Device Assessment An essential part of a GIC mitigation program is the installation of monitors to measure GICs and harmonic currents on a continuing basis. Monitors are a key source of real‐time information that can guide system operators in determining real‐time response. Additionally, monitors can provide valuable historical records that can be evaluated and factored into power system planning and analysis. Coupled with alerts and warnings issued by the SWPC or CSWFC, monitors can provide the reinforcing information that a GMD event is imminent or in progress and can support operational decisions and actions. More information on GIC monitoring devices can be found in Chapter 9 (GIC Monitoring Devices).
I.7 Reduction Devices One potential mitigation approach is to reduce GIC flow through the use of series compensation on the line, and/or placing blocking capacitors or neutral resistors in the transformer’s neutral‐to‐ground connection. This report describes how such devices function, summarizes considerations for their appropriate placement, discusses their failure modes, and summarizes general functional requirements. More background and information GIC reduction devices can be found in Chapter 10 (GIC Reduction Devices).

Executive Summary
GMDTF Interim Report: Affects of Geomagnetic Disturbances on the Bulk Power System–February 2012 vi
I.8 Risk Management Approach Figure ES‐3 shows a phased approach to GMD risk mitigation. The first step in risk management for GMD is to develop a number of credible scenarios and the associated probability of occurrence (e.g., severe storm – once in 100 years; serious storm – once in 10 years). Next, determine each scenario’s effects on the bulk power system (e.g., loss of equipment, number of customers impacted, and duration of storm). Alternative approaches can be developed to eliminate or ameliorate the effects, and selections made for appropriate combinations of mitigation to minimize the total cost of mitigation and storm impact. The final step is to implement the solutions, adjust system procedures, track performance, and update the process as new information becomes available. Attachment 7 in the Appendix provides a view on risk management relating to GMD.
I.9 Conclusions The most likely worst‐case system impacts from a severe GMD event and corresponding GIC flow is voltage instability caused by a significant loss of reactive power support11 simultaneous to a dramatic increase in reactive power demand. Loss of reactive power support can be caused by the unavailability of shunt compensation devices (e.g., shunt capacitor banks, SVCs) due to harmonic distortions generated by transformer half‐cycle saturation. Noteworthy is that the lack of sufficient reactive power support, and unexpected relay operation removing shunt compensation devices was a primary contributor to the 1989 Hydro‐Québec GMD‐induced blackout. NERC recognizes that other studies have indicated a severe GMD event would result in the failure of a large number of EHV transformers. The work of the GMD Task Force documented in this report does not support this result for reasons detailed in Chapter 5 (Power Transformers), and Chapter 8 (Power System Analysis). Instead, voltage instability is the far more likely result of a severe GMD storm, although older transformers of a certain design and transformers near the end of operational life could experience damage, which is also detailed in Chapter 5 (Power Transformers).
11 Almost all bulk electric power in the United States is generated, transported and consumed in an alternating current (AC)
network. Elements of AC systems produce and consume two kinds of power: real power (measured in watts) and reactive
power (measured in volt‐amperes reactive or VAr). Real power accomplishes useful work (e.g., running motors and lighting
lamps). Reactive power supports the voltages that must be controlled for system reliability. Voltage collapse can occur when
there is insufficient reactive support in a wide area, leading to depressed voltages and eventually to blackout. The 2003
blackout experience shows that voltage collapse could result in blackout of hours in duration, but with minimal equipment
damage
Continuous Monitoring
System
Resiliency
Phase One
Assess and Baseline the Risk
Phase Two
Perform Technical and Programmatic Analysis
Phase Three
Develop Integrated Solutions
Phase Four
Implement Solutions and Adjust System Procedures
Figure ES‐3. Phased approach to GMD risk mitigation

Executive Summary
vii GMDTF Interim Report: Affects of Geomagnetic Disturbances on the Bulk Power System–February 2012
There are options available for system operators and asset managers to mitigate the impact from geomagnetic disturbances. These strategies, detailed in Chapters 11 (Operating Procedures), Chapter 12 (Managing Geomagnetic Disturbance Risks), and Attachment 7 (A View on Risk Management), provide industry participants with procedures and methods that should be implemented now to better manage the risks from geomagnetic disturbances. However, the margin gained by using these system operating procedures is dependent on number of factors, including (but not limited to) equipment characteristics, system design, and operating philosophy of the asset manager. The following conclusions are drawn from the literature included within this report:
What are the risks to operation of the bulk power system from a strong GMD?
The most significant issue for system operators to overcome a severe GMD event is to maintain voltage stability. As transformers absorb high levels of reactive power, protection and control systems may trip supporting reactive equipment due to the harmonic distortion of waveforms. In addition, maintaining the health of operating bulk power system assets during a geomagnetic storm is a key consideration for asset managers.
What transformers are at risk from a GMD?
The magnitude, frequency, and duration of GIC, as well as the geology and transformer design are key considerations in determining the amount of heating that develops in the windings and structural parts of a transformer. The effect of this heating on the condition, performance, and insulation life of the transformer is also a function of a transformer’s design and operational loading during a GMD event. This report reviews past transformer failures from strong GMD events and illustrates that some older transformer designs are more at risk for experiencing increased heating and VAr consumption than newer designs. Additionally, transformers that have high water content and high dissolved gasses and those nearing their dielectric end‐of‐life may also have a risk of failure.
What are NERC’s next steps for identifying the risks from strong GMD?
Planners and operators require the technical tools to model GIC flows and subsequent reactive power losses to develop mitigating solutions, as necessary. This tool development includes GIC flow calculations for a variety of system conditions and configurations, test wavefronts representative of GMD for a variety of latitudes, and suitable transient and thermal equipment models. NERC, in collaboration with Electrical Power Research Institute (EPRI), will follow the work plan established in the recommendations section of this report. All results of will be open source and freely available. As work progresses to identify specific vulnerabilities, all assumptions and methods used for planning and operating studies need to be available, transparent, and validated through existing interconnection reliability modeling groups.

Executive Summary
GMDTF Interim Report: Affects of Geomagnetic Disturbances on the Bulk Power System–February 2012 viii
I.10 Recommended Follow-on Actions for NERC Table ES‐1 identifies four high‐level recommended actions for NERC to respond to the conclusions documented in this report. Each of the four recommended actions below are supported by a number of separate work plan tasks, including their timeline for completion, found in Chapter 13 (Recommendations). Further, Chapter 13 also provides detailed recommendations for electric industry asset owners, government agencies, and policy makers.
Table ES‐1: Recommended Follow‐on Actions for NERC
• NERC will support the development of equipment vulnerability assessment tools, enhance the definition of the reference solar storm, and develop open source tools and methods to enhance industry response and mitigation to the threat from a solar storm.
Improved tools for industry planners to develop GMD mitigation strategies
• NERC will enhance the existing Reliability Coordinator notification procedures for GMD watches, alerts, and warnings. Further, NERC will work in partnership with industry to update reliability guidelines to provide stakeholders best practices to monitor and mitigate the impact of geomagnetically induced currents in real‐time operations.
Improved tools for system operators to manage GMD impacts
• NERC will raise awareness of the impact of geomagnetic disturbances on the bulk power system by conducting focused training for industry and policy makers and by developing information exchanges between industry and GMD researchers.
Develop education and information exchanges between researchers and industry
• NERC and the industry will investigate potential enhancements to existing NERC Reliability Standards, as well as the need for additional NERC Reliability Standards development projects, to ensure the continued reliable operation of the bulk power system in North America.
Review the need for enhanced NERC Reliability Standards

Chapter 1–Space Weather and the Power System
1 GMDTF Interim Report: Affects of Geomagnetic Disturbances on the Bulk Power System–February 2012
1. Space Weather and the Power System
1.1 Introduction This chapter provides insights into the risks to bulk power system reliability from space weather and historical accounts of significant space weather activity.
1.2 Threat Posed by Space Weather to the Power System Space weather is a consequence of the interaction of the sun, Earth’s magnetic field and the atmosphere. Space weather can create geomagnetic storms that affect Earth. The active elements of space weather are particles, electromagnetic energy, and magnetic fields. Terrestrial weather is local. Effects from geomagnetic storms are a global phenomenon. The sun undergoes a 22‐year cycle where the polarities of the north and south poles reverse every 11 years. Most solar storms occur during a four‐ to six‐year period referred to as “solar maximum.” The next solar cycle ‐ Solar Cycle 24 ‐ is expected to reach its maximum phase in 2013 (Figure 1 shows the sunspot progression through October 2011). However, the largest historical solar storms have not occurred at the peak of the “solar maximum.” Although the probability of a solar storm occurrence is greater during the peak of the solar cycle, severe solar storms can occur at any time in the cycle. The following is a summary of space weather phenomena and their potential effect on the bulk power system.12
1.2.1 Solar Flares Solar flares are intense, temporary releases of energy typically occurring in “active” regions on the sun. Flares are seen as very bright areas in optical wavelengths and as bursts of noise at X‐ray and radio wavelengths; they can last from minutes to hours. Flares are the solar system’s largest explosive events and can be equivalent to 10 million volcanic eruptions. They radiate across the electromagnetic spectrum, from gamma rays to X‐rays, through visible light to kilometer‐long radio waves. This radiation travels at the speed of light—186,000 miles/second (300,000 kilometers/second)—so X‐rays, gamma rays, and radio waves are the first evidence of a flare to reach Earth. The trip from the sun takes about eight minutes. This electromagnetic radiation does not significantly impact power grid operations. Severe solar flares (i.e., level K7 or greater) occur at an approximate frequency of 175 per 11‐year solar cycle, with typically eight to ten extreme flares (i.e., K8‐K9) during this cycle.
12 The bulk power system consists of the interconnected system of power generation and transmission facilities, as well as the control systems that operate these facilities.

Chapter 1–Space Weather and the Power System
GMDTF Interim Report: Affects of Geomagnetic Disturbances on the Bulk Power System–February 2012 2
Figure 1: The International Solar Energy Society (ISES) solar sunspot number progression through
October 201113
1.2.2 Radiation Storms Typically associated with large solar flares, radiation storms can affect Earth within 30 minutes of a major flare’s peak. During such an event, energetic solar particles (primarily protons) are released from the flare site. Some of these particles spiral down Earth's magnetic field line and penetrate the upper layers of the atmosphere. Once the upper atmosphere is penetrated, the energetic particles may produce a significant increase in the radiation environment. Radiation storms are a significant concern for satellite and space operations, but do not present a threat to the bulk power system. Strong storms only occur about 10 times per 11‐year solar cycle. Severe conditions are rare, with typically three to five storms per cycle.
1.2.3 Geomagnetic Storms Geomagnetic storms occur on Earth one to four days after a flare or other eruption occurs on the sun and direct at Earth. A CME, which is a cloud of solar material and magnetic fields that ejects from the sun and moves at a rate of about one to five million miles per hour, is usually associated with a large flare. If CMEs are Earth‐directed, they collide with Earth’s magnetosphere and cause geomagnetic induced current (GIC) flows that can potentially affect the operation of power system equipment (see Figure 2).14 On average, there are 200 days during the 11‐year solar cycle with strong to severe geomagnetic storms and approximately four days of extreme conditions.
13 NOAA/Space Weather Prediction Center Solar Cycle Progression Tracking website, last updated October 31, 2011: http://www.swpc.noaa.gov/SolarCycle/
14 Equipment impacted by previous storms includes transformers, circuit breakers, generators, and protective devices.

Chapter 1–Space Weather and the Power System
3 GMDTF Interim Report: Affects of Geomagnetic Disturbances on the Bulk Power System–February 2012
Figure 2: Graphic depiction of a coronal mass ejection
The degree to which a GMD storm impacts the power system and the power system equipment depends on a number of factors, including:
Magnitude of the magnetic field and its orientation
Latitude
Directional orientation, resistance, and length of transmission lines
Geology of the local area, including the electrical conductivity of the soil
Proximity to the ocean or large bodies of water
Design of power system and power system equipment GMD can have had a wide range of impacts on power apparatus and power system operations. The effects on apparatus range from nuisance events, such as tripping of electrical equipment, radio interference, and control malfunctions, to large‐scale events, such as voltage and reactive power fluctuations, local disruption of service, limited equipment failure, and potential voltage instability resulting in uncontrolled cascading of the bulk power system.
1.3 Historical Accounts of Significant Space Weather Activity The effects of space weather have been experienced on Earth, and in more recent history, on the bulk power system. The following are examples of such effects.
1.3.1 The Carrington Event of 1859 The largest recorded geomagnetic disturbance event was the Carrington Event of 1859. Richard Carrington, a British astronomer, observed an intense flare resulting in aurora observations as far south as Panama. The Carrington Event actually consisted of two separate solar
Ionosphere
Magnetosphere
Energetic Charged Particles
IonosphereHeliosphere
Chapter 1–Space Weather and the Power System
GMDTF Interim Report: Affects of Geomagnetic Disturbances on the Bulk Power System–February 2012 4
disturbances, both of which produced widespread observable auroras in North America as documented in various newspaper reports at the time (the bulk power system was not in existence in 1859). The first magnetic disturbance started August 28, 1859. Telegraph operations were disrupted in North America and Europe from the evening of August 28 through August 29, 1859. The second disturbance began at 0440 Universal Time (UT), on September 2, 1859, and a major disturbance followed immediately.15 Telegraph operations in Europe were affected by the initial magnetic disturbance, though no effects were seen in North America for the initial disturbance as it occurred during the night when telegraphs were not operating.16
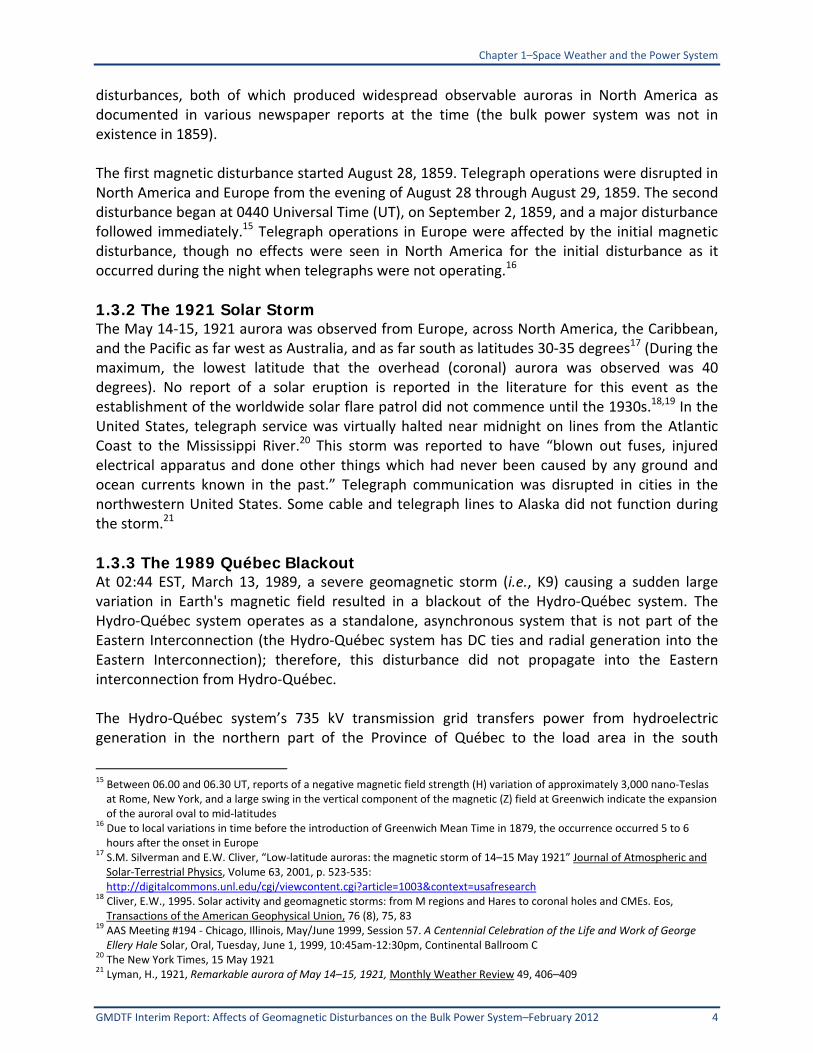
1.3.2 The 1921 Solar Storm The May 14‐15, 1921 aurora was observed from Europe, across North America, the Caribbean, and the Pacific as far west as Australia, and as far south as latitudes 30‐35 degrees17 (During the maximum, the lowest latitude that the overhead (coronal) aurora was observed was 40 degrees). No report of a solar eruption is reported in the literature for this event as the establishment of the worldwide solar flare patrol did not commence until the 1930s.18,19 In the United States, telegraph service was virtually halted near midnight on lines from the Atlantic Coast to the Mississippi River.20 This storm was reported to have “blown out fuses, injured electrical apparatus and done other things which had never been caused by any ground and ocean currents known in the past.” Telegraph communication was disrupted in cities in the northwestern United States. Some cable and telegraph lines to Alaska did not function during the storm.21
1.3.3 The 1989 Québec Blackout At 02:44 EST, March 13, 1989, a severe geomagnetic storm (i.e., K9) causing a sudden large variation in Earth's magnetic field resulted in a blackout of the Hydro‐Québec system. The Hydro‐Québec system operates as a standalone, asynchronous system that is not part of the Eastern Interconnection (the Hydro‐Québec system has DC ties and radial generation into the Eastern Interconnection); therefore, this disturbance did not propagate into the Eastern interconnection from Hydro‐Québec. The Hydro‐Québec system’s 735 kV transmission grid transfers power from hydroelectric generation in the northern part of the Province of Québec to the load area in the south
15 Between 06.00 and 06.30 UT, reports of a negative magnetic field strength (H) variation of approximately 3,000 nano‐Teslas at Rome, New York, and a large swing in the vertical component of the magnetic (Z) field at Greenwich indicate the expansion of the auroral oval to mid‐latitudes
16 Due to local variations in time before the introduction of Greenwich Mean Time in 1879, the occurrence occurred 5 to 6 hours after the onset in Europe
17 S.M. Silverman and E.W. Cliver, “Low‐latitude auroras: the magnetic storm of 14–15 May 1921” Journal of Atmospheric and Solar‐Terrestrial Physics, Volume 63, 2001, p. 523‐535: http://digitalcommons.unl.edu/cgi/viewcontent.cgi?article=1003&context=usafresearch
18 Cliver, E.W., 1995. Solar activity and geomagnetic storms: from M regions and Hares to coronal holes and CMEs. Eos, Transactions of the American Geophysical Union, 76 (8), 75, 83
19 AAS Meeting #194 ‐ Chicago, Illinois, May/June 1999, Session 57. A Centennial Celebration of the Life and Work of George Ellery Hale Solar, Oral, Tuesday, June 1, 1999, 10:45am‐12:30pm, Continental Ballroom C
20 The New York Times, 15 May 1921 21 Lyman, H., 1921, Remarkable aurora of May 14–15, 1921, Monthly Weather Review 49, 406–409
Chapter 1–Space Weather and the Power System
5 GMDTF Interim Report: Affects of Geomagnetic Disturbances on the Bulk Power System–February 2012
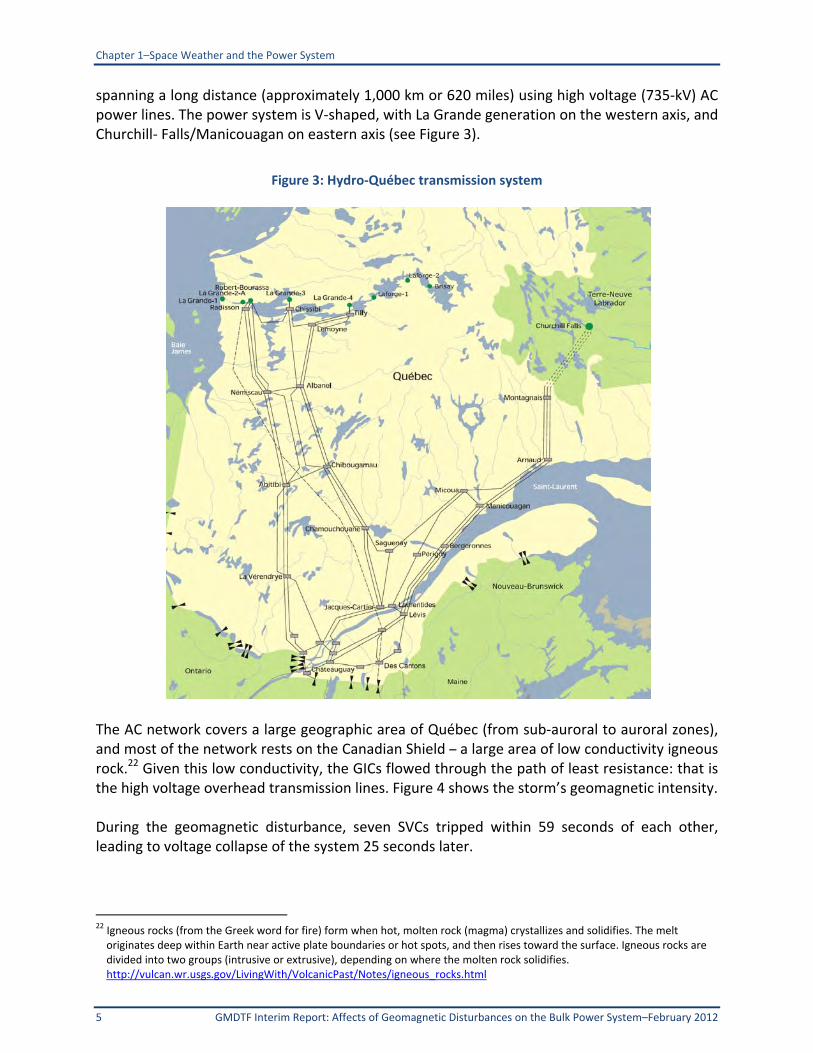
spanning a long distance (approximately 1,000 km or 620 miles) using high voltage (735‐kV) AC power lines. The power system is V‐shaped, with La Grande generation on the western axis, and Churchill‐ Falls/Manicouagan on eastern axis (see Figure 3).
Figure 3: Hydro‐Québec transmission system
The AC network covers a large geographic area of Québec (from sub‐auroral to auroral zones), and most of the network rests on the Canadian Shield – a large area of low conductivity igneous rock.22 Given this low conductivity, the GICs flowed through the path of least resistance: that is the high voltage overhead transmission lines. Figure 4 shows the storm’s geomagnetic intensity. During the geomagnetic disturbance, seven SVCs tripped within 59 seconds of each other, leading to voltage collapse of the system 25 seconds later.
22 Igneous rocks (from the Greek word for fire) form when hot, molten rock (magma) crystallizes and solidifies. The melt originates deep within Earth near active plate boundaries or hot spots, and then rises toward the surface. Igneous rocks are divided into two groups (intrusive or extrusive), depending on where the molten rock solidifies. http://vulcan.wr.usgs.gov/LivingWith/VolcanicPast/Notes/igneous_rocks.html

Chapter 1–Space Weather and the Power System
GMDTF Interim Report: Affects of Geomagnetic Disturbances on the Bulk Power System–February 2012 6
Figure 4: Geomagnetic intensity–March 1989 storm
The voltage collapse and corresponding blackout of the Hydro‐Québec network was caused by the effects of harmonics resulting from half‐cycle saturation of power transformers. Unanticipated tripping of multiple SVCs and corresponding system separation were the primary causes of the issues that were experienced during the GMD event. Equipment damage was the result of temporary overvoltage caused by load shedding and system separation, and not directly by GIC flow. Among the major equipment that was damaged were two generator step‐up units (GSU) transformers located at La Grande 4 generating station, and a shunt reactor at Némiscau, which were reported to have suffered dielectric damage due to overvoltage when the system separated. The SVCs at Albanel and Némiscau suffered only minor damage. The SVC phase‐C transformer at Chibougamau substation was also damaged by temporary overvoltage following system separation. Surge arrester failures were also reported.23 Additional details on this event are included in Chapter 6.
1.3.4 The 2003 Halloween Solar Storms The largest recent storm was during Solar Cycle 23,24 which began in May 1996 and peaked in April 2000. Seventeen major flares erupted on the sun between October 19, 2003, and November 5, 2003 (often called the 2003 Halloween Solar Storms). A wide range of effects on human activities and technological systems were observed. The most extensively reported effects resulted from the interaction of energetic particles with spacecraft operations and electronics. A number of specific deep space missions and near‐Earth satellites were also affected.25 Airline routes and schedules were significantly affected due to communication degradation in the daylight and Polar Regions and concerns about increased radiation exposure at high latitudes.
23NERC report, “March 13, 1989 Geomagnetic Disturbances” http://www.nerc.com/files/1989‐Quebec‐Disturbance.pdf 24 Solar cycles typically last approximately 11 years in duration from trough to peak in activity. 25 United States National Oceanic and Atmospheric Administration (NOAA) magazine: http://www.magazine.noaa.gov/stories/mag131b.htm

Chapter 1–Space Weather and the Power System
7 GMDTF Interim Report: Affects of Geomagnetic Disturbances on the Bulk Power System–February 2012
The electric power industry in North America experienced some effects. Impacts and actions reported by grid operators included high levels of neutral current, a capacitor trip in the Pacific Northwest (known to be GIC susceptible), and some transformer heating in the eastern United States.26 GIC impacts were more significant in Northern Europe. On October 30, 2003, a three‐phase large power transformer in the power grid in the south of Sweden was subjected to GIC flows estimated to be in the 330 amps. A blackout that ranged in duration between 20 and 50 minutes followed that resulted from tripping of a 130 kV line. The line trip was caused by the operation of a relay with a higher sensitivity to the third harmonic associated with the transformers half‐cycle saturation. No transformer issues were reported to be associated with this GIC storm.
26 United States National Oceanic and Atmospheric Administration (NOAA) Space Weather Prediction Center (SWPC)
assessment of 2003 Halloween Storm Outbreak: http://www.swpc.noaa.gov/Services/HalloweenStorms_assessment.pdf

Chapter 2–Monitoring and Predicting Space Weather
GMDTF Interim Report: Affects of Geomagnetic Disturbances on the Bulk Power System–February 2012 8
2. Monitoring and Predicting Space Weather
2.1 Introduction In the United States, the responsibility for monitoring and providing services on space weather rests with the Space Weather Prediction Center (SWPC), located in Boulder, Colorado.27 The SWPC is part of the National Oceanic and Atmospheric Administration (NOAA) of the Department of Commerce. SWPC provides real‐time monitoring and forecasting of solar and geophysical events that affect satellites, power grids, communications, navigation, and many other technological systems. SWPC is also the primary warning center for the International Space Environment Service28 (ISES) and works with national and international partners to share data, products, and services. Further, magnetometers are operated by the United States Geological Survey (USGS), which operates the National Geomagnetism Program monitoring Earth’s magnetic field at magnetic observatories and distributes magnetometer data in real‐time.29 In Canada, the Canadian Space Weather Forecast Centre30 (CSWFC), located in Ottawa, Ontario, is responsible for monitoring and providing services on space weather. The CSWFC is part of Natural Resources Canada (NRCan).31 Similar to the SWPC in the United States, the CSWFC provides forecast services to various operating entities within Canada. Also, similar to the SWPC, the CSWFC is a primary warning center for the ISES. Another NRCan affiliate, the Geological Survey of Canada32 (GSC) operates a network of 15 magnetic observatories, which use magnetometers to gather data on Earth’s geomagnetic field. Satellites and Earth‐based observation sites monitor solar activity to detect active regions, solar flares and other events. The information is used by NRCan scientists, who work with several Canadian universities, the Canadian Space Agency,33 and the National Research Council34 to provide near real‐time forecasting of space weather events through the Space Weather Canada website.
27The NOAA Space Weather Prediction Center can be accessed at: http://www.swpc.noaa.gov . 28The International Space Environment Service (ISES) is a permanent service of the Federations of Astronomical and Geophysical Data Analysis Services under the support of the International Union of Radio Science (URSI) in association with the International Astronomical Union (IAU) and the International Union of Geodesy and Geophysics (IUGG). http://www.ises‐spaceweather.org/
29 The USGS National Geomagnetism Program: http://geomag.usgs.gov/ 30The Canadian Space Weather Forecast Centre at Space Weather Canada can be accessed at: http://www.spaceweather.ca/index‐eng.php
31 Natural Resources Canada can be accessed at: http://www.nrcan.gc.ca/home 32The Geological Survey of Canada is a part of the Earth Sciences Sector of Natural Resources Canada.: http://gsc.nrcan.gc.ca/index_e.php
33 Established in March 1989, the Canadian Space Agency (CSA) was created through an Act of the Canadian Parliament in December 1990: http://www.asc‐csa.gc.ca/eng/about/default.asp
34The National Research Council’s mission is to improve government decision making and public policy, increase public understanding, and promote the acquisition and dissemination of knowledge in matters involving science, engineering, technology, and health. The Research Council's independent expert reports and other scientific activities inform policies and actions that have the power to improve the lives of people in the U.S. and around the world. http://www.nationalacademies.org/nrc/
Chapter 2–Monitoring and Predicting Space Weather
9 GMDTF Interim Report: Affects of Geomagnetic Disturbances on the Bulk Power System–February 2012
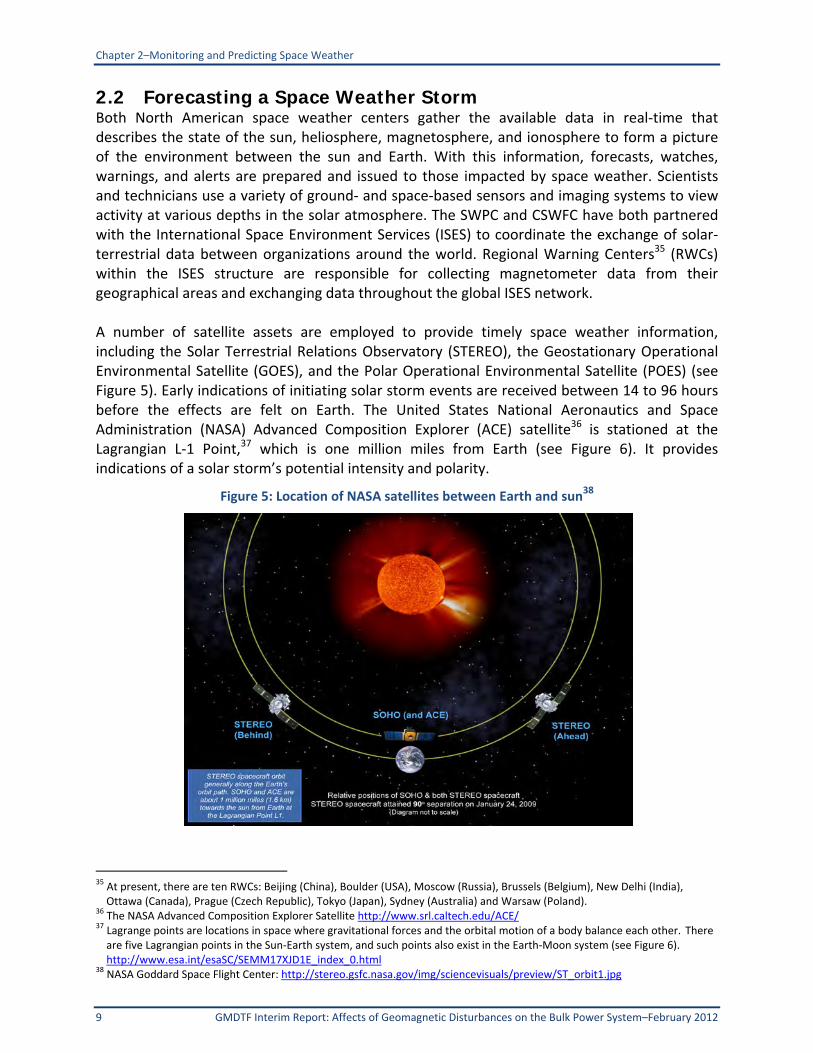
2.2 Forecasting a Space Weather Storm Both North American space weather centers gather the available data in real‐time that describes the state of the sun, heliosphere, magnetosphere, and ionosphere to form a picture of the environment between the sun and Earth. With this information, forecasts, watches, warnings, and alerts are prepared and issued to those impacted by space weather. Scientists and technicians use a variety of ground‐ and space‐based sensors and imaging systems to view activity at various depths in the solar atmosphere. The SWPC and CSWFC have both partnered with the International Space Environment Services (ISES) to coordinate the exchange of solar‐terrestrial data between organizations around the world. Regional Warning Centers35 (RWCs) within the ISES structure are responsible for collecting magnetometer data from their geographical areas and exchanging data throughout the global ISES network. A number of satellite assets are employed to provide timely space weather information, including the Solar Terrestrial Relations Observatory (STEREO), the Geostationary Operational Environmental Satellite (GOES), and the Polar Operational Environmental Satellite (POES) (see Figure 5). Early indications of initiating solar storm events are received between 14 to 96 hours before the effects are felt on Earth. The United States National Aeronautics and Space Administration (NASA) Advanced Composition Explorer (ACE) satellite36 is stationed at the Lagrangian L‐1 Point,37 which is one million miles from Earth (see Figure 6). It provides indications of a solar storm’s potential intensity and polarity.
Figure 5: Location of NASA satellites between Earth and sun38
35 At present, there are ten RWCs: Beijing (China), Boulder (USA), Moscow (Russia), Brussels (Belgium), New Delhi (India), Ottawa (Canada), Prague (Czech Republic), Tokyo (Japan), Sydney (Australia) and Warsaw (Poland).
36 The NASA Advanced Composition Explorer Satellite http://www.srl.caltech.edu/ACE/ 37 Lagrange points are locations in space where gravitational forces and the orbital motion of a body balance each other. There are five Lagrangian points in the Sun‐Earth system, and such points also exist in the Earth‐Moon system (see Figure 6). http://www.esa.int/esaSC/SEMM17XJD1E_index_0.html
38 NASA Goddard Space Flight Center: http://stereo.gsfc.nasa.gov/img/sciencevisuals/preview/ST_orbit1.jpg
Chapter 2–Monitoring and Predicting Space Weather
GMDTF Interim Report: Affects of Geomagnetic Disturbances on the Bulk Power System–February 2012 10
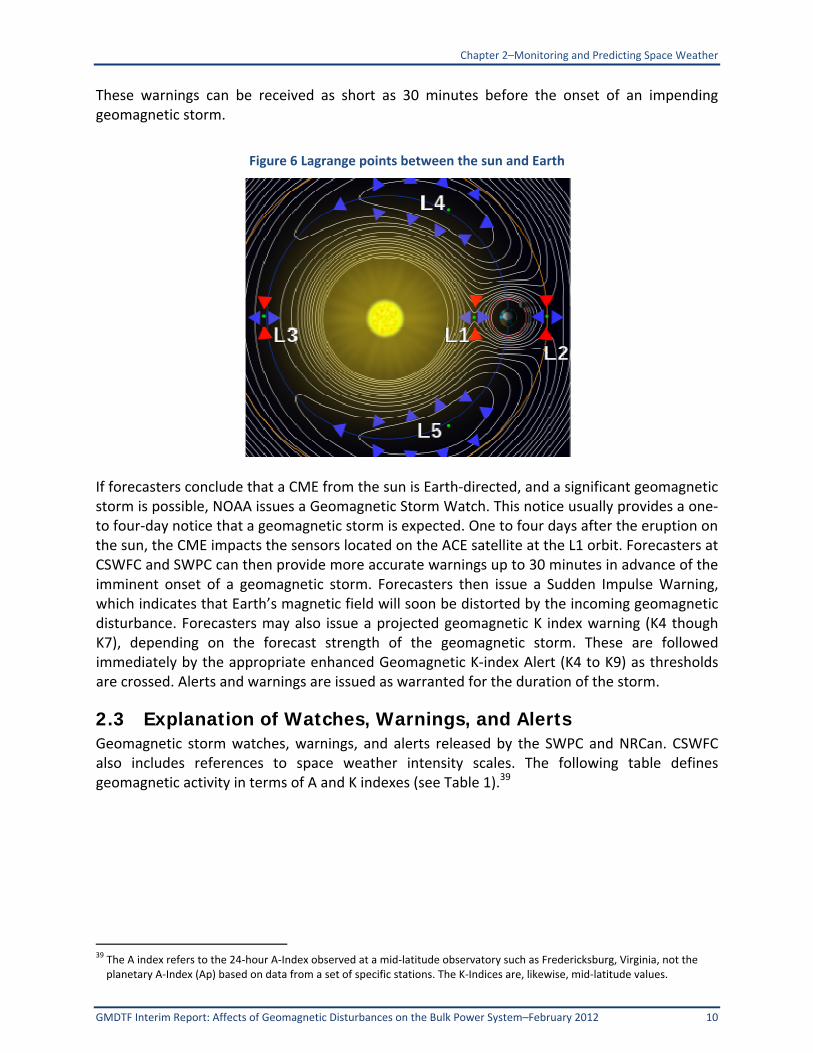
These warnings can be received as short as 30 minutes before the onset of an impending geomagnetic storm.
Figure 6 Lagrange points between the sun and Earth
If forecasters conclude that a CME from the sun is Earth‐directed, and a significant geomagnetic storm is possible, NOAA issues a Geomagnetic Storm Watch. This notice usually provides a one‐ to four‐day notice that a geomagnetic storm is expected. One to four days after the eruption on the sun, the CME impacts the sensors located on the ACE satellite at the L1 orbit. Forecasters at CSWFC and SWPC can then provide more accurate warnings up to 30 minutes in advance of the imminent onset of a geomagnetic storm. Forecasters then issue a Sudden Impulse Warning, which indicates that Earth’s magnetic field will soon be distorted by the incoming geomagnetic disturbance. Forecasters may also issue a projected geomagnetic K index warning (K4 though K7), depending on the forecast strength of the geomagnetic storm. These are followed immediately by the appropriate enhanced Geomagnetic K‐index Alert (K4 to K9) as thresholds are crossed. Alerts and warnings are issued as warranted for the duration of the storm.
2.3 Explanation of Watches, Warnings, and Alerts Geomagnetic storm watches, warnings, and alerts released by the SWPC and NRCan. CSWFC also includes references to space weather intensity scales. The following table defines geomagnetic activity in terms of A and K indexes (see Table 1).39
39 The A index refers to the 24‐hour A‐Index observed at a mid‐latitude observatory such as Fredericksburg, Virginia, not the planetary A‐Index (Ap) based on data from a set of specific stations. The K‐Indices are, likewise, mid‐latitude values.

Chapter 2–Monitoring and Predicting Space Weather
11 GMDTF Interim Report: Affects of Geomagnetic Disturbances on the Bulk Power System–February 2012
Table 1: NOAA SWPC indices
Solar Activity A Index Level K Index Level
Quiet A Index <7, Usually no K‐indices >2
Unsettled 7 < A Index < 15, Usually no K‐indices > 3
Active 15 < A Index < 30, A few K‐indices of 4
Minor Geomagnetic Storm 30 < A Index < 50, K‐indices mostly 4 and 5
Major Geomagnetic Storm 50 < A Index <100 K‐indices mostly 5 and 6
Severe Geomagnetic Storm A Index>100 K‐indices 7 or greater
The Kp index scale40 summarizes the global level of geomagnetic activity, though it is not always understandable for those affected by the space environment.41 The NOAA G‐scale was designed to correspond to the significance of effects of geomagnetic storms. SWPC uses estimates of the planetary average Kp index to determine geomagnetic storm (space weather scale) level (see Table 2).
Table 2: NOAA space weather storm levels
Kp Index NOAA Space Weather Scale Geomagnetic Storm Levels
Kp=5 G1 (Minor)
Kp=6 G2 (Moderate)
Kp=7 G3 (Strong)
Kp=8 G4 (Severe)
Kp=9 G5 (Extreme)
Kp index levels of zero to four are below geomagnetic storm levels and considered to be a G0 event.42 Solar flare radio blackout alerts are issued when a large solar flare is observed on the sun. Within minutes, radiation storm warnings are issued if forecasters conclude that the eruption on the sun has resulted in accelerated solar protons toward Earth. Radiation storm alerts are issued when the solar protons measured on the NOAA Geostationary Satellite exceed alert thresholds.
40Background on the NOAA K‐Index can be found here: http://www.swpc.noaa.gov/info/Kindex.html 41 The official planetary Kp index is derived by calculating a weighted average of K‐indices from a network of geomagnetic
observatories. 42 The complete NOAA Space Weather Scales can be found at: http://www.spaceweather.gov/NOAAscales/
Chapter 2–Monitoring and Predicting Space Weather
GMDTF Interim Report: Affects of Geomagnetic Disturbances on the Bulk Power System–February 2012 12
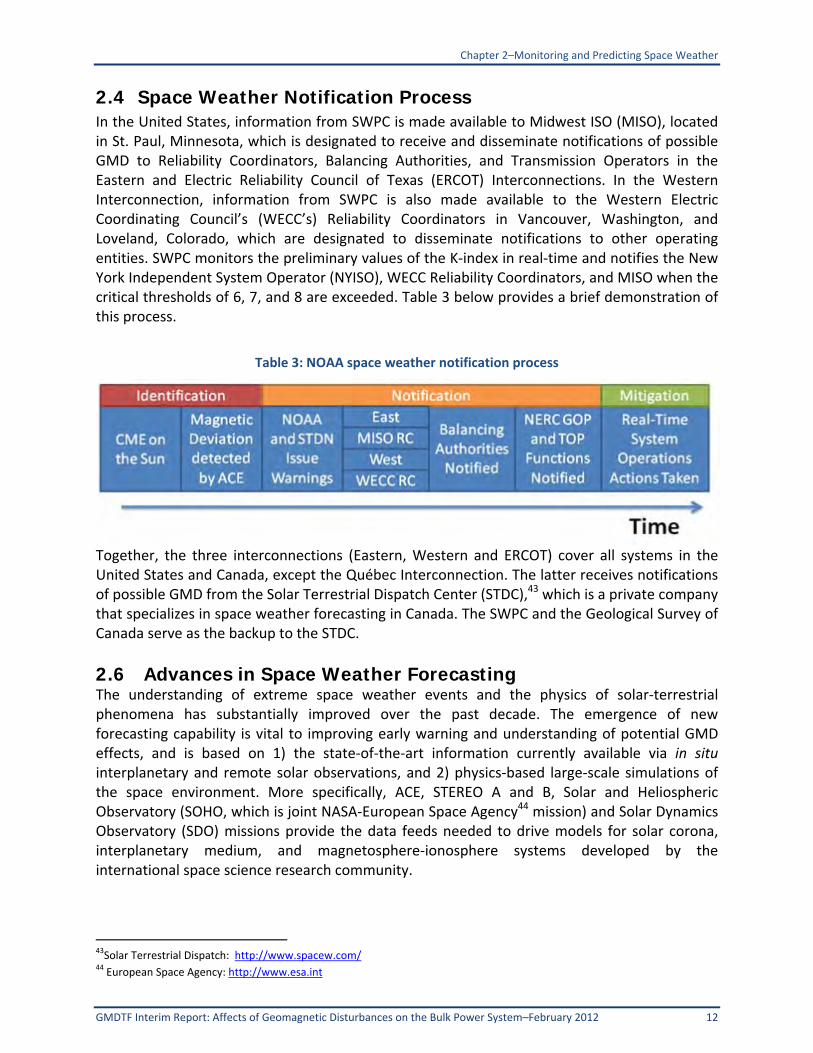
2.4 Space Weather Notification Process In the United States, information from SWPC is made available to Midwest ISO (MISO), located in St. Paul, Minnesota, which is designated to receive and disseminate notifications of possible GMD to Reliability Coordinators, Balancing Authorities, and Transmission Operators in the Eastern and Electric Reliability Council of Texas (ERCOT) Interconnections. In the Western Interconnection, information from SWPC is also made available to the Western Electric Coordinating Council’s (WECC’s) Reliability Coordinators in Vancouver, Washington, and Loveland, Colorado, which are designated to disseminate notifications to other operating entities. SWPC monitors the preliminary values of the K‐index in real‐time and notifies the New York Independent System Operator (NYISO), WECC Reliability Coordinators, and MISO when the critical thresholds of 6, 7, and 8 are exceeded. Table 3 below provides a brief demonstration of this process.
Table 3: NOAA space weather notification process
Together, the three interconnections (Eastern, Western and ERCOT) cover all systems in the United States and Canada, except the Québec Interconnection. The latter receives notifications of possible GMD from the Solar Terrestrial Dispatch Center (STDC),43 which is a private company that specializes in space weather forecasting in Canada. The SWPC and the Geological Survey of Canada serve as the backup to the STDC.
2.6 Advances in Space Weather Forecasting The understanding of extreme space weather events and the physics of solar‐terrestrial phenomena has substantially improved over the past decade. The emergence of new forecasting capability is vital to improving early warning and understanding of potential GMD effects, and is based on 1) the state‐of‐the‐art information currently available via in situ interplanetary and remote solar observations, and 2) physics‐based large‐scale simulations of the space environment. More specifically, ACE, STEREO A and B, Solar and Heliospheric Observatory (SOHO, which is joint NASA‐European Space Agency44 mission) and Solar Dynamics Observatory (SDO) missions provide the data feeds needed to drive models for solar corona, interplanetary medium, and magnetosphere‐ionosphere systems developed by the international space science research community.
43Solar Terrestrial Dispatch: http://www.spacew.com/ 44 European Space Agency: http://www.esa.int

Chapter 2–Monitoring and Predicting Space Weather
13 GMDTF Interim Report: Affects of Geomagnetic Disturbances on the Bulk Power System–February 2012
The new forecasting capability enables a great variety of space weather information not available via any traditional space weather information sources. Importantly, numerical forecasting of the near‐space environment conditions can be used to tailor information specifically to industry needs. The new forecasts are able not only to characterize the general level of global geomagnetic activity, but also to provide information about the local geoelectric field induced on the surface of Earth and to predict actual GIC flows through individual nodes of the transmission system. The new forecasting capacity is demonstrated by the Solar Shield system residing at the NASA Goddard Space Flight Center (Pulkkinen et al., 2009).45 The Solar Shield project was launched to design and establish a forecasting system that can be used to mitigate the adverse impacts of GIC flows on the North American bulk power system. The forecasting system uses a two‐level approach that provides two different forecast lead‐times needed to meet the identified system requirements. The two different lead‐times are obtained by using extensive heliospheric and magnetospheric magnetohydrodynamic (MHD) simulations driven by remote solar and in situ solar wind observations, respectively. The Solar Shield46 system has been running in real‐time since February 2008 and further development of the system is underway. Continued collaboration with industry is important to maximize the future applications of the system. Development of current GIC prediction models is dependent on data from GIC monitoring sites. One of the central goals is to provide Solar Shield coverage for any interested collaborator. Solar Shield output is being integrated into the European space weather infrastructure via collaboration under European Union Framework Program 7 project European Risk from Geomagnetically Induced Currents (EURISGIC).47
Figure 7: Process used to generate short lead‐time NASA Solar Shield GIC forecasts
45 The system is a collaborative activity between the NASA GSFC and the Electric Power Research Institute (EPRI). 46 More details and a collection of Solar Shield documentation can be found at
http://ccmc.gsfc.nasa.gov/Solar_Shield/Solar_Shield.html. See attachment 2 for more information on the future of space
weather forecasting. 47European Risk from Geomagnetically Induced Currents Project http://www.eurisgic.eu

Chapter 3–Existing Response Capability
GMDTF Interim Report: Affects of Geomagnetic Disturbances on the Bulk Power System–February 2012 14
3. Existing Response Capability
3.1 Introduction To help stakeholders address GMD risks and vulnerabilities, NERC issued an alert in the form of an advisory in May 2011.48 This advisory outlined action that the industry should consider using given each stakeholders system topology, location, ground resistivity, equipment susceptibility to GIC flows, and experience with past GMD events. The actions are divided into three categories: 1) operations planning actions, 2) real‐time operations actions, and 3) long‐term stakeholder actions. The operations planning actions are intended for the time period after SWPC or STDC predicts a severe GMD event (K>6), but before a severe GMD warning is issued. The real‐time operations actions are intended for the time period after receiving a severe GMD warning (K>6, about 30‐60 minutes before storm impact), but before detection of increased GIC levels. The long‐term actions are intended to prepare for future occurrences of severe GMD. Attachment 3 contains the text of the alert, and Attachment 4 contains more information on current GMD response procedures.
3.2 Limitations of the Existing Response Capability 3.2.1 Enhancing Situational Awareness Operating measures suggested in NERC’s GMD alert are based on system stability considerations, reactive consumption of transformers experiencing half‐cycle saturation, and the potential loss of reactive compensation due to harmonic overloading of reactive power devices at a time when reactive compensation needs are high. These measures are based on minimal operator visibility of the location and magnitude of GIC, which can only be achieved by simulation of GIC flows on the network and extensive monitoring during an event. These simulations require an understanding of equipment vulnerability, as well as a clear picture of legitimate equipment tripping due to harmonics injected by transformer saturation. However, extensive simulation capabilities and monitoring are not widely available and the existing operating procedures may not be sufficient to successfully respond to all GMD events. NERC recommends development of operational planning and operator tools to enhance situational awareness of the impacts of GMD.
3.2.2 Categorizing Assets to Aid Mitigation In the absence of GIC visibility (monitoring) or extensive contingency simulations, it is still possible to improve safe posture measures. Identifying the general vulnerability of a fleet of power transformers to core half‐cycle saturation and, in some cases, possible winding/structural parts heating due to GIC flows can be best determined by:
1) Determining the possible levels and duration of the GIC pulses to which transformers would be subjected.
2) Evaluating the general vulnerability of the transformers to core half‐cycle saturation, based on the voltage rating, core design, and age.
48NERC, “Industry Advisory, Preparing for Geo‐Magnetic Disturbances,” Initial Distribution: May 10, 2011, http://www.nerc.com/fileUploads/File/Events%20Analysis/A‐2011‐05‐10‐01_GMD_FINAL.pdf.

Chapter 3–Existing Response Capability
15 GMDTF Interim Report: Affects of Geomagnetic Disturbances on the Bulk Power System–February 2012
3) Performing appropriate magnetic and thermal calculations of detailed transformer designs identified as vulnerable to heating to determine the GIC withstand capability of these transformer designs, given magnitude and duration of the GIC versus loading.
4) Defining acceptable levels of risk tolerance for asset managers based on operating philosophy.
Once the above steps are taken, then:
Identify low priority assets: These system assets are unaffected by GIC flows because they are connected to high‐voltage backbone transmission with delta connections, and are single‐point grounded or ungrounded.
Identify medium priority assets: These system assets are somewhat vulnerable to half‐cycle core saturation by high levels of GIC (e.g., three‐phase, three‐leg, core‐type transformers).
Identify high priority assets: These system assets are most vulnerable to half‐cycle core saturation by lower levels of GIC (e.g., shell‐form transformers and core‐form transformers other than three‐phase transformers with three‐legged cores).
Additionally, using traditional power flow analysis, planners should complete simulations that anticipate the possibility of system operation where only low‐ and medium‐priority assets are available. This might represent a possible end‐state of a severe GMD event, where generation and load rejection is used to prevent system collapse. For more moderate GMD events, planners should identify contingencies where the tripping of capacitor banks and SVCs can result in high‐priority assets being taken off‐line. In most cases, capacitor banks and SVCs will trip before a high‐priority transformer is stressed by GIC effects. Once the studies are complete, planning for operational procedures and equipment mitigation should be considered based on the potential risk to reliability for an individual organization and expected outcomes. More on this approach is provided in the following chapters of this assessment.

Chapter 4–GMD Credible Threat Definition
GMDTF Interim Report: Affects of Geomagnetic Disturbances on the Bulk Power System–February 2012 16
4. Credible Threat Concept and GIC Calculation
4.1 Introduction To assess the geomagnetic effects on power systems and associated equipment requires knowledge about the magnitudes and duration of GIC pulses. The potential impacts of GIC on power transformers, as well as protection and control systems, are addressed in Chapters 5 and 6, respectively. The purpose of this chapter is to show how GIC magnitudes can be calculated and amplitudes that can be expected at different latitudes. In particular, this section considers the “one in 100 year” storm scenario as a potential design criterion for the power system.
4.2 Definition of Design Basis Credible Threat To reasonably set expectations for the industry to establish its response plan, a definition of a credible threat is needed that can be used as a guide for development of multiple classes of mitigation actions. Therefore, the following definition is designed to provide transmission system planners, engineers, and operators with an approach to address the space weather threat that is consistent with current design practices, facility ratings methods, and NERC Reliability Standards.
The design basis credible threat (DBCT) for GMD events can be characterized as the magnitudes and corresponding durations of GIC pulses sustained over a period of time that have historical and geographical significance for a region or operating entity, and are substantiated by data measurement and/or engineering models. The DBCT shall be identified by asset owners and operators for their specific regions, and be used as the minimum system design requirement for equipment specifications, hardening, and system resilience for the respective region/entity. Asset owners and operators shall establish methods for their respective regions in the determination of their DBCT. As part of the overall response plan for GMD, use of a DBCT as a basis for system hardening constitutes a first level of defense for higher rates of expected GMD events. This first level of defense will be complemented by operating procedures or postures for more extreme levels of GMD.
This definition leaves the determination of the design basis GIC levels to the asset owners. Once simulation tools and operational tools are available, owners should be able to assess levels of GIC expected on their equipment and the relative risk to system reliability and specific equipment based on latitude and equipment fleet. This approach is consistent with current asset owner responsibilities for system modeling, facility ratings, and the maintenance documentation on methods and calculations.
Chapter 4–GMD Credible Threat Definition
17 GMDTF Interim Report: Affects of Geomagnetic Disturbances on the Bulk Power System–February 2012
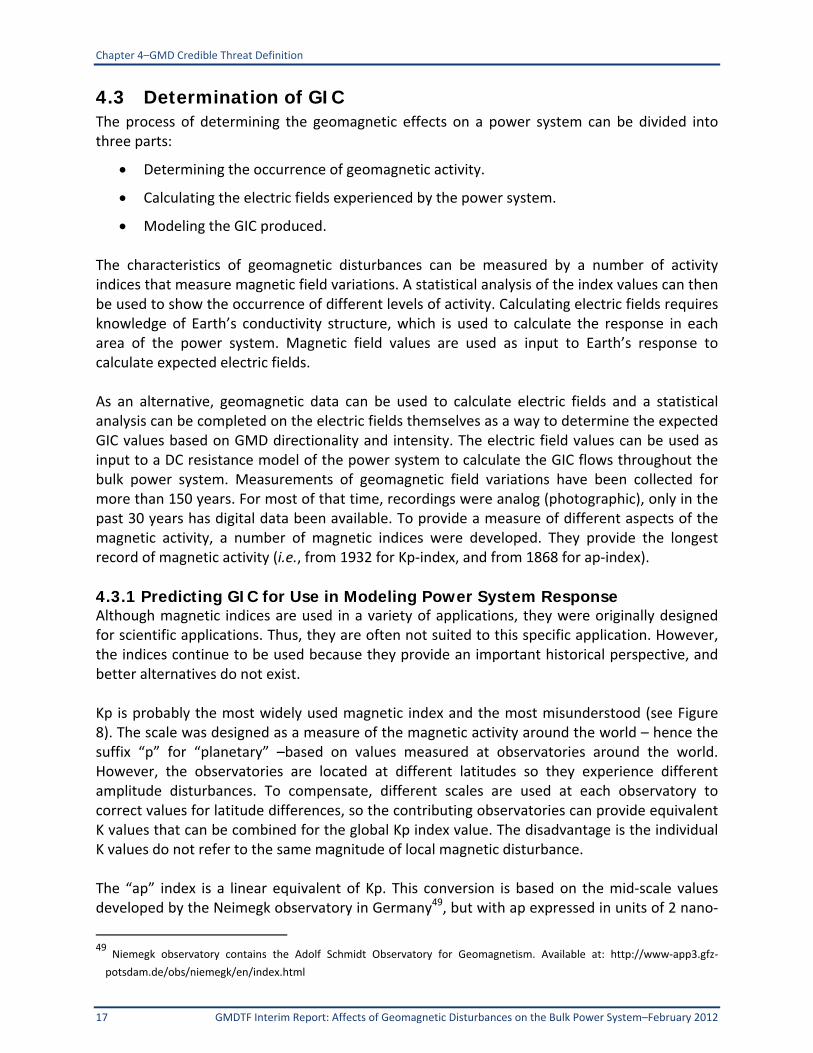
4.3 Determination of GIC The process of determining the geomagnetic effects on a power system can be divided into three parts:
Determining the occurrence of geomagnetic activity.
Calculating the electric fields experienced by the power system.
Modeling the GIC produced. The characteristics of geomagnetic disturbances can be measured by a number of activity indices that measure magnetic field variations. A statistical analysis of the index values can then be used to show the occurrence of different levels of activity. Calculating electric fields requires knowledge of Earth’s conductivity structure, which is used to calculate the response in each area of the power system. Magnetic field values are used as input to Earth’s response to calculate expected electric fields. As an alternative, geomagnetic data can be used to calculate electric fields and a statistical analysis can be completed on the electric fields themselves as a way to determine the expected GIC values based on GMD directionality and intensity. The electric field values can be used as input to a DC resistance model of the power system to calculate the GIC flows throughout the bulk power system. Measurements of geomagnetic field variations have been collected for more than 150 years. For most of that time, recordings were analog (photographic), only in the past 30 years has digital data been available. To provide a measure of different aspects of the magnetic activity, a number of magnetic indices were developed. They provide the longest record of magnetic activity (i.e., from 1932 for Kp‐index, and from 1868 for ap‐index).
4.3.1 Predicting GIC for Use in Modeling Power System Response Although magnetic indices are used in a variety of applications, they were originally designed for scientific applications. Thus, they are often not suited to this specific application. However, the indices continue to be used because they provide an important historical perspective, and better alternatives do not exist. Kp is probably the most widely used magnetic index and the most misunderstood (see Figure 8). The scale was designed as a measure of the magnetic activity around the world – hence the suffix “p” for “planetary” –based on values measured at observatories around the world. However, the observatories are located at different latitudes so they experience different amplitude disturbances. To compensate, different scales are used at each observatory to correct values for latitude differences, so the contributing observatories can provide equivalent K values that can be combined for the global Kp index value. The disadvantage is the individual K values do not refer to the same magnitude of local magnetic disturbance. The “ap” index is a linear equivalent of Kp. This conversion is based on the mid‐scale values developed by the Neimegk observatory in Germany49, but with ap expressed in units of 2 nano‐
49
Niemegk observatory contains the Adolf Schmidt Observatory for Geomagnetism. Available at: http://www‐app3.gfz‐
potsdam.de/obs/niemegk/en/index.html

Chapter 4–GMD Credible Threat Definition
GMDTF Interim Report: Affects of Geomagnetic Disturbances on the Bulk Power System–February 2012 18
Teslas (nT). Because they are based on a linear scale, the eight daily ap values can be averaged to calculate a daily value for magnetic activity, which is designated “ap.”
Figure 8: Occurrence of Kp values from 1932 to 1991.
In 1972, PN Mayaud 50compared the ranges of measurements from two magnetic observatories –in the United Kingdom and Australia – and combined to produce the “aa index” of magnetic activity back to 1868. This measure uses a linear scale like ap, but aa has units of 1nT, so it is easier to convert to the size of the actual magnetic field variations. The aa values are produced for three‐hour intervals (like Kp and ap), but they are derived from only two stations that might not be well placed to record every short‐term magnetic field variation. For this reason, the daily averages of the aa values, designated as “AA,” are not recommended for use. The Dst index is designed to measure the amplitude of the main phase disturbance (D) of a magnetic storm (st). To avoid contamination from the auroral zone magnetic activity, the Dst index is derived from the magnetic field variations recorded at four low‐latitude observatories. These are combined to provide a measure of the average main phase magnetic storm amplitude around the world. Dst should not be used for geomagnetic hazard assessments. Substorm activity occurs at the same time as the magnetic storm main phase, but Dst is not a good proxy for the size of substorm activity, which is better measured using the Kp, ap or aa indices.
4.3.2 Geomagnetic Data Modern magnetic measurements are made with three‐component fluxgate magnetometers. These measure the X, Y, Z or H, D, Z components of the magnetic field. The X, Y, Z measurements correspond to the northward, eastward, and vertical (downward) components of the magnetic field in a geographic coordinate system. Some instruments are aligned in the geomagnetic coordinate system and measure the field directed to magnetic north (H), directed
50
Mayaud, P.N. 1972, The aa indices: a 100‐year series characterizing the magnetic activity. J. Geoph. Res., 77, 6870‐6874.

Chapter 4–GMD Credible Threat Definition
19 GMDTF Interim Report: Affects of Geomagnetic Disturbances on the Bulk Power System–February 2012
to magnetic east (D) and vertically down (Z). The conversion from H, D, Z to X, Y, and Z depends on the magnetic declination at each observatory. In North America, the magnetic observatories are operated by the United States Geological Survey (USGS) and the Geological Survey of Canada (GSC). Magnetic data are available from these institutes and also through the InterMagnet website.51 The digital geomagnetic data can be used to determine the rate of change of the magnetic field dB/dt. The occurrence of peak values of the rate of magnetic field change in time (dB/dt) in each hour evaluated. Figure 9 shows the percentage occurrence of dB/dt greater than 300 nT/minute derived from Canadian and U.S. magnetic observatories. The results vary smoothly with the geomagnetic latitude of the observatory, so the results were extrapolated along lines of constant geomagnetic latitude to produce the contour lines of occurrence. These relative percent expectations show an extremely low probability for large events in most of North America.
Figure 9: Percent probability of occurrence of hourly peak dB/dt greater than 300 nT/min.
4.3.3 Geomagnetic Substorms A geomagnetic substorm, sometimes referred to as a magnetospheric substorm, is a brief disturbance in Earth's magnetosphere that causes energy to be released from the “tail’ of the magnetosphere and injected into the high latitude ionosphere. Substorms usually take place over a period of a few hours and are observable primarily at the Polar Regions. Substorm
51 Intermagnet is available at: http://www.intermagnet.org
Chapter 4–GMD Credible Threat Definition
GMDTF Interim Report: Affects of Geomagnetic Disturbances on the Bulk Power System–February 2012 20
occurrence becomes more frequent during a geomagnetic storm when one substorm may start before a previous one has completed. The recent launch of the multi‐satellite NASA THEMIS mission was specifically designed to look at issues surrounding substorms. This work is on‐going.
4.3.4 Calculation of Electric Fields The magnetic field variations that occur during a GMD induce electric fields on Earth. These electric fields drive current flows (GIC) on Earth that tends to cancel the magnetic field variations, producing a fall‐off in amplitude with depth. This is the well known “skin effect” seen in conductors. However, because of Earth’s lower conductivity, the skin depth is much greater than in metals, and the fields penetrate to depths ranging from kilometers to hundreds of kilometers depending on the frequency. At the frequencies of concern for GIC (seconds to hours), the magnetic field variations penetrate the thin surface layer of soil; the conductivity of this layer has no influence. Earth conductivity at depths into the crust and mantle influences the electric fields on the surface of Earth; this needs to be taken into account when calculating the electric fields and resulting GIC. Information about the conductivity structure of Earth can be obtained from magnetotelluric soundings, with interpretation aided by consideration of other geophysical and geological information. The basic tectonic structure of North America consists of ancient rocks of the Canadian Shield, sedimentary rocks to the south and west, and the uplifted rocks that form the Appalachian Mountains on the east coast and the Cordilleran Mountains on the west coast. In the southeast United States, there are also coastal plains between the mountains and the oceans. This information can be used to produce a layered model that represents Earth’s conductivity structure below the region of a specific power system (see Figure 10). The Québec model shows the high resistivity in the upper 15 km characteristic of the Canadian Shield, whereas the British Columbia model shows more conductive upper layers. These models represent the upper and lower range of resistivity. Models for other regions would be expected to have values at or between these two extremes. The one‐dimensional Earth models (i.e., only considering variation with depth) can be used to calculate the surface impedance of Earth. This is effectively the transfer function of Earth, showing the frequency domain relation between the electric and magnetic fields on Earth’s surface. Thus, the electric fields can be calculated by creating a Fourier transform of the time‐series of magnetic field data, multiplying the magnetic field spectrum by Earth’s surface impedance to obtain the electric field spectrum, and then inversing the resulting Fourier transform to convert this to the time series of electric field values. Electric field values have been calculated for a number of observatories in North America. Figure 11 shows the hourly peak electric field values as a function of the activity index Kp. This can be combined with the statistics of Kp shown in Figure 8 above to estimate the occurrence of electric field values.

Chapter 4–GMD Credible Threat Definition
21 GMDTF Interim Report: Affects of Geomagnetic Disturbances on the Bulk Power System–February 2012
Figure 10: Examples of Earth conductivity models
Figure 11: Occurrence of hourly peak electric fields for different Kp values
An alternative approach is to use the available archive of digital magnetic field data to calculate the electric fields that occurred during the data interval. A statistical analysis can then be made directly on the electric field values.
4 km
6 km
5 km
half‐
space1 ohm‐meter
300 km
200 km 10 ohm‐meter
100‐ohm‐meter
300 ohm‐meter
100 ohm‐meter
Surface
Québec British Columbia
Surface
20 km
65 km
500 ohm‐meter
150 ohm‐meter
20 ohm‐meter
20,000 ohm‐meter
200 ohm‐meter
1000 ohm‐meter
100 ohm‐meter
3 ohm‐meter
15 km
10 km
125 km
200 km
half‐
space

Chapter 4–GMD Credible Threat Definition
GMDTF Interim Report: Affects of Geomagnetic Disturbances on the Bulk Power System–February 2012 22
To provide an example of this information use, a recent analysis was completed by using geomagnetic data with 10‐second sampling from 1993 to 2006 and the resistive and conductive Earth models in Figure 10 to calculate electric fields using geomagnetic data from the NASA Imager for Magnetopause‐to‐Aurora Global Exploration (IMAGE) chain.52 A statistical analysis of these values (see Figure 12) shows the decrease in occurrence with increasing amplitude, which is then extrapolated to determine the electric field magnitude expected once in a 100 years. For a conductive Earth structure, Figure 12a indicates a 100‐year peak electric field of 5 V/km for British Columbia, while for a resistive Earth structure Figure 12b indicates a 1 in 100‐year peak electric field value of 20 V/km for Québec. The amplitude of geomagnetic disturbances (and hence the peak electric fields) also shows a strong dependence on latitude. It is valuable to calibrate the magnetic field data recorded at the North American geomagnetic observatories during the March 13‐14, 1989, and October 29‐31, 2003, geomagnetic disturbances with the aforementioned calculations. Figure 13 shows the peak electric field values occurred in the auroral zone and a dramatic drop at a geomagnetic latitude threshold of about 50 degrees. More information and background can be found in Generation of 100‐year geomagnetically induced current scenarios. 53.
Figure 12: Statistical occurrence of geoelectric fields calculated using the ground conductivity structure of (a) British Columbia (conductive) and (b) Québec (resistive).
Note: Different curves correspond to different IMAGE stations used in the computation of the geoelectric field. The black lines indicate approximate visual extrapolations of the statistics to 100‐year peak magnitudes. The gray lines
indicate the reasonable lower and upper boundaries for the extrapolated values.
52 The NASA IMAGE Chain is available at: http://image.gsfc.nasa.gov/ 53 Pulkkinen, A., E. Bernabeu, J. Eichner, C. Beggan and A. Thomson, Generation of 100‐year geomagnetically induced current
scenarios, Accepted for publication in Space Weather, 2012.

Chapter 4–GMD Credible Threat Definition
23 GMDTF Interim Report: Affects of Geomagnetic Disturbances on the Bulk Power System–February 2012
Figure 13: Spatial distributions of the maximum computed geoelectric field for (a) March 13‐15, 1989 and (b) October 29‐31, 2003.
Note: The center of each circle indicates the location of the corresponding magnetometer station and the radius of the circle indicates the maximum magnitudes of the physical parameters.
To provide an example of the geoelectric fields that could occur during a one in 100‐year scenario (also referred to as the GIC test wavefronts) at different latitudes and with regions of different resistivity, geoelectric fields calculated for the October 29, 2003, event for the Nurmijarvi and Memanbetsu magnetic observatories were scaled to determine the peak electric fields expected from Figures 11 and 12. The results, shown in Figure 14, indicate that above the threshold geomagnetic latitude, the peak electric fields are 20 V/km and 5 V/km in resistive and conductive regions respectively. Below the threshold geomagnetic latitude, the corresponding peak electric fields are 2 V/km and 0.5 V/km for resistive and conductive regions.
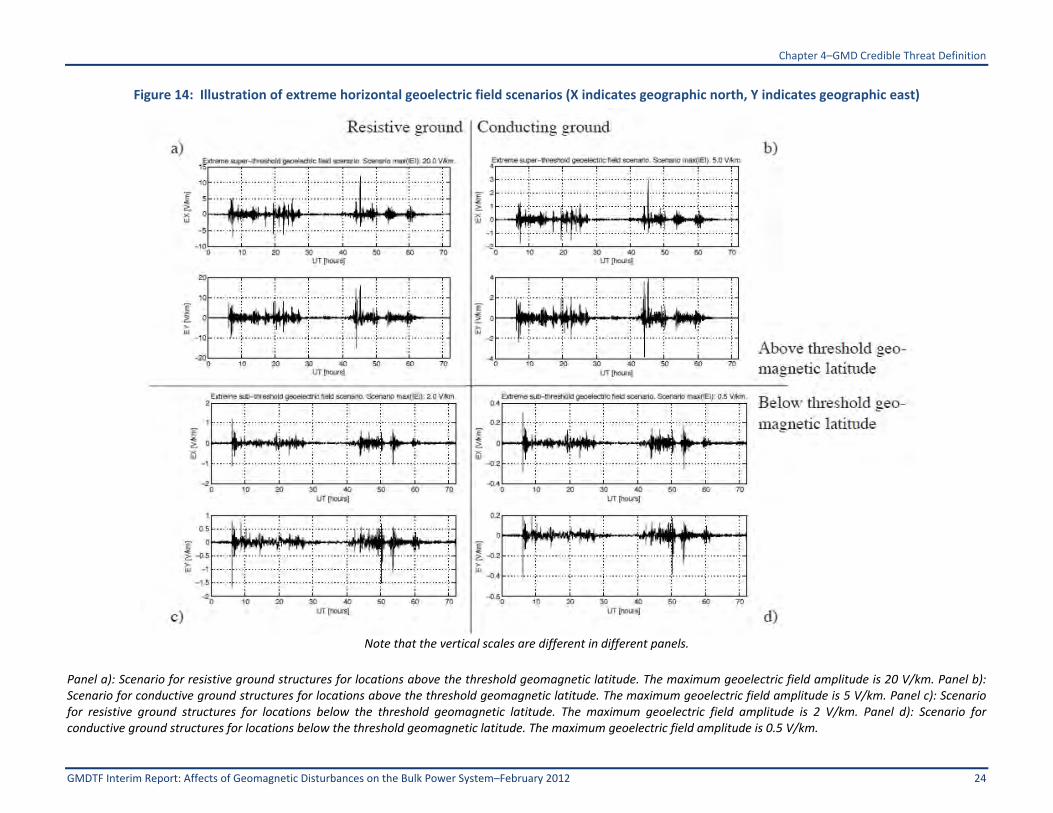
Chapter 4–GMD Credible Threat Definition
GMDTF Interim Report: Affects of Geomagnetic Disturbances on the Bulk Power System–February 2012 24
Figure 14: Illustration of extreme horizontal geoelectric field scenarios (X indicates geographic north, Y indicates geographic east)
Note that the vertical scales are different in different panels.
Panel a): Scenario for resistive ground structures for locations above the threshold geomagnetic latitude. The maximum geoelectric field amplitude is 20 V/km. Panel b): Scenario for conductive ground structures for locations above the threshold geomagnetic latitude. The maximum geoelectric field amplitude is 5 V/km. Panel c): Scenario for resistive ground structures for locations below the threshold geomagnetic latitude. The maximum geoelectric field amplitude is 2 V/km. Panel d): Scenario for conductive ground structures for locations below the threshold geomagnetic latitude. The maximum geoelectric field amplitude is 0.5 V/km.
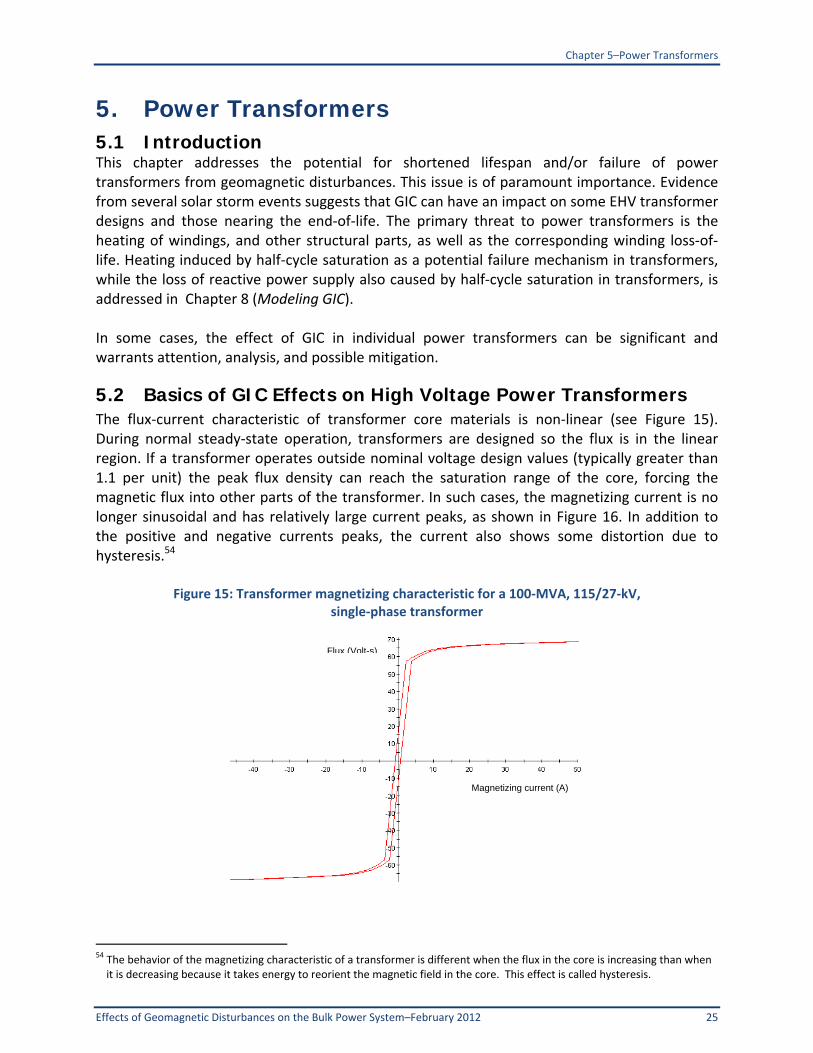
Chapter 5–Power Transformers
Effects of Geomagnetic Disturbances on the Bulk Power System–February 2012 25
5. Power Transformers 5.1 Introduction This chapter addresses the potential for shortened lifespan and/or failure of power transformers from geomagnetic disturbances. This issue is of paramount importance. Evidence from several solar storm events suggests that GIC can have an impact on some EHV transformer designs and those nearing the end‐of‐life. The primary threat to power transformers is the heating of windings, and other structural parts, as well as the corresponding winding loss‐of‐life. Heating induced by half‐cycle saturation as a potential failure mechanism in transformers, while the loss of reactive power supply also caused by half‐cycle saturation in transformers, is addressed in Chapter 8 (Modeling GIC). In some cases, the effect of GIC in individual power transformers can be significant and warrants attention, analysis, and possible mitigation.
5.2 Basics of GIC Effects on High Voltage Power Transformers The flux‐current characteristic of transformer core materials is non‐linear (see Figure 15). During normal steady‐state operation, transformers are designed so the flux is in the linear region. If a transformer operates outside nominal voltage design values (typically greater than 1.1 per unit) the peak flux density can reach the saturation range of the core, forcing the magnetic flux into other parts of the transformer. In such cases, the magnetizing current is no longer sinusoidal and has relatively large current peaks, as shown in Figure 16. In addition to the positive and negative currents peaks, the current also shows some distortion due to hysteresis.54
Figure 15: Transformer magnetizing characteristic for a 100‐MVA, 115/27‐kV, single‐phase transformer
54 The behavior of the magnetizing characteristic of a transformer is different when the flux in the core is increasing than when it is decreasing because it takes energy to reorient the magnetic field in the core. This effect is called hysteresis.
Magnetizing current (A)
Flux (Volt-s)
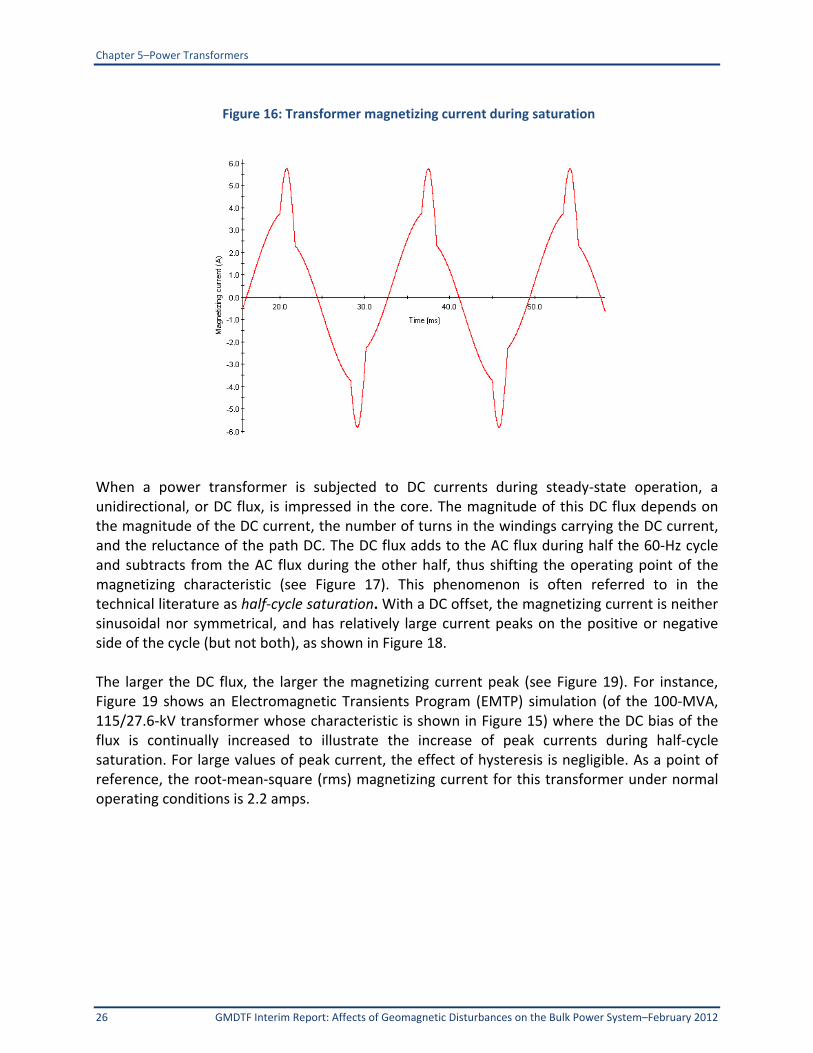
Chapter 5–Power Transformers
26 GMDTF Interim Report: Affects of Geomagnetic Disturbances on the Bulk Power System–February 2012
Figure 16: Transformer magnetizing current during saturation
When a power transformer is subjected to DC currents during steady‐state operation, a unidirectional, or DC flux, is impressed in the core. The magnitude of this DC flux depends on the magnitude of the DC current, the number of turns in the windings carrying the DC current, and the reluctance of the path DC. The DC flux adds to the AC flux during half the 60‐Hz cycle and subtracts from the AC flux during the other half, thus shifting the operating point of the magnetizing characteristic (see Figure 17). This phenomenon is often referred to in the technical literature as half‐cycle saturation. With a DC offset, the magnetizing current is neither sinusoidal nor symmetrical, and has relatively large current peaks on the positive or negative side of the cycle (but not both), as shown in Figure 18. The larger the DC flux, the larger the magnetizing current peak (see Figure 19). For instance, Figure 19 shows an Electromagnetic Transients Program (EMTP) simulation (of the 100‐MVA, 115/27.6‐kV transformer whose characteristic is shown in Figure 15) where the DC bias of the flux is continually increased to illustrate the increase of peak currents during half‐cycle saturation. For large values of peak current, the effect of hysteresis is negligible. As a point of reference, the root‐mean‐square (rms) magnetizing current for this transformer under normal operating conditions is 2.2 amps.
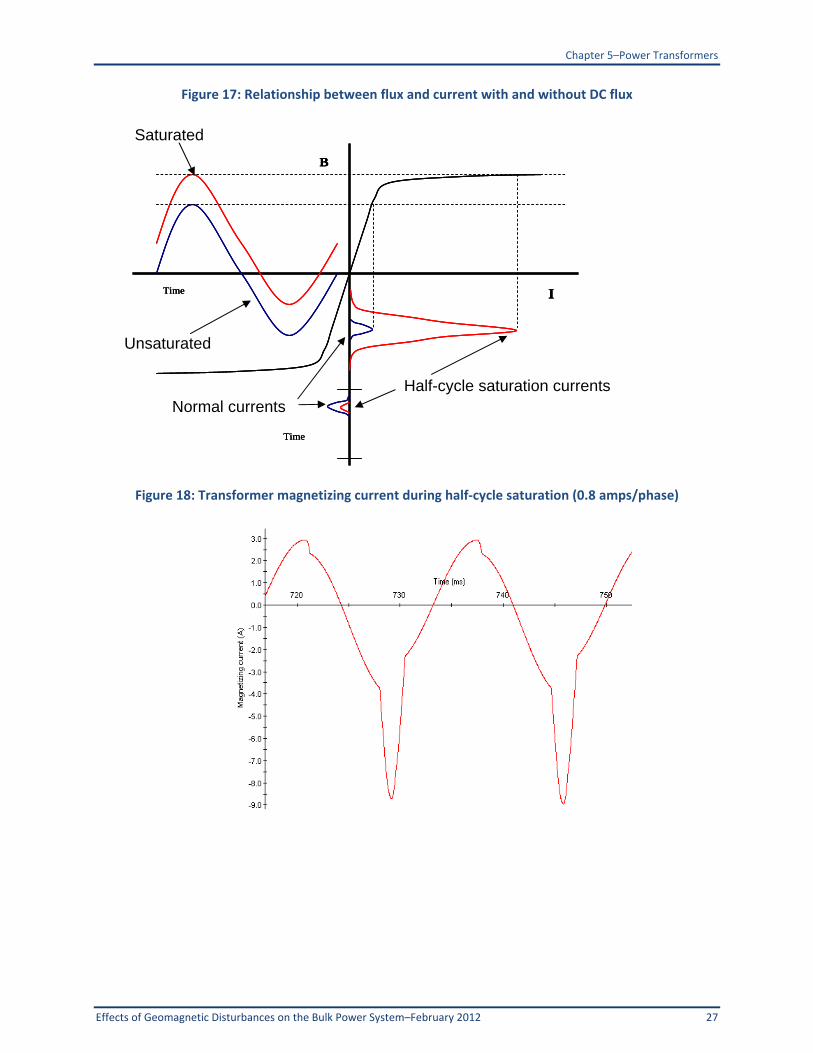
Chapter 5–Power Transformers
Effects of Geomagnetic Disturbances on the Bulk Power System–February 2012 27
Figure 17: Relationship between flux and current with and without DC flux
Figure 18: Transformer magnetizing current during half‐cycle saturation (0.8 amps/phase)
Time I
B
Time
Time I
B
Time
Time I
B
Time
Unsaturated
Saturated
Normal currents Half-cycle saturation currents

Chapter 5–Power Transformers
28 GMDTF Interim Report: Affects of Geomagnetic Disturbances on the Bulk Power System–February 2012
Figure 19: Transformer magnetizing current for increasing values of DC current per phase
Table 3: Magnetizing currents during half‐cycle saturation IDC /phase (amps)
Peak magnetizing current (amps)
rms magnetizing current (amps)
20 390 88
33 570 118
47 745 157
The magnetizing current peak values (and under high levels of GIC, the rms values) can become a substantial portion of the nominal rated current of the transformer during half‐cycle saturation. The numerical values shown are based on ElectroMagnetic Transients Program (EMTP) simulations that illustrate the physics of the phenomenon from a power system point of view. Also, as further discussed in Section 5.3 below, the magnetizing characteristic and how DC flux offset is affected when DC currents flow (GICs) through the windings can vary depending on many factors, such as core construction and design characteristics. The duration of this pulse is only in the range of 1/6th to 1/10th of the cycle; once per cycle. Figure 20 illustrates different magnetizing current peak values as a function of GIC for a single‐phase unit.
20 A DC
47 A
33 A

Chapter 5–Power Transformers
Effects of Geomagnetic Disturbances on the Bulk Power System–February 2012 29
Figure 20: Magnetizing current pulse drawn from power grid under (AC+DC) excitation
5.2.1 Factors that Determine the Behavior of Half-Cycle Saturation The magnitude of DC flux offset in the core depends on the magnetic reluctance of the DC flux path. Thus, the DC flux offset in a three‐phase, three‐legged, core‐form transformer would be the lowest of all transformer core types because the design offers an order of magnitude higher magnetic reluctance to the DC amp‐turns in the core‐tank magnetic circuit (see Figure 21). The DC flux passes through the high reluctance path from the core top yoke to the tank cover, through the tank walls, and returns to the bottom yoke and again through the high reluctance path from the tank bottom. All other core types offer much less reluctance to the DC ampere‐turns because the return path for this DC flux is through the core, which has orders of magnitudes higher permeability (see Figure 21 below). Core material and core joint type have some influence; however, this influence is small and depends on the core type and the operating flux density in the core. The influence of core material and joint type decreases even further for high magnitudes of GIC.

Chapter 5–Power Transformers
30 GMDTF Interim Report: Affects of Geomagnetic Disturbances on the Bulk Power System–February 2012
Figure 21: Core DC flux path in various core types
To illustrate, Figure 22 (below) shows the percentage magnetizing current drawn by two different types of power transformers,55 a large single‐phase power transformer with a three‐egged core and a large three‐phase power transformer with a three‐legged core. The excitation current drawn by the three‐phase, three‐legged transformer is much smaller than that of the single‐phase transformer for the same value of DC winding current.
55.R. Girgis, K. Vedante, “Effects of GIC on Power Transformers and Power Systems”, To be presented at IEEE T&D Conference May 2012
*

Chapter 5–Power Transformers
Effects of Geomagnetic Disturbances on the Bulk Power System–February 2012 31
Figure 22: RMS magnetizing current for two transformers with two different core types
5.2.2 Harmonic Content of the Magnetizing Current during Half-Cycle Saturation Typically, when three‐phase transformers with a three‐legged core are subjected to GIC, they have narrower excitation current pulses compared to corresponding magnetizing current pulses of transformers with other core types.56 The magnetizing current pulse of three‐phase transformers has higher amplitudes of the lower order harmonics and much lower amplitudes of the high‐order harmonics (see Figure 23 as a representative case). For other core types represented by the single‐phase transformer data below, the magnetizing current pulse has uniform amplitudes between low‐order and high‐order harmonics. Therefore, these transformers have a significant content of higher order harmonics. Other impacts from the introduction of GIC to the power system are covered in more detail in Chapter 6 (Protection and Control), Chapter 7 (Other Equipment), and Chapter 8 (Power System Analysis).
56 R. Girgis, K. Vedante, “Effects of GIC on Power Transformers and Power Systems”, To be presented at IEEE T&D Conference May 2012
Percent [%] Excitation Current versus DC Current
0
1
2
3
4
5
6
7
8
0 5 10 15 20 25 30 35 40 45
DC Current/Phase
% E
xcit
atio
n C
urr
ent
3-Phase, 3-Limb XFMR
1-Phase XFMR

Chapter 5–Power Transformers
32 GMDTF Interim Report: Affects of Geomagnetic Disturbances on the Bulk Power System–February 2012
Figure 23: Harmonic content of magnetizing current during half‐cycle saturation
5.2.3 Thermal Effects of GIC on Power Transformers When GIC cause half‐cycle saturation, flux “flows” through structural elements of the transformer, such as tank, tie plates, and core support, rather than through the transformer laminated steel core. Heat is generated by the eddy currents induced by changing off‐core flux, causing hot‐spot heating. Winding and structural element hot spots are the inevitable effects of saturation. Off‐core or stray flux due to half‐cycle saturation has different characteristics than stray flux caused by overexcitation. Hot‐spot heating can degrade the mechanical strength of winding insulation elements. The Institute of Electrical and Electronic Engineers (IEEE) Standard C57.91‐1995 sets definite limits on hot spot temperature for steady‐state and short‐time emergency loading. These limits were specified for overload conditions and are not applicable to half‐cycle saturation conditions. Additionally, the standards are silent regarding the adverse effects of overheating by a given temperature over a given time period, but there are some well‐known empirical relationships that associate an expected reduction in the expected life of dielectric insulation with the magnitude and duration of overheating.57
57 R. D. Vecchio, B. Poulin, P. Feghali, D. M. Shah, R. Ahuja, Transformer Design Principles, 2nd Edition, CRC Press, 2010
Harmonics Spectrum of Excitation current under DC Conditions
0%
2%
4%
6%
8%
10%
12%
14%
16%
60 120 180 240 300 360 420 480 540 600 660
Harmonic Frequency, Hz
% H
arm
on
ics A
mp
litu
de
3 - Phase, 3 - Limb Transformer
1 - Phase Transformer

Chapter 5–Power Transformers
Effects of Geomagnetic Disturbances on the Bulk Power System–February 2012 33
If construction and design details of a transformer are known, it is possible to estimate the amount of winding and structural elements heating by mathematical modeling, and to relate it to the amount of GIC flowing through the windings.58,59,60 For instance, the calculated temperature rise as a function of time for a single‐phase 750 MVA, 345/24.5 kV (three‐phase) transformer is shown in Figures 24 and 25.61 For this transformer, the temperature rise time constant in the tie plate due to a step GIC excitation is approximately five minutes. This temperature rise as a function of GIC can also be obtained from actual measurements if such measurements are specified as part of acceptance tests. For instance, Figure 26 shows the measured temperature rise of a 400‐MVA, 550/16.5‐kV bank (single‐phase).62
Figure 24: Winding hot spot temperatures for various values of DC current.
58 Nobuo Takasu, et al, “An experimental analysis of DC excitation of transformers by geo‐magnetically induced currents,” IEEE Transactions on Power Delivery, vol. 9, no. 2, April 1994, p 1173‐1182.
59 X. Dong, Y. Liu, J. G. Kappenman, “Comparative Analysis of Exciting Current Harmonics and Reactive Power Consumption from GIC Saturation Transformers,” IEEE Power Engineering Society Meeting, 2001, pp. 318‐322.
60 P. R. Price, Geomagnetically Induced Current Effects on Transformers,” IEEE Transactions on Power Delivery, vol. 17, no. 4, October 2002.
61 R. Girgis, K. Vedante, “Effects of GIC on Power Transformers and Power Systems”, To be presented at IEEE T&D Conference
May 2012 62 L. Marti, A. Rezaei‐Zare, A. Narang, “Simulation of Transformer Hot‐Spot Heating due to Geomagnetically Induced Currents,”
submission to IEEE Transactions on Power Delivery.
Winding Hot Spot Temperature vs Time, 1-Phase Transformer
0
10
20
30
40
50
60
70
80
90
100
110
120
130
0 5 10 15 20 25 30Time, Minutes
Wd
g H
ot
Sp
ot
Te
mp
t, D
eg
ree
C
Idc = 50 Amps
Idc = 30 Amps
Idc = 20 Amps

Chapter 5–Power Transformers
34 GMDTF Interim Report: Affects of Geomagnetic Disturbances on the Bulk Power System–February 2012
Figure 25: Plate temperature for different values of DC current
Figure 26: Measured temperature characteristic of a 400‐MVA, 550/16.5‐kV bank (single‐phase)
Tie plate points
Bottom oil
Flitch-Plate Temperature vs Time
0
20
40
60
80
100
120
140
160
0 20 40 60 80 100 120Time, Minutes
Flit
ch-P
late
Tem
pt, D
egre
e C
Idc = 20 Amps
Idc = 30 Amps
Idc = 50 Amps

Chapter 5–Power Transformers
Effects of Geomagnetic Disturbances on the Bulk Power System–February 2012 35
If the temperature response as a function of GIC is known, it is possible to approximate the transformer thermal behavior as a black box and examine the incremental heating due to a GMD event or pre‐defined test function.63 For instance, using the 100‐year scenario corresponding to the 5 V/km electric field (see Chapter 4), the tie‐plate temperature rise for the 345/24.5 kV 750 MVA transformer is shown in Figure 27. Note that the absolute value of GIC is plotted since the polarity of the current does not have a significant effect on temperature rise. From Figure 27, it is apparent that for this transformer the tie plate temperature rise for these GIC only reaches 8 degrees Celsius. In contrast, using the thermal behavior of the 400 MVA, 500/16.5 kV transformer in Figure 26, the same 100‐year scenario produces the response shown in Figure 28. In this case, the temperature rise in the tie plate reaches 48 degrees Celsius for approximately four minutes. The maximum calculated metallic part temperature at full load, oil direct air forced (ODAF) rating for this transformer, assuming 40 degrees Celsius ambient temperature, would be 120 degrees Celsius. This is below the 200 degrees Celsius threshold in IEEE C57.91‐1995. Note that the extrapolation from testing at no‐load/normal‐ambient to full‐load/maximum‐ambient does not take into account reduction in stray losses and increase in cooling rate because of the much higher metallic and oil temperatures. In the case of the 20 V/km, low‐conductivity, 100‐year scenario, and a 400 MVA, 500/16.5 kV transformer, the maximum calculated metallic part temperature exceeds 200 degrees Celsius for 14 minutes, therefore IEEE C57.91‐1995 thresholds would be exceeded. To place this scenario in perspective, this level of GIC represents more than 10 times what was experienced by Hydro‐Québec and Public Service Electric and Gas (PSE&G) on March 13, 1989. Also, the 14 minute duration is greater than the duration of the highest peaks experienced by the same systems in 1989. For the 750 MVA, 345/24.5 kV transformer, maximum temperature reaches 130 degrees Celsius and the IEEE C57.91‐1995 thresholds would not be exceeded. Note that the results in Figures 27 and 28 do not take into account different heating and cooling rates because cooling rates were not available.
63 L. Marti, A. Rezaei‐Zare, A. Narang, “Simulation of Transformer Hot‐Spot Heating due to Geomagnetically Induced Currents,” submission to IEEE Transactions on Power Delivery.

Chapter 5–Power Transformers
36 GMDTF Interim Report: Affects of Geomagnetic Disturbances on the Bulk Power System–February 2012
Figure 27: Tie plate temperature rise and GIC time series. Calculated characteristic of a single‐phase 345/24.5 kV 750 MVA transformer
(a) Complete 5 V/km 100‐years scenario
(b) Zoom‐in of first substorm
(b)
Temperature
(a)

Chapter 5–Power Transformers
Effects of Geomagnetic Disturbances on the Bulk Power System–February 2012 37
Figure 28: Tie plate temperature rise and GIC time series. Measured characteristics of a 400‐MVA, 500/16.5‐kV, single‐phase transformer (a) Complete 5 V/km 100‐years scenario
(b) Zoom‐in of first substorm
(b)
Temperature
(a)

Chapter 5–Power Transformers
38 GMDTF Interim Report: Affects of Geomagnetic Disturbances on the Bulk Power System–February 2012
These examples highlight several points:
Hot‐spot heating can vary significantly among transformers, even when they appear to be similar in size and construction.
The magnitude, frequency, and duration of the GIC peaks during a substorm are key in assessing the possibility of winding and structural parts heating, and the affect of this heating on transformer condition, performance, and insulation life.
If the calculated or measured heating behavior of a transformer is known, it is possible to ascertain tangible thresholds with a reasonable degree of confidence.
Measurements of GIC heating characteristics can be specified during the commissioning of new units. (Thermocouples need to be installed in key parts for the transformer.)
IEEE and International Electrotechnical Commission (IEC) should design and test standards to improve reliability of transformers during and after GMD events.
Calculation of GIC heating characteristics can be made if the design and construction details are known. Transformer manufacturers have the design information and tools needed to produce the GIC heating characteristics.
Once the heating characteristics are known, it is relatively straightforward to assess temperature thresholds for any type of GMD event or test function.64
5.3 Reported Transformer Effects This section provides an overview of instances where transformers been reported to be affected by GMD in the literature.
5.3.1 Salem No. 1 Nuclear Plant Generator Step-Up (GSU) Transformer The Salem No. 1 Nuclear Plant Generator Step‐Up (GSU) transformer was adversely affected by the March 1989 solar storm.65,66 The GSU is comprised of three single‐phase transformers and is rated at 360 MVA, 500 kV Grounded Y – 24 kV Delta [2]. Effects observed during the storm included the following:67,68
50 MVAr (14% of nameplate rating) increase in MVAr demand.
Unacceptable levels of dissolved combustible gases in oil.
High noise levels.
64 L. Marti, A. Rezaei‐Zare, A. Narang, “Simulation of Transformer Hot‐Spot Heating due to Geomagnetically Induced Currents,” submission to IEEE Transactions on Power Delivery.
65 J. Wrubel, “Monitoring for Geomagnetic Induced Current Flow Effects Using Existing EMS Telemetering,” Conference Proceedings of Power Industry Computer Application Conference, 1991, pp. 44‐49.
66 R. S. Girgis, R. J. Nevins, “Analysis of Observed Geomagnetically Induced Current Effects on Transformers,” Proceedings of EPRI Geomagnetically Induced Current Conference, June 1992, TR‐100450.
67 R. S. Girgis, R. J. Nevins, “Analysis of Observed Geomagnetically Induced Current Effects on Transformers,” Proceedings of EPRI Geomagnetically Induced Current Conference, June 1992, TR‐100450.
68 CIGRE Study Committee 12, “Effects of Geomagnetically Induced Currents on Power Transformers,” Electra, no. 141, April 1992.
Chapter 5–Power Transformers
Effects of Geomagnetic Disturbances on the Bulk Power System–February 2012 39
The units were removed from service a week later, and internal inspections were conducted. Internal inspection of all three phases revealed the following:69,70
Charred winding series connections between two parallel low voltage windings.
Degree of burning varied for different series connections.
Phases A and C had burnt connections, but phase B was clean. The cause of overheating by the low voltage windings was determined to be circulating currents in the series connections.71 The low voltage leads were an old design that consisted of a hundred strands connected by welding joints in two parallel sections of the winding.72 A considerable circulating current would have been established within this connecting lead after the appearance of saturation flux73 potentially caused by GIC flows. A thorough description of these circulating currents and design methods for mitigation can be found in “Calculation Techniques and Results of Effects of GIC Currents as Applied to Two Large Power Transformers.”74
5.3.2 Salem No. 2 Nuclear Plant Generator Step-Up Transformer On September 19, 1989, a GMD event caused significant GIC flows in the neutrals of the transformers located at the Salem substation. This event was suggested to have caused minor damage to one phase of Salem No. 2 Nuclear Plant GSU. The GSU had the same design as that of Salem No. 1 transformers. However, no details were provided in the published literature. This damaged phase of the GSU was replaced during a subsequent refueling of Salem No. 2. 75
5.3.3 Allegheny Power System (APS) A three‐phase, seven‐leg, core shell‐form autotransformer rated 210/280/350‐MVA, 500kV/138‐kV and located at Meadowbrook Substation, was affected by the March 1989 solar storm.76 Effects observed during the GMD included:77
Significant increase in dissolved combustible gases in oil.
Bands of discolored tank paint at four locations78.
69 R. S. Girgis, R. J. Nevins, “Analysis of Observed Geomagnetically Induced Current Effects on Transformers,” Proceedings of EPRI Geomagnetically Induced Current Conference, June 1992, TR‐100450.
70 CIGRE Study Committee 12, “Effects of Geomagnetically Induced Currents on Power Transformers,” Electra, no. 141, April 1992.
71 R. S. Girgis, R. J. Nevins, “Analysis of Observed Geomagnetically Induced Current Effects on Transformers,” Proceedings of EPRI Geomagnetically Induced Current Conference, June 1992, TR‐100450.
72 CIGRE Study Committee 12, “Effects of Geomagnetically Induced Currents on Power Transformers,” Electra, no. 141, April 1992.
73 CIGRE Study Committee 12, “Effects of Geomagnetically Induced Currents on Power Transformers,” Electra, no. 141, April 1992.
74 Ramsis Girgis and Chung‐Duck K.O., “Calculation Techniques and Results of Effects of GIC Currents as Applied to Two Large Power Transformers,” IEEE Transactions on Power Delivery, vol. 7, no. 2, April 1992, pp. 699‐705.
75 J. Wrubel, “Monitoring for Geomagnetic Induced Current Flow Effects Using Existing EMS Telemetering,” Conference Proceedings of Power Industry Computer Application Conference, 1991, pp. 44‐49.
76 Ramsis Girgis and Chung‐Duck K.O., “Calculation Techniques and Results of Effects of GIC Currents as Applied to Two Large Power Transformers,” IEEE Transactions on Power Delivery, vol. 7, no. 2, April 1992, pp. 699‐705.
77 Ramsis Girgis and Chung‐Duck K.O., “Calculation Techniques and Results of Effects of GIC Currents as Applied to Two Large Power Transformers,” IEEE Transactions on Power Delivery, vol. 7, no. 2, April 1992, pp. 699‐705.
78 J. G. Kappenman, V.D. Albertson, “Bracing for the Geomagnetic Storms,” IEEE Spectrum, vol. 27, issue 3, 1990, pp. 27‐33.

Chapter 5–Power Transformers
40 GMDTF Interim Report: Affects of Geomagnetic Disturbances on the Bulk Power System–February 2012
14% increase in MVAr demand.
Increase in harmonic current (THDi = 9.2%).79
Significant increase in noise level (10‐15 dB). The transformer was removed from service, and a detailed internal inspection was performed, revealing no internal damage [4]. Finite element analysis indicated the wooden slats sandwiched between the outer periphery of the core and the tank walls blanketed these regions of the tank walls, which contributed to the heating and caused discoloration of the external tank paint. Citing calculated results from Westinghouse and Allegheny [5], the temperature of the tank wall was estimated to have reached 400 degrees Celsius at some locations of the transformer tank. APS experienced an additional GMD event on May 10, 1992.80,81 Figure 29 demonstrates the correlated rise of GIC with tank and oil temperature captured during the event. During the course of the storm, GIC flow in the neutral of the transformer reached a level of approximately 60 amps DC (20 amps per phase) in about 15 minutes with a corresponding steady increase in temperature on the exterior of the tank (see Figure 29). The peak temperature measurement on the exterior of the tank was 173 degrees Celsius, and occurred approximately 1‐2 minutes after the peak GIC occurred. The oil temperature rise during the event was negligible.
79 NERC March 13, 1989 Disturbance Report. 80 Leonard L. Grigsby, Electric Power Engineering Handbook, 2nd Edition, CRC Press, 2007. 81 Metatech Corporation for Oak Ridge National Laboratory, “Geomagnetic Storms and Their Impacts on the U.S. Power Grid,” Meta‐R‐319, January 2010, http://www.ornl.gov/sci/ees/etsd/pes/pubs/ferc_Meta‐R‐319.pdf

Chapter 5–Power Transformers
Effects of Geomagnetic Disturbances on the Bulk Power System–February 2012 41
Figure 29: GIC and measured tank temperature82
5.3.4 Eskom, South Africa After the severe geomagnetic storm in November 2003 (also called the Halloween storms), the levels of some dissolved gasses in the transformers increased rapidly. A transformer at Lethabo Power Station tripped on protection November 17. There was another severe storm November 20, and on November 23 the Matimba #3 transformer tripped on protection, and January 19, 2004, one of the transformers at Tutuka was taken out of service. Two more transformers at Matimba Power Station (#5 and #6) had to be removed from service with high levels of dissolved gas analysis (DGA) in June 2004. A second transformer at Lethabo Power Station tripped on Buchholz protection in November 2004. More information and background on this event can be found in Transformer Failures in Regions Incorrectly Considered to Have Low GIC‐Risk. 83 Figure 30 shows the DGA record for one of the Matimba transformers, and is characterized as typical for other Eskom transformers affected by the storm.
82Leonard L. Grigsby, Electric Power Engineering Handbook, 2nd Edition, CRC Press, 2007. 83 C. T. Gaunt, G. Coetzee, “Transformer Failures in Regions Incorrectly Considered to Have Low GIC‐Risk,” IEEE Power Tech 2007, Lausanne, pp. 807‐812.

Chapter 5–Power Transformers
42 GMDTF Interim Report: Affects of Geomagnetic Disturbances on the Bulk Power System–February 2012
Figure 30: DGA results Matimba #1: May 2003 to June 200484
Figure 30 shows an increase in dissolved gas after the onset of the Eskom storm. The DGA results shown in Figure 30 are consistent with low temperature thermal degradation. Internal inspection of the failed transformers identified thermal damage to paper insulation in various parts of the transformer, which was found to be consistent with the DGA results. In all cases, the extent of the damage was small, and discoloration of paper insulation beyond the immediate vicinity of the fault location was negligible, which is consistent with low levels of DGA.85 In transformers with corrosive oil, localized heating caused by GIC (especially at leads that were over‐insulated) could result in the formation of copper sulfide, which can cause dielectric breakdown of winding insulation.
5.3.5 National Grid Company, United Kingdom Suggestion from Geomagnetically Induced Current Detection and Monitoring86 is that two 400/275‐kV autotransformers (Norwich Main and Indian Queens87) failed in southern England during a GMD that occurred on March 13, 1989. Both transformers exhibited significant increases in DGA. No additional details regarding the transformer failures were provided.
84 C. T. Gaunt, G. Coetzee, “Transformer Failures in Regions Incorrectly Considered to Have Low GIC‐Risk,” IEEE Power Tech 2007, Lausanne, pp. 807‐812.
85 Leonard L. Grigsby, Electric Power Engineering Handbook, 2nd Edition, CRC Press, 2007. 86 T. H. Breckenridge, T. Cumming, J. Merron, “Geomagnetically Induced Current Detection and Monitoring,” Developments in Power System Protection Conference, Publication No. 479 IEE 2001
87 A. Erinmez, J. G. Kappenman, W. A. Radasky: Management of the geomagnetically induced current risks on the National Grid Company’s electric power transmission system,” Journal of Atmospheric and Solar‐Terrestrial Physics, 64, 2002, p 743‐756.

Chapter 5–Power Transformers
Effects of Geomagnetic Disturbances on the Bulk Power System–February 2012 43
5.3.6 Transpower New Zealand On November 6, 2001, widespread alarms occurred in many of the monitored South Island transformers in the Transpower New Zealand grid. Around the same time, a transformer at the Halfway Bush Substation tripped.88 No additional details are provided.
5.4 Measured Effects of GIC on Power Transformers Several experiments have been performed to characterize the effects of GIC on transformers. Both Hydro‐Québec89 and FINGRID Power90 subjected single‐phase and three‐phase power transformers to high levels of DC current for extended time periods. Tests were also conducted by Tokyo Electric Power Corporation, in collaboration with Toshiba, Hitachi, and Mitsubishi, to study several small‐scale models of core‐form and shell‐form transformers with different core types.91 The Idaho National Laboratory has also conducted EMTP tests on transformers, though results of these tests have not yet been published in scientific literature.
5.4.1 Hydro-Québec Tests The temperature rise in transformers subjected to a DC source of excitation was measured on core‐form, single‐phase, 735‐kV autotransformers rated at 370 MVA and 550 MVA.92 Injections of 12.5 amps, 25 amps, 50 amps, and 75 amps on the high‐voltage side were performed for an hour at each DC level. The injection sequence was as follows: one hour at 735 kV without DC current injected, one hour with a DC current of 25 amps, and one hour with a DC current of 75 amps. The initial temperature inside the transformers stabilized at 25 degrees Celsius prior to every test. Test results showed that the tie plates of the particular type of transformer tested were the components most susceptible to rapid temperature rise. The maximum temperature rise above the top oil temperature (of both transformers) was found to be 52 degrees Celsius at the upper end of a tie plate of the 370 MVA class transformer after the circulation of 75 amps DC. Gas analysis was also performed after each DC injection test, and the results did not show notable rise of dissolved gas in oil.
5.4.2 FINGRID Power Tests FINGRID Power conducted tests on two 400‐MVA transformers equipped with 38 thermocouples and 16 optical fiber‐based temperature sensors. The test adjusted the magnetizing current of a DC‐generator stepwise, resulting in the increase of neutral current from 50 amps to 200 amps, with increases occurring approximately every 10‐15 minutes. Results show that the tested transformers can tolerate, without damage, very high DC currents four times typical of geomagnetic storms. 93
88 Transpower New Zealand, System Operators Report, June 2011. 89 P. Picher, L. Bolduc et al., “Study of the acceptable DC current limit in core‐form power transformers,” IEEE Transactions on Power Delivery, vol. 12, no. 1, January 1997, page 257‐265.
90 Matti Lahtinen and Jarmo Elovaara, “GIC Occurrences and GIC Test for 400 kV System Transformer,” IEEE Transactions on Power Delivery, vol. 17, no. 2, April 2002, page 555‐561.
91 Nobuo Takasu, et al, “An experimental analysis of DC excitation of transformers by geo‐magnetically induced currents,” IEEE Transactions on Power Delivery, vol. 9, no. 2, April 1994, p 1173‐1182.
92 P. Picher, L. Bolduc et al., “Study of the acceptable DC current limit in core‐form power transformers,” IEEE Transactions on Power Delivery, vol. 12, no. 1, January 1997, page 257‐265.
93 Matti Lahtinen and Jarmo Elovaara, “GIC Occurrences and GIC Test for 400 kV System Transformer,” IEEE Transactions on Power Delivery, vol. 17, no. 2, April 2002, page 555‐561.

Chapter 5–Power Transformers
44 GMDTF Interim Report: Affects of Geomagnetic Disturbances on the Bulk Power System–February 2012
5.4.3 Tokyo Electric Power Corporation Tests Measurements were made of two large‐scale models with linear dimensions 1/3 to 1/2 of those of actual power transformers. Single‐phase, three‐legged, 1,000‐kV/550‐kV, core‐form (30 MVA) and shell form (6 MVA) transformers were evaluated. These transformers were tested with a DC current level of up to 66 amps, which corresponds to 400‐600 amps/phase for the corresponding full‐size transformers. DC was continuously applied for 20‐30 minutes. The leakage flux and temperatures were measured in windings and structural parts of the transformers. After 30 minutes of large magnitudes of continuous DC current, the maximum temperature measured was approximately 110 degrees Celsius in the core‐form transformer tie plate and the shell‐form transformer core support. The paper suggested temperature rises would have been 1/10th of these values if the tie plates and the core support were made of non‐magnetic steel. The study concluded the short duration of these temperatures would not appreciably affect the transformer life. Also, the short duration of GIC would not allow hot spot temperatures to rise to a fraction of these temperatures. 94
5.4.4 Idaho National Laboratory Tests The Idaho National Laboratory is conducting a set of experiments in which a 138‐kV/13‐kV transformer is subjected to a DC current of 120 amps to determine the effects of harmonics on power system equipment and other electrical loads. Results of these experiments were not available at the time of publication.
5.5 Transformer Vulnerability Assessment Section 9.2.3 of IEEE C57.91 – 1995 summarizes what is currently known in terms of the vulnerability of transformer winding insulation from the perspective of normal and emergency operation winding and other metallic hot spot temperatures: “9.2.3 Risk considerations
Normal life expectancy loading is considered to be risk free; however, the remaining three types of loading (planned overloading, long‐term emergency, and short‐term emergency) have associated with them some indeterminate level of risk. Specifically, the level of risk is based on the quantity of free gas, moisture content of oil and insulation, and voltage. The presence of free gas as discussed in annex A may cause dielectric failure during an overvoltage condition and possibly at rated power frequency voltage. The temperatures shown in table 8 for each type of loading are believed to result in an acceptable degree of risk for the special circumstances that require loading beyond nameplate rating. A scientific basis for the user's evaluation of the degree of risk is not available at this time. Current research in the area of model testing has not established sufficient quantitative data relationships between conductor temperature, length of time at that temperature, and reduction in winding dielectric strength. Additionally, there are other important factors that may affect any reduction, such as moisture content of the winding insulation and rate of rise of conductor temperature.”
94 Nobuo Takasu, et al, “An experimental analysis of DC excitation of transformers by geo‐magnetically induced currents,” IEEE Transactions on Power Delivery, vol. 9, no. 2, April 1994, p 1173‐1182.
Chapter 5–Power Transformers
Effects of Geomagnetic Disturbances on the Bulk Power System–February 2012 45
Placed in context of overheating caused by half‐cycle saturation, it is only possible to say that if the winding and other metallic part, hot‐spot temperatures remain below 180 degrees Celsius and 200 degrees Celsius, respectively, during the short‐term emergency loading timeframe of 15 minutes, it would result in an acceptable degree of risk. Exceeding these suggested temperatures would result in additional, but indeterminate risk. The magnitude, frequency, and duration of GIC flows, as well as the geology and transformer design are key considerations in determining the amount of heating that develops in the windings and structural parts of a transformer and the potential for insulation damage. With the current state of knowledge, the best vulnerability assessment option is to use transformer thermal models to determine the appropriate risk‐free temperatures that specific transformers may reach when subjected to GIC. Thermal models can take many forms, such as the detailed finite element method (FEM) models used by manufacturers or the transfer function models presented in Simulation of Transformer Hot‐Spot Heating due to Geomagnetically Induced Currents.95 If the short‐term emergency temperatures suggested in IEEE C57.91‐1995 are exceeded, a transformer can be flagged as being exposed to a higher degree of risk and deserving of a closer look in the context of its condition (e.g., age, moisture, dissolved gasses). Whether a given transformer can be expected to see such temperatures during a severe GMD event can only be estimated when all relevant factors are considered:
Local ground resistivity and network configuration.
Loading and availability of reactive support.
Voltage and loading limits. Such factors can be estimated using the modeling and simulation considerations discussed in Chapters 8 and 9. GIC reduction devices, system reconfiguration or other mitigation measures could be deployed in transformers flagged as potentially vulnerable. As discussed in Chapter 11, GIC flow reduction devices also require careful studies, notwithstanding cost, performance and maturity considerations as with any given technology.
5.6 Conclusion This chapter describes the parameters that would need to be considered by entities to prepare an informed assessment of the effects of GIC flows on each power transformer within their system. The magnitude, frequency, and duration of GIC, as well as the geology and transformer design are key considerations in determining the amount of heating that will develop in the windings and structural parts of a transformer. The effect of this heating on the condition, performance, and insulation life of the transformer is also a function of a transformer’s design
95 L. Marti, A. Rezaei‐Zare, A. Narang, “Simulation of Transformer Hot‐Spot Heating due to Geomagnetically Induced Currents,” submission to IEEE Transactions on Power Delivery.

Chapter 5–Power Transformers
46 GMDTF Interim Report: Affects of Geomagnetic Disturbances on the Bulk Power System–February 2012
and operational loading during a GMD event. Further, GIC measurement data shows that the change in the magnetic field (dB/dt) and corresponding GIC values vary considerably throughout the duration of a given geomagnetic storm; thus, impacts to the system and power transformers in particular, are time‐dependent. This chapter also reviews past transformer failures from strong GMD events and illustrates that some older transformer designs and those that have high water content and high dissolved gasses or nearing their dielectric end‐of‐life are more at risk to experiencing increased heating and VAr consumption, than newer designs. NERC recognizes that other studies have indicated a severe GMD event would result in the failure of a large number of EHV transformers. Based on the results of this chapter, the most likely worst‐case system impacts from a severe GMD event and corresponding GIC flow is voltage instability caused by a significant loss of reactive power support and simultaneous to a dramatic increase in reactive power demand. Loss of reactive power support can be caused by the unavailability of shunt compensation devices (e.g., shunt capacitor banks, SVCs) due to harmonic distortions generated by transformer half‐cycle saturation. Noteworthy is that the lack of sufficient reactive power support, and unexpected relay operation removing shunt compensation devices was a primary contributor to the 1989 Hydro‐Québec GMD‐induced blackout. NERC has identified a number of recommendations in Chapter 13 to better understand and address the issues identified within this Chapter. NERC intends to pursue additional detailed analyses and assessments to provide results that are open and transparent, and would enable the industry, transformer manufacturers, government agencies, and policy makers to validate the findings.
5.7 References [1] J. Wrubel, “Monitoring for Geomagnetic Induced Current Flow Effects Using Existing EMS
Telemetering,” Conference Proceedings of Power Industry Computer Application Conference, 1991, pp. 44‐49.
[2] R. S. Girgis, R. J. Nevins, “Analysis of Observed Geomagnetically Induced Current Effects on Transformers,” Proceedings of EPRI Geomagnetically Induced Current Conference, June 1992, TR‐100450.
[3] CIGRE Study Committee 12, “Effects of Geomagnetically Induced Currents on Power Transformers,” Electra, no. 141, April 1992.
[4] Ramsis Girgis and Chung‐Duck K.O., “Calculation Techniques and Results of Effects of GIC Currents as Applied to Two Large Power Transformers,” IEEE Transactions on Power Delivery, vol. 7, no. 2, April 1992, pp. 699‐705.
[5] J. G. Kappenman, V.D. Albertson, “Bracing for the Geomagnetic Storms,” IEEE Spectrum, vol. 27, issue 3, 1990, pp. 27‐33.
[6] NERC March 13, 1989 Disturbance Report.
[7] Leonard L. Grigsby, Electric Power Engineering Handbook, 2nd Edition, CRC Press, 2007.

Chapter 5–Power Transformers
Effects of Geomagnetic Disturbances on the Bulk Power System–February 2012 47
[8] C. T. Gaunt, G. Coetzee, “Transformer Failures in Regions Incorrectly Considered to Have Low GIC‐Risk,” IEEE Power Tech 2007, Lausanne, pp. 807‐812.
[9] T. H. Breckenridge, T. Cumming, J. Merron, “Geomagnetically Induced Current Detection and Monitoring,” Developments in Power System Protection Conference, Publication No. 479 IEE 2001.
[10] A. Erinmez, J. G. Kappenman, W. A. Radasky: Management of the geomagnetically induced current risks on the National Grid Company’s electric power transmission system,” Journal of Atmospheric and Solar‐Terrestrial Physics, 64, 2002, p 743‐756.
[11] Transpower New Zealand, System Operators Report, June 2011.
[12] P. Picher, L. Bolduc et al., “Study of the acceptable DC current limit in core‐form power transformers,” IEEE Transactions on Power Delivery, vol. 12, no. 1, January 1997, page 257‐265.
[13] Matti Lahtinen and Jarmo Elovaara, “GIC Occurrences and GIC Test for 400 kV System Transformer,” IEEE Transactions on Power Delivery, vol. 17, no. 2, April 2002, page 555‐561.
[14] Nobuo Takasu, et al, “An experimental analysis of DC excitation of transformers by geo‐magnetically induced currents,” IEEE Transactions on Power Delivery, vol. 9, no. 2, April 1994, p 1173‐1182.
[15] R. A. Walling, A. H. Khan, “Characteristics of Transformer Exciting‐Current During Geomagnetic Disturbances,” IEEE Transactions on Power Delivery, vol. 6, no. 4, October 1991.
[16] X. Dong, Y. Liu, J. G. Kappenman, “Comparative Analysis of Exciting Current Harmonics and Reactive Power Consumption from GIC Saturation Transformers,” IEEE Power Engineering Society Meeting, 2001, pp. 318‐322.
[17] R. Girgis, K. Vedante, “Effects of GIC on Power Transformers and Power Systems”, To be presented at IEEE T&D Conference May 2012
[18] P. R. Price, Geomagnetically Induced Current Effects on Transformers,” IEEE Transactions on Power Delivery, vol. 17, no. 4, October 2002.
[19] L. Marti, A. Rezaei‐Zare, A. Narang, “Simulation of Transformer Hot‐Spot Heating due to Geomagnetically Induced Currents,” submission to IEEE Transactions on Power Delivery.
[20] Metatech Corporation for Oak Ridge National Laboratory, “Geomagnetic Storms and Their Impacts on the U.S. Power Grid,” Meta‐R‐319, January 2010, http://www.ornl.gov/sci/ees/etsd/pes/pubs/ferc_Meta‐R‐319.pdf
Chapter 6–Protection and Control
48 GMDTF Interim Report: Affects of Geomagnetic Disturbances on the Bulk Power System–February 2012
6. Protection and Control
6.1 Introduction During a GMD event, protection and control devices may experience elevated harmonic content and increased risk of current transformer (CT) saturation. Incorrect operation of protection and control devices can lead to unintended isolation of equipment at times when the equipment provides critical support to the system. Isolating components, such as transmission lines, transformers, capacitor banks and SVCs due to a GMD event may reduce margins further, moving the system closer to collapse. The operation of protection and control devices must be assessed to ensure proper operation during a GMD event. Reviewing protection and control devices requires careful understanding of how the devices operate and the role they play in the operating scheme.
6.2 Relay Technology A wide variety of relay types and vintages are in‐service today with assorted operating principles and technologies used to perform their functions. Relay technology has advanced dramatically in the past 25‐30 years, but improved relatively slowly in the years prior. Early vintage relays are electromechanical, designed in most cases for a singular function. As technology advanced, solid state electronic relays became an alternative to electromechanical relays. These relays can consolidate several functions and provide protection via electronic circuitry. In the mid‐1980s, microprocessor‐based relays were introduced that continue to be used today. Electromechanical relays are more susceptible to GIC‐induced misoperation than microprocessor‐based relays, as the electromechanical relays generally lack the ability to filter extraneous signals resulting from distorted wavefronts caused by harmonics. Both relay types are susceptible to CT saturation, but the electromechanical relays are more susceptible to GIC tripping. Today’s microprocessor relay is actually a computer running complex algorithms to sample, filter and operate on the signals provided from the instrument transformers. The filtering and operational methods employed vary depending on the function provided and the techniques implemented by the particular manufacturers. Each relay often provides many protection and control elements in a single unit and may employ more than one method for filtering and operating. When assessing protection and control for susceptibility to GIC influence, it is critical to understand relay operating principles. Electromechanical relays lack the filtering ability available in modern relays and need to be reviewed carefully. Given the limited amount of information available on some of the older designs, testing may be required to determine how the relay will operate under the anticipated conditions. In some applications, it may be advantageous to consider replacing the electromechanical relay with a microprocessor relay capable of filtering fundamental harmonics, and rejecting quasi‐DC GIC signals properly to avoid potential undesired operation.
Chapter 6–Protection and Control
Effects of Geomagnetic Disturbances on the Bulk Power System–February 2012 49
Testing relays of all vintages for proper operation requires that test equipment is available to simulate the analog signals that will be generated in an actual GMD event. Additionally, a baseline event must be identified and modeled to use for playback during testing.
6.3 CT Saturation Similar to a power transformer, CTs may be driven into saturation by GIC. Saturation of a CT results in failure to replicate the primary signal accurately on the secondary side of the CT. Protection systems relying on CT signals are influenced by the erroneous secondary current values presented. CT performance can be modeled relatively easily, and protection engineers should review this during the design process to ensure proper performance during known system conditions. Ideally, the CT is sized to incorporate sufficient margins to accommodate maximum anticipated fault currents that include DC offset, which is similar to GIC. Given the standard transmission system CT design practices, it is unlikely in most instances that GIC alone can saturate protection CTs under non‐fault operating conditions. Even though the GIC may not drive the CT into saturation, it can move it to a point where fault currents combined with the presence of GIC push the CT into saturation at lower fault current values than expected in the design review. Modern relay designs generally take into account the possibility of CT saturation. However, review of CT saturation due to GIC should be considered to avoid unintended relay operation.
6.3.1 Current Differential Protection Current differential relays can be vulnerable to CT saturation. Current differential protection is based on Kirchoff’s Current Law: The sum of the current entering a node (or zone of protection) must equal the sum of the current exiting a node. If this condition is not true, then a fault must exist and action is taken by the differential relay. The relay measures the signals from the CTs bounding the zone of protection. If a fault occurs outside the zone of protection, non‐saturated CTs present current to the relay that sums to zero. If a CT in the protection zone fails to reproduce the signal accurately due to saturation, the difference between the actual signal and the ideal signal shows up in the relay as differential (or operating) current and potentially leads to misoperation. In typical applications, margin is built into the relay settings to account for inaccuracies in the instrument transformers and measuring devices, as well as losses or charging currents (associated with transmission line protection) in the protected primary equipment. During the design and setting calculations, the relay engineer should determine if CT saturation is possible. Settings can be made to accommodate some level of saturation if required due to design constraints. Beyond CT saturation, GIC may affect transformer differential protection in a second way. When sufficient GIC is present, the resulting half‐cycle saturation results in the generation of harmonics. Many transformer differential protection relays include harmonic restraint and or blocking functions. Harmonic blocking prevents the differential relay from tripping when the harmonic content is above a set threshold. Harmonic restraint desensitizes the differential element when harmonics are present, but still allows the differential element to operate even if the thresholds are exceeded. The intent of the harmonic block and restraint functions is to prevent differential operation during transformer energization or voltage recovery when significant operating current is expected under normal conditions.
Chapter 6–Protection and Control
50 GMDTF Interim Report: Affects of Geomagnetic Disturbances on the Bulk Power System–February 2012
However, when GIC is present, the resulting harmonics may actually add security by preventing operation due to the CT saturation described above that may occur coincident with the elevated harmonic content. Conversely, the harmonic block element may prevent or delay operation of the differential protection for real transformer faults occurring during GMD events. For transformers that may be susceptible to GIC flows, harmonic restraint is a better protection scheme than blocking. In such a scenario, the transformer protection falls to other systems, such as overcurrent elements or mechanical measures ‐‐ sudden pressure relays or Buchholz relays. Though the probability of a transformer fault simultaneous with a significant GMD event is small, the relay response warrants study and analysis. For differential schemes that protect equipment other than transformers, the harmonic restraint function is usually not employed. Other types of differential elements that may be used for shunt reactor, bus, and line protection are current differential, alpha plane differential, and high impedance differential elements. Typically, each of these methods provides an avenue for margins to be achieved to balance sensitivity and security.
6.3.2 Distance, Directional, Overcurrent, and Sequence Elements The effect of CT saturation on common line protection methods is generally considered to have a less significant impact than the differential methods described above. Common line protection is composed of phase and ground distance elements, overcurrent elements, directional elements, as well as negative and zero sequence elements. During CT saturation, the current values seen by the relays may be reduced in magnitude and may experience some phase shift. The consequence of the reduced current magnitude values is under‐reaching of distance elements. Depending on the severity and the fault location, this could lead to slower operating time and possible failure of the element to operate. Typically the relay settings include a significant margin to ensure that faults in the primary zone of protection do not go undetected. Directional elements are typically not considered to be subject to misoperation for CT saturation conditions. Protection of transmission lines may also be accomplished using a differential element. CT saturation can affect the operation of these schemes by creating a false mismatch in the input signals that shows up as an operate quantity. Like other differentials, there are methods employed to provide security margins for signal input errors, such as CT saturation. Given typical margins, GIC‐induced saturation is unlikely to create a misoperation in the absence of a fault condition, but could push input errors beyond normal margins if occurring coincident with an external fault condition.
6.4 Harmonics GIC flows can lead to half‐cycle saturation of power transformers and generate significant amounts of odd and even harmonics in the system current and voltages. Devices, such as SVCs and capacitor banks are vulnerable to harmonics if the protection device operates on peak or rms quantities instead of only fundamental quantities. These system VAr support devices are critical to maintaining voltage stability during GMD events where the VAr demand is high. While it is important to protect equipment from damage, settings and methods should be reviewed to

Chapter 6–Protection and Control
Effects of Geomagnetic Disturbances on the Bulk Power System–February 2012 51
prevent false operation of the protective devices during a GMD event. Operation of these relays set to protect capacitor banks and SVCs was a contributing factor to the major disturbance in the 1989 Québec event. Relays that are designed to operate on fundamental components are nearly insensitive to non‐fundamental frequency quantities. However, if the non‐fundamental frequency content is sufficiently high enough to cause distortion of the primary signal through transformer saturation, then the relay’s phasor calculation may have sufficient error that could lead to misoperation in some sensitive applications. For example, some grounded capacitor banks use sensitive neutral overcurrent relays to detect capacitor failure. If the settings are very sensitive, misoperation caused by distortion of the fundamental signal could occur.
6.5 Loss of GPS Signals During a GMD event, information from the global positioning system (GPS) may become unavailable. The availability of an accurate time reference, such as a GPS signal, over a large geographic area allows intelligent electronic devices, such as protective digital relays, to provide precise time‐synchronized event reporting, synchrophasor information, IEC 61850 sampled values, and other similar time‐based applications. Substation GPS clocks enable organizations to distribute precise time information to intelligent electronic devices down to microsecond resolution. The loss of these clocks during a large operational event hampers system operation, as well as protection and control groups, in determining successful operations and troubleshooting suspected misoperations. Additionally, the performance of synchrophasor applications is degraded. Most intelligent electronic devices that use an absolute time source are equipped with an internal clock. Although the internal clocks in the intelligent electronic devices may drift over time, they remain fairly accurate for some period of time in the absence of a GPS signal. The temporary loss of the GPS signal (lasting from a few minutes to possibly a few hours) does not severely impact power system reliable operation. As organizations expand the use of IEC 6185096 and synchrophasor‐based wide area control schemes, there will be more exposure to system operational issues associated with the loss of a GPS clock. Further, back‐up precise time sources are available (e.g., Rubidium time sources, etc.). The loss of GPS clocks should be taken into account when implementing any feasible wide‐area control schemes.
6.6 Protection Communications Communication‐aided line protection schemes are commonly used for power system protection. With communications, traditional protection schemes are augmented with the transfer of information from the ends of the protected transmission line to increase speed and security of the protection scheme. As in the case of relays, there are a variety of vintages and technologies employed in the communications schemes today, including fiber optics, radio, microwave, pilot wire, and power line carrier. The communications used in these schemes
96 IEC‐61850: Communication networks and systems in substations: http://webstore.iec.ch/Webstore/webstore.nsf/Artnum_PK/33549

Chapter 6–Protection and Control
52 GMDTF Interim Report: Affects of Geomagnetic Disturbances on the Bulk Power System–February 2012
should be evaluated to determine susceptibility to effects of the GMD event causing the GIC flow conditions. Additionally, the operation of the complete protection scheme – considering the effects of the loss of communication between protection system equipment caused by GMD events (or other events interfering with communications) – should be reviewed to determine the risk of improper tripping or failing to trip.
6.6.1 Radio-Based Communications Susceptibility of radio communication to solar events is dependent on a number of factors. Long distance transmissions (sky waves) using conducting layers of Earth’s atmosphere to reflect the signal and gain longer distances are affected by solar radiation variances. Short range (ground wave) radio communications are affected by the electrical characteristics of Earth and the radio wave variances. Failure of radio‐based communications can create a variety of problems, from loss of telemetry to an adverse effect on protection schemes. Reports from the 1989 Québec storm indicate numerous radio communications problems, such as fading of microwave and carrier communications and loss of telemetry. Analysis of loss of communication and the impact on protection should be performed.
6.6.2 Wire-Based Communications Wire‐based communications problems have been reported as far back as events in 1860 when telegraph systems were reported to operate abnormally or rendered inoperative. High Earth Surface Potential (ESP) gradients due to geomagnetic storms can cause increased channel noise on wire‐based communications systems. Analysis of loss of communication and the impact on protection should be performed.
6.6.3 Fiber Optic-Based Communications Fiber optic cable is a non‐propagating media for electric and magnetic fields and therefore is considered generally immune to the effects of geomagnetic disturbances.
6.6.4 Power line Carrier Communications During geomagnetic disturbances, power line carrier systems can experience a decrease in the signal‐to‐noise ratio due to GIC production of low frequency and harmonic related noise. However, this effect is unlikely due to the band pass filtering of the power line communication signal traps. Analysis of loss of communication and the impact on protection should be performed.
6.7 March 13, 1989 Hydro-Québec Network: Protection & Control 6.7.1 Hydro-Québec Network Prior to the blackout, the Hydro‐Québec 735 kV main grid network consisted of two groups of five transmission lines transferring power from the remote generation centers in the northern part of the province to the main load centers around the cities of Montréal and Québec. Generation to load area distance is approximately 1,000 km (620 miles). Five lines connect La

Chapter 6–Protection and Control
Effects of Geomagnetic Disturbances on the Bulk Power System–February 2012 53
Grande Complex to the James Bay area, and five lines connect Churchill Falls to the Manicouagan complex.97 Successful operation of such a vast network depends on the reliability of SVCs and shunt reactors that provide the voltage control. During the March 13, 1989, event, a number of these devices tripped due to the intense geomagnetic activity. Contrary to the La Grande Complex system, the Churchill Falls and Manicouagan Complex did not incorporate any static compensation at the time of the event. A consequence of this is that when the SVCs were lost at the onset of the blackout, the La Grande Complex system was the first to separate from the network.
6.7.2 Sequence of Events Leading to the March 13, 1989 Blackout The March 13, 1989, geomagnetic storm and subsequent GIC‐initiated protective relay operations causing seven SVCs on the James Bay network to trip. The seven SVCs tripped within less than one minute in the sequence below:
2:44:17 a.m. Tripping of SVC 12 at Chibougamau substation
2:44:19 a.m. Tripping of SVC 11 at Chibougamau substation
2:44:33 to 2:44:46 a.m. Shutdown of the four SVC’s at the Albanel and Némiscau substations
2:45:16 a.m. Tripping of SVC 12 at La Vérendrye Nine seconds after the loss of the seven SVCs, all five lines of the James Bay network cascaded over an interval of one second. Hydro‐Québec publications [1] do not provide any indication on what protective elements caused the line trips. However, consultation with Hydro‐Québec engineers involved with the event analysis stated the following:
a) Distance elements protecting the lines were subjected to a substantial voltage drop due to the loss of the SVCs and confirmed the high level of line loading.
b) Hydro‐Québec’s philosophy in 1989 was that no intentional out‐of‐step blocking was used on the distance elements protecting the lines, so the power swing accompanying the voltage drop could have been another reason the distance elements operated. It was deemed impossible to save the system if such a power swing occurred.
The tripping of the five lines caused the separation of the James Bay network from the rest of the system. Frequency dropped because of the loss of 9,500 MW of generation out of a total of 21,500 MW. Moreover, the entire system experienced a major voltage drop. Automatic under‐frequency load‐shedding schemes were ineffective because the generation loss was simply too large. Approximately six seconds after the La Grande network separation, an unstable power swing caused the separation of the Churchill Falls network from the system, actually increasing voltage and frequency drops. This separation initiated another load shedding scheme, but all load‐ shedding capability had already been exhausted.
97 The system is v‐shaped, with one branch (called the James Bay Network) connecting the La Grande area generation and the other branch (called the Manicouagan‐Québec Network) connecting the Churchill Falls (in the Province of Newfoundland and Labrador) and Manicouagan area generation to the load areas.

Chapter 6–Protection and Control
54 GMDTF Interim Report: Affects of Geomagnetic Disturbances on the Bulk Power System–February 2012
Eighteen seconds after the Churchill Falls network separation, the entire network collapsed through a combination of voltage and frequency instabilities. However, the blackout was initiated by voltage instability due to the loss of seven SVCs on the La Grande network.
6.7.3 The La Vérendrye-Chibougamau Substations SVCs The time, location and cause of protection failure of the seven SVCs on the La Grande Network are provided as follows:
2:44:17/19 a.m.: Overload (overcurrent) protection tripped two 330 MVA SVCs at the Chibougamau substation. Solid‐state overload elements respond to peak value and are very sensitive to harmonics.
2:44:33/46 a.m.: Four SVCs tripped at the Albanel and Némiscau substations. The unbalance protection and damping resistor overload (overcurrent) elements misoperated due to the presence of harmonics in the input signal.
2:45:16 a.m.: At the La Vérendrye substation, the secondary winding overvoltage protection of the secondary of the 735/265/16 kV 330 MVA transformer tripped the capacitor branch of the last remaining SVC on the James Bay network. As discussed in Appendix 8, this overvoltage protection is based on signal peak detection and is sensitive to harmonics.
The loss of the seven SVCs on the James Bay network was the event that initiated the system blackout. In all cases, tripping of the SVCs was caused by the operation of an overvoltage, overcurrent or unbalance protection element sensitive to the presence of harmonics. The rest of this section analyzes La Vérendrye and Chibougamau SVCs. The same conclusions can be drawn for other substations since the cause of protection malfunction is similar. Table 4 provides the harmonic current and voltage distortion levels present at the La Vérendrye site prior to the blackout. Individual harmonic distortion levels do not necessarily decrease with increasing harmonic order. This phenomenon has not been thoroughly investigated, but is likely due to the system’s frequency response prior to the event (i.e., there is a possibility of harmonic resonance).
Table 4: Harmonic content at La Vérendrye substation
Harmonic Order % of Fundamental Voltage on 735 kV
Side
% of Fundamental Voltage on 16 kV
Side
Thyristor‐Switched Capacitors Current
1(60 Hz) 100% 100% 100%
2 (120 Hz) 7.2% 16.7% 32%
3(180 Hz) 2.1% 4.6% 1.8%
4 (240 Hz) 5.9% 0.9% 3.4%
5 (300 Hz) 1.8% 0.6% 3.4%
At La Vérendrye, a solid state overvoltage device was installed on the 16 kV bus to provide SVC protection. This overvoltage protection tripped the SVC. Following the blackout, the immediate
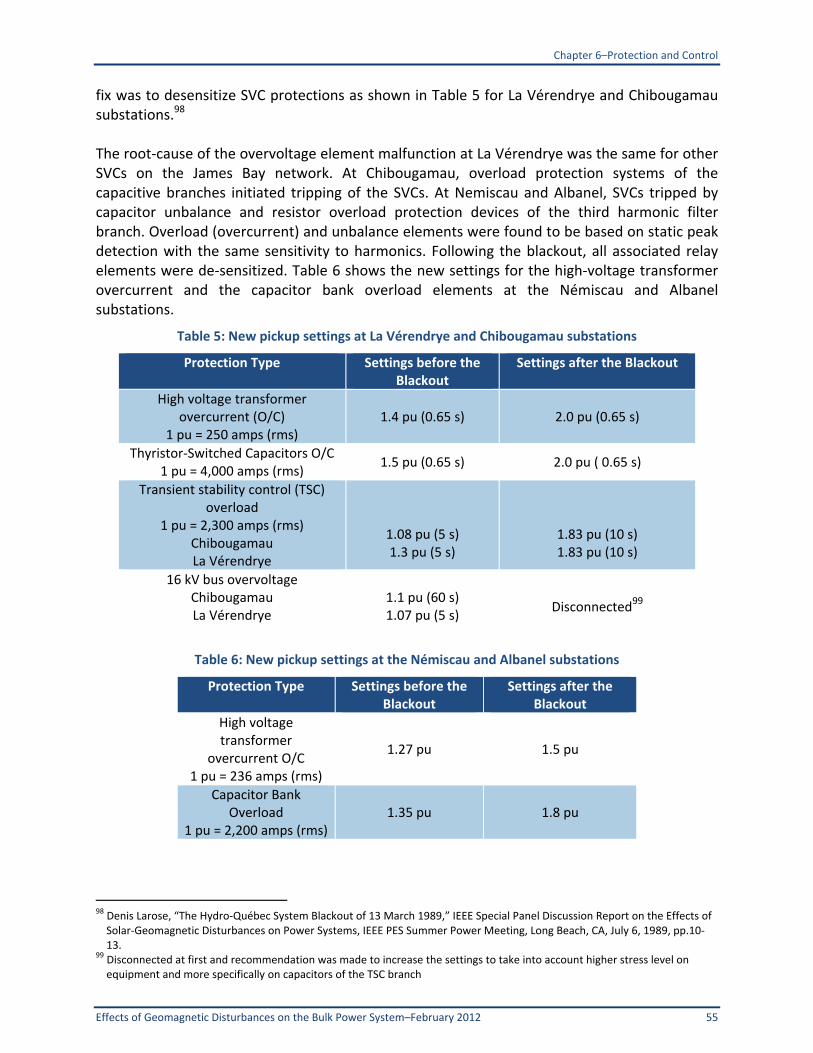
Chapter 6–Protection and Control
Effects of Geomagnetic Disturbances on the Bulk Power System–February 2012 55
fix was to desensitize SVC protections as shown in Table 5 for La Vérendrye and Chibougamau substations.98 The root‐cause of the overvoltage element malfunction at La Vérendrye was the same for other SVCs on the James Bay network. At Chibougamau, overload protection systems of the capacitive branches initiated tripping of the SVCs. At Nemiscau and Albanel, SVCs tripped by capacitor unbalance and resistor overload protection devices of the third harmonic filter branch. Overload (overcurrent) and unbalance elements were found to be based on static peak detection with the same sensitivity to harmonics. Following the blackout, all associated relay elements were de‐sensitized. Table 6 shows the new settings for the high‐voltage transformer overcurrent and the capacitor bank overload elements at the Némiscau and Albanel substations.
Table 5: New pickup settings at La Vérendrye and Chibougamau substations
Protection Type Settings before the Blackout
Settings after the Blackout
High voltage transformer overcurrent (O/C)
1 pu = 250 amps (rms) 1.4 pu (0.65 s) 2.0 pu (0.65 s)
Thyristor‐Switched Capacitors O/C1 pu = 4,000 amps (rms)
1.5 pu (0.65 s) 2.0 pu ( 0.65 s)
Transient stability control (TSC) overload
1 pu = 2,300 amps (rms) Chibougamau La Vérendrye
1.08 pu (5 s) 1.3 pu (5 s)
1.83 pu (10 s) 1.83 pu (10 s)
16 kV bus overvoltage Chibougamau La Vérendrye
1.1 pu (60 s) 1.07 pu (5 s)
Disconnected99
Table 6: New pickup settings at the Némiscau and Albanel substations
Protection Type Settings before the Blackout
Settings after the Blackout
High voltage transformer
overcurrent O/C 1 pu = 236 amps (rms)
1.27 pu 1.5 pu
Capacitor Bank Overload
1 pu = 2,200 amps (rms)1.35 pu 1.8 pu
98 Denis Larose, “The Hydro‐Québec System Blackout of 13 March 1989,” IEEE Special Panel Discussion Report on the Effects of Solar‐Geomagnetic Disturbances on Power Systems, IEEE PES Summer Power Meeting, Long Beach, CA, July 6, 1989, pp.10‐13.
99 Disconnected at first and recommendation was made to increase the settings to take into account higher stress level on equipment and more specifically on capacitors of the TSC branch

Chapter 6–Protection and Control
56 GMDTF Interim Report: Affects of Geomagnetic Disturbances on the Bulk Power System–February 2012
6.7.4 Cause of the 1989 Hydro-Québec System Collapse In all cases of protection element misoperation, the cause was the sensitivity of the protective elements to the harmonics generated during geomagnetic activity. These elements were part of the protection scheme of the SVCs belonging to the La Grande Complex. Other elements protecting transmission lines, generators or transformers have been found to be reliable.
6.7.5 Corrective Actions:
1. Overvoltage, overload and unbalance elements based on solid‐state technology or others that use waveform peak detection have shown that they are prone to misoperate when harmonics are present. In most cases, corrective measures have included desensitizing the elements by raising the pickup value or removing the element when the protection was not essential.
2. Following the blackout, a GIC‐monitoring system was installed at Hydro‐Québec. Among other parameters, the system measures voltage asymmetry (between positive and negative peaks of the voltage waveform) on selected 735‐kV buses. This asymmetry evaluation is equivalent to measuring second harmonic levels in the distorted voltage signal. A direct correlation has been found between GIC activity and second harmonic content in the voltage waveform. Above a given second harmonic threshold, operating procedures direct system operators to reduce loading on the James Bay network and on DC interconnections. Loading on the interconnections is coordinated with neighboring Northeast Power Coordinating Council areas. Load on the James Bay lines prior to the blackout has been assessed as one of the causes leading to the system instability. Moreover, Attachment 4: Current GMD Response Procedures (NPCC Section) describes how information on GMD prediction is communicated to all NPCC areas and how it is managed.
3. In the early 1990s, Hydro‐Québec began installing series compensation on most of its 735 kV transmission lines in the northern areas of the system. Series compensation technology was chosen as part of a number of system projects designed to improve reliability and system transfer capability. Series compensation also provides the added benefit of mitigating the impacts of GMD. The quasi‐DC currents generated by GMD are now blocked from flowing through transmission lines by the series capacitors (infinite impedance to DC currents). This has considerably reduced harmonic levels in the voltage and current waveforms on the system.
4. Hydro‐Québec is continually improving protection reliability by progressively replacing solid‐state relays by digital units with harmonic filtering capabilities. These relays perform better when geomagnetic activity is present.
6.8 Protective Relaying OEM Positions on Relaying Performance Relay manufacturers are encouraged to evaluate and document relay performance and resiliency for their product lines under postulated geomagnetic disturbance scenarios. Manufacturers should provide information on harmonic filtering capability, fundamental current and voltage signal detection, and discrete relay element (distance, directional, overcurrent, sequence) performance with respect to GMD events.

Chapter 6–Protection and Control
Effects of Geomagnetic Disturbances on the Bulk Power System–February 2012 57
6.9 References 1. Denis Larose, “The Hydro‐Québec System Blackout of 13 March 1989,” IEEE Special
Panel Discussion Report on the Effects of Solar‐Geomagnetic Disturbances on Power Systems, IEEE PES Summer Power Meeting, Long Beach, CA, July 6, 1989, pp.10‐13.
2. “The Effect of Solar Magnetic Disturbances on Protective Relaying”, a report by Working Group K11 of the Power System Relaying Committee, Special Panel Session report, IEEE PES Summer Meeting, July 17, 1990, Minneapolis, Minnesota, 90TH0357‐4‐PWR.

Chapter 7–Other Equipment
58 GMDTF Interim Report: Affects of Geomagnetic Disturbances on the Bulk Power System–February 2012
7. Other Equipment
7.1 Introduction This chapter details the adverse effects on other bulk power assets during GMD events.
7.2 Generators During a GMD event, voltage imbalance and harmonic distortion created by GSU transformer and local transformer half‐cycle saturation can impact the generator.100 There have been documented cases of generator failure due to GMD and also evidence of rotor heating and protective relay operation, which could result in damage or loss of generation during a severe solar disturbance. Potential generator susceptibility to GIC effects include:
Increased negative sequence harmonic currents, resulting in increased generator heating due to oscillating rotor flux.
Potential damage to rotor components, including retaining rings and wedges, due to prolonged negative sequence current and rotor heating.
Increased mechanical vibrations and torsional stress due to increased negative sequence currents.
Negative sequence relay alarming, operation, or erratic behavior due to harmonic content of the negative sequence currents.
Previous analysis has found that negative sequence overcurrent relays were not designed for the unique harmonic conditions posed by a geomagnetic storm. Therefore, the relays have exhibited widely different responses to harmonics and they cannot, in general, be relied upon to protect against protracted high harmonic levels.101 To mitigate these effects during a GMD event, the following techniques can be considered:
Reduce power output to increase margin on rotor field amps and allowable rotor heating.
Dispatch additional local generation to reduce loading on a per generator basis and increase local reactive power capacity.
Ensure that allowable negative sequence current is maintained within IEEE C50.13 limits with proper weighting, especially for second and other negative sequence harmonics that are present due to the transformer reaction to GIC. This could be done via operational practices or improved protective relaying design.
The effects on generators during a GMD event are coupled directly with the effects of local transformers driven into half‐cycle saturation. By ensuring an adequate margin for rotor
100 Generators are not directly affected by quasi‐DC GIC due to the isolation provided by the typical delta‐wye transformer used
to connect the generator to the bulk power system. 101 EPRI Report EPRI TR‐102621

Chapter 7–Other Equipment
Effects of Geomagnetic Disturbances on the Bulk Power System–February 2012 59
heating limits is present during an event, the generator operator can mitigate the permanent impacts of GMD on machine life. However for very large events, it may be necessary to protectively trip generating units to avoid potential damage and, in coordination, shed load in specific areas to alleviate the stress to remaining online generating units.
7.3 Capacitor Banks High voltage shunt capacitor banks are generally used for reactive power compensation and voltage support during heavy loading conditions. The effect of harmonic currents generated during half‐cycle saturation depends on a number of factors, such as the grounding configuration of the bank, protection scheme, and system impedance seen by the bank. A shunt capacitor is a low impedance path for the harmonic currents generated during half‐cycle saturation. Therefore, the rms current flowing through the capacitor bank can increase substantially during a GMD event. Capacitor banks can withstand a certain amount of rms overcurrent and overvoltage under normal and contingency conditions (IEEE Standard 18‐2002 for Shunt Power Capacitors102). An illustrative example of capacitor voltage for increasing values of GIC is shown below in Figure 31. Issues to consider:
Grounding. The amount of current depends on grounding. An ungrounded bank will see smaller rms overcurrent than a grounded one because it blocks zero sequence harmonics
Protective relaying configuration.
o Intelligent electronic devices may be set to filter harmonics and, thus, be insensitive to harmonic overcurrents
o Overcurrent protection may or may not be used.
o Unbalance protection. A high voltage capacitor bank normally consists of a number of smaller series and parallel capacitor units (or cans) in order meet nominal voltage and current specification. It is not uncommon for one or more of these to fail. If a sufficient number of units fail, the full capacitor bank is tripped off‐line due to unbalance protection. If the bank is stressed due to harmonic overcurrents during a GMD event and there is no overcurrent protection, the bank is likely to trip on unbalance protection when a number of cans fail. This would make the bank unavailable during the remainder of the GMD event, but would not result in irreparable damage to the bank. Replacement of damaged cans is relatively simple and does not require a dedicated outage.
o Resonance. Depending on the system impedance seen from the capacitor bank, the magnitude of the transformer’s air‐core reactance, and the magnitude of the GIC, a sustained resonance condition is possible. Such conditions would have to be evaluated on a case‐by‐case basis.
102 The standard specifies that under continuous and contingency situations, none of the following should be exceeded: 110% of rated voltage, 135% of nominal rms current, 135% of rated kVAr.

Chapter 7–Other Equipment
60 GMDTF Interim Report: Affects of Geomagnetic Disturbances on the Bulk Power System–February 2012
Figure 31: Illustrative example of capacitor voltage for increasing values of GIC
7.4 Shunt Reactors In general, shunt reactors used for reactive power compensation and voltage control on long, lightly loaded transmission lines do not have a steel core, thus the term air‐core reactors. An air‐core reactor does not saturate and is not affected by the effect of GIC and harmonics caused by half‐cycle transformer saturation.
7.5 Circuit breakers In an inductive network, current can only be interrupted when it becomes zero during a 60 Hz cycle. A high voltage network is largely inductive, and circuit breakers designed to interrupt fault and load currents rely on a zero current crossing to initiate the process of successful arc quenching and current interruption. If the magnitude of GIC is small compared to the magnitude of currents to be interrupted during a fault (a few hundred amperes as compared to tens of kA under fault conditions), a zero crossing in the current to be interrupted will always take place. On the other hand, finding a zero crossing could be an issue if the magnitude of GIC exceeds the peak value of current in a lightly loaded circuit. In such a scenario, the arc between the poles of the circuit breaker would not be interrupted, and could, in principle be sustained for seconds or minutes and eventually damage the circuit breaker. If a breaker fails to clear a fault, the protection and control system would either detect the improper position of the breaker pallet or the persistence of fault current, and a “breaker failure signal” would initiate the backup current interruption process. In the case of load
V
GIC=0
GIC=22A
GIC=63A

Chapter 7–Other Equipment
Effects of Geomagnetic Disturbances on the Bulk Power System–February 2012 61
current interruption, under very large GIC conditions, the contacts would be in the correct position (i.e., open), but the current through the breaker may not be enough to trigger a “breaker failure” signal. This is a low probability issue, but merits additional research and consideration, especially on the part of circuit breaker manufacturers, and protection and control experts.
7.6 Conductors GIC may impact line sag, especially if the circuits are stressed under N‐1 or N‐2 conditions during severe GMD events. The extent of the sag effects is dependent on the line condition, GMD current, and conductor types (see Table 7).
Table 7: Impacts on conductors from GMD
ACSR AAAC AAC ACCC ACSS/TW GAP ACCR INVAR ACSS
Drake Greeley Arbitus Drake Suwanee Drake Drake Drake Drake
Al Cross‐sectional Area (kcmil) 795 927.2 795 1026 959.6 815.4 824 694 795
Conductor OD (in.) 1.108 1.108 1.1026 1.108 1.108 1.095 1.128 1 1.108
DC @ 20 oC (ohm/kft) 0.0214 0.0217 0.0217 0.0163 0.0172 0.0218 0.0201 0.0246 0.0208
AC @ 25 oC (ohm/kft) 0.0221 0.0226 0.0227 0.0169 0.0178 0.0224 0.205 0.0247 0.0215
AC @ 75 oC (ohm/kft) 0.0263 0.0263 0.027 0.0202 0.0213 0.0268 0.0246 0.0295 0.0257
Conductor Temp oC 112 110 118 91 95 114 105 129 110
AC Resistance (ohm/kft) 0.0294 0.0290 0.0307 0.0212 0.0228 0.0301 0.0271 0.0347 0.0287
Sag (ft) (after NESC Heavy) 30 27.9 N/A 17.1 27.6 19.6 25.4 24.1 27.2
DC Resistance (ohm/kft) 0.0294 0.0285 0.0291 0.0210 0.0224 0.0292 0.0263 0.0343 0.0284
DC Resistance (% over ACSR) 100% 97% 99% 71% 76% 99% 89% 117% 97%
GIC Impact
GIC (A) 51.9 53.5 52.4 72.7 68.0 52.2 58.1 44.5 53.7
Total Current (A) w GIC 1251.9 1253.5 1252.4 1272.7 1268.0 1252.2 1258.1 1244.5 1253.7
Conductor Temp (oC) w GIC 120 119 127 99 103 122 114 138 118
New Sag (ft) w GIC 30.4 29.3 N/A 17.1 28.1 20 25.7 24.2 27.7Temp Increase (
oC) w GIC 8 9 9 8 8 8 9 9 8
Sag Increase (ft) w GIC 0.4 1.4 N/A 0 0.5 0.4 0.3 0.1 0.5
GMD E Field: 5V/km=1.524 V/kft
HTLS ConductorsConventional Conductors
Conductor Types
25 oC Ambient temp, Sea level, 30 degree North latitude, Wind 2 ft/sec, 0.5
absorptivity/emissivity, Solar Radiation 96 W/ft2; 1000 ft Ruling Span
Operating Current at 1200 A

Chapter 8–Power System Analysis
62 GMDTF Interim Report: Affects of Geomagnetic Disturbances on the Bulk Power System–February 2012
8. Power System Analysis
8.1 Introduction There has been a great deal of work during the last two decades devoted to the modeling of GIC flows in a power network. However, modeling of the effects of GIC on power apparatus and system performance during a GMD event is not as well developed. Because the most likely outcome from a large GMD event is voltage instability exacerbated protection and control failures, this area requires more work by industry to develop mitigation strategies. From the point of view of a power system engineer, what to model and how to model it depends on the intended uses of the simulation. In this chapter, modeling guidelines are organized based on how power system engineers would complete their analysis to ensure the proper operation of the bulk power system and the protection of major assets during a GMD event. The diagram below summarizes the effects of GIC on the power system stemming from transformers entering half‐cycle saturation (see Chapter 5). Saturation generates harmonics (including even harmonics). Both transformer half‐cycle saturation and harmonics can have a negative effect on transformers causing heating and high levels of reactive absorption, while harmonics in the high‐voltage (HV) network can cause problems in the performance of protective relays (see Chapter 6).
Figure 32: Effects of GIC in an HV transmission network
Harmonics can cause current overloading and tripping of capacitor banks, as well as overheating and generator tripping (see Chapter 7). In order to assess the level of saturation and, thus, harmonics, it is necessary to know the distribution of GIC flows in the bulk power
GIC flows in lines
Transformer half-cycle saturation
Harmonics
Capacitor bank or SVC Tripping – loss or reactive
support
Generator overheating and tripping
P&C incorrect operation
Reactive power loss
Transformer heating
Voltage control, limits, contingency management
Voltage and angle stability
GIC simulations Power system simulations
Chapter 8–Power System Analysis
Effects of Geomagnetic Disturbances on the Bulk Power System–February 2012 63
system. Transformer saturation also affects the power system because the magnetizing currents of the transformer become so large (albeit very distorted) that the effective magnetizing reactance becomes very small during a fraction of cycle. In power flow terms, the effective shunt reactance of the transformer now becomes a “sink” for reactive power and its reactive power consumption increases, or alternatively, there is an effective reactive power loss in the system. The balance of reactive power in the system has a direct impact on system voltages. There are limits for maximum and minimum voltages for the reliable and secure operation of the power system, as well as limits for line loadability and post‐contingency performance (i.e., the system has to be able to operate properly after an accepted contingency, such as fault and subsequent loss of a circuit takes place). These issues are normally studied with power flow simulations. To carry out these assessments, knowing the distribution of GIC flows in every line and transformer of the system under a number of different conditions is necessary.
8.2 Calculation of GIC in a High-Voltage Network There are a number of complex phenomena that cause changes in Earth’s magnetic field and, in turn, induce voltages in high voltage transmission circuits. These induced voltages are the electromotive force that causes GIC to flow if there is a closed path for currents to circulate. These currents have a low frequency (below 1 Hz); therefore, the entire power network can be described using resistances. General simulation guidelines:
The potential induced by the time varying magnetic field is modeled as a voltage source in series with the transmission line.103 The magnitude of the voltage source depends on the relative orientation of the geoelectric field and the geographical orientation of the transmission circuit. If the geoelectric field can be assumed to be constant in the geographical area of a transmission circuit, then only the coordinates of the end points of the line are important regardless of routing twists and turns. The end points of a circuit are defined as the buses to which transformers and/or other circuits are connected.
The transmission line is modeled as a resistor. The DC resistance at operating temperature should be used. Conductor tables typically provide this information.
The network can be modeled as a single phase network since the spatial distances between conductors of a transmission circuit are negligible compared to the distance of the transmission circuit to the electrojet. That is why GICs are often referred to as zero sequence currents (they are the same in all phases).
Transformers can be modeled by their winding resistance to ground. In the case of an autotransformer, the resistance of common and series windings should be modeled separately.
103 D. H. Boteler, R. J. Pirjola, “Modelling Geomagnetically Induced Currents Produced by Realistic and Uniform Electric Fields,” IEEE Transactions on Power Delivery, vol. 13, no. 4, October 1998, pp. 1303‐1308.

Chapter 8–Power System Analysis
64 GMDTF Interim Report: Affects of Geomagnetic Disturbances on the Bulk Power System–February 2012
Equivalent station grounding resistance Rg should be modeled, if known. This is the equivalent resistance of the station grounding mat and the ground wire of all transmission circuits connected to the station grounding mat.
Shunt reactors and shunt capacitors do not have to be modeled. Shunt capacitors represent an infinite resistance to near‐DC currents and shunt reactors are normally connected to tertiary transformer windings and are largely decoupled from the DC network. HV line reactors can be included into the network, but their resistance is usually larger than the transformer winding resistance and their effect is not as important.
Only transformers with a galvanic path between neutral and ground have to be
modeled.
Transmission lines below 230 kV are typically not modeled because the resistances of
conductors used in lines 115 kV and below are usually much higher than those used in
circuits 230 kV and above.
Interconnections to other utilities can be modeled as a transmission line terminated in a
transformer. Normally the approximate geographical orientation and length of the
circuits to the neighboring utility transmission station are known, and generic resistance
values can be used based on voltage level and interconnection capacity.
Once the DC network and the voltages induced on the transmission circuits are known, the calculation of the distribution of DC currents in every branch of the network will provide the GIC flows throughout the studied system. These can be used for further detailed study of equipment vulnerability.
8.3 Calculation of Geoelectric Fields in an HV Network During a GMD event, the voltages induced on transmission circuits at any one point in time depend on a number of complex factors that depend on the interaction between the solar wind, the electrojet and Earth’s magnetic field.104 The geology of the area and geographical location of the transmission circuits also have a strong influence on the induced‐earth potentials. If the intent of the study is to calculate the GIC flows on every branch of the system in real‐time, then magnetic field changes in the area under study must be known and the induced potential can be calculated with a number of well‐established methods.105 If a time series of the magnetic field is known or measured, it is possible to calculate the time series of induced potentials. This calculation could also be used in a real‐time simulation for situational awareness or to study time‐dependent phenomena, such as transformer spot heating during a GMD event.
104 D. H. Boteler, R. J. Pirjola, “Modelling Geomagnetically Induced Currents Produced by Realistic and Uniform Electric Fields,” IEEE Transactions on Power Delivery, vol. 13, no. 4, October 1998, pp. 1303‐1308.
105 Viljanen, A.; , "Relation of geomagnetically induced currents and local geomagnetic variations," Power Delivery, IEEE Transactions on , vol.13, no.4, pp.1285‐1290, Oct 1998

Chapter 8–Power System Analysis
Effects of Geomagnetic Disturbances on the Bulk Power System–February 2012 65
If the purpose of the study is to determine the prevalent GIC flows in lines and transformers for planning purposes, the calculation of the voltages induced in transmission circuits can follow a different approach:
Assume an average geoelectric potential of, say 2, 4, 10, etc. V/km. The highest peak geoelectric potentials in the Hydro‐Québec system during the March 1989 GMD was 1.7 V/km.106
Calculate GICX flow assuming that the direction of the electric field is east‐west
Repeat the calculation assuming that the direction of the electric field is north‐south and obtain GICY.
If the electric field can be assumed to be uniform, then the GIC flow in any line and transformer in the system will be the linear combination of the GICX and GICY and the maximum GIC flow is demonstrated in Equation 1.
Equation 1: Maximum GIC flow in any line
22max yx GICGICGIC
The maximum GIC in a given line or transformer will occur when the direction of the electric field (assuming a reference E‐W field as zero angle) is demonstrated in Equation 2.
Equation 2: Maximum GIC flow in a given line
)/(tan 1xyelectric GICGIC
Note that the GICMAX obtained this way reflects the maximum currents that could flow for a given electric field assumption. This maximum current does not flow in every part of the network at any given point in time because the direction of the geoelectric field changes with time. To assess the performance of the power network, the average geoelectric field assumption must be made first.
8.4 Calculation of Reactive Power losses Due to GIC When a transformer enters half‐cycle saturation, the effective magnetizing reactance of a transformer becomes small and from the point of view of active and reactive power flows, the transformer effectively absorbs more reactive power than when it is not saturated. The amount of reactive power absorbed by a transformer is directly proportional to the flux linkages produced by the GIC in the winding, as well as the core form of the transformer (e.g., single‐phase core, three‐legged, three‐phase, etc.). A number of approximate relationships between GIC and reactive power loss can be found in technical literature.107,108 Figure 33 (on the following page) shows a sample reactive power loss for a single phase transformer 100‐year reference storm. Using such relationships and the GIC
106 Bolduc, L.; Langlois, P.; Boteler, D.; Pirjola, R., “A study of geoelectromagnetic disturbances in Quebec. I. General results “, IEEE Transactions on Power Delivery, Volume: 13 , 1998 , pp. 1251 – 1256.
107 X. Dong, Y. Liu, J. G. Kappenman, “Comparative Analysis of Exciting Current Harmonics and Reactive Power Consumption from GIC Saturation Transformers,” IEEE Power Engineering Society Meeting, 2001, pp. 318‐322.
108 L. Marti, J. Berge, and R. K. Varma, "Determination of Geomagnetically Induced Current Flow in a Transformer from Reactive Power Absorption", Submitted to IEEE Transactions on Power Delivery
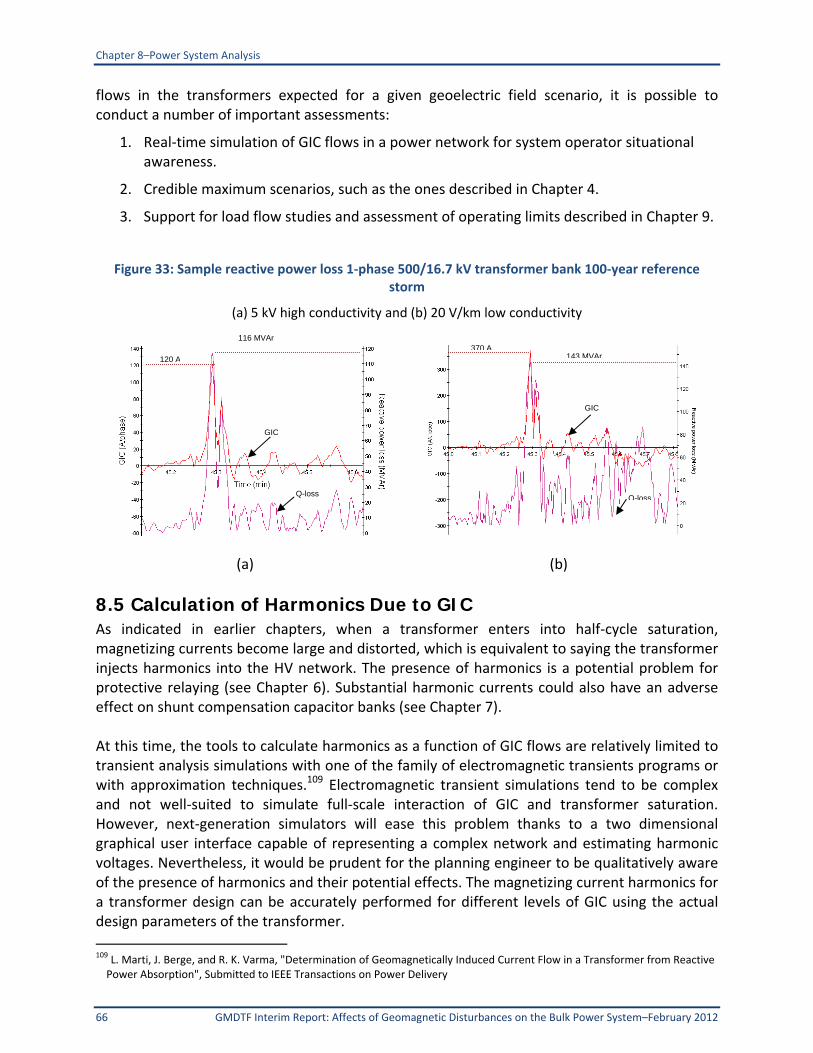
Chapter 8–Power System Analysis
66 GMDTF Interim Report: Affects of Geomagnetic Disturbances on the Bulk Power System–February 2012
flows in the transformers expected for a given geoelectric field scenario, it is possible to conduct a number of important assessments:
1. Real‐time simulation of GIC flows in a power network for system operator situational awareness.
2. Credible maximum scenarios, such as the ones described in Chapter 4.
3. Support for load flow studies and assessment of operating limits described in Chapter 9.
Figure 33: Sample reactive power loss 1‐phase 500/16.7 kV transformer bank 100‐year reference storm
(a) 5 kV high conductivity and (b) 20 V/km low conductivity
(a) (b)
8.5 Calculation of Harmonics Due to GIC As indicated in earlier chapters, when a transformer enters into half‐cycle saturation, magnetizing currents become large and distorted, which is equivalent to saying the transformer injects harmonics into the HV network. The presence of harmonics is a potential problem for protective relaying (see Chapter 6). Substantial harmonic currents could also have an adverse effect on shunt compensation capacitor banks (see Chapter 7). At this time, the tools to calculate harmonics as a function of GIC flows are relatively limited to transient analysis simulations with one of the family of electromagnetic transients programs or with approximation techniques.109 Electromagnetic transient simulations tend to be complex and not well‐suited to simulate full‐scale interaction of GIC and transformer saturation. However, next‐generation simulators will ease this problem thanks to a two dimensional graphical user interface capable of representing a complex network and estimating harmonic voltages. Nevertheless, it would be prudent for the planning engineer to be qualitatively aware of the presence of harmonics and their potential effects. The magnetizing current harmonics for a transformer design can be accurately performed for different levels of GIC using the actual design parameters of the transformer.
109 L. Marti, J. Berge, and R. K. Varma, "Determination of Geomagnetically Induced Current Flow in a Transformer from Reactive Power Absorption", Submitted to IEEE Transactions on Power Delivery
143 MVAr370 A
GIC
Q-loss
116 MVAr
120 A
GIC
Q-loss

Chapter 8–Power System Analysis
Effects of Geomagnetic Disturbances on the Bulk Power System–February 2012 67
8.6 Assessment of Equipment Performance In order to assess the performance of major power apparatus under GIC, it is necessary to know the stresses imposed on equipment and their withstand characteristics when exposed to those stresses. The determination of stresses, namely GIC during a GMD event, can be calculated using the guidelines discussed in this chapter and Attachment 8, using the maximum credible scenarios discussed in Chapter 4 or variations based on the simulations of the power network discussed in the next section. However, such maximum credible threats are not yet an industry standard for use by equipment manufacturer to test the performance under credible and reproducible GIC stresses. That said, these hazard levels can be used by planners to determine impacts and take mitigating actions, balanced against the risk to reliability and overall organizational goals. As discussed, GIC capability vs. load of major equipment, such as transformers, cannot be generalized because the effects are dependent on design and construction details of the transformer and will be different depending on the duration of the GIC pulses. GIC withstand characteristics of major equipment, such as transformers, cannot be generalized because the effects are dependent of design and construction details. Another difficulty is that there are no testing standards against which to assess equipment withstand. This is an area that still requires much work. Industry transformer standards associations (IEEE/IEC) are encouraged to develop such standards. Therefore, in terms of equipment performance, conservative use of engineering judgment in combination with information equipment manufacturers provide to support that judgment, should be used to assess the effects from GMD events.
8.7 Power System Modeling and Analysis Approaches Power system modeling and analysis of GMD events involves a comparison of the power system under steady‐state conditions and when subjected to GIC flows. For context, the power system is operating under normal conditions when:
Generation supplies load and losses.
Bus voltage magnitudes are within accepted limits.
Generation operates within specified real and reactive power limits.
Transmission lines and transformers are not overloaded.
All the conditions above are respected after an accepted contingency, such as a bus fault or protective relaying misoperation.
8.7.1 Load Flow Analysis Many of the potential adverse effects of a GMD event are caused by transformer half‐cycle saturation, which causes the injection of harmonics in the high voltage network and the effective reactive power losses in heavily saturated transformers. The link between the distribution of GIC flows in the network and the performance of the system under steady‐state conditions is reactive power losses. As indicated in Chapter 8, the relationship between GIC

Chapter 8–Power System Analysis
68 GMDTF Interim Report: Affects of Geomagnetic Disturbances on the Bulk Power System–February 2012
flow in a transformer winding and effective reactive power loss depends on the transformer type (e.g., two‐three winding, number of transformer legs, autotransformer, etc.) and construction of the transformer (e.g., single‐phase versus three‐phase, three‐legged core type). Using relationships such as those proposed in Dong et. al., and Marti et. al., the reactive power loss of every transformer in the system can be estimated and modeled in a load flow program as static reactive loads connected to the transformers. The value of these additional reactive loads changes with GIC, which changes according to the direction and magnitude of the geoelectric field during a GMD event. There is no simple way to predict the behavior of the power system under all possible GMD events and system configurations. There are, however ways to reduce the number of studies required to manageable levels. For instance:
Determine the directions of the geoelectric field that cause the largest loss of reactive power in key parts of the network. These key parts are system‐specific but generally known to experienced planning engineers.
Assume that equipment is not vulnerable and increase the maximum geoelectric field until post‐contingency voltages or overloading requires control action.
Once the limits and scenarios from the point‐of‐view of operational performance have been identified, equipment vulnerability, if known (e.g., effects from one of more SVCs tripping) can be included.
The approach suggested above is not a recommendation or guideline. Rather, it illustrates that when the distribution of GIC flows and associated loss of reactive power are known (or reasonably estimated), determining the behavior of the system becomes a substantial but manageable power system analysis problem.
8.7.2 Harmonic Analysis As discussed above, half‐cycle transformer saturation can inject a substantial amount of harmonics into the high‐voltage network. In addition to the potential for relay misoperation discussed in Chapter 6, and potential generator damage/tripping discussed in Chapter 7, there is, in principle, the potential for harmonic resonance. The most common way to carry out harmonic resonance studies is to use the Electromagnetic Transients (EMTP) programs. This is not a trivial exercise. It is nevertheless an important class of studies because the power system is not normally subjected to a sustained mix of even and odd harmonics.
8.7.3 Mitigation Measures by Design Low‐cost, low‐risk, equipment specification practices are available that could increase resilience to GMD events. For instance:
Specify GIC withstand on new transformers. Until such time as industry standards specify levels and testing protocols, withstand levels need to be determined on the basis of system studies. Note that transformer manufacturers may not be able to do a GIC flow withstand test. Such a test requires two auto transformers energized in parallel on the test floor with DC circulating between them. The MVAr required for two saturated transformers is beyond the capacity of most transformer plants.

Chapter 8–Power System Analysis
Effects of Geomagnetic Disturbances on the Bulk Power System–February 2012 69
Request manufacturers to evaluate the GIC flows vs. Load Capability of the transformer design for high peak levels of short duration GIC pulses as well as moderate levels of long duration GIC flow levels. Use these characteristics for the operating procedures.
Specify heating sensors in critical parts of the transformer.
Specify a larger margin in overcurrent withstand of shunt capacitor banks.
Specify full rms overcurrent capacitor bank protection.
Enable operator‐triggered forced cooling on transformers as a standard operational measure on GMD events K7 or higher (or direct GIC measurement or transformer temperature if available). This would buy some lead time by operating transformers at lower pre‐event temperatures.110
Poll harmonic monitoring on IEDs used in transformer differential protection. This is an indirect but simple way to monitor the level of GIC on transformers regardless of type and construction
8.8 Conclusions The combination of increased reactive power absorption and injected harmonics into the system by saturated transformers, changes the worst‐case scenario due to a low probability, high magnitude GMD event, to one of voltage instability and subsequent voltage collapse. Reactive power absorption from saturated transformers would tend to lower system voltages. Tripping of reactive power support from capacitor banks and SVCs due to high harmonic currents at a time when the saturated transformers increases the VAr demand, creates the scenario for voltage collapse. This is exactly what triggered the 1989 Hydro‐Québec blackout. Planners and operators require the technical tools to model GIC flows and develop mitigating solutions, as necessary. The development of these tools includes a combination of GIC flow calculations for a variety of system conditions and configurations, test wavefronts representative of GMD events for a variety of latitudes and ground conductivity structures, and suitable thermal equipment models.
8.9 References [1] D. H. Boteler, R. J. Pirjola, “Modelling Geomagnetically Induced Currents Produced by
Realistic and Uniform Electric Fields,” IEEE Transactions on Power Delivery, vol. 13, no. 4, October 1998, pp. 1303‐1308.
[2] Bolduc, L.; Langlois, P.; Boteler, D.; Pirjola, R., “A study of geoelectromagnetic disturbances in Quebec. I. General results “, IEEE Transactions on Power Delivery, Volume: 13 , 1998 , pp. 1251 – 1256.
[3] X. Dong, Y. Liu, J. G. Kappenman, “Comparative Analysis of Exciting Current Harmonics and Reactive Power Consumption from GIC Saturation Transformers,” IEEE Power Engineering Society Meeting, 2001, pp. 318‐322.
110 Static Electrification occurs when electrons are stripped away from the oil as it rubs on the winding insulation pressboard washers as the oil passes through the oil ducts at a high velocity, caused by forced cooling.

Chapter 8–Power System Analysis
70 GMDTF Interim Report: Affects of Geomagnetic Disturbances on the Bulk Power System–February 2012
[4] L. Marti, J. Berge, and R. K. Varma, "Determination of Geomagnetically Induced Current Flow in a Transformer from Reactive Power Absorption", Submitted to IEEE Transactions on Power Delivery
[5] Investigation of Geomagnetically Induced Currents in the Proposed Winnipeg‐Duluth‐Twin Cities 500 kV Transmission Line, EPRI EL‐1949, July 1981.
Chapter 9–Grid Monitoring Enhancement
Effects of Geomagnetic Disturbances on the Bulk Power System–February 2012 71
9. Grid Monitoring Enhancement
9.1 Introduction An essential part of a GIC flow mitigation program is to install monitors to measure GIC flow and harmonics on a continuing basis. Monitors are a key source of real‐time information that can guide system operators in determining real‐time response. The monitors can also provide valuable historical records of previous storm activity that can be evaluated and factored into power system planning and analysis. Coupled with alerts and warnings that may be issued by the SWPC or CSWFC, the monitoring data can provide the reinforcing message that a GMD event is imminent or in progress and can spur action. In order to mitigate the risk of GMD events impacts on power grids, installation of monitors is recommended to detect and evaluate GIC and harmonics at multiple locations. The placement of the monitors is influenced by a number of vulnerability factors, including system topology, local geology, transformer type, etc. A GIC flow and harmonics monitoring system can provide additional information to help system operators evaluate imminent risk to transformers due to GIC and take appropriate actions, preventing equipment damage and system blackout. Attachment 6 provides an example of monitoring systems from an asset owner’s perspective. The monitoring system comprises both the monitoring of GIC flows and harmonics. GIC flows, second and fifth harmonics, MVAr, MW, and voltages on key transformers should be monitored, as well as the rate of change of these variables. The Kp index provided by the space weather forecasters should also be documented for post‐event correlation analysis.
9.2 GIC Flow Monitoring The GIC flow monitoring system includes a Hall‐effect DC current transducer and a GIC relay. GIC data can be passed from the transducer by GIC relay via fiber to a remote terminal unit (RTU) in a control house.
9.2.1 Hall-Effect DC Current Transducer The DC current transducer is a Hall‐effect sensor integrated with an output amplifier. The DC sensor should accommodate at least +/‐500 amps of DC current with an extended temperature range.111,112 The Hall‐effect sensor is available in different sizes for different applications. Appropriate sensor size must be chosen to fit transformer neutral insulated cables. Additionally, Hall‐effect transducers should be tested for accuracy, including conducting tests on temperature measurement accuracy and measuring DC with an AC background.
111 A DNP 3.0 protocol can be used to meet NERC Critical Infrastructure Protection (CIP) requirements, and a 0.5% resolution will be required over a ‐40 ~ 60°C temperature range.
112 Normally the standard outputs of the DC transducer can be either AC/DC current (e.g., 4 ~ 20 mA) or DC voltage (e.g., +/‐ 5 V DC or +/‐ 10 V DC). +/‐ 10VDC output is preferable if it is fed into a GIC relay.

Chapter 9–Grid Monitoring Enhancement
72 GMDTF Interim Report: Affects of Geomagnetic Disturbances on the Bulk Power System–February 2012
9.2.2 GIC Monitoring System Installation For a typical GIC installation, a DC transducer cabinet and a GIC relay cabinet are added to the existing transformer neutral structure. The GIC relay cabinet connects to an RTU and/or a local substation computer.
9.3 Harmonics Monitoring In order to minimize hardware/installation cost associated with harmonics monitoring, using existing transformer protection intelligent electronic device relays to provide harmonics information is preferable. If the existing transformer protection uses old electromechanical relays, such as BDD relays, a standalone harmonics monitoring device can be installed to monitor harmonics, MVAr, MW, voltage, etc. Some devices can provide harmonics monitoring to the 50th order. Oscillography waveforms can also be captured from a transformer relay triggered by the GIC level. The waveforms can be stored in the local computer for post‐event analysis. A visualization and decision tool is needed to help operators implement appropriate actions based on a combined GMD event index, which can comprise the following monitoring data:
GIC flows
Harmonics
Rate of MVAr changes
Transformer temperature rise
GMD forecast
Alarm displays should be developed based on different trigger thresholds of the combined GMD index. Transformer subject matter experts and vendors should be consulted to develop an algorithm for appropriate alarm triggers. Operating procedures can be enhanced and refined based in part on the combined GMD index.

Chapter 10–GIC Reduction Devices
Effects of Geomagnetic Disturbances on the Bulk Power System–February 2012 73
10. GIC Reduction Devices
10.1 Introduction A number of mitigation approaches can be used to address those transformers viewed to be vulnerable to failure, as well as their criticality to system operation. One mitigation approach involves the installation of neutral current blocking devices on transformers that are designed to block or impede the flow of GIC (quasi‐DC) where the current couples to the power system. Neutral blocking philosophy has been researched and tested by EPRI.113 In addition, similar transformer neutral devices have been installed elsewhere in the industry for GIC mitigation and other operational conditions. In principle, the simplest approach to reduce GIC flows in substation equipment is to place relatively high impedance device in series with the path formed by the transmission circuit, the transformer, and Earth return (see Figure 39). The most economical and convenient point to place this impedance is in series with the neutral‐to‐ground connection of a transformer. The commonly‐proposed methods include either a neutral resistor or a capacitor. However, line configuration and equipment can also alter GIC flows. For example, series compensated lines automatically reduce or block GIC, although GIC blocking is not the driver for the installation of series compensation capacitors. Hydro‐Québec has implemented series compensation on its main grid, mainly for stability reasons, and Hydro‐Québec has also used specific capacitors blocking devices on three AC transmission lines close to Radisson substation, for the express purpose of blocking DC current coming from GIC or from a nearby DC tie. The application of line series capacitor banks is a mature technology, which can be costly, but has a significant operating history. Series capacitors are covered by IEEE Standard 824.114 The term “GIC blocker” is sometimes used to describe a GIC reduction device or GIC Mitigation System. (This is probably misleading in the case of a neutral resistor since their values are
typically in the 2 to 5 range and the level of reduction achieved depends on the relative resistance of the transformer‐line‐resistor loop.) A neutral capacitor inserts larger impedance into the loop at GIC frequencies of 1 milliHertz to 100 milliHertz, and its effect would be relatively independent of the resistances in the loop. Nevertheless, the term GIC Reduction Device (GRD) is more precise and is used throughout this chapter.
113 The testing consisted of computer simulations, laboratory prototypes, and in actual full scale projects installed at Minnesota Power. These EPRI projects, documented in reports EL‐3295 (December 1983) and TR‐100450 (June 1992), demonstrated the viability of neutral blocking devices for mitigating the effects of GIC.
114 IEEE Standard 824‐2004 is focused on series capacitor bank components and bank duty cycle ratings, equipment insulation levels, protective functions, component testing, instruction books, nameplates, and safety. This is the current version of the standard and represents a significant update to its predecessor, IEEE 824‐1994.

Chapter 10–GIC Reduction Devices
74 GMDTF Interim Report: Affects of Geomagnetic Disturbances on the Bulk Power System–February 2012
Figure 39: Placement of a GIC reduction device (GRD)
The largest GIC flows in an HV network normally take place at voltage levels above 230 kV. Transmission circuits below 230 kV generally have much higher DC resistance per unit length, and their contribution can be ignored in most cases. Similarly, the higher the operating voltage, the lower the resistance per unit length of the transmission circuit is and the higher the GIC flow for a given induced geoelectric field. For instance, the DC resistance of a 230‐kV line can
range from 0.04 to 0.06 / km, while the resistance of 500‐kV lines can range from 0.01 to 0.02
/km. The GIC injected by a transmission circuit become constant, regardless of line length, when the resistance of the line dominates the resistance of the loop (because both line resistance and induced geoelectric field are proportional to line length). For instance, GIC in a double‐circuit becomes practically constant after 50 km, whereas a double‐circuit 500‐kV line becomes practically constant after 100 km. Winding resistances of transformers depend on the MVA rating and winding voltage levels. For
transformers in the 230‐kV to 500‐kV class, winding resistances can range from 0.05 to 0.5 . In Figure 37, the loop resistance of the circuit is 1.15 , and it consists of the line resistance (assuming a 100‐km, 500‐kV line; RDC = 0.01 /km), a transformer winding resistance of 0.05
, and a station grounding resistance of 0.1 .
A 2 neutral resistor in the single‐phase loop shown in Figure 39 would reduce GIC by a factor
of 1.15/3.15 = 0.37. In a three‐phase network, the reduction of GIC per phase with a 2 neutral resistor is found below in Equation 3.
Equation 3: Calculation of GIC per phase
18.0)21.0(305.01
1.0305.01
10.2 Placement of a GIC Reduction Device The effects of a single GIC reduction device are local in nature because only GIC flowing in one loop is reduced. In the system shown in Figure 40, a GIC reduction device placed in only one transformer would shift the total GIC contributed by the lines connecting to station to the other transformer.

Chapter 10–GIC Reduction Devices
Effects of Geomagnetic Disturbances on the Bulk Power System–February 2012 75
Figure 40: Simple HV network
The placement of a GIC reduction device depends on where the reduction in GIC is required or identified by system study. When the area or location of GIC reduction is identified, there are a number of system and equipment factors to consider, such as:
Transformer winding connection (e.g., wye‐delta, or wye‐wye – tertiary windings are normally ignored in quasi‐DC GIC calculations).
Type of transformer (e.g., two‐winding or autotransformer).
Type of network connection (e.g., line tap, transmission station).
Type of network configuration (radial or meshed).
Orientation of the circuits that form part of or are connected to the loop.
In addition, a system study needs to be carried out to assess the effect of the GIC reduction device on multiple system configurations and conditions. Further interconnection‐wide study is required to determine how GIC reduction devices s may redistribute the flow of GIC across the system, influencing GIC in other transformers and on the network of neighboring interconnected systems.
Figure 41: HV transmission network with generator step‐up (T4 &T5) and local supply transformer (T3)
From the point of view of GIC, a DC current reduction device connected to the neutral of an autotransformer can reduce the amount of GIC in the common winding, which in turn reduces the level of saturation of the selected transformer, and reduces impacts on harmonic generation and effective reactive power loss. However, the neutral impedance will also have the effect of allowing more “through” current to circulate in the HV and low voltage (LV)

Chapter 10–GIC Reduction Devices
76 GMDTF Interim Report: Affects of Geomagnetic Disturbances on the Bulk Power System–February 2012
terminals (see Figure 42). In a more complex situation, like the one shown in Figure 41, placing GIC reduction device at autotransformers located at points T1 and T2 would likely push/transfer GIC into step‐up transformers located at points T4 and T5.
Figure 42: GIC flow in an autotransformer
Placement of a GIC reduction device on a tap transformer (e.g., T3 in Figure 41) only reduces the GIC flow on that transformer. The orientation of the transmission lines connected to the transformer buses can have a significant influence on the placement of GIC reduction devices. Typically in planning studies, GIC flow is calculated twice: first assuming east‐west (E‐W) electric field orientation and then assuming a north‐south (N‐S) field orientation. If the geoelectric field can be assumed to be uniform or coincident in the system under consideration, the worst case potential maximum will be the vector sum of GIC N‐S orientation and GIC E‐W orientation.
10.3 Selection of GIC Reduction Devices The evaluation of the advantages and disadvantages of vendor‐specific GIC reduction devices is not within the scope of this report. However, installing impedances in the neutral of a transformer can pose electrical considerations that can affect transformer reliability and safety. Typical transformer insulation systems are originally designed as solidly‐grounded wye systems. These designs typically incorporate a reduced transformer neutral basic insulation level (BIL) rating. Inserting impedance in the neutral connection can create voltage levels that exceed the transformer neutral BIL rating. Therefore, engineers must account for and limit overvoltages at the neutral and phases for the full range of operating conditions: including, but not limited to through faults, load imbalances, transient recovery voltage (TRV) events, excessive third harmonics, lightning, internal faults, bolted faults, circulating currents, ferroresonance, etc. The general functional requirements and system issues that should be taken into consideration in the specification of a GIC reduction device will be discussed. These depend on whether a resistor or a capacitor is used as the GIC reduction device.
10.3.1 Neutral Resistors The specification of the size of a neutral resistor depends on a number of factors:
Maximum overvoltage across the resistor during fault and transient conditions. The neutral of a transformer designed to be solidly or impedance‐grounded may have a
Chapter 10–GIC Reduction Devices
Effects of Geomagnetic Disturbances on the Bulk Power System–February 2012 77
relatively low neutral BIL. The size of the resistor is constrained by neutral currents during ground faults. Overvoltage due to switching transients can be managed with a neutral surge arrester.
Transient overvoltage (TOV) during ground faults should be reviewed against existing surge arrester TOV ratings.
Effect on protection systems. The size of the resistor must be low compared to the winding impedances to keep the transformer effectively grounded. Care in selecting resistor size must be taken not to desensitize relay settings.
Transient and continuous thermal ratings. These are determined by ground fault currents and system imbalance assumptions, respectively.
Physical size. For example, one vendor estimates the dimensions of a 2 resistor rated for 12‐kA fault currents as approximately 17 feet in length, 8 feet in height, and 6 feet in width.
Insertion or bypass. A neutral resistor can be left permanently connected to the neutral of a transformer if the system imbalance and continuous rating of the resistor are such that thermal losses are not an issue. Otherwise, a bypass breaker or load‐break switch is needed to insert the resistor during a GMD event, and remove it when it is not needed.
Failure mode. The resistor assembly must be instrumented and bypassed upon failure of any component (e.g., resistor or arrester failure).
10.3.2 Neutral Capacitors A neutral capacitor represents the introduction of large impedance into a GIC loop at GIC frequencies. Therefore, potential GIC reduction in a given loop is much higher than with a neutral resistor. However, the ohmic value at 60 Hz has to be very low to reduce the impact on the power system, which indicates a large capacitance. The specification of a neutral capacitor depends on a number of factors:
Ohmic value should be low. 43.2 have been suggested in the literature. This means a physically large capacitor.115
Short circuit and steady‐state rating. A neutral capacitor may increase ground fault levels. In such a case, it must be managed with a reliable bypass scheme. It may not be an option in stations at or close to their short circuit limits.
Since the capacitance is large, there is the risk of creating linear harmonic resonance. Further, to avoid displacing GIC to other transformers in the station, multiple neutral capacitors would have to be installed, thus potentially increasing the risk of linear resonance at even lower frequencies. Linear resonance can create extremely high overvoltage and catastrophic insulation failure. The need to avoid linear resonance is not preempted by the use of a bypass scheme, since the loss or failure of a bypass scheme is a valid contingency. Therefore, a careful
115 Kappenman, J.G.; Norr, S.R.; Sweezy, G.A.; Carlson, D.L.; Albertson, V.D.; Harder, J.E.; Damsky, B.L.; , "GIC mitigation: a neutral blocking/bypass device to prevent the flow of GIC in power systems," Power Delivery, IEEE Transactions on , vol.6, no.3, pp.1271‐1281, July 1991
Chapter 10–GIC Reduction Devices
78 GMDTF Interim Report: Affects of Geomagnetic Disturbances on the Bulk Power System–February 2012
harmonic resonance assessment taking into consideration maintenance outages and other possible configuration changes is necessary.
Maximum overvoltage across the capacitor during steady state and ground fault condition may be managed with a bypass scheme.
Bypass scheme: This issue is more complex in the case of neutral capacitors than in the case of neutral resistors. In the case of a fault or other system transients, it requires a fast bypass element (usually with a choke and a damping resistor), as well as a slower bypass breaker. Additionally, control circuitry/logic is needed to provide the firing signal to the bypass device, possibly based either on neutral current or neutral voltage supervision. From a power engineer’s point of view, this would be similar to the specification of a series compensation capacitor assembly, but at a smaller scale.
Failure mode: Given the complexity of the assembly, component failure is expected to require taking the transformer out of service.
The use of GIC reduction devices require system studies that may grow in complexity with the number of devices installed. The effect of GIC reduction devices is relatively local and according to Kirchoff’s Law, there is no way to avoid GIC flow redistribution. The implementation of GIC reduction device must be considered in the backdrop of cost, the criticality of the equipment that is meant to be protected, the vulnerability of the transformer, the impact of flow diversion to other transformers, and the inevitable loss of reliability caused by the introduction of complex non‐static equipment into the power system.
10.4 Functional Specification of GIC Reduction Devices A functional specification defines in high‐level terms the expected performance of a device. Functional specifications depend on a number of factors, such as the ones discussed in Section 11.3. On the other hand, a functional specification must meet specific utility, operator, and regulatory requirements. The following is presented as an illustrative example.
Fail safe – the assembly must provide a ground path at all times.
The assembly must not create any linear or ferroresonance conditions – under normal operation or due to the failure of one its components.
The assembly must be maintainable – removed and re‐inserted without transformer outage.
The system must:
o Handle insertion/bypass under GIC conditions
o Be able to withstand full range of normal and abnormal operating conditions
o Be controllable remotely with automatic sensing and insertion
o Incorporate self diagnostics
o Meet applicable standards. If no standards exist, system components must meet applicable standards.
Chapter 11–Operating Procedures to Mitigate GIC
Effects of Geomagnetic Disturbances on the Bulk Power System–February 2012 79
11. Operating Procedures to Mitigate GIC
11.1 Introduction This section covers the importance of enhancing system operating procedures to mitigate the impact of GIC in the bulk power system.
11.2 Operating Procedures Operating procedures are the quickest way to put in place actions that can mitigate the adverse effects of GIC on system reliability. They also have the merit of being relatively easy to change as new information and understanding concerning this threat becomes available. Both system operating and transmission owner organizations need to have appropriate procedures and training in place. The procedures of these organizations need to be coordinated with each other and with their neighboring organizations. Operating procedures need to be easily understood by, and provide clear direction to, operating personnel. This is especially true since most operators are unlikely to frequently respond to significant GMD events.
11.3 Information Needed for Decision-Making Information and indications that can be used as inputs for the decision‐making process embedded in these procedures may be considered in two categories: 1) those that are immediately available, and 2) those that can be made available in the future. 116 Immediately available information includes the warnings provided by NOAA and other agencies and the indications already available to operators from their existing Supervisory Control and Data Acquisition (SCADA) systems. Information that can and should be made available in the future includes the following:
GIC system models both for offline studies and as part of a real‐time analysis tool.
Studies that identify system vulnerabilities and actions most likely to help.
Determinations from these studies as to where to add GIC (and other) sensors.
Improved monitoring with additional sensors and links to outside information sources.
Listing transformers that are particularly vulnerable to the effects of GIC.
Thresholds for actions based on this enhanced knowledge.
116Some of the actions listed below should only be taken if supported by an adequate GIC system impact study and/or if adequate monitoring systems are available. Otherwise they can make matters worse. Those actions are indicated by the phrase “if supported by studies.”

Chapter 11–Operating Procedures to Mitigate GIC
80 GMDTF Interim Report: Affects of Geomagnetic Disturbances on the Bulk Power System–February 2012
11.4 Items to Consider: Studies and Operating Procedures A combination of operating strategies can be employed to mitigate the impacts of GIC during a GMD event. Strategies need to be applied based on the characteristics of the system, assessment of vulnerabilities to GIC, and may include:
1. Reduction of equipment loading by re‐dispatch of generation, returning outage equipment to service, starting off‐line generation, and selective load shedding has the following benefits:
a. Allows the equipment loading to tolerate the increased VAr and harmonic loading.
b. Reduces the transformer operating temperature, thus permitting additional temperature rise from transformer saturation.
c. Prepares for the contingency of possible loss of transmission capacity due to transformer loss.
2. Unloading the reactive load of operating generation will provide operating margin in the case of possible loss of system reactive capability from SVC and shunt capacitors. Shunt capacitive devices are particularly vulnerable to the increased system harmonics and may trip during such an event. Shunt capacitors become a short for the harmonics, thus possibly overloading the capacitor and being sensed by relaying. Modifying protective relaying to prevent unnecessary tripping of these assets due to GIC may be the single most important action to prevent voltage collapse during GMD events (see Chapter 6).
3. Reductions of system voltage through reduced generator and load‐tap changer (LTC) set‐points and less insertion of capacitors have the following benefits:
a. Reduces system voltage, which could allow the transformer to operate farther from the saturation points of the transformer core. The transformer would then require less excitation current when the magnetic flux is biased due to GIC.
b. Lowers system voltage, which can reduce the loading on the capacitor, allowing an increased harmonic loading of capacitors.
4. If supported by study, given the low probability of events, system and/or equipment isolation through reconfiguration can be used to preserve equipment from damage from GIC and may limit the risk exposure to certain regions of the bulk power system. Because GMD events are relatively short lived, the controlled islanding and potential collapse of portions of bulk power system will contain the customer impact to the length of time to restore portions of the bulk power system. This is in contrast to the greater customer service impact from failure of long, lead‐time equipment.
a. This mitigation technique has the following benefits:
i. Monitors transformers to determine if overheating is occurring and takes them off line if permanent damage to the transformers is imminent. Relay systems could be employed that could be set to trip a transformer unit at some point before permanent damage could occur. The effect of DC bias on breaker operation must also be considered for this option.

Chapter 11–Operating Procedures to Mitigate GIC
Effects of Geomagnetic Disturbances on the Bulk Power System–February 2012 81
ii. Operational areas that have the proper balance of load and generation may reduce effects of GIC by opening long transmission lines most influenced by GMD. This may, in essence, result in fragmentation of the power grid that could have a positive effect.
b. This mitigation technique has the following risks:
i. Given the current uncertainty with solar weather forecasting, unnecessary disruption of normal network service in anticipation of an event could limit the effectiveness of this approach. Operators may be hesitant due to the consequences of loss‐of‐service to segments of the network. Of course, this risk can be mitigated with good planning studies, operating procedures and suitable monitoring.
ii. Because there are economic consequences of taking these actions, legal measures might ensue after the fact.
11.5 Geomagnetic Disturbance Operator Training Operator training on GMD should cover these (as well as other) topics:
Disruption of some telecommunications and satellite communications systems used to support grid operations, including SCADA and GPS systems. Disruption of GPS signals may impact phasor measurement unit (PMU) systems.
GIC flows are wide‐area, quasi‐DC currents that can enter transmission systems via any ground point. GIC flows, in some highly susceptible areas, have the potential to drive certain transformers into half‐cycle saturation, which can result in excessive VAr demand on the transmission system. A few older transformer designs may be subject to permanent damage.
In some cases, tripping of reactive sources, such as shunt capacitors and SVC devices, may occur. If power system reactive reserves become inadequate, voltage collapse could result.
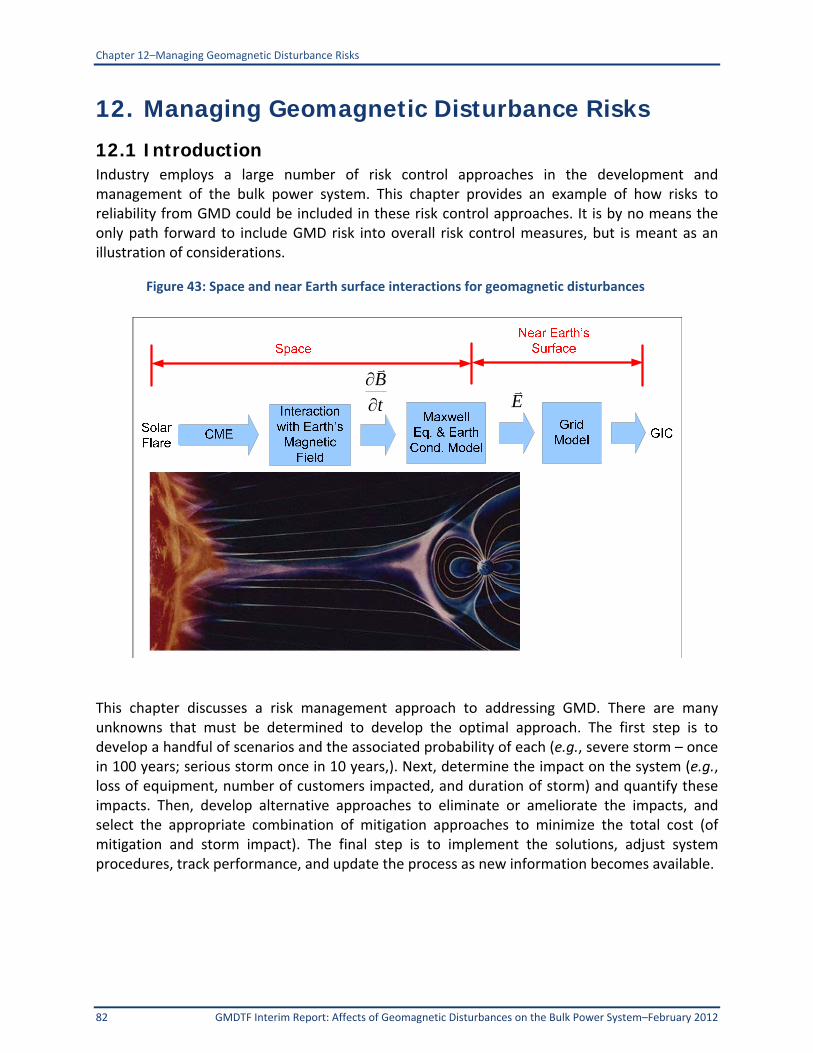
Chapter 12–Managing Geomagnetic Disturbance Risks
82 GMDTF Interim Report: Affects of Geomagnetic Disturbances on the Bulk Power System–February 2012
12. Managing Geomagnetic Disturbance Risks
12.1 Introduction Industry employs a large number of risk control approaches in the development and management of the bulk power system. This chapter provides an example of how risks to reliability from GMD could be included in these risk control approaches. It is by no means the only path forward to include GMD risk into overall risk control measures, but is meant as an illustration of considerations.
This chapter discusses a risk management approach to addressing GMD. There are many unknowns that must be determined to develop the optimal approach. The first step is to develop a handful of scenarios and the associated probability of each (e.g., severe storm – once in 100 years; serious storm once in 10 years,). Next, determine the impact on the system (e.g., loss of equipment, number of customers impacted, and duration of storm) and quantify these impacts. Then, develop alternative approaches to eliminate or ameliorate the impacts, and select the appropriate combination of mitigation approaches to minimize the total cost (of mitigation and storm impact). The final step is to implement the solutions, adjust system procedures, track performance, and update the process as new information becomes available.
t
B
E
Figure 43: Space and near Earth surface interactions for geomagnetic disturbances

Chapter 12–Managing Geomagnetic Disturbance Risks
Effects of Geomagnetic Disturbances on the Bulk Power System–February 2012 83
12.2 Risk Assessment Guide The listing below provides a potential phased approach an organization might consider as part of their risk control strategies (see Figure 44):
1. Phase one: Assess and baseline the risk.
a. Improve understanding of the severity of the storms as a function of time. This includes mining NOAA data on storm severity.
b. Understand the risk to transformers as a function of storm severity.
c. Understand the risk to the power system as a function of storm severity.
2. Phase two: Perform technical and programmatic analysis.
a. Develop transformer models.
b. Develop power system models.
c. Create a list of approaches to eliminate or ameliorate GMD impacts.
d. Assess the efficacy of each approach through modeling and testing. Evaluate the value of the approaches ‐‐ calculating costs and the associated reduction in risk for each risk or combination of risks.
e. Present and describe example approaches (e.g., improved forecasting, improved monitoring, improved visualization, improved operation approaches, improved hardware blocking devices, and more resilient transformers).
3. Phase three: Develop integrated solutions.
a. Determine the optimum combination of countermeasures to produce the lowest total cost.
b. Note that the risk varies as a function of latitude, geology, and voltage class. Therefore the optimal strategy varies as well.
4. Phase four: Implement solutions and adjust system procedures.
a. Apply the approaches and track performance.
b. Update the process as new information on the risk and new approaches become available.
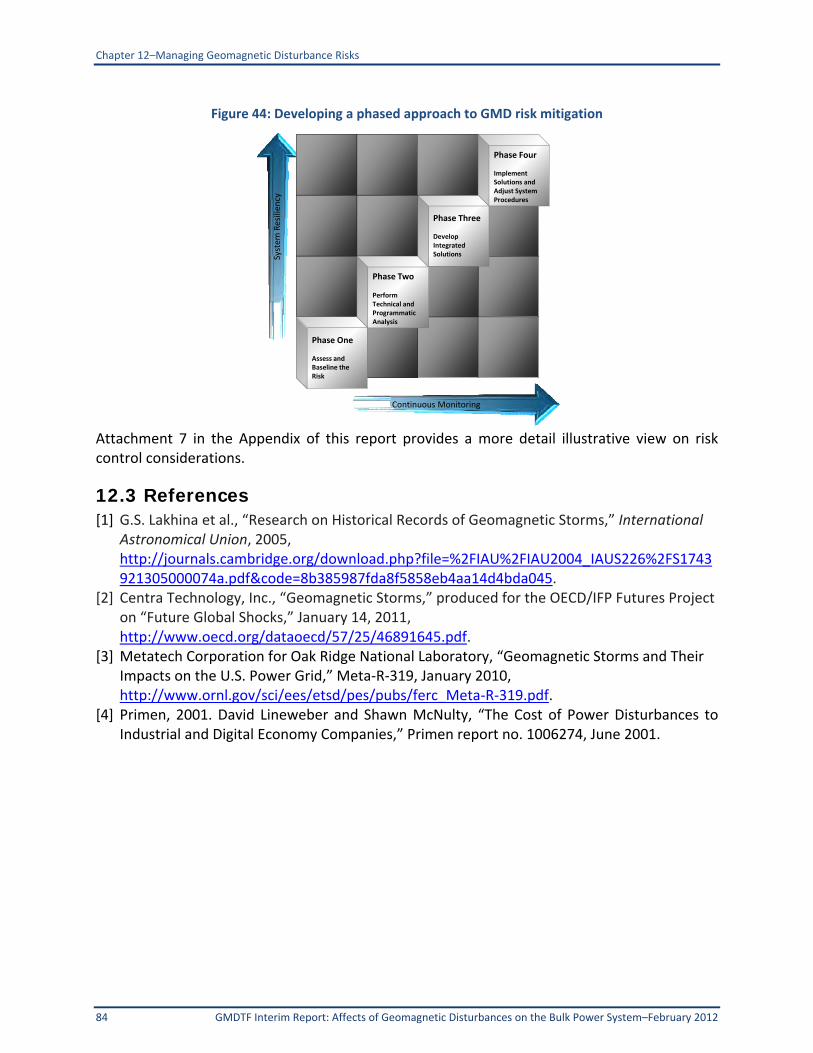
Chapter 12–Managing Geomagnetic Disturbance Risks
84 GMDTF Interim Report: Affects of Geomagnetic Disturbances on the Bulk Power System–February 2012
Figure 44: Developing a phased approach to GMD risk mitigation
Attachment 7 in the Appendix of this report provides a more detail illustrative view on risk control considerations.
12.3 References [1] G.S. Lakhina et al., “Research on Historical Records of Geomagnetic Storms,” International
Astronomical Union, 2005, http://journals.cambridge.org/download.php?file=%2FIAU%2FIAU2004_IAUS226%2FS1743921305000074a.pdf&code=8b385987fda8f5858eb4aa14d4bda045.
[2] Centra Technology, Inc., “Geomagnetic Storms,” produced for the OECD/IFP Futures Project on “Future Global Shocks,” January 14, 2011, http://www.oecd.org/dataoecd/57/25/46891645.pdf.
[3] Metatech Corporation for Oak Ridge National Laboratory, “Geomagnetic Storms and Their Impacts on the U.S. Power Grid,” Meta‐R‐319, January 2010, http://www.ornl.gov/sci/ees/etsd/pes/pubs/ferc_Meta‐R‐319.pdf.
[4] Primen, 2001. David Lineweber and Shawn McNulty, “The Cost of Power Disturbances to Industrial and Digital Economy Companies,” Primen report no. 1006274, June 2001.
Continuous Monitoring
System
Resiliency
Phase One
Assess and Baseline the Risk
Phase Two
Perform Technical and Programmatic Analysis
Phase Three
Develop Integrated Solutions
Phase Four
Implement Solutions and Adjust System Procedures
Chapter 13–Recommendations
Effects of Geomagnetic Disturbances on the Bulk Power System–February 2012 85
13. Recommendations
13.1 Introduction After careful consideration of information presented in this report, the NERC GMD Task Force has prepared a set of interim conclusions and supporting recommendations for consideration by the industry and policy makers. These interim conclusions are made on the basis of current knowledge. Recommendations need to be considered in the context of the variability of the threats posed by severe GMD due to location, local geology, and other characteristic factors. However, even if risk is expected to be to be low in a particular area, these recommendations should be carefully considered.
13.2 Interim Report Conclusions The most likely worst‐case system impacts resulting from a low probability strong GMD event and corresponding large GIC flows in the bulk power system is voltage instability, caused by a significant loss of reactive power support117 (VAr) and a simultaneous dramatic increase in the reactive power demand.118 The lack of sufficient reactive power support was a primary contributor of the 1989 Hydro‐Québec GMD‐induced blackout. NERC recognizes that other studies have indicated a severe GMD event would result in the failure of a large number of EHV transformers. The work of the GMD Task Force documented does not support that result for reasons documented in this report Therefore, the most significant issue for system operators to overcome from a strong GMD event would be to maintain voltage stability, as transformers absorb high levels of reactive power while protection and control systems may trip supportive reactive equipment due to harmonic distortion of signals. In addition, maintaining the health of operating bulk power system assets during a GMD would also be the main consideration for asset managers. The magnitude, frequency, and duration of GIC, as well as the geology and transformer design are key considerations in determining the amount of heating that will develop in the windings and structural parts of a transformer. The effect of this heating on the condition, performance, and insulation life of the transformer is also a function of a transformer’s design and operational loading during a GMD event. Further, GIC measurement data shows that the change in the magnetic field (dB/dt) and corresponding GIC values vary considerably throughout the duration of a given geomagnetic storm; thus, impacts to the system and power transformers in particular, are time‐dependent. This report also reviews past transformer failures from strong GMD events and illustrates that some older transformer designs,
117 Almost all bulk electric power in the United States is generated, transported and consumed in an alternating current (AC) network. Elements of AC systems produce and consume two kinds of power: real power (measured in watts) and reactive power (measured in volt‐amperes reactive or VAr). Real power accomplishes useful work (e.g., running motors and lighting lamps). Reactive power supports the voltages that must be controlled for system reliability. Voltage collapse can occur when there is insufficient reactive support in a wide area, leading to depressed voltages and eventually to blackout. The 2003 blackout experience shows that voltage collapse could result in blackout of hours in duration, but with minimal equipment damage.
118 Loss of reactive power support can be caused by the response of shunt compensation devices (e.g., shunt capacitor banks,
SVCs) to harmonics generated by transformer half‐cycle saturation.
Chapter 13–Recommendations
86 GMDTF Interim Report: Affects of Geomagnetic Disturbances on the Bulk Power System–February 2012
transformers in poor health, and transformers that have high water content and high dissolved gasses as well as those nearing their dielectric end‐of‐life are more at risk for experiencing increased heating and VAr consumption, than newer designs. Planners and operators require the technical tools to model GIC flows and subsequent reactive power losses to develop mitigating solutions, as necessary. This tool development includes GIC flow calculations for a variety of system conditions and configurations, test waveforms representative of GMD for a variety of latitudes, and suitable transient and thermal equipment models.
13.3 Short Term Actions for NERC While some recommendations highlighted in this assessment are medium‐ to long‐term efforts, there are also a number of short‐term solutions that NERC can implement within the next three months. They include the following:
Update NERC’s May 2010 GMD Alert to the industry to reflect the results of this study and encourage system operators to develop procedures or ensure that existing procedures are up‐to‐date in order to manage the affects from GMD events.
Update NERC Certified System Operators training requirements to include a subject matter focus on GMD.
Encourage industry participants who have interest in GMD research and development to participate in the NERC/EPRI Research Collaborative on GMD.
Have public webinars to outline the results of this assessment and highlight next steps from NERC and the industry.
Release open‐source code and approximate ground impedance models for use in study of GIC flows as results become available.
13.4 Medium to Long-Term Recommendations for NERC and Associated Work Plan Table 5, below, details tasks to be completed by the NERC in phase 2 of the study and in support of the four top‐level recommendations identified in the Executive Summary. NERC staff will coordinate, where possible, with government agencies and industry participants to ensure staff and industry resources are deployed in the most efficient and effective manner.

Chapter 13–Recommendations
Effects of Geomagnetic Disturbances on the Bulk Power System–February 2012 87
Table 5: NERC Recommendations
Recommendation Identification
Recommendation Estimated Completion
Recommendation 1: Improve tools for industry planners to develop GMD mitigation strategies
NERC‐1.1
Develop a vulnerability assessment tool that categorizes transformer vulnerability and expected GIC levels. This tool will assess the transient and thermal effects, along with dynamic and transient impacts from increased reactive consumption and harmonic currents.
Q4 2012
NERC‐1.2 Continue to refine and improve a set of defined reference storms (most severe occurrence in a 100‐year time horizon) and support ongoing research to identify the maximum theoretical GMD.
Q1 2013
NERC‐1.3 Support the development of open‐source simulation tools and models to calculate GIC flows.
Q4 2012
NERC‐1.4 Work with NERC Regional Interconnection Modeling Groups to enhance system models in support of the study of GMD impacts.
Q2 2013
NERC‐1.5 Support the development of improved Earth conductivity and ground impedance models for the North American geology.
Q2 2012
NERC‐1.6 Identify GIC monitoring capability on transformers, and determine optimum locations based on studies and operational experience
Q3 2013
NERC‐1.7
Review industry transformer procurement specifications and identify suitable GIC‐withstand criteria. In coordination with equipment standards organizations, develop minimum benchmark criteria for incorporation into procurement processes.
Q4 2013
Recommendation 2: Improve tools for system operators to manage GMD impacts.
NERC‐2.1 Develop guidelines for transmission operators and owners to enhance monitoring and mitigation of GIC.
Q4 2013
NERC‐2.2 When improved NOAA and NRCan alert and warning notification actions are available, enhance GMD notification procedures used in the Reliability Coordinator Information System (RCIS).
Q2 2013
Recommendation 3: Education and information exchanges between researchers and industry
NERC‐3.1
Develop training material and conduct ongoing periodic webinars (including during dormant period) to inform industry planners and system operators of system vulnerabilities from GMD and actions that can be taken to mitigate the impact.
Q4 2012
NERC 3.2 Establish a GMD data clearinghouse for use by industry and researchers to share information and enhance reliability.119
Q1 2014
NERC‐3.3 Raise awareness in industry, regulators, policymakers, and government agencies, of GMD impacts on the bulk power system.
Q2 2012
Recommendation 4: Review the need to enhance NERC Reliability Standards
NERC‐4.1 Investigate enhancements to existing standards and need for additional standards development projects to ensure the continued reliability of the bulk power system in North America.
Q1 2013
119 Any data clearinghouse established by NERC would follow appropriate standards and regulations relating to NERC Critical Infrastructure Protection Standards and FERC Regulations on Critical Energy Infrastructure Information. This clearinghouse would need to establish standardized data formats for GIC data for continued use by industry and researchers.

Chapter 13–Recommendations
88 GMDTF Interim Report: Affects of Geomagnetic Disturbances on the Bulk Power System–February 2012
13.4 Recommendations for Asset Owners, Government Agencies, and Policy Makers NERC, in collaboration with EPRI, will follow the work plan below. Results will be open‐source and publicly available. As this work progresses to identify specific vulnerabilities, assumptions and methods used for planning and operating studies will need to be available, transparent, and validated through existing Interconnection Reliability Modeling groups. Recommendations for asset owners, government agencies, and policy makers begin on Table 6. These recommendations have been categorized into the following functional areas:
1) Equipment and system design.
2) Modeling and simulation.
3) Situational awareness and forecasting.
4) Alert notification and response.
5) Training and education. NERC will continue to partner and engage with on‐going efforts at federal, state, provincial, and academic levels to develop tools and maximize the efficiency of resources and expertise of all interested parties.

Chapter 13–Recommendations
Effects of Geomagnetic Disturbances on the Bulk Power System–February 2012 89
Table 6: Recommendations for asset owners, government agencies, and policy makers
Functional Area
Recommendation Background Support NERC Reference
Lead Organization
Support Organization(s)
Equipment and System Design
Support the development of vulnerability assessment tools to study the transient and thermal models useful in measuring effects on equipment along with dynamic and transient impacts from reactive requirements and harmonic generation.
Transformers can be vulnerable in a GMD event from a combination of heating and harmonic currents caused by half‐cycle saturation. Heating and harmonic currents, by themselves, would not cause a transformer to fail. However, when reviewed in the context of other factors, such as age, core design, operational, geological conditions, and maintenance history, the transformer may be vulnerable. Transformers that are identified as highly vulnerable, based on the above factors, would be high priority targets for application of mitigation strategies. Initially, this vulnerability assessment would be for transformers 230 kV and above.
NERC‐1.1 Asset owners NERC
Equipment and System Design
Review industry transformer specifications for GIC withstand criteria and, in coordination with equipment standards organizations, develop minimum benchmark criteria that can be incorporated into procurement processes.
A number of transmission asset owners have included GIC withstand requirements into their procurement specifications for new transformers. Working with transformer manufacturers and the electric industry, review GIC specification criteria currently in use, and work through established standards organizations to develop minimum benchmark criteria.
NERC 1.7 NERC
IEEE Transformers Committee,
DOE
Equipment and System Design
Assess vulnerability of protective relaying to withstand the introduction of GIC to the power system.
Protective relaying systems can be vulnerable to harmonics generated as a result of GIC flowing in transformers. The 1989 Hydro‐Québec event demonstrated that protective relaying systems need to be resilient to harmonics, and relay settings. Further, relay technology need to address the anticipated levels of GIC, as well as subsequent harmonic content.
NERC‐1.1 Asset owners NERC, DOE

Chapter 13–Recommendations
90 GMDTF Interim Report: Affects of Geomagnetic Disturbances on the Bulk Power System–February 2012
Functional Area
Recommendation Background Support NERC Reference
Lead Organization
Support Organization(s)
Equipment and System Design
Develop methods and criteria to determine the most effective placement and location of magnetometers. NERC will also work with industry and government to increase the availability of magnetometer data to support operational procedures.
Opportunity exists for asset owners to employ a wide range of GIC monitoring capabilities, from transformer "neutral" direct current measurements to more sophisticated protective relay capabilities. Such real‐time data can provide control room operators, supported by operational procedures, with increased decision‐making information and provide asset managers with equipment performance data.
NERC‐1.6 NERC NOAA, DOE, USGS, NRCan
Modeling and Simulation
Develop GIC simulation tools (to the same level of quality of load flow and stability software) that can be used to represent expected GIC flows.
Developing a standard set of GIC waveforms will be necessary – such waveforms could be developed based on a combination of academic research, field GIC detector data, and magnetometer data. Industry collaboration is needed to understand the similarities and differences between various waveform and field assumptions in different areas of the system.
NERC‐1.1 NERC‐1.3
NERC Interconnection
Modeling Groups
Modeling and Simulation
Enhance wide‐area monitoring for GIC to enhance Reliability Coordinator response to severe GMD storms.
Each utility owner/operator maintains a view of their system performance and may provide certain portions of that information to their Reliability Coordinator. To enhance Reliability Coordinator response to GMD storms, asset owners who have installed GIC monitoring devices would be encouraged to share information to enhance the real‐time operational response to GMD.
NERC‐1.6 DOE NERC
Modeling and Simulation
Develop improved Earth‐conductivity models of existing geology in North America.
Improved conductivity models are needed for GIC propagation due to specific storm scenarios.
NERC‐1.5 USGS NERC, FERC,
NRCan

Chapter 13–Recommendations
Effects of Geomagnetic Disturbances on the Bulk Power System–February 2012 91
Functional Area
Recommendation Background Support NERC Reference
Lead Organization
Support Organization(s)
Modeling and Simulation
Work with NERC Interconnection Modeling Groups to enhance system models in support of the study of interconnection‐wide GMD impacts. Perform power system analysis under potential GMD conditions to assess the potential impacts.
Each NERC‐registered transmission planner performs power system analysis to assess the transmission system, in accordance with NERC’s TPL Reliability Standards. Additional analysis is needed to incorporate the impacts of a severe GMD to assess the system’s performance. Such analysis is a first step toward developing mitigation or prevention strategies. The analysis should be considered for inclusion into the NERC Reliability Standards Development process. Similarly, each NERC‐registered transmission Operator and Reliability Coordinator should complete power system analysis under severe GMD conditions to assess the system operating conditions.
NERC‐1.4
Interconnection Modeling
Groups (ERAG, WECC, ERCOT)
NERC, FERC
Modeling and Simulation
Perform a risk assessment of system by asset owners for potential vulnerability to GIC.
Each asset owner should employ a set of design base criteria that addresses their GMD risk based on the characteristics and parameters of their system. It is an imperative to communicate the criteria and results broadly as other asset owners depend upon the effectiveness of other asset owner’s mitigation methods due to the degree of interconnection and broad affects associated with space weather events. DBCT (design basis credible threat) modeling and calculations should reflect changes in system topology and new technology. For example, equipment manufacturers need to be cognizant of the GMD threat and, when specified in equipment designs, can incorporate mitigating design features into their equipment.
‐‐ Asset owners ‐‐

Chapter 13–Recommendations
92 GMDTF Interim Report: Affects of Geomagnetic Disturbances on the Bulk Power System–February 2012
Functional Area
Recommendation Background Support NERC Reference
Lead Organization
Support Organization(s)
Modeling and Simulation
Benchmark of relevant data by asset owners with GIC mitigation devices in operational locations and dissemination of the results to industry planners and system modelers.
Develop benchmark data sets with operational installations of GIC reduction devices that can be used by planners and system modelers. Data sets should include GIC flows in transformer neutrals, phase voltage variations, phase harmonics, transformer VAr consumption, transformer physical data (selected temperatures, etc.), and will be provided with the GIC mitigation devices in‐and‐out of circuit. This improved modeling capability can be used to refine system models to support enhanced severe GMD responses.
‐‐ Asset owners DOE
Situational Awareness and Forecasting
Continue to refine and improve the definition of the Reference Storm (most severe occurrence in a 100‐year time horizon) and continue to support ongoing research examining the maximum theoretical GMD.
With the reference storm definition as input, the transmission system asset owners can determine a DBCT and design mitigation strategy. The threat posed by severe space weather will require a diverse set of strategies based on the local geology, equipment configuration, etc. Further, identification of the theoretical maximum storm is necessary to assess the worst‐case potential. Industry will not necessarily design to withstand the maximum storm, but study is useful to assess the transmission system’s response in such a scenario and if more unusual mitigation steps should be considered. The storm (or set of storms) should include the peak, the duration of the sub‐storm, and the influence of geology and latitude.
NERC‐1.2 NASA NOAA
Situational Awareness and Forecasting
Ensure current solar storm situational awareness for space weather forecasters is maintained.
Forecasting and early warning of GMD are a vital components of system defense against severe GMD. The ACE satellite, launched in 1996, has exceeded its design life. ACE is stationed at the L‐1 Lagrange point, providing the close‐in data on polarity and direction of CMEs, as well as situational awareness to NOAA. Maintaining and enhancing this capability is important to system operators to mitigate the impacts of a severe GMD event.
NERC‐2.2 NERC‐3.2
NASA, NOAA
NERC
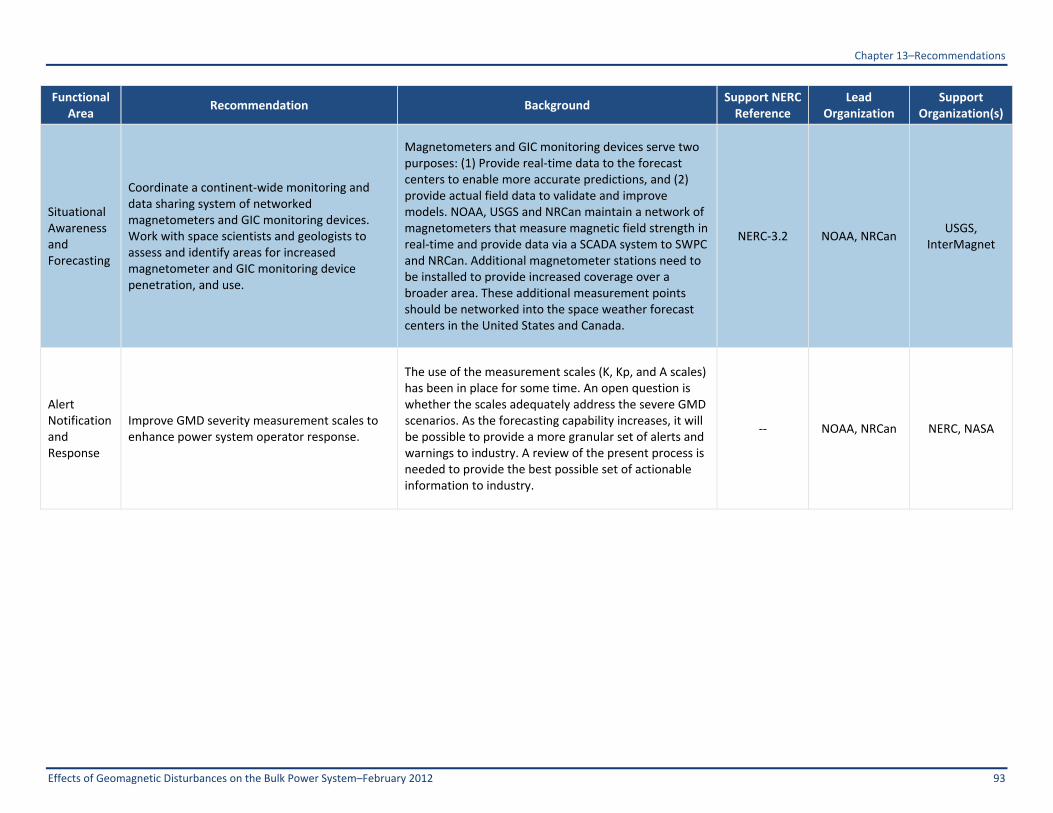
Chapter 13–Recommendations
Effects of Geomagnetic Disturbances on the Bulk Power System–February 2012 93
Functional Area
Recommendation Background Support NERC Reference
Lead Organization
Support Organization(s)
Situational Awareness and Forecasting
Coordinate a continent‐wide monitoring and data sharing system of networked magnetometers and GIC monitoring devices. Work with space scientists and geologists to assess and identify areas for increased magnetometer and GIC monitoring device penetration, and use.
Magnetometers and GIC monitoring devices serve two purposes: (1) Provide real‐time data to the forecast centers to enable more accurate predictions, and (2) provide actual field data to validate and improve models. NOAA, USGS and NRCan maintain a network of magnetometers that measure magnetic field strength in real‐time and provide data via a SCADA system to SWPC and NRCan. Additional magnetometer stations need to be installed to provide increased coverage over a broader area. These additional measurement points should be networked into the space weather forecast centers in the United States and Canada.
NERC‐3.2 NOAA, NRCan USGS,
InterMagnet
Alert Notification and Response
Improve GMD severity measurement scales to enhance power system operator response.
The use of the measurement scales (K, Kp, and A scales) has been in place for some time. An open question is whether the scales adequately address the severe GMD scenarios. As the forecasting capability increases, it will be possible to provide a more granular set of alerts and warnings to industry. A review of the present process is needed to provide the best possible set of actionable information to industry.
‐‐ NOAA, NRCan NERC, NASA
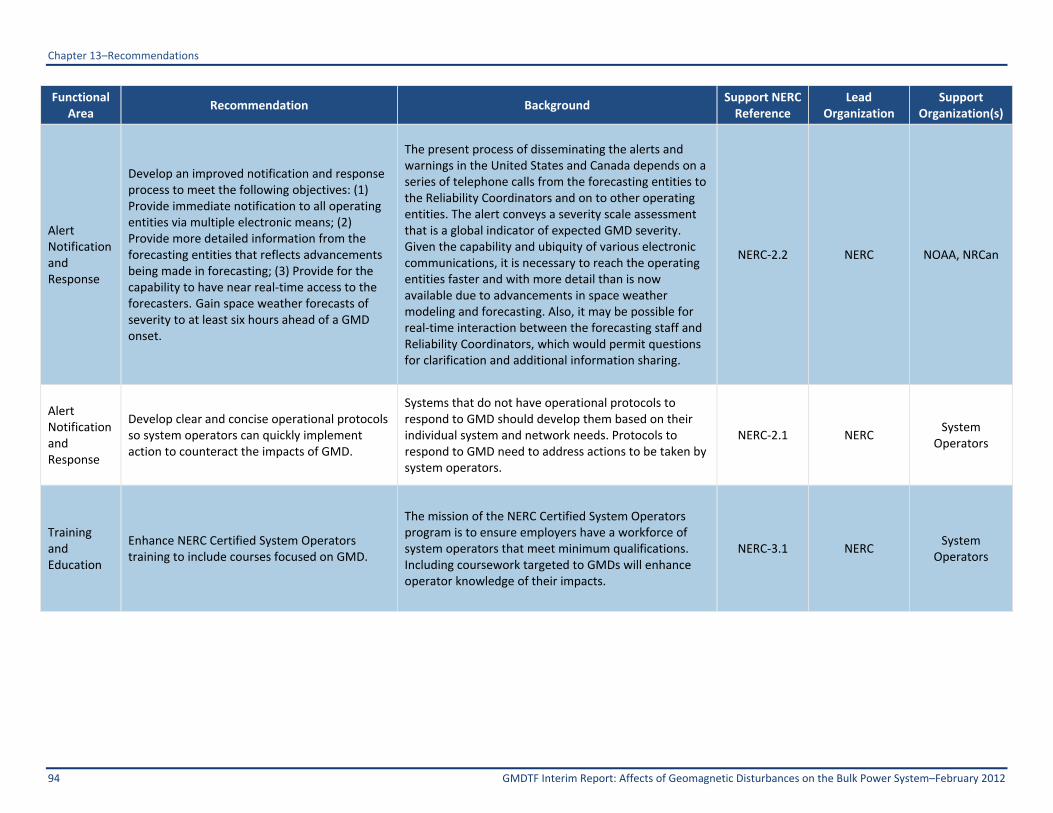
Chapter 13–Recommendations
94 GMDTF Interim Report: Affects of Geomagnetic Disturbances on the Bulk Power System–February 2012
Functional Area
Recommendation Background Support NERC Reference
Lead Organization
Support Organization(s)
Alert Notification and Response
Develop an improved notification and response process to meet the following objectives: (1) Provide immediate notification to all operating entities via multiple electronic means; (2) Provide more detailed information from the forecasting entities that reflects advancements being made in forecasting; (3) Provide for the capability to have near real‐time access to the forecasters. Gain space weather forecasts of severity to at least six hours ahead of a GMD onset.
The present process of disseminating the alerts and warnings in the United States and Canada depends on a series of telephone calls from the forecasting entities to the Reliability Coordinators and on to other operating entities. The alert conveys a severity scale assessment that is a global indicator of expected GMD severity. Given the capability and ubiquity of various electronic communications, it is necessary to reach the operating entities faster and with more detail than is now available due to advancements in space weather modeling and forecasting. Also, it may be possible for real‐time interaction between the forecasting staff and Reliability Coordinators, which would permit questions for clarification and additional information sharing.
NERC‐2.2 NERC NOAA, NRCan
Alert Notification and Response
Develop clear and concise operational protocols so system operators can quickly implement action to counteract the impacts of GMD.
Systems that do not have operational protocols to respond to GMD should develop them based on their individual system and network needs. Protocols to respond to GMD need to address actions to be taken by system operators.
NERC‐2.1 NERC System
Operators
Training and Education
Enhance NERC Certified System Operators training to include courses focused on GMD.
The mission of the NERC Certified System Operators program is to ensure employers have a workforce of system operators that meet minimum qualifications. Including coursework targeted to GMDs will enhance operator knowledge of their impacts.
NERC‐3.1 NERC System
Operators

Chapter 13–Recommendations
Effects of Geomagnetic Disturbances on the Bulk Power System–February 2012 95
Functional Area
Recommendation Background Support NERC Reference
Lead Organization
Support Organization(s)
Training and Education
Develop training material and conduct webinars to inform industry planners and system operators of the system vulnerabilities from GMD and the actions that can be taken to mitigate the impacts.
Training for the operators, technical staff, and management is necessary to deepen understanding of threats posed by GMD, and t actions that may become necessary. More specifically, this group needs to completely understand local procedures and protocols, but also the process by which the alerts and warnings are developed and communicated. Further, with enhanced forecasting and alerting, it may become possible to provide additional detailed information on a more timely basis. Because a storm can occur at any time in the cycle, training must be provided regularly. The training could be reduced in the solar minimum of the cycle.
NERC‐3.1 NERC
Asset owners, Regional Entities,
Transmission Operators
Training and Education
Raise awareness in the industry, among regulators, and government agencies of the potential threat to the power system from GMD.
NERC should conduct workshops and online training for the industry, regulators, and government agencies to raise awareness on the potential threats to the power system from GMD. For industry, the focus is review how to address the threat, based on utility operations. For regulators and government agencies, the focus would be to understand the vulnerability of the power system and how to support industry action.
NERC‐3.3 NERC Trade
Associations
Training and Education
Perform regular drills and exercises to reinforce the decision process to take action(s) based on GMD forecast watches and alerts.
Timely execution of the operating procedures will be necessary in a severe GMD event. Skills and steps to be taken based on forecasts and actual system conditions need to be exercised. Also, communications with government and stakeholders will need to be practiced.
Asset owners, Transmission Operators
NERC, DOE

Attachment 1–Acronyms
GMDTF Interim Report: Affects of Geomagnetic Disturbances on the Bulk Power System–February 2012 96
Attachment 1: Acronyms Used in this Report Acronym Definition
AC alternating current
ACE Advanced Composition Explorer (satellite)
ANSI American National Standards Institute
APTD asset performance tracking database
BA Balancing Authority
BPS bulk power system
CIP critical infrastructure protection
CME coronal mass ejection
CSA Canadian Space Agency
CT current transformer
DBCT design basis credible threat
DC direct current
DGA dissolved gas analysis
DHS United States Department of Homeland Security
DOE United States Department of Energy
EHV extra high voltage
EMTP Electromagnetic Transients Program
EPRI Electric Power Research Institute
ERCOT Electric Reliability Council of Texas
ESP Earth surface potential
FACTS flexible AC transmission system
FERC United States Federal Energy Regulatory Commission
GHM GIC/Harmonics Monitoring
GIC geo‐magnetically induced current
GMD geo‐magnetic disturbance
GMDTF Geo‐Magnetic Disturbance Task Force (NERC)
GPS global positioning satellite
GRD GIC reduction device
GSC Geological Survey of Canada
GSU generator step‐up (transformer)
HQ Hydro‐Québec
IED intelligent electronic device
IEEE Institute of Electrical and Electronics Engineers
ISES International Space Environment Service
ISO independent system operator
LTC load tap changer
MCM thousand circular mils
MHD magnetohydrodynamic
MISO Midwest ISO
MVA million volt‐amperes
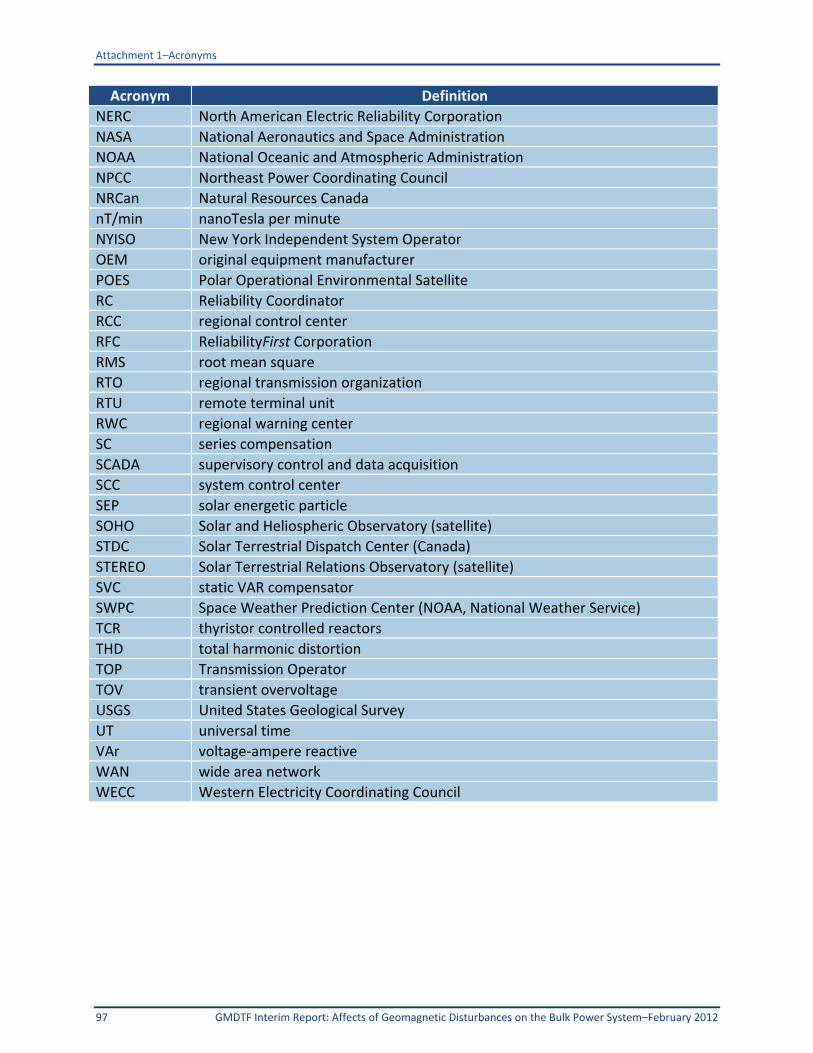
Attachment 1–Acronyms
97 GMDTF Interim Report: Affects of Geomagnetic Disturbances on the Bulk Power System–February 2012
Acronym Definition
NERC North American Electric Reliability Corporation
NASA National Aeronautics and Space Administration
NOAA National Oceanic and Atmospheric Administration
NPCC Northeast Power Coordinating Council
NRCan Natural Resources Canada
nT/min nanoTesla per minute
NYISO New York Independent System Operator
OEM original equipment manufacturer
POES Polar Operational Environmental Satellite
RC Reliability Coordinator
RCC regional control center
RFC ReliabilityFirst Corporation
RMS root mean square
RTO regional transmission organization
RTU remote terminal unit
RWC regional warning center
SC series compensation
SCADA supervisory control and data acquisition
SCC system control center
SEP solar energetic particle
SOHO Solar and Heliospheric Observatory (satellite)
STDC Solar Terrestrial Dispatch Center (Canada)
STEREO Solar Terrestrial Relations Observatory (satellite)
SVC static VAR compensator
SWPC Space Weather Prediction Center (NOAA, National Weather Service)
TCR thyristor controlled reactors
THD total harmonic distortion
TOP Transmission Operator
TOV transient overvoltage
USGS United States Geological Survey
UT universal time
VAr voltage‐ampere reactive
WAN wide area network
WECC Western Electricity Coordinating Council

Attachment 2–April 2011 NOAA SWPC Workshop
GMDTF Interim Report: Affects of Geomagnetic Disturbances on the Bulk Power System–February 2012 98
Attachment 2: April 2011 NOAA SWPC Workshop
A2.1 Introduction The SWPC recently brought together representatives of the industry and the scientific community from both the US and Canada to discuss the future of space weather prediction and the needs of the industry to better prepare for severe space weather events. The electric industry was interested in exploring the capabilities of the space weather prediction community and what enhancements are reasonable to expect in the near term. NOAA and NWS leadership supports SWPC’s decision to redefine NOAA’s suite of space weather services in support of electric utility companies. The SWPC desires to expand their services to include local and regional specification of GMD, and plan to introduce more appropriate indices to better capture intensity and duration of magnetic disturbances.
A2.2 April 2011 NOAA GMD Workshop Output Following much discussion with experts in the field and a workshop in Boulder in April 2011, the following was determined:
• The number one question industry needs to know from the SWPC is what can be forecast. In particular, how far ahead and accurately can geomagnetic activity be forecast? More lead time provides better value for the grid operators.
• The internal magnetic field in the driving part of a CME is a basic unknown today and presents a fundamental problem in making reliable 18 ‐ 72 hour predictions.
• Probabilistic predictions and/or confidence levels are useful for the utilities.
• There are some critical actions that can be taken with as little as 15‐20 minutes lead time. There are other actions that can be taken that require days of lead time. The actions that can be taken also depend on the predicted severity of the storm.
• Accurately forecasting the magnitude and duration of the storm is more important than getting the arrival time correct.
• The electric utilities are generally interested in the “envelope” of the activity (amplitude, range, “wave shape”) and the “duration” of the activity. There is a general requirement to know how ‘big’ the storm is and how it relates to what has been seen before.
• The utilities would like the real‐time specification and prediction of the electric field, E (strength and direction) at their operating site. This was identified as the best, most useful environment parameter for their purposes. The electric field is calculated from the time series of the vector magnetic field combined with a model for local ground conductivity.
• The systems engineers in particular want a six hour forecast, updated hourly, of the geoelectric field at select locations.
• For the present, the operators are not set up to respond to electric field forecasts and will need to rely on a general measure (K, Kp, or alternative) of the expected geomagnetic storm level.
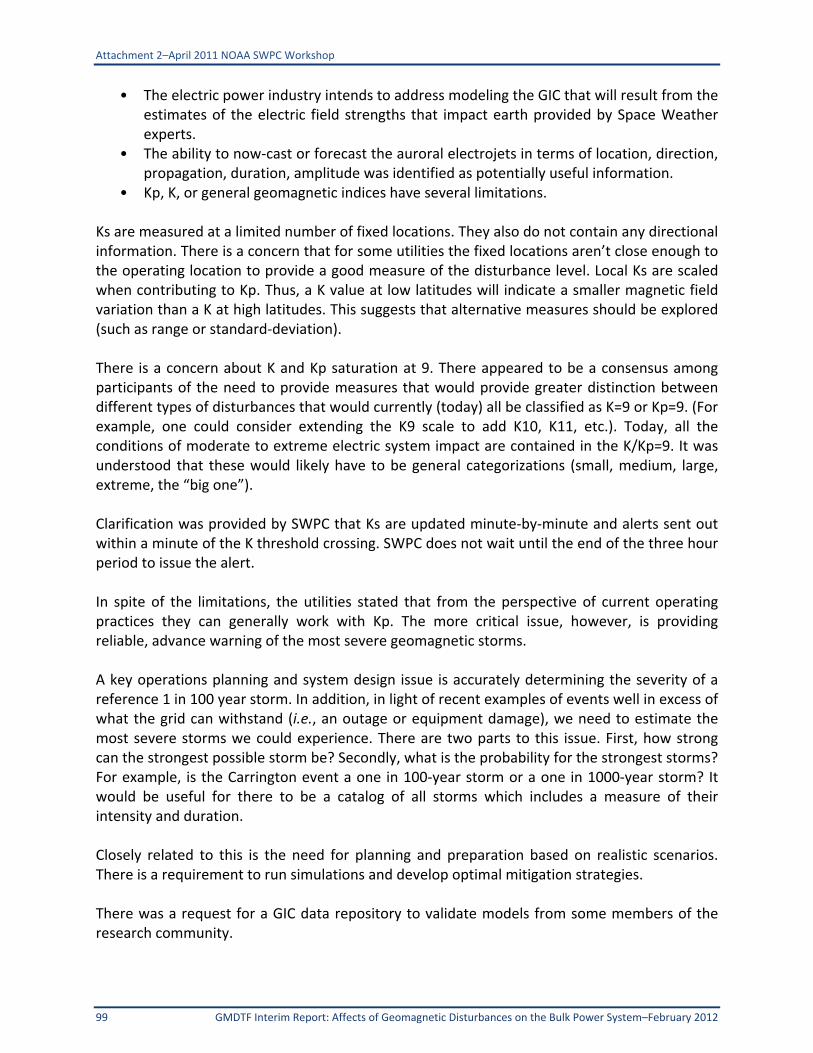
Attachment 2–April 2011 NOAA SWPC Workshop
99 GMDTF Interim Report: Affects of Geomagnetic Disturbances on the Bulk Power System–February 2012
• The electric power industry intends to address modeling the GIC that will result from the estimates of the electric field strengths that impact earth provided by Space Weather experts.
• The ability to now‐cast or forecast the auroral electrojets in terms of location, direction, propagation, duration, amplitude was identified as potentially useful information.
• Kp, K, or general geomagnetic indices have several limitations. Ks are measured at a limited number of fixed locations. They also do not contain any directional information. There is a concern that for some utilities the fixed locations aren’t close enough to the operating location to provide a good measure of the disturbance level. Local Ks are scaled when contributing to Kp. Thus, a K value at low latitudes will indicate a smaller magnetic field variation than a K at high latitudes. This suggests that alternative measures should be explored (such as range or standard‐deviation). There is a concern about K and Kp saturation at 9. There appeared to be a consensus among participants of the need to provide measures that would provide greater distinction between different types of disturbances that would currently (today) all be classified as K=9 or Kp=9. (For example, one could consider extending the K9 scale to add K10, K11, etc.). Today, all the conditions of moderate to extreme electric system impact are contained in the K/Kp=9. It was understood that these would likely have to be general categorizations (small, medium, large, extreme, the “big one”). Clarification was provided by SWPC that Ks are updated minute‐by‐minute and alerts sent out within a minute of the K threshold crossing. SWPC does not wait until the end of the three hour period to issue the alert. In spite of the limitations, the utilities stated that from the perspective of current operating practices they can generally work with Kp. The more critical issue, however, is providing reliable, advance warning of the most severe geomagnetic storms. A key operations planning and system design issue is accurately determining the severity of a reference 1 in 100 year storm. In addition, in light of recent examples of events well in excess of what the grid can withstand (i.e., an outage or equipment damage), we need to estimate the most severe storms we could experience. There are two parts to this issue. First, how strong can the strongest possible storm be? Secondly, what is the probability for the strongest storms? For example, is the Carrington event a one in 100‐year storm or a one in 1000‐year storm? It would be useful for there to be a catalog of all storms which includes a measure of their intensity and duration. Closely related to this is the need for planning and preparation based on realistic scenarios. There is a requirement to run simulations and develop optimal mitigation strategies. There was a request for a GIC data repository to validate models from some members of the research community.

Attachment 2–April 2011 NOAA SWPC Workshop
GMDTF Interim Report: Affects of Geomagnetic Disturbances on the Bulk Power System–February 2012 100
Of concern: there is not reliable back‐up to the satellites we depend on for forecasting potentially harmful geomagnetic storms in the short period before an event (e.g., ACE and SOHO coronagraphs). It is also a concern that there do not appear to be funded projects to replace or improve this critical information.
A2.3 Follow-on Efforts from April 2011 NOAA SWPC GMD Workshop SWPC carefully evaluated the feedback and discussions with grid experts and have agreed to undertake the following efforts:
• SWPC and partners will look into calculating the actual electric field strength and direction. This will require a partnership with USGS, the Community Coordinated Modeling Center (CCMC), and others. SWPC and partners will investigate ways to add more real‐time ground magnetometer stations and to model ground conductivity.
• It is likely that forecasts of dB/dt and the electric field will be very difficult. Therefore, forecasts of Kp, K, or alternate summary measures will be necessary for the near‐term. It is possible to provide climatology for dB/dt, range, standard deviation, local electric field, for a given activity level and this was identified as a useful service. SWPC will work with partners to carry out this analysis and make such climatology tables available.
• SWPC and partners will investigate alternate measures to local K‐indices. The goal will be to have summary measures that extend the disturbance scale up to larger values to avoid saturation, and to have summary measures that can be compared in a meaningful way. Examples include, range, standard deviation, delta‐B, and so on, all which are quantities that would be expressed in standard units (nT).
• SWPC and partners will also investigate a “storm catalog” and will study better ways to characterize the envelope of these disturbances. This effort will address the requirement to characterize the intensity and duration of the disturbances.
• The results of these evaluations will lead to an interagency effort to produce new, more useful real‐time and forecast services for the utilities.
• SWPC will coordinate with the NERC on an option for a teleconference with Reliability Coordinators in the event of an exceptional space weather situation (e.g., October 28‐29, 2003). Thresholds, quantitative measures, and response procedures need to be addressed.
• SWPC will explore partnering with international partners, particularly NR Canada and the British Geological Survey (BGS), on the development and improvement of geomagnetic storm services. Mechanisms in place to facilitate these efforts include participating with NERC on the GMD task force, where NOAA and NR Canada are leads on operational services to the grid; and the recently signed MOU between NOAA/NWS and the UK Met Office, who are collaborating closely with BGS on the development of space weather services.
• SWPC representatives in the GMDTF will pursue a process for information sharing during and after geomagnetic disturbances. Feedback on system effects and impacts due to geomagnetic disturbances would be very valuable to SWPC for warning

Attachment 2–April 2011 NOAA SWPC Workshop
101 GMDTF Interim Report: Affects of Geomagnetic Disturbances on the Bulk Power System–February 2012
validation and for our modeling and research community for validation and verification of models.
In addition to the GIC and power‐grid focused initiatives mentioned above, SWPC are undertaking several other initiatives that will benefit the space weather user community as a whole. They include: ACE Replacement ‐ SWPC will continue working with its government partners on a replacement for the ACE spacecraft. NOAA leadership is fully supportive of this effort and recognizes the importance of these observations in support of critical infrastructure protection. Solutions have been identified, and various activities are underway to fill this potential gap. High Activity Response Team – SWPC are in the final stage of introducing a High Activity Response Team (HART) that can be activated during busy periods of severe space weather. HART is composed of SWPC staff, from outside of the Operations Center, who has knowledge of space weather impacts and customer effects. HART will deal with media, stakeholder and special customer inquiries during severe outbreaks of space weather. Interactions with NERC and the Reliability Coordinators are considered a critical element in this plan. Space Weather Prediction Test bed – The effective and efficient transition of research‐caliber numerical space weather forecast models into operations is a critical objective for SWPC to achieve in order to ensure the future sustainment and growth of its portfolio of services. To this end, SWPC is in the process of standing‐up the Space Weather Prediction Test bed (SWPT) to facilitate the transition‐to‐operations of select community research models. Enlil, a solar wind disturbance propagation model, will be the first project to move through the SWPT. Enlil has the potential to accurately predict the trajectories of solar coronal mass ejections (CME) between the solar corona and the orbit of Earth and beyond. While the SWPT is working on Enlil, the SWPC staff is working with CCMC to evaluate the relative performance characteristics of a variety of magnetosphere models. Based on the evaluation, SWPC will determine which (if any) magnetosphere models should be selected for transition to operations. Global Model – SWPC is working with the UK Met Office on the development of the world’s first combined space weather/terrestrial weather model. This is essentially adding the physics of the thermosphere, mesosphere, and ionosphere to the UK Met terrestrial weather model. This coupled, whole atmosphere approach will improve both terrestrial and space weather forecasting.
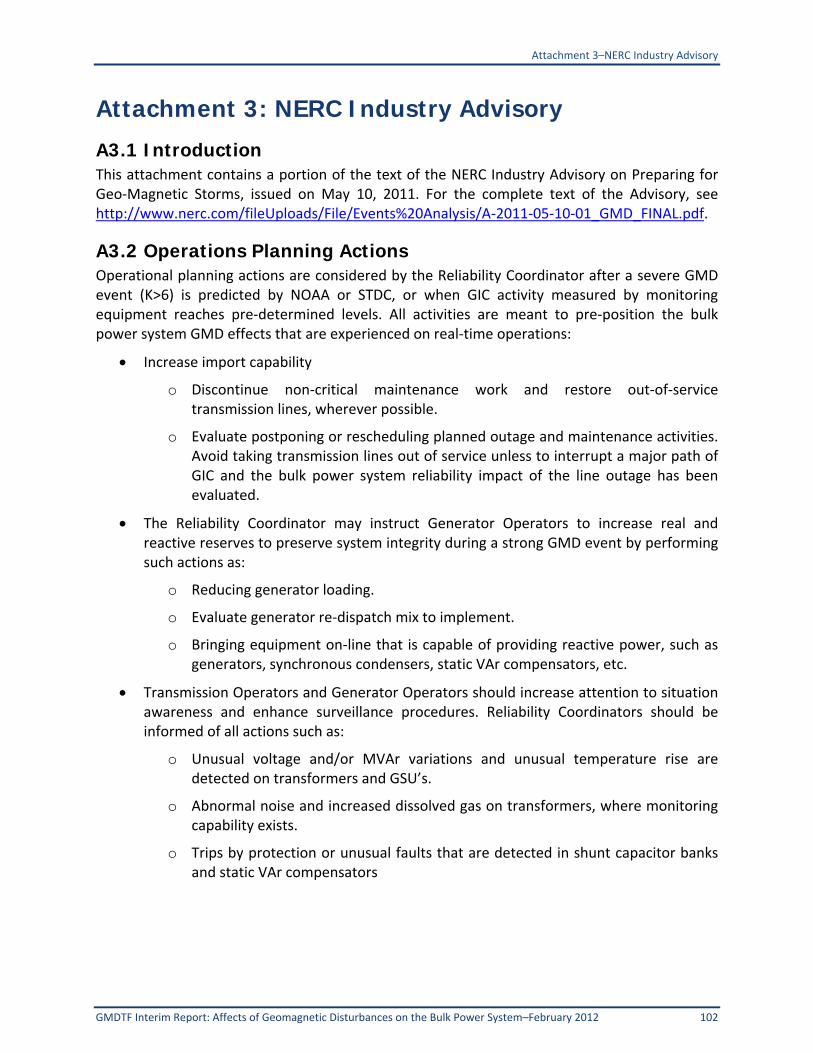
Attachment 3–NERC Industry Advisory
GMDTF Interim Report: Affects of Geomagnetic Disturbances on the Bulk Power System–February 2012 102
Attachment 3: NERC Industry Advisory
A3.1 Introduction This attachment contains a portion of the text of the NERC Industry Advisory on Preparing for Geo‐Magnetic Storms, issued on May 10, 2011. For the complete text of the Advisory, see http://www.nerc.com/fileUploads/File/Events%20Analysis/A‐2011‐05‐10‐01_GMD_FINAL.pdf.
A3.2 Operations Planning Actions Operational planning actions are considered by the Reliability Coordinator after a severe GMD event (K>6) is predicted by NOAA or STDC, or when GIC activity measured by monitoring equipment reaches pre‐determined levels. All activities are meant to pre‐position the bulk power system GMD effects that are experienced on real‐time operations:
Increase import capability
o Discontinue non‐critical maintenance work and restore out‐of‐service transmission lines, wherever possible.
o Evaluate postponing or rescheduling planned outage and maintenance activities. Avoid taking transmission lines out of service unless to interrupt a major path of GIC and the bulk power system reliability impact of the line outage has been evaluated.
The Reliability Coordinator may instruct Generator Operators to increase real and reactive reserves to preserve system integrity during a strong GMD event by performing such actions as:
o Reducing generator loading.
o Evaluate generator re‐dispatch mix to implement.
o Bringing equipment on‐line that is capable of providing reactive power, such as generators, synchronous condensers, static VAr compensators, etc.
Transmission Operators and Generator Operators should increase attention to situation awareness and enhance surveillance procedures. Reliability Coordinators should be informed of all actions such as:
o Unusual voltage and/or MVAr variations and unusual temperature rise are detected on transformers and GSU’s.
o Abnormal noise and increased dissolved gas on transformers, where monitoring capability exists.
o Trips by protection or unusual faults that are detected in shunt capacitor banks and static VAr compensators
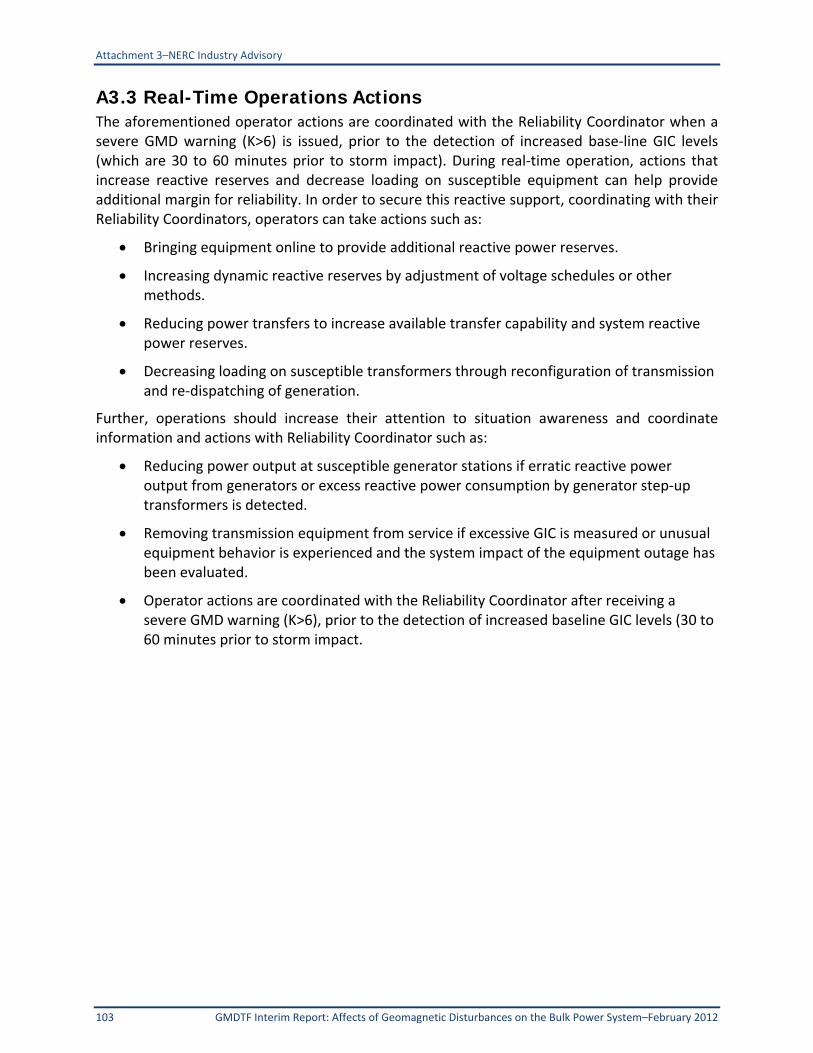
Attachment 3–NERC Industry Advisory
103 GMDTF Interim Report: Affects of Geomagnetic Disturbances on the Bulk Power System–February 2012
A3.3 Real-Time Operations Actions The aforementioned operator actions are coordinated with the Reliability Coordinator when a severe GMD warning (K>6) is issued, prior to the detection of increased base‐line GIC levels (which are 30 to 60 minutes prior to storm impact). During real‐time operation, actions that increase reactive reserves and decrease loading on susceptible equipment can help provide additional margin for reliability. In order to secure this reactive support, coordinating with their Reliability Coordinators, operators can take actions such as:
Bringing equipment online to provide additional reactive power reserves.
Increasing dynamic reactive reserves by adjustment of voltage schedules or other methods.
Reducing power transfers to increase available transfer capability and system reactive power reserves.
Decreasing loading on susceptible transformers through reconfiguration of transmission and re‐dispatching of generation.
Further, operations should increase their attention to situation awareness and coordinate information and actions with Reliability Coordinator such as:
Reducing power output at susceptible generator stations if erratic reactive power output from generators or excess reactive power consumption by generator step‐up transformers is detected.
Removing transmission equipment from service if excessive GIC is measured or unusual equipment behavior is experienced and the system impact of the equipment outage has been evaluated.
Operator actions are coordinated with the Reliability Coordinator after receiving a severe GMD warning (K>6), prior to the detection of increased baseline GIC levels (30 to 60 minutes prior to storm impact.
Attachment 4–Current GMD Response Procedures
GMDTF Interim Report: Affects of Geomagnetic Disturbances on the Bulk Power System–February 2012 104
Attachment 4: Public GMD Response Procedures
ISO-New England System Operating Procedures – SOP‐RTMKTS.0120.0050 Implement Solar Magnetic Disturbance Remedial Action Effective: February 4, 2011 http://www.iso‐ne.com/rules_proceds/operating/sysop/rt_mkts/sop_rtmkts_0120_0050.pdf
MISO Geo‐Magnetic Disturbance Procedure – RTO‐OP‐053‐r5 Effective: December 20, 2011 https://www.midwestiso.org/Library/Repository/Procedure/RTO‐OP‐053‐r5%20Geomagnetic%20Disturbance%20Procedure.pdf
NYISO Transmission and Dispatching Operation Manual Section 4.2.11 – Solar Magnetic Disturbances Effective: September 4, 2008 http://www.nyiso.com/public/webdocs/documents/manuals/operations/trans_disp.pdf
Northeast Power Coordinating Council Procedures for Solar Magnetic Disturbances Which Affect Electric Power Systems Effective: January 11, 2007 https://www.npcc.org/Standards/Procedures/c‐15.pdf
PJM PJM Manual 13 – Emergency Operations Section 3.7 – Geo‐Magnetic Disturbances Effective Date: January 1, 2012 http://www.pjm.com/~/media/documents/manuals/m13.ashx

Attachment 5–OEM Documents
105 GMDTF Interim Report: Affects of Geomagnetic Disturbances on the Bulk Power System–February 2012
Attachment 5: Public OEM Documentation on GMD
Schweitzer Engineering Laboratories Geomagnetically Induced Currents: Detection, Protection, and Mitigation Document: AG2011‐16 This Schweitzer Engineering Laboratories application guide shows:
• How GIC can impact your power system.
• How to detect GMD events using equipment you already have installed.
• How SEL relays respond to GMD events, which relay settings are relevant to GIC, and how to make sure you have the best settings for both normal and geomagnetic storm power system conditions.
• How to collect and display GIC information and develop coordinated system responses to these conditions.
Authors: Greg Zweigle, Jeff Pope, and David Whitehead Published: 10/11/2011 http://www.selinc.com/WorkArea/DownloadAsset.aspx?id=98310

Attachment 6–Monitoring and Measurement Architecture
GMDTF Interim Report: Affects of Geomagnetic Disturbances on the Bulk Power System–February 2012 106
Attachment 6: Monitoring & Measurement Architecture
A6.1 Introduction This attachment provides an example of a monitoring and measurement architecture an organization could consider. The functional diagram of a GIC/Harmonics Monitoring (GHM) system is represented below in Figure A6‐1.
Figure A6‐1: Functional diagram of GIC/Harmonics monitoring system
A6.2 GIC/Harmonics Monitoring (GHM) System – Corporate Level The GIC/Harmonics Monitoring (GHM) System may comprise a System Control Center (SCC), a few Regional Control Centers (RCCs), and a number of GIC/Harmonics Monitoring (GHM) networks located at key substations. Figure A6‐2 demonstrates the configuration of a GIC/Harmonics Monitoring (GHM) System. The number of Regional Control Centers depends on a utility’s geographical service territories and practice, etc. The Asset Performance Tracking Database (APTD) normally can be located at the system control center, and connected to the backup server of SCC to minimize interventions to other key functions of the SCC, such as monitoring and control functions. The APTD may be accessed by authorized users from the corporate WAN. Internal firewalls and a secure router between the corporate wide area network (WAN) and the SCC are used to secure the GHM SCADA network. The connection between a substation and the regional control center should ensure the transmission of real‐time monitoring data with first priority. Other non time‐critical data, such as event logs and oscillography data will be stored at local substation computer and can be polled regularly by the APTD.

Attachment 6–Monitoring and Measurement Architecture
107 GMDTF Interim Report: Affects of Geomagnetic Disturbances on the Bulk Power System–February 2012
The RCC is responsible for monitoring critical asset. If a monitored transformer at a station is in an abnormal condition and its GIC exceeds a preset threshold, an alarm signal will display on a monitor at the RCC to alert the operator.
Figure A6‐2: GIC/Harmonics Monitoring (GHM) system – corporate level

Attachment 6–Monitoring and Measurement Architecture
GMDTF Interim Report: Affects of Geomagnetic Disturbances on the Bulk Power System–February 2012 108
A6.3 GIC/Harmonics Monitoring (GHM) System – Substation Level Figure A6‐3 shows a typical GHM configuration at substation level. If a substation network is identified as Critical Cyber Assets per NERC CIP Standards, serial‐to‐fiber converters such as RMC20s can be used in the GIC cabinet and at the RTU panel to provide serial connection over fiber.
Figure A6‐3: GIC/Harmonics Monitoring (GHM) System – substation level

Attachment 7–A View on Risk Management
109 GMDTF Interim Report: Affects of Geomagnetic Disturbances on the Bulk Power System–February 2012
Attachment 7: A View on Risk Management
A7.1 Introduction This section provides a risk assessment framework that an organization can consider. It is provided here as an illustrative example, as there are a number of approaches used by industry to address risks to the bulk power system reliability. The framework is designed to serve as a reference for the users, owners and operators of the bulk power system who perform an internal risk review. The strategy and steps outlined are based on industry information available at the time of this report and should be adjusted as more data and information becomes available.
A7.1.1 Risk Management Strategy Addresses Common Concerns Table A7‐1 presents the risk control strategy that will be employed to establish the illustrative framework for industry as presented later in this section.
Table A7‐1: Aligning solar GMD threat mitigation concerns to a risk control strategy
Concern Risk Management Strategy
Complicated problem that has many components; too difficult to manage.
Identify the vulnerable components and determine a reasonable set of actions to take, align them into a logical sequence and methodically work across multiple complexities to achieve results in measurable phases.
Limited operational experience and historical reference available to assess the risk.
Collect known data and develop models and other simulation techniques to calculate and represent operational impacts.
The threat appears to be rare in occurrence and it will be expensive to mitigate the risk.
There is “low‐hanging” fruit in the form of vulnerability studies that can be employed to improve the posture of the system from impact and can be readily integrated into existing funded programs.
Impacts from solar events vary in terms of location and system.
A “large‐scale” approach is necessary due to the integrated nature of the operational components, reviewing effects on an interconnection‐wide basis. More vulnerable components can be isolated in reference to role in the system and targeted for advanced management procedures.
This risk is unlike the other risks managed on a daily basis to ensure system reliability; New and costly regulatory requirements will result.
Training and education programs on the nature of the threat will allow bulk power System Operators to more rapidly identify areas for improvement and take actions when necessary. Likewise, increasing system resilience to this threat can increase system response interoperability for other high impact, low frequency (HILF) risks such as a combined cyber/physical attack on the system. Few regulatory adjustments may be necessary if this risk is managed under existing bulk power reliability standards.
A7.2 Engineering GMD Resiliency into the Bulk Power System A7.2.1 - Ensuring Reliability of the Bulk Power System There are a number of formal entities that have a key role in ensuring reliability. The specific risk to the North American bulk power system from severe solar GMD requires international coordination between many formal entities. In the United States, the Federal Energy Regulatory

Attachment 7–A View on Risk Management
GMDTF Interim Report: Affects of Geomagnetic Disturbances on the Bulk Power System–February 2012 110
Commission (FERC), NERC, the Department of Homeland Security (DHS), the Department of Energy (DOE), the National Aeronautics and Space Administration (NASA), the Electric Power Research Institute (EPRI), and the National Oceanic and Atmospheric Agency (NOAA) are key stakeholders. In Canada, the organizations with a lead role include Natural Resources Canada (NRCan), the National Energy Board (NEB), Provincial Authorities, and NERC. These organizations are working closely with industry stakeholders to assess the risk and determine the vulnerability of the system to this threat.
A7.2.2 What is the Vulnerability? The North American bulk power system was not specifically designed to withstand the effects of a severe solar storm. Since 1989 a record of significant effects to the modern bulk power system from a solar event was established. Since then, there have been a number of isolated solar storm events in varying latitudes and strengths. All of these events have resulted in localized, rather than wide‐spread, damage to system components.
A7.2.3 The Risk of Geomagnetically Induced Current (GIC) to Extra High Voltage (EHV) Transformers and the System The sun’s activity is monitored, and the frequency and severity of the solar spots that produce the coronal mass ejections (CME) of concern are statistically predicted and aligned to cycles of solar activity. This is a scientific process that is highly dependent on specific satellite assets used to monitor the sun’s activities and perform “space weather predictions” that are accurate enough to allow earth‐based System Operators to make timely operational decisions. When discussing the risk to bulk power system operations from a solar geomagnetic disturbance, the fundamental risk question is: How will GIC resulting from the CME affect different types of bulk system transformers (EHV and generator step‐up), circuit breaker performance, and the protective systems that comprise the ability of the bulk power system to maintain the security and reliability of energy supply? This includes the impact to reactive power demand and the capability of system operators to maintain voltage support and economic load dispatch, as well as, the effect of increased system harmonics on equipment not designed to withstand levels outside established standards (e.g., capacitor banks). GIC has been known to occur on bulk power systems, but GIC impact to the system has not traditionally been identified as a specific risk to track and monitor outside those jurisdictions that have seen impact in the past. At this time there is no centralized reporting system for power companies to report incidents involving GIC impact.
A7.3 EHV Transformer Considerations As discussed earlier, the vulnerability of the transformer is a key component to this risk and determining the specific vulnerability will require a rigorous analysis process that incorporates the complexity of the problem. The process by which to examine this risk is by using analytical methods such as modeling and simulation and equipment testing. These methods will support changing transformer design or operational performance expectations when the system is under duress from GIC. Emerging trends in transformer vulnerability characteristics are presented in Table 5 later in this section for assistance in determining organizational asset vulnerability.

Attachment 7–A View on Risk Management
111 GMDTF Interim Report: Affects of Geomagnetic Disturbances on the Bulk Power System–February 2012
Age Transformers are typically reliable, rugged equipment designed to operate over decades. The design life of a transformer is typically 25 to 30 years, although, with proper maintenance, units can operate for up to 60 years. New transformers can withstand many unusual system conditions. Over time, transformers can accumulate effects of aging and wear which affects the insulation properties that would provide resilience to the unit from short‐circuit faults, system overvoltages or other abnormal stresses. There is also loss of transformer life caused by overheating.
Acquisition Lead Time The manufacturing capability of transformers within North America is limited at the time of this report. Above 500kV, most transformers are procured from non‐North American sources and typically take one to three years to acquire. In addition, these high voltage transformers are customized which can hinder the application of a North American “spare” strategy. However, spare equipment can play a vital transitional role, as the built‐in resiliency of the bulk power system industry meets the restoration requirements based on the effects from a specific event.
Geology Information about the conductivity structure of Earth can be obtained from magnetotelluric soundings, with interpretation aided by consideration of other geophysical and geological information. This information can be used to produce a layered model that represents Earth’s conductivity structure below the region of a specific power system. The one‐dimensional Earth models (i.e., only considering variation with depth) can be used to calculate the surface impedance of Earth, and show its variation across the North American continent.
Transportation EHV transformers require special handling while in transit to minimize internal shock to the mechanical components, as well as very specific internal environmental conditions that must be managed. The internal environment of a transformer is affected by many conditions to include moisture, dissolved gas levels, and other factors. In addition, EHV transformers are very large and require customized shipping strategies for each unit as well as heavy equipment on site to enable installation. These logistical factors contribute to the difficulty in supplying a spare transformer from a centralized source during an emergency. If the spare transformers are unavailable or if delivery is impeded by a regional impact from loss of power or other factors such as lack of access to specialized rail cars or trucks, inability to access roads, rail lines, or bridges, or inability to acquire fuel during a regional power outage, the ability to rapidly replace failed units may not be possible within required timeframes. Installing the replacement oftentimes requires the removal of the existing unit. In some cases, there are portable transformers that can be used as a temporary solution.
Increased Voltage of the North American Bulk Power System Over the past few decades, power transfer requirements have increased, requiring extra high‐voltage (EHV) transmission. The transmission capacity is inversely related to the transmission resistance; therefore, low resistance lines coupled with high resistance grounding increases GIC levels injected into transformers.

Attachment 7–A View on Risk Management
GMDTF Interim Report: Affects of Geomagnetic Disturbances on the Bulk Power System–February 2012 112
Role in the System The bulk power system has two primary aspects: transmission and generation. Electricity generation capabilities include nuclear, fossil, hydro, solar, natural gas and other sources. EHV transformers and generation step‐up units (GSU’s) are required to be operational for bulk electricity to be transmitted and ultimately distributed to local utilities. If there is an isolated failure of a few transformer units, electricity can be redistributed across other lines, but if there are many failures, the impact to electricity generation is immediate. The premise of reliable power is that the “load” remains balanced and generation matches consumption. The transition period where generation balances to new load demands is critical and can affect system stability. The cessation of generation activities in certain facilities such as nuclear plants adds risk to stability and most generating plants require access to reliable electricity to operate properly.
A7.3.1 Vulnerable to Resilient While the process to determine the vulnerability of EHV transformers is important to defining vulnerability from GMD, there are actions and steps the bulk power industry can take to mitigate the effects on system reliability from solar events. Like other naturally occurring events such as inclement weather, severe thunderstorms, hurricanes, earthquake, etc., GMD has affected bulk power operations in the past and requires specific attention.
A7.3.2 Current State of Operations As NERC works to understand the vulnerability and consequence of the risk of solar GMD to bulk power system reliability, it is important to understand the current ability of industry to respond to warnings of increased solar activity.
A7.3.3 Creating a Framework: The Integrated Vision for the Future In order to establish a program to address this complex threat, it is valuable to create a basic framework that will allow individual program elements to be identified and then demonstrate how they integrate in order to achieve the desired result of a bulk power system that is inherently resilient to the effects of the sun. This framework can then serve as a roadmap for the industry to refer to as internal programs are established and it also highlights programs that are vital to the success of achieving this goal. There are two basic steps that will be employed to create the appropriate framework. The first step is to identify the primary components and sub‐topics in order to establish a boundary to the planning process, and the second step is to create a phased strategy where individual actions can be aligned into “actionable” processes conducted over a period of time.

Attachment 7–A View on Risk Management
113 GMDTF Interim Report: Affects of Geomagnetic Disturbances on the Bulk Power System–February 2012
A7.3.4 Step One: Identify the Components There are program categories in Figure A7‐1 currently identified to capture the basic program elements under consideration at this time. These are as follows:
1. Space Weather Forecasting
2. Alert Notification and Response
3. System and Operational Planning: Modeling and Simulation
4. Equipment Design
5. System Operations
6. Training and Education
Figure A7‐1: Integrated approach–bulk power system resilience to geomagnetic disturbances
Figure A7‐2 provides an example of how to assign sub‐components (sub‐topics) within the larger program categories. This document provides specific information on many of these sub‐topics aligned to the program categories. Additionally, some sub‐topics may belong to more than one program categories.

Attachment 7–A View on Risk Management
GMDTF Interim Report: Affects of Geomagnetic Disturbances on the Bulk Power System–February 2012 114
Figure A7‐2: Primary and sub‐components of understanding and mitigating risk
A7.3.5 Step Two: Assess the Components Using a Phased Approach Once the program components and sub‐components are identified, there remains a requirement to address the sequencing of the expected actions associated with developing solutions to mitigate the risk. For this process, four primary phases of activity have been identified. These are shown in Figure A7‐3.
Space Weather Forecasting
• Scientific space‐based satellite assets and llfacilities to assess the potential impact to earth
• Interface across organizations
• Timing and expected impact duration
• Historical Data
Alert Notification and Response
• K‐Indices and other severity llmeasurement scales
• Process to alert the industry
• Role of organization
• Timeframe for decision making
Modeling and Simulation
• Existing or postulated data
• GIC impact
• Equipment and System Vulnerabilities
Equipment Design
• Design Standards
• EHV Transformers
• Test and Evaluation
• Acquisition Strategies
• Protective Components
System Operations
• Pre, During and Post‐event llOperational Protocols
• Regulatory Requirements
• Emergency Management Procedures
• Communications
Training and Education
• Awareness Programs
• Certification Programs
• Exercises
• Outreach Programs
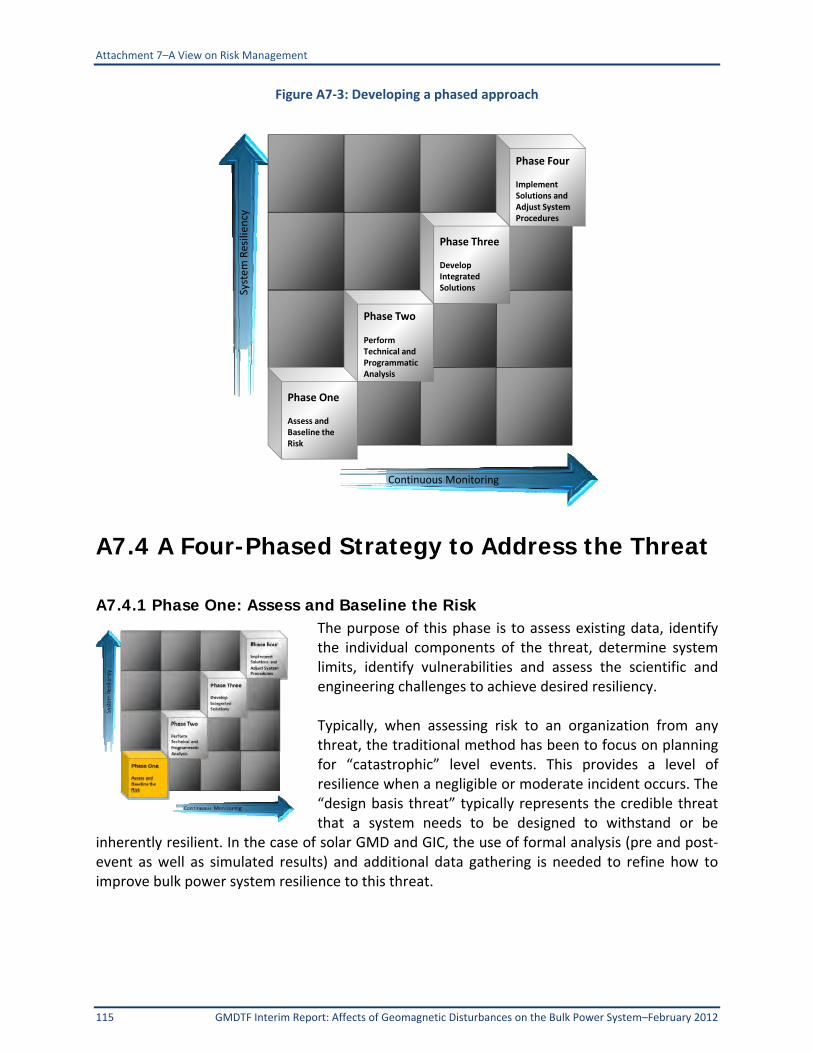
Attachment 7–A View on Risk Management
115 GMDTF Interim Report: Affects of Geomagnetic Disturbances on the Bulk Power System–February 2012
Figure A7‐3: Developing a phased approach
A7.4 A Four-Phased Strategy to Address the Threat
A7.4.1 Phase One: Assess and Baseline the Risk The purpose of this phase is to assess existing data, identify the individual components of the threat, determine system limits, identify vulnerabilities and assess the scientific and engineering challenges to achieve desired resiliency. Typically, when assessing risk to an organization from any threat, the traditional method has been to focus on planning for “catastrophic” level events. This provides a level of resilience when a negligible or moderate incident occurs. The “design basis threat” typically represents the credible threat that a system needs to be designed to withstand or be
inherently resilient. In the case of solar GMD and GIC, the use of formal analysis (pre and post‐event as well as simulated results) and additional data gathering is needed to refine how to improve bulk power system resilience to this threat.
Continuous Monitoring
System Resiliency
Phase One
Assess and Baseline the Risk
Phase Two
Perform Technical and Programmatic Analysis
Phase Three
Develop Integrated Solutions
Phase Four
Implement Solutions and Adjust System Procedures

Attachment 7–A View on Risk Management
GMDTF Interim Report: Affects of Geomagnetic Disturbances on the Bulk Power System–February 2012 116
A7.4.2 Phase Two: Perform Technical and Programmatic Analysis The next phase in this process involves performing an in‐depth scientific, mathematical and engineering analysis to further validate and predict system performance expectations against various scenarios. This phase involves the refinement or development of specific modeling and simulation capabilities, as well as physical testing of existing equipment to further understand the vulnerability and then develop solutions. These solutions include databases, software, models, reports, procedures, and other tangible results. An important aspect of this phase is the ability to collect
accurate data of system impacts as they continue to occur. For example, the sun will continue to impact Earth while this analysis is underway, so the ability to integrate changing data into this process is necessary. Formal data repositories and continued discussion across the North American and International bulk power industry will serve as an enabler during this process, as will the ability to openly share technical data and results. Once the risk is understood and an organizational baseline is created to define the potential vulnerability, the next step involves performing the technical and programmatic analysis required to further define and capture results that will allow for changes in system design and in operational procedures. This quantitative and qualitative analysis will allow leadership to make decisions concerning the need to make significant changes in the bulk power system to increase resiliency to this threat. In addition to the technical analysis performed, there are programmatic reviews that an organization can perform to assess the threat.
A7.4.3 Phase Three: Develop Integrated Solutions Once the analysis and awareness activities conducted during Phase Two are developed, the next step is to integrate the results and develop solutions. Phase Three represents the point where the system begins to achieve an increased state of resilience; the threat has been defined, the system has been analyzed, quantitative and qualitative results are being produced, and the organization understands the threat. These individual solutions and successes can then be integrated formally to change the dynamic of the risk. At first, the system becomes more resilient as operational procedures are adjusted based on the analysis, but then as acquisition strategies and
vulnerable asset replacement programs, or other proposed solutions are implemented, the system becomes more resilient because it has being “engineered” to operate during solar events. An important aspect to this phase is the review and creation of standards, regulatory requirements, system operator certifications, and acquisition policies. In certain cases, the results and recommendations can be accommodated within existing policies, but if changes are required, these would be produced in this phase, or validated and ready for implementation.
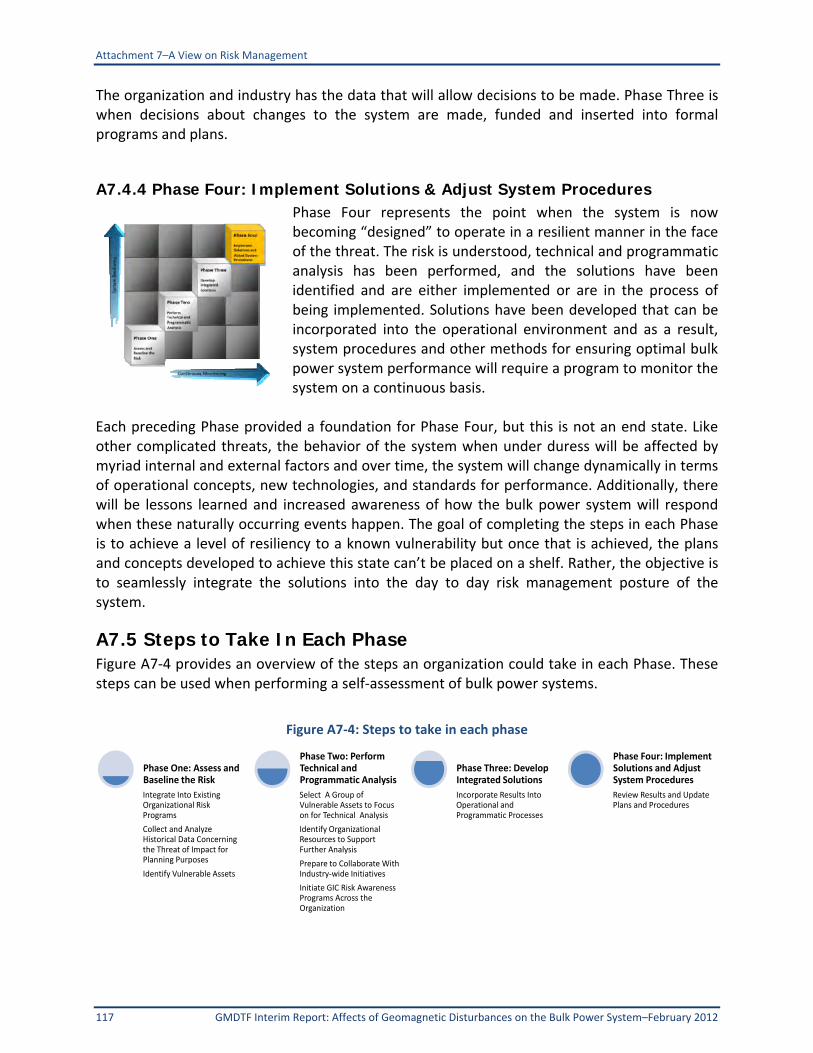
Attachment 7–A View on Risk Management
117 GMDTF Interim Report: Affects of Geomagnetic Disturbances on the Bulk Power System–February 2012
The organization and industry has the data that will allow decisions to be made. Phase Three is when decisions about changes to the system are made, funded and inserted into formal programs and plans.
A7.4.4 Phase Four: Implement Solutions & Adjust System Procedures Phase Four represents the point when the system is now becoming “designed” to operate in a resilient manner in the face of the threat. The risk is understood, technical and programmatic analysis has been performed, and the solutions have been identified and are either implemented or are in the process of being implemented. Solutions have been developed that can be incorporated into the operational environment and as a result, system procedures and other methods for ensuring optimal bulk power system performance will require a program to monitor the system on a continuous basis.
Each preceding Phase provided a foundation for Phase Four, but this is not an end state. Like other complicated threats, the behavior of the system when under duress will be affected by myriad internal and external factors and over time, the system will change dynamically in terms of operational concepts, new technologies, and standards for performance. Additionally, there will be lessons learned and increased awareness of how the bulk power system will respond when these naturally occurring events happen. The goal of completing the steps in each Phase is to achieve a level of resiliency to a known vulnerability but once that is achieved, the plans and concepts developed to achieve this state can’t be placed on a shelf. Rather, the objective is to seamlessly integrate the solutions into the day to day risk management posture of the system.
A7.5 Steps to Take In Each Phase Figure A7‐4 provides an overview of the steps an organization could take in each Phase. These steps can be used when performing a self‐assessment of bulk power systems.
Figure A7‐4: Steps to take in each phase
Integrate Into Existing Organizational Risk Programs
Collect and Analyze Historical Data Concerning the Threat of Impact for Planning Purposes
Identify Vulnerable Assets
Phase One: Assess and Baseline the Risk
Select A Group of Vulnerable Assets to Focus on for Technical Analysis
Identify Organizational Resources to Support Further Analysis
Prepare to Collaborate With Industry‐wide Initiatives
Initiate GIC Risk Awareness Programs Across the Organization
Phase Two: Perform Technical and Programmatic Analysis
Incorporate Results Into Operational and Programmatic Processes
Phase Three: Develop Integrated Solutions
Review Results and Update Plans and Procedures
Phase Four: Implement Solutions and Adjust System Procedures

Attachment 8–Example of GIC Calculation
GMDTF Interim Report: Affects of Geomagnetic Disturbances on the Bulk Power System–February 2012 118
Attachment 8: Example of GIC Calculations
A8.1 Introduction This attachment presents the method to calculate the distribution of GIC in a power network based on the considerations described in Chapter 8. Numerical examples are also provided as an engineering reference.
A8.2 Calculation of GIC in HV and EHV Networks During geomagnetic disturbances, magnetic field variations drive electric currents along transmission lines and through transformer windings to ground. These geomagnetically induced currents (GICs) produce half‐cycle saturation in transformers, leading to harmonic generation and increased reactive power demand. As part of assessing the hazard to power systems and planning mitigation, it is necessary to model GIC produced to different levels of geomagnetic activity. The following sections provide an overview of the modeling procedure for determining GIC in high voltage (HV) and extra high voltage (EHV) networks. A number of complex phenomena cause Earth’s magnetic field to vary slowly with time. Changes in Earth’s magnetic field density with respect to time (i.e., dB/dt) are generally on the order of millihertz (mHz). These changes in Earth’s magnetic field produce an electric field at Earth’s surface, resulting in an induced voltage along the length of the transmission line via Faraday’s Law. The resulting induced voltage drives GIC flow in the system wherever a path for current flow exists. Connections to ground are not a prerequisite for GIC flow [1] to occur. This process is illustrated for the simple two bus system shown in Figure A8‐1.

Attachment 8–Example of GIC Calculation
119 GMDTF Interim Report: Affects of Geomagnetic Disturbances on the Bulk Power System–February 2012
Figure A8‐1: Induction process and system model
The following sections describe the models necessary to compute GIC.
A8.2.1 Transmission Line Models Slow varying dB/dt results in an induced voltage in the millihertz range. Thus, the induced voltage can be modeled as purely DC, and the system can be modeled by a resistance network (i.e., mutual coupling, inductance and shunt capacitance can be ignored). A three‐phase transmission line model that can be used for GIC calculation is shown in Figure A8‐2.
Figure A8‐2: Transmission line model
The quasi‐DC voltage that is induced in each phase of a transmission line can be computed using Faraday’s Law as defined in (1):
ldEVdc
(1)
ldEVdc

Attachment 8–Example of GIC Calculation
GMDTF Interim Report: Affects of Geomagnetic Disturbances on the Bulk Power System–February 2012 120
where
E is the induced geoelectric field at the surface of Earth, and ld
is the incremental
length of the transmission line including direction. For the purposes of GIC calculations, it is assumed that the electric field at the height of the transmission line is equal to the electric field at Earth’s surface. If the geoelectric field can be assumed constant in the geographical area of a transmission line, then only the coordinates of the end point of the line are important,
regardless of routing twists and turns. The resulting incremental length vector ld, becomes L
.
The vector L, representing the length and direction of the line between end points can be
constructed using an arbitrary reference; however, such a method can introduce error. An improved method is to compute the distance in the x and y directions independently. Recall that the dot product of two vectors A and B can be computed using (2):
yyxx BABABA
(2)
Thus (1) can be approximated by (3):
yyxx LELELE
(3)
where Ex is the northward electric field (V/km), Ey is the eastward electric field (V/km), Lx is the northward distance (km), and Ly is the eastward distance (km). The following procedure can be used to compute northward and eastward distances. Consider a transmission line between substations A and B. The northward distance can be computed using (4):
lat2.111Lx (4)
where ∆lat is the difference in latitude (degrees) between the two substations A and B. The eastward distance can be computed using (5):
90sinlong2.111Ly (5)
where ∆long is the difference in longitude (degrees) between the two substations A and B, and is defined in (6) as the average of the two latitudes:
2
LatBLatA (6)
The line resistance that is modeled is simply the DC resistance of the line. If this value is unavailable, it can be derived from the positive sequence resistance of the line using a correction factor to account for skin effect. The correction factor varies from approximately 0.95 for large conductors (e.g., 1,590 MCM), to unity for smaller conductors (e.g., 750 MCM) [2]. Specific correction factors can be determined from conductor tables. When possible, the DC resistance corresponding to the line operating temperature should be used.

Attachment 8–Example of GIC Calculation
121 GMDTF Interim Report: Affects of Geomagnetic Disturbances on the Bulk Power System–February 2012
A8.2.2 Transformer Model Calculating GIC requires a modification in the way in which transformers are modeled. In the case of GIC calculations, only the winding resistance is modeled, and induction between the windings is ignored. Figure 3 shows the three‐phase equivalent circuit of several common types of transformer winding configurations. Note that transformer windings without terminal designations are ignored in the analysis. This corresponds to all delta windings (as shown in Figure 3) and ungrounded wye windings (not shown).
Figure A8‐3: GIC models of common transformer winding configurations
Three‐Winding Transformer Gy‐Gy‐Delta
GSU Gy‐Delta
Autotransformer Gy‐Gy‐Delta
Rw2
Rw2
Rw2
Rw1
Rw1
Rw1
Rw3
Rw3
Rw3
H0
H1
H2
H3
X1
X2
X3
X0
Rw1
Rw1
Rw1
Rw2
Rw2 Rw2
H1
H2
H3
H0
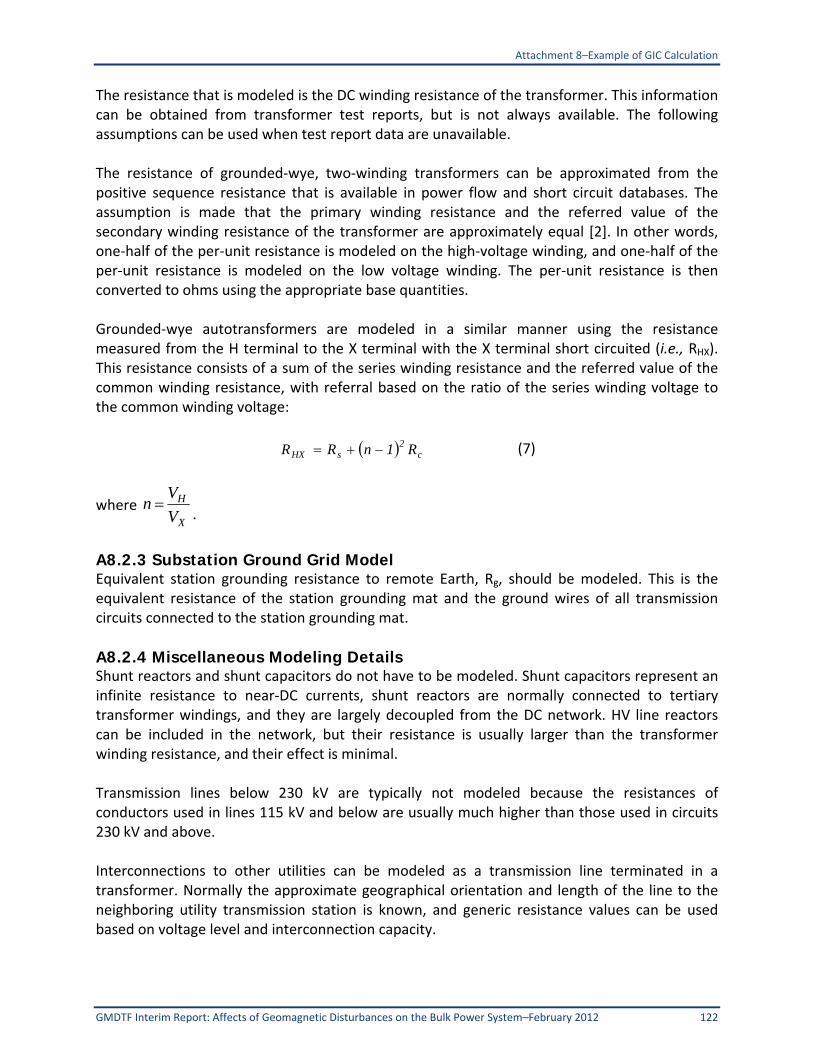
Attachment 8–Example of GIC Calculation
GMDTF Interim Report: Affects of Geomagnetic Disturbances on the Bulk Power System–February 2012 122
The resistance that is modeled is the DC winding resistance of the transformer. This information can be obtained from transformer test reports, but is not always available. The following assumptions can be used when test report data are unavailable. The resistance of grounded‐wye, two‐winding transformers can be approximated from the positive sequence resistance that is available in power flow and short circuit databases. The assumption is made that the primary winding resistance and the referred value of the secondary winding resistance of the transformer are approximately equal [2]. In other words, one‐half of the per‐unit resistance is modeled on the high‐voltage winding, and one‐half of the per‐unit resistance is modeled on the low voltage winding. The per‐unit resistance is then converted to ohms using the appropriate base quantities. Grounded‐wye autotransformers are modeled in a similar manner using the resistance measured from the H terminal to the X terminal with the X terminal short circuited (i.e., RHX). This resistance consists of a sum of the series winding resistance and the referred value of the common winding resistance, with referral based on the ratio of the series winding voltage to the common winding voltage:
c2
sHX R1nRR (7)
where X
H
V
Vn
.
A8.2.3 Substation Ground Grid Model Equivalent station grounding resistance to remote Earth, Rg, should be modeled. This is the equivalent resistance of the station grounding mat and the ground wires of all transmission circuits connected to the station grounding mat.
A8.2.4 Miscellaneous Modeling Details Shunt reactors and shunt capacitors do not have to be modeled. Shunt capacitors represent an infinite resistance to near‐DC currents, shunt reactors are normally connected to tertiary transformer windings, and they are largely decoupled from the DC network. HV line reactors can be included in the network, but their resistance is usually larger than the transformer winding resistance, and their effect is minimal. Transmission lines below 230 kV are typically not modeled because the resistances of conductors used in lines 115 kV and below are usually much higher than those used in circuits 230 kV and above. Interconnections to other utilities can be modeled as a transmission line terminated in a transformer. Normally the approximate geographical orientation and length of the line to the neighboring utility transmission station is known, and generic resistance values can be used based on voltage level and interconnection capacity.

Attachment 8–Example of GIC Calculation
123 GMDTF Interim Report: Affects of Geomagnetic Disturbances on the Bulk Power System–February 2012
A8.3 Example Calculation of GIC in HV and EHV Networks The following section describes the steps that can be taken to compute GIC flow in a power system. The network can be modeled as a single‐phase network because the spatial distances between conductors of a transmission circuit are negligible compared to the distance of the transmission circuit to the electrojet. The example six‐bus system that will be analyzed is shown in Figure A8‐4. Bus numbers are shown at bus locations. Encircled numbers refer to circuit nodes that will be used later in the calculation of GIC.
Figure A8‐4: Example system used to compute GIC
Required system data are provided in Tables A8‐1and A8‐2.
Table A8‐1: Substation location and ground grid resistance
Name Latitude Longitude
Grounding
Resistance
(Ohms)
Sub 1 33.613499 ‐87.373673 0.2
Sub 2 34.310437 ‐86.365765 0.2
Sub 3 33.955058 ‐84.679354 0.2
Table A8‐2: Transmission line information
Line From
Bus
To
Bus
Length
(km)
Resistance
(Ohms/phase)
1 2 3 121.03 3.525
2 4 5 160.18 4.665
G
2 31T1
345 kV
500 kV
G
6T3
SUB 1
T2
54SUB 2SUB 3
1 2
3
4
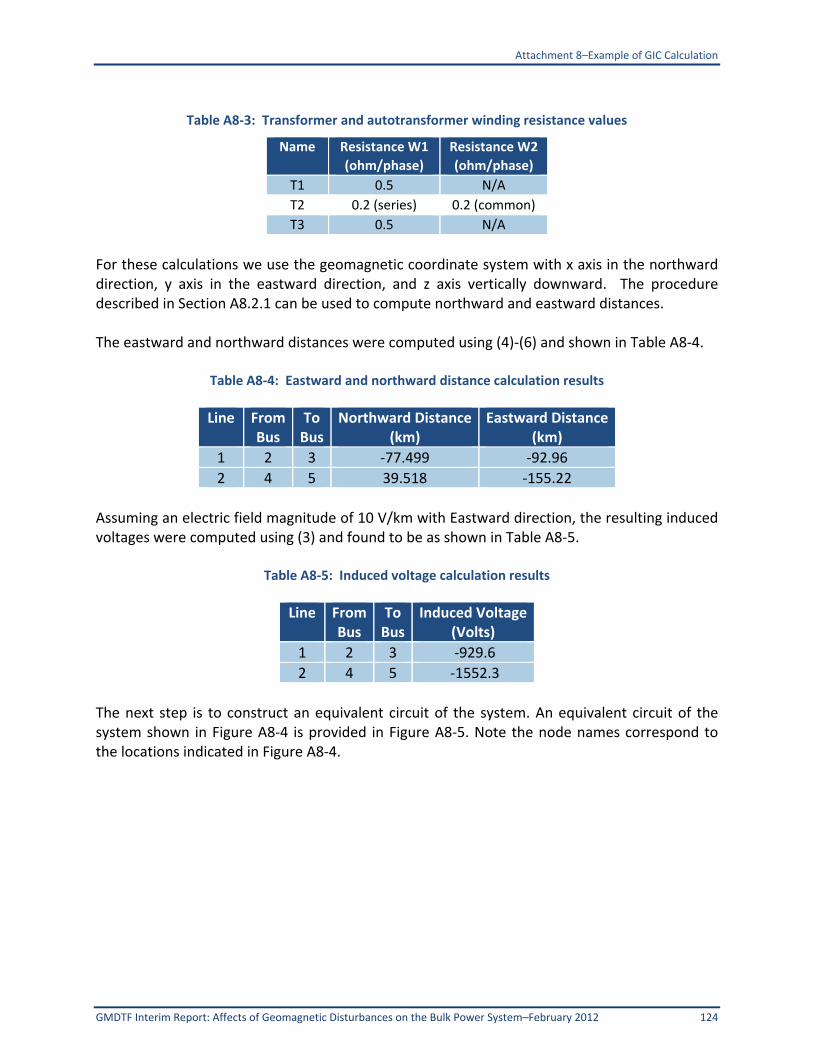
Attachment 8–Example of GIC Calculation
GMDTF Interim Report: Affects of Geomagnetic Disturbances on the Bulk Power System–February 2012 124
Table A8‐3: Transformer and autotransformer winding resistance values
Name Resistance W1
(ohm/phase)
Resistance W2
(ohm/phase)
T1 0.5 N/A
T2 0.2 (series) 0.2 (common)
T3 0.5 N/A
For these calculations we use the geomagnetic coordinate system with x axis in the northward direction, y axis in the eastward direction, and z axis vertically downward. The procedure described in Section A8.2.1 can be used to compute northward and eastward distances. The eastward and northward distances were computed using (4)‐(6) and shown in Table A8‐4.
Table A8‐4: Eastward and northward distance calculation results
Line From Bus
To Bus
Northward Distance(km)
Eastward Distance (km)
1 2 3 ‐77.499 ‐92.96
2 4 5 39.518 ‐155.22
Assuming an electric field magnitude of 10 V/km with Eastward direction, the resulting induced voltages were computed using (3) and found to be as shown in Table A8‐5.
Table A8‐5: Induced voltage calculation results
Line From Bus
To Bus
Induced Voltage(Volts)
1 2 3 ‐929.6
2 4 5 ‐1552.3
The next step is to construct an equivalent circuit of the system. An equivalent circuit of the system shown in Figure A8‐4 is provided in Figure A8‐5. Note the node names correspond to the locations indicated in Figure A8‐4.

Attachment 8–Example of GIC Calculation
125 GMDTF Interim Report: Affects of Geomagnetic Disturbances on the Bulk Power System–February 2012
Figure A8‐5: Equivalent circuit of example system
Although the equivalent circuit shown in Figure 5 can be solved directly, it is more convenient to perform the calculations using nodal analysis. To convert the equivalent circuit shown in Figure 5 to a form more suitable for nodal analysis, the voltage sources are converted to current sources, and all impedance elements are converted to their equivalent admittances. The resulting equivalent circuit is shown in Figure A8‐6.
Figure A8‐6: Equivalent circuit of example system in nodal form
The admittance matrix of the circuit shown in Figure A8‐6 can be readily constructed, and is shown in general form in (8):

Attachment 8–Example of GIC Calculation
GMDTF Interim Report: Affects of Geomagnetic Disturbances on the Bulk Power System–February 2012 126
0 0
0
0
0 0
(8)
Substituting the appropriate values into (8) results in (9):
3.578 0.851 0 00.851 19.601 15 00 15 15.643 0.6430 0 0.643 3.37
(9)
The resulting nodal current injections were found to be:
3791.15
3998.23
The current vector can be constructed using the nodal currents as shown in (10):
(10)
The resulting node voltages are computed using Ohms Law
229.7236.2587.08279.56
(11)
The GIC flows (all three phases combined) are computed using various relationships derived from the circuit. The results are as follows:
626.5 (12)
626.5 (13)
762.45 (14)
135.95 (15)
762.45 (16)
762.45 (17)
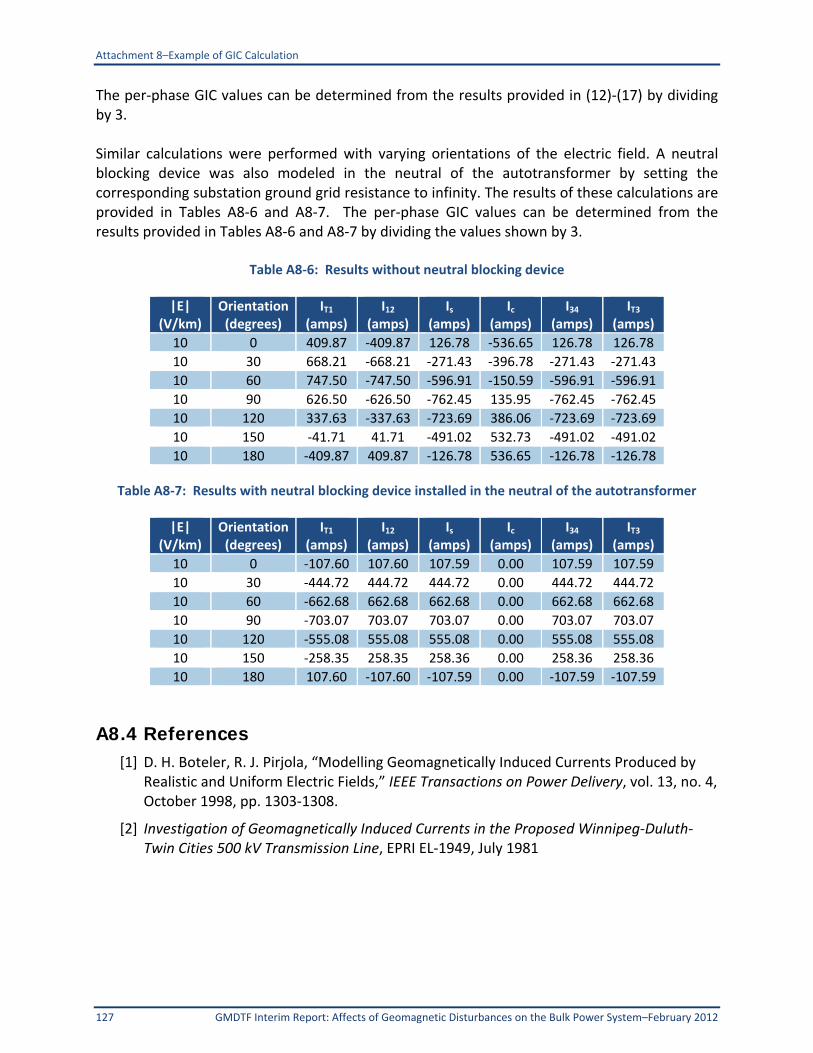
Attachment 8–Example of GIC Calculation
127 GMDTF Interim Report: Affects of Geomagnetic Disturbances on the Bulk Power System–February 2012
The per‐phase GIC values can be determined from the results provided in (12)‐(17) by dividing by 3. Similar calculations were performed with varying orientations of the electric field. A neutral blocking device was also modeled in the neutral of the autotransformer by setting the corresponding substation ground grid resistance to infinity. The results of these calculations are provided in Tables A8‐6 and A8‐7. The per‐phase GIC values can be determined from the results provided in Tables A8‐6 and A8‐7 by dividing the values shown by 3.
Table A8‐6: Results without neutral blocking device
|E| (V/km)
Orientation (degrees)
IT1(amps)
I12(amps)
Is(amps)
Ic(amps)
I34 (amps)
IT3 (amps)
10 0 409.87 ‐409.87 126.78 ‐536.65 126.78 126.78
10 30 668.21 ‐668.21 ‐271.43 ‐396.78 ‐271.43 ‐271.43
10 60 747.50 ‐747.50 ‐596.91 ‐150.59 ‐596.91 ‐596.91
10 90 626.50 ‐626.50 ‐762.45 135.95 ‐762.45 ‐762.45
10 120 337.63 ‐337.63 ‐723.69 386.06 ‐723.69 ‐723.69
10 150 ‐41.71 41.71 ‐491.02 532.73 ‐491.02 ‐491.02
10 180 ‐409.87 409.87 ‐126.78 536.65 ‐126.78 ‐126.78
Table A8‐7: Results with neutral blocking device installed in the neutral of the autotransformer
|E| (V/km)
Orientation (degrees)
IT1(amps)
I12(amps)
Is(amps)
Ic(amps)
I34 (amps)
IT3 (amps)
10 0 ‐107.60 107.60 107.59 0.00 107.59 107.59
10 30 ‐444.72 444.72 444.72 0.00 444.72 444.72
10 60 ‐662.68 662.68 662.68 0.00 662.68 662.68
10 90 ‐703.07 703.07 703.07 0.00 703.07 703.07
10 120 ‐555.08 555.08 555.08 0.00 555.08 555.08
10 150 ‐258.35 258.35 258.36 0.00 258.36 258.36
10 180 107.60 ‐107.60 ‐107.59 0.00 ‐107.59 ‐107.59
A8.4 References [1] D. H. Boteler, R. J. Pirjola, “Modelling Geomagnetically Induced Currents Produced by
Realistic and Uniform Electric Fields,” IEEE Transactions on Power Delivery, vol. 13, no. 4, October 1998, pp. 1303‐1308.
[2] Investigation of Geomagnetically Induced Currents in the Proposed Winnipeg‐Duluth‐Twin Cities 500 kV Transmission Line, EPRI EL‐1949, July 1981
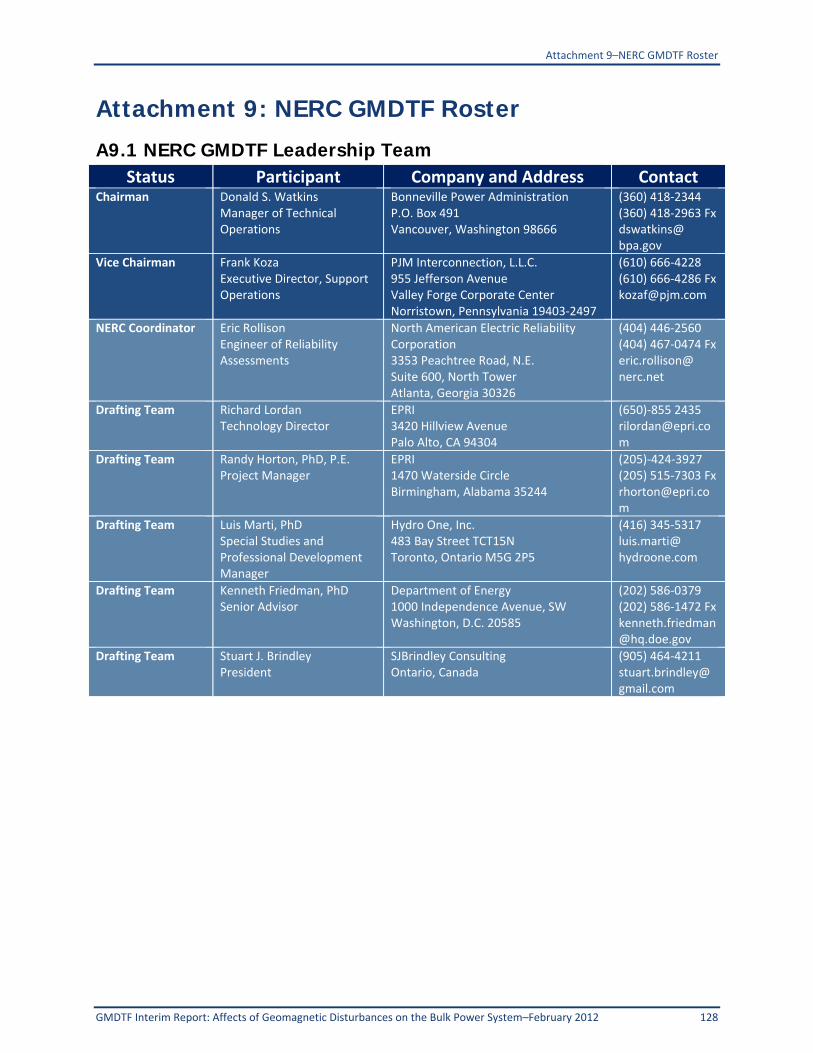
Attachment 9–NERC GMDTF Roster
GMDTF Interim Report: Affects of Geomagnetic Disturbances on the Bulk Power System–February 2012 128
Attachment 9: NERC GMDTF Roster
A9.1 NERC GMDTF Leadership Team Status Participant Company and Address Contact
Chairman Donald S. Watkins Manager of Technical Operations
Bonneville Power AdministrationP.O. Box 491 Vancouver, Washington 98666
(360) 418‐2344(360) 418‐2963 Fx dswatkins@ bpa.gov
Vice Chairman Frank Koza Executive Director, Support Operations
PJM Interconnection, L.L.C.955 Jefferson Avenue Valley Forge Corporate Center Norristown, Pennsylvania 19403‐2497
(610) 666‐4228(610) 666‐4286 Fx [email protected]
NERC Coordinator Eric Rollison Engineer of Reliability Assessments
North American Electric Reliability Corporation 3353 Peachtree Road, N.E. Suite 600, North Tower Atlanta, Georgia 30326
(404) 446‐2560(404) 467‐0474 Fx eric.rollison@ nerc.net
Drafting Team Richard Lordan Technology Director
EPRI 3420 Hillview Avenue Palo Alto, CA 94304
(650)‐855 [email protected]
Drafting Team Randy Horton, PhD, P.E.Project Manager
EPRI1470 Waterside Circle Birmingham, Alabama 35244
(205)‐424‐3927(205) 515‐7303 Fx [email protected]
Drafting Team Luis Marti, PhD Special Studies and Professional Development Manager
Hydro One, Inc.483 Bay Street TCT15N Toronto, Ontario M5G 2P5
(416) 345‐5317luis.marti@ hydroone.com
Drafting Team Kenneth Friedman, PhDSenior Advisor
Department of Energy1000 Independence Avenue, SW Washington, D.C. 20585
(202) 586‐0379(202) 586‐1472 Fx [email protected]
Drafting Team Stuart J. Brindley President
SJBrindley ConsultingOntario, Canada
(905) 464‐4211stuart.brindley@ gmail.com

Attachment 9–NERC GMDTF Roster
129 GMDTF Interim Report: Affects of Geomagnetic Disturbances on the Bulk Power System–February 2012
A9.2 NERC GMDTF Members Roster
Status Participant Company and Address Contact Member Michael Bocovich
Principal Substation Maintenance Engineer
Xcel Energy, Inc. 8701 Monticello Lane Maple Grove, Minnesota 55369
(763) 493‐1560 Michael.Bocovich@ XcelEnergy.com
Member Stephen Boutiler Sr. Engineering Specialist
Nova Scotia Power Inc. NPSI (Ragged Lake), P.O. Box 910 Halifax, Nova Scotia B3J 2W5
(902) 428‐7751 stephen.boutilier@ nspower.ca
Member Sebastien Guillon Engineer
Hydro‐Quebec TransEnergie 2 Complx Desjardins, 9th Floor, CP10000 Montreal, Quebec H5B 1H7
(514) 879‐4100 ext. 5439 guillon.sebastien@ hydro.qc.ca
Member David Wojtczak Team Leader, Substation Services
American Transmission Company, LLC ATC PO Box 47 Waukesha, Wisconsin 53187
(262) 506‐6823 dwojtczak@ atcllc.com
Member Victoria Bannon Director Systems Operations
Duke Energy 526 South Church Street Charlotte, North Carolina 28202
(704) 382‐0817 victoria.bannon@ duke‐energy.com
Member Alton Comans Chief Engineer
Southern Company Services, Inc. 600 North 18th St Birmingham, Alabama 35291
(205) 257‐4031 alcomans@ southernco.com
Member Richard Becker Substation Engineering Manager
Bonneville Power Administration 2401 NE Minnehaha St. Vancouver, Washington 98661
(360) 619‐6220 (360) 619‐6989 Fx rabeckerjr@ bpa.gov
Member Janet Smith, Phd Regulatory Affairs Supervisor
Arizona Public Service Co. PO Box 53933 Sta. 3200 Phoenix, Arizona 85072
(602) 250‐2927 Janet.smith@ aps.com
Member Raymond M. Connolly, III Director, Transmission Planning
Exelon Corporation 3 Lincoln Centre Oakbrook Terrace, IL 60181
(630) 437‐3320 raymond.m.connolly@ exeloncorp.com
Member Mike Cooper US Transmission R&D
National Grid 40 Sylvan Road Waltham, Massachusetts 02451
(781) 907‐2495 michael.cooper@ us.ngrid.com
Member Mohammed Alfayyoumi Manager ‐ Electric Transmission Operations Engineering
Dominion Virginia Power 701 East Cary Street Richmond , Virginia 23219
(804) 771‐3702 (804) 771‐6304 Fx mohammed.alfayyoumi@ dom.com
Member Emanuel Bernabeu Engineer III
Dominion Technical Solutions, Inc. 2400 Grayland Avenue Richmond, Virginia 23220
(804) 432‐8780 emanuel.e.bernabeu@ dom.com
Member Manjula Datta‐Barua Manager, System Protection
CenterPoint Energy 1111 Louisiana Houston, Texas 77002
(713) 207‐2752 (713) 207‐2281 Fx manjula.datta‐barua@ centerpointenergy.com
Member Kenneth R. Fleischer Cheif Electrical/I&C Engineer
NextEra Energy Resources, LLC P.O. Box 14000 Juno Beach, FL 33408‐0420
(561) 691‐2456 kenneth.fleischer@ fpl.com
Member Michael Galantich Area Manager
Con Edison 469 Tarrytown Road White Plains, New York 10607
(914) 422‐8253 (914) 422‐8259 Fx galantichm@ coned.com

Attachment 9–NERC GMDTF Roster
GMDTF Interim Report: Affects of Geomagnetic Disturbances on the Bulk Power System–February 2012 130
Status Participant Company and Address Contact Member Gregory D Hataway
Division Engineer ‐ Power Delivery
PowerSouth Energy Cooperative 2027 E. Three Notch Street Andalusia, Alabama 36421
(334) 427‐3281 (334) 427‐3726 Fx greg.hataway@ powersouth.com
Member Eric Hatter Supervisor, EMS Applications ‐ Transmission Operations
American Electric Power 8400 Smith's Mill Road New Albany, Ohio 43054
614‐413‐2384 [email protected]
Member John Isecke, P.E. Chief Engineer
Con Edison Company of New York Equipment and Field Engineering Department Central Engineering 4 Irving Place Room 5SW New York, New York 10003
(212) 460‐6369 iseckej@ coned.com
Member Mario L Kiresich Power System Operation Specialist 4
Southern California Edison Co. 501 S. Marengo Ave Alhambra, California 91803
(626) 308‐6022 (626) 308‐6373 Fx mario.kiresich@ sce.com
Member Gary Kobet Project Specialist System Protection
Tennessee Valley Authority 1101 Market Street MR 1B Chattanooga, Tennessee 37402‐2801
(423) 751‐4104 [email protected]
Member Justin Lane, P.E. Electrical Engineer
PSEG Nuclear 80 Park Plaza P.O. Box 570 Newark, New Jersey 07101
(856) 339‐2367 justin.lane@ pseg.com
Member Kenneth Petroff
PSEG Nuclear Alloway Creek Neck Road Hancocks Bridge, New Jersey 08038
(856) 339‐3179 kenneth.petroff@ pseg.com
Member Russell Neal Strategic Program Manager
Southern California Edison Co. 14799 Chestnut Street Westminster, California 92683
(714)895‐0300 (714) 895‐0593 Fx russell.neal@ sce.com
Member Qun Qiu, Ph.D., PE Senior Engineer
American Electric Power 700 Morrison Road Gahanna, Ohio 43230
(614) 552‐1182 (614) 883‐7020 Fx [email protected]
Member Ralph H. McKosky Project Manager‐Technical Innovations
Tennessee Valley Authority 1101 Market Street SP 5D Chattanooga, Tennessee 37402‐2801
(423) 751‐3659 (423) 751‐2463 Fx rhmckosky@ tva.gov
Member Julie Ann Soutuyo Senior Program Manager
Tennessee Valley Authority 1101 Market Street Chattanooga, TN 37402‐3801
(703) 862‐0819 (256) 489‐5201 Fx [email protected]
Member Bradley C. Young Manager of Reliability and Compliance
LG&E and KU Services Company 1 Quality Street Lexington, Kentucky 40507
(859) 367‐5703 (502) 217‐2249 Fx brad.young@ lge‐ku.com
Member David Wallach, P.E. Senior Engineer
Duke Energy 526 S. Chrurch St., Mailcode EC09Q P.O. Box 1006 Charlotte, North Carolina 28201
(980) 373‐4167 (704) 382‐5607 Fx david.wallach@ duke‐energy.com
Member Bruce Whitney Principal Engineer
ITC Holdings 27175 Energy Way Novi, Michigan 48377
(248) 946‐3239 (248) 946‐3229 Fx bwhitney@ itctransco.com
Member Ian S Grant Senior Manager, NERC Planning Coordinator
Tennessee Valley Authority 1101 Market Street MR‐5G‐C Chattanooga, Tennessee 37402‐2801
(423) 751‐8721 [email protected]

Attachment 9–NERC GMDTF Roster
131 GMDTF Interim Report: Affects of Geomagnetic Disturbances on the Bulk Power System–February 2012
Status Participant Company and Address Contact Member Gary Victor Gazankas
Manager ‐ System Planning and Engineering
Great Lakes Power Transmission, LP 2 Sackville Road Suite B Sault Ste. Marie, Ontario P6B 6J6
(705) 256‐3842 (705) 759‐7706 Fx [email protected]
Member Warren Whitson Transmission Planning
Southern Company Services, Inc. 600 North, 18th Street Birmingham, Alabama 35291
(205)‐257‐3472 wwhitson@ southernco.com
Regional Entity Larry Bugh Chief Security Officer
ReliabilityFirst Corporation 320 Springside Drive Suite 300 Akron, Ohio 44333
(330) 247‐3046 (330) 456‐3648 Fx larry.bugh@ rfirst.org
Regional Entity Eric Senkowicz Manager of Operations
Florida Reliability Coordinating Council 1408 N. Westshore Blvd Suite 1002 Tampa, Florida 33607
(813) 207‐7980 esenkowicz@ frcc.com
Regional Entity Jim Rowan Manager – Critical Infrastructure Protection
SERC Reliability Corporation 2815 Coliseum Centre Drive Suite 500 Charlotte, NC 28217
(704) 940‐8230 [email protected]

Attachment 9–NERC GMDTF Roster
GMDTF Interim Report: Affects of Geomagnetic Disturbances on the Bulk Power System–February 2012 132
A9.3 NERC GMDTF Observer Roster
Status Participant Company and Address ContactObserver Nicholas Abi‐Samra
Senior Manager, Smart Grid Services
Accenture 1596 Triton Street Carlsbad, CA, 92011
(760) 960‐3605 (760) 258‐9831 Fx nicholas.abi‐samra@ accenture.com
Observer Richard B. Andres, Sn Professor
National War College 260 5th Avenue Fort McNair, D.C. 20319
(334) 328‐5237 [email protected]
Observer Sharla Artz Director, Government Affairs
Schweitzer Engineering Laboratories, Inc. 500 Montgomery Street Suite 400 Alexandria, Virginia 22314
(703) 647‐6253 (703) 647‐6259 Fx sharla_artz@ selgs.com
Observer Chris Beck President
Electric Infrastructure Security Council 10 G Street Suite 710 Washington, D.C. 20002
(202) 248‐5025 chris.beck@ eiscouncil.org
Observer Curtis Birnbach President
Advanced Fusion Systems LLC P.O. Box C New Rochelle, New York 10804
(914) 772‐5515 cbirnbach@ hudres.com
Observer Phil Bolin Senior Advisor Power Systems Group
Mitsubishi Electric Power Products, Inc. 530 Keystone Drive Warrendale, Pennsylvania 15086
(724)‐272‐0987 phil.bolin@ meppi.com
Observer David Boteler Research Scientist
Natural Resources Canada 7 Observatory Cres Ottawa, Ontario K1A 0Y3
(613) 837‐2035 dboteler@ nrcan.gc.ca
Observer Micheal J. Botti Senior Transformer Application Engineer
Mitsubishi Electrric Power Products, Inc. 547 Keystone Drive Warrendale, Pennsylvania 15086‐7538
(724)‐778‐3130 michael.botti@ meppi.com
Observer Alenka Brown Sr. Research Fellow
National Defense University Lincoln Hall, Building 64 Room 3618 Washington, D.C. 20319
(202) 685‐6344 brownvanhoozers@ ndu.edu
Observer Patrick Brown Director of Compliance
Essential Power, LLC 99 Wood Avenue South, Suite 200 Iselin, New Jersey 08830
(732) 623‐8801 Patrick.Brown@ naeallc.com
Observer Juan Castellanos Design Engineering ‐ Power Transformers
Prolec GE Blvd. Carlos Salinas de Gortari Km. 9.25 Apodaca, N.L. Monterrey, N.L., 66600
+52 (81) 8030‐2231 juan.castellanos@ ge.com
Observer James Danburg CEO
Situationally Aware Associates, Inc. 7201 York Avenue So. Unit 1317 Edina, Minnesota 55435
(952) 500‐8770 (773) 439‐6777 Fx james.danburg@ gmail.com
Observer Karen Davis Business Manager, R&D
Schweitzer Engineering Laboratories, Inc. 2350 NE Hopkins Court Pullman, Washington 99163
(509) 334‐4915 karen_davis@ selinc.com
Observer Mohamed Diaby Shell Type Transformer Engineering
EFACEC Power Transformer
(912) 754‐5327 mohamed.diaby@ efacec.com
Observer Cathy Eade Electric Sector Specialist
DHS Office of Infrastructure Protection 245 Murray Lane Mailstop 0607 Rm 5419 Arlington, Virginia 20598‐0607
(703) 603‐5032 (703)‐603‐5098 Fx cathy.eade@ dhs.gov
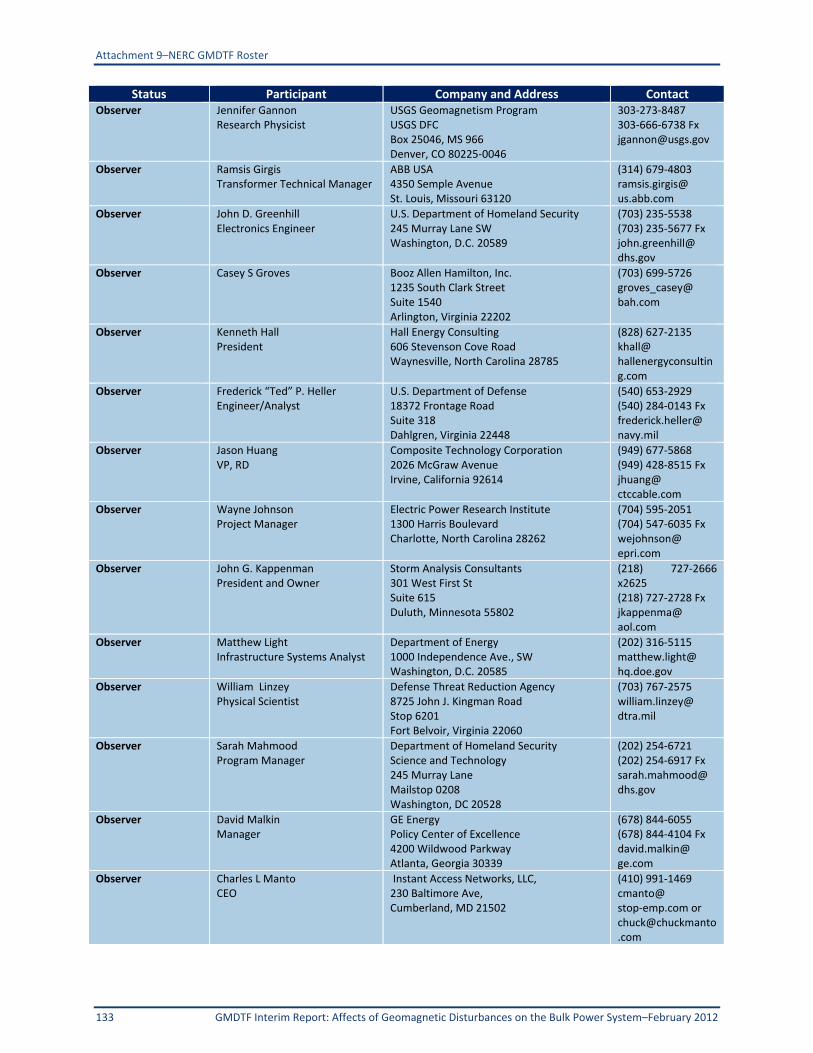
Attachment 9–NERC GMDTF Roster
133 GMDTF Interim Report: Affects of Geomagnetic Disturbances on the Bulk Power System–February 2012
Status Participant Company and Address ContactObserver Jennifer Gannon
Research Physicist USGS Geomagnetism Program USGS DFC Box 25046, MS 966 Denver, CO 80225‐0046
303‐273‐8487 303‐666‐6738 Fx [email protected]
Observer Ramsis Girgis Transformer Technical Manager
ABB USA 4350 Semple Avenue St. Louis, Missouri 63120
(314) 679‐4803 ramsis.girgis@ us.abb.com
Observer John D. Greenhill Electronics Engineer
U.S. Department of Homeland Security 245 Murray Lane SW Washington, D.C. 20589
(703) 235‐5538 (703) 235‐5677 Fx john.greenhill@ dhs.gov
Observer Casey S Groves
Booz Allen Hamilton, Inc. 1235 South Clark Street Suite 1540 Arlington, Virginia 22202
(703) 699‐5726 groves_casey@ bah.com
Observer Kenneth Hall President
Hall Energy Consulting 606 Stevenson Cove Road Waynesville, North Carolina 28785
(828) 627‐2135 khall@ hallenergyconsulting.com
Observer Frederick “Ted” P. Heller Engineer/Analyst
U.S. Department of Defense 18372 Frontage Road Suite 318 Dahlgren, Virginia 22448
(540) 653‐2929 (540) 284‐0143 Fx frederick.heller@ navy.mil
Observer Jason Huang VP, RD
Composite Technology Corporation 2026 McGraw Avenue Irvine, California 92614
(949) 677‐5868 (949) 428‐8515 Fx jhuang@ ctccable.com
Observer Wayne Johnson Project Manager
Electric Power Research Institute 1300 Harris Boulevard Charlotte, North Carolina 28262
(704) 595‐2051 (704) 547‐6035 Fx wejohnson@ epri.com
Observer John G. Kappenman President and Owner
Storm Analysis Consultants 301 West First St Suite 615 Duluth, Minnesota 55802
(218) 727‐2666 x2625 (218) 727‐2728 Fx jkappenma@ aol.com
Observer Matthew Light Infrastructure Systems Analyst
Department of Energy 1000 Independence Ave., SW Washington, D.C. 20585
(202) 316‐5115 matthew.light@ hq.doe.gov
Observer William Linzey Physical Scientist
Defense Threat Reduction Agency 8725 John J. Kingman Road Stop 6201 Fort Belvoir, Virginia 22060
(703) 767‐2575 william.linzey@ dtra.mil
Observer Sarah Mahmood Program Manager
Department of Homeland Security Science and Technology 245 Murray Lane Mailstop 0208 Washington, DC 20528
(202) 254‐6721 (202) 254‐6917 Fx sarah.mahmood@ dhs.gov
Observer David Malkin Manager
GE Energy Policy Center of Excellence 4200 Wildwood Parkway Atlanta, Georgia 30339
(678) 844‐6055 (678) 844‐4104 Fx david.malkin@ ge.com
Observer Charles L Manto CEO
Instant Access Networks, LLC, 230 Baltimore Ave, Cumberland, MD 21502
(410) 991‐1469 cmanto@ stop‐emp.com or [email protected]
Attachment 9–NERC GMDTF Roster
GMDTF Interim Report: Affects of Geomagnetic Disturbances on the Bulk Power System–February 2012 134
Status Participant Company and Address ContactObserver Jim McIver
Principal Application Engineer Siemens Corporation 5850 S. Polaris Ave, STE 1800 Las Vegas, Nevada 89118
(702) 408‐3979 James.mciver@ siemens.com
Observer Zhixin Miao Assistant Professor
University of South Florida 4202 E. Fowler Avenue ENB 118 Tampa, Florida 33502
(813) 974‐4237 (813) 699‐9188 Fx [email protected]
Observer Nathan Mitchell, P.E. Director of Electric Reliability Standards and Compliance
American Public Power Association 1875 Connecticut Avenue Suite 1200 Washington, D.C. 20009
(202) 467‐2925 (202) 467‐2918 Fx nmitchell@ appanet.org
Observer Gale Nordling President/CEO/Consultant
Emprimus 1660 S Hwy 100 Minneapolis, Minnesota 55416
9525452051 9525452216 Fx gnordling@ emprimus.com
Observer Bipin K. Patel Consultant
Technical Consulting Services 3090 Arbor Bend Birmingham, Alabama 35244
(205) 317‐2579 (205) 987‐5139 Fx [email protected]
Observer Paul Pekarek Associate
Situationally Aware Associates, Inc. 7201 York Avenue So. Unit 1317 Edina, Minnesota 55435
(952) 500‐8770 (773) 439‐6777 Fx paulpekarek@ q.com
Observer Risto J. Pirjola, PhD Research Manager / Visiting Scientist
Finnish Meteorological Institute Erik Palmenin aukio 1 503 Helsinki, FI‐00101 Geomagnetic Laboratory Natural Resources Canada 7 Observatory Crescent, Ottawa, Ontario, Canada, K1A 0Y3
+358‐9‐19294652 +358‐9‐19294604 Fx risto.pirjola@ fmi.fi (613) 837‐5138 (613) 824‐9803 Fx risto.pirjola@nrcan‐rncan.gc.ca
Observer Thomas Popik Director
Foundation for Resilient Societies 52 Technology Way Nashua, New Hampshire 03060
thomasp@ resilientsocieties.org
Observer Peter Vincent Pry, PhD President / Executive Director
EMPact America 50185 Hays Beach Road Scotland, Maryland 20687 Task Force on National and Homeland Security 50185 Hays Beach Road Scotland, Maryland 20687
(301)‐481‐4715 peterpry@ verizon.net
Observer Scott Pugh Science & Technology Directorate
Department of Homeland Security 1120 Vermont Avenue N.W. Suite 990 Washington, D.C. 20005‐3801
(202) 254‐2288 scott.pugh@ dhs.gov
Observer Antti Pulkkinen, Ph.D.
NASA Goddard Space Flight Center NASA/GSFC Code 674 Greenbelt, MD 20771 Catholic University of America 620 Michigan Ave., N.E. Washington, DC 20064
(301) 286‐0652 (301) 286‐1648 Fx antti.a.pulkkinen@ nasa.gov [email protected]

Attachment 9–NERC GMDTF Roster
135 GMDTF Interim Report: Affects of Geomagnetic Disturbances on the Bulk Power System–February 2012
Status Participant Company and Address ContactObserver Chris Rogers
Energy Forecasting Manager, Network Operations
National Grid St. Catherine's Lodge Bearwood Road Wokingham, Bershire, RG41 5BN
+44 (0) 118 396 3196 +44 (0) 118 936 3197 Fx christopher.rogers@ uk.ngrid.com
Observer Rose Safir, DM Information Technology Officer
U.S. Department of State 2201 C Street NW Washington, D.C. 20520
(301) 254‐9545 [email protected]
Observer Katie Schnider Communications Specialist
Schweitzer Engineering Laboratories, Inc. 2350 NE Hopkins Court Pullman, Washington 99163
(703) 647‐6253 katie_schnider@ selgs.com
Observer Shawn M. Simon Program Lead‐Large Power Transformers & Switchyards, Grid interface
Institute of Nuclear Power Operations 700 Galleria Parkway, SE Suite 100 Atlanta, Georgia 30339
(770)‐644‐8122 Fx [email protected]
Observer Robert V. Snow, P.E. Senior Electrical Engineer
Federal Energy Regulatory Commission 888 First Street, NE Washington, D.C. 20426
(202) 502‐6716 robert.snow@ ferc.gov
Observer Craig L. Stiegemeier Business Development & Technology Director ABB TRES
ABB Inc. ‐ North America 4350 Semple Avenue Saint Louis, Missouri 63120‐2241
(314) 679‐4568 (314) 679‐4595 Fx craig.stiegemeier@ us.abb.com
Observer Wesley Terek System Studies Engineer
Mitsubishi Electric Power Products, Inc. 530 Keystone Drive Warrendale, Pennsylvania 15086‐7537
(724)‐779‐1615 (724)‐778‐5146 Fx wesley.terek@ meppi.com
Observer Terry Volkmann Consultant
Volkmann Consulting, Inc. 14240 55th Street, NE St. Michael, Minnesota 55376
(612) 419‐0672 terrylvolkmann@ gmail.com
Observer Virginia Whitaker Manager ‐ SCADA
United Illuminating Co. P.O. Box 1564 New Haven, Connecticut 06506
(203) 926‐4468
Observer Dave Whitehead Vice President of Research and Development
Schweitzer Engineering Laboratories, Inc. 2350 NE Hopkins Court Pullman, Washington 99163
(509) 334‐8797 dave_whitehead@ selinc.com
Observer Bruce Wollenberg Professor
University of Minnesota Keller Hall 200 Union Street S.E. Minneapolis, Minnesota 55455
(612) 626‐7192 (612) 625‐4583 Fx [email protected]
Observer Xiaoyin (Mark) Yao, Ph. D. Staff Engineer
Micro‐RDC 8102 Menaul Boulevard Suite B Albuquerque, New Mexico 87110
(505) 294‐1962 ext. 24 mark.yao@ micro‐rdc.com
Observer Christopher Balch Space Scientist
National Ocean and Atmospheric Administration 325 Broadway Boulder, Colorado 80305‐3337
(303) 497‐5693 christopher.balch@ noaa.gov
Observer Dong‐Hyeon Kim Electrical Engineer
Burns & McDonnell 9400 Ward Parkway Kansas City, Missouri 64114
(816) 823‐6178 dkim@ burnsmcd.com
Observer William Murtagh Program Coordinator
National Ocean and Atmospheric Administration 325 Broadway Boulder, Colorado 80305‐3337
(303) 497‐7492 william.murtagh@ noaa.gov
Observer Frank J. Smith, P.E., CFPS, DGCP, BESA Lead Consultant
Macro Corporation 4377 County Line Road Chalfont, Pennsylvania 18914
(215) 997‐5100 ext. 41256 [email protected]

Attachment 9–NERC GMDTF Roster
GMDTF Interim Report: Affects of Geomagnetic Disturbances on the Bulk Power System–February 2012 136
Status Participant Company and Address ContactObserver Richard Waggel
Electrical Engineer Federal Energy Regulatory Commission 888 First St. NE Washington , D.C. 20426
(202) 502‐6385 richard.waggel@ ferc.gov
Observer Alberto Ramirez Orquin Associate Professor
University of Puerto Rico at Mayagüez Electrical and Computer Engineering Call Box 9000 Mayaguez, PR 00681‐9042
(787) 832‐4040 [email protected]

North American Electric Reliability Corporation Staff
137 GMDTF Interim Report: Affects of Geomagnetic Disturbances on the Bulk Power System–February 2012
North American Electric Reliability Corporation Staff
Reliability Assessment Department Name and Position Contact InformationMark G. Lauby [email protected]
Vice President and Director of Reliability Assessment and Performance Analysis 404‐446‐9723
John Moura [email protected]
Manager, Reliability Assessment 404‐446‐9731
Eric Rollison [email protected]
Engineer, Reliability Assessment 404‐446‐9738
Elliott Nethercutt [email protected]
Technical Analyst, Reliability Assessment 404‐446‐9722
Michelle Marx [email protected]
Administrative Assistant, Reliability Assessment and Performance Analysis 404‐446‐9727

3353 Peachtree Road NE Suite 600, North Tower
Atlanta, GA 30326 (404) 446-2560 | www.nerc.com