Embed Size (px)
Citation preview
A.P. Moller-Maersk, ABN AMROHolding, Air France-KLM, All Nippon Airways, British Airways, CathayPacific Airways, Central Japan Railway, China Cosco Holdings, ContinentalAirlines, Delta Airlines, Deutsche PostDHL, East Japan Railway, FedEx, Kawasaki Kisen Kaisha, Kühne & NagelIntl, Lufthansa Group, Mitsui OSK Lines, Nippon Express, Nippon YusenK a i s h a ( N Y K ) , Q a n t a s A i r w a y s , Singapore Airlines, STX Corp, TNT,Tokyu, Union Pacific, United Airlines, United Parcel Service, US Airways Group, West Japan Rai lway, andY a m a t o H o l d i n g s .
2012 Sustainability Reporting of the World’s Largest Transportation Logistics CompaniesPacific Sustainability Index Scores: A benchmarking tool for online sustainability repor ng
J.Emil Morhardt, Elgeri e Adidjaja, Taryn Akiyama, Ra k Asokan, Simone Berkovitz, Quinn Chasan, Whitney Ellen Dawson, Erin Franks, Sierra Gibson, Karina Gomez, Hilary Haskell, Nicholas Hobbs, Alan Hu, Sam Kahr, Somaiah Kambiranda, Helen Liu, Damini Marwaha, Stephanie Oehler, Katherine Recinos, Chad Redman, Megan Smith, Lucas Van Houten, Stephanie Wolfe, and Grant Yang.
Contents Topics Page Company Rankings 3 PSI Overview 4 PSI Scoring in a Nutshell 5 Environmental Intent Topics 6 Environmental Reporting Topics 7 Social Intent Topics 8 Social Reporting Topics 9 Environmental Intent Element of the PSI Scores 10 Environmental Reporting Element of the PSI Scores
11
Social Intent Element of the PSI Scores 12 Social Reporting Element of the PSI Scores 13 Environmental Intent Scores Ranking 14 Environmental Reporting Scores Ranking 15 Environmental Performance Scores Ranking 16 Social Intent Scores Ranking 17 Social Reporting Scores Ranking 18 Social Performance Scores Ranking 19 Human Rights Reporting Element 20 Performance by Country 21 Visual Cluster Analysis 22 Relationship Between PSI Scores and Financial Variables
23
Number of Explicit numerical goals Reported 26 Number of Topics Showing Performance Improvement over Previous Year Data
27
Number of Topics in which Performance was Better than Sector Average
29
Analyst’s Comments, alphabetically listed by company name
30
Appendix: PSI Questionnaire 60 Questions should be addressed to: Dr. J. Emil Morhardt, Director ([email protected]) Roberts Environmental Center Claremont McKenna College 925 N. Mills Ave. Claremont, CA 91711-5916, USA Direct line: (909) 621-8190 Elgeritte Adidjaja, Research Fellow (909) 621-8698 ([email protected]) Departmental Secretaries: (909) 621-8298
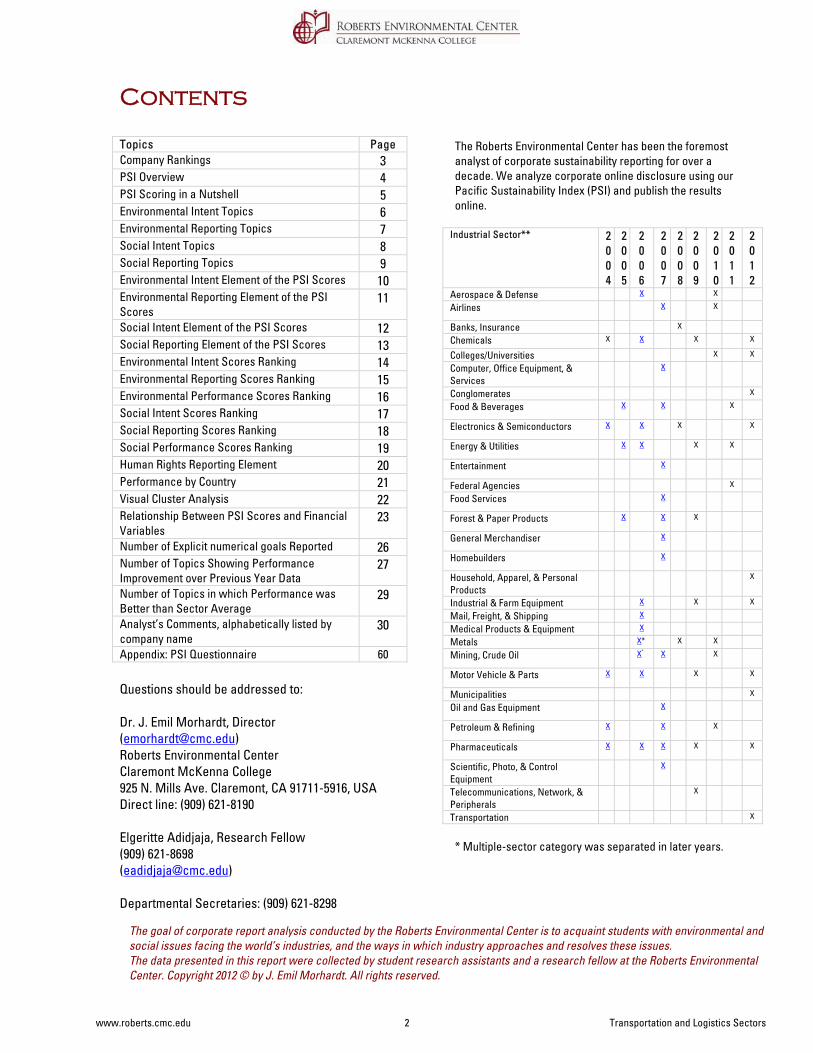
The Roberts Environmental Center has been the foremost analyst of corporate sustainability reporting for over a decade. We analyze corporate online disclosure using our Pacific Sustainability Index (PSI) and publish the results online.
Industrial Sector** 2004
2005
2006
2007
2008
2009
2010
2011
2012
Aerospace & Defense X X
Airlines X
X
Banks, Insurance X
Chemicals X X X X
Colleges/Universities X X
Computer, Office Equipment, & Services
X
Conglomerates X
Food & Beverages X
X
X
Electronics & Semiconductors X
X X X
Energy & Utilities X
X X X
Entertainment X
Federal Agencies X
Food Services X
Forest & Paper Products X
X
X
General Merchandiser X
Homebuilders X
Household, Apparel, & Personal Products
X
Industrial & Farm Equipment X X X
Mail, Freight, & Shipping X
Medical Products & Equipment X
Metals X* X X
Mining, Crude Oil X* X
X
Motor Vehicle & Parts X
X X X
Municipalities X
Oil and Gas Equipment X
Petroleum & Refining X
X
X
Pharmaceuticals X
X X
X X
Scientific, Photo, & Control Equipment
X
Telecommunications, Network, & Peripherals
X
Transportation X
* Multiple-sector category was separated in later years.
The goal of corporate report analysis conducted by the Roberts Environmental Center is to acquaint students with environmental and social issues facing the world’s industries, and the ways in which industry approaches and resolves these issues. The data presented in this report were collected by student research assistants and a research fellow at the Roberts Environmental Center. Copyright 2012 © by J. Emil Morhardt. All rights reserved.
www.roberts.cmc.edu 2 Transportation and Logistics Sectors
Corporate Environmental and Sustainability Reporting
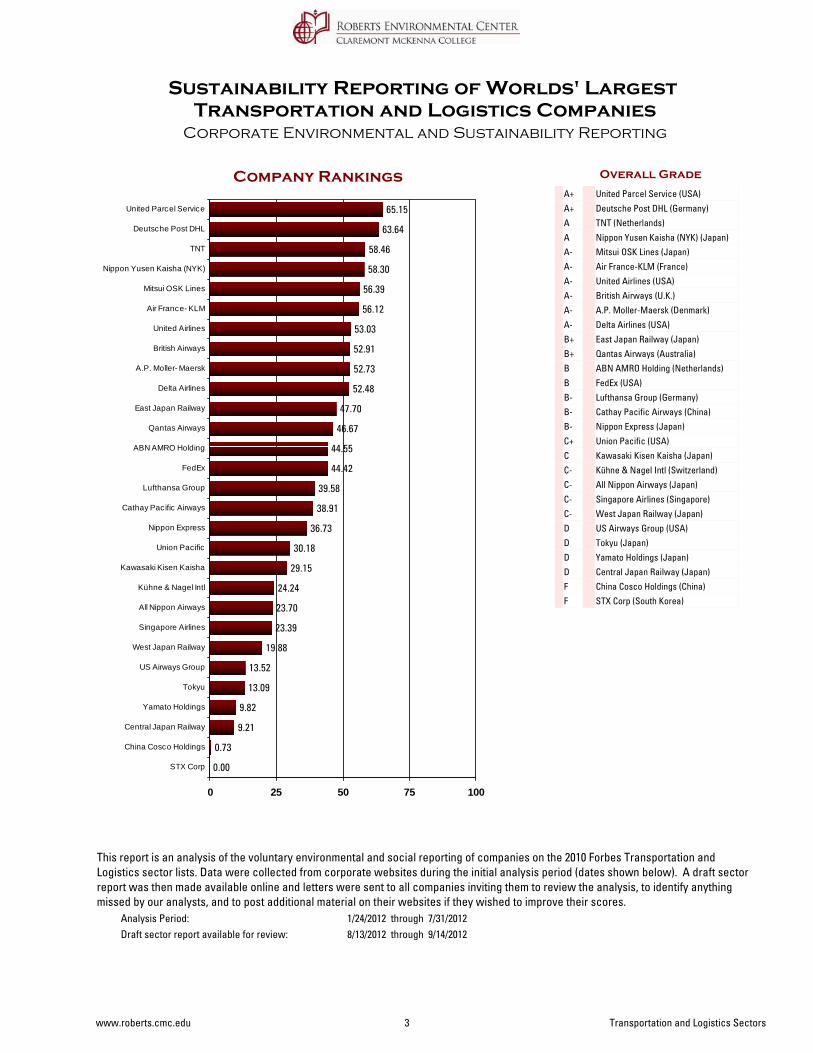
Overall GradeCompany Rankings
Sustainability Reporting of Worlds' Largest Transportation and Logistics Companies
0.00
0.73
9.21
9.82
13.09
13.52
19.88
23.39
23.70
24.24
29.15
30.18
36.73
38.91
39.58
44.42
44.55
46.67
47.70
52.48
52.73
52.91
53.03
56.12
56.39
58.30
58.46
63.64
65.15
0 25 50 75 100
STX Corp
China Cosco Holdings
Central Japan Railway
Yamato Holdings
Tokyu
US Airways Group
West Japan Railway
Singapore Airlines
All Nippon Airways
Kühne & Nagel Intl
Kawasaki Kisen Kaisha
Union Pacific
Nippon Express
Cathay Pacific Airways
Lufthansa Group
FedEx
ABN AMRO Holding
Qantas Airways
East Japan Railway
Delta Airlines
A.P. Moller- Maersk
British Airways
United Airlines
Air France- KLM
Mitsui OSK Lines
Nippon Yusen Kaisha (NYK)
TNT
Deutsche Post DHL
United Parcel Service
United Parcel Service (USA)A+
Deutsche Post DHL (Germany)A+
TNT (Netherlands)A
Nippon Yusen Kaisha (NYK) (Japan)A
Mitsui OSK Lines (Japan)A-
Air France-KLM (France)A-
United Airlines (USA)A-
British Airways (U.K.)A-
A.P. Moller-Maersk (Denmark)A-
Delta Airlines (USA)A-
East Japan Railway (Japan)B+
Qantas Airways (Australia)B+
ABN AMRO Holding (Netherlands)B
FedEx (USA)B
Lufthansa Group (Germany)B-
Cathay Pacific Airways (China)B-
Nippon Express (Japan)B-
Union Pacific (USA)C+
Kawasaki Kisen Kaisha (Japan)C
Kühne & Nagel Intl (Switzerland)C-
All Nippon Airways (Japan)C-
Singapore Airlines (Singapore)C-
West Japan Railway (Japan)C-
US Airways Group (USA)D
Tokyu (Japan)D
Yamato Holdings (Japan)D
Central Japan Railway (Japan)D
China Cosco Holdings (China)F
STX Corp (South Korea)F
This report is an analysis of the voluntary environmental and social reporting of companies on the 2010 Forbes Transportation and Logistics sector lists. Data were collected from corporate websites during the initial analysis period (dates shown below). A draft sector report was then made available online and letters were sent to all companies inviting them to review the analysis, to identify anything missed by our analysts, and to post additional material on their websites if they wished to improve their scores.
1/24/2012 7/31/20128/13/2012 9/14/2012
throughthrough
Analysis Period:Draft sector report available for review:
www.roberts.cmc.edu 3 Transportation and Logistics Sectors
The Pacific Sustainability Index (PSI) Overview
the PSI Scoring System The Pacific Sustainability Index (PSI) uses two systematic questionnaires to analyze the quality of the sustainability reporting—a base questionnaire for reports across sectors and a sector-specific questionnaire for companies within the same sector. The selection of questions is based on, and periodically adjusted to, the most frequently-mentioned topics in over 1,900 corporate sustainability reports analyzed from 2002 through 2009 at the Roberts Environmental Center. The Roberts Environmental Center The Roberts Environmental Center is an environmental research institute at Claremont McKenna College (CMC). Its mission is to provide students of all the Claremont Colleges with a comprehensive and realistic understanding of today’s environmental issues and the ways in which they are being and can be resolved--beyond the confines of traditional academic disciplines and curriculum--and to identify, publicize, and encourage policies and practices that achieve economic and social goals in the most environmentally benign and protective manner. The Center is partially funded by an endowment from George R. Roberts (Founding Partner of Kohlberg Kravis Roberts & Co. and CMC alumnus), other grants and gifts, and is staffed by faculty and students from the Claremont Colleges. Methodology Student analysts download relevant English language web pages from the main corporate website for analysis. Our scoring excludes data independently stored outside the main corporate website or available only in hard copy. When a corporate subsidiary has its own sustainability reporting, partial credit is given to the parent company when a direct link is provided in the main corporate website. We archive these web pages as PDF files for future reference. Our analysts use a keyword search function to search reporting of specific topics, they fill out a PSI scoring sheet (http://www.roberts.cmc.edu/PSI/scoringsheet.asp), and track the coverage and depths of different sustainability issues mentioned in all online materials. Scores and Ranks When they are finished scoring, the analysts enter their scoring results into the PSI database. The PSI database calculates scores and publishes them on the Center’s website. This sector report provides an in-depth analysis on sustainability reporting of the largest companies of the sector, as listed in the latest 2010 Forbes lists. Prior to publishing our sector report, we notify companies analyzed and encourage them to provide feedback and additional new online materials, which often improve their scores. What do the scores mean? We normalize all the scores to the potential maximum score. Scores of subsets of the overall score are also normalized to their potential maxima. The letter grades (A+, A, A-, B+, etc.), however, are normalized to the highest scoring company analyzed in the report. Grades of individual companies in the report might be different from grades posted online on the Roberts Environmental Center's website, since the normalization of scores of an individual company online is not limited to the companies analyzed in the sector report, but also includes other companies of the same sector irrespective of the year of analysis. Companies with scores in the highest 4% get an A+ and any in the bottom 4% get an F. We assign these by dividing the maximum PSI score obtained in the sector into 12 equal parts then rounding fractional score up or down. This means that A+ and F are under-represented compared to the other grades. The same technique applies to the separate categories of environmental and social scores. Thus, we grade on the curve. We assume that the highest score obtained in the sector and any scores near it represent the state-of-the-art for that sector and deserve an A+.
www.roberts.cmc.edu 4 Transportation and Logistics Sectors
PSI Scoring in a Nutshell
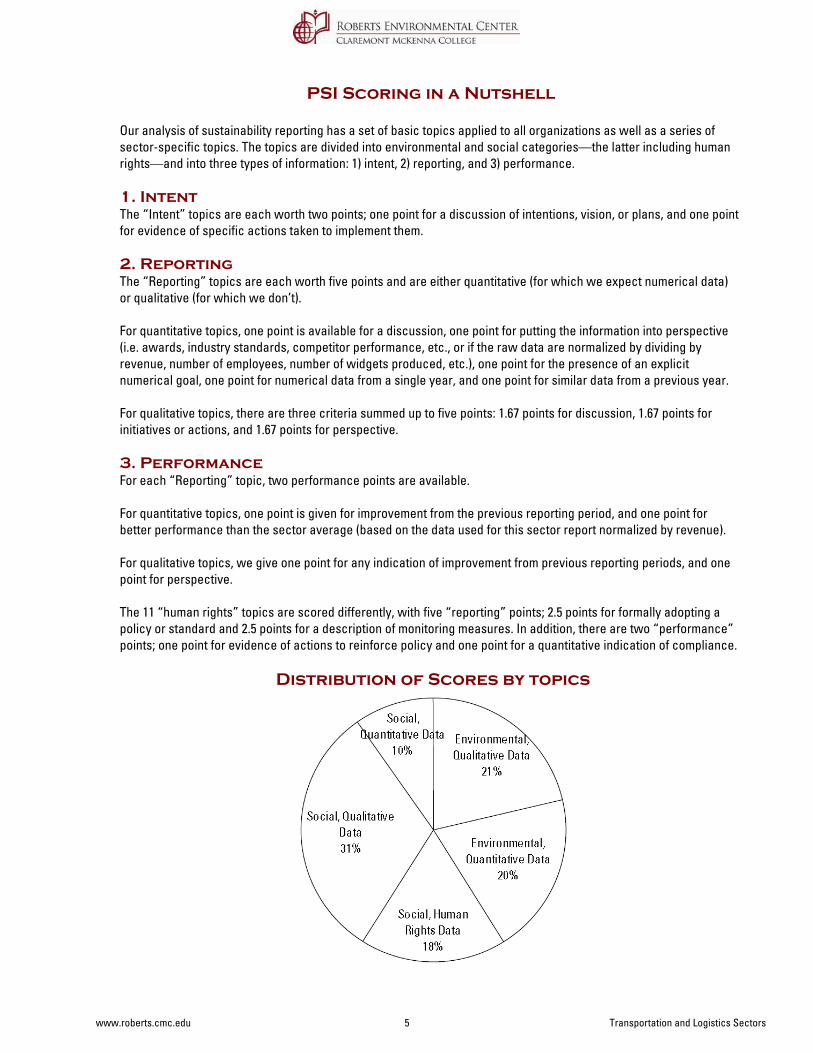
Our analysis of sustainability reporting has a set of basic topics applied to all organizations as well as a series of sector-specific topics. The topics are divided into environmental and social categories—the latter including human rights—and into three types of information: 1) intent, 2) reporting, and 3) performance. 1. Intent The “Intent” topics are each worth two points; one point for a discussion of intentions, vision, or plans, and one point for evidence of specific actions taken to implement them. 2. Reporting The “Reporting” topics are each worth five points and are either quantitative (for which we expect numerical data) or qualitative (for which we don’t). For quantitative topics, one point is available for a discussion, one point for putting the information into perspective (i.e. awards, industry standards, competitor performance, etc., or if the raw data are normalized by dividing by revenue, number of employees, number of widgets produced, etc.), one point for the presence of an explicit numerical goal, one point for numerical data from a single year, and one point for similar data from a previous year. For qualitative topics, there are three criteria summed up to five points: 1.67 points for discussion, 1.67 points for initiatives or actions, and 1.67 points for perspective. 3. Performance For each “Reporting” topic, two performance points are available. For quantitative topics, one point is given for improvement from the previous reporting period, and one point for better performance than the sector average (based on the data used for this sector report normalized by revenue). For qualitative topics, we give one point for any indication of improvement from previous reporting periods, and one point for perspective. The 11 “human rights” topics are scored differently, with five “reporting” points; 2.5 points for formally adopting a policy or standard and 2.5 points for a description of monitoring measures. In addition, there are two “performance” points; one point for evidence of actions to reinforce policy and one point for a quantitative indication of compliance.
Distribution of Scores by topics
www.roberts.cmc.edu 5 Transportation and Logistics Sectors
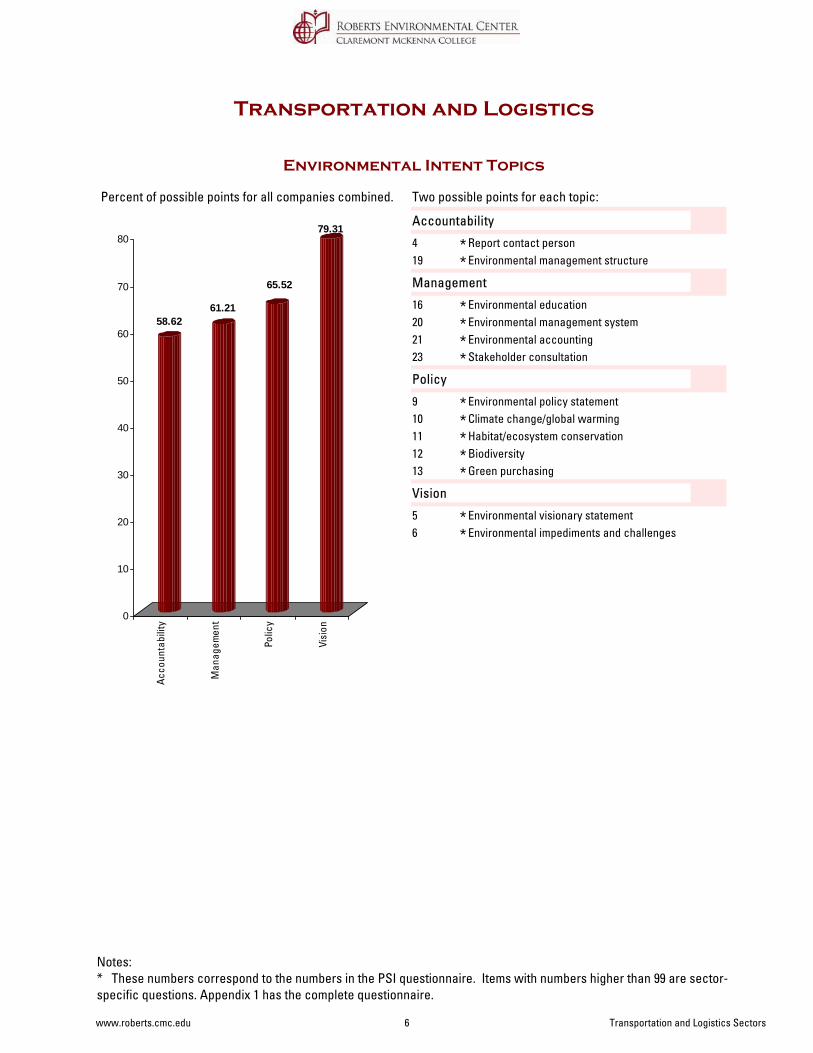
Percent of possible points for all companies combined.
Environmental Intent Topics
Transportation and Logistics
58.6261.21
65.52
79.31
0
10
20
30
40
50
60
70
80
Acco
unta
bilit
y
Man
agem
ent
Polic
y
Visi
on
Two possible points for each topic:
Accountability
Report contact person4 *Environmental management structure19 *
Management
Environmental education16 *Environmental management system20 *Environmental accounting21 *Stakeholder consultation23 *
Policy
Environmental policy statement9 *Climate change/global warming10 *Habitat/ecosystem conservation11 *Biodiversity12 *Green purchasing13 *
Vision
Environmental visionary statement5 *Environmental impediments and challenges6 *
Notes: * These numbers correspond to the numbers in the PSI questionnaire. Items with numbers higher than 99 are sector-specific questions. Appendix 1 has the complete questionnaire.
www.roberts.cmc.edu 6 Transportation and Logistics Sectors
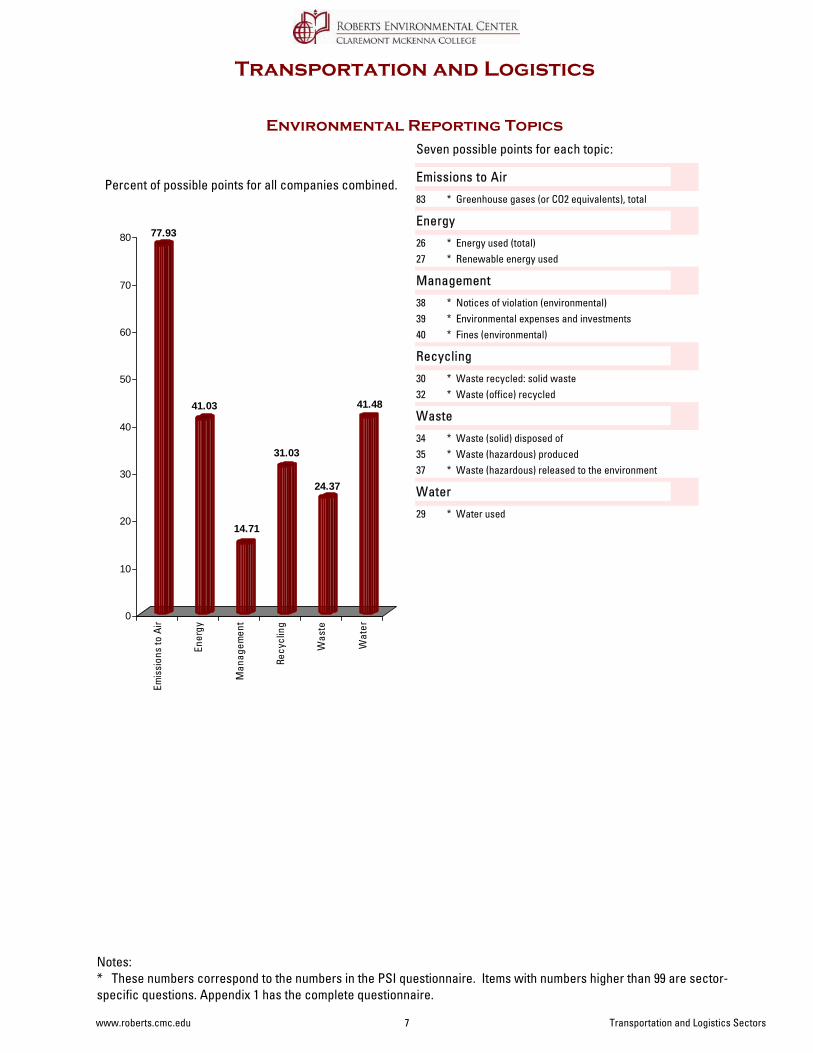
Percent of possible points for all companies combined.
Environmental Reporting Topics
Transportation and Logistics
77.93
41.03
14.71
31.03
24.37
41.48
0
10
20
30
40
50
60
70
80
Emis
sion
s to
Air
Ener
gy
Man
agem
ent
Recy
clin
g
Was
te
Wat
er
Seven possible points for each topic:
Emissions to Air
Greenhouse gases (or CO2 equivalents), total83 *
Energy
Energy used (total)26 *Renewable energy used27 *
Management
Notices of violation (environmental)38 *Environmental expenses and investments39 *Fines (environmental)40 *
Recycling
Waste recycled: solid waste30 *Waste (office) recycled32 *
Waste
Waste (solid) disposed of34 *Waste (hazardous) produced35 *Waste (hazardous) released to the environment37 *
Water
Water used29 *
Notes: * These numbers correspond to the numbers in the PSI questionnaire. Items with numbers higher than 99 are sector-specific questions. Appendix 1 has the complete questionnaire.
www.roberts.cmc.edu 7 Transportation and Logistics Sectors
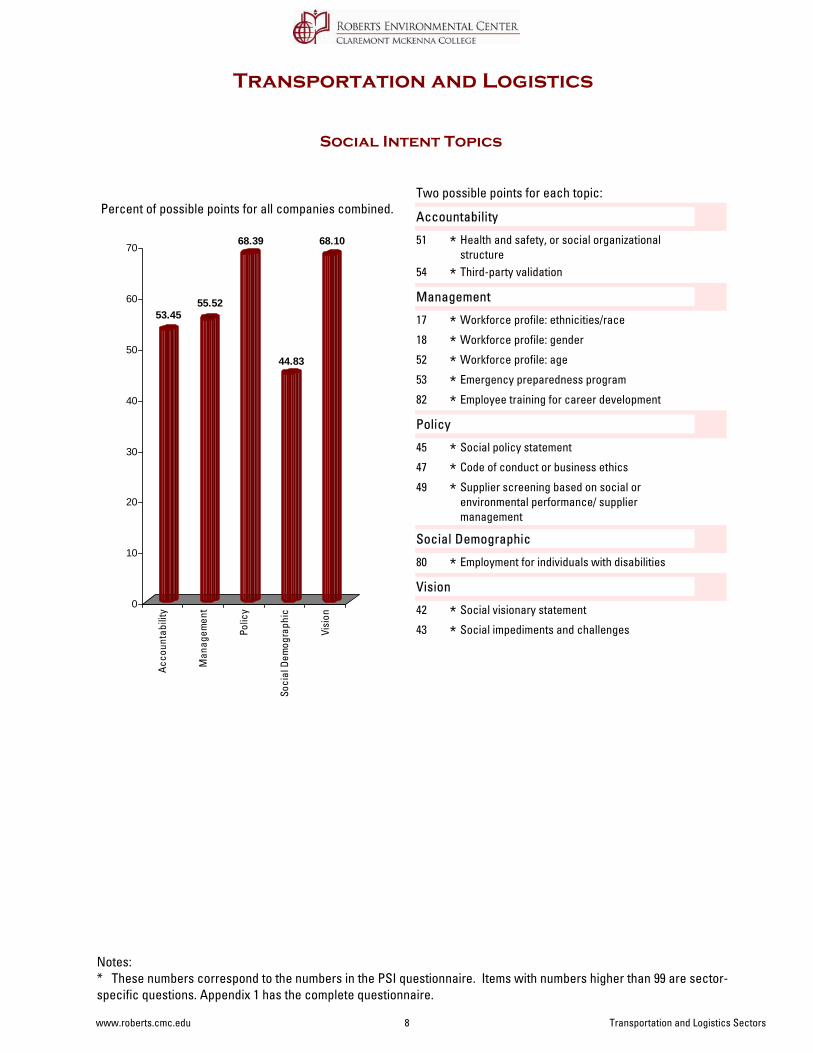
Percent of possible points for all companies combined.
Social Intent Topics
Transportation and Logistics
53.4555.52
68.39
44.83
68.10
0
10
20
30
40
50
60
70
Acco
unta
bilit
y
Man
agem
ent
Polic
y
Soci
al D
emog
raph
ic
Visi
on
Two possible points for each topic:
Accountability
Health and safety, or social organizational structure
51 *
Third-party validation54 *Management
Workforce profile: ethnicities/race17 *Workforce profile: gender18 *Workforce profile: age52 *Emergency preparedness program53 *Employee training for career development82 *
Policy
Social policy statement 45 *Code of conduct or business ethics47 *Supplier screening based on social or environmental performance/ supplier management
49 *
Social Demographic
Employment for individuals with disabilities80 *Vision
Social visionary statement 42 *Social impediments and challenges43 *
Notes: * These numbers correspond to the numbers in the PSI questionnaire. Items with numbers higher than 99 are sector-specific questions. Appendix 1 has the complete questionnaire.
www.roberts.cmc.edu 8 Transportation and Logistics Sectors
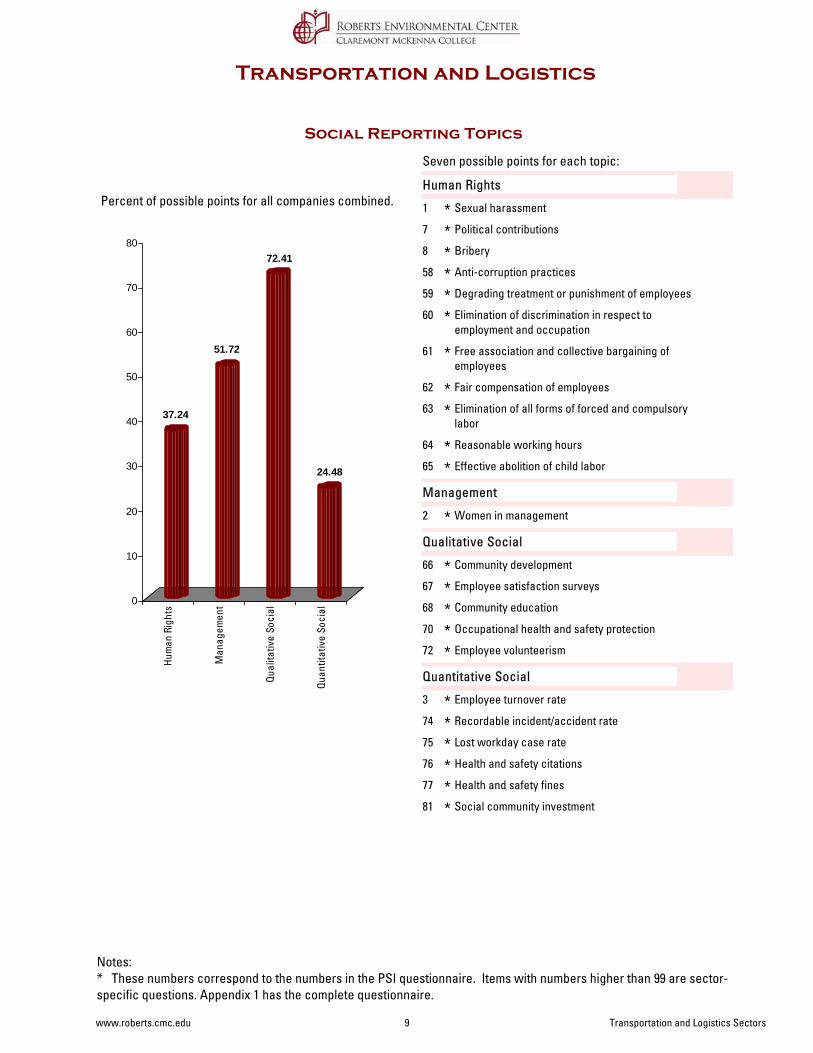
Percent of possible points for all companies combined.
Social Reporting Topics
Transportation and Logistics
37.24
51.72
72.41
24.48
0
10
20
30
40
50
60
70
80
Hum
an R
ight
s
Man
agem
ent
Qual
itativ
e So
cial
Quan
titat
ive
Soci
al
Seven possible points for each topic:
Human Rights
Sexual harassment1 *Political contributions7 *Bribery8 *Anti-corruption practices58 *Degrading treatment or punishment of employees59 *Elimination of discrimination in respect to employment and occupation
60 *
Free association and collective bargaining of employees
61 *
Fair compensation of employees62 *Elimination of all forms of forced and compulsory labor
63 *
Reasonable working hours64 *Effective abolition of child labor65 *
Management
Women in management2 *Qualitative Social
Community development66 *Employee satisfaction surveys67 *Community education68 *Occupational health and safety protection70 *Employee volunteerism72 *
Quantitative Social
Employee turnover rate3 *Recordable incident/accident rate74 *Lost workday case rate75 *Health and safety citations76 *Health and safety fines77 *Social community investment81 *
Notes: * These numbers correspond to the numbers in the PSI questionnaire. Items with numbers higher than 99 are sector-specific questions. Appendix 1 has the complete questionnaire.
www.roberts.cmc.edu 9 Transportation and Logistics Sectors
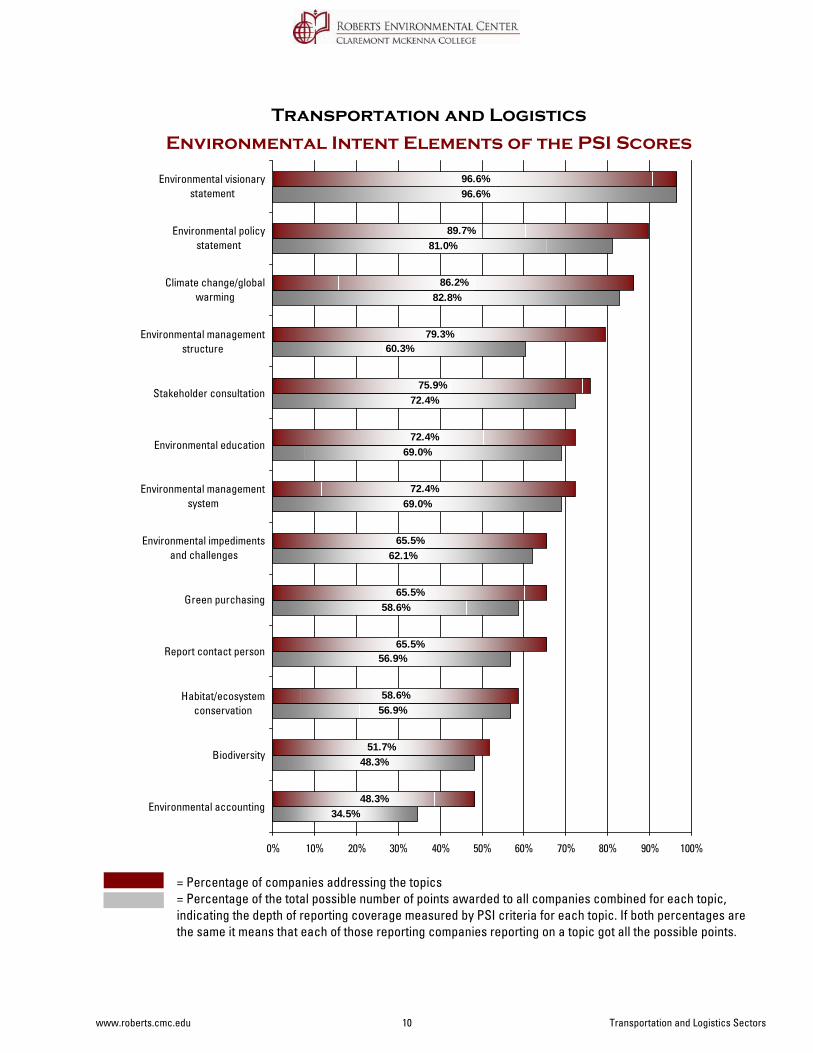
Environmental Intent Elements of the PSI Scores
= Percentage of companies addressing the topics= Percentage of the total possible number of points awarded to all companies combined for each topic, indicating the depth of reporting coverage measured by PSI criteria for each topic. If both percentages are the same it means that each of those reporting companies reporting on a topic got all the possible points.
Transportation and Logistics
34.5%
48.3%
56.9%
56.9%
58.6%
62.1%
69.0%
69.0%
72.4%
60.3%
82.8%
81.0%
96.6%
48.3%
51.7%
58.6%
65.5%
65.5%
65.5%
72.4%
72.4%
75.9%
79.3%
86.2%
89.7%
96.6%
0% 10% 20% 30% 40% 50% 60% 70% 80% 90% 100%
Environmental accounting
Biodiversity
Habitat/ecosystemconservation
Report contact person
Green purchasing
Environmental impedimentsand challenges
Environmental managementsystem
Environmental education
Stakeholder consultation
Environmental managementstructure
Climate change/globalwarming
Environmental policystatement
Environmental visionarystatement
www.roberts.cmc.edu 10 Transportation and Logistics Sectors
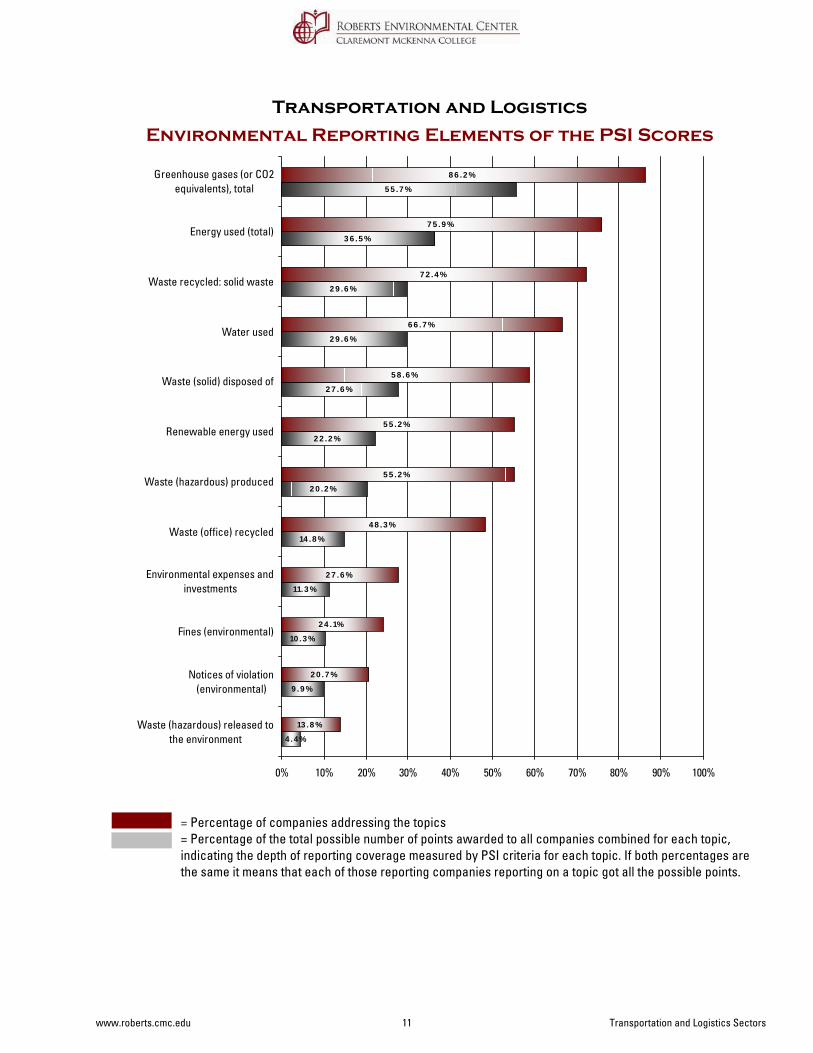
Environmental Reporting Elements of the PSI Scores
Transportation and Logistics
= Percentage of companies addressing the topics= Percentage of the total possible number of points awarded to all companies combined for each topic, indicating the depth of reporting coverage measured by PSI criteria for each topic. If both percentages are the same it means that each of those reporting companies reporting on a topic got all the possible points.
4 .4 %
9 .9 %
10 .3 %
11.3 %
14 .8 %
2 0 .2 %
2 2 .2 %
2 7 .6 %
2 9 .6 %
2 9 .6 %
3 6 .5 %
5 5 .7 %
13 .8 %
2 0 .7 %
2 4 .1%
2 7 .6 %
4 8 .3 %
5 5 .2 %
5 5 .2 %
5 8 .6 %
6 6 .7 %
7 2 .4 %
7 5 .9 %
8 6 .2 %
0% 10% 20% 30% 40% 50% 60% 70% 80% 90% 100%
Waste (hazardous) released tothe environment
Notices of violation(environmental)
Fines (environmental)
Environmental expenses andinvestments
Waste (office) recycled
Waste (hazardous) produced
Renewable energy used
Waste (solid) disposed of
Water used
Waste recycled: solid waste
Energy used (total)
Greenhouse gases (or CO2equivalents), total
www.roberts.cmc.edu 11 Transportation and Logistics Sectors
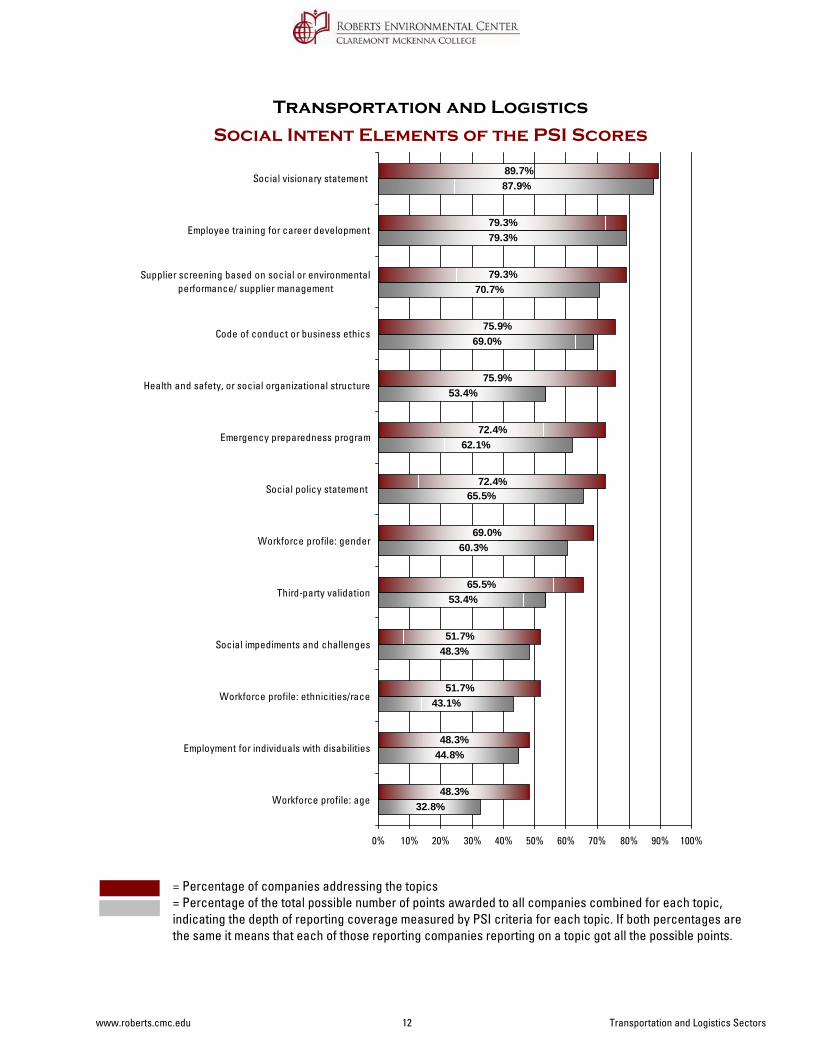
Social Intent Elements of the PSI Scores
Transportation and Logistics
= Percentage of companies addressing the topics= Percentage of the total possible number of points awarded to all companies combined for each topic, indicating the depth of reporting coverage measured by PSI criteria for each topic. If both percentages are the same it means that each of those reporting companies reporting on a topic got all the possible points.
32.8%
44.8%
43.1%
48.3%
53.4%
60.3%
65.5%
62.1%
53.4%
69.0%
70.7%
79.3%
87.9%
48.3%
48.3%
51.7%
51.7%
65.5%
69.0%
72.4%
72.4%
75.9%
75.9%
79.3%
79.3%
89.7%
0% 10% 20% 30% 40% 50% 60% 70% 80% 90% 100%
Workforce profile: age
Employment for individuals with disabilities
Workforce profile: ethnicities/race
Social impediments and challenges
Third-party validation
Workforce profile: gender
Social policy statement
Emergency preparedness program
Health and safety, or social organizational structure
Code of conduct or business ethics
Supplier screening based on social or environmentalperformance/ supplier management
Employee training for career development
Social visionary statement
www.roberts.cmc.edu 12 Transportation and Logistics Sectors
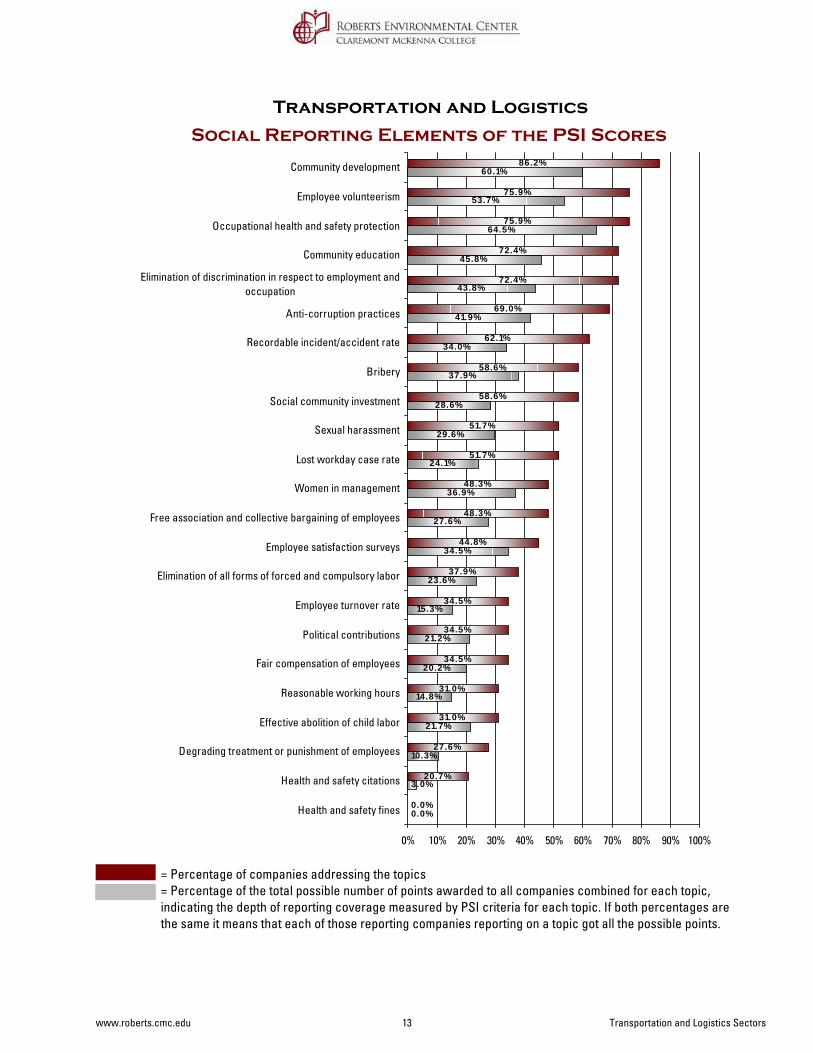
Social Reporting Elements of the PSI Scores
Transportation and Logistics
= Percentage of companies addressing the topics= Percentage of the total possible number of points awarded to all companies combined for each topic, indicating the depth of reporting coverage measured by PSI criteria for each topic. If both percentages are the same it means that each of those reporting companies reporting on a topic got all the possible points.
0.0%
3.0%
10.3%
21.7%
14.8%
20.2%
21.2%
15.3%
23.6%
34.5%
27.6%
36.9%
24.1%
29.6%
28.6%
37.9%
34.0%
41.9%
43.8%
45.8%
64.5%
53.7%
60.1%
0.0%
20.7%
27.6%
31.0%
31.0%
34.5%
34.5%
34.5%
37.9%
44.8%
48.3%
48.3%
51.7%
51.7%
58.6%
58.6%
62.1%
69.0%
72.4%
72.4%
75.9%
75.9%
86.2%
0% 10% 20% 30% 40% 50% 60% 70% 80% 90% 100%
Health and safety fines
Health and safety citations
Degrading treatment or punishment of employees
Effective abolition of child labor
Reasonable working hours
Fair compensation of employees
Political contributions
Employee turnover rate
Elimination of all forms of forced and compulsory labor
Employee satisfaction surveys
Free association and collective bargaining of employees
Women in management
Lost workday case rate
Sexual harassment
Social community investment
Bribery
Recordable incident/accident rate
Anti-corruption practices
Elimination of discrimination in respect to employment andoccupation
Community education
Occupational health and safety protection
Employee volunteerism
Community development
www.roberts.cmc.edu 13 Transportation and Logistics Sectors
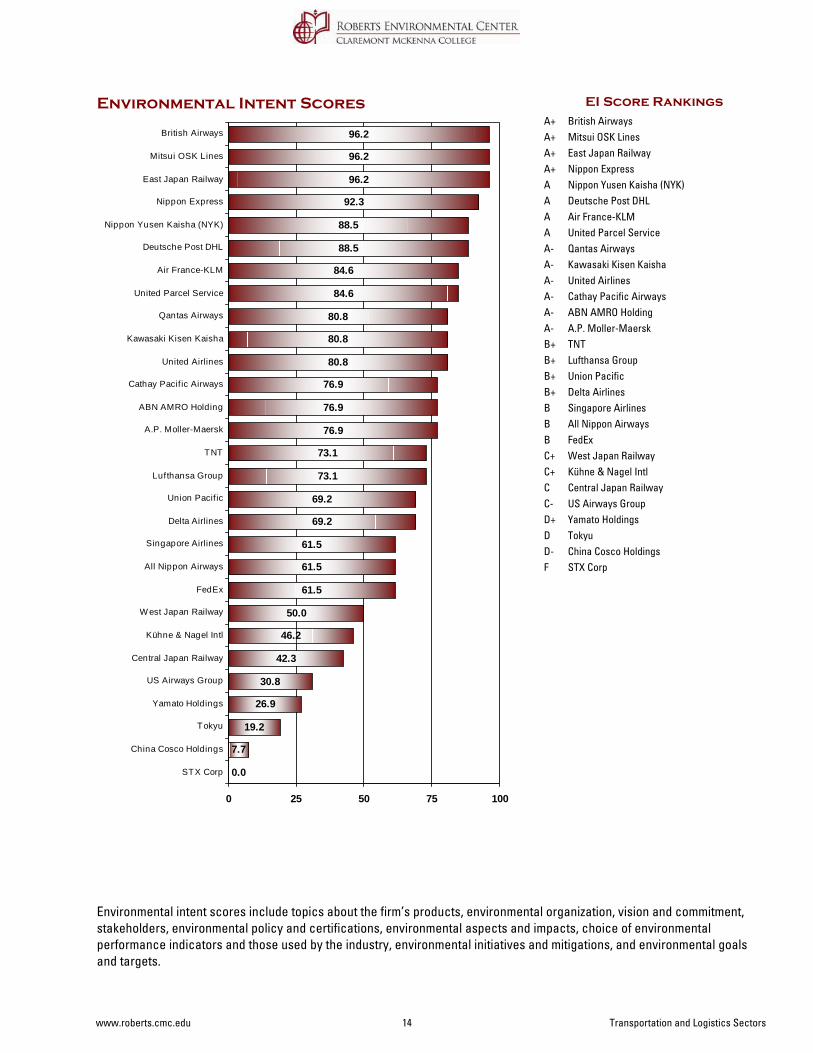
Environmental Intent Scores
Environmental intent scores include topics about the firm’s products, environmental organization, vision and commitment, stakeholders, environmental policy and certifications, environmental aspects and impacts, choice of environmental performance indicators and those used by the industry, environmental initiatives and mitigations, and environmental goals and targets.
EI Score RankingsBritish AirwaysA+Mitsui OSK LinesA+East Japan RailwayA+Nippon ExpressA+Nippon Yusen Kaisha (NYK)ADeutsche Post DHLAAir France-KLMAUnited Parcel ServiceAQantas AirwaysA-Kawasaki Kisen KaishaA-United AirlinesA-Cathay Pacific AirwaysA-ABN AMRO HoldingA-A.P. Moller-MaerskA-TNTB+Lufthansa GroupB+Union PacificB+Delta AirlinesB+Singapore AirlinesBAll Nippon AirwaysBFedExBWest Japan RailwayC+Kühne & Nagel IntlC+Central Japan RailwayCUS Airways GroupC-Yamato HoldingsD+TokyuDChina Cosco HoldingsD-STX CorpF
0.0
7.7
19.2
26.9
30.8
42.3
46.2
50.0
61.5
61.5
61.5
69.2
69.2
73.1
73.1
76.9
76.9
76.9
80.8
80.8
80.8
84.6
84.6
88.5
88.5
92.3
96.2
96.2
96.2
0 25 50 75 100
STX Corp
China Cosco Holdings
Tokyu
Yamato Holdings
US Airways Group
Central Japan Railway
Kühne & Nagel Intl
W est Japan Railway
FedEx
All Nippon Airways
Singapore Airlines
Delta Airlines
Union Pacif ic
Lufthansa Group
TNT
A.P. Moller-Maersk
ABN AMRO Holding
Cathay Pacif ic Airways
United Airlines
Kawasaki Kisen Kaisha
Qantas Airways
United Parcel Service
Air France-KLM
Deutsche Post DHL
Nippon Yusen Kaisha (NYK)
Nippon Express
East Japan Railway
Mitsui OSK Lines
British Airways
www.roberts.cmc.edu 14 Transportation and Logistics Sectors
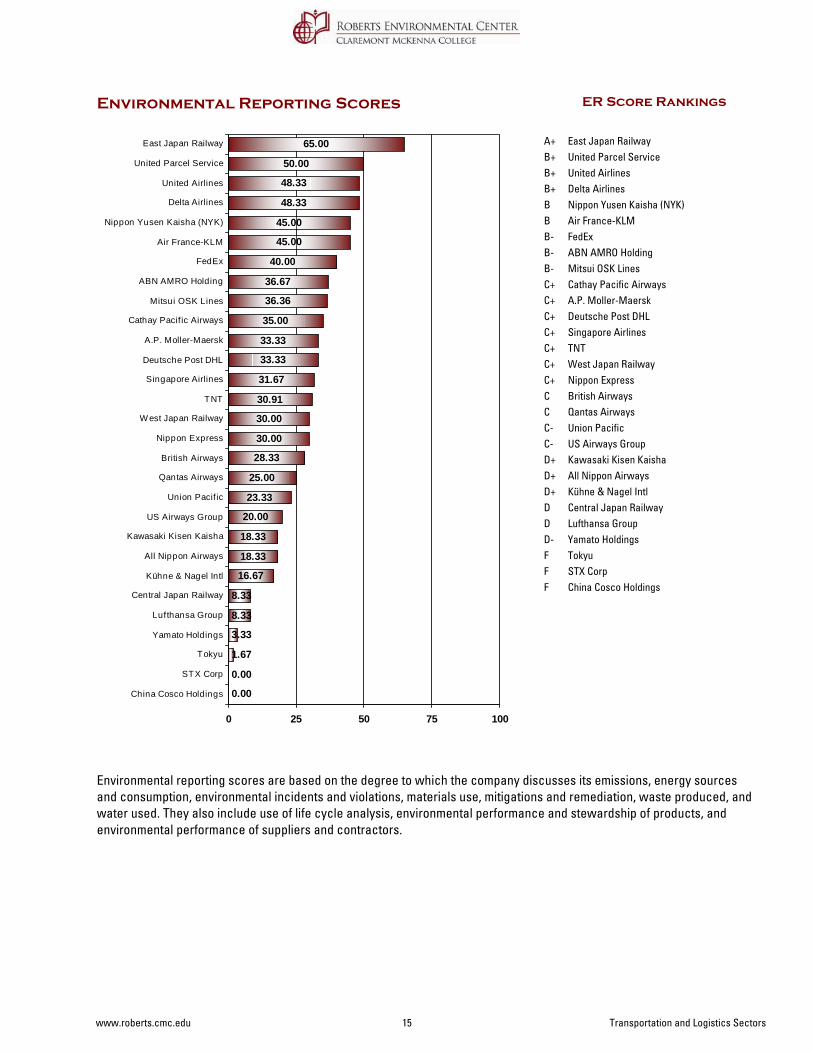
Environmental Reporting Scores
Environmental reporting scores are based on the degree to which the company discusses its emissions, energy sources and consumption, environmental incidents and violations, materials use, mitigations and remediation, waste produced, and water used. They also include use of life cycle analysis, environmental performance and stewardship of products, and environmental performance of suppliers and contractors.
ER Score Rankings
East Japan RailwayA+United Parcel ServiceB+United AirlinesB+Delta AirlinesB+Nippon Yusen Kaisha (NYK)BAir France-KLMBFedExB-ABN AMRO HoldingB-Mitsui OSK LinesB-Cathay Pacific AirwaysC+A.P. Moller-MaerskC+Deutsche Post DHLC+Singapore AirlinesC+TNTC+West Japan RailwayC+Nippon ExpressC+British AirwaysCQantas AirwaysCUnion PacificC-US Airways GroupC-Kawasaki Kisen KaishaD+All Nippon AirwaysD+Kühne & Nagel IntlD+Central Japan RailwayDLufthansa GroupDYamato HoldingsD-TokyuFSTX CorpFChina Cosco HoldingsF
0.00
0.00
1.67
3.33
8.33
8.33
16.67
18.33
18.33
20.00
23.33
25.00
28.33
30.00
30.00
30.91
31.67
33.33
33.33
35.00
36.36
36.67
40.00
45.00
45.00
48.33
48.33
50.00
65.00
0 25 50 75 100
China Cosco Holdings
STX Corp
Tokyu
Yamato Holdings
Lufthansa Group
Central Japan Railway
Kühne & Nagel Intl
All Nippon Airways
Kawasaki Kisen Kaisha
US Airways Group
Union Pacif ic
Qantas Airways
British Airways
Nippon Express
W est Japan Railway
TNT
Singapore Airlines
Deutsche Post DHL
A.P. Moller-Maersk
Cathay Pacif ic Airways
Mitsui OSK Lines
ABN AMRO Holding
FedEx
Air France-KLM
Nippon Yusen Kaisha (NYK)
Delta Airlines
United Airlines
United Parcel Service
East Japan Railway
www.roberts.cmc.edu 15 Transportation and Logistics Sectors
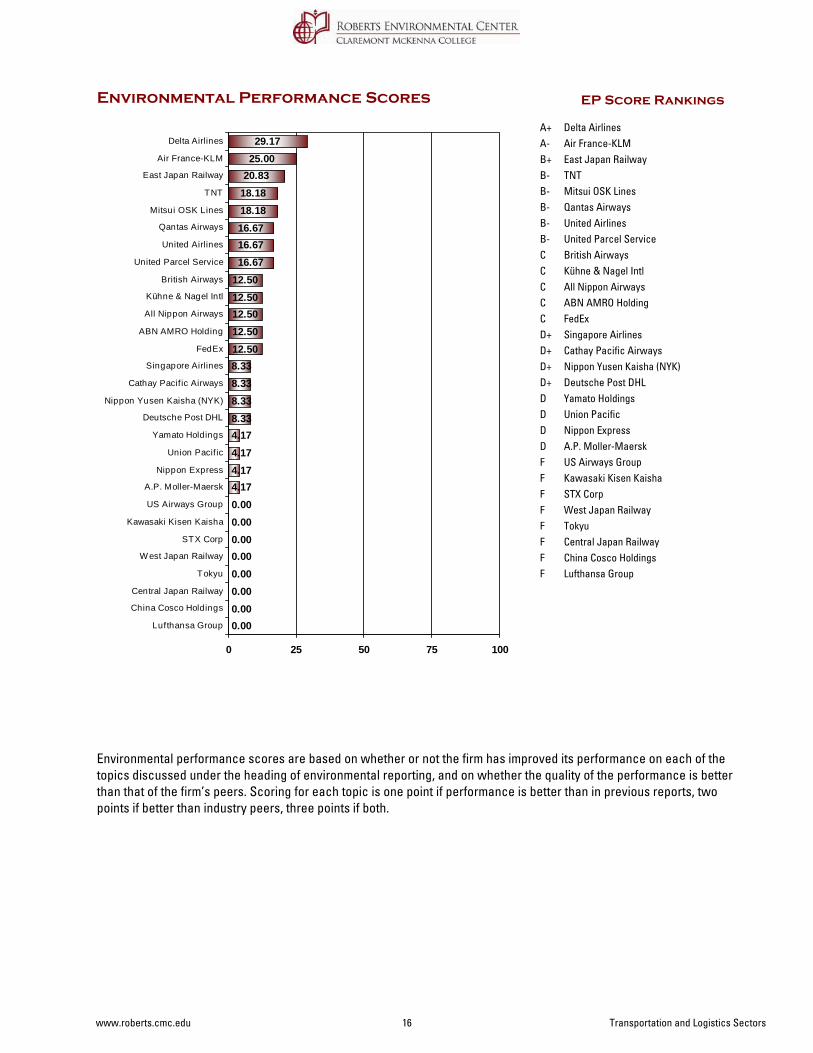
Environmental Performance Scores
Environmental performance scores are based on whether or not the firm has improved its performance on each of the topics discussed under the heading of environmental reporting, and on whether the quality of the performance is better than that of the firm’s peers. Scoring for each topic is one point if performance is better than in previous reports, two points if better than industry peers, three points if both.
EP Score Rankings
Delta AirlinesA+Air France-KLMA-East Japan RailwayB+TNTB-Mitsui OSK LinesB-Qantas AirwaysB-United AirlinesB-United Parcel ServiceB-British AirwaysCKühne & Nagel IntlCAll Nippon AirwaysCABN AMRO HoldingCFedExCSingapore AirlinesD+Cathay Pacific AirwaysD+Nippon Yusen Kaisha (NYK)D+Deutsche Post DHLD+Yamato HoldingsDUnion PacificDNippon ExpressDA.P. Moller-MaerskDUS Airways GroupFKawasaki Kisen KaishaFSTX CorpFWest Japan RailwayFTokyuFCentral Japan RailwayFChina Cosco HoldingsFLufthansa GroupF
0.000.000.000.000.000.000.000.004.174.174.174.178.338.338.338.3312.5012.5012.5012.5012.5016.6716.6716.6718.1818.1820.8325.0029.17
0 25 50 75 100
Lufthansa Group
China Cosco Holdings
Central Japan Railway
Tokyu
W est Japan Railway
STX Corp
Kawasaki Kisen Kaisha
US Airways Group
A.P. Moller-Maersk
Nippon Express
Union Pacif ic
Yamato Holdings
Deutsche Post DHL
Nippon Yusen Kaisha (NYK)
Cathay Pacif ic Airways
Singapore Airlines
FedEx
ABN AMRO Holding
All Nippon Airways
Kühne & Nagel Intl
British Airways
United Parcel Service
United Airlines
Qantas Airways
Mitsui OSK Lines
TNT
East Japan Railway
Air France-KLM
Delta Airlines
www.roberts.cmc.edu 16 Transportation and Logistics Sectors
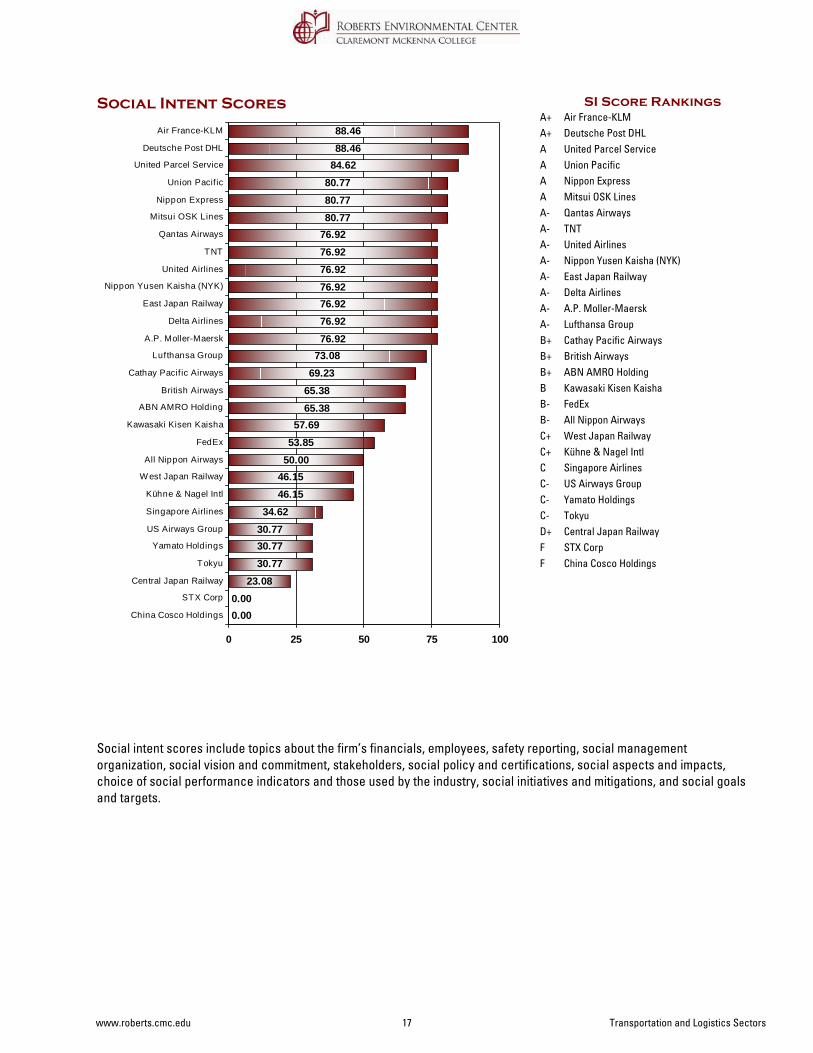
Social Intent Scores
Social intent scores include topics about the firm’s financials, employees, safety reporting, social management organization, social vision and commitment, stakeholders, social policy and certifications, social aspects and impacts, choice of social performance indicators and those used by the industry, social initiatives and mitigations, and social goals and targets.
SI Score RankingsAir France-KLMA+Deutsche Post DHLA+United Parcel ServiceAUnion PacificANippon ExpressAMitsui OSK LinesAQantas AirwaysA-TNTA-United AirlinesA-Nippon Yusen Kaisha (NYK)A-East Japan RailwayA-Delta AirlinesA-A.P. Moller-MaerskA-Lufthansa GroupA-Cathay Pacific AirwaysB+British AirwaysB+ABN AMRO HoldingB+Kawasaki Kisen KaishaBFedExB-All Nippon AirwaysB-West Japan RailwayC+Kühne & Nagel IntlC+Singapore AirlinesCUS Airways GroupC-Yamato HoldingsC-TokyuC-Central Japan RailwayD+STX CorpFChina Cosco HoldingsF
0.000.00
23.0830.7730.7730.7734.62
46.1546.1550.0053.8557.69
65.3865.3869.2373.0876.9276.9276.9276.9276.9276.9276.9280.7780.7780.7784.6288.4688.46
0 25 50 75 100
China Cosco Holdings
STX Corp
Central Japan Railway
Tokyu
Yamato Holdings
US Airways Group
Singapore Airlines
Kühne & Nagel Intl
W est Japan Railway
All Nippon Airways
FedEx
Kawasaki Kisen Kaisha
ABN AMRO Holding
British Airways
Cathay Pacif ic Airways
Lufthansa Group
A.P. Moller-Maersk
Delta Airlines
East Japan Railway
Nippon Yusen Kaisha (NYK)
United Airlines
TNT
Qantas Airways
Mitsui OSK Lines
Nippon Express
Union Pacif ic
United Parcel Service
Deutsche Post DHL
Air France-KLM
www.roberts.cmc.edu 17 Transportation and Logistics Sectors
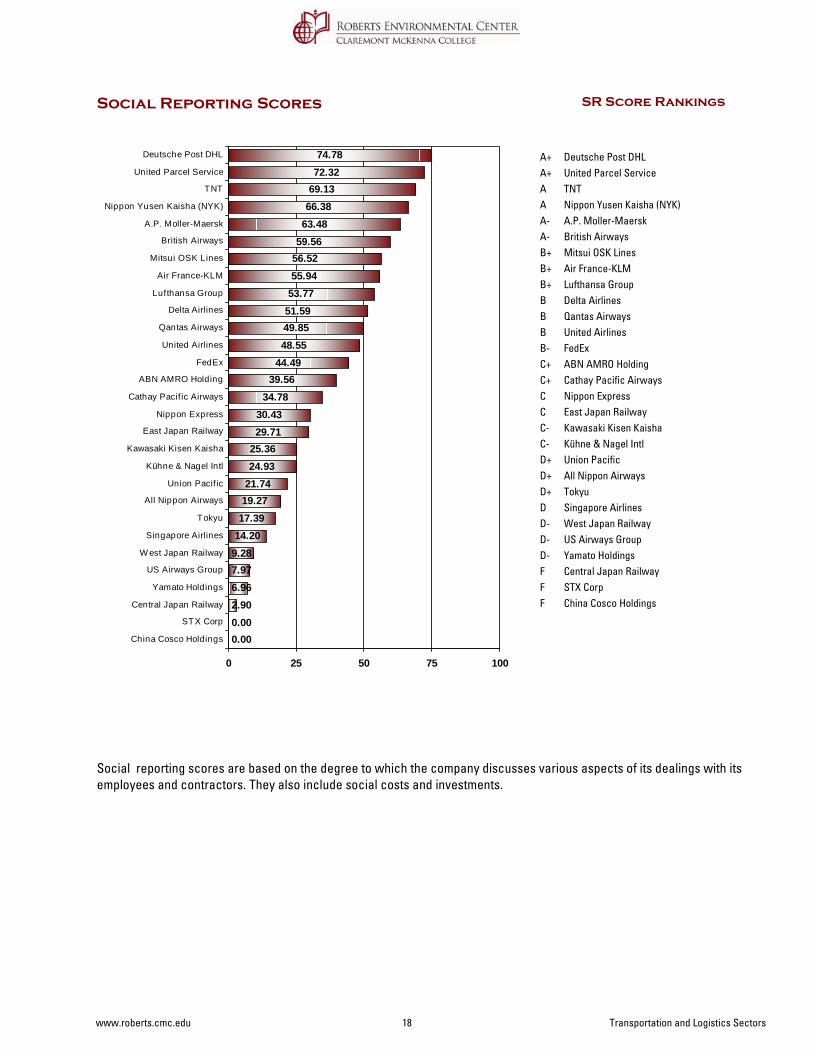
Social Reporting Scores
Social reporting scores are based on the degree to which the company discusses various aspects of its dealings with its employees and contractors. They also include social costs and investments.
SR Score Rankings
Deutsche Post DHLA+United Parcel ServiceA+TNTANippon Yusen Kaisha (NYK)AA.P. Moller-MaerskA-British AirwaysA-Mitsui OSK LinesB+Air France-KLMB+Lufthansa GroupB+Delta AirlinesBQantas AirwaysBUnited AirlinesBFedExB-ABN AMRO HoldingC+Cathay Pacific AirwaysC+Nippon ExpressCEast Japan RailwayCKawasaki Kisen KaishaC-Kühne & Nagel IntlC-Union PacificD+All Nippon AirwaysD+TokyuD+Singapore AirlinesDWest Japan RailwayD-US Airways GroupD-Yamato HoldingsD-Central Japan RailwayFSTX CorpFChina Cosco HoldingsF
0.000.002.906.967.979.2814.2017.3919.2721.7424.9325.3629.7130.43
34.7839.56
44.4948.5549.8551.5953.7755.9456.5259.5663.4866.3869.1372.3274.78
0 25 50 75 100
China Cosco Holdings
STX Corp
Central Japan Railway
Yamato Holdings
US Airways Group
W est Japan Railway
Singapore Airlines
Tokyu
All Nippon Airways
Union Pacif ic
Kühne & Nagel Intl
Kawasaki Kisen Kaisha
East Japan Railway
Nippon Express
Cathay Pacif ic Airways
ABN AMRO Holding
FedEx
United Airlines
Qantas Airways
Delta Airlines
Lufthansa Group
Air France-KLM
Mitsui OSK Lines
British Airways
A.P. Moller-Maersk
Nippon Yusen Kaisha (NYK)
TNT
United Parcel Service
Deutsche Post DHL
www.roberts.cmc.edu 18 Transportation and Logistics Sectors
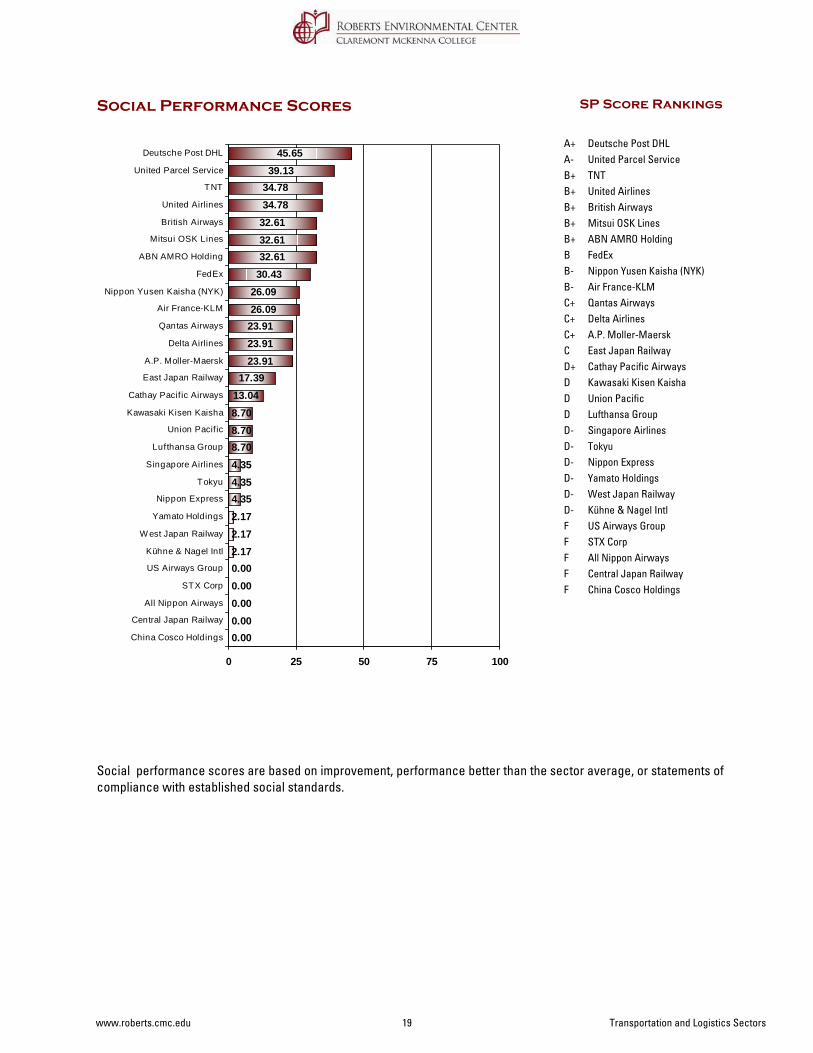
Social Performance Scores
Social performance scores are based on improvement, performance better than the sector average, or statements of compliance with established social standards.
SP Score Rankings
Deutsche Post DHLA+United Parcel ServiceA-TNTB+United AirlinesB+British AirwaysB+Mitsui OSK LinesB+ABN AMRO HoldingB+FedExBNippon Yusen Kaisha (NYK)B-Air France-KLMB-Qantas AirwaysC+Delta AirlinesC+A.P. Moller-MaerskC+East Japan RailwayCCathay Pacific AirwaysD+Kawasaki Kisen KaishaDUnion PacificDLufthansa GroupDSingapore AirlinesD-TokyuD-Nippon ExpressD-Yamato HoldingsD-West Japan RailwayD-Kühne & Nagel IntlD-US Airways GroupFSTX CorpFAll Nippon AirwaysFCentral Japan RailwayFChina Cosco HoldingsF
0.000.000.000.000.002.172.172.174.354.354.358.708.708.7013.0417.39
23.9123.9123.9126.0926.0930.4332.6132.6132.6134.7834.7839.13
45.65
0 25 50 75 100
China Cosco Holdings
Central Japan Railway
All Nippon Airways
STX Corp
US Airways Group
Kühne & Nagel Intl
W est Japan Railway
Yamato Holdings
Nippon Express
Tokyu
Singapore Airlines
Lufthansa Group
Union Pacif ic
Kawasaki Kisen Kaisha
Cathay Pacif ic Airways
East Japan Railway
A.P. Moller-Maersk
Delta Airlines
Qantas Airways
Air France-KLM
Nippon Yusen Kaisha (NYK)
FedEx
ABN AMRO Holding
Mitsui OSK Lines
British Airways
United Airlines
TNT
United Parcel Service
Deutsche Post DHL
www.roberts.cmc.edu 19 Transportation and Logistics Sectors
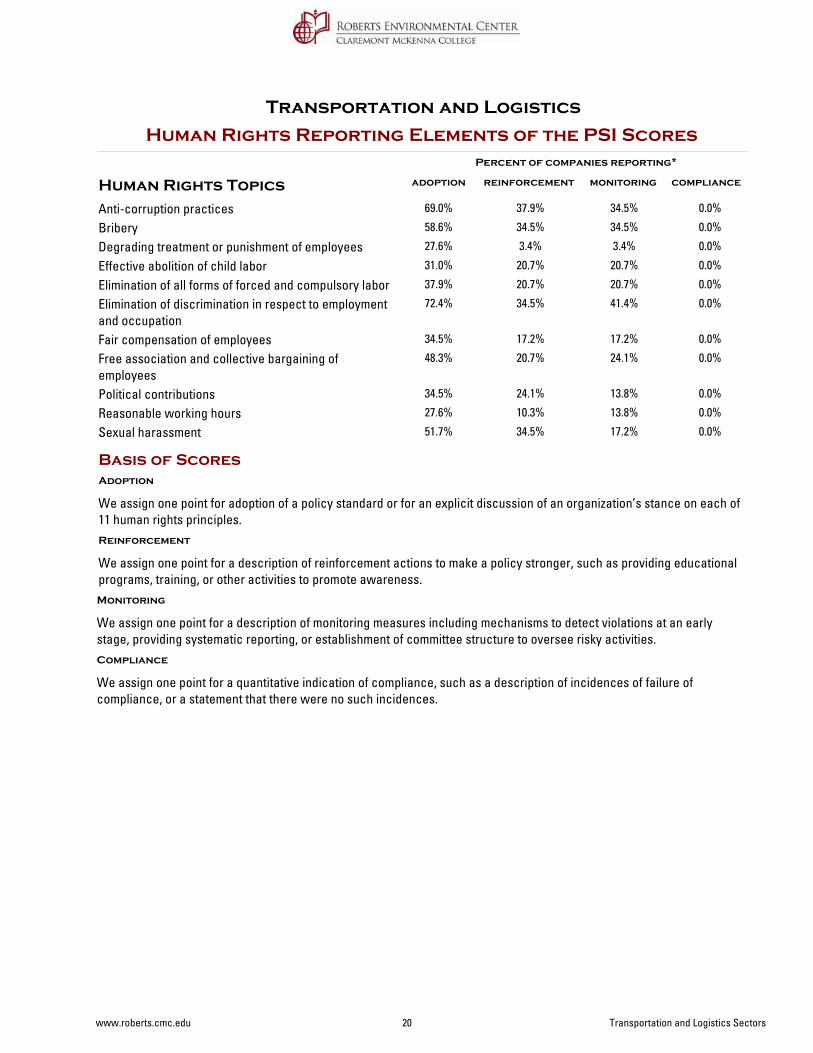
Human Rights Reporting Elements of the PSI Scores
Transportation and Logistics
adoption reinforcement monitoring complianceHuman Rights Topics
Percent of companies reporting*
Anti-corruption practices 69.0% 37.9% 34.5% 0.0%
Bribery 58.6% 34.5% 34.5% 0.0%
Degrading treatment or punishment of employees 27.6% 3.4% 3.4% 0.0%
Effective abolition of child labor 31.0% 20.7% 20.7% 0.0%
Elimination of all forms of forced and compulsory labor 37.9% 20.7% 20.7% 0.0%
Elimination of discrimination in respect to employment and occupation
72.4% 34.5% 41.4% 0.0%
Fair compensation of employees 34.5% 17.2% 17.2% 0.0%
Free association and collective bargaining of employees
48.3% 20.7% 24.1% 0.0%
Political contributions 34.5% 24.1% 13.8% 0.0%
Reasonable working hours 27.6% 10.3% 13.8% 0.0%
Sexual harassment 51.7% 34.5% 17.2% 0.0%
We assign one point for adoption of a policy standard or for an explicit discussion of an organization’s stance on each of 11 human rights principles.
Adoption
We assign one point for a description of reinforcement actions to make a policy stronger, such as providing educational programs, training, or other activities to promote awareness.
Reinforcement
We assign one point for a description of monitoring measures including mechanisms to detect violations at an early stage, providing systematic reporting, or establishment of committee structure to oversee risky activities.
Monitoring
We assign one point for a quantitative indication of compliance, such as a description of incidences of failure of compliance, or a statement that there were no such incidences.
Compliance
Basis of Scores
www.roberts.cmc.edu 20 Transportation and Logistics Sectors
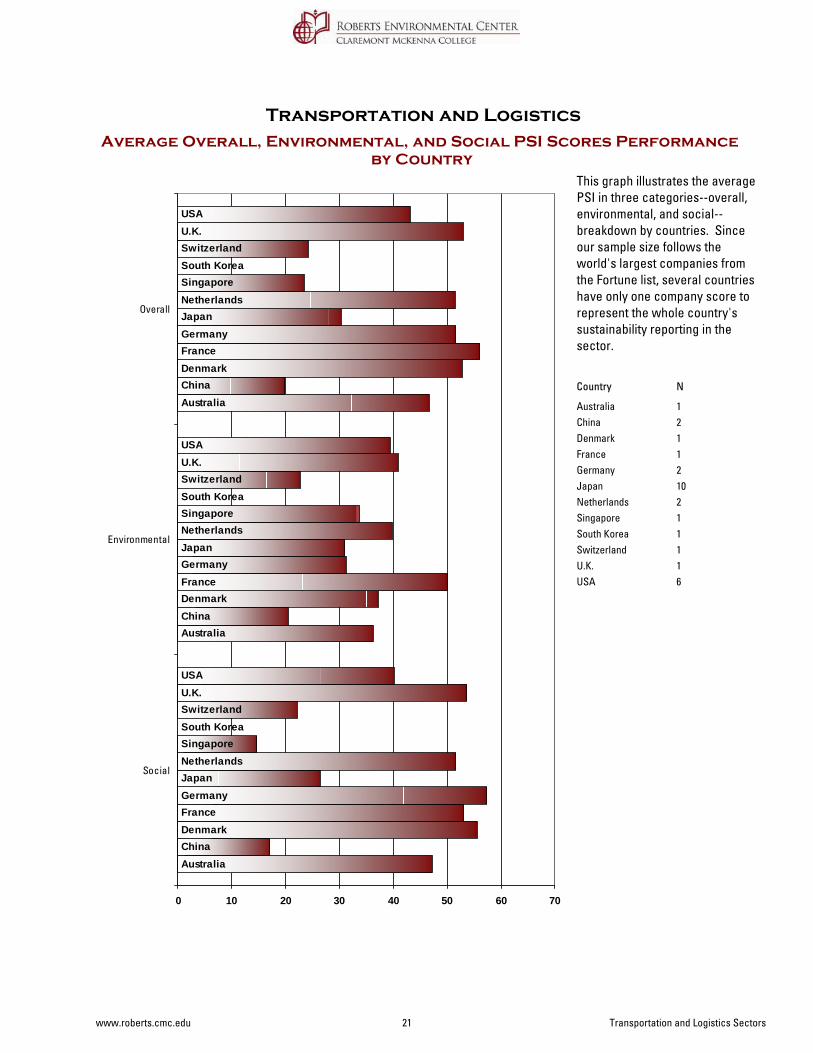
Average Overall, Environmental, and Social PSI Scores Performance by Country
Transportation and Logistics
Australia
Australia
Australia
China
China
China
Denmark
Denmark
Denmark
France
France
France
Germany
Germany
Germany
Japan
Japan
Japan
Netherlands
Netherlands
Netherlands
Singapore
Singapore
Singapore
South Korea
South Korea
South Korea
Switzerland
Switzerland
Switzerland
U.K.
U.K.
U.K.
USA
USA
USA
0 10 20 30 40 50 60 70
Social
Environmental
Overall
This graph illustrates the average PSI in three categories--overall, environmental, and social--breakdown by countries. Since our sample size follows the world's largest companies from the Fortune list, several countries have only one company score to represent the whole country's sustainability reporting in the sector.
Country N
Australia 1China 2Denmark 1France 1Germany 2Japan 10Netherlands 2Singapore 1South Korea 1Switzerland 1U.K. 1USA 6
www.roberts.cmc.edu 21 Transportation and Logistics Sectors
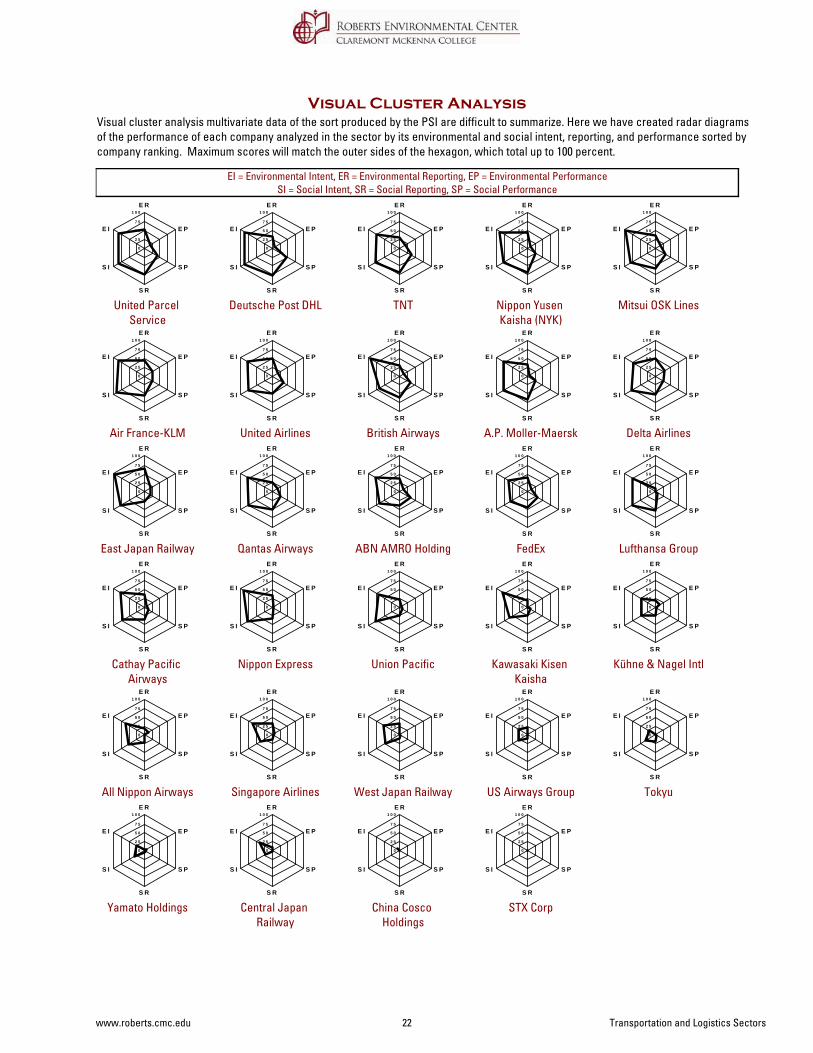
Visual cluster analysis multivariate data of the sort produced by the PSI are difficult to summarize. Here we have created radar diagrams of the performance of each company analyzed in the sector by its environmental and social intent, reporting, and performance sorted by company ranking. Maximum scores will match the outer sides of the hexagon, which total up to 100 percent.
Visual Cluster Analysis
EI = Environmental Intent, ER = Environmental Reporting, EP = Environmental PerformanceSI = Social Intent, SR = Social Reporting, SP = Social Performance
United Parcel Service
0
2 5
5 0
7 5
1 0 0E R
E P
S P
S R
S I
E I
Deutsche Post DHL
0
2 5
5 0
7 5
1 0 0E R
E P
S P
S R
S I
E I
TNT
0
2 5
5 0
7 5
1 0 0E R
E P
S P
S R
S I
E I
Nippon Yusen Kaisha (NYK)
0
2 5
5 0
7 5
1 0 0E R
E P
S P
S R
S I
E I
Mitsui OSK Lines
0
2 5
5 0
7 5
1 0 0E R
E P
S P
S R
S I
E I
Air France-KLM
0
2 5
5 0
7 5
1 0 0E R
E P
S P
S R
S I
E I
United Airlines
0
2 5
5 0
7 5
1 0 0E R
E P
S P
S R
S I
E I
British Airways
0
2 5
5 0
7 5
1 0 0E R
E P
S P
S R
S I
E I
A.P. Moller-Maersk
0
2 5
5 0
7 5
1 0 0E R
E P
S P
S R
S I
E I
Delta Airlines
0
2 5
5 0
7 5
1 0 0E R
E P
S P
S R
S I
E I
East Japan Railway
0
2 5
5 0
7 5
1 0 0E R
E P
S P
S R
S I
E I
Qantas Airways
0
2 5
5 0
7 5
1 0 0E R
E P
S P
S R
S I
E I
ABN AMRO Holding
0
2 5
5 0
7 5
1 0 0E R
E P
S P
S R
S I
E I
FedEx
0
2 5
5 0
7 5
1 0 0E R
E P
S P
S R
S I
E I
Lufthansa Group
0
2 5
5 0
7 5
1 0 0E R
E P
S P
S R
S I
E I
Cathay Pacific Airways
0
2 5
5 0
7 5
1 0 0E R
E P
S P
S R
S I
E I
Nippon Express
0
2 5
5 0
7 5
1 0 0E R
E P
S P
S R
S I
E I
Union Pacific
0
2 5
5 0
7 5
1 0 0E R
E P
S P
S R
S I
E I
Kawasaki Kisen Kaisha
0
2 5
5 0
7 5
1 0 0E R
E P
S P
S R
S I
E I
Kühne & Nagel Intl
0
2 5
5 0
7 5
1 0 0E R
E P
S P
S R
S I
E I
All Nippon Airways
0
2 5
5 0
7 5
1 0 0E R
E P
S P
S R
S I
E I
Singapore Airlines
0
2 5
5 0
7 5
1 0 0E R
E P
S P
S R
S I
E I
West Japan Railway
0
2 5
5 0
7 5
1 0 0E R
E P
S P
S R
S I
E I
US Airways Group
0
2 5
5 0
7 5
1 0 0E R
E P
S P
S R
S I
E I
Tokyu
0
2 5
5 0
7 5
1 0 0E R
E P
S P
S R
S I
E I
Yamato Holdings
0
2 5
5 0
7 5
1 0 0E R
E P
S P
S R
S I
E I
Central Japan Railway
0
2 5
5 0
7 5
1 0 0E R
E P
S P
S R
S I
E I
China Cosco Holdings
0
2 5
5 0
7 5
1 0 0E R
E P
S P
S R
S I
E I
STX Corp
0
2 5
5 0
7 5
1 0 0E R
E P
S P
S R
S I
E I
www.roberts.cmc.edu 22 Transportation and Logistics Sectors
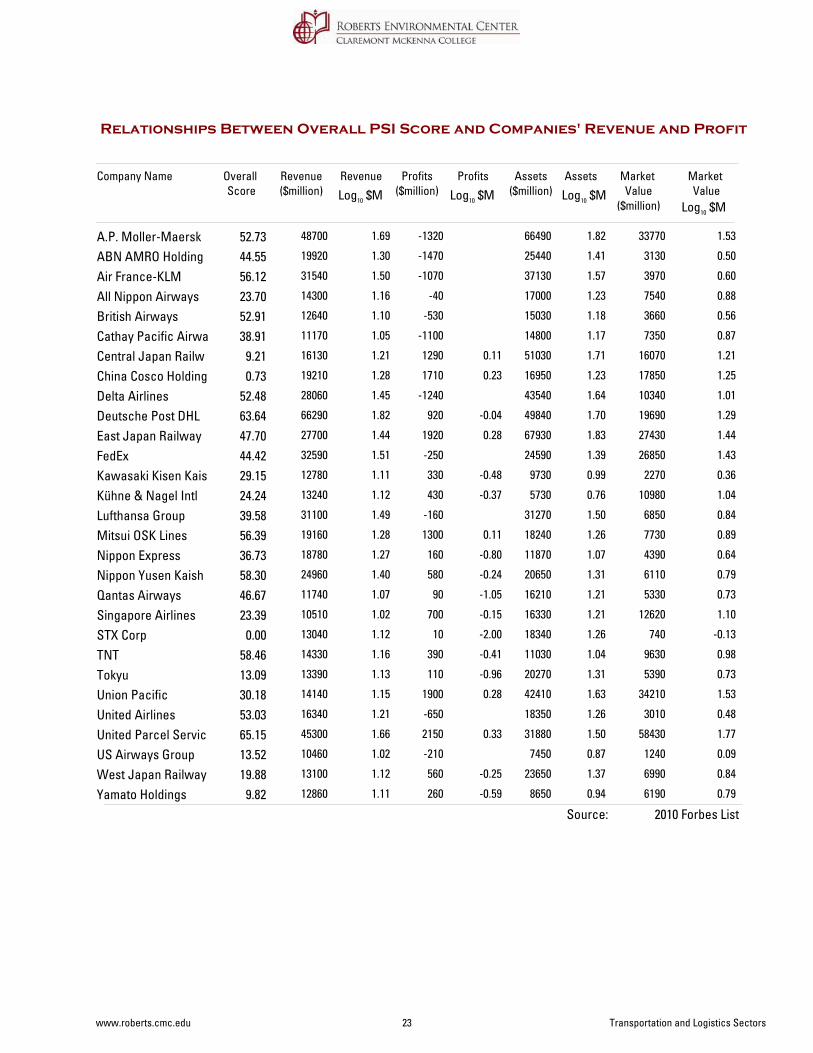
Relationships Between Overall PSI Score and Companies' Revenue and Profit
Company Name Overall Score
Revenue($million)
Profits($million)
Assets($million)
Market Value
($million)
Revenue Profits Assets Market ValueLog10 $M Log10 $M Log10 $M
Log10 $M
A.P. Moller-Maersk 52.73 48700 -1320 66490 337701.69 1.82 1.53
ABN AMRO Holding 44.55 19920 -1470 25440 31301.30 1.41 0.50
Air France-KLM 56.12 31540 -1070 37130 39701.50 1.57 0.60
All Nippon Airways 23.70 14300 -40 17000 75401.16 1.23 0.88
British Airways 52.91 12640 -530 15030 36601.10 1.18 0.56
Cathay Pacific Airwa 38.91 11170 -1100 14800 73501.05 1.17 0.87
Central Japan Railw 9.21 16130 1290 51030 160701.21 0.11 1.71 1.21
China Cosco Holding 0.73 19210 1710 16950 178501.28 0.23 1.23 1.25
Delta Airlines 52.48 28060 -1240 43540 103401.45 1.64 1.01
Deutsche Post DHL 63.64 66290 920 49840 196901.82 -0.04 1.70 1.29
East Japan Railway 47.70 27700 1920 67930 274301.44 0.28 1.83 1.44
FedEx 44.42 32590 -250 24590 268501.51 1.39 1.43
Kawasaki Kisen Kais 29.15 12780 330 9730 22701.11 -0.48 0.99 0.36
Kühne & Nagel Intl 24.24 13240 430 5730 109801.12 -0.37 0.76 1.04
Lufthansa Group 39.58 31100 -160 31270 68501.49 1.50 0.84
Mitsui OSK Lines 56.39 19160 1300 18240 77301.28 0.11 1.26 0.89
Nippon Express 36.73 18780 160 11870 43901.27 -0.80 1.07 0.64
Nippon Yusen Kaish 58.30 24960 580 20650 61101.40 -0.24 1.31 0.79
Qantas Airways 46.67 11740 90 16210 53301.07 -1.05 1.21 0.73
Singapore Airlines 23.39 10510 700 16330 126201.02 -0.15 1.21 1.10
STX Corp 0.00 13040 10 18340 7401.12 -2.00 1.26 -0.13
TNT 58.46 14330 390 11030 96301.16 -0.41 1.04 0.98
Tokyu 13.09 13390 110 20270 53901.13 -0.96 1.31 0.73
Union Pacific 30.18 14140 1900 42410 342101.15 0.28 1.63 1.53
United Airlines 53.03 16340 -650 18350 30101.21 1.26 0.48
United Parcel Servic 65.15 45300 2150 31880 584301.66 0.33 1.50 1.77
US Airways Group 13.52 10460 -210 7450 12401.02 0.87 0.09
West Japan Railway 19.88 13100 560 23650 69901.12 -0.25 1.37 0.84
Yamato Holdings 9.82 12860 260 8650 61901.11 -0.59 0.94 0.79
2010 Forbes List Source:
www.roberts.cmc.edu 23 Transportation and Logistics Sectors
0 .0 0 0 .7 3
9 .2 19 .8 2
13 .0 913 .5 2
19 .8 8
2 3 .3 9 2 3 .7 02 4 .2 4
2 9 .153 0 .18
3 6 .7 33 8 .9 1 3 9 .5 8
4 4 .4 24 4 .5 54 6 .6 7 4 7 .7 0
5 2 .4 8 5 2 .7 35 2 .9 1 5 3 .0 3
5 6 .125 6 .3 95 8 .3 05 8 .4 6
6 3 .6 46 5 .15
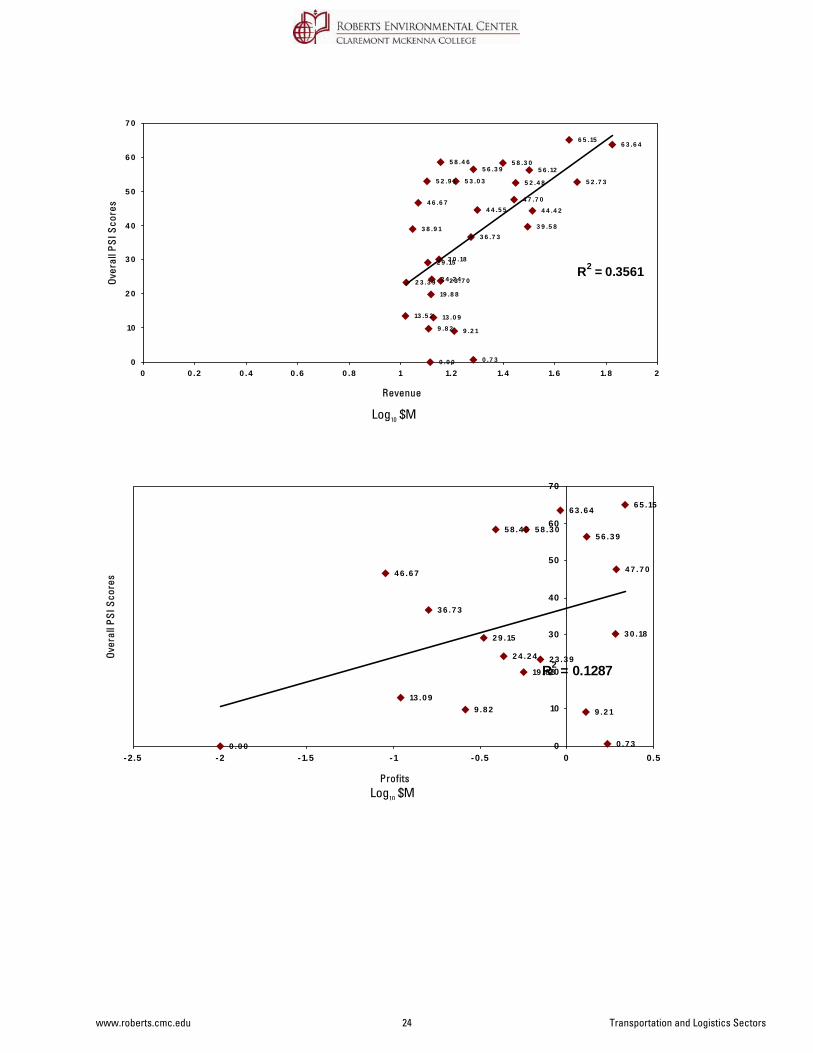
R2 = 0.3561
0
10
2 0
3 0
4 0
5 0
6 0
7 0
0 0 .2 0 .4 0 .6 0 .8 1 1.2 1.4 1.6 1.8 2
Revenue
Over
all P
SI S
core
s
Log10 $M
0 .0 0 0 .7 3
9 .2 19 .8 213 .0 9
19 .8 82 3 .3 92 4 .2 4
2 9 .15 3 0 .18
3 6 .7 3
4 6 .6 7 4 7 .7 0
5 6 .3 95 8 .3 05 8 .4 6
6 3 .6 46 5 .15
R2 = 0.1287
0
10
20
30
40
50
60
70
-2.5 -2 -1.5 -1 -0.5 0 0.5
Profits
Over
all P
SI S
core
s
Log10 $M
www.roberts.cmc.edu 24 Transportation and Logistics Sectors
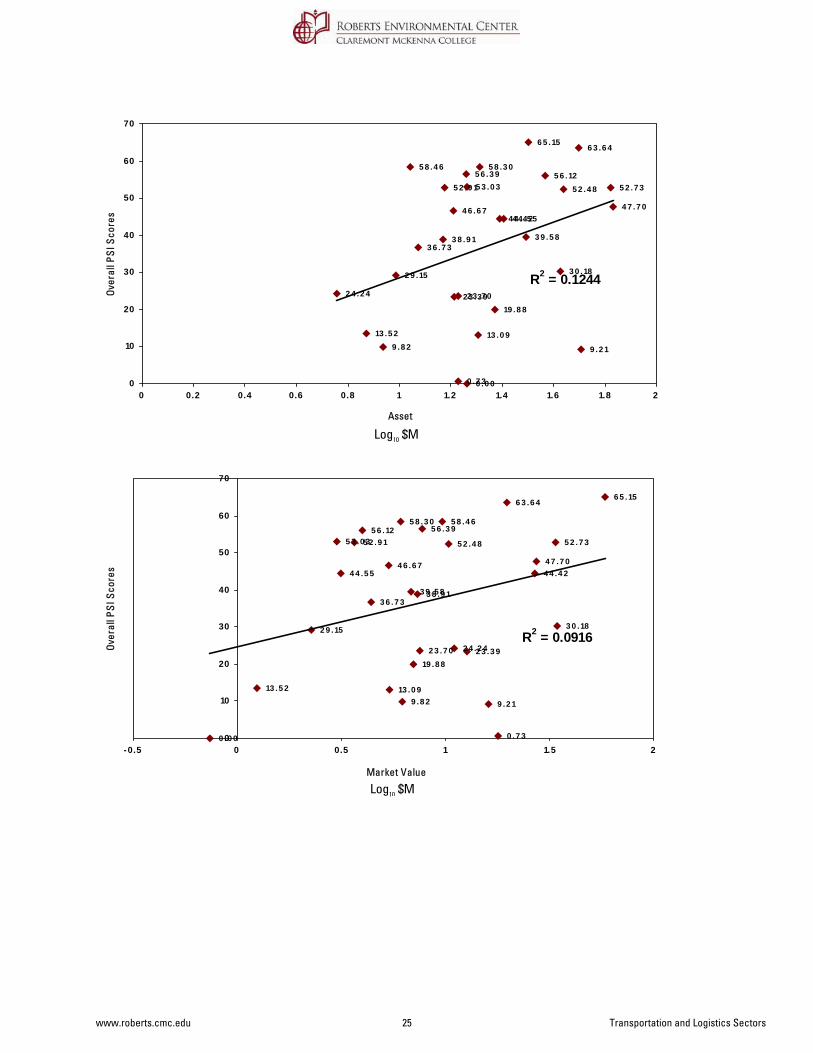
0 .0 00 .7 3
9 .2 19 .8 213 .0 913 .5 2
19 .8 82 3 .3 92 3 .7 02 4 .2 4
2 9 .15 3 0 .18
3 6 .7 33 8 .9 1 3 9 .5 8
4 4 .4 24 4 .5 54 6 .6 7 4 7 .7 0
5 2 .4 8 5 2 .7 35 2 .9 15 3 .0 35 6 .125 6 .3 9
5 8 .3 05 8 .4 6
6 3 .6 46 5 .15
R2 = 0.1244
0
10
20
30
40
50
60
70
0 0.2 0.4 0.6 0.8 1 1.2 1.4 1.6 1.8 2
Asset
Over
all P
SI S
core
s
Log10 $M
0 .0 0 0 .7 3
9 .2 19 .8 213 .0 913 .5 2
19 .8 82 3 .3 92 3 .7 0 2 4 .2 4
2 9 .15 3 0 .18
3 6 .7 33 8 .9 13 9 .5 8
4 4 .4 24 4 .5 54 6 .6 7 4 7 .7 0
5 2 .4 8 5 2 .7 35 2 .9 15 3 .0 35 6 .12 5 6 .3 9
5 8 .3 0 5 8 .4 6
6 3 .6 46 5 .15
R2 = 0.0916
0
10
20
30
40
50
60
70
-0.5 0 0.5 1 1.5 2
Market Value
Over
all P
SI S
core
s
Log10 $M
www.roberts.cmc.edu 25 Transportation and Logistics Sectors
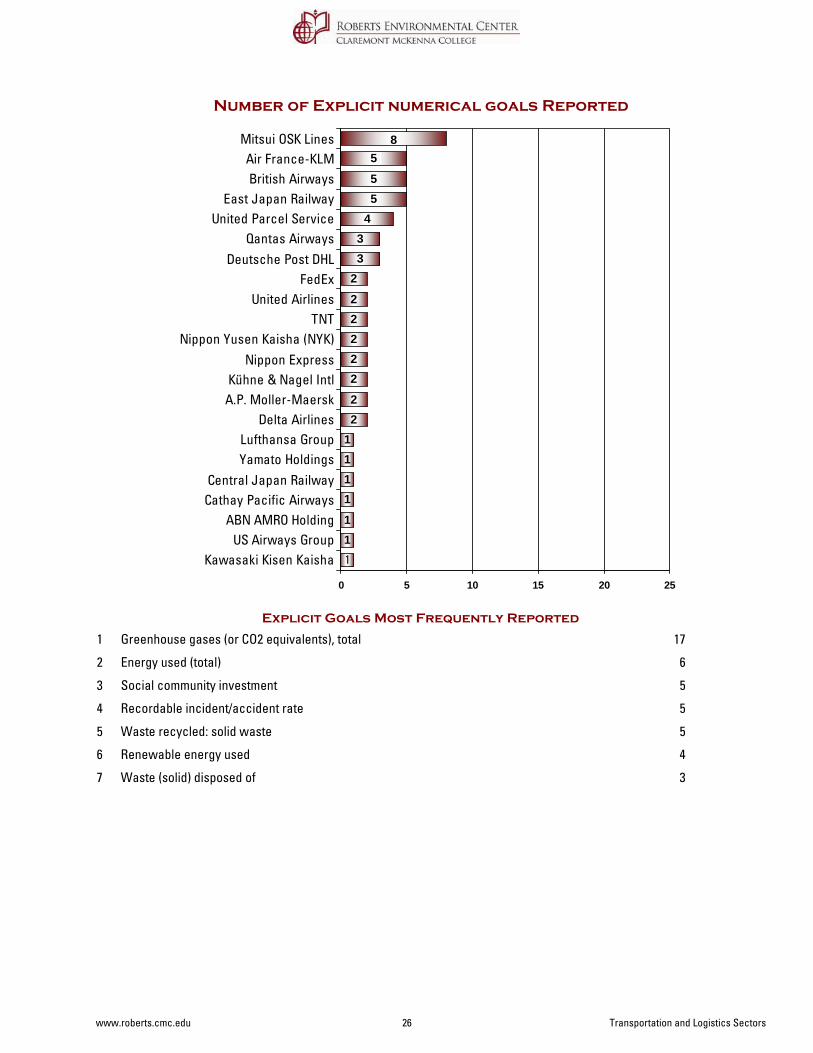
Number of Explicit numerical goals Reported
Explicit Goals Most Frequently Reported
11
111122
22222
233
455
58
1
0 5 10 15 20 25
Kawasaki Kisen KaishaUS Airways Group
ABN AMRO HoldingCathay Pacific AirwaysCentral Japan Railway
Yamato HoldingsLufthansa Group
Delta AirlinesA.P. Moller-MaerskKühne & Nagel Intl
Nippon ExpressNippon Yusen Kaisha (NYK)
TNTUnited Airlines
FedExDeutsche Post DHL
Qantas AirwaysUnited Parcel Service
East Japan RailwayBritish Airways
Air France-KLMMitsui OSK Lines
Greenhouse gases (or CO2 equivalents), total1 17
Energy used (total)2 6
Social community investment3 5
Recordable incident/accident rate4 5
Waste recycled: solid waste5 5
Renewable energy used6 4
Waste (solid) disposed of7 3
www.roberts.cmc.edu 26 Transportation and Logistics Sectors
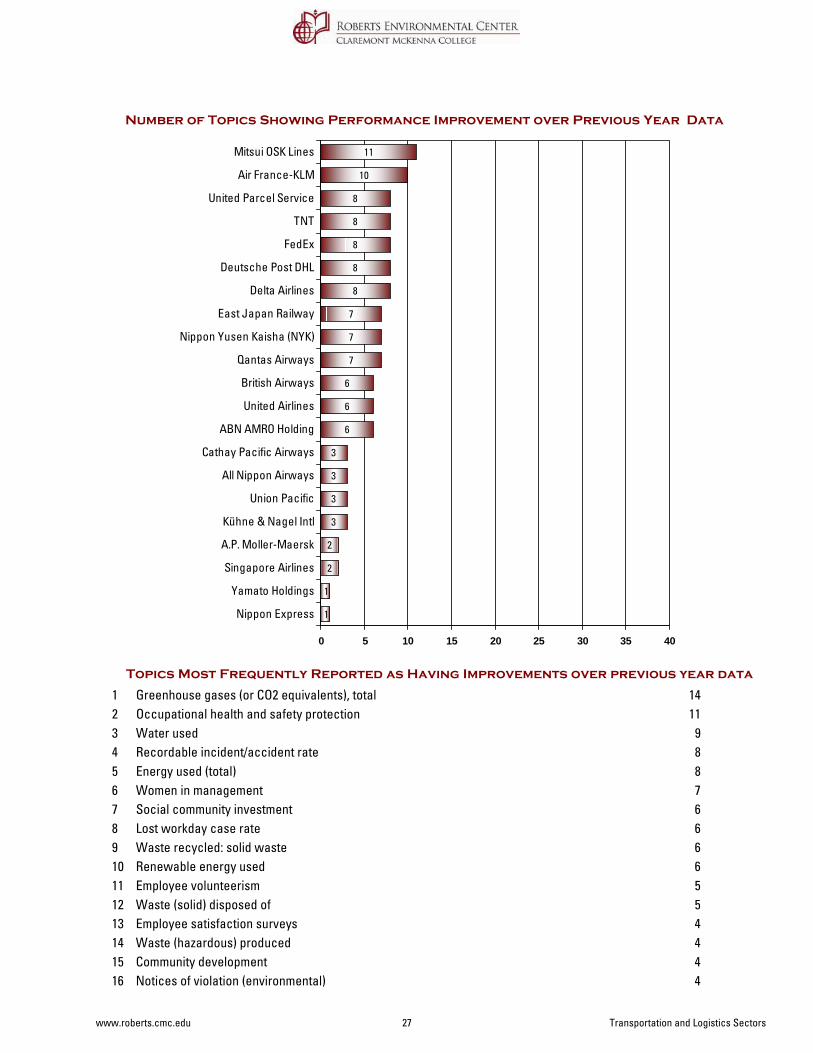
Number of Topics Showing Performance Improvement over Previous Year Data
Topics Most Frequently Reported as Having Improvements over previous year data
1
1
2
2
3
3
3
3
6
6
6
7
7
7
8
8
8
8
8
10
11
0 5 10 15 20 25 30 35 40
Nippon Express
Yamato Holdings
Singapore Airlines
A.P. Moller-Maersk
Kühne & Nagel Intl
Union Pacific
All Nippon Airways
Cathay Pacific Airways
ABN AMRO Holding
United Airlines
British Airways
Qantas Airways
Nippon Yusen Kaisha (NYK)
East Japan Railway
Delta Airlines
Deutsche Post DHL
FedEx
TNT
United Parcel Service
Air France-KLM
Mitsui OSK Lines
Greenhouse gases (or CO2 equivalents), total1 14Occupational health and safety protection2 11Water used3 9Recordable incident/accident rate4 8Energy used (total)5 8Women in management6 7Social community investment7 6Lost workday case rate8 6Waste recycled: solid waste9 6Renewable energy used10 6Employee volunteerism11 5Waste (solid) disposed of12 5Employee satisfaction surveys13 4Waste (hazardous) produced14 4Community development15 4Notices of violation (environmental)16 4
www.roberts.cmc.edu 27 Transportation and Logistics Sectors
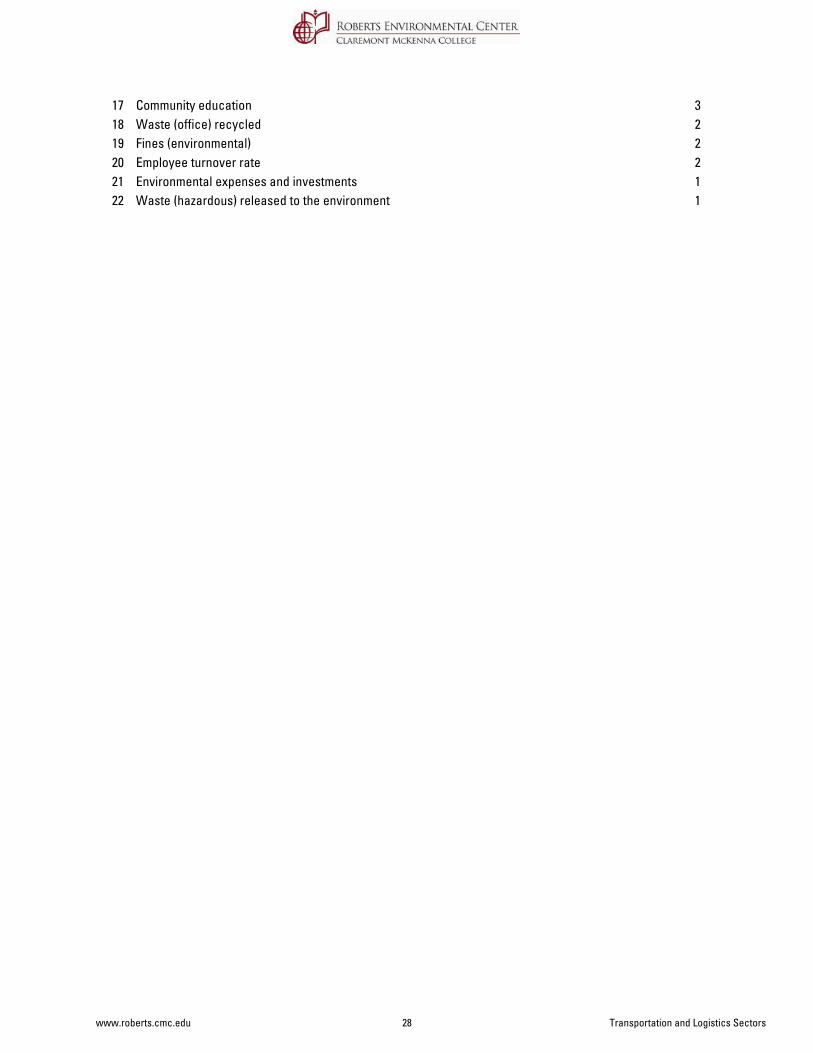
Community education17 3Waste (office) recycled18 2Fines (environmental)19 2Employee turnover rate20 2Environmental expenses and investments21 1Waste (hazardous) released to the environment22 1
www.roberts.cmc.edu 28 Transportation and Logistics Sectors
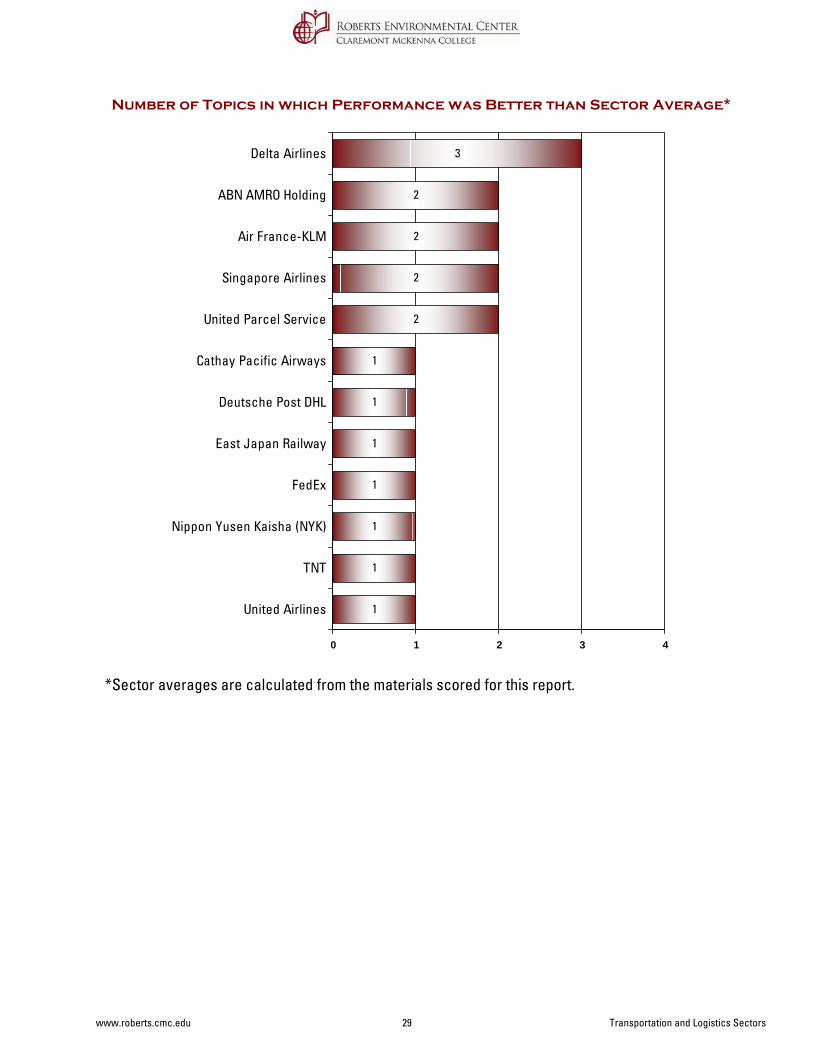
Number of Topics in which Performance was Better than Sector Average*
*Sector averages are calculated from the materials scored for this report.
1
1
1
1
1
1
1
2
2
2
2
3
0 1 2 3 4
United Airlines
TNT
Nippon Yusen Kaisha (NYK)
FedEx
East Japan Railway
Deutsche Post DHL
Cathay Pacific Airways
United Parcel Service
Singapore Airlines
Air France-KLM
ABN AMRO Holding
Delta Airlines
www.roberts.cmc.edu 29 Transportation and Logistics Sectors
A.P. Moller-Maersk
0 2 5 5 0 7 5
SSA
SESA
E
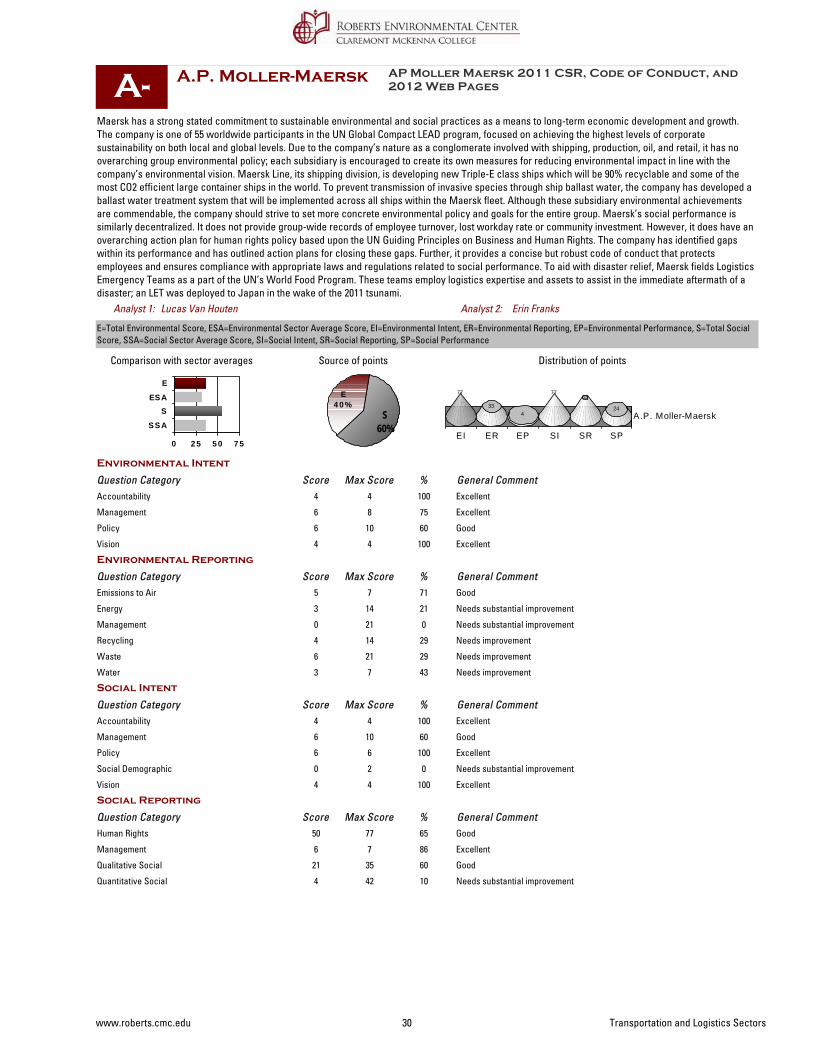
Maersk has a strong stated commitment to sustainable environmental and social practices as a means to long-term economic development and growth. The company is one of 55 worldwide participants in the UN Global Compact LEAD program, focused on achieving the highest levels of corporate sustainability on both local and global levels. Due to the company’s nature as a conglomerate involved with shipping, production, oil, and retail, it has no overarching group environmental policy; each subsidiary is encouraged to create its own measures for reducing environmental impact in line with the company’s environmental vision. Maersk Line, its shipping division, is developing new Triple-E class ships which will be 90% recyclable and some of the most CO2 efficient large container ships in the world. To prevent transmission of invasive species through ship ballast water, the company has developed a ballast water treatment system that will be implemented across all ships within the Maersk fleet. Although these subsidiary environmental achievements are commendable, the company should strive to set more concrete environmental policy and goals for the entire group. Maersk’s social performance is similarly decentralized. It does not provide group-wide records of employee turnover, lost workday rate or community investment. However, it does have an overarching action plan for human rights policy based upon the UN Guiding Principles on Business and Human Rights. The company has identified gaps within its performance and has outlined action plans for closing these gaps. Further, it provides a concise but robust code of conduct that protects employees and ensures compliance with appropriate laws and regulations related to social performance. To aid with disaster relief, Maersk fields Logistics Emergency Teams as a part of the UN’s World Food Program. These teams employ logistics expertise and assets to assist in the immediate aftermath of a disaster; an LET was deployed to Japan in the wake of the 2011 tsunami.
S60%
E4 0 %
AP Moller Maersk 2011 CSR, Code of Conduct, and 2012 Web Pages
Comparison with sector averages Source of points
A-
Erin FranksLucas Van Houten
Distribution of points
E=Total Environmental Score, ESA=Environmental Sector Average Score, EI=Environmental Intent, ER=Environmental Reporting, EP=Environmental Performance, S=Total Social Score, SSA=Social Sector Average Score, SI=Social Intent, SR=Social Reporting, SP=Social Performance
EI ER EP SI SR SP
A.P. Moller-Maersk
77
334
7763
24
Analyst 1: Analyst 2:
Environmental Intent
Question Category Max Score General CommentScore %Accountability 4 Excellent4 100
Management 8 Excellent6 75
Policy 10 Good6 60
Vision 4 Excellent4 100
Environmental Reporting
Question Category Max Score General CommentScore %Emissions to Air 7 Good5 71
Energy 14 Needs substantial improvement3 21
Management 21 Needs substantial improvement0 0
Recycling 14 Needs improvement4 29
Waste 21 Needs improvement6 29
Water 7 Needs improvement3 43
Social Intent
Question Category Max Score General CommentScore %Accountability 4 Excellent4 100
Management 10 Good6 60
Policy 6 Excellent6 100
Social Demographic 2 Needs substantial improvement0 0
Vision 4 Excellent4 100
Social Reporting
Question Category Max Score General CommentScore %Human Rights 77 Good50 65
Management 7 Excellent6 86
Qualitative Social 35 Good21 60
Quantitative Social 42 Needs substantial improvement4 10
www.roberts.cmc.edu 30 Transportation and Logistics Sectors
ABN AMRO Holding
0 2 5 5 0 7 5
SSA
SESA
E
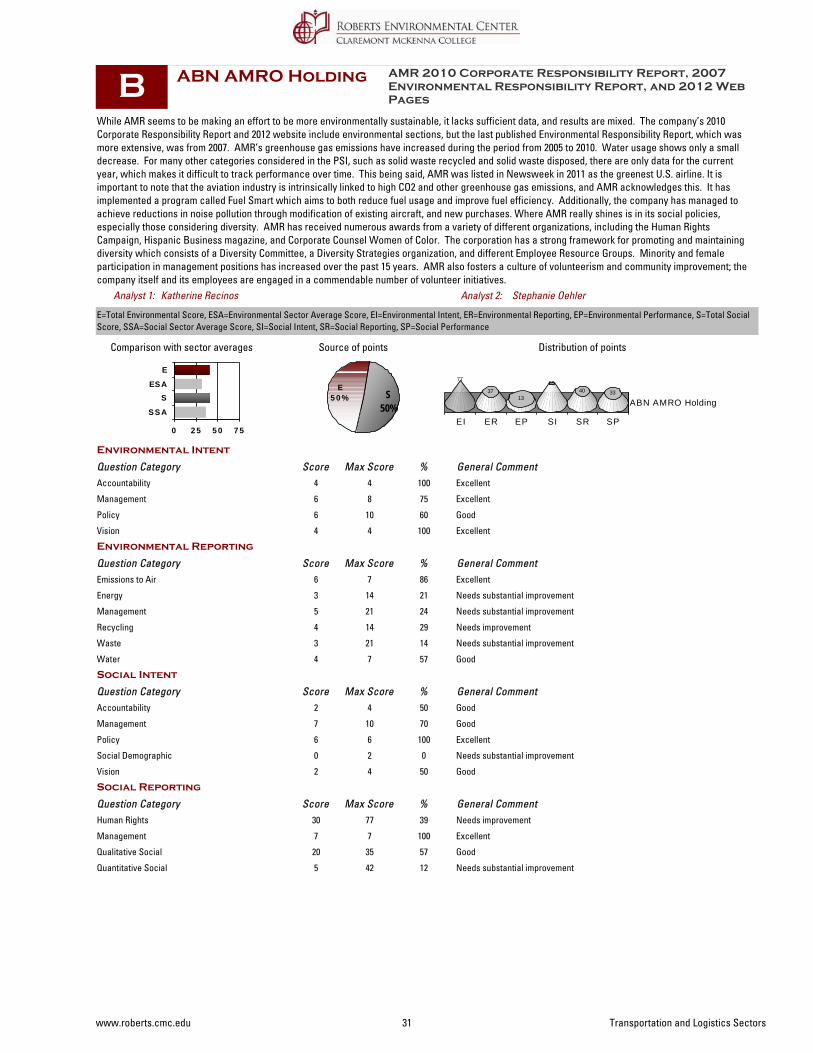
While AMR seems to be making an effort to be more environmentally sustainable, it lacks sufficient data, and results are mixed. The company’s 2010 Corporate Responsibility Report and 2012 website include environmental sections, but the last published Environmental Responsibility Report, which was more extensive, was from 2007. AMR’s greenhouse gas emissions have increased during the period from 2005 to 2010. Water usage shows only a small decrease. For many other categories considered in the PSI, such as solid waste recycled and solid waste disposed, there are only data for the current year, which makes it difficult to track performance over time. This being said, AMR was listed in Newsweek in 2011 as the greenest U.S. airline. It is important to note that the aviation industry is intrinsically linked to high CO2 and other greenhouse gas emissions, and AMR acknowledges this. It has implemented a program called Fuel Smart which aims to both reduce fuel usage and improve fuel efficiency. Additionally, the company has managed to achieve reductions in noise pollution through modification of existing aircraft, and new purchases. Where AMR really shines is in its social policies, especially those considering diversity. AMR has received numerous awards from a variety of different organizations, including the Human Rights Campaign, Hispanic Business magazine, and Corporate Counsel Women of Color. The corporation has a strong framework for promoting and maintaining diversity which consists of a Diversity Committee, a Diversity Strategies organization, and different Employee Resource Groups. Minority and female participation in management positions has increased over the past 15 years. AMR also fosters a culture of volunteerism and community improvement; the company itself and its employees are engaged in a commendable number of volunteer initiatives.
S50%
E5 0 %
AMR 2010 Corporate Responsibility Report, 2007 Environmental Responsibility Report, and 2012 Web Pages
Comparison with sector averages Source of points
B
Stephanie OehlerKatherine Recinos
Distribution of points
E=Total Environmental Score, ESA=Environmental Sector Average Score, EI=Environmental Intent, ER=Environmental Reporting, EP=Environmental Performance, S=Total Social Score, SSA=Social Sector Average Score, SI=Social Intent, SR=Social Reporting, SP=Social Performance
EI ER EP SI SR SP
ABN AMRO Holding
77
3713
6540 33
Analyst 1: Analyst 2:
Environmental Intent
Question Category Max Score General CommentScore %Accountability 4 Excellent4 100
Management 8 Excellent6 75
Policy 10 Good6 60
Vision 4 Excellent4 100
Environmental Reporting
Question Category Max Score General CommentScore %Emissions to Air 7 Excellent6 86
Energy 14 Needs substantial improvement3 21
Management 21 Needs substantial improvement5 24
Recycling 14 Needs improvement4 29
Waste 21 Needs substantial improvement3 14
Water 7 Good4 57
Social Intent
Question Category Max Score General CommentScore %Accountability 4 Good2 50
Management 10 Good7 70
Policy 6 Excellent6 100
Social Demographic 2 Needs substantial improvement0 0
Vision 4 Good2 50
Social Reporting
Question Category Max Score General CommentScore %Human Rights 77 Needs improvement30 39
Management 7 Excellent7 100
Qualitative Social 35 Good20 57
Quantitative Social 42 Needs substantial improvement5 12
www.roberts.cmc.edu 31 Transportation and Logistics Sectors
Air France-KLM
0 2 5 5 0 7 5
SSA
SESA
E
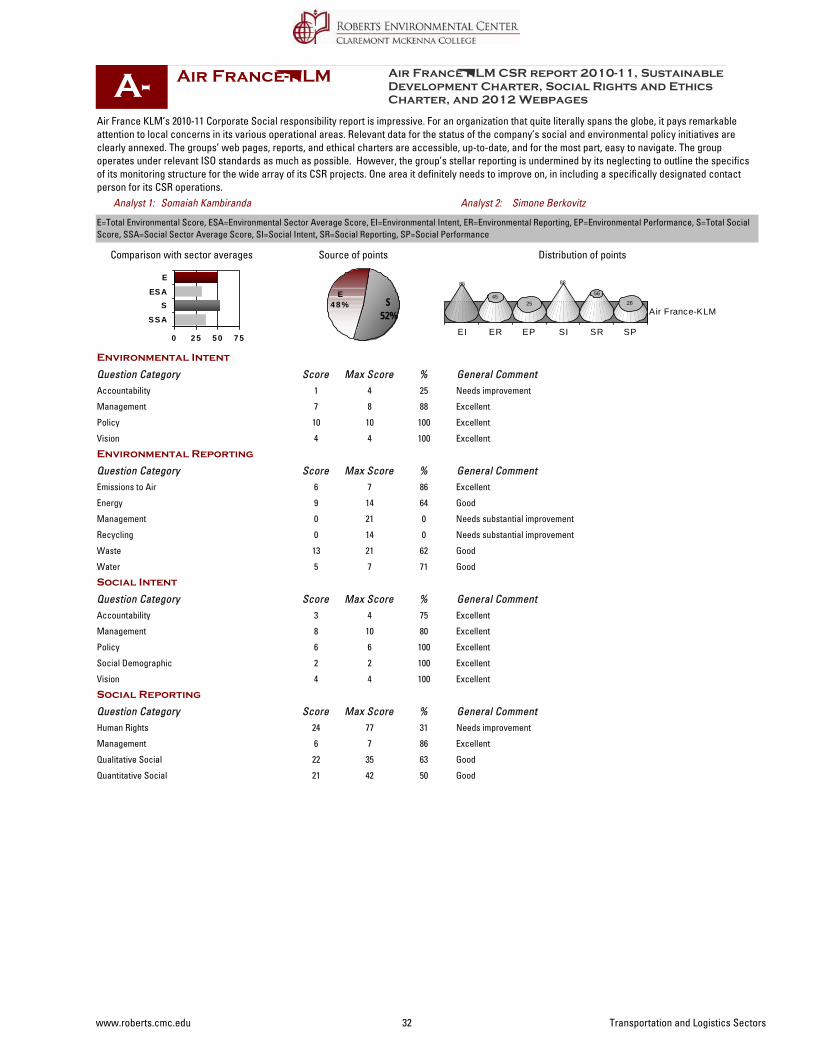
Air France KLM’s 2010-11 Corporate Social responsibility report is impressive. For an organization that quite literally spans the globe, it pays remarkable attention to local concerns in its various operational areas. Relevant data for the status of the company’s social and environmental policy initiatives are clearly annexed. The groups’ web pages, reports, and ethical charters are accessible, up-to-date, and for the most part, easy to navigate. The group operates under relevant ISO standards as much as possible. However, the group’s stellar reporting is undermined by its neglecting to outline the specifics of its monitoring structure for the wide array of its CSR projects. One area it definitely needs to improve on, in including a specifically designated contact person for its CSR operations.
S52%
E4 8 %
Air France KLM CSR report 2010-11, Sustainable Development Charter, Social Rights and Ethics Charter, and 2012 Webpages
Comparison with sector averages Source of points
A-
Simone BerkovitzSomaiah Kambiranda
Distribution of points
E=Total Environmental Score, ESA=Environmental Sector Average Score, EI=Environmental Intent, ER=Environmental Reporting, EP=Environmental Performance, S=Total Social Score, SSA=Social Sector Average Score, SI=Social Intent, SR=Social Reporting, SP=Social Performance
EI ER EP SI SR SP
Air France-KLM
85
4525
88
56
26
Analyst 1: Analyst 2:
Environmental Intent
Question Category Max Score General CommentScore %Accountability 4 Needs improvement1 25
Management 8 Excellent7 88
Policy 10 Excellent10 100
Vision 4 Excellent4 100
Environmental Reporting
Question Category Max Score General CommentScore %Emissions to Air 7 Excellent6 86
Energy 14 Good9 64
Management 21 Needs substantial improvement0 0
Recycling 14 Needs substantial improvement0 0
Waste 21 Good13 62
Water 7 Good5 71
Social Intent
Question Category Max Score General CommentScore %Accountability 4 Excellent3 75
Management 10 Excellent8 80
Policy 6 Excellent6 100
Social Demographic 2 Excellent2 100
Vision 4 Excellent4 100
Social Reporting
Question Category Max Score General CommentScore %Human Rights 77 Needs improvement24 31
Management 7 Excellent6 86
Qualitative Social 35 Good22 63
Quantitative Social 42 Good21 50
www.roberts.cmc.edu 32 Transportation and Logistics Sectors
All Nippon Airways
0 2 5 5 0 7 5
SSA
SESA
E
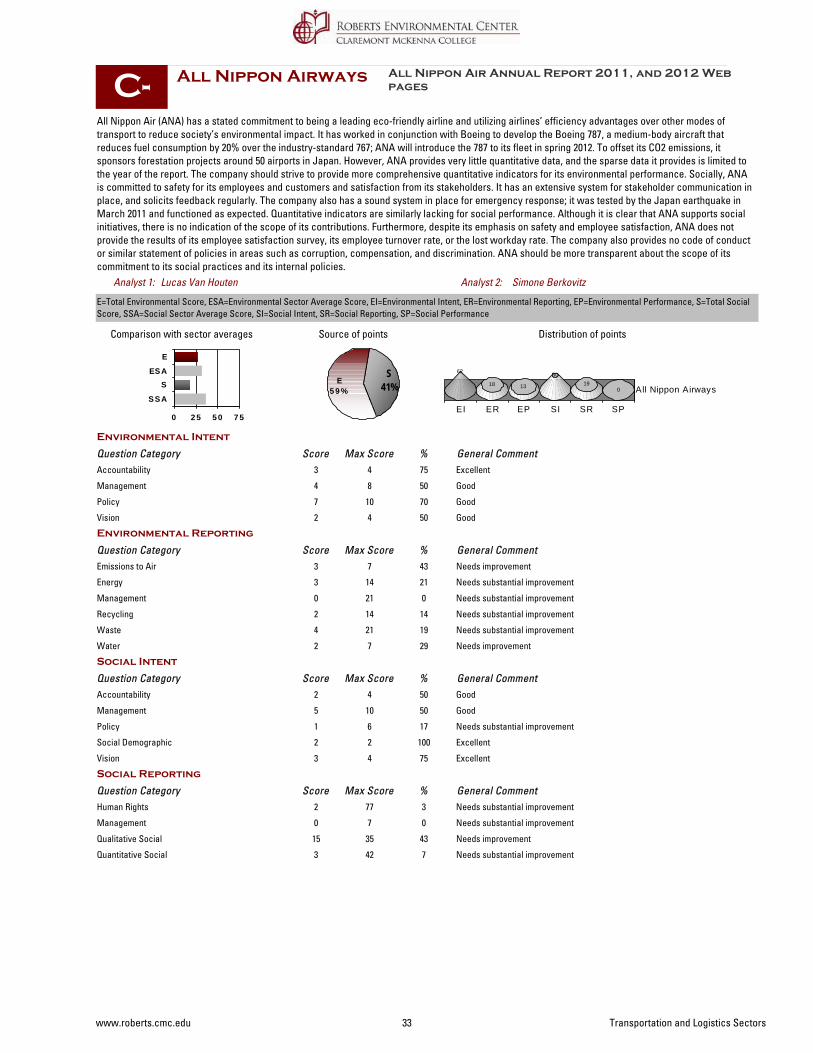
All Nippon Air (ANA) has a stated commitment to being a leading eco-friendly airline and utilizing airlines’ efficiency advantages over other modes of transport to reduce society’s environmental impact. It has worked in conjunction with Boeing to develop the Boeing 787, a medium-body aircraft that reduces fuel consumption by 20% over the industry-standard 767; ANA will introduce the 787 to its fleet in spring 2012. To offset its CO2 emissions, it sponsors forestation projects around 50 airports in Japan. However, ANA provides very little quantitative data, and the sparse data it provides is limited to the year of the report. The company should strive to provide more comprehensive quantitative indicators for its environmental performance. Socially, ANA is committed to safety for its employees and customers and satisfaction from its stakeholders. It has an extensive system for stakeholder communication in place, and solicits feedback regularly. The company also has a sound system in place for emergency response; it was tested by the Japan earthquake in March 2011 and functioned as expected. Quantitative indicators are similarly lacking for social performance. Although it is clear that ANA supports social initiatives, there is no indication of the scope of its contributions. Furthermore, despite its emphasis on safety and employee satisfaction, ANA does not provide the results of its employee satisfaction survey, its employee turnover rate, or the lost workday rate. The company also provides no code of conduct or similar statement of policies in areas such as corruption, compensation, and discrimination. ANA should be more transparent about the scope of its commitment to its social practices and its internal policies.
S41%E
5 9 %
All Nippon Air Annual Report 2011, and 2012 Web pages
Comparison with sector averages Source of points
C-
Simone BerkovitzLucas Van Houten
Distribution of points
E=Total Environmental Score, ESA=Environmental Sector Average Score, EI=Environmental Intent, ER=Environmental Reporting, EP=Environmental Performance, S=Total Social Score, SSA=Social Sector Average Score, SI=Social Intent, SR=Social Reporting, SP=Social Performance
EI ER EP SI SR SP
All Nippon Airways
62
18 13
5019
0
Analyst 1: Analyst 2:
Environmental Intent
Question Category Max Score General CommentScore %Accountability 4 Excellent3 75
Management 8 Good4 50
Policy 10 Good7 70
Vision 4 Good2 50
Environmental Reporting
Question Category Max Score General CommentScore %Emissions to Air 7 Needs improvement3 43
Energy 14 Needs substantial improvement3 21
Management 21 Needs substantial improvement0 0
Recycling 14 Needs substantial improvement2 14
Waste 21 Needs substantial improvement4 19
Water 7 Needs improvement2 29
Social Intent
Question Category Max Score General CommentScore %Accountability 4 Good2 50
Management 10 Good5 50
Policy 6 Needs substantial improvement1 17
Social Demographic 2 Excellent2 100
Vision 4 Excellent3 75
Social Reporting
Question Category Max Score General CommentScore %Human Rights 77 Needs substantial improvement2 3
Management 7 Needs substantial improvement0 0
Qualitative Social 35 Needs improvement15 43
Quantitative Social 42 Needs substantial improvement3 7
www.roberts.cmc.edu 33 Transportation and Logistics Sectors

British Airways
0 2 5 5 0 7 5
SSA
SESA
E
British Airways does a good job of touching on most subjects concerning social and environmental sustainability. However, their quantitative data is severely lacking. Aside from some figures on waste, greenhouse gas emissions, and accident rate, they hardly have any consistently measured figures at all (or, if they do, they do not report them). From a plethora of single statistics throughout their website, it seems that British Airways either does keep track of these figures and simply did not release them, or at the very least has the capacity to do so. The figures may have been kept up to date for several years, but the annual report on sustainability that was started in 1990 was disbanded in 2005. On the qualitative side, however, British Airways is quite thorough. They delve deeply into several topics, covering a wide variety of topics related to community investment, for example. If they were to take just a few more measurements or add a few paragraphs to their CSR, they could easily increase the breadth of their sustainability reporting greatly, and could then phase-in the sort of depth they have become accustomed to over time.
S57%
E4 3 %
British Airways CSR, Env. Policy, Staff Concerns, Business Standards, Business Integrity, and 2012 Webpages
Comparison with sector averages Source of points
A-
Karina GomezQuinn Chasan
Distribution of points
E=Total Environmental Score, ESA=Environmental Sector Average Score, EI=Environmental Intent, ER=Environmental Reporting, EP=Environmental Performance, S=Total Social Score, SSA=Social Sector Average Score, SI=Social Intent, SR=Social Reporting, SP=Social Performance
EI ER EP SI SR SP
British Airways
96
2813
65 6033
Analyst 1: Analyst 2:
Environmental Intent
Question Category Max Score General CommentScore %Accountability 4 Excellent3 75
Management 8 Excellent8 100
Policy 10 Excellent10 100
Vision 4 Excellent4 100
Environmental Reporting
Question Category Max Score General CommentScore %Emissions to Air 7 Excellent6 86
Energy 14 Needs substantial improvement2 14
Management 21 Needs substantial improvement0 0
Recycling 14 Needs improvement6 43
Waste 21 Needs improvement6 29
Water 7 Needs substantial improvement0 0
Social Intent
Question Category Max Score General CommentScore %Accountability 4 Needs improvement1 25
Management 10 Good5 50
Policy 6 Excellent5 83
Social Demographic 2 Excellent2 100
Vision 4 Excellent4 100
Social Reporting
Question Category Max Score General CommentScore %Human Rights 77 Needs improvement34 44
Management 7 Excellent7 100
Qualitative Social 35 Excellent32 91
Quantitative Social 42 Needs improvement11 26
www.roberts.cmc.edu 34 Transportation and Logistics Sectors
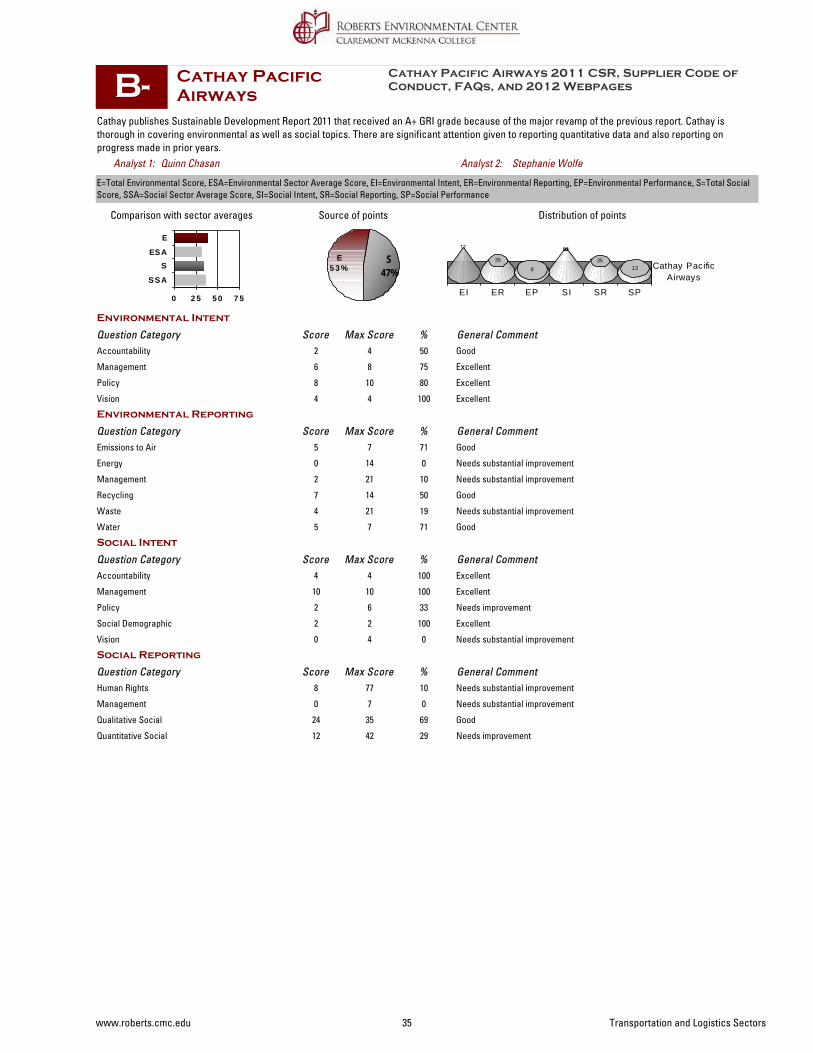
Cathay Pacific Airways
0 2 5 5 0 7 5
SSA
SESA
E
Cathay publishes Sustainable Development Report 2011 that received an A+ GRI grade because of the major revamp of the previous report. Cathay is thorough in covering environmental as well as social topics. There are significant attention given to reporting quantitative data and also reporting on progress made in prior years.
S47%
E5 3 %
Cathay Pacific Airways 2011 CSR, Supplier Code of Conduct, FAQs, and 2012 Webpages
Comparison with sector averages Source of points
B-
Stephanie WolfeQuinn Chasan
Distribution of points
E=Total Environmental Score, ESA=Environmental Sector Average Score, EI=Environmental Intent, ER=Environmental Reporting, EP=Environmental Performance, S=Total Social Score, SSA=Social Sector Average Score, SI=Social Intent, SR=Social Reporting, SP=Social Performance
EI ER EP SI SR SP
Cathay PacificAirways
77
35
8
69
3513
Analyst 1: Analyst 2:
Environmental Intent
Question Category Max Score General CommentScore %Accountability 4 Good2 50
Management 8 Excellent6 75
Policy 10 Excellent8 80
Vision 4 Excellent4 100
Environmental Reporting
Question Category Max Score General CommentScore %Emissions to Air 7 Good5 71
Energy 14 Needs substantial improvement0 0
Management 21 Needs substantial improvement2 10
Recycling 14 Good7 50
Waste 21 Needs substantial improvement4 19
Water 7 Good5 71
Social Intent
Question Category Max Score General CommentScore %Accountability 4 Excellent4 100
Management 10 Excellent10 100
Policy 6 Needs improvement2 33
Social Demographic 2 Excellent2 100
Vision 4 Needs substantial improvement0 0
Social Reporting
Question Category Max Score General CommentScore %Human Rights 77 Needs substantial improvement8 10
Management 7 Needs substantial improvement0 0
Qualitative Social 35 Good24 69
Quantitative Social 42 Needs improvement12 29
www.roberts.cmc.edu 35 Transportation and Logistics Sectors
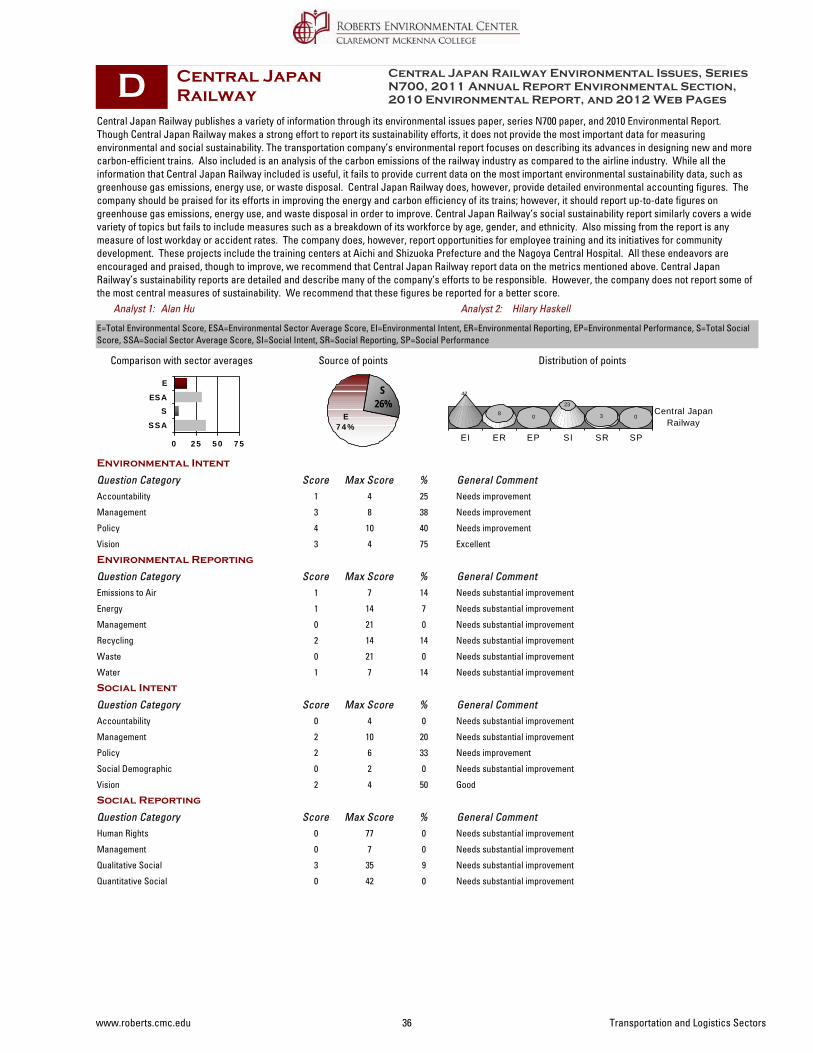
Central Japan Railway
0 2 5 5 0 7 5
SSA
SESA
E
Central Japan Railway publishes a variety of information through its environmental issues paper, series N700 paper, and 2010 Environmental Report. Though Central Japan Railway makes a strong effort to report its sustainability efforts, it does not provide the most important data for measuring environmental and social sustainability. The transportation company’s environmental report focuses on describing its advances in designing new and more carbon-efficient trains. Also included is an analysis of the carbon emissions of the railway industry as compared to the airline industry. While all the information that Central Japan Railway included is useful, it fails to provide current data on the most important environmental sustainability data, such as greenhouse gas emissions, energy use, or waste disposal. Central Japan Railway does, however, provide detailed environmental accounting figures. The company should be praised for its efforts in improving the energy and carbon efficiency of its trains; however, it should report up-to-date figures on greenhouse gas emissions, energy use, and waste disposal in order to improve. Central Japan Railway’s social sustainability report similarly covers a wide variety of topics but fails to include measures such as a breakdown of its workforce by age, gender, and ethnicity. Also missing from the report is any measure of lost workday or accident rates. The company does, however, report opportunities for employee training and its initiatives for community development. These projects include the training centers at Aichi and Shizuoka Prefecture and the Nagoya Central Hospital. All these endeavors are encouraged and praised, though to improve, we recommend that Central Japan Railway report data on the metrics mentioned above. Central Japan Railway’s sustainability reports are detailed and describe many of the company’s efforts to be responsible. However, the company does not report some of the most central measures of sustainability. We recommend that these figures be reported for a better score.
S26%
E7 4 %
Central Japan Railway Environmental Issues, Series N700, 2011 Annual Report Environmental Section, 2010 Environmental Report, and 2012 Web Pages
Comparison with sector averages Source of points
D
Hilary HaskellAlan Hu
Distribution of points
E=Total Environmental Score, ESA=Environmental Sector Average Score, EI=Environmental Intent, ER=Environmental Reporting, EP=Environmental Performance, S=Total Social Score, SSA=Social Sector Average Score, SI=Social Intent, SR=Social Reporting, SP=Social Performance
EI ER EP SI SR SP
Central JapanRailway
42
8 0
23
3 0
Analyst 1: Analyst 2:
Environmental Intent
Question Category Max Score General CommentScore %Accountability 4 Needs improvement1 25
Management 8 Needs improvement3 38
Policy 10 Needs improvement4 40
Vision 4 Excellent3 75
Environmental Reporting
Question Category Max Score General CommentScore %Emissions to Air 7 Needs substantial improvement1 14
Energy 14 Needs substantial improvement1 7
Management 21 Needs substantial improvement0 0
Recycling 14 Needs substantial improvement2 14
Waste 21 Needs substantial improvement0 0
Water 7 Needs substantial improvement1 14
Social Intent
Question Category Max Score General CommentScore %Accountability 4 Needs substantial improvement0 0
Management 10 Needs substantial improvement2 20
Policy 6 Needs improvement2 33
Social Demographic 2 Needs substantial improvement0 0
Vision 4 Good2 50
Social Reporting
Question Category Max Score General CommentScore %Human Rights 77 Needs substantial improvement0 0
Management 7 Needs substantial improvement0 0
Qualitative Social 35 Needs substantial improvement3 9
Quantitative Social 42 Needs substantial improvement0 0
www.roberts.cmc.edu 36 Transportation and Logistics Sectors
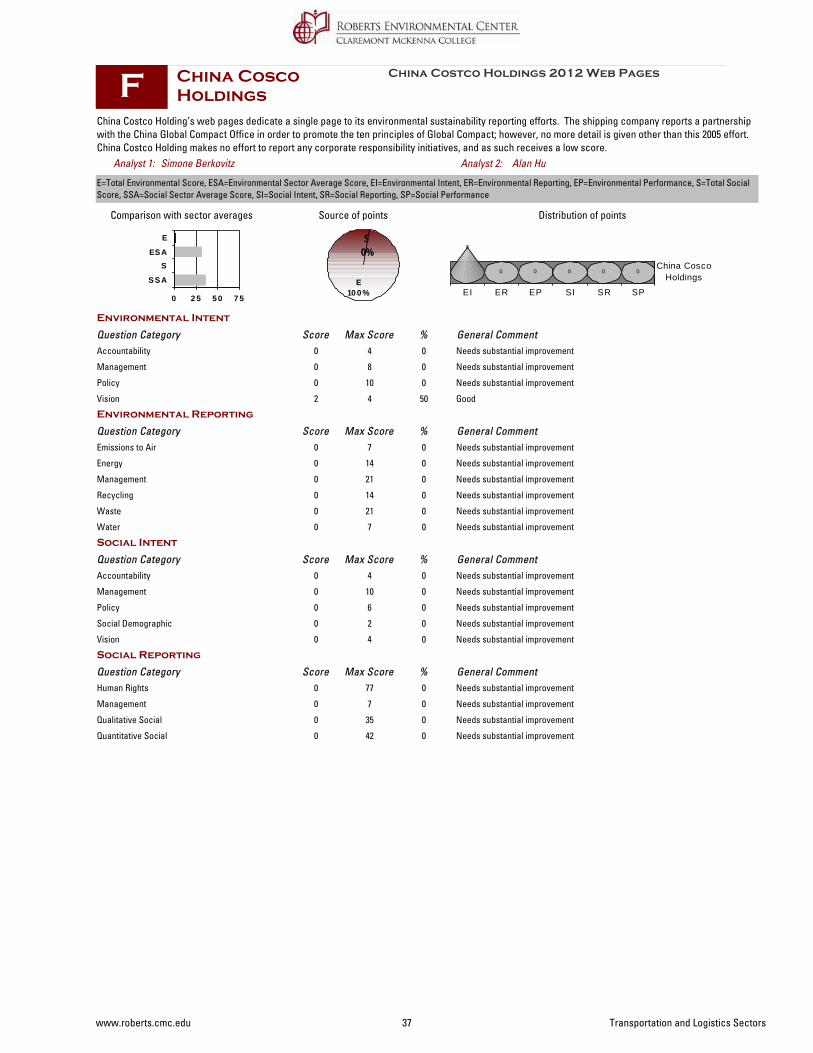
China Cosco Holdings
0 2 5 5 0 7 5
SSA
SESA
E
China Costco Holding’s web pages dedicate a single page to its environmental sustainability reporting efforts. The shipping company reports a partnership with the China Global Compact Office in order to promote the ten principles of Global Compact; however, no more detail is given other than this 2005 effort. China Costco Holding makes no effort to report any corporate responsibility initiatives, and as such receives a low score.
S0%
E10 0 %
China Costco Holdings 2012 Web Pages
Comparison with sector averages Source of points
F
Alan HuSimone Berkovitz
Distribution of points
E=Total Environmental Score, ESA=Environmental Sector Average Score, EI=Environmental Intent, ER=Environmental Reporting, EP=Environmental Performance, S=Total Social Score, SSA=Social Sector Average Score, SI=Social Intent, SR=Social Reporting, SP=Social Performance
EI ER EP SI SR SP
China CoscoHoldings
8
0 0 0 0 0
Analyst 1: Analyst 2:
Environmental Intent
Question Category Max Score General CommentScore %Accountability 4 Needs substantial improvement0 0
Management 8 Needs substantial improvement0 0
Policy 10 Needs substantial improvement0 0
Vision 4 Good2 50
Environmental Reporting
Question Category Max Score General CommentScore %Emissions to Air 7 Needs substantial improvement0 0
Energy 14 Needs substantial improvement0 0
Management 21 Needs substantial improvement0 0
Recycling 14 Needs substantial improvement0 0
Waste 21 Needs substantial improvement0 0
Water 7 Needs substantial improvement0 0
Social Intent
Question Category Max Score General CommentScore %Accountability 4 Needs substantial improvement0 0
Management 10 Needs substantial improvement0 0
Policy 6 Needs substantial improvement0 0
Social Demographic 2 Needs substantial improvement0 0
Vision 4 Needs substantial improvement0 0
Social Reporting
Question Category Max Score General CommentScore %Human Rights 77 Needs substantial improvement0 0
Management 7 Needs substantial improvement0 0
Qualitative Social 35 Needs substantial improvement0 0
Quantitative Social 42 Needs substantial improvement0 0
www.roberts.cmc.edu 37 Transportation and Logistics Sectors
Delta Airlines
0 2 5 5 0 7 5
SSA
SESA
E
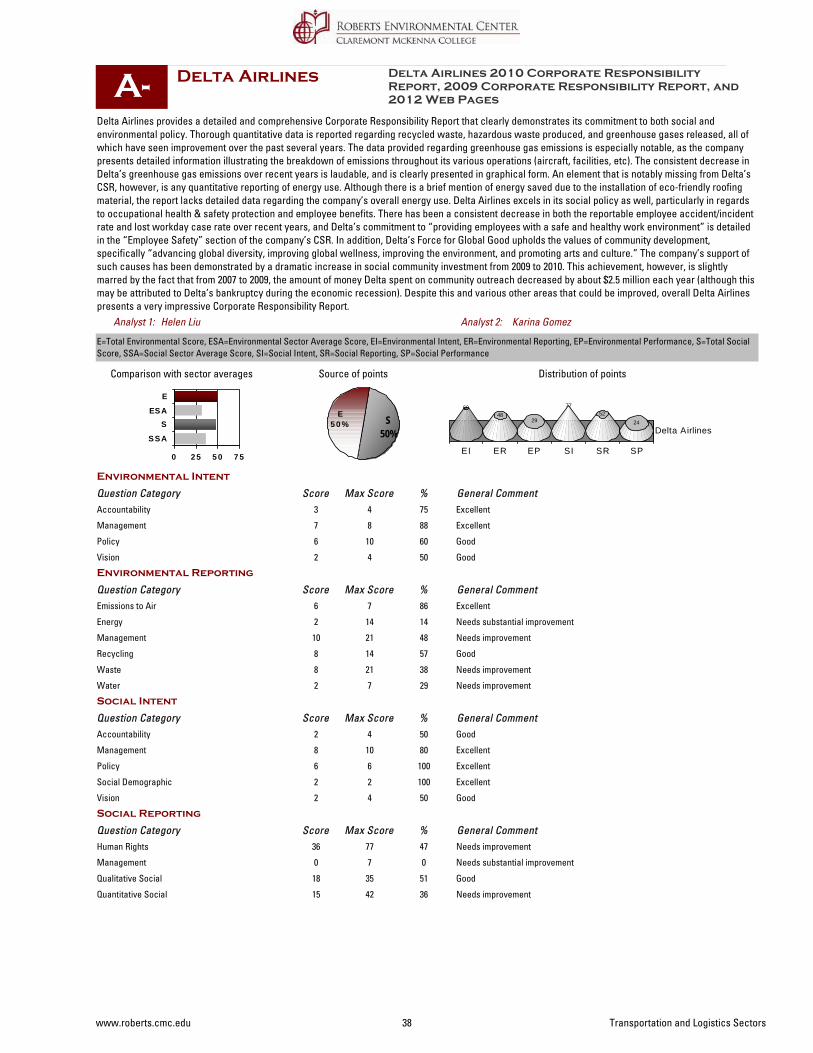
Delta Airlines provides a detailed and comprehensive Corporate Responsibility Report that clearly demonstrates its commitment to both social and environmental policy. Thorough quantitative data is reported regarding recycled waste, hazardous waste produced, and greenhouse gases released, all of which have seen improvement over the past several years. The data provided regarding greenhouse gas emissions is especially notable, as the company presents detailed information illustrating the breakdown of emissions throughout its various operations (aircraft, facilities, etc). The consistent decrease in Delta’s greenhouse gas emissions over recent years is laudable, and is clearly presented in graphical form. An element that is notably missing from Delta’s CSR, however, is any quantitative reporting of energy use. Although there is a brief mention of energy saved due to the installation of eco-friendly roofing material, the report lacks detailed data regarding the company’s overall energy use. Delta Airlines excels in its social policy as well, particularly in regards to occupational health & safety protection and employee benefits. There has been a consistent decrease in both the reportable employee accident/incident rate and lost workday case rate over recent years, and Delta’s commitment to “providing employees with a safe and healthy work environment” is detailed in the “Employee Safety” section of the company’s CSR. In addition, Delta’s Force for Global Good upholds the values of community development, specifically “advancing global diversity, improving global wellness, improving the environment, and promoting arts and culture.” The company’s support of such causes has been demonstrated by a dramatic increase in social community investment from 2009 to 2010. This achievement, however, is slightly marred by the fact that from 2007 to 2009, the amount of money Delta spent on community outreach decreased by about $2.5 million each year (although this may be attributed to Delta’s bankruptcy during the economic recession). Despite this and various other areas that could be improved, overall Delta Airlines presents a very impressive Corporate Responsibility Report.
S50%
E5 0 %
Delta Airlines 2010 Corporate Responsibility Report, 2009 Corporate Responsibility Report, and 2012 Web Pages
Comparison with sector averages Source of points
A-
Karina GomezHelen Liu
Distribution of points
E=Total Environmental Score, ESA=Environmental Sector Average Score, EI=Environmental Intent, ER=Environmental Reporting, EP=Environmental Performance, S=Total Social Score, SSA=Social Sector Average Score, SI=Social Intent, SR=Social Reporting, SP=Social Performance
EI ER EP SI SR SP
Delta Airlines
6948
29
7752
24
Analyst 1: Analyst 2:
Environmental Intent
Question Category Max Score General CommentScore %Accountability 4 Excellent3 75
Management 8 Excellent7 88
Policy 10 Good6 60
Vision 4 Good2 50
Environmental Reporting
Question Category Max Score General CommentScore %Emissions to Air 7 Excellent6 86
Energy 14 Needs substantial improvement2 14
Management 21 Needs improvement10 48
Recycling 14 Good8 57
Waste 21 Needs improvement8 38
Water 7 Needs improvement2 29
Social Intent
Question Category Max Score General CommentScore %Accountability 4 Good2 50
Management 10 Excellent8 80
Policy 6 Excellent6 100
Social Demographic 2 Excellent2 100
Vision 4 Good2 50
Social Reporting
Question Category Max Score General CommentScore %Human Rights 77 Needs improvement36 47
Management 7 Needs substantial improvement0 0
Qualitative Social 35 Good18 51
Quantitative Social 42 Needs improvement15 36
www.roberts.cmc.edu 38 Transportation and Logistics Sectors
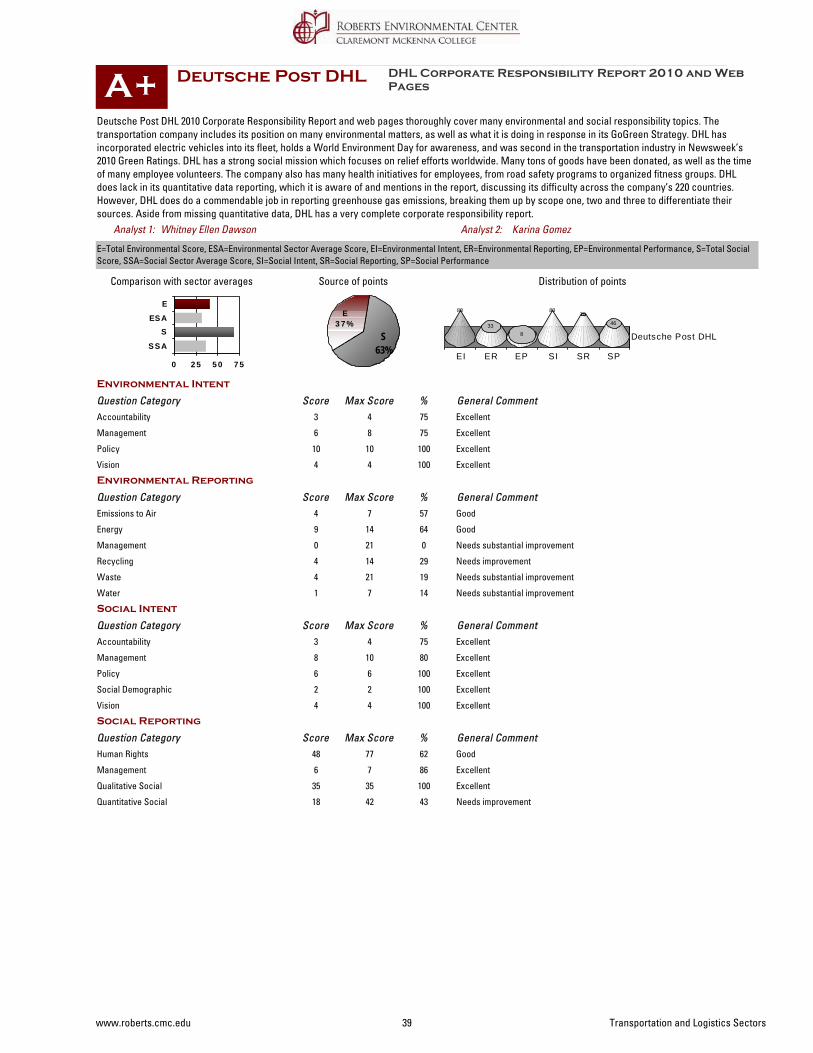
Deutsche Post DHL
0 2 5 5 0 7 5
SSA
SESA
E
Deutsche Post DHL 2010 Corporate Responsibility Report and web pages thoroughly cover many environmental and social responsibility topics. The transportation company includes its position on many environmental matters, as well as what it is doing in response in its GoGreen Strategy. DHL has incorporated electric vehicles into its fleet, holds a World Environment Day for awareness, and was second in the transportation industry in Newsweek’s 2010 Green Ratings. DHL has a strong social mission which focuses on relief efforts worldwide. Many tons of goods have been donated, as well as the time of many employee volunteers. The company also has many health initiatives for employees, from road safety programs to organized fitness groups. DHL does lack in its quantitative data reporting, which it is aware of and mentions in the report, discussing its difficulty across the company’s 220 countries. However, DHL does do a commendable job in reporting greenhouse gas emissions, breaking them up by scope one, two and three to differentiate their sources. Aside from missing quantitative data, DHL has a very complete corporate responsibility report.
S63%
E3 7 %
DHL Corporate Responsibility Report 2010 and Web Pages
Comparison with sector averages Source of points
A+
Karina GomezWhitney Ellen Dawson
Distribution of points
E=Total Environmental Score, ESA=Environmental Sector Average Score, EI=Environmental Intent, ER=Environmental Reporting, EP=Environmental Performance, S=Total Social Score, SSA=Social Sector Average Score, SI=Social Intent, SR=Social Reporting, SP=Social Performance
EI ER EP SI SR SP
Deutsche Post DHL
88
338
8875
46
Analyst 1: Analyst 2:
Environmental Intent
Question Category Max Score General CommentScore %Accountability 4 Excellent3 75
Management 8 Excellent6 75
Policy 10 Excellent10 100
Vision 4 Excellent4 100
Environmental Reporting
Question Category Max Score General CommentScore %Emissions to Air 7 Good4 57
Energy 14 Good9 64
Management 21 Needs substantial improvement0 0
Recycling 14 Needs improvement4 29
Waste 21 Needs substantial improvement4 19
Water 7 Needs substantial improvement1 14
Social Intent
Question Category Max Score General CommentScore %Accountability 4 Excellent3 75
Management 10 Excellent8 80
Policy 6 Excellent6 100
Social Demographic 2 Excellent2 100
Vision 4 Excellent4 100
Social Reporting
Question Category Max Score General CommentScore %Human Rights 77 Good48 62
Management 7 Excellent6 86
Qualitative Social 35 Excellent35 100
Quantitative Social 42 Needs improvement18 43
www.roberts.cmc.edu 39 Transportation and Logistics Sectors
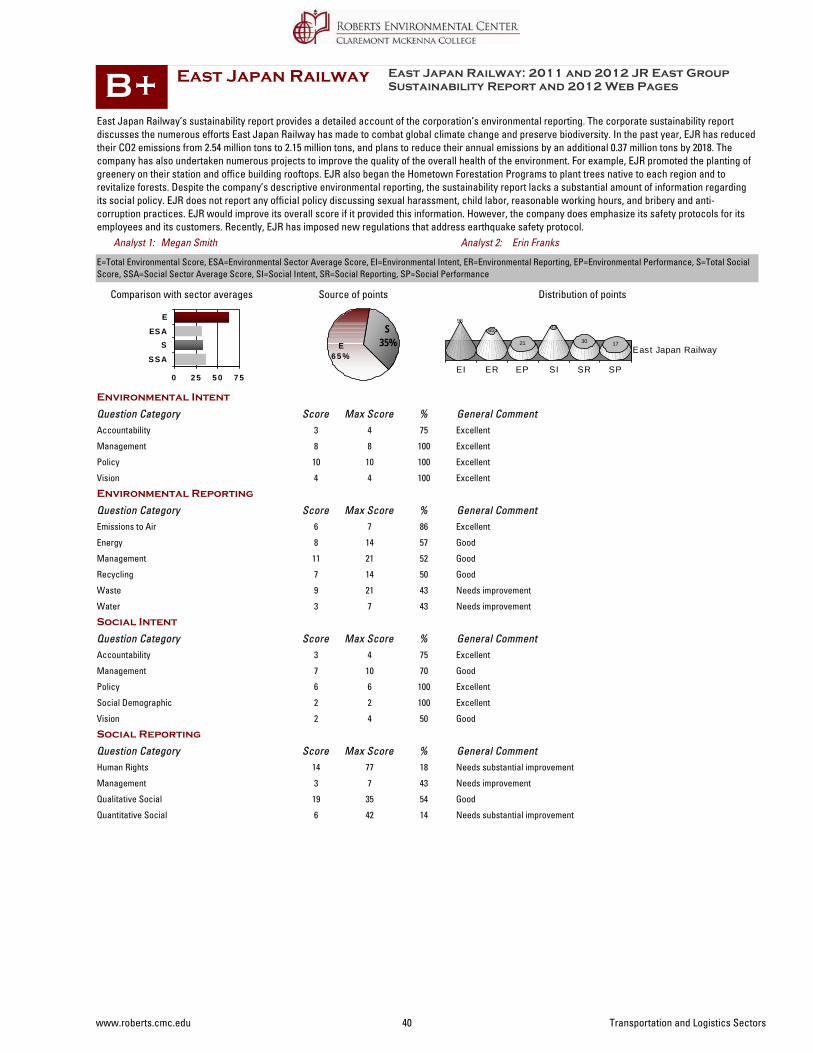
East Japan Railway
0 2 5 5 0 7 5
SSA
SESA
E
East Japan Railway’s sustainability report provides a detailed account of the corporation’s environmental reporting. The corporate sustainability report discusses the numerous efforts East Japan Railway has made to combat global climate change and preserve biodiversity. In the past year, EJR has reduced their CO2 emissions from 2.54 million tons to 2.15 million tons, and plans to reduce their annual emissions by an additional 0.37 million tons by 2018. The company has also undertaken numerous projects to improve the quality of the overall health of the environment. For example, EJR promoted the planting of greenery on their station and office building rooftops. EJR also began the Hometown Forestation Programs to plant trees native to each region and to revitalize forests. Despite the company’s descriptive environmental reporting, the sustainability report lacks a substantial amount of information regarding its social policy. EJR does not report any official policy discussing sexual harassment, child labor, reasonable working hours, and bribery and anti-corruption practices. EJR would improve its overall score if it provided this information. However, the company does emphasize its safety protocols for its employees and its customers. Recently, EJR has imposed new regulations that address earthquake safety protocol.
S35%E
6 5 %
East Japan Railway: 2011 and 2012 JR East Group Sustainability Report and 2012 Web Pages
Comparison with sector averages Source of points
B+
Erin FranksMegan Smith
Distribution of points
E=Total Environmental Score, ESA=Environmental Sector Average Score, EI=Environmental Intent, ER=Environmental Reporting, EP=Environmental Performance, S=Total Social Score, SSA=Social Sector Average Score, SI=Social Intent, SR=Social Reporting, SP=Social Performance
EI ER EP SI SR SP
East Japan Railway
96
65
21
77
30 17
Analyst 1: Analyst 2:
Environmental Intent
Question Category Max Score General CommentScore %Accountability 4 Excellent3 75
Management 8 Excellent8 100
Policy 10 Excellent10 100
Vision 4 Excellent4 100
Environmental Reporting
Question Category Max Score General CommentScore %Emissions to Air 7 Excellent6 86
Energy 14 Good8 57
Management 21 Good11 52
Recycling 14 Good7 50
Waste 21 Needs improvement9 43
Water 7 Needs improvement3 43
Social Intent
Question Category Max Score General CommentScore %Accountability 4 Excellent3 75
Management 10 Good7 70
Policy 6 Excellent6 100
Social Demographic 2 Excellent2 100
Vision 4 Good2 50
Social Reporting
Question Category Max Score General CommentScore %Human Rights 77 Needs substantial improvement14 18
Management 7 Needs improvement3 43
Qualitative Social 35 Good19 54
Quantitative Social 42 Needs substantial improvement6 14
www.roberts.cmc.edu 40 Transportation and Logistics Sectors
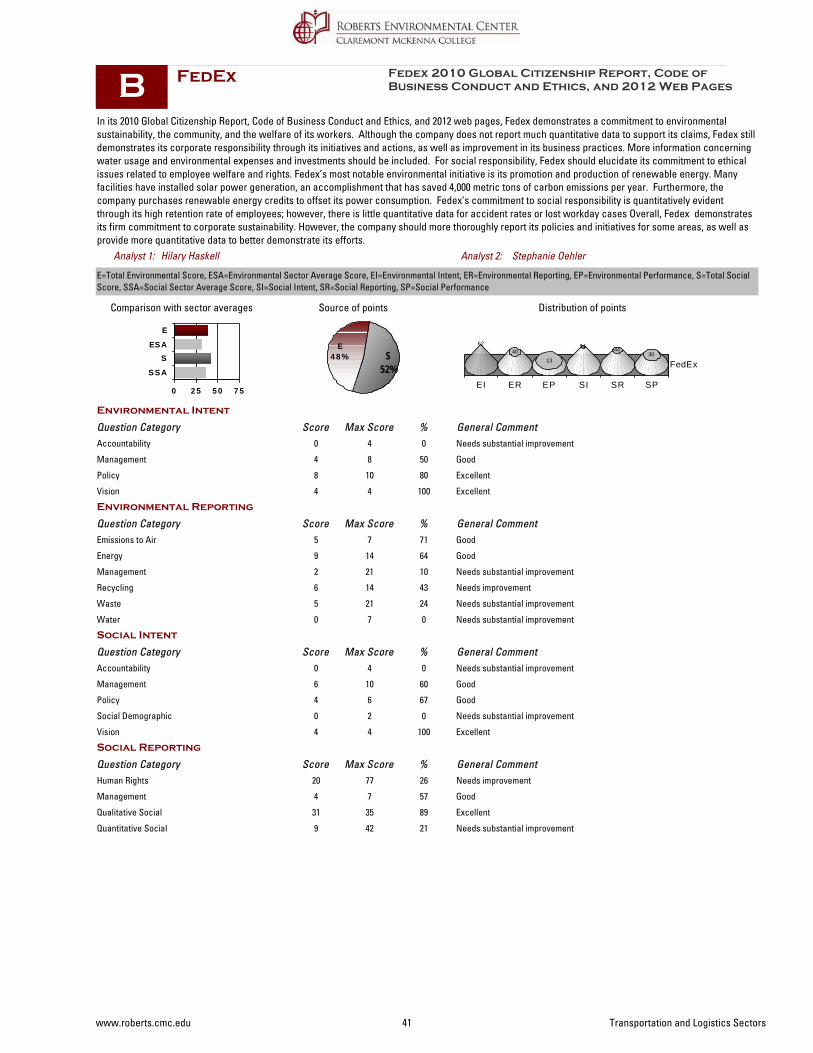
FedEx
0 2 5 5 0 7 5
SSA
SESA
E
In its 2010 Global Citizenship Report, Code of Business Conduct and Ethics, and 2012 web pages, Fedex demonstrates a commitment to environmental sustainability, the community, and the welfare of its workers. Although the company does not report much quantitative data to support its claims, Fedex still demonstrates its corporate responsibility through its initiatives and actions, as well as improvement in its business practices. More information concerning water usage and environmental expenses and investments should be included. For social responsibility, Fedex should elucidate its commitment to ethical issues related to employee welfare and rights. Fedex’s most notable environmental initiative is its promotion and production of renewable energy. Many facilities have installed solar power generation, an accomplishment that has saved 4,000 metric tons of carbon emissions per year. Furthermore, the company purchases renewable energy credits to offset its power consumption. Fedex’s commitment to social responsibility is quantitatively evident through its high retention rate of employees; however, there is little quantitative data for accident rates or lost workday cases Overall, Fedex demonstrates its firm commitment to corporate sustainability. However, the company should more thoroughly report its policies and initiatives for some areas, as well as provide more quantitative data to better demonstrate its efforts.
S52%
E4 8 %
Fedex 2010 Global Citizenship Report, Code of Business Conduct and Ethics, and 2012 Web Pages
Comparison with sector averages Source of points
B
Stephanie OehlerHilary Haskell
Distribution of points
E=Total Environmental Score, ESA=Environmental Sector Average Score, EI=Environmental Intent, ER=Environmental Reporting, EP=Environmental Performance, S=Total Social Score, SSA=Social Sector Average Score, SI=Social Intent, SR=Social Reporting, SP=Social Performance
EI ER EP SI SR SP
FedEx
6240
13
54 4430
Analyst 1: Analyst 2:
Environmental Intent
Question Category Max Score General CommentScore %Accountability 4 Needs substantial improvement0 0
Management 8 Good4 50
Policy 10 Excellent8 80
Vision 4 Excellent4 100
Environmental Reporting
Question Category Max Score General CommentScore %Emissions to Air 7 Good5 71
Energy 14 Good9 64
Management 21 Needs substantial improvement2 10
Recycling 14 Needs improvement6 43
Waste 21 Needs substantial improvement5 24
Water 7 Needs substantial improvement0 0
Social Intent
Question Category Max Score General CommentScore %Accountability 4 Needs substantial improvement0 0
Management 10 Good6 60
Policy 6 Good4 67
Social Demographic 2 Needs substantial improvement0 0
Vision 4 Excellent4 100
Social Reporting
Question Category Max Score General CommentScore %Human Rights 77 Needs improvement20 26
Management 7 Good4 57
Qualitative Social 35 Excellent31 89
Quantitative Social 42 Needs substantial improvement9 21
www.roberts.cmc.edu 41 Transportation and Logistics Sectors
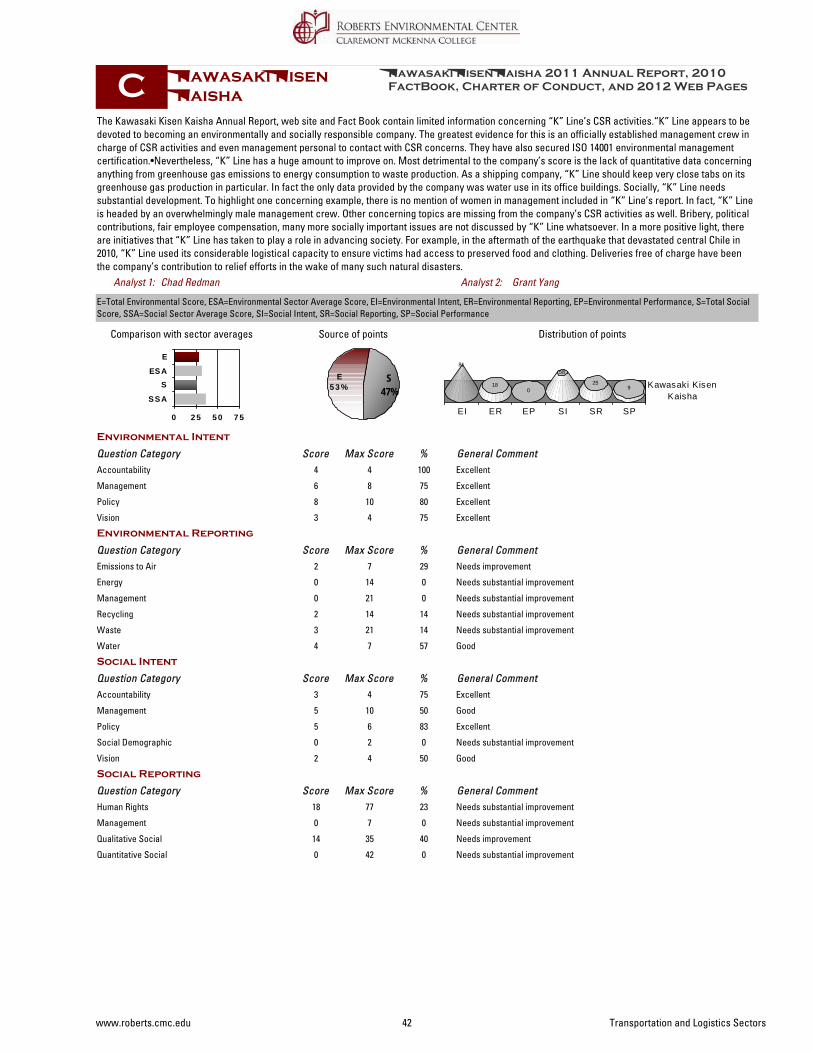
Kawasaki Kisen Kaisha
0 2 5 5 0 7 5
SSA
SESA
E
The Kawasaki Kisen Kaisha Annual Report, web site and Fact Book contain limited information concerning “K” Line’s CSR activities.“K” Line appears to be devoted to becoming an environmentally and socially responsible company. The greatest evidence for this is an officially established management crew in charge of CSR activities and even management personal to contact with CSR concerns. They have also secured ISO 14001 environmental management certification.•Nevertheless, “K” Line has a huge amount to improve on. Most detrimental to the company’s score is the lack of quantitative data concerning anything from greenhouse gas emissions to energy consumption to waste production. As a shipping company, “K” Line should keep very close tabs on its greenhouse gas production in particular. In fact the only data provided by the company was water use in its office buildings. Socially, “K” Line needs substantial development. To highlight one concerning example, there is no mention of women in management included in “K” Line’s report. In fact, “K” Line is headed by an overwhelmingly male management crew. Other concerning topics are missing from the company’s CSR activities as well. Bribery, political contributions, fair employee compensation, many more socially important issues are not discussed by “K” Line whatsoever. In a more positive light, there are initiatives that “K” Line has taken to play a role in advancing society. For example, in the aftermath of the earthquake that devastated central Chile in 2010, “K” Line used its considerable logistical capacity to ensure victims had access to preserved food and clothing. Deliveries free of charge have been the company’s contribution to relief efforts in the wake of many such natural disasters.
S47%
E5 3 %
Kawasaki Kisen Kaisha 2011 Annual Report, 2010 FactBook, Charter of Conduct, and 2012 Web Pages
Comparison with sector averages Source of points
C
Grant YangChad Redman
Distribution of points
E=Total Environmental Score, ESA=Environmental Sector Average Score, EI=Environmental Intent, ER=Environmental Reporting, EP=Environmental Performance, S=Total Social Score, SSA=Social Sector Average Score, SI=Social Intent, SR=Social Reporting, SP=Social Performance
EI ER EP SI SR SP
Kawasaki KisenKaisha
81
180
58
259
Analyst 1: Analyst 2:
Environmental Intent
Question Category Max Score General CommentScore %Accountability 4 Excellent4 100
Management 8 Excellent6 75
Policy 10 Excellent8 80
Vision 4 Excellent3 75
Environmental Reporting
Question Category Max Score General CommentScore %Emissions to Air 7 Needs improvement2 29
Energy 14 Needs substantial improvement0 0
Management 21 Needs substantial improvement0 0
Recycling 14 Needs substantial improvement2 14
Waste 21 Needs substantial improvement3 14
Water 7 Good4 57
Social Intent
Question Category Max Score General CommentScore %Accountability 4 Excellent3 75
Management 10 Good5 50
Policy 6 Excellent5 83
Social Demographic 2 Needs substantial improvement0 0
Vision 4 Good2 50
Social Reporting
Question Category Max Score General CommentScore %Human Rights 77 Needs substantial improvement18 23
Management 7 Needs substantial improvement0 0
Qualitative Social 35 Needs improvement14 40
Quantitative Social 42 Needs substantial improvement0 0
www.roberts.cmc.edu 42 Transportation and Logistics Sectors

Kühne & Nagel Intl
0 2 5 5 0 7 5
SSA
SESA
E
While Kuehne and Nagel dedicate a majority of its report towards the discussion of environmental sustainability, the report falls short of depicting an accurate portrait of the company’s environmental impact. Although the company attempts to communicate its impact with its suppliers and customers, Kuehne and Nagel’s Code of Conduct, 2012 Sustainability Report, and 2012 web pages need to add more information. The company omits discussion of any environmental or social impediments. In terms of the environment, the report overlooks issues such as climate change, the maintenance of biodiversity, and ecosystem and habitat conservation. Not one social challenges is mentioned; the company only states its respect for cultural diversity. The Code of Conduct emphasizes the company’s views on anti-corruption and bribery through the elaboration of policies, but little more is discussed. The company never mentions a policy on sexual harassment, free association, or the elimination of forced labo and child labor. The company provides explanations for carbon calculators, claiming the calculators provide accurate readings, yet does not validate this statement with quantitative evidence; Kuehne & Nagel only reports current quantitative data for renewable energy used and notes the greenhouse gases emissions improvement. Similarly, the company discusses the desire for the reduction of carbon emissions and energy usages. To improve the report, the company must disclose more information: quantitative data to accurately demonstrate its environmental impact, policies for workers’ rights, greater discussion of environmental and social challenges, and Kuehne and Nagel’s plans to combat these challenges.
S50%
E5 0 %
Kuehne and Nagel 2012 Sustainability Report, Code of Conduct, and 2012 Web Pages
Comparison with sector averages Source of points
C-
Erin FranksSierra Gibson
Distribution of points
E=Total Environmental Score, ESA=Environmental Sector Average Score, EI=Environmental Intent, ER=Environmental Reporting, EP=Environmental Performance, S=Total Social Score, SSA=Social Sector Average Score, SI=Social Intent, SR=Social Reporting, SP=Social Performance
EI ER EP SI SR SP
Kühne & Nagel Intl
46
17 13
46
25
2
Analyst 1: Analyst 2:
Environmental Intent
Question Category Max Score General CommentScore %Accountability 4 Good2 50
Management 8 Good5 63
Policy 10 Needs improvement3 30
Vision 4 Good2 50
Environmental Reporting
Question Category Max Score General CommentScore %Emissions to Air 7 Good4 57
Energy 14 Needs improvement4 29
Management 21 Needs substantial improvement0 0
Recycling 14 Needs substantial improvement3 21
Waste 21 Needs substantial improvement0 0
Water 7 Needs improvement2 29
Social Intent
Question Category Max Score General CommentScore %Accountability 4 Good2 50
Management 10 Needs improvement4 40
Policy 6 Good4 67
Social Demographic 2 Needs substantial improvement0 0
Vision 4 Good2 50
Social Reporting
Question Category Max Score General CommentScore %Human Rights 77 Needs improvement20 26
Management 7 Needs substantial improvement0 0
Qualitative Social 35 Needs substantial improvement8 23
Quantitative Social 42 Needs substantial improvement2 5
www.roberts.cmc.edu 43 Transportation and Logistics Sectors
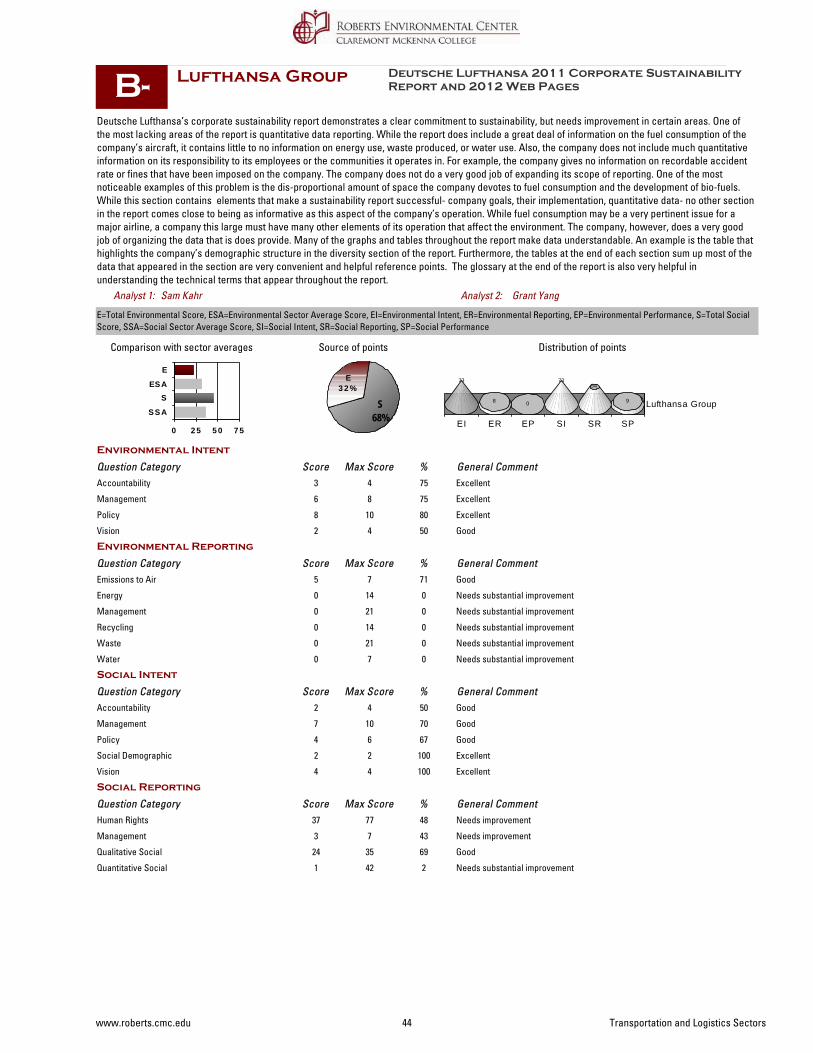
Lufthansa Group
0 2 5 5 0 7 5
SSA
SESA
E
Deutsche Lufthansa’s corporate sustainability report demonstrates a clear commitment to sustainability, but needs improvement in certain areas. One of the most lacking areas of the report is quantitative data reporting. While the report does include a great deal of information on the fuel consumption of the company’s aircraft, it contains little to no information on energy use, waste produced, or water use. Also, the company does not include much quantitative information on its responsibility to its employees or the communities it operates in. For example, the company gives no information on recordable accident rate or fines that have been imposed on the company. The company does not do a very good job of expanding its scope of reporting. One of the most noticeable examples of this problem is the dis-proportional amount of space the company devotes to fuel consumption and the development of bio-fuels. While this section contains elements that make a sustainability report successful- company goals, their implementation, quantitative data- no other section in the report comes close to being as informative as this aspect of the company’s operation. While fuel consumption may be a very pertinent issue for a major airline, a company this large must have many other elements of its operation that affect the environment. The company, however, does a very good job of organizing the data that is does provide. Many of the graphs and tables throughout the report make data understandable. An example is the table that highlights the company’s demographic structure in the diversity section of the report. Furthermore, the tables at the end of each section sum up most of the data that appeared in the section are very convenient and helpful reference points. The glossary at the end of the report is also very helpful in understanding the technical terms that appear throughout the report.
S68%
E3 2 %
Deutsche Lufthansa 2011 Corporate Sustainability Report and 2012 Web Pages
Comparison with sector averages Source of points
B-
Grant YangSam Kahr
Distribution of points
E=Total Environmental Score, ESA=Environmental Sector Average Score, EI=Environmental Intent, ER=Environmental Reporting, EP=Environmental Performance, S=Total Social Score, SSA=Social Sector Average Score, SI=Social Intent, SR=Social Reporting, SP=Social Performance
EI ER EP SI SR SP
Lufthansa Group
73
8 0
7354
9
Analyst 1: Analyst 2:
Environmental Intent
Question Category Max Score General CommentScore %Accountability 4 Excellent3 75
Management 8 Excellent6 75
Policy 10 Excellent8 80
Vision 4 Good2 50
Environmental Reporting
Question Category Max Score General CommentScore %Emissions to Air 7 Good5 71
Energy 14 Needs substantial improvement0 0
Management 21 Needs substantial improvement0 0
Recycling 14 Needs substantial improvement0 0
Waste 21 Needs substantial improvement0 0
Water 7 Needs substantial improvement0 0
Social Intent
Question Category Max Score General CommentScore %Accountability 4 Good2 50
Management 10 Good7 70
Policy 6 Good4 67
Social Demographic 2 Excellent2 100
Vision 4 Excellent4 100
Social Reporting
Question Category Max Score General CommentScore %Human Rights 77 Needs improvement37 48
Management 7 Needs improvement3 43
Qualitative Social 35 Good24 69
Quantitative Social 42 Needs substantial improvement1 2
www.roberts.cmc.edu 44 Transportation and Logistics Sectors
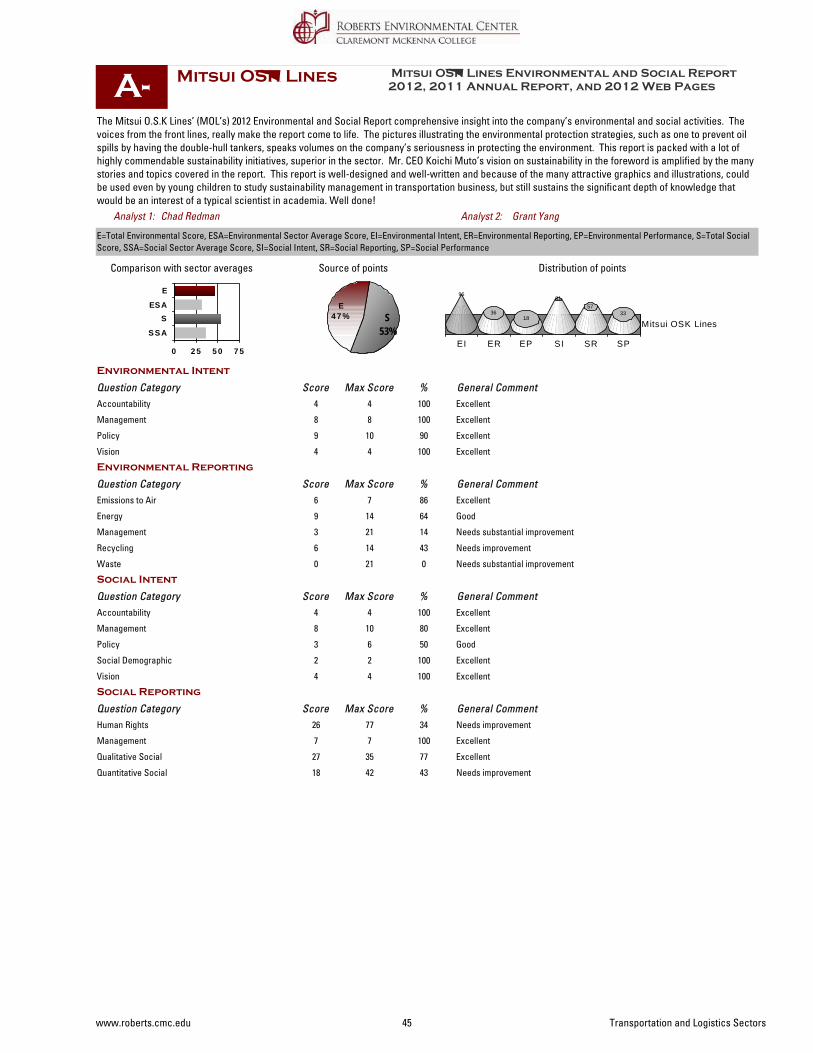
Mitsui OSK Lines
0 2 5 5 0 7 5
SSA
SESA
E
The Mitsui O.S.K Lines’ (MOL’s) 2012 Environmental and Social Report comprehensive insight into the company’s environmental and social activities. The voices from the front lines, really make the report come to life. The pictures illustrating the environmental protection strategies, such as one to prevent oil spills by having the double-hull tankers, speaks volumes on the company’s seriousness in protecting the environment. This report is packed with a lot of highly commendable sustainability initiatives, superior in the sector. Mr. CEO Koichi Muto’s vision on sustainability in the foreword is amplified by the many stories and topics covered in the report. This report is well-designed and well-written and because of the many attractive graphics and illustrations, could be used even by young children to study sustainability management in transportation business, but still sustains the significant depth of knowledge that would be an interest of a typical scientist in academia. Well done!
S53%
E4 7 %
Mitsui OSK Lines Environmental and Social Report 2012, 2011 Annual Report, and 2012 Web Pages
Comparison with sector averages Source of points
A-
Grant YangChad Redman
Distribution of points
E=Total Environmental Score, ESA=Environmental Sector Average Score, EI=Environmental Intent, ER=Environmental Reporting, EP=Environmental Performance, S=Total Social Score, SSA=Social Sector Average Score, SI=Social Intent, SR=Social Reporting, SP=Social Performance
EI ER EP SI SR SP
Mitsui OSK Lines
96
3618
8157
33
Analyst 1: Analyst 2:
Environmental Intent
Question Category Max Score General CommentScore %Accountability 4 Excellent4 100
Management 8 Excellent8 100
Policy 10 Excellent9 90
Vision 4 Excellent4 100
Environmental Reporting
Question Category Max Score General CommentScore %Emissions to Air 7 Excellent6 86
Energy 14 Good9 64
Management 21 Needs substantial improvement3 14
Recycling 14 Needs improvement6 43
Waste 21 Needs substantial improvement0 0
Social Intent
Question Category Max Score General CommentScore %Accountability 4 Excellent4 100
Management 10 Excellent8 80
Policy 6 Good3 50
Social Demographic 2 Excellent2 100
Vision 4 Excellent4 100
Social Reporting
Question Category Max Score General CommentScore %Human Rights 77 Needs improvement26 34
Management 7 Excellent7 100
Qualitative Social 35 Excellent27 77
Quantitative Social 42 Needs improvement18 43
www.roberts.cmc.edu 45 Transportation and Logistics Sectors
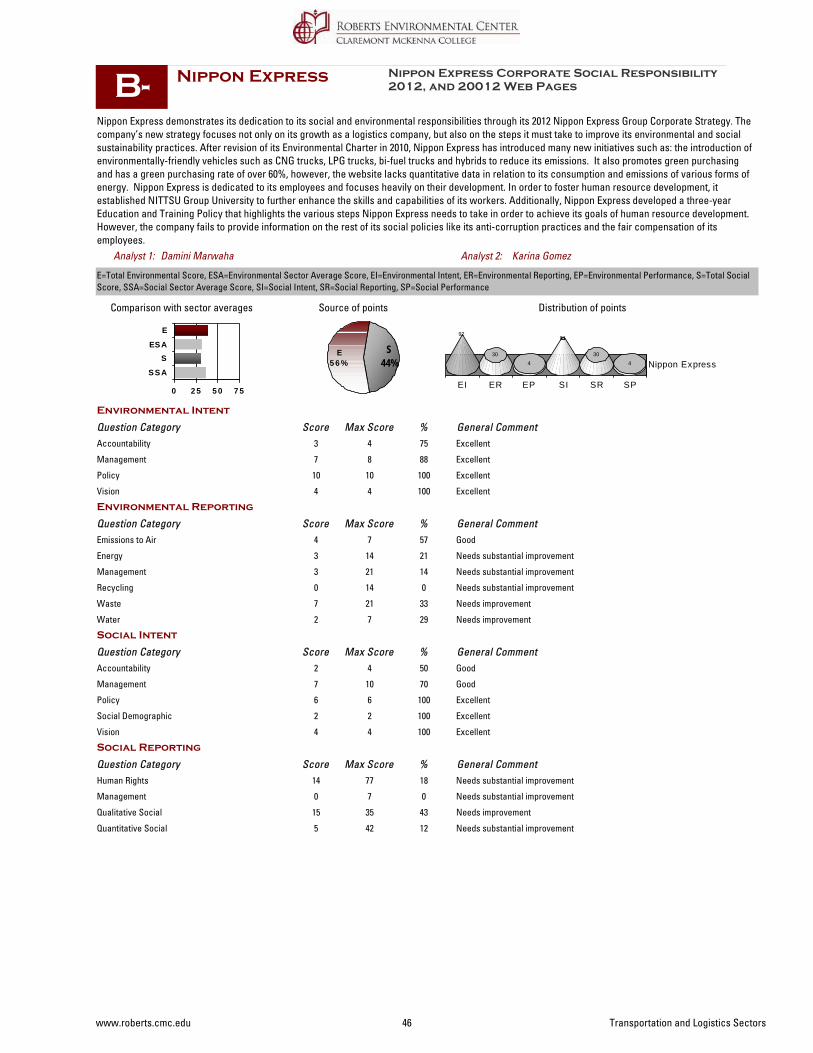
Nippon Express
0 2 5 5 0 7 5
SSA
SESA
E
Nippon Express demonstrates its dedication to its social and environmental responsibilities through its 2012 Nippon Express Group Corporate Strategy. The company’s new strategy focuses not only on its growth as a logistics company, but also on the steps it must take to improve its environmental and social sustainability practices. After revision of its Environmental Charter in 2010, Nippon Express has introduced many new initiatives such as: the introduction of environmentally-friendly vehicles such as CNG trucks, LPG trucks, bi-fuel trucks and hybrids to reduce its emissions. It also promotes green purchasing and has a green purchasing rate of over 60%, however, the website lacks quantitative data in relation to its consumption and emissions of various forms of energy. Nippon Express is dedicated to its employees and focuses heavily on their development. In order to foster human resource development, it established NITTSU Group University to further enhance the skills and capabilities of its workers. Additionally, Nippon Express developed a three-year Education and Training Policy that highlights the various steps Nippon Express needs to take in order to achieve its goals of human resource development. However, the company fails to provide information on the rest of its social policies like its anti-corruption practices and the fair compensation of its employees.
S44%
E5 6 %
Nippon Express Corporate Social Responsibility 2012, and 20012 Web Pages
Comparison with sector averages Source of points
B-
Karina GomezDamini Marwaha
Distribution of points
E=Total Environmental Score, ESA=Environmental Sector Average Score, EI=Environmental Intent, ER=Environmental Reporting, EP=Environmental Performance, S=Total Social Score, SSA=Social Sector Average Score, SI=Social Intent, SR=Social Reporting, SP=Social Performance
EI ER EP SI SR SP
Nippon Express
92
304
81
304
Analyst 1: Analyst 2:
Environmental Intent
Question Category Max Score General CommentScore %Accountability 4 Excellent3 75
Management 8 Excellent7 88
Policy 10 Excellent10 100
Vision 4 Excellent4 100
Environmental Reporting
Question Category Max Score General CommentScore %Emissions to Air 7 Good4 57
Energy 14 Needs substantial improvement3 21
Management 21 Needs substantial improvement3 14
Recycling 14 Needs substantial improvement0 0
Waste 21 Needs improvement7 33
Water 7 Needs improvement2 29
Social Intent
Question Category Max Score General CommentScore %Accountability 4 Good2 50
Management 10 Good7 70
Policy 6 Excellent6 100
Social Demographic 2 Excellent2 100
Vision 4 Excellent4 100
Social Reporting
Question Category Max Score General CommentScore %Human Rights 77 Needs substantial improvement14 18
Management 7 Needs substantial improvement0 0
Qualitative Social 35 Needs improvement15 43
Quantitative Social 42 Needs substantial improvement5 12
www.roberts.cmc.edu 46 Transportation and Logistics Sectors
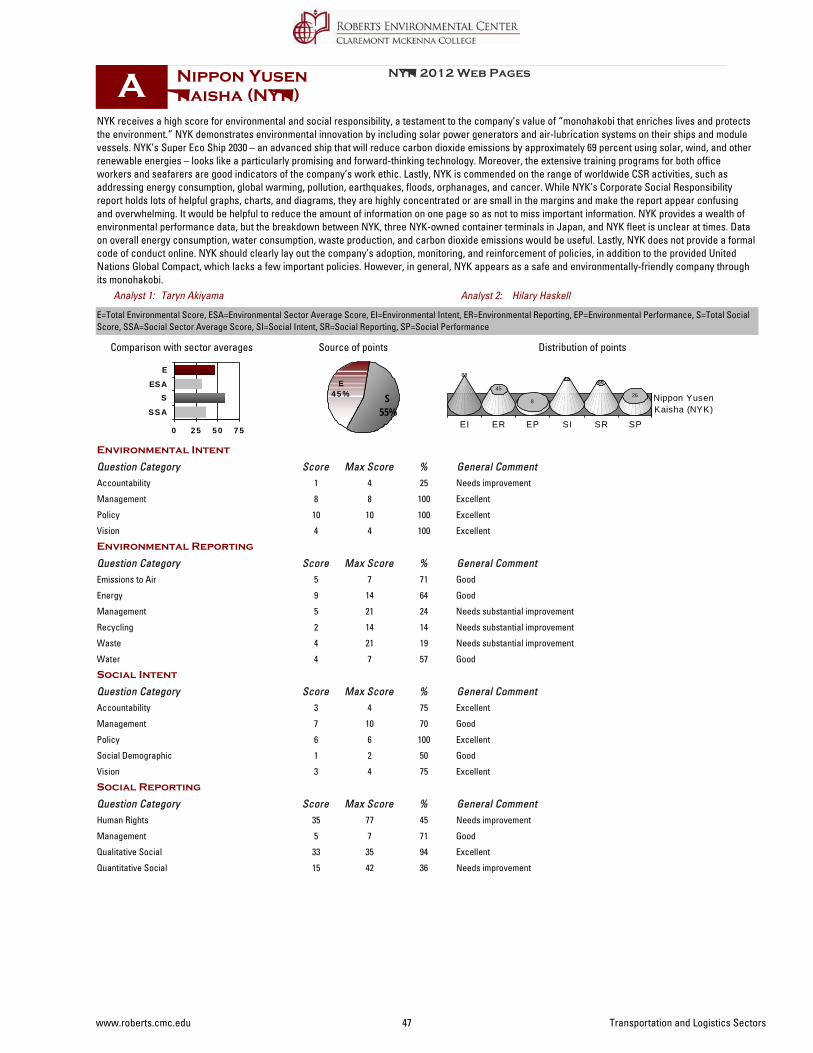
Nippon Yusen Kaisha (NYK)
0 2 5 5 0 7 5
SSA
SESA
E
NYK receives a high score for environmental and social responsibility, a testament to the company’s value of “monohakobi that enriches lives and protects the environment.” NYK demonstrates environmental innovation by including solar power generators and air-lubrication systems on their ships and module vessels. NYK’s Super Eco Ship 2030 – an advanced ship that will reduce carbon dioxide emissions by approximately 69 percent using solar, wind, and other renewable energies – looks like a particularly promising and forward-thinking technology. Moreover, the extensive training programs for both office workers and seafarers are good indicators of the company’s work ethic. Lastly, NYK is commended on the range of worldwide CSR activities, such as addressing energy consumption, global warming, pollution, earthquakes, floods, orphanages, and cancer. While NYK’s Corporate Social Responsibility report holds lots of helpful graphs, charts, and diagrams, they are highly concentrated or are small in the margins and make the report appear confusing and overwhelming. It would be helpful to reduce the amount of information on one page so as not to miss important information. NYK provides a wealth of environmental performance data, but the breakdown between NYK, three NYK-owned container terminals in Japan, and NYK fleet is unclear at times. Data on overall energy consumption, water consumption, waste production, and carbon dioxide emissions would be useful. Lastly, NYK does not provide a formal code of conduct online. NYK should clearly lay out the company’s adoption, monitoring, and reinforcement of policies, in addition to the provided United Nations Global Compact, which lacks a few important policies. However, in general, NYK appears as a safe and environmentally-friendly company through its monohakobi.
S55%
E4 5 %
NYK 2012 Web Pages
Comparison with sector averages Source of points
A
Hilary HaskellTaryn Akiyama
Distribution of points
E=Total Environmental Score, ESA=Environmental Sector Average Score, EI=Environmental Intent, ER=Environmental Reporting, EP=Environmental Performance, S=Total Social Score, SSA=Social Sector Average Score, SI=Social Intent, SR=Social Reporting, SP=Social Performance
EI ER EP SI SR SP
Nippon YusenKaisha (NYK)
88
45
8
77 66
26
Analyst 1: Analyst 2:
Environmental Intent
Question Category Max Score General CommentScore %Accountability 4 Needs improvement1 25
Management 8 Excellent8 100
Policy 10 Excellent10 100
Vision 4 Excellent4 100
Environmental Reporting
Question Category Max Score General CommentScore %Emissions to Air 7 Good5 71
Energy 14 Good9 64
Management 21 Needs substantial improvement5 24
Recycling 14 Needs substantial improvement2 14
Waste 21 Needs substantial improvement4 19
Water 7 Good4 57
Social Intent
Question Category Max Score General CommentScore %Accountability 4 Excellent3 75
Management 10 Good7 70
Policy 6 Excellent6 100
Social Demographic 2 Good1 50
Vision 4 Excellent3 75
Social Reporting
Question Category Max Score General CommentScore %Human Rights 77 Needs improvement35 45
Management 7 Good5 71
Qualitative Social 35 Excellent33 94
Quantitative Social 42 Needs improvement15 36
www.roberts.cmc.edu 47 Transportation and Logistics Sectors
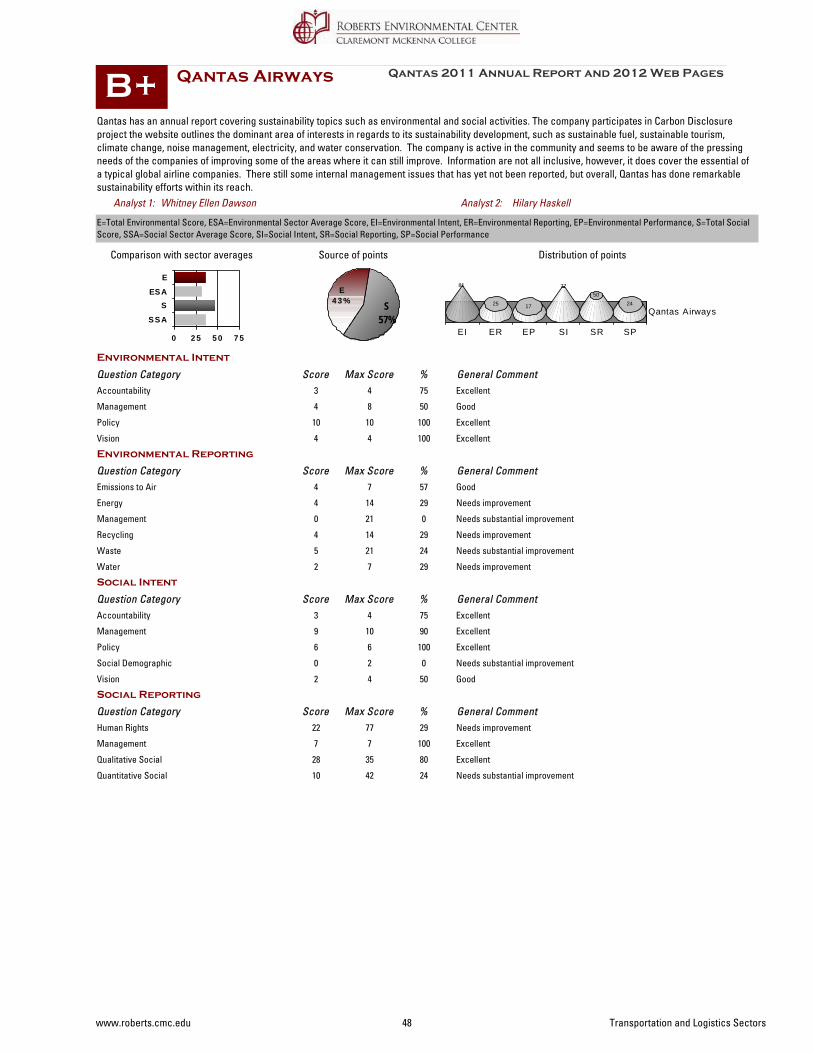
Qantas Airways
0 2 5 5 0 7 5
SSA
SESA
E
Qantas has an annual report covering sustainability topics such as environmental and social activities. The company participates in Carbon Disclosure project the website outlines the dominant area of interests in regards to its sustainability development, such as sustainable fuel, sustainable tourism, climate change, noise management, electricity, and water conservation. The company is active in the community and seems to be aware of the pressing needs of the companies of improving some of the areas where it can still improve. Information are not all inclusive, however, it does cover the essential of a typical global airline companies. There still some internal management issues that has yet not been reported, but overall, Qantas has done remarkable sustainability efforts within its reach.
S57%
E4 3 %
Qantas 2011 Annual Report and 2012 Web Pages
Comparison with sector averages Source of points
B+
Hilary HaskellWhitney Ellen Dawson
Distribution of points
E=Total Environmental Score, ESA=Environmental Sector Average Score, EI=Environmental Intent, ER=Environmental Reporting, EP=Environmental Performance, S=Total Social Score, SSA=Social Sector Average Score, SI=Social Intent, SR=Social Reporting, SP=Social Performance
EI ER EP SI SR SP
Qantas Airways
81
25 17
7750
24
Analyst 1: Analyst 2:
Environmental Intent
Question Category Max Score General CommentScore %Accountability 4 Excellent3 75
Management 8 Good4 50
Policy 10 Excellent10 100
Vision 4 Excellent4 100
Environmental Reporting
Question Category Max Score General CommentScore %Emissions to Air 7 Good4 57
Energy 14 Needs improvement4 29
Management 21 Needs substantial improvement0 0
Recycling 14 Needs improvement4 29
Waste 21 Needs substantial improvement5 24
Water 7 Needs improvement2 29
Social Intent
Question Category Max Score General CommentScore %Accountability 4 Excellent3 75
Management 10 Excellent9 90
Policy 6 Excellent6 100
Social Demographic 2 Needs substantial improvement0 0
Vision 4 Good2 50
Social Reporting
Question Category Max Score General CommentScore %Human Rights 77 Needs improvement22 29
Management 7 Excellent7 100
Qualitative Social 35 Excellent28 80
Quantitative Social 42 Needs substantial improvement10 24
www.roberts.cmc.edu 48 Transportation and Logistics Sectors
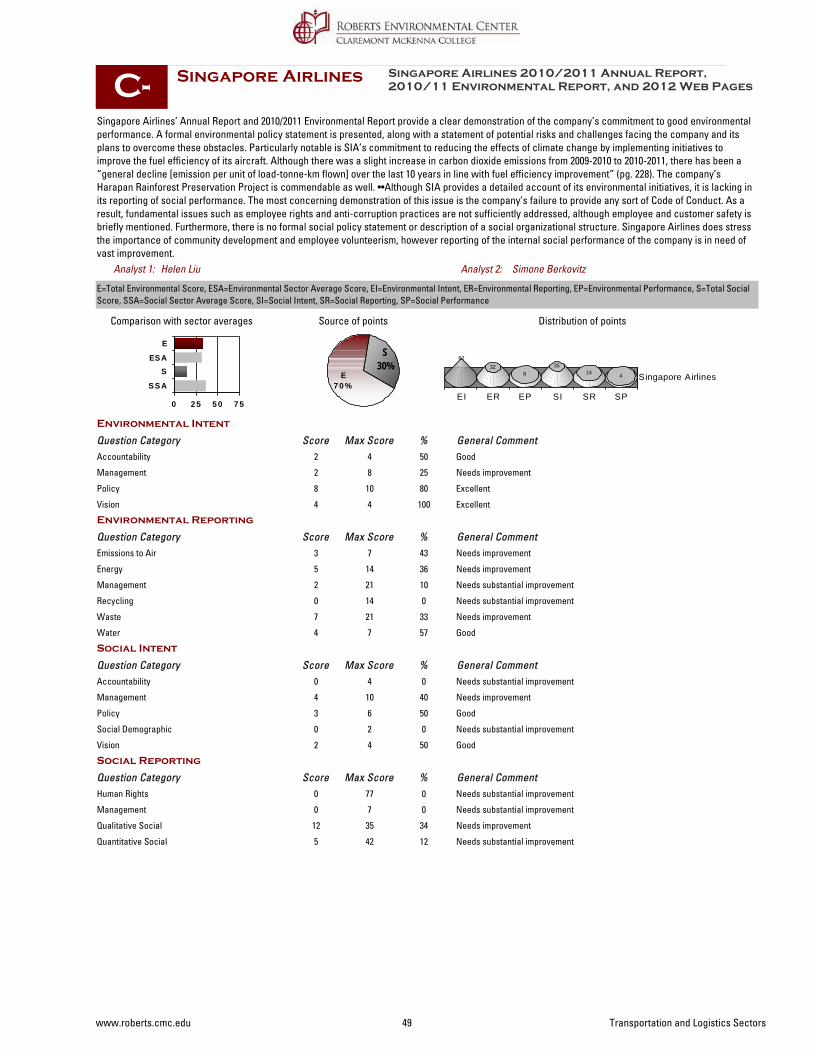
Singapore Airlines
0 2 5 5 0 7 5
SSA
SESA
E
Singapore Airlines’ Annual Report and 2010/2011 Environmental Report provide a clear demonstration of the company’s commitment to good environmental performance. A formal environmental policy statement is presented, along with a statement of potential risks and challenges facing the company and its plans to overcome these obstacles. Particularly notable is SIA’s commitment to reducing the effects of climate change by implementing initiatives to improve the fuel efficiency of its aircraft. Although there was a slight increase in carbon dioxide emissions from 2009-2010 to 2010-2011, there has been a “general decline [emission per unit of load-tonne-km flown] over the last 10 years in line with fuel efficiency improvement” (pg. 228). The company’s Harapan Rainforest Preservation Project is commendable as well. ••Although SIA provides a detailed account of its environmental initiatives, it is lacking in its reporting of social performance. The most concerning demonstration of this issue is the company’s failure to provide any sort of Code of Conduct. As a result, fundamental issues such as employee rights and anti-corruption practices are not sufficiently addressed, although employee and customer safety is briefly mentioned. Furthermore, there is no formal social policy statement or description of a social organizational structure. Singapore Airlines does stress the importance of community development and employee volunteerism, however reporting of the internal social performance of the company is in need of vast improvement.
S30%
E7 0 %
Singapore Airlines 2010/2011 Annual Report, 2010/11 Environmental Report, and 2012 Web Pages
Comparison with sector averages Source of points
C-
Simone BerkovitzHelen Liu
Distribution of points
E=Total Environmental Score, ESA=Environmental Sector Average Score, EI=Environmental Intent, ER=Environmental Reporting, EP=Environmental Performance, S=Total Social Score, SSA=Social Sector Average Score, SI=Social Intent, SR=Social Reporting, SP=Social Performance
EI ER EP SI SR SP
Singapore Airlines
6232
835
14 4
Analyst 1: Analyst 2:
Environmental Intent
Question Category Max Score General CommentScore %Accountability 4 Good2 50
Management 8 Needs improvement2 25
Policy 10 Excellent8 80
Vision 4 Excellent4 100
Environmental Reporting
Question Category Max Score General CommentScore %Emissions to Air 7 Needs improvement3 43
Energy 14 Needs improvement5 36
Management 21 Needs substantial improvement2 10
Recycling 14 Needs substantial improvement0 0
Waste 21 Needs improvement7 33
Water 7 Good4 57
Social Intent
Question Category Max Score General CommentScore %Accountability 4 Needs substantial improvement0 0
Management 10 Needs improvement4 40
Policy 6 Good3 50
Social Demographic 2 Needs substantial improvement0 0
Vision 4 Good2 50
Social Reporting
Question Category Max Score General CommentScore %Human Rights 77 Needs substantial improvement0 0
Management 7 Needs substantial improvement0 0
Qualitative Social 35 Needs improvement12 34
Quantitative Social 42 Needs substantial improvement5 12
www.roberts.cmc.edu 49 Transportation and Logistics Sectors
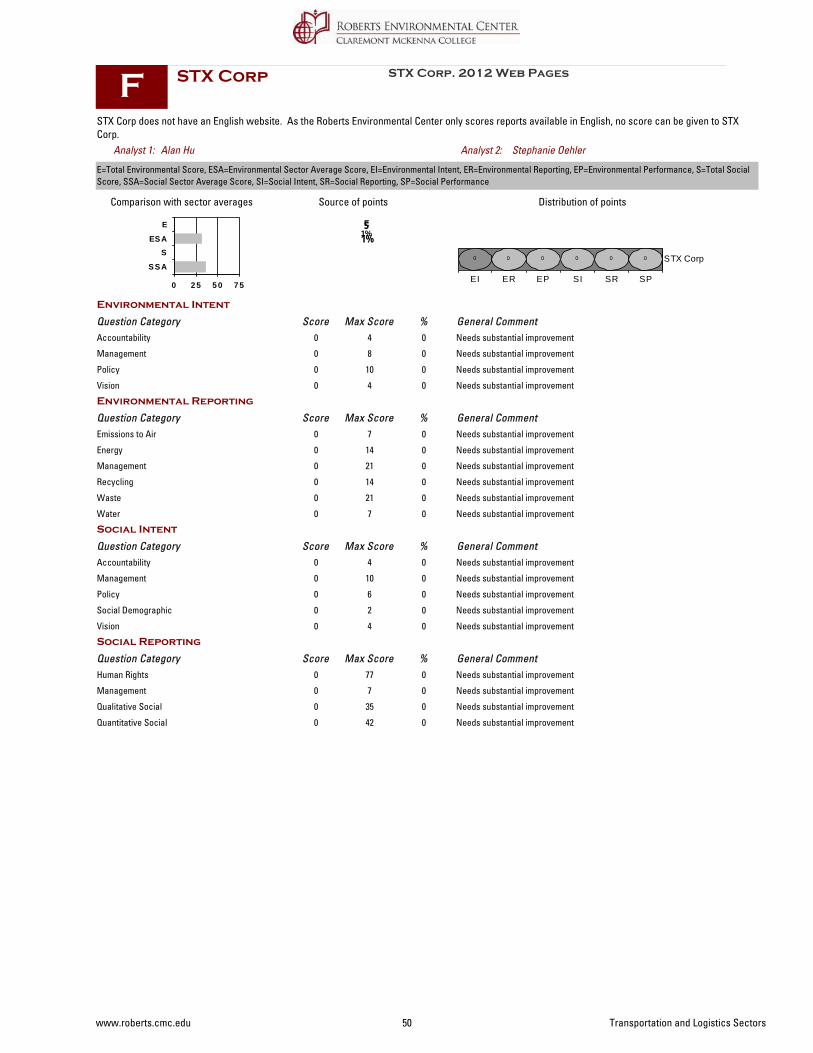
STX Corp
0 2 5 5 0 7 5
SSA
SESA
E
STX Corp does not have an English website. As the Roberts Environmental Center only scores reports available in English, no score can be given to STX Corp.
S1%E
1%
STX Corp. 2012 Web Pages
Comparison with sector averages Source of points
F
Stephanie OehlerAlan Hu
Distribution of points
E=Total Environmental Score, ESA=Environmental Sector Average Score, EI=Environmental Intent, ER=Environmental Reporting, EP=Environmental Performance, S=Total Social Score, SSA=Social Sector Average Score, SI=Social Intent, SR=Social Reporting, SP=Social Performance
EI ER EP SI SR SP
STX Corp0 0 0 0 0 0
Analyst 1: Analyst 2:
Environmental Intent
Question Category Max Score General CommentScore %Accountability 4 Needs substantial improvement0 0
Management 8 Needs substantial improvement0 0
Policy 10 Needs substantial improvement0 0
Vision 4 Needs substantial improvement0 0
Environmental Reporting
Question Category Max Score General CommentScore %Emissions to Air 7 Needs substantial improvement0 0
Energy 14 Needs substantial improvement0 0
Management 21 Needs substantial improvement0 0
Recycling 14 Needs substantial improvement0 0
Waste 21 Needs substantial improvement0 0
Water 7 Needs substantial improvement0 0
Social Intent
Question Category Max Score General CommentScore %Accountability 4 Needs substantial improvement0 0
Management 10 Needs substantial improvement0 0
Policy 6 Needs substantial improvement0 0
Social Demographic 2 Needs substantial improvement0 0
Vision 4 Needs substantial improvement0 0
Social Reporting
Question Category Max Score General CommentScore %Human Rights 77 Needs substantial improvement0 0
Management 7 Needs substantial improvement0 0
Qualitative Social 35 Needs substantial improvement0 0
Quantitative Social 42 Needs substantial improvement0 0
www.roberts.cmc.edu 50 Transportation and Logistics Sectors
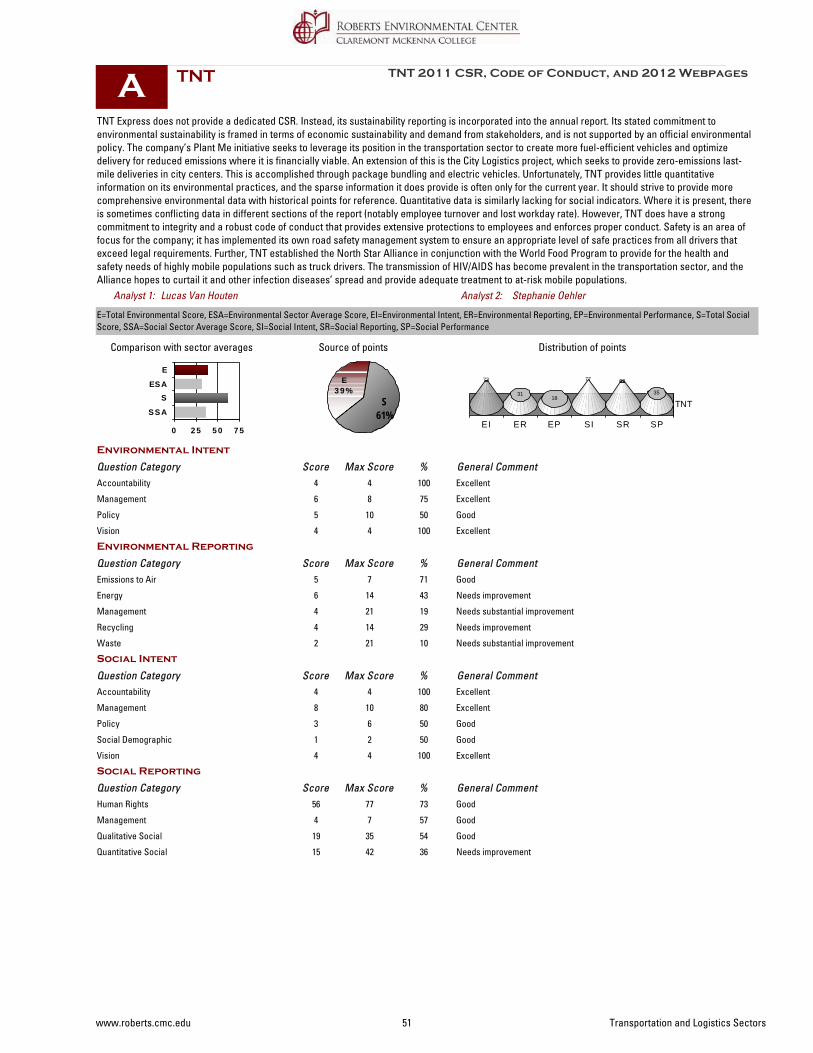
TNT
0 2 5 5 0 7 5
SSA
SESA
E
TNT Express does not provide a dedicated CSR. Instead, its sustainability reporting is incorporated into the annual report. Its stated commitment to environmental sustainability is framed in terms of economic sustainability and demand from stakeholders, and is not supported by an official environmental policy. The company’s Plant Me initiative seeks to leverage its position in the transportation sector to create more fuel-efficient vehicles and optimize delivery for reduced emissions where it is financially viable. An extension of this is the City Logistics project, which seeks to provide zero-emissions last-mile deliveries in city centers. This is accomplished through package bundling and electric vehicles. Unfortunately, TNT provides little quantitative information on its environmental practices, and the sparse information it does provide is often only for the current year. It should strive to provide more comprehensive environmental data with historical points for reference. Quantitative data is similarly lacking for social indicators. Where it is present, there is sometimes conflicting data in different sections of the report (notably employee turnover and lost workday rate). However, TNT does have a strong commitment to integrity and a robust code of conduct that provides extensive protections to employees and enforces proper conduct. Safety is an area of focus for the company; it has implemented its own road safety management system to ensure an appropriate level of safe practices from all drivers that exceed legal requirements. Further, TNT established the North Star Alliance in conjunction with the World Food Program to provide for the health and safety needs of highly mobile populations such as truck drivers. The transmission of HIV/AIDS has become prevalent in the transportation sector, and the Alliance hopes to curtail it and other infection diseases’ spread and provide adequate treatment to at-risk mobile populations.
S61%
E3 9 %
TNT 2011 CSR, Code of Conduct, and 2012 Webpages
Comparison with sector averages Source of points
A
Stephanie OehlerLucas Van Houten
Distribution of points
E=Total Environmental Score, ESA=Environmental Sector Average Score, EI=Environmental Intent, ER=Environmental Reporting, EP=Environmental Performance, S=Total Social Score, SSA=Social Sector Average Score, SI=Social Intent, SR=Social Reporting, SP=Social Performance
EI ER EP SI SR SP
TNT
73
3118
77 69
35
Analyst 1: Analyst 2:
Environmental Intent
Question Category Max Score General CommentScore %Accountability 4 Excellent4 100
Management 8 Excellent6 75
Policy 10 Good5 50
Vision 4 Excellent4 100
Environmental Reporting
Question Category Max Score General CommentScore %Emissions to Air 7 Good5 71
Energy 14 Needs improvement6 43
Management 21 Needs substantial improvement4 19
Recycling 14 Needs improvement4 29
Waste 21 Needs substantial improvement2 10
Social Intent
Question Category Max Score General CommentScore %Accountability 4 Excellent4 100
Management 10 Excellent8 80
Policy 6 Good3 50
Social Demographic 2 Good1 50
Vision 4 Excellent4 100
Social Reporting
Question Category Max Score General CommentScore %Human Rights 77 Good56 73
Management 7 Good4 57
Qualitative Social 35 Good19 54
Quantitative Social 42 Needs improvement15 36
www.roberts.cmc.edu 51 Transportation and Logistics Sectors
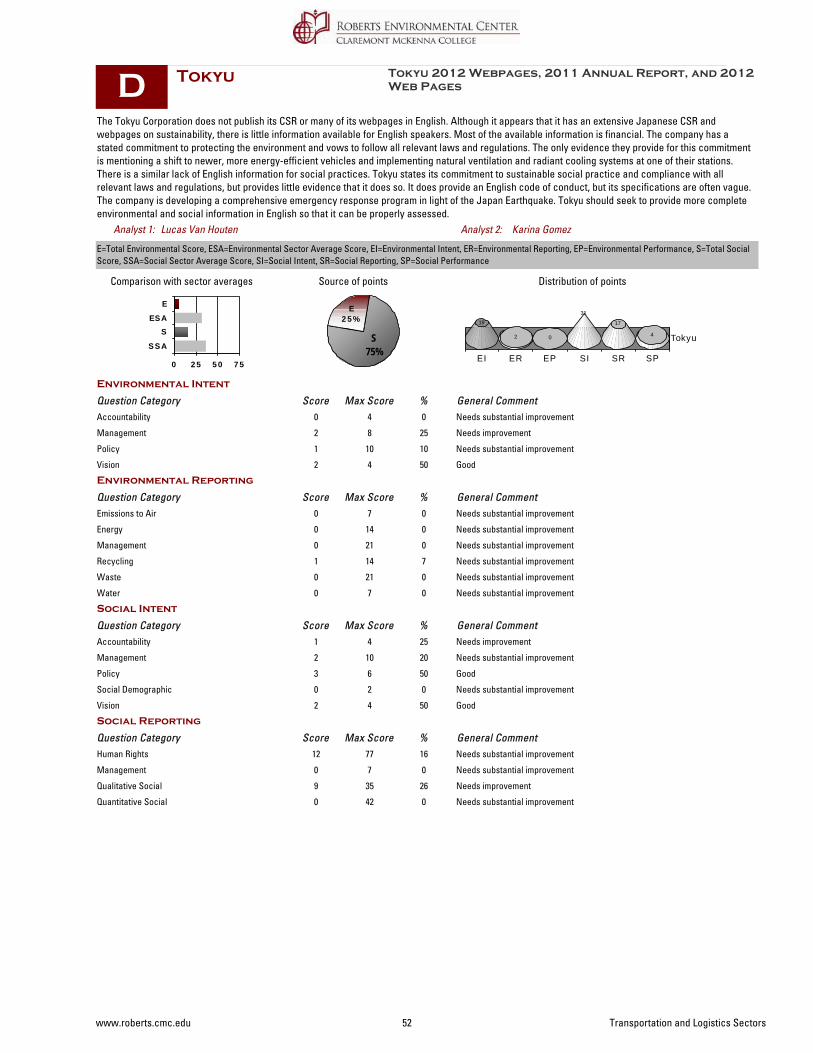
Tokyu
0 2 5 5 0 7 5
SSA
SESA
E
The Tokyu Corporation does not publish its CSR or many of its webpages in English. Although it appears that it has an extensive Japanese CSR and webpages on sustainability, there is little information available for English speakers. Most of the available information is financial. The company has a stated commitment to protecting the environment and vows to follow all relevant laws and regulations. The only evidence they provide for this commitment is mentioning a shift to newer, more energy-efficient vehicles and implementing natural ventilation and radiant cooling systems at one of their stations. There is a similar lack of English information for social practices. Tokyu states its commitment to sustainable social practice and compliance with all relevant laws and regulations, but provides little evidence that it does so. It does provide an English code of conduct, but its specifications are often vague. The company is developing a comprehensive emergency response program in light of the Japan Earthquake. Tokyu should seek to provide more complete environmental and social information in English so that it can be properly assessed.
S75%
E2 5 %
Tokyu 2012 Webpages, 2011 Annual Report, and 2012 Web Pages
Comparison with sector averages Source of points
D
Karina GomezLucas Van Houten
Distribution of points
E=Total Environmental Score, ESA=Environmental Sector Average Score, EI=Environmental Intent, ER=Environmental Reporting, EP=Environmental Performance, S=Total Social Score, SSA=Social Sector Average Score, SI=Social Intent, SR=Social Reporting, SP=Social Performance
EI ER EP SI SR SP
Tokyu
19
2 0
31
17
4
Analyst 1: Analyst 2:
Environmental Intent
Question Category Max Score General CommentScore %Accountability 4 Needs substantial improvement0 0
Management 8 Needs improvement2 25
Policy 10 Needs substantial improvement1 10
Vision 4 Good2 50
Environmental Reporting
Question Category Max Score General CommentScore %Emissions to Air 7 Needs substantial improvement0 0
Energy 14 Needs substantial improvement0 0
Management 21 Needs substantial improvement0 0
Recycling 14 Needs substantial improvement1 7
Waste 21 Needs substantial improvement0 0
Water 7 Needs substantial improvement0 0
Social Intent
Question Category Max Score General CommentScore %Accountability 4 Needs improvement1 25
Management 10 Needs substantial improvement2 20
Policy 6 Good3 50
Social Demographic 2 Needs substantial improvement0 0
Vision 4 Good2 50
Social Reporting
Question Category Max Score General CommentScore %Human Rights 77 Needs substantial improvement12 16
Management 7 Needs substantial improvement0 0
Qualitative Social 35 Needs improvement9 26
Quantitative Social 42 Needs substantial improvement0 0
www.roberts.cmc.edu 52 Transportation and Logistics Sectors
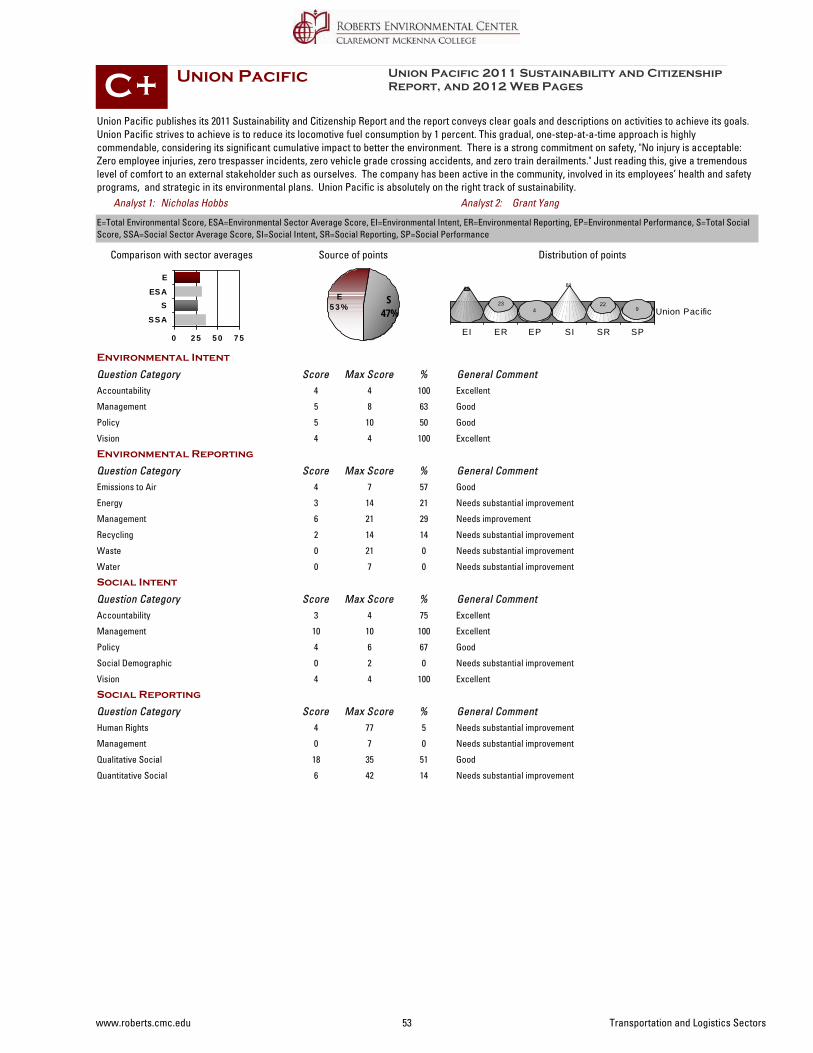
Union Pacific
0 2 5 5 0 7 5
SSA
SESA
E
Union Pacific publishes its 2011 Sustainability and Citizenship Report and the report conveys clear goals and descriptions on activities to achieve its goals. Union Pacific strives to achieve is to reduce its locomotive fuel consumption by 1 percent. This gradual, one-step-at-a-time approach is highly commendable, considering its significant cumulative impact to better the environment. There is a strong commitment on safety, "No injury is acceptable: Zero employee injuries, zero trespasser incidents, zero vehicle grade crossing accidents, and zero train derailments." Just reading this, give a tremendous level of comfort to an external stakeholder such as ourselves. The company has been active in the community, involved in its employees’ health and safety programs, and strategic in its environmental plans. Union Pacific is absolutely on the right track of sustainability.
S47%
E5 3 %
Union Pacific 2011 Sustainability and Citizenship Report, and 2012 Web Pages
Comparison with sector averages Source of points
C+
Grant YangNicholas Hobbs
Distribution of points
E=Total Environmental Score, ESA=Environmental Sector Average Score, EI=Environmental Intent, ER=Environmental Reporting, EP=Environmental Performance, S=Total Social Score, SSA=Social Sector Average Score, SI=Social Intent, SR=Social Reporting, SP=Social Performance
EI ER EP SI SR SP
Union Pacific
69
234
81
229
Analyst 1: Analyst 2:
Environmental Intent
Question Category Max Score General CommentScore %Accountability 4 Excellent4 100
Management 8 Good5 63
Policy 10 Good5 50
Vision 4 Excellent4 100
Environmental Reporting
Question Category Max Score General CommentScore %Emissions to Air 7 Good4 57
Energy 14 Needs substantial improvement3 21
Management 21 Needs improvement6 29
Recycling 14 Needs substantial improvement2 14
Waste 21 Needs substantial improvement0 0
Water 7 Needs substantial improvement0 0
Social Intent
Question Category Max Score General CommentScore %Accountability 4 Excellent3 75
Management 10 Excellent10 100
Policy 6 Good4 67
Social Demographic 2 Needs substantial improvement0 0
Vision 4 Excellent4 100
Social Reporting
Question Category Max Score General CommentScore %Human Rights 77 Needs substantial improvement4 5
Management 7 Needs substantial improvement0 0
Qualitative Social 35 Good18 51
Quantitative Social 42 Needs substantial improvement6 14
www.roberts.cmc.edu 53 Transportation and Logistics Sectors
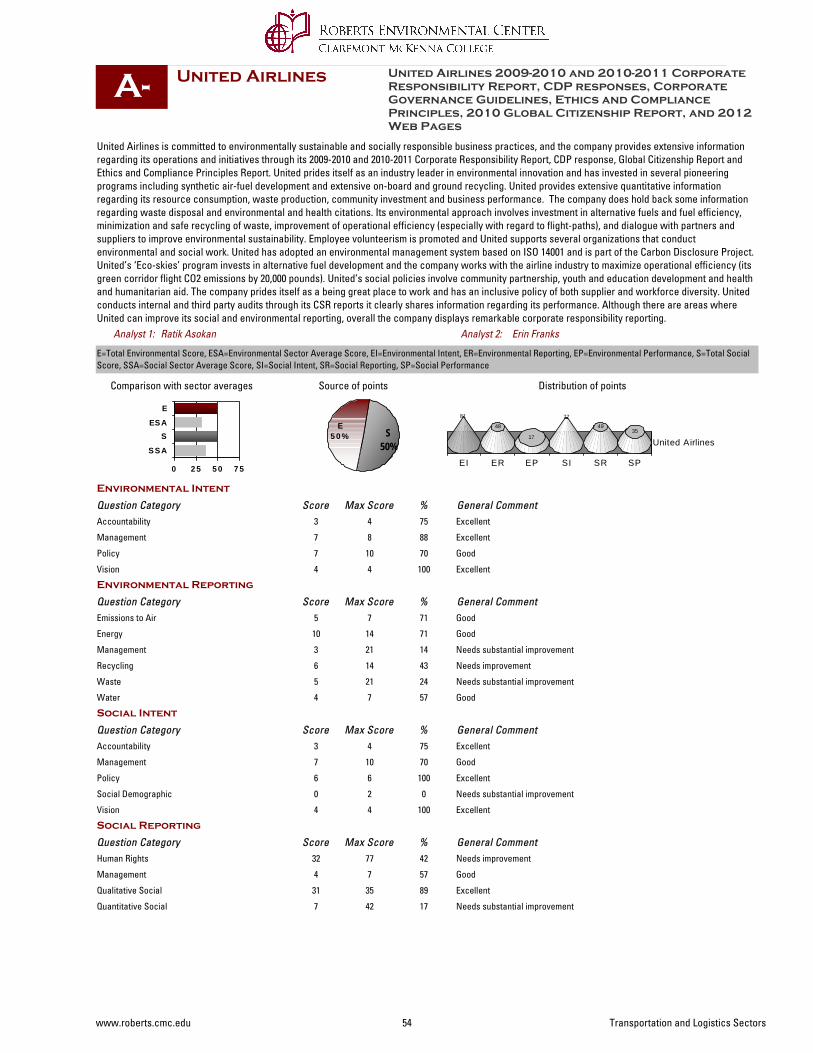
United Airlines
0 2 5 5 0 7 5
SSA
SESA
E
United Airlines is committed to environmentally sustainable and socially responsible business practices, and the company provides extensive information regarding its operations and initiatives through its 2009-2010 and 2010-2011 Corporate Responsibility Report, CDP response, Global Citizenship Report and Ethics and Compliance Principles Report. United prides itself as an industry leader in environmental innovation and has invested in several pioneering programs including synthetic air-fuel development and extensive on-board and ground recycling. United provides extensive quantitative information regarding its resource consumption, waste production, community investment and business performance. The company does hold back some information regarding waste disposal and environmental and health citations. Its environmental approach involves investment in alternative fuels and fuel efficiency, minimization and safe recycling of waste, improvement of operational efficiency (especially with regard to flight-paths), and dialogue with partners and suppliers to improve environmental sustainability. Employee volunteerism is promoted and United supports several organizations that conduct environmental and social work. United has adopted an environmental management system based on ISO 14001 and is part of the Carbon Disclosure Project. United’s ‘Eco-skies’ program invests in alternative fuel development and the company works with the airline industry to maximize operational efficiency (its green corridor flight CO2 emissions by 20,000 pounds). United’s social policies involve community partnership, youth and education development and health and humanitarian aid. The company prides itself as a being great place to work and has an inclusive policy of both supplier and workforce diversity. United conducts internal and third party audits through its CSR reports it clearly shares information regarding its performance. Although there are areas where United can improve its social and environmental reporting, overall the company displays remarkable corporate responsibility reporting.
S50%
E5 0 %
United Airlines 2009-2010 and 2010-2011 Corporate Responsibility Report, CDP responses, Corporate Governance Guidelines, Ethics and Compliance Principles, 2010 Global Citizenship Report, and 2012 Web Pages
Comparison with sector averages Source of points
A-
Erin FranksRatik Asokan
Distribution of points
E=Total Environmental Score, ESA=Environmental Sector Average Score, EI=Environmental Intent, ER=Environmental Reporting, EP=Environmental Performance, S=Total Social Score, SSA=Social Sector Average Score, SI=Social Intent, SR=Social Reporting, SP=Social Performance
EI ER EP SI SR SP
United Airlines
81
48
17
77
4935
Analyst 1: Analyst 2:
Environmental Intent
Question Category Max Score General CommentScore %Accountability 4 Excellent3 75
Management 8 Excellent7 88
Policy 10 Good7 70
Vision 4 Excellent4 100
Environmental Reporting
Question Category Max Score General CommentScore %Emissions to Air 7 Good5 71
Energy 14 Good10 71
Management 21 Needs substantial improvement3 14
Recycling 14 Needs improvement6 43
Waste 21 Needs substantial improvement5 24
Water 7 Good4 57
Social Intent
Question Category Max Score General CommentScore %Accountability 4 Excellent3 75
Management 10 Good7 70
Policy 6 Excellent6 100
Social Demographic 2 Needs substantial improvement0 0
Vision 4 Excellent4 100
Social Reporting
Question Category Max Score General CommentScore %Human Rights 77 Needs improvement32 42
Management 7 Good4 57
Qualitative Social 35 Excellent31 89
Quantitative Social 42 Needs substantial improvement7 17
www.roberts.cmc.edu 54 Transportation and Logistics Sectors
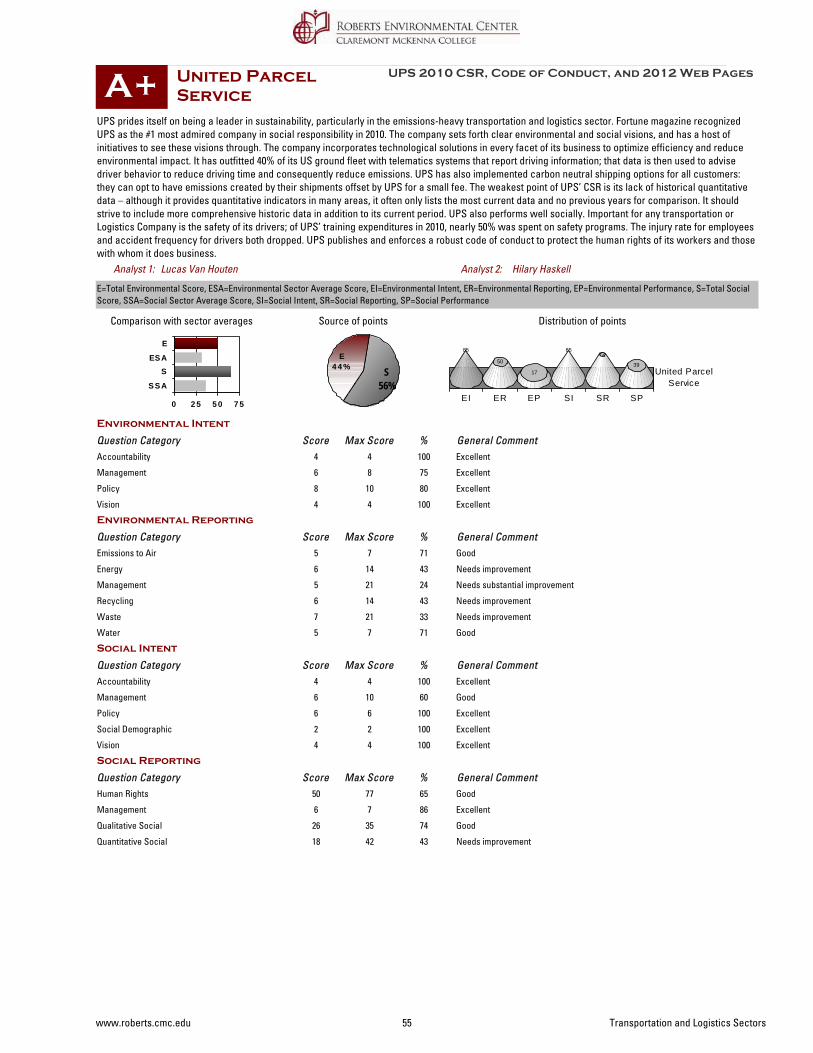
United Parcel Service
0 2 5 5 0 7 5
SSA
SESA
E
UPS prides itself on being a leader in sustainability, particularly in the emissions-heavy transportation and logistics sector. Fortune magazine recognized UPS as the #1 most admired company in social responsibility in 2010. The company sets forth clear environmental and social visions, and has a host of initiatives to see these visions through. The company incorporates technological solutions in every facet of its business to optimize efficiency and reduce environmental impact. It has outfitted 40% of its US ground fleet with telematics systems that report driving information; that data is then used to advise driver behavior to reduce driving time and consequently reduce emissions. UPS has also implemented carbon neutral shipping options for all customers: they can opt to have emissions created by their shipments offset by UPS for a small fee. The weakest point of UPS’ CSR is its lack of historical quantitative data – although it provides quantitative indicators in many areas, it often only lists the most current data and no previous years for comparison. It should strive to include more comprehensive historic data in addition to its current period. UPS also performs well socially. Important for any transportation or Logistics Company is the safety of its drivers; of UPS’ training expenditures in 2010, nearly 50% was spent on safety programs. The injury rate for employees and accident frequency for drivers both dropped. UPS publishes and enforces a robust code of conduct to protect the human rights of its workers and those with whom it does business.
S56%
E4 4 %
UPS 2010 CSR, Code of Conduct, and 2012 Web Pages
Comparison with sector averages Source of points
A+
Hilary HaskellLucas Van Houten
Distribution of points
E=Total Environmental Score, ESA=Environmental Sector Average Score, EI=Environmental Intent, ER=Environmental Reporting, EP=Environmental Performance, S=Total Social Score, SSA=Social Sector Average Score, SI=Social Intent, SR=Social Reporting, SP=Social Performance
EI ER EP SI SR SP
United ParcelService
85
50
17
8572
39
Analyst 1: Analyst 2:
Environmental Intent
Question Category Max Score General CommentScore %Accountability 4 Excellent4 100
Management 8 Excellent6 75
Policy 10 Excellent8 80
Vision 4 Excellent4 100
Environmental Reporting
Question Category Max Score General CommentScore %Emissions to Air 7 Good5 71
Energy 14 Needs improvement6 43
Management 21 Needs substantial improvement5 24
Recycling 14 Needs improvement6 43
Waste 21 Needs improvement7 33
Water 7 Good5 71
Social Intent
Question Category Max Score General CommentScore %Accountability 4 Excellent4 100
Management 10 Good6 60
Policy 6 Excellent6 100
Social Demographic 2 Excellent2 100
Vision 4 Excellent4 100
Social Reporting
Question Category Max Score General CommentScore %Human Rights 77 Good50 65
Management 7 Excellent6 86
Qualitative Social 35 Good26 74
Quantitative Social 42 Needs improvement18 43
www.roberts.cmc.edu 55 Transportation and Logistics Sectors
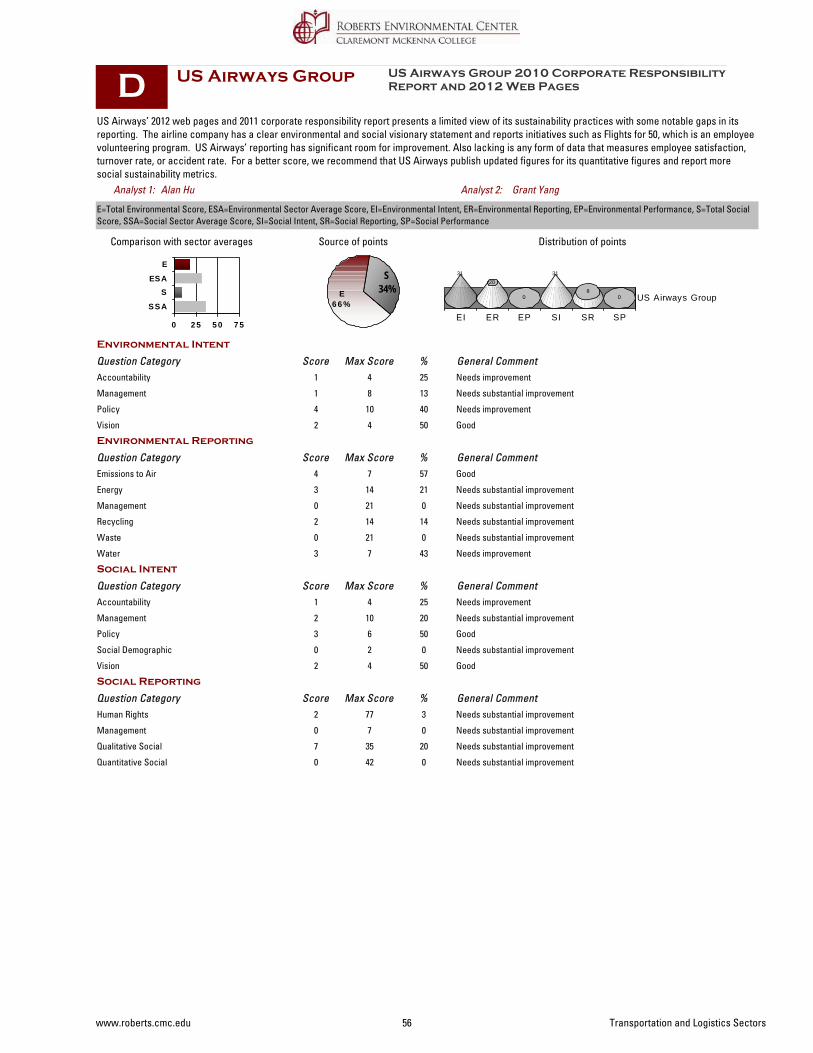
US Airways Group
0 2 5 5 0 7 5
SSA
SESA
E
US Airways’ 2012 web pages and 2011 corporate responsibility report presents a limited view of its sustainability practices with some notable gaps in its reporting. The airline company has a clear environmental and social visionary statement and reports initiatives such as Flights for 50, which is an employee volunteering program. US Airways’ reporting has significant room for improvement. Also lacking is any form of data that measures employee satisfaction, turnover rate, or accident rate. For a better score, we recommend that US Airways publish updated figures for its quantitative figures and report more social sustainability metrics.
S34%E
6 6 %
US Airways Group 2010 Corporate Responsibility Report and 2012 Web Pages
Comparison with sector averages Source of points
D
Grant YangAlan Hu
Distribution of points
E=Total Environmental Score, ESA=Environmental Sector Average Score, EI=Environmental Intent, ER=Environmental Reporting, EP=Environmental Performance, S=Total Social Score, SSA=Social Sector Average Score, SI=Social Intent, SR=Social Reporting, SP=Social Performance
EI ER EP SI SR SP
US Airways Group
3120
0
31
80
Analyst 1: Analyst 2:
Environmental Intent
Question Category Max Score General CommentScore %Accountability 4 Needs improvement1 25
Management 8 Needs substantial improvement1 13
Policy 10 Needs improvement4 40
Vision 4 Good2 50
Environmental Reporting
Question Category Max Score General CommentScore %Emissions to Air 7 Good4 57
Energy 14 Needs substantial improvement3 21
Management 21 Needs substantial improvement0 0
Recycling 14 Needs substantial improvement2 14
Waste 21 Needs substantial improvement0 0
Water 7 Needs improvement3 43
Social Intent
Question Category Max Score General CommentScore %Accountability 4 Needs improvement1 25
Management 10 Needs substantial improvement2 20
Policy 6 Good3 50
Social Demographic 2 Needs substantial improvement0 0
Vision 4 Good2 50
Social Reporting
Question Category Max Score General CommentScore %Human Rights 77 Needs substantial improvement2 3
Management 7 Needs substantial improvement0 0
Qualitative Social 35 Needs substantial improvement7 20
Quantitative Social 42 Needs substantial improvement0 0
www.roberts.cmc.edu 56 Transportation and Logistics Sectors
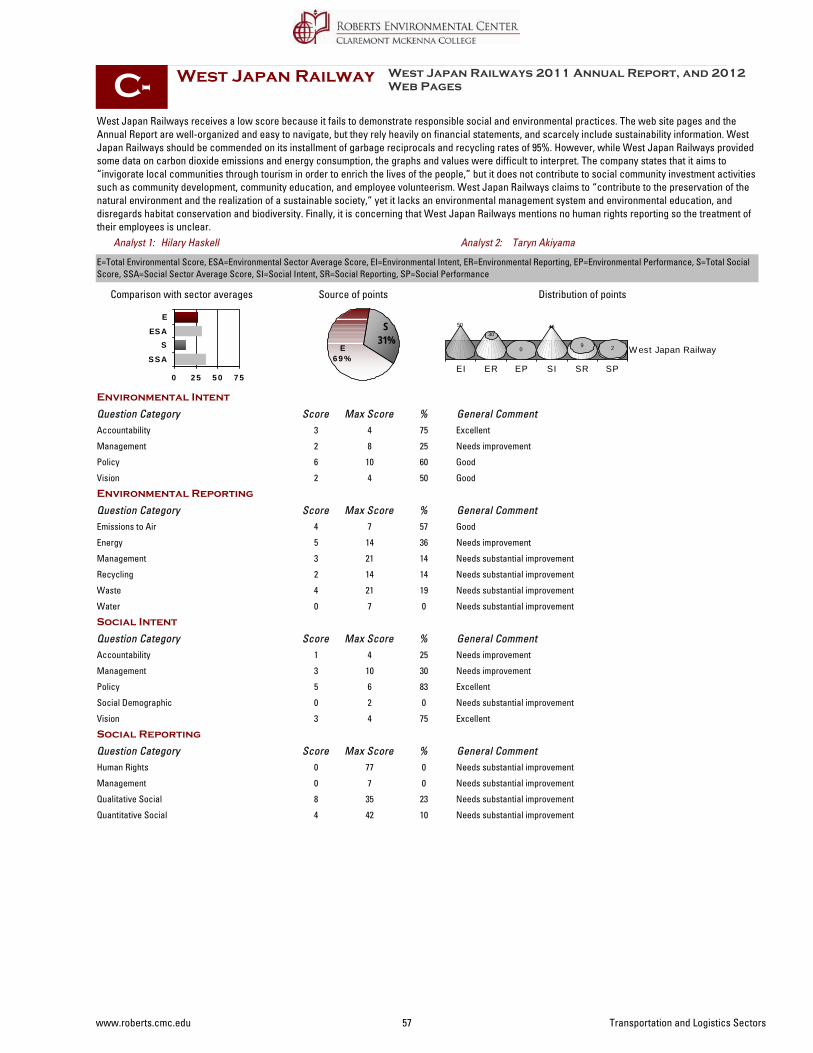
West Japan Railway
0 2 5 5 0 7 5
SSA
SESA
E
West Japan Railways receives a low score because it fails to demonstrate responsible social and environmental practices. The web site pages and the Annual Report are well-organized and easy to navigate, but they rely heavily on financial statements, and scarcely include sustainability information. West Japan Railways should be commended on its installment of garbage reciprocals and recycling rates of 95%. However, while West Japan Railways provided some data on carbon dioxide emissions and energy consumption, the graphs and values were difficult to interpret. The company states that it aims to “invigorate local communities through tourism in order to enrich the lives of the people,” but it does not contribute to social community investment activities such as community development, community education, and employee volunteerism. West Japan Railways claims to “contribute to the preservation of the natural environment and the realization of a sustainable society,” yet it lacks an environmental management system and environmental education, and disregards habitat conservation and biodiversity. Finally, it is concerning that West Japan Railways mentions no human rights reporting so the treatment of their employees is unclear.
S31%
E6 9 %
West Japan Railways 2011 Annual Report, and 2012 Web Pages
Comparison with sector averages Source of points
C-
Taryn AkiyamaHilary Haskell
Distribution of points
E=Total Environmental Score, ESA=Environmental Sector Average Score, EI=Environmental Intent, ER=Environmental Reporting, EP=Environmental Performance, S=Total Social Score, SSA=Social Sector Average Score, SI=Social Intent, SR=Social Reporting, SP=Social Performance
EI ER EP SI SR SP
W est Japan Railway
50
30
0
46
9 2
Analyst 1: Analyst 2:
Environmental Intent
Question Category Max Score General CommentScore %Accountability 4 Excellent3 75
Management 8 Needs improvement2 25
Policy 10 Good6 60
Vision 4 Good2 50
Environmental Reporting
Question Category Max Score General CommentScore %Emissions to Air 7 Good4 57
Energy 14 Needs improvement5 36
Management 21 Needs substantial improvement3 14
Recycling 14 Needs substantial improvement2 14
Waste 21 Needs substantial improvement4 19
Water 7 Needs substantial improvement0 0
Social Intent
Question Category Max Score General CommentScore %Accountability 4 Needs improvement1 25
Management 10 Needs improvement3 30
Policy 6 Excellent5 83
Social Demographic 2 Needs substantial improvement0 0
Vision 4 Excellent3 75
Social Reporting
Question Category Max Score General CommentScore %Human Rights 77 Needs substantial improvement0 0
Management 7 Needs substantial improvement0 0
Qualitative Social 35 Needs substantial improvement8 23
Quantitative Social 42 Needs substantial improvement4 10
www.roberts.cmc.edu 57 Transportation and Logistics Sectors

Yamato Holdings
0 2 5 5 0 7 5
SSA
SESA
E
Yamato Holdings’ corporate social responsibility activities involve issues of safety, environment, society and economy. The company believes in running sustainable operations that reflect sound ideals and social responsibility. However, the company’s CSR report however, is only 2 pages long and provides almost no quantitative data. Yamato Holdings stresses the importance of safety and runs traffic safety workshops for students. To improve environmental efficiency, Yamato has introduced several low-emission and hybrid vehicles in their transportation business. Its social programs include employment for disabled people and earthquake relief. Yet, the company’s CSR initiatives are very narrow. No information is provided regarding any large environmental investment or community activities. No operational data is provided and the company is not involved in any environmental programs or initiatives. The company would greatly benefit from promoting employee volunteerism, conducting a large-scale project to improve environmental efficiency or being involved in social programs.
S50%
E5 0 %
Yamato Holdings 2011 Annual Report and 2012 Web Pages
Comparison with sector averages Source of points
D
Simone BerkovitzRatik Asokan
Distribution of points
E=Total Environmental Score, ESA=Environmental Sector Average Score, EI=Environmental Intent, ER=Environmental Reporting, EP=Environmental Performance, S=Total Social Score, SSA=Social Sector Average Score, SI=Social Intent, SR=Social Reporting, SP=Social Performance
EI ER EP SI SR SP
Yamato Holdings
27
3 4
31
7 2
Analyst 1: Analyst 2:
Environmental Intent
Question Category Max Score General CommentScore %Accountability 4 Needs substantial improvement0 0
Management 8 Needs improvement2 25
Policy 10 Needs improvement3 30
Vision 4 Good2 50
Environmental Reporting
Question Category Max Score General CommentScore %Emissions to Air 7 Needs substantial improvement0 0
Energy 14 Needs substantial improvement3 21
Management 21 Needs substantial improvement0 0
Recycling 14 Needs substantial improvement0 0
Waste 21 Needs substantial improvement0 0
Water 7 Needs substantial improvement0 0
Social Intent
Question Category Max Score General CommentScore %Accountability 4 Good2 50
Management 10 Needs substantial improvement0 0
Policy 6 Needs improvement2 33
Social Demographic 2 Excellent2 100
Vision 4 Good2 50
Social Reporting
Question Category Max Score General CommentScore %Human Rights 77 Needs substantial improvement0 0
Management 7 Needs substantial improvement0 0
Qualitative Social 35 Needs substantial improvement6 17
Quantitative Social 42 Needs substantial improvement3 7
www.roberts.cmc.edu 58 Transportation and Logistics Sectors
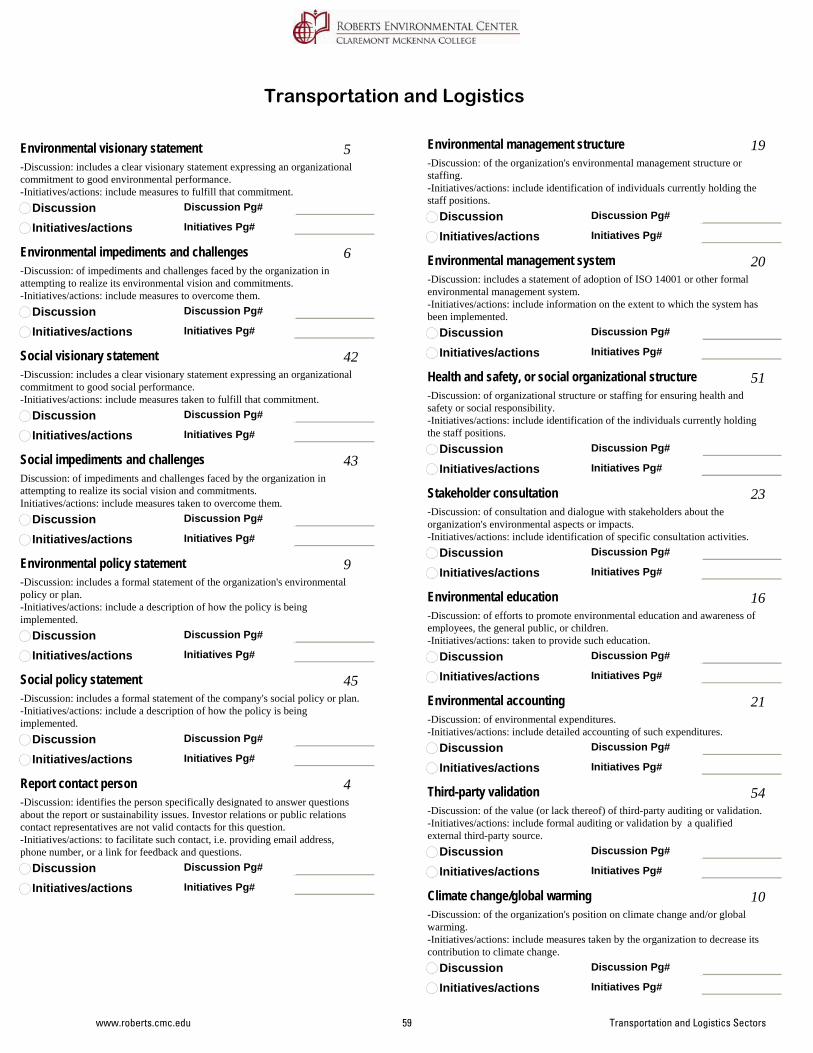
Transportation and Logistics
Environmental visionary statement-Discussion: includes a clear visionary statement expressing an organizational commitment to good environmental performance. -Initiatives/actions: include measures to fulfill that commitment.
5
DiscussionInitiatives/actions
Discussion Pg#
Initiatives Pg#
Environmental impediments and challenges-Discussion: of impediments and challenges faced by the organization in attempting to realize its environmental vision and commitments.-Initiatives/actions: include measures to overcome them.
6
DiscussionInitiatives/actions
Discussion Pg#
Initiatives Pg#
Social visionary statement -Discussion: includes a clear visionary statement expressing an organizational commitment to good social performance.-Initiatives/actions: include measures taken to fulfill that commitment.
42
DiscussionInitiatives/actions
Discussion Pg#
Initiatives Pg#
Social impediments and challengesDiscussion: of impediments and challenges faced by the organization in attempting to realize its social vision and commitments.Initiatives/actions: include measures taken to overcome them.
43
DiscussionInitiatives/actions
Discussion Pg#
Initiatives Pg#
Environmental policy statement-Discussion: includes a formal statement of the organization's environmental policy or plan.-Initiatives/actions: include a description of how the policy is being implemented.
9
DiscussionInitiatives/actions
Discussion Pg#
Initiatives Pg#
Social policy statement -Discussion: includes a formal statement of the company's social policy or plan.-Initiatives/actions: include a description of how the policy is being implemented.
45
DiscussionInitiatives/actions
Discussion Pg#
Initiatives Pg#
Report contact person-Discussion: identifies the person specifically designated to answer questions about the report or sustainability issues. Investor relations or public relations contact representatives are not valid contacts for this question. -Initiatives/actions: to facilitate such contact, i.e. providing email address, phone number, or a link for feedback and questions.
4
DiscussionInitiatives/actions
Discussion Pg#
Initiatives Pg#
Environmental management structure-Discussion: of the organization's environmental management structure or staffing.-Initiatives/actions: include identification of individuals currently holding the staff positions.
19
DiscussionInitiatives/actions
Discussion Pg#
Initiatives Pg#
Environmental management system-Discussion: includes a statement of adoption of ISO 14001 or other formal environmental management system. -Initiatives/actions: include information on the extent to which the system has been implemented.
20
DiscussionInitiatives/actions
Discussion Pg#
Initiatives Pg#
Health and safety, or social organizational structure-Discussion: of organizational structure or staffing for ensuring health and safety or social responsibility.-Initiatives/actions: include identification of the individuals currently holding the staff positions.
51
DiscussionInitiatives/actions
Discussion Pg#
Initiatives Pg#
Stakeholder consultation-Discussion: of consultation and dialogue with stakeholders about the organization's environmental aspects or impacts.-Initiatives/actions: include identification of specific consultation activities.
23
DiscussionInitiatives/actions
Discussion Pg#
Initiatives Pg#
Environmental education-Discussion: of efforts to promote environmental education and awareness of employees, the general public, or children.-Initiatives/actions: taken to provide such education.
16
DiscussionInitiatives/actions
Discussion Pg#
Initiatives Pg#
Environmental accounting-Discussion: of environmental expenditures.-Initiatives/actions: include detailed accounting of such expenditures.
21
DiscussionInitiatives/actions
Discussion Pg#
Initiatives Pg#
Third-party validation-Discussion: of the value (or lack thereof) of third-party auditing or validation. -Initiatives/actions: include formal auditing or validation by a qualified external third-party source.
54
DiscussionInitiatives/actions
Discussion Pg#
Initiatives Pg#
Climate change/global warming-Discussion: of the organization's position on climate change and/or global warming.-Initiatives/actions: include measures taken by the organization to decrease its contribution to climate change.
10
DiscussionInitiatives/actions
Discussion Pg#
Initiatives Pg#
www.roberts.cmc.edu 59 Transportation and Logistics Sectors
Transportation and Logistics
Habitat/ecosystem conservation-Discussion: of the organization's position on conserving natural ecosystems and habitat.-Initiatives/actions: taken to increase conservation of natural ecosystems either associated with or separate from the organization's business activities.
11
DiscussionInitiatives/actions
Discussion Pg#
Initiatives Pg#
Biodiversity-Discussion: of the organization's position on biodiversity.-Initiatives/actions: taken by to the organization to foster biodiversity.
12
DiscussionInitiatives/actions
Discussion Pg#
Initiatives Pg#
Green purchasing-Discussion: about preferential purchasing of eco-friendly (non-polluting, recycled, recyclable, etc.) products.-Initiatives/actions: taken to implement such purchasing.
13
DiscussionInitiatives/actions
Discussion Pg#
Initiatives Pg#
Supplier screening based on social or environmental performance/ supplier management-Discussion: or description of procedures to evaluate and select suppliers on their ability to meet the requirements of the company's social or environmental policy and principles.-Initiatives/actions: include measures to implement or assure such screening or selection.
49
DiscussionInitiatives/actions
Discussion Pg#
Initiatives Pg#
Workforce profile: ethnicities/race-Discussion: of racial or ethnic distribution of workforce.-Initiatives/actions: taken to avoid racial or ethnic discrimination.
17
DiscussionInitiatives/actions
Discussion Pg#
Initiatives Pg#
Workforce profile: gender-Discussion: of gender distribution of workforce.-Initiatives/actions: taken to avoid gender discrimination and achieve appropriate balance
18
DiscussionInitiatives/actions
Discussion Pg#
Initiatives Pg#
Workforce profile: age-Discussion: of age distribution of workforce.-Initiatives/actions: include measures taken to avoid age discrimination or to encourage a balanced age structure.
52
DiscussionInitiatives/actions
Discussion Pg#
Initiatives Pg#
Employment for individuals with disabilities-Discussion: of appropriate actions to accommodate employees with disabilities.-Initiatives/actions: taken to implement such accommodations.
80
DiscussionInitiatives/actions
Discussion Pg#
Initiatives Pg#
Emergency preparedness program-Discussion: of emergency preparedness programs to prepare employees or the public to cope with potential emergencies at the organization's facilities.-Initiatives/actions: include measures taken to implement such programs.
53
DiscussionInitiatives/actions
Discussion Pg#
Initiatives Pg#
Employee training for career development-Discussion: of training, skills and learning programs appropriate to support employees' upward mobility.-Initiatives/actions: taken to implement such training.
82
DiscussionInitiatives/actions
Discussion Pg#
Initiatives Pg#
Code of conduct or business ethics-Discussion: includes a formal organizational code of conduct or of ethical behavior.-Initiatives/actions: include measures to assure that the code of conduct is followed.
47
DiscussionInitiatives/actions
Discussion Pg#
Initiatives Pg#
Energy used (total)Sum of the energy used by the organization in all different forms, including electricity, fuel, natural gas and others.
26
Discussion Discussion Pg#:Context Pg#:
Goal Pg#:Quant Pg#:
Prev Quan Pg#:Improve Pg#
Year Data Values Units
ContextGoalCurrent Period Quantitative DataPrevious Quantitative DataImprovement Over Previous
Renewable energy usedEnergy used from renewable sources such as wind, solar, hydroelectric, or other renewable sources.
27
Discussion Discussion Pg#:Context Pg#:
Goal Pg#:Quant Pg#:
Prev Quan Pg#:Improve Pg#
Year Data Values Units
ContextGoalCurrent Period Quantitative DataPrevious Quantitative DataImprovement Over Previous
www.roberts.cmc.edu 60 Transportation and Logistics Sectors
Transportation and Logistics
Waste recycled: solid wasteSum of all solid waste recycled, including hazardous waste.
30
Discussion Discussion Pg#:Context Pg#:
Goal Pg#:Quant Pg#:
Prev Quan Pg#:Improve Pg#
Year Data Values Units
ContextGoalCurrent Period Quantitative DataPrevious Quantitative DataImprovement Over Previous
Waste (office) recycledOffice recycling of paper, cardboard, metal, or plastic.
32
Discussion Discussion Pg#:Context Pg#:
Goal Pg#:Quant Pg#:
Prev Quan Pg#:Improve Pg#
Year Data Values Units
ContextGoalCurrent Period Quantitative DataPrevious Quantitative DataImprovement Over Previous
Waste (solid) disposed ofIncludes solid hazardous and non-hazardous waste landfilled, incinerated, or transferred.
34
Discussion Discussion Pg#:Context Pg#:
Goal Pg#:Quant Pg#:
Prev Quan Pg#:Improve Pg#
Year Data Values Units
ContextGoalCurrent Period Quantitative DataPrevious Quantitative DataImprovement Over Previous
Waste (hazardous) producedSum of all hazardous materials remaining after production, irrespective of final disposition. Hazardous wastes include items identified as TRI, PRTR, HAP (Hazardous Air Pollutants), and similar indices, and may include mercury or lead. Depending on the nationality of the organization, this could be labeled "TRI" (Toxic Release Inventory,) "substance releases" , or something else.
35
Discussion Discussion Pg#:Context Pg#:
Goal Pg#:Quant Pg#:
Prev Quan Pg#:Improve Pg#
Year Data Values Units
ContextGoalCurrent Period Quantitative DataPrevious Quantitative DataImprovement Over Previous
Waste (hazardous) released to the environmentAmounts of hazardous materials released into the environment, total (TRI, PRTR, HAP (Hazardous Air Pollutants), and similar indices), may include mercury or lead. Depending on the nationality of the organization, this could be labeled "TRI" (Toxic Release Inventory), "substance releases," or something else.
37
Discussion Discussion Pg#:Context Pg#:
Goal Pg#:Quant Pg#:
Prev Quan Pg#:Improve Pg#
Year Data Values Units
ContextGoalCurrent Period Quantitative DataPrevious Quantitative DataImprovement Over Previous
Water usedSum of all water used during operations.
29
Discussion Discussion Pg#:Context Pg#:
Goal Pg#:Quant Pg#:
Prev Quan Pg#:Improve Pg#
Year Data Values Units
ContextGoalCurrent Period Quantitative DataPrevious Quantitative DataImprovement Over Previous
www.roberts.cmc.edu 61 Transportation and Logistics Sectors
Transportation and Logistics
Greenhouse gases (or CO2 equivalents), totalThe sum of all greenhouse gases released, which could include CO2, CH4 (methane), N2O (nitrous oxide), SF6 (Sulphur hexafluoride), PFCs (Perfluorocarbons) and HFCs (hydrofluorocarbons).
83
Discussion Discussion Pg#:Context Pg#:
Goal Pg#:Quant Pg#:
Prev Quan Pg#:Improve Pg#
Year Data Values Units
ContextGoalCurrent Period Quantitative DataPrevious Quantitative DataImprovement Over Previous
Employee turnover rateAnnual employee turnover rate.
3
Discussion Discussion Pg#:Context Pg#:
Goal Pg#:Quant Pg#:
Prev Quan Pg#:Improve Pg#
Year Data Values Units
ContextGoalCurrent Period Quantitative DataPrevious Quantitative DataImprovement Over Previous
Recordable incident/accident rateNumber of employee incidents or accidents, such as: “total case incident rate,” “incident rate,” or "accident rate."
74
Discussion Discussion Pg#:Context Pg#:
Goal Pg#:Quant Pg#:
Prev Quan Pg#:Improve Pg#
Year Data Values Units
ContextGoalCurrent Period Quantitative DataPrevious Quantitative DataImprovement Over Previous
Lost workday case rateNumber of employee injuries or illnesses that resulted in one or more lost workdays.
75
Discussion Discussion Pg#:Context Pg#:
Goal Pg#:Quant Pg#:
Prev Quan Pg#:Improve Pg#
Year Data Values Units
ContextGoalCurrent Period Quantitative DataPrevious Quantitative DataImprovement Over Previous
Social community investmentAmount of money spent on community outreach, including education grants, donations, and relief effort funds.
81
Discussion Discussion Pg#:Context Pg#:
Goal Pg#:Quant Pg#:
Prev Quan Pg#:Improve Pg#
Year Data Values Units
ContextGoalCurrent Period Quantitative DataPrevious Quantitative DataImprovement Over Previous
Notices of violation (environmental)Notices of violation (NOVs) for environmental infractions.
38
Discussion Discussion Pg#:Context Pg#:
Goal Pg#:Quant Pg#:
Prev Quan Pg#:Improve Pg#
Year Data Values Units
ContextGoalCurrent Period Quantitative DataPrevious Quantitative DataImprovement Over Previous
www.roberts.cmc.edu 62 Transportation and Logistics Sectors
Transportation and Logistics
Environmental expenses and investmentsAn accounting of money spent or invested specifically to decrease environmental damage or to benefit the environment.
39
Discussion Discussion Pg#:Context Pg#:
Goal Pg#:Quant Pg#:
Prev Quan Pg#:Improve Pg#
Year Data Values Units
ContextGoalCurrent Period Quantitative DataPrevious Quantitative DataImprovement Over Previous
Fines (environmental)Government imposed fines for environmental infractions.
40
Discussion Discussion Pg#:Context Pg#:
Goal Pg#:Quant Pg#:
Prev Quan Pg#:Improve Pg#
Year Data Values Units
ContextGoalCurrent Period Quantitative DataPrevious Quantitative DataImprovement Over Previous
Health and safety citationsNumber of health and safety citations or notices of violation. If it is stated that there were none, check lines 1,2,3, 4, and 6.
76
Discussion Discussion Pg#:Context Pg#:
Goal Pg#:Quant Pg#:
Prev Quan Pg#:Improve Pg#
Year Data Values Units
ContextGoalCurrent Period Quantitative DataPrevious Quantitative DataImprovement Over Previous
Health and safety finesFines levied against a company for health and safety violations.
77
Discussion Discussion Pg#:Context Pg#:
Goal Pg#:Quant Pg#:
Prev Quan Pg#:Improve Pg#
Year Data Values Units
ContextGoalCurrent Period Quantitative DataPrevious Quantitative DataImprovement Over Previous
Women in managementRelative numbers of women in management.
2
Discussion Discussion Pg#:
Context Pg#:Improve Pg#:
Initiative Pg#:Initiatives/ActionContextImprovement Over Previous
Employee satisfaction surveysSurveys to monitor employee satisfaction.
67
Discussion Discussion Pg#:
Context Pg#:Improve Pg#:
Initiative Pg#:Initiatives/ActionContextImprovement Over Previous
Occupational health and safety protectionEfforts to provide a safe and healthy working environment at all sites.
70
Discussion Discussion Pg#:
Context Pg#:Improve Pg#:
Initiative Pg#:Initiatives/ActionContextImprovement Over Previous
Employee volunteerismEfforts to promote employee volunteerism in social or environmental projects.
72
Discussion Discussion Pg#:
Context Pg#:Improve Pg#:
Initiative Pg#:Initiatives/ActionContextImprovement Over Previous
Community developmentEfforts to participate in social activities that improve the quality of life of communities including that of indigenous people, where the organization operates.
66
Discussion Discussion Pg#:
Context Pg#:Improve Pg#:
Initiative Pg#:Initiatives/ActionContextImprovement Over Previous
www.roberts.cmc.edu 63 Transportation and Logistics Sectors
Transportation and Logistics
Community educationEfforts to support education in the communities where the company is located.
68
Discussion Discussion Pg#:
Context Pg#:Improve Pg#:
Initiative Pg#:Initiatives/ActionContextImprovement Over Previous
Sexual harassmentRejection of any form of sexual harassment.
1
Initiative Pg#:Policy Adopt Pg#:
Monitoring Pg#:Qty Perf Pg#:
Adoption of PolicyAction to Reinforce PolicyMonitoringQuant. Indication of Compliance
Political contributionsPolicy about political contributions.
7
Initiative Pg#:Policy Adopt Pg#:
Monitoring Pg#:Qty Perf Pg#:
Adoption of PolicyAction to Reinforce PolicyMonitoringQuant. Indication of Compliance
BriberyRejection of bribery
8
Initiative Pg#:Policy Adopt Pg#:
Monitoring Pg#:Qty Perf Pg#:
Adoption of PolicyAction to Reinforce PolicyMonitoringQuant. Indication of Compliance
Anti-corruption practicesEfforts to uphold the highest standards of business ethics and integrity. May be foundunder a Code of Conduct.
58
Initiative Pg#:Policy Adopt Pg#:
Monitoring Pg#:Qty Perf Pg#:
Adoption of PolicyAction to Reinforce PolicyMonitoringQuant. Indication of Compliance
Fair compensation of employeesAssurance that wages paid meet or exceed legal or industry minimum standard.
62
Initiative Pg#:Policy Adopt Pg#:
Monitoring Pg#:Qty Perf Pg#:
Adoption of PolicyAction to Reinforce PolicyMonitoringQuant. Indication of Compliance
Reasonable working hoursCompliance with applicable laws and industry standards on working hours, including overtime.
64
Initiative Pg#:Policy Adopt Pg#:
Monitoring Pg#:Qty Perf Pg#:
Adoption of PolicyAction to Reinforce PolicyMonitoringQuant. Indication of Compliance
Degrading treatment or punishment of employeesCommitment to oppose any corporal/hard labor punishment, mental/physical coercion, or verbal abuse.
59
Initiative Pg#:Policy Adopt Pg#:
Monitoring Pg#:Qty Perf Pg#:
Adoption of PolicyAction to Reinforce PolicyMonitoringQuant. Indication of Compliance
Elimination of discrimination in respect to employment and occupationCommitment not to engage in any kind of discrimination based on ethnicity, caste, religion, disability, sex, age, sexual orientation, union membership, or political affiliation in hiring practices or employee treatment.
60
Initiative Pg#:Policy Adopt Pg#:
Monitoring Pg#:Qty Perf Pg#:
Adoption of PolicyAction to Reinforce PolicyMonitoringQuant. Indication of Compliance
Free association and collective bargaining of employeesEfforts to respect the right of employees to form and join trade unions of their choice and to bargain collectively.
61
Initiative Pg#:Policy Adopt Pg#:
Monitoring Pg#:Qty Perf Pg#:
Adoption of PolicyAction to Reinforce PolicyMonitoringQuant. Indication of Compliance
Elimination of all forms of forced and compulsory laborAssurance that all employees enter employment with the company of their own free will, not by compulsion.
63
Initiative Pg#:Policy Adopt Pg#:
Monitoring Pg#:Qty Perf Pg#:
Adoption of PolicyAction to Reinforce PolicyMonitoringQuant. Indication of Compliance
Effective abolition of child laborRejection of illegal child labor by the company or its affiliates.
65
Initiative Pg#:Policy Adopt Pg#:
Monitoring Pg#:Qty Perf Pg#:
Adoption of PolicyAction to Reinforce PolicyMonitoringQuant. Indication of Compliance
www.roberts.cmc.edu 64 Transportation and Logistics Sectors
A.P. Moller-Maersk, ABN AMROHolding, Air France-KLM, All Nippon Airways, British Airways, CathayPacific Airways, Central Japan Railway, China Cosco Holdings, ContinentalAirlines, Delta Airlines, Deutsche Post DHL, East Japan Railway, FedEx, Kawasaki Kisen Kaisha, Kühne & NagelIntl, Lufthansa Group, Mitsui OSK Lines, Nippon Express, Nippon YusenK a i s h a ( N Y K ) , Q a n t a s A i r w a y s , Singapore Airlines, STX Corp, TNT,Tokyu, Union Pacific, United Airlines, United Parcel Service, US Airways Group, West Japan Rai lway, andY a m a t o H o l d i n g s .
Contact InformationContact Information
Roberts Environmental CenterRoberts Environmental Center
The Roberts Environmental Center is a research institute at Claremont McKenna College, endowed by George R. Roberts, Founding Partner, Kohlberg Kravis Roberts & Co. The Center is managed by faculty and staff, and its research, including the material in this report, is done by students at the Claremont Colleges.
Dr. J. Emil Morhardt, Director, Phone: 909-621-8190, email: [email protected] Adidjaja, Research Fellow, Phone: 909-621-8698, email: [email protected] Environmental Center, Claremont McKenna College, 925 N. Mills Avenue, Claremont, CA 91711-5916, USA.
Claremont McKenna College, a member of the Claremont Colleges, is a highly selective, independent, coeducational, residential, undergraduate liberal arts college with a curricular emphasis on economics, government, and public affairs.
Claremont McKenna CollegeClaremont McKenna College
The Claremont CollegesThe Claremont CollegesThe Claremont Colleges form a consortium of five undergraduate liberal arts colleges and two graduate institutions based on the Oxford/Cambridge model. The consortium offers students diverse opportunities and resources typically found only at much larger universities. The consortium members include Claremont McKenna College, Harvey Mudd College, Pitzer College, Pomona College, Scripps College, Keck Graduate Institute of Applied Life Sciences, and the Clremont Graduate University which—includes the Peter F. Drucker and Masatoshi Ito Graduate School of Management.