Embed Size (px)
Citation preview

in the European Union in 2011
Energy Markets
Energy
ISSN 1831-5666


in the European Union in 2011
Energy Markets

This publication presents the Commission Staff Working Document SWD(2012) 368 final of 15 November 2012 accompanying the Communication ‘Making the internal energy market work’ (COM(2012) 663 final).
Legal notice: The European Commission does not guarantee the accuracy of the data included in this publication, nor does it accept responsibility for any use made thereof.
Some data included in this report are subject to database rights and/or third party copyright.
Europe Direct is a service to help you find answers to your questions about the European Union
Freephone number (*):
00 800 6 7 8 9 10 11
(*) Certain mobile telephone operators do not allow access
to 00 800 numbers or these calls may be billed.
More information on the European Union is available on the Internet (http://europa.eu).
Cataloguing data can be found at the end of this publication.
Luxembourg: Publications Office of the European Union, 2012
ISBN 978-92-79-25489-5 doi:10.2833/12806
© European Union, 2012 Reproduction is authorised provided the source is acknowledged.
Printed in Belgium
Printed on white chlorine-free paper

Table of contents1. Executive summary . . . . . . . . . . . . . . . . . . . . . . . . . . . . . . . . . . . . . . . . . . . . . . . . . . . . . . . . . . . . . . . . . . . . . 6
2. Overview of energy markets in the European Union . . . . . . . . . . . . . . . . . . . . . . . . . 10
1. Energy position of the EU . . . . . . . . . . . . . . . . . . . . . . . . . . . . . . . . . . . . . . . . . . . . . . . . . . . . . . . . . . . . . . 10
1.1. EU energy consumption . . . . . . . . . . . . . . . . . . . . . . . . . . . . . . . . . . . . . . . . . . . . . . . . . . . . . . . . . . . . . 10
1.1.1. Gross inland consumption (energy mix) . . . . . . . . . . . . . . . . . . . . . . . . . . . . . . . . . . . . . . . . 10
1.1.2. Uses of energy sources by sector . . . . . . . . . . . . . . . . . . . . . . . . . . . . . . . . . . . . . . . . . . . . . 11
1.1.3. Energy intensity . . . . . . . . . . . . . . . . . . . . . . . . . . . . . . . . . . . . . . . . . . . . . . . . . . . . . . . . . . . . . 12
1.2. EU energy supply . . . . . . . . . . . . . . . . . . . . . . . . . . . . . . . . . . . . . . . . . . . . . . . . . . . . . . . . . . . . . . . . . . . 13
1.2.1. EU primary energy production . . . . . . . . . . . . . . . . . . . . . . . . . . . . . . . . . . . . . . . . . . . . . . . . 13
1.2.2. EU electricity generation . . . . . . . . . . . . . . . . . . . . . . . . . . . . . . . . . . . . . . . . . . . . . . . . . . . . . 14
1.2.3. EU energy imports . . . . . . . . . . . . . . . . . . . . . . . . . . . . . . . . . . . . . . . . . . . . . . . . . . . . . . . . . . . 14
1.2.4. EU import dependency . . . . . . . . . . . . . . . . . . . . . . . . . . . . . . . . . . . . . . . . . . . . . . . . . . . . . . . 16
EU-27 – RENEWABLE ENERGY SOURCES . . . . . . . . . . . . . . . . . . . . . . . . . . . . . . . . . . . . . . . . . . . . . . . . . . 17
RES consumption . . . . . . . . . . . . . . . . . . . . . . . . . . . . . . . . . . . . . . . . . . . . . . . . . . . . . . . . . . . . . . . . . . 17
RES production . . . . . . . . . . . . . . . . . . . . . . . . . . . . . . . . . . . . . . . . . . . . . . . . . . . . . . . . . . . . . . . . . . . . . 18
Electricity from RES . . . . . . . . . . . . . . . . . . . . . . . . . . . . . . . . . . . . . . . . . . . . . . . . . . . . . . . . . . . . . . . . 19
2. Market developments in the EU gas sector . . . . . . . . . . . . . . . . . . . . . . . . . . . . . . . . . . . . . . . . . . . . 20
2.1. Wholesale markets . . . . . . . . . . . . . . . . . . . . . . . . . . . . . . . . . . . . . . . . . . . . . . . . . . . . . . . . . . . . . . . . . 20
2.2. Market structure and unbundling . . . . . . . . . . . . . . . . . . . . . . . . . . . . . . . . . . . . . . . . . . . . . . . . . . . . 28
2.3. Retail markets . . . . . . . . . . . . . . . . . . . . . . . . . . . . . . . . . . . . . . . . . . . . . . . . . . . . . . . . . . . . . . . . . . . . . . 32
3. European electricity markets . . . . . . . . . . . . . . . . . . . . . . . . . . . . . . . . . . . . . . . . . . . . . . . . . . . . . . . . . . 37
3.1. Power supply sources and wholesale markets . . . . . . . . . . . . . . . . . . . . . . . . . . . . . . . . . . . . . . . . 37
3.2. Market structure and unbundling . . . . . . . . . . . . . . . . . . . . . . . . . . . . . . . . . . . . . . . . . . . . . . . . . . . . 42
3.3. Retail markets . . . . . . . . . . . . . . . . . . . . . . . . . . . . . . . . . . . . . . . . . . . . . . . . . . . . . . . . . . . . . . . . . . . . . . 44
EN
ER
GY
M
AR
KE
TS
I
N
TH
E
EU
RO
PE
AN
U
NI
ON
I
N
20
11
/
3

3. Country reports . . . . . . . . . . . . . . . . . . . . . . . . . . . . . . . . . . . . . . . . . . . . . . . . . . . . . . . . . . . . . . . . . . . . . . . . . 53
BELGIUM . . . . . . . . . . . . . . . . . . . . . . . . . . . . . . . . . . . . . . . . . . . . . . . . . . . . . . . . . . . . . . . . . . . . . . . . . . . 54
BULGARIA . . . . . . . . . . . . . . . . . . . . . . . . . . . . . . . . . . . . . . . . . . . . . . . . . . . . . . . . . . . . . . . . . . . . . . . . . . 58
CZECH REPUBLIC . . . . . . . . . . . . . . . . . . . . . . . . . . . . . . . . . . . . . . . . . . . . . . . . . . . . . . . . . . . . . . . . . . . 62
DENMARK . . . . . . . . . . . . . . . . . . . . . . . . . . . . . . . . . . . . . . . . . . . . . . . . . . . . . . . . . . . . . . . . . . . . . . . . . . 66
GERMANY . . . . . . . . . . . . . . . . . . . . . . . . . . . . . . . . . . . . . . . . . . . . . . . . . . . . . . . . . . . . . . . . . . . . . . . . . . 70
ESTONIA . . . . . . . . . . . . . . . . . . . . . . . . . . . . . . . . . . . . . . . . . . . . . . . . . . . . . . . . . . . . . . . . . . . . . . . . . . . 74
IRELAND . . . . . . . . . . . . . . . . . . . . . . . . . . . . . . . . . . . . . . . . . . . . . . . . . . . . . . . . . . . . . . . . . . . . . . . . . . . 78
GREECE . . . . . . . . . . . . . . . . . . . . . . . . . . . . . . . . . . . . . . . . . . . . . . . . . . . . . . . . . . . . . . . . . . . . . . . . . . . . 82
SPAIN . . . . . . . . . . . . . . . . . . . . . . . . . . . . . . . . . . . . . . . . . . . . . . . . . . . . . . . . . . . . . . . . . . . . . . . . . . . . . . 86
FRANCE . . . . . . . . . . . . . . . . . . . . . . . . . . . . . . . . . . . . . . . . . . . . . . . . . . . . . . . . . . . . . . . . . . . . . . . . . . . . 90
ITALY . . . . . . . . . . . . . . . . . . . . . . . . . . . . . . . . . . . . . . . . . . . . . . . . . . . . . . . . . . . . . . . . . . . . . . . . . . . . . . . 94
CYPRUS . . . . . . . . . . . . . . . . . . . . . . . . . . . . . . . . . . . . . . . . . . . . . . . . . . . . . . . . . . . . . . . . . . . . . . . . . . . . 98
LATVIA . . . . . . . . . . . . . . . . . . . . . . . . . . . . . . . . . . . . . . . . . . . . . . . . . . . . . . . . . . . . . . . . . . . . . . . . . . . . 101
LITHUANIA . . . . . . . . . . . . . . . . . . . . . . . . . . . . . . . . . . . . . . . . . . . . . . . . . . . . . . . . . . . . . . . . . . . . . . . . 104
LUXEMBOURG . . . . . . . . . . . . . . . . . . . . . . . . . . . . . . . . . . . . . . . . . . . . . . . . . . . . . . . . . . . . . . . . . . . . 108
HUNGARY . . . . . . . . . . . . . . . . . . . . . . . . . . . . . . . . . . . . . . . . . . . . . . . . . . . . . . . . . . . . . . . . . . . . . . . . . 111
MALTA . . . . . . . . . . . . . . . . . . . . . . . . . . . . . . . . . . . . . . . . . . . . . . . . . . . . . . . . . . . . . . . . . . . . . . . . . . . . 114
EN
ER
GY
M
AR
KE
TS
I
N
TH
E
EU
RO
PE
AN
U
NI
ON
I
N
20
11
/
4

THE NETHERLANDS . . . . . . . . . . . . . . . . . . . . . . . . . . . . . . . . . . . . . . . . . . . . . . . . . . . . . . . . . . . . . . . 117
AUSTRIA . . . . . . . . . . . . . . . . . . . . . . . . . . . . . . . . . . . . . . . . . . . . . . . . . . . . . . . . . . . . . . . . . . . . . . . . . . 121
POLAND . . . . . . . . . . . . . . . . . . . . . . . . . . . . . . . . . . . . . . . . . . . . . . . . . . . . . . . . . . . . . . . . . . . . . . . . . . 125
PORTUGAL . . . . . . . . . . . . . . . . . . . . . . . . . . . . . . . . . . . . . . . . . . . . . . . . . . . . . . . . . . . . . . . . . . . . . . . . 129
ROMANIA . . . . . . . . . . . . . . . . . . . . . . . . . . . . . . . . . . . . . . . . . . . . . . . . . . . . . . . . . . . . . . . . . . . . . . . . . 132
SLOVENIA . . . . . . . . . . . . . . . . . . . . . . . . . . . . . . . . . . . . . . . . . . . . . . . . . . . . . . . . . . . . . . . . . . . . . . . . . 136
SLOVAKIA . . . . . . . . . . . . . . . . . . . . . . . . . . . . . . . . . . . . . . . . . . . . . . . . . . . . . . . . . . . . . . . . . . . . . . . . . 139
FINLAND . . . . . . . . . . . . . . . . . . . . . . . . . . . . . . . . . . . . . . . . . . . . . . . . . . . . . . . . . . . . . . . . . . . . . . . . . . 143
SWEDEN . . . . . . . . . . . . . . . . . . . . . . . . . . . . . . . . . . . . . . . . . . . . . . . . . . . . . . . . . . . . . . . . . . . . . . . . . . 146
UNITED KINGDOM . . . . . . . . . . . . . . . . . . . . . . . . . . . . . . . . . . . . . . . . . . . . . . . . . . . . . . . . . . . . . . . . 150
4. Infringement procedures on the 2nd and 3rd Energy Package . . . . . . . . . . . . . . . . . . . . . . . . . . . . . . . . . . . . . . . . . . . . . . . 154
Glossary . . . . . . . . . . . . . . . . . . . . . . . . . . . . . . . . . . . . . . . . . . . . . . . . . . . . . . . . . . . . . . . . . . . . . . . . . . . . . . . . . . . . . 156
Abbreviations . . . . . . . . . . . . . . . . . . . . . . . . . . . . . . . . . . . . . . . . . . . . . . . . . . . . . . . . . . . . . . . . . . . . . . . . . . . . . . 158
EN
ER
GY
M
AR
KE
TS
I
N
TH
E
EU
RO
PE
AN
U
NI
ON
I
N
20
11
/
5

EN
ER
GY
M
AR
KE
TS
I
N
TH
E
EU
RO
PE
AN
U
NI
ON
I
N
20
11
/
6
1. Executive summary1. Background to this report
This Staff Working Document contains important background information relevant to the Communication on the Internal Energy Market ‘Making Energy Markets Work’. It consists of four parts: an Executive Summary (Part I), an overview of the EU electricity and gas markets which includes key statistical data of the European energy markets (Part II), a country chapter (Part III) that provides country-specific analysis for all of the 27 Member States of the EU and a state of play of infringement procedures (Part IV). The Commission is legally bound to report on the progress towards the creation of the internal energy market on the basis of Article 47(6) of the Electricity Directive and Article 52(6) of the Gas Directive.
The purpose of the country reports (Part III) is to take stock, in quantitative terms, of the state of the market in terms of energy mix, the renewables target, the development of trade, wholesale and retail markets, consumers’ rights and empowerment and, finally, infrastructure in each Member State. As far as the implementation of the Third energy package is concerned, the document assesses the status of notification by Member States of transposition measures by 29 October 2012. Part IV provides an overview of all infringement cases, including information as to whether they are pending or closed. The Commission is conducting compliance checks on all notified transposition measures. The reports also contain, for each Member State, the action points that are most urgent, in the Commission’s view and also in line with the Council recommendations on the National Reform Programmes 20121.
The bulk of the information provided in the country reports is based on the national monitoring reports as submitted by the national regulatory authorities in the second half of 2011, monitoring the year 2010. Data on renewables, energy mixes and energy import and export volumes are mostly based on Eurostat data, and also refer to 2010. Where possible and appropriate, more recent data have been taken into account. Annual average wholesale prices and traded volumes of electricity and gas refer to 2011 and
1. http://ec.europa.eu/europe2020/making-it-happen/country-
specific-recommendations/index_en.htm
are derived either from commercial data providers or from the national regulators. Electricity and gas retail prices and a breakdown of price bewteen energy costs, network costs and taxes are also taken from Eurostat and refer to the year 2011. Data in the ‘Key indicators’ table are derived from Eurostat, the European Energy regulators database, the national regulators and ACER, backed up by own estimations.
2. Main messages
Message 1: Increasing share of RES and energy savings achieved
While crude oil and petroleum products still dominated energy consumption in 2010 in the EU, their share continued to fall between 2009 and 2010. Over the same period, the share of nuclear and solid fuels was stable, while that of natural gas and renewables increased. Renewables accounted for 12.5% of the EU’s energy consumption in 2010, an increase of four percentage points in five years2.
The production of crude oil and petroleum products in the EU also declined in 2010, continuing the trend of recent years. While the production of solid fuels declined slightly, that of natural gas and nuclear energy posted moderate increases. Production of renewables grew by 12% in 2010 alone.
In power generation, only oil experienced negative growth between 2009 and 2010, while renewables registered the highest rate of growth (13%), with solar power generation registering particularly high growth (63%). Positive growth in both renewables and nuclear power generation led to almost half of the EU’s electricity being produced from low carbon sources in 2010 (21% and 27% respectively).
In addition, there was evidence of energy savings achieved in the EU in 2010, and in particular energy saving measures that contributed to lower electricity consumption, mainly by industry.
2. Share of renewables in gross final consumption (indicator used for
the 2020 target of 20%). The share of renewables in gross inland
consumption (energy mix) was 10% in 2010.
EN
ER
GY
M
AR
KE
TS
I
N
TH
E
EU
RO
PE
AN
U
NI
ON
I
N
20
11
/
7
Message 2: Slight fall in import dependency and falling LNG imports
Between 2009 and 2010, overall energy import dependency in the EU fell slightly, due to falling import dependency registered in solid fuels and natural gas. The EU’s import dependency had also fallen between 2008 and 2009, due to falling import dependency of both crude oil and solid fuels. The EU’s overall energy import dependency in 2010 was 52.7%, compared to the historic high of 54.6% recorded in 2008.
Falling import dependency of solid fuels and crude oil in 2009 can be explained in terms of both falling net imports as well as falling consumption at a time of economic recession.
Falling import dependency in natural gas in 2010 occurred despite both rising net imports and consumption; this was mainly due to big reductions in gas storage levels to meet steep increases in demand during the fourth quarter of 2010. In the case of solid fuels, substantial storage withdrawals were also made to meet the much higher demand. Thus, the fact that a large proportion of the - largely unexpected - increases in demand in both solid fuels and natural gas in 2010 were met by domestically stocked resources explains the falling dependency on imports in these two energy sources.
However, between 2010 and 2011, this was followed by a fall in natural gas consumption, which registered its lowest level since 2000. Alongside this fall in consumption, there was also evidence of falling imports in natural gas in 2011. In particular, LNG imports fell heavily (-26%) in the second half of 2011, relative to the first half of the year, in contrast to rising import levels between the 1st and 2nd half of the previous year.
Having risen to represent an important share of natural gas imports by 2011 (20%), a fall in LNG imports occurred, together with a continuing rise in the difference between the superior prices paid for LNG deliveries to Japan and Asia relative to LNG prices in the EU. Parallel to this growing premium, there were significant increases in demand for LNG from Japan, following the Fukushima nuclear outages earlier in the year due to the tsunami.
Together with the growing domestic production of shale gas in the US, events in Japan have therefore contributed - in a relatively short period of time - to a shift from the EU being primarily in competition with the US for LNG supplies, to competing with Asia.
Message 3: Increased gas-to-gas competition alongside increases in oil-indexed gas prices
Another key issue in the EU gas markets in 2011 was the continued increases in oil-indexed prices of Long Term Contracts (LTC) for gas. Relative to stable traded spot prices, this signified a reversal in the narrowing of the gap between the two pricing mechanisms in 2010.
This renewed divergence in gas price contracts coincided with reports of pressure being put by importers on gas producers to reflect movements of hub-traded gas prices in their LTC contracts. If the price of gas purchased via LTC contracts were to continue to exceed the price of spot gas in the EU in the future, it would continue to give cause for concern on the part of European utilities who would have to buy gas under long term, oil-indexed contracts, while being pressured by their own customers to sell at lower spot levels.
Competitive prices of traded gas provided a boost to spot traded volumes in continental EU, which registered a significant, double digit (27%) increase between 2010 and 2011. They also contributed to a significant fall in the share of oil-indexed gas contracts in 2010 in Europe (accounting for 68% of natural gas consumption in 2009, down to 59% in 2010), as the proportion of spot purchased gas increased significantly (from 27% of natural gas consumption in 2009 to 37% in 2010).
In 2010 and 2011 there were therefore further signs of the continued emergence of true gas-to-gas competition, whereby the price of gas is ultimately determined by gas market fundamentals and by the interplay of gas supply and demand, traded over a variety of different periods, rather than by oil and oil product markets.
Message 4: Increasing liquidity & higher integration of EU power markets
While traded volumes of power in the EU have not grown to the same extent as traded volumes of gas in recent years, power market liquidity3 has increased almost continuously between 2005 and 2011. Increasing market liquidity is indispensable for the proper functioning of a wholesale market and for the formation of competitive prices, thereby ensuring welfare benefits for consumers.
The increasing role of wholesale power trading markets in Europe has meant that electricity prices are increasingly being determined by the relationship of demand and supply in the market.
3. See definition under section 3.1

EN
ER
GY
M
AR
KE
TS
I
N
TH
E
EU
RO
PE
AN
U
NI
ON
I
N
20
11
/
8
In the process of integrating wholesale electricity markets among neighbouring countries, market coupling is playing an increasingly important role in the EU. Market coupling allows players to trade directly between markets by benefiting automatically from cross-border capacities, without having explicitly acquired the required transmission capacity in individual markets. Market coupling has been spreading steadily from the North-West of the EU to other regions, and there are currently 18 Member States which have such a system in place4.
In the Central West European (CWE) power markets, where market coupling took place in November 2010, a steep fall in adverse power flows (flows going from a high price area to a low price area) occurred in Q4 2010 and, from the first quarter of 2011, adverse flows became virtually non-existent in the region. Disappearing adverse flows and a high ratio of hourly converging prices within an observed time period both indicate a well-functioning, integrated wholesale power market.
The lack of market coupling prevents prices from acting as effective signals for the direction of power flows between markets. It should therefore be regarded as an effective, market-based tool contributing to the achievement of a single European wholesale electricity market.
Better integration of European wholesale power markets, which has enabled more convergent wholesale power prices, could be a factor explaining why power prices did not follow the sharp increase in fossil fuel prices in the last couple of years. This achievement also underlines the importance of European-level electricity market policy and the need to fully implement the successive energy packages.
Message 5: Competition in place, but room for improvements. Switching rates still too low
Gas
Between 2009 and 2010, the number of operators on the transmission and distribution grid of the gas system in most Member States remained stable. By 2010, there were more than ten gas supplying companies in the majority of Member States.
As regards the number of gas importers, less than half of the Member States had more than ten gas importing companies. Furthermore, the market share of the largest gas importers
4. Central Western Europe (Germany, France, the Netherlands, Belgium
and Luxembourg); Nord Pool Spot (Sweden, Finland, Denmark,
Estonia, Lithuania and Norway), Czech Republic/Slovakia/Hungary,
Slovenia/Italy, Spain/Portugal, Poland/Sweden. Central Western
Europe and Nord Pool Spot are also coupled.
exceeded 50% in 14 out of the 20 Member States for which information was available (and over 80% in five Member States). On the gas retail side, while all but six Member States had ten or more companies supplying natural gas to final consumers, the market share of the largest retailer exceeded 50% in 13 Member States (and it even exceeded 80% in eight Member States).
The available data show that switching rates continued to be low across all categories of consumers in 2010, with few exceptions (such as the UK and Italy). In addition, switching rates continue to be typically the lowest in the small industry and household category.
Power
In power markets, concentration in power generation continues to be high in most Member States, while the total number of power generation companies present in the market reached a three-digit to four-digit figure in a few Member States. The market share of the largest generators is, however, larger than 50% in 11 Member States (and larger than 80% in six Member States).
There were 18 Member States in the power retail markets which had more than 20 electricity suppliers, while there were three or more main electricity suppliers in 20 Member States (i.e. selling more than 5% of the total national electricity consumption).
By 2010, most of the EU Member States had only one TSO, while six Member States had two or more. In addition, ownership unbundling had occurred in about half of the EU Member States.
As for the gas sector, switching between power suppliers in 2010 remained low, and was more apparent among medium to large size industrial consumers. In the case of household consumers, the ratio of households that switched suppliers was low in all Member States of the EU.
In both the gas and the power markets, the data on switching rates therefore seem to suggest that the issue of cost-effectiveness is still a cause for concern, mainly among industrial customers. Lack of knowledge about the potential for switching also still seems to prevail among household consumers.

EN
ER
GY
M
AR
KE
TS
I
N
TH
E
EU
RO
PE
AN
U
NI
ON
I
N
20
11
/
9
Message 6: Retail prices on the increase, with little convergence between Member States
Gas
Both EU households and industries experienced average increases in excess of 10% in gas retail prices in 2011 relative to 2010.
Comparisons between the retail prices for gas across the EU in 2010 reveal significant differences between Member States, with the price paid in the most expensive Member State representing several times the price paid in the cheapest. In addition, the difference is greater for households than for businesses, while the gap in the case of households has actually been widening in recent years.
However, retail prices in some Member States are artificially low. Indeed, some Member States continue to regulate the retail prices of natural gas for groups of industrial and household consumers.
Power
With some exceptions, there were increases in retail power prices for both households and industrial customers throughout the EU in 2011, although on average the increases were lower than in the case of gas retail prices.
As with gas retail prices, major differences persist between prices in different EU Member States, with no significant change being observed in the case of household prices in recent years.
Variations in retail prices between Member States can be explained by differences in network costs and taxation, as the latter fall within the remit of the national legislations in each Member State. In addition, the practice of indexing retail electricity price to fossil fuel prices still exists in some countries, which prevents falls in wholesale prices from being reflected in retail prices.
EN
ER
GY
M
AR
KE
TS
I
N
TH
E
EU
RO
PE
AN
U
NI
ON
I
N
20
11
/
1
0
1. Energy position of the EU
1.1. EU energy consumption
1.1.1. Gross inland consumption (energy mix)
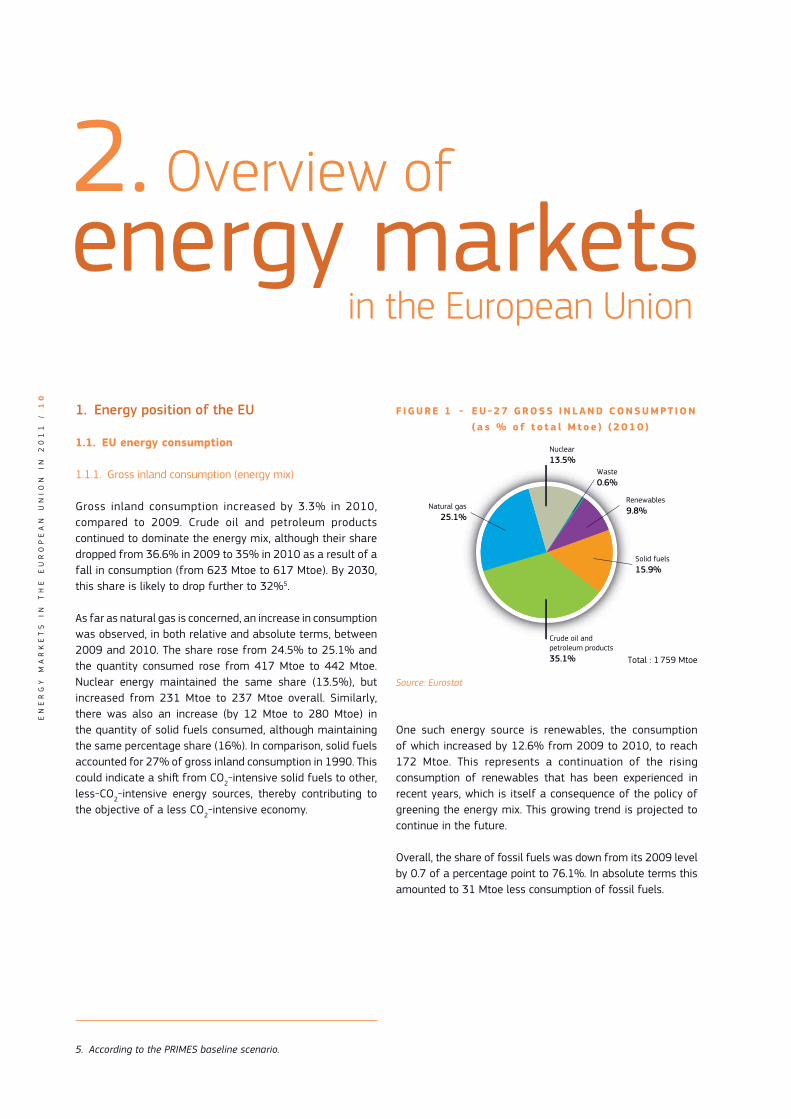
Gross inland consumption increased by 3.3% in 2010, compared to 2009. Crude oil and petroleum products continued to dominate the energy mix, although their share dropped from 36.6% in 2009 to 35% in 2010 as a result of a fall in consumption (from 623 Mtoe to 617 Mtoe). By 2030, this share is likely to drop further to 32%5.
As far as natural gas is concerned, an increase in consumption was observed, in both relative and absolute terms, between 2009 and 2010. The share rose from 24.5% to 25.1% and the quantity consumed rose from 417 Mtoe to 442 Mtoe. Nuclear energy maintained the same share (13.5%), but increased from 231 Mtoe to 237 Mtoe overall. Similarly, there was also an increase (by 12 Mtoe to 280 Mtoe) in the quantity of solid fuels consumed, although maintaining the same percentage share (16%). In comparison, solid fuels accounted for 27% of gross inland consumption in 1990. This could indicate a shift from CO2-intensive solid fuels to other, less-CO2-intensive energy sources, thereby contributing to the objective of a less CO2-intensive economy.
5. According to the PRIMES baseline scenario.
F IGURE 1 - EU-27 GROSS INLAND CONSUMPT ION ( a s % o f t o t a l M t o e ) ( 2 0 1 0 )
Crude oil and petroleum products35.1%
Natural gas25.1%
Renewables9.8%
Waste 0.6%
Solid fuels15.9%
Nuclear13.5%
Total : 1 759 Mtoe
Source: Eurostat
One such energy source is renewables, the consumption of which increased by 12.6% from 2009 to 2010, to reach 172 Mtoe. This represents a continuation of the rising consumption of renewables that has been experienced in recent years, which is itself a consequence of the policy of greening the energy mix. This growing trend is projected to continue in the future.
Overall, the share of fossil fuels was down from its 2009 level by 0.7 of a percentage point to 76.1%. In absolute terms this amounted to 31 Mtoe less consumption of fossil fuels.
2. Overview of energy markets in the European Union

EN
ER
GY
M
AR
KE
TS
I
N
TH
E
EU
RO
PE
AN
U
NI
ON
I
N
20
11
/
1
1
1.1.2. Uses of energy sources by sector
As in previous years, transport continued to be the largest consumer of energy in 2010, followed by households and industry. However, compared to 2009, the share of transport was down by 1 percentage point.
As far as the consumption of energy sources in different sectors was concerned, natural gas was mostly used for power generation and in households. The percentages were at similar levels to those of 2009. However, absolute values
were up in all categories. Consequently, the total gross inland consumption of natural gas in 2010 was 6% higher than the previous year.
In the area of petroleum products, transport was responsible for almost two thirds of final consumption in 2010. Petroleum products were also used in power plants, but to a much lesser extent than natural gas (20 Mtoe vs. 139 Mtoe).
F I G U R E 2 - E U - 2 7 TOTA L F I N A L E N E R G Y C O N S U M P T I O N ( i n M t o e ) ( 1 9 9 5 - 2 0 1 0 )
Agriculture Services, etc. Households Industry Transport
1995 1996 1997 1998 1999 2000 2001 2002 2003 2004 2005 2006 2007 2008 2009 20100
400
200
600
800
1 000
1 200
1 400
32%
25%
27%
14%
2%
Source: Eurostat
F I G U R E 3 - U S E O F N AT U R A L G A S BY S E C TO R ( a s % o f t o t a l M t o e ) ( 2 0 1 0 )
Gross inland consumption = 438 Mtoe
Power generation31.7%
Households*27.2%
Industry*19.4%
Services*10.8%
Consumption – energy sector3.3%
Final non-energy consumption – industry3.0%
Other sectors*1.5%
Agriculture*0.8%
District heating2%
Other0.2%
Other11.0%
Source: Eurostat
Note: * Final energy consumption

EN
ER
GY
M
AR
KE
TS
I
N
TH
E
EU
RO
PE
AN
U
NI
ON
I
N
20
11
/
1
2
FIGURE 4 - USE OF PETROLEUM PRODUCTS BY SECTOR ( a s % o f t o t a l M t o e ) ( 2 0 1 0 )
Energy available for final consumption = 549 Mtoe
Final consumption – industry21.7%
Final consumption –transport62.8%
Final consumption – other sectors
15.4%
Source: Eurostat
Unlike petroleum products, solid fuels and nuclear are predominantly used for power generation.
Turning now to electricity consumption, industry continued to be the largest consumer. Household consumption increased by 21 TWh (surpassing the quantity consumed in 2008 by 27 TWh). Consumption was higher in the services sector than in 2008 and 2009 (by 43 TWh and 37 TWh respectively), whereas in the other sectors it was still below 2008 levels. Total final consumption of electricity was lower than in 2008 (by 1%), but higher than in 2009 (by 4.6%).
F I G U R E 6 - U S E O F E L E C T R I C I T Y BY S E C TO R ( a s % o f t o t a l M t o e ) ( 2 0 1 0 )
Final energy consumption = 244 Mtoe (2 837 TWh)
Transport2.4%
Other2.0%
Industry36.5%
Households29.7%
Services29.4%
Source: Eurostat
1.1.3. Energy intensity
Energy intensity is a measure of how much energy is used to produce a unit of economic output. Final energy intensity measures the energy efficiency of the economy against final energy consumption, i.e. the amount of energy finally available to different sectors after conversion of energy sources. The chart below shows that final energy intensity has been decreasing over time, although in 2009 it increased slightly for the economy as a whole, as a result of increases in transport and services. Nevertheless, the energy intensity of industry continued to decline in 2009.
F I G U R E 5 - U S E O F S O L I D F U E L S BY S E C TO R ( a s % o f t o t a l M t o e ) ( 2 0 1 0 )
Gross inland consumption = 280 Mtoe
Power generation70.7%
Industry*12.7%
Blast-furnace plants4.6%
Coke-oven plants3.7%
Households4.0%
Other2.5%
District heating1.7%
Source: Eurostat

EN
ER
GY
M
AR
KE
TS
I
N
TH
E
EU
RO
PE
AN
U
NI
ON
I
N
20
11
/
1
3
F I G U R E 7 - E U - 2 7 F I N A L E N E R G Y I N T E N S I T Y ( i n t o e / m i l l i o n E U R )
1995 1996 1997 1998 1999 2000 2001 2002 2003 2004 2005 2006 2007 2008 2009
Industry Services Transport Whole Economy
0
50
100
150
200
250
Source: Eurostat
F I G U R E 8 - E U - 2 7 P R I M A RY E N E R G Y P R O D U C T I O N ( i n M t o e ) ( 1 9 9 5 - 2 0 1 0 )
Crude oil and petroleum productsRenewablesOther Nuclear Solid fuelsNatural gas
1995 1996 1997 1998 1999 2000 2001 2002 2003 2004 2005 2006 2007 2008 2009 20100
400
200
600
800
1 000
1 200
20%
12%
19%
20%
28%
1%
Source: Eurostat
According to information provided by the Member States in their second National Energy Efficiency Action Plans, total final energy savings in the EU reached 60 Mtoe in 2010. This number can be broken down as follows: electricity savings (20%), thermal energy savings (58%) and transport energy savings (22%).
This means that, without energy saving measures in the energy end-use sector, the consumption of electricity itself in the EU-27 in 2010 would have been higher by some 10-12 Mtoe, mainly consumed by industry.
1.2. EU energy supply
1.2.1. EU primary energy production
After years of decline, EU energy production picked up again in 2010, albeit to a level lower than in 2008 (837 Mtoe vs. 855 Mtoe). The decrease of recent years is primarily due to lower levels of fossil fuel production.
Renewables production grew by 12% between 2009 and 2010. During the same period, moderate increases were recorded in the production of natural gas (2%) and
nuclear energy (2.5%), while the production of crude oil and petroleum as well as solid fuels both fell (by 7% and 1% respectively). These growth rates indicate the ongoing transition towards a low-carbon economy.
Although the production of natural gas remained stable in 2010, the declining trend from the earlier years is projected to continue. Between 1995 and 2010 the decrease reached

EN
ER
GY
M
AR
KE
TS
I
N
TH
E
EU
RO
PE
AN
U
NI
ON
I
N
20
11
/
1
4
18%. The biggest producers in the EU are the Netherlands and United Kingdom. In 2010 their shares in total EU natural gas production were 41% and 33% respectively. Germany, the third largest producer, had a share of 6%.
The production of oil decreased at an even faster rate, i.e: by 40%, between 1995 and 2010. The United Kingdom is by far the largest producer of crude oil in the EU, with a 67% share of total EU oil production in 2010. Denmark is the EU’s second largest producer, with a share of 14% of total EU production.
1.2.2. EU electricity generation
Total gross electricity generation in 2010 was 3 346 TWh, i.e. 4% higher than in 2009 when it contracted due to the economic slowdown. Prior to the crisis, electricity generation had been growing steadily. It then fell in 2009 to its 2003 level. However, as the chart shows, the changes after the crisis were visibly different from one type of fuel to another.
Renewables experienced the highest rate of growth, up by 13% between 2009 and 2010. The most important source remains hydro power, representing more than half of green electricity, followed by wind (21% of green generation). Solar power grew by 63% between 2009 and 2010.
Nuclear energy became the most important source of power production in 2008, and remained so in 2010. Due to variations in electricity production, it had often alternated with solid fuels in the past. As an example, the PRIMES baseline scenario projections reveal that solid fuels could once again contribute to the largest amount of electricity produced by 2020 due to a decrease in installed nuclear capacities. However, with new capacities installed by 2030, nuclear power could once again play a major role.
The importance of natural gas has been rapidly increasing since 1995. This is due to the significantly greater importance of gas in some Member States to provide the necessary back-up supply for variable generation from renewables. During the observation period, its use in electricity generation more than doubled. Oil, on the other hand, continued to register a negative trend, and is likely to become even more marginal in the future. Cyprus and Malta, due to their geographical location, are the only two Member States which rely almost entirely on this source of electricity production.
Almost half of the EU’s electricity was produced from CO2-neutral sources (renewables and nuclear). When natural gas is added, this covers more than two thirds of generated electricity. Compared to 1995, these shares were 46% and 57% respectively6.
1.2.3. EU energy imports
Following a rise in 2008, energy imports fell sharply in 2009: by 7% to 941 Mtoe, which was close to the 2004 level. The decrease is in line with lower energy consumption and electricity generation during the economic recession. With recovering economic activity, net imports increased in 2010, but by only 1%.
6. Due to revisions of statistics, these numbers are not necessarily
the same as presented in previous annual reports.
F I G U R E 9 - E U - 2 7 G R O S S E L E C T R I C I T Y G E N E R AT I O N ( i n T W h ) ( 1 9 9 5 - 2 0 1 0 )
Crude oil and petroleum productsRenewablesOther Nuclear Solid fuelsNatural gas
1995 1996 1997 1998 1999 2000 2001 2002 2003 2004 2005 2006 2007 2008 2009 20100
2 000
1 000
1 500
500
2 500
3 000
3 500
4 000
25%
3%
24%
21%
27%
1%
Source: Eurostat

EN
ER
GY
M
AR
KE
TS
I
N
TH
E
EU
RO
PE
AN
U
NI
ON
I
N
20
11
/
1
5
F I G U R E 1 0 - E U - 2 7 N E T I M P O R T S O F E N E R G Y ( i n M t o e ) ( 1 9 9 5 - 2 0 1 0 )
Crude oil and petroleum productsOther Solid fuelsNatural gas
1995 1996 1997 1998 1999 2000 2001 2002 2003 2004 2005 2006 2007 2008 2009 20100
400
200
600
800
1 000
1 200
12%
59%
28%
1%
Source: Eurostat
F I G U R E 1 1 - E U - 2 7 S T R U C T U R E O F I M P O R T S O F FO S S I L F U E L S ( i n % ) ( 2 0 1 0 )
Crude oil Hard coalNatural gas0
60
50
40
30
20
10
70
80
90
100
Norway
Russia Russia Russia
Norway
Libya
AlgeriaSaudi Arabia
Qatar
Iran
Nigeria
Kazakhstan
LibyaOthers
Others
Colombia
Australia
USA
South Africa
Indonesia
Others
Source: Eurostat
In the category of solid fuels, hard coal experienced the largest decrease – 18% in 2009. It posted a further slight fall the year after, which was not the case for other categories, where net imports increased in 2010. 59% of total energy imports consisted of crude oil and petroleum products in 2010. Renewables again registered the biggest annual increase (28%), although their share in total imports was very low, given that the EU relies mostly on indigenous
renewable sources (see the box on renewables for more details). Fossil fuels account for 99% of EU energy imports. Partner countries differ from fuel to fuel, although some of them are key partners in a number of fuel categories. In 2010, Russia was the main exporter of crude, natural gas and hard coal to the EU, while Norway was the second most important exporter of both crude oil and natural gas.
The list of the top six countries which exported hard coal in 2010 was the same as in 2009, although long-term developments have shown a changing picture. Since 1990, imports from Colombia, the second largest exporter of hard coal to the EU, have been increasing. Imports from South Africa, on the other hand, have been dropping, while in the case of the US, imports have started to pick up again after years of decline. The increased US exports of coal can be attributed to the growing production, and consumption,
of unconventional gas. As far as South African exports are concerned, these are being redirected towards the Pacific basin, due to increasing demand from China and India. The same trends can be observed for Australian and Indonesian coal and, in the latter, growing domestic demand is having a large influence on the quantities available for exports.

EN
ER
GY
M
AR
KE
TS
I
N
TH
E
EU
RO
PE
AN
U
NI
ON
I
N
20
11
/
1
6
F I G U R E 1 2 - I M P O R T D E P E N D E N C Y O N FO S S I L F U E L S ( i n % )
Crude oil and petroleum products Solid fuelsNatural gas
-100
-50
50
0
100
150
ROLVEEBE BG UKPL FILTEL SKMTLU HUES FRIECZ DE PTCY SLIT NL ATDK SEEU-27
Source: Eurostat
Note: Import dependency is defined as the ratio of net imports and the sum of gross inland consumption and bunkers. Negative numbers indicate
that the country is a net exporter. Values over 100% are possible due to changes of stocks.
F I G U R E 1 3 - E U - 2 7 I M P O R T D E P E N D E N C Y ( i n % ) ( 1 9 9 5 - 2 0 1 0 )
1995 1996 1997 1998 1999 2000 2001 2002 2003 2004 2005 2006 2007 2008 2009 2010
Solid fuels Crude oil and petroleum products Natural gas All fuels
0
30
40
10
20
50
80
70
60
90
Source: Eurostat
1.2.4. EU import dependency
The overall energy import dependency7 of the EU fell slightly between 2009 and 2010, due to the falling import dependency registered in solid fuels and natural gas. The EU’s import dependency had also fallen between 2008 and 2009, due to a drop in the import dependency of both crude oil and solid fuels. The overall energy import dependency of the EU in 2010 was 52.7%, compared to the historic high of 54.6% recorded in 2008.
Falling import dependency of solid fuels and crude oil in 2009 can be explained by both falling net imports and falling consumption, unlike in 2010 for the former, when falling import dependency occurred, although net imports remained stable as consumption increased.
7. Import dependency is measured as the ratio of net imports
to gross inland consumption plus international marine bunkers.
Falling import dependency in natural gas in 2010 occurred in spite of both rising net imports and consumption; this was mainly due to major reductions in gas storage levels to meet high increases in demand during the fourth quarter of 2010. In the case of solid fuels, substantial storage withdrawals were also made to meet the much increased demand. Thus, the fact that a large proportion of the - largely unexpected - increases in demand in both solid fuels and natural gas in 2010 were met by domestically stocked resources explains the drop in import dependency in these two energy sources.

EN
ER
GY
M
AR
KE
TS
I
N
TH
E
EU
RO
PE
AN
U
NI
ON
I
N
20
11
/
1
7
The overall import dependency of the EU has grown at a lower rate in recent years. Although it increased by 3.5 percentage points between 1995 and 2000, and by 5.8 percentage points between 2000 and 2005, the increase in the period between 2005 and 2010 was only 0.2 percentage points. The impact assessment of the Energy Roadmap 2050 indicates that EU’s import dependency will not change significantly until 2030 (56.4% according to the reference scenario).8
The majority of the EU Member States are highly dependent on imports of oil and gas. In 2010, there were a few Member States with significant production that made a considerable contribution to the EU energy balance. Denmark and the Netherlands were important net exporters of gas, while the United Kingdom and Romania were able to satisfy most of their needs through domestic production. Denmark was also a net exporter of crude oil and petroleum products, whereas the United Kingdom was close to being self-sufficient in oil and petroleum products.
E U - 2 7 – R E N E WA B L E E N E R G Y S O U R C E S
RES consumption
Gross inland consumption of renewable energy sources (RES) reached 172 Mtoe in 2010, representing an annual increase of 13%, while the share of RES in the EU’s total gross final energy consumption accounted for 12.5% of the EU’s energy consumption in 2010, compared to 8.5% in 20059.
Biomass has been by far the largest source of RES consumed in the EU. Consumption of biomass was up 13% in 2010, accounting for 69% of the total consumption of renewables. Most of this was used for power generation and in households.
8.
9.
Solar power was the renewable source with the highest growth in consumption, up by 48% to 3.7 Mtoe. This was mainly due to the big increase in photovoltaics, which saw consumption increase by 60% compared to 2009.
The use of wind power rose by 12%, while that of geothermal power increased only by 1.2%, although hydropower is still the second most important renewable source in the European energy mix.
8. SEC(2011)1565 final p136.
9. See definition in Directive 2009/28/EC- Article 2 f). The objective set in the Directive is to achieve a 20% share of energy from renewable
sources in the EU’s gross final consumption of energy and a 10% share of energy from renewable sources in each Member State’s
transport energy consumption by 2020.
F I G U R E 1 4 - R E N E WA B L E E N E R G Y S O U R C E S : G R O S S I N L A N D C O N S U M P T I O N BY S O U R C E ( a s % o f t o t a l M t o e ) ( 2 0 1 0 )
Biomass and waste68.7%
Wind7.4%
Hydro18.3%
Solar2.1%
Geothermal3.4%
Total: 172 Mtoe
Source: Eurostat

EN
ER
GY
M
AR
KE
TS
I
N
TH
E
EU
RO
PE
AN
U
NI
ON
I
N
20
11
/
1
8
RES production
In 2010, the production of renewables reached 167 Mtoe, representing a 12% increase compared to 2009 and a 100% increase compared to 1995. As production was lower than consumption, the difference was covered by imports. In 2010, half of the imports were solid biomass and the other half biofuels, primarily biodiesels.
Biomass and wastes have been the main driver behind the growth in renewable energy production. As figure 16 shows, solid biomass has the largest share. This is mainly due to its increased use in power generation.
Wind and solar energy also grew strongly in recent years (see again figure 15). In 2010, the production of wind energy was up by 12% over the previous year, while solar energy grew by 48%. There are two categories of solar energy: solar
thermal and solar photovoltaic. In 2000, the share of solar thermal accounted for 98% of the solar energy produced, while in 2010 photovoltaics had grown to represent 52% of solar energy produced.
F I G U R E 1 5 - E U - 2 7 R E N E WA B L E E N E R G Y P R O D U C T I O N ( i n M t o e ) ( 1 9 9 5 - 2 0 1 0 )
Geothermal energySolar energy Wind energy Biomass and wasteHydro power
1995 1996 1997 1998 1999 2000 2001 2002 2003 2004 2005 2006 2007 2008 2009 2010
0
100
80
60
40
20
120
140
160
180
68%
19%
4%
8%
2%
Source: Eurostat
F I G U R E 1 6 - R E N E WA B L E S , P R O D U C T I O N O F B I O M A S S A N D WA S T E ( a s % o f t o t a l M t o e ) ( 2 0 1 0 )
Total = 112.7 Mtoe
Wood and wood waste71.7%
Biogas 9.7%
Municipal solid waste 7.1%
Biofuels 11.4%
Biogasoline 1.8%
Biodiesels 7.2%
Other liquid biofuels 2.5%
Source: Eurostat

EN
ER
GY
M
AR
KE
TS
I
N
TH
E
EU
RO
PE
AN
U
NI
ON
I
N
20
11
/
1
9
Electricity from RES
Renewable energy sources are playing an ever increasing role in European electricity generation. In the period under review, their share increased from 14% in 1995 to 21% in 2010.
Contrary to the total gross inland consumption of RES, where biomass and wastes are the most important fuels, hydro power plays by far the most important role in electricity generation. Nevertheless, the importance of RES other than hydro has grown considerably. In 1995, they contributed only 8% of green electricity. By 2010, this had risen to 43%.
As figure 18 shows, between 2006 and 2010 the installed capacities of wind and photovoltaic power experienced a rapid growth. In 2010, the installed capacity of wind turbines was 75% higher than in 2006, representing an average annual growth of 15%. Installations of photovoltaic panels grew even more rapidly, ending at a level of capacity nine times higher than in 2006. The average annual growth rate was 75% within the observed period.
Germany (27.2 GW) and Spain (20.8 GW) accounted for 56% of installed wind power capacity in 2010. In the case of
photovoltaic power, Germany accounted for 59% (17.4 GW) of the EU’s net maximum capacity.
F I G U R E 1 7 - E U - 2 7 G R O S S E L E C T R I C I T Y G E N E R AT I O N BY F U E L ( i n T W h ) ( 1 9 9 5 - 2 0 1 0 )
Geothermal energy Solar energy Wind energyBiomass and waste Hydro power
1995 1996 1997 1998 1999 2000 2001 2002 2003 2004 2005 2006 2007 2008 2009 20100
300
200
100
400
500
600
700
57%
21%
3%
18%
1%
Source: Eurostat
F I G U R E 1 8 - I N S TA L L E D P H OTOVO LTA I C A N D W I N D P OW E R C A PAC I T I E S I N T H E E U ( i n G W )
2006 2007 2008 2009 2010
Photovoltaics Wind
0
30
40
10
20
50
80
70
60
90
Source: Eurostat

EN
ER
GY
M
AR
KE
TS
I
N
TH
E
EU
RO
PE
AN
U
NI
ON
I
N
20
11
/
2
0
2. Market developments in the EU gas sector
2011 was an eventful year for natural gas markets, marked by political unrest in the Middle East and the nuclear outages caused by the devastating tsunami in Japan. Markets were concerned about the implication of these events on the supply of gas. In the case of the former, the fear was the possibility of interruption of important gas pipelines, and in the latter case, the concern was the likely diversion of EU-bound LNG cargoes to Japan in order to compensate for the loss of nuclear energy in Fukushima and elsewhere in Japan.
Middle Eastern exports of gas were affected in the form of the complete shut-down of Libyan supplies to Europe. Only Italy – as the biggest importer of Libyan gas – was liable to be affected to any significant degree, although additional supplies from Russia to Italy ultimately made up for the shortfall. More importantly, disruptions in Tunisia did not affect transiting Algerian supplies to Europe, and unrest in Egypt did not cause blockages of the Suez Canal, which is a key LNG supply route.
Prices were only temporarily affected by fears that flexible LNG spot cargoes might be diverted to Japan. In the period following the outages, it quickly became evident that exports of LNG from Qatar could match the increasing demand from Japan in the short term, supported by diversions of LNG from other parts of Asia, without there being any immediate impact on European LNG imports. Markets were also reassured by signs of continued healthy supplies of natural gas in the EU in the second quarter of 2011, thereby keeping price rises in check. The announcement in May that all nuclear capacity in Germany would be retired by 2022 also did not appear to have any lasting effect on day-ahead traded gas prices.
However, increases in the price of LNG deliveries sounded the first alarm bells in terms of the pressures likely to come from heightened Asian demand in the future. These price increases contributed to reducing the gap between day-ahead prices and prices of LNG deliveries to the EU, which have been low in recent times, partly as a result of ample gas supplies in the US.
Indeed, by the second half of 2011, marked falls in imports of LNG into the EU were observed. Overall, 26% less LNG was imported into the EU in the second half of 2011 compared to the first half of 2011, in contrast to a rise in imports between the first and second halves of the previous year.
Another key issue in EU gas markets in 2011 was the continued increases in oil-indexed prices of Long Term Contracts (LTC) for gas. Relative to stable traded prices, this denoted a reversal in the narrowing of the gap between the two pricing mechanisms that had been observed in 2010. This meant that, by the end of 2011, the issue of renegotiating LTC gas contracts between suppliers and EU importers was still very firmly on the table.
The end of 2010/ beginning of 2011 was an important period for EU gas-related policy. In a Communication published in November 2010, the European Commission outlined the energy infrastructure priorities for 2020 and beyond, as well as the new approach envisaged for the EU support of energy infrastructure during the period 2014-2020.
The Commission’s proposals seek to address a number of issues with regard to the integration and development of the EU’s gas infrastructure, in particular the absence of interconnections between the national and regional gas markets, the need for more LNG terminals and storage facilities for security of supply, sustainability and system resilience, and the need to push ahead with the diversification of sources, routes and suppliers. Planned investment in new gas transmission and import pipelines, storages and LNG terminals are likely to be of the order of EUR 70 billion by 202010.
In addition, an important new regulation on the Security of Gas Supply entered into force on the 2nd of December 2010. It calls on Member States and gas companies to be fully prepared in the event of disruption of supply, by putting in place clear and effective emergency plans involving all stakeholders and fully incorporating the EU dimension of any significant disruption in a spirit of solidarity. In addition, Member States and gas companies are encouraged to coordinate their preventive actions and emergency plans at regional and European levels, while companies will need to be able to deliver gas for at least 30 days of average demand, as well as in the case of an infrastructure disruption under normal winter conditions. The regulation should enable the EU to cope more effectively in the event of disruption of gas imports by fostering a more coordinated approach, in order to guarantee a stable and secure energy supply to citizens across the EU.
2.1. Wholesale markets
Continuing the trend which began in the first quarter of 2011, natural gas consumption in the EU in the 4th quarter 2011 fell year-on-year, contributing to a full year 2011 level of gas consumption for the EU which was less than any of the years since the effects of the crisis were observed (2009+), and even registering the lowest level since 2000.
By the fourth quarter of 2011, falling imports of natural gas were also observed along with falling consumption. This is in contrast to trends observed in the three previous quarters of the year, when there was positive year-on-year growth in imports. This contributed to a marginal decrease in imports of natural gas between 2010 and 2011, although 2011 levels of imports were higher than in 2009 and even 2008.
10. SWD(2012) 367

EN
ER
GY
M
AR
KE
TS
I
N
TH
E
EU
RO
PE
AN
U
NI
ON
I
N
20
11
/
2
1
F I G U R E 1 9 - B A L A N C E O F N AT U R A L G A S I N T H E E U R O P E A N U N I O N ( T W h )
Gross inland consumption Primary productionTotal imports Total exports
1998 1999 2000 2001 2002 2003 2004 2005 2006 2007 2008 2009 2010 20110
1 000
2 000
3 000
4 000
5 000
6 000
Source: Eurostat energy statistics
Falls in consumption and imports of natural gas occurred alongside a prolonged period of sluggish economic growth11. By Q1, EU GDP growth in 2012 hit its lowest level since the fourth quarter of 2009 – when the EU economy was in recession.
The mild weather conditions across the continent in Q4 2011 contributed to the relatively low demand for gas for heating. As a result, withdrawals from underground storages started much later than usual during the winter season. Storage levels proved to be an important factor in bringing the much needed flexibility during the cold snap which occurred in February 2012.
As far as EU domestic production of natural gas is concerned, a continued decline was observed in 2011, with the rate of fall since the year of peak production (2001) to 2011 amounting to 34%, significantly exceeding the reduction of gross inland consumption (of 19%) during the same period.
According to Eurostat data, gas imports into the EU totalled 4 621 TWh in 2010, with the most important trading partners being the Russian Federation (32%), Norway (28%) and Algeria (14%). The combined share of Nigeria, Libya, Qatar, Egypt and Trinidad & Tobago was less than 18%.
The EU’s dependency on natural gas imports12 increased from 48% in 2000 to 58% in 2005, to 62% in 2010. As the first section of Table 1 shows, European Member States -
11. See also section 1.2.4. Throughout 2011 the EU GDP growth
rate was steadily decelerating, with every quarter recording
annual growth lower than the previous quarter.
12. Import dependency is defined as the ratio of net imports over the
sum of gross inland consumption and bunkers. The EU import
dependency is net of intra EU trade; calculated at national level
however, it includes the intra EU trade.
except for Denmark, the Netherlands and to a lesser extent also Romania and the United Kingdom - tended to rely on imports as their major source of gross inland consumption.
In the second section of Table 1, it can be seen that peak daily consumption was higher than the maximal technical availability of the capacity of the importing pipeline or the peak daily import flow in Member States such as Spain, France, Italy and Poland. In these Member States, gas storages and market based measures, such as interruptible consumption and cross border swaps, play an important part in balancing the gas system.
Turning to developments in the trading of natural gas on European hubs, the volume of total spot traded gas was 1 640 BCM in 2011. The UK NBP – the largest hub in Europe – traded 1 137 BCM in 2011, compared to 152 BCM in the Netherlands - the next biggest hub in Europe - and a total of 542 BCM for all continental hubs, which shows that there is still considerable scope for further growth, contributing to greater liquidity of European wholesale gas markets in Europe.
There has been a significant increase in traded volume on the continental hubs. The amount of exchanged spot natural gas increased more than tenfold between 2003 and 2011, and registered a 27% increase between 2010 and 2011. In 2011, the volumes physically delivered on continental hubs covered 58% of the total demand for natural gas in the corresponding countries. This compares with only 35% in 2009 and 6% in 200613. This shows that the role of trading hubs as an instrument for exchange of natural gas ownership in the EU is already considerable and is on the increase. Total traded (spot) volumes in the EU are around three times higher than physical consumption (six times including the UK NBP hub).
13. IEA Medium Term Gas Market Report 2012.

EN
ER
GY
M
AR
KE
TS
I
N
TH
E
EU
RO
PE
AN
U
NI
ON
I
N
20
11
/
2
2
TA B L E 1 - G A S S E C U R I T Y O F S U P P LY - 2 0 1 0
GROSS INLAND CONSUMPTION (1)
TWh/yr
NATIONAL PRODUCTION (3)
TWh/yr
TRANSIT QUANTITY
TWh/yr
PEAK (2)TWh/day
MAXIMAL TECH AVAILABILITY
PIPELINE IMPORTING CAPACITY
TWh/h
PEAK HOURLY IMPORT GAS
FLOWTWh/h
BELGIUM 197.24 N/A 240.00 1.10 0.19 0.08
BULGARIA 26.07 N/A N/A 0.14 0.03 0.01
CZECH REPUBLIC 93.26 1.94 338.00 0.60 N/A 0.03
DENMARK 51.45 85.41 N/A 0.26 0.00 N/A
GERMANY 853.71 112.74 287.70 N/A N/A N/A
ESTONIA 6.54 N/A 0.00 0.05 0.00 N/A
IRELAND 54.61 3.68 N/A N/A N/A N/A
GREECE 37.61 0.08 N/A N/A N/A N/A
SPAIN 362.71 0.60 22.40 1.85 0.02 0.07
FRANCE 494.74 7.51 53.70 3.28 0.09 N/A
ITALY 791.50 80.07 3.68 4.90 0.13 0.11
CYPRUS N/A N/A N/A N/A N/A N/A
LATVIA 17.00 N/A N/A N/A N/A N/A
LITHUANIA 28.98 N/A 12.90 0.19 0.01 0.01
LUXEMBOURG 13.92 N/A N/A 0.07 0.01 0.00
HUNGARY 114.15 25.99 41.35 0.69 0.04 0.01
MALTA N/A N/A N/A N/A N/A N/A
NETHERLANDS 457.16 738.90 N/A 2.50 N/A 0.04
AUSTRIA 95.53 17.28 336.98 0.54 0.08 0.08
POLAND 148.92 42.95 284.60 0.75 N/A 0.02
PORTUGAL 52.20 N/A 0.00 0.22 0.01 0.01
ROMANIA 125.47 100.23 155.50 N/A 0.02 N/A
SLOVENIA 10.03 0.07 10.52 0.06 N/A 0.00
SLOVAKIA 58.22 1.03 686.40 0.35 0.15 0.11
FINLAND 44.63 N/A N/A 0.21 0.01 0.01
SWEDEN 15.27 N/A 0.00 N/A N/A N/A
UNITED KINGDOM*(4) 994.40 598.57 413.09 4.86 2.72 N/A
Sources: National Regulators data Eurostat * DECC (UK)
Notes: (1) Gross Inland Consumption = Production + Imports - Exports + Storage variations. (2) All dry marketable production within national boundaries,
including offshore production. Production is measured after purification and extraction of NGLs and sulphur. Excludes extraction losses and quantities
reinjected, vented or flared. (3) Maximum quantity of gas consumed in a day during the year. (4) UK numbers include Great Britain only as gas demand
from Northern Ireland and the Republic of Ireland is not possible to differentiate.
As far as imports of liquefied natural gas (LNG) are concerned, in addition to the increasing volumes of gas being imported into the EU, the share of LNG deliveries has risen from 10% twenty years ago to just under 20% in 2011, as Figure 21 shows.
Reporting on 2011, the first signs of falling gas imports which we highlighted above could be observed in the third quarter of 2011, as LNG imports fell by 14% year on year, after having risen by 20% in the previous quarter. By the fourth quarter of 2011, all exporters of LNG cut back considerably on exports, with the result that 26% less LNG was imported into the EU in the second half of 2011 compared to the first half of 2011, in contrast to the rising levels of imports
between the first and second halves of the previous year (see also table 2 for a comparison of LNG capacities among Member States in 2011).
The outcome for the full year 2011, based on data for contracted volumes, pointed to some slight growth between 2010 and 2011. Volumes contracted via long term purchasing arrangements were about 100 bcm (1 040 TWh) higher than what was actually imported, indicating that some market participants were making good use of the flexibility clauses in their contracts (using the so-called ‘take or pay’ clause). Based on data from Eurostat and Gas Strategies, the gap between contracted and actually imported gas exceeded 20% in 2011.

EN
ER
GY
M
AR
KE
TS
I
N
TH
E
EU
RO
PE
AN
U
NI
ON
I
N
20
11
/
2
3
F I G U R E 2 0 - A N N U A L T R A D E D VO L U M E S O N E U R O P E A N G A S H U B S
Austria (le� axis)
Belgium (le� axis)
UK (right axis)
France (le� axis) Italy (le� axis)
Germany (le� axis) Netherlands (le� axis)
2003 2004 2005 2006 2007 2008 2009 2010 20110
100
200
300
400
500
600
0
200
400
600
800
1 000
1 200
Volu
me
(BCM
) for
con
tinen
tal h
ubs
Volu
me
(BCM
) for
NBP
hub
Source: IEA Medium-Term Gas Market Report
Note: The chart covers the following trading hubs: UK: NBP (National Balancing Point); Belgium: Zeebrugge; Netherlands: TTF (Title Transfer Facility);
France: PEG (Point d’Echange Gaz); Italy: PSV (Punto di Scambio Virtuale); Germany: GASPOOL and NCG (NetConnect Germany);
Austria: CEGH (Central European Gas Hub).
F I G U R E 2 1 - I M P O R T S O F N AT U R A L G A S I N T H E E U
(le� axis) Total EU-27 gas imports (pipe+LNG)
1990 1991 1992 1993 1994 1995 1996 1997 1998 1999 2000 2001 2002 2003 2004 2005 2006 2007 2008 2009 2010 2011
(right axis) LNG relative part
0
100
200
300
400
500
600
0%
5%
10%
25%
15%
20%
25%
BCM
Source: Gas Strategies
TA B L E 2 - L N G C A PAC I T I E S I N T H E E U - 2 0 1 1
MAX HOURLY CAPACITYMCM (N) / HOUR
NOMINAL ANNUAL CAPACITYBCM (N) / YEAR
LNG STORAGE CAPACITYMCM (LNG)
BELGIUM 1.70 9.00 0.38
GREECE 0.75 5.30 0.13
SPAIN 6.86 60.11 2.94
FRANCE 3.91 23.75 0.84
ITALY 1.54 10.96 0.35
NETHERLANDS 1.65 12.00 0.54
PORTUGAL 1.13 6.50 0.24
UNITED KINGDOM 6.23 46.50 1.87
Sources: Gas Infrastructure Europe; Gas LNG Europe
(N): Normal

EN
ER
GY
M
AR
KE
TS
I
N
TH
E
EU
RO
PE
AN
U
NI
ON
I
N
20
11
/
2
4
Figure 22 below compares the trend of the price of natural gas contracts (as represented by the UK NBP hub day-ahead average price and the German border price) with the price of the Brent spot and Coal CIF Ara13 spot prices. The graph shows that, after the major correction in all energy commodity prices during the second half of 2008/first half of 2009, there had been a period of renewed growth which lasted until the last quarter of 2010/first quarter of 2011.
By that point, the price of Brent crude had hit a daily record average (of 87.8 €/bbl), while both the price of coal and natural gas had also risen significantly, reaching 95.2 €/tonne and 25.7 €/MWh respectively − somewhat short of their historic daily highs of 135.8 €/tonne and 32.1 €/MWh respectively, in August 2008. Thus, in the period between late 2008 and early 2011, the prices of energy commodity prices followed a similar upward trend.
However, there has been a clear decoupling between coal prices on the one hand, and oil and gas prices on the other, since the beginning of 2011. Coal followed a slightly downward course throughout 2011, reaching a level of 85.9 €/tonne at year end. It fell more sharply in the first quarter of 2012, reaching a daily level of 76.5 €/tonne by the end of March 2012. Coal CIF ARA prices were kept low due to the growing availability and supplies of US-produced coal, on account of declining US demand for coal due to strong competition from shale gas on the US power markets.
In contrast to coal, the price of Brent stabilised at around 80 €/bbl during 2011, but then picked up again, reaching a new record daily level of 97.7 €/bbl by mid-March 201214.
Similarly, the price of the NBP day-ahead contract for gas remained within a range of between 20 and 24 €/MWh during 2011, but then temporarily hit new record levels of 40.7 €/MWh in early February 2012, as a result of a sudden and unexpected cold snap. By the end of March 2012, a price level of 25.2 €/MWh was recorded which, not counting the exceptional February levels, was the highest price attained by the NBP day-ahead since the first quarter of 2011.
14. Price for a metric tonne of coal (calorific value of 6 000 kcal/kg)
delivered at the Amsterdam-Rotterdam-Antwerp area with
cost, insurance and freight covered.
The above graph also shows the price of actual gas imports at the German border, as published by the German Federal Office of Economics and Export Control (BAFA). This price has traditionally been taken as an indicator of oil-index priced gas into Europe.
By comparing these two gas prices, it can be seen that the German border price was briefly comparable to the NBP spot price at the end of 2010, when high levels of demand for gas in the EU sent hub prices soaring to levels close to the pre-crisis levels of 2008. Since then, however, relatively low demand levels throughout 2011 ensured the stability of the NBP price, while the oil-indexed German border price has continued to rise in line with the increases in oil prices of the previous months.
The UK NBP average monthly price represented 75% of the German border price in December 2011, compared to 89% in June 2011 and 94% in January 2011. The difference between the long-term oil-indexed and spot prices for gas therefore grew throughout 2011, in spite of reports that importers won concessions to reflect movements of hub-traded gas prices in their long-term contracts. If such a large gap in the future between the two types of contracts were to persist, it would continue to cause concern among European utilities that have to buy gas under long term, oil-indexed contracts, but continue to be pressured by their own customers to sell at lower spot levels.
F I G U R E 2 2 - P R I C E S O F C O M P E T I T I V E F U E L S V S P R I C E S O F G A S
(le� axis) Brent Spot (EUR/bbl)
(right axis) NBP average price (EUR/MWh) (right axis) DE border (EUR/MWh)
(le� axis) Coal CIF ARA Spot (EUR/t)
45
55
65
75
85
95
105
7
7
12
17
22
27
32
Pric
es o
f co
mpe
titiv
e fu
els
(€)
pric
es o
f ga
s (€
/MW
h)
10 11 12 1 2 3 4 5 6 7 8 9 10 11 12 1 2 3 4 5 6 7 8 9 10 11 12 1 2 3 2009 2010 2011 2012
Sources: Platts, BAFA (DE border)

EN
ER
GY
M
AR
KE
TS
I
N
TH
E
EU
RO
PE
AN
U
NI
ON
I
N
20
11
/
2
5
The difference in prices between the different gas contracts is an important issue, because the EU is continuing to buy a large proportion of its gas under long-term, oil-indexed contracts. However, according to surveys conducted by the International Gas Union since 2005 (see figure 23), it would appear that − along with the increase in traded gas volumes reported previously − the share of oil-indexed gas contracts is falling (representing 68% of natural gas consumption in 2009 and only 59% in 2010) and is expected to decrease further. At the same time, the proportion of spot purchased
gas has increased significantly (from 27% of natural gas consumption in 2009 to 37% in 2010). The disparity between the prices of LTC contracts and hub prices has clearly been a driving force behind this trend.
This paves the way for the gradual emergence of true gas-to-gas competition, where the price of gas is ultimately determined by gas market fundamentals and by the interplay of gas supply and demand, traded over a variety of different periods, and no longer by oil and oil product markets.
An additional key contributing factor of the development of hubs, and of gas-to-gas competition, is in terms of adding to the diversity of gas contracts available in the EU. As Map 1 shows, this diversity is important, because markets with access to multiple sources of gas and competitive trading arrangements (e.g. North-West Europe, UK) have benefitted from lower prices in recent years. By contrast, Eastern European countries that depend predominantly on long-term, oil-linked contracts have paid relatively higher prices.
It is worth noting, however, that not all EU markets have been equally affected by the sharp rises in the price of oil, which have pushed up natural gas prices. EU Member States with well-developed gas hubs have not only enjoyed the benefit of greater price stability; the prices of piped gas imported under long-term contracts in these markets have also been lower. This further underlines the importance of developing hub-trading in the EU.
Therefore, markets with more supply diversity not only enjoy greater security, they also enable consumers in those markets to benefit from greater competition and lower prices.
F I G U R E 2 3 - W H O L E S A L E G A S C O N T R AC T S B R E A K D OW N I N E U R O P E (share of consumption in %)
2005 2007 2009 2010
Oil indexed Gas-to-gas competition Regulated Other 0
10
30
50
70
20
40
60
80
90
Source: International Gas Union

EN
ER
GY
M
AR
KE
TS
I
N
TH
E
EU
RO
PE
AN
U
NI
ON
I
N
20
11
/
2
6
M A P 1 - 2 0 1 1 AV E R AG E W H O L E S A L E G A S P R I C E
FRH
UB:
23
LNG
: 27.
2
**PL
Oth
er: 2
9.6
ESLT
C1: 2
2.3
LTC3
: 22.
2LN
G: 2
1.8
ROLT
C2: 3
0.9
*DE
HU
B: 2
2.9
LTC1
: 24.
6LT
C2: 2
6
HU
LTC2
: 27
BGLT
C2: 3
1.9
ATH
UB:
23.
8
CZLT
C2: 2
9.3
LTLT
C2: 3
2.8
UK
HU
B: 2
2.1
LTC1
: 17.
8LT
C4: 2
2.9
LNG
: 21.
1
PTLN
G: 2
1.5
ITH
UB:
28.
2LT
C1: 3
0.8
LTC2
: 30.
6LT
C3: 2
8.8
LTC4
: 24.
2LN
G: 2
8.9
LVLT
C2: 2
5.8
GR
LTC2
: 27.
5LN
G: 2
8.2
SKLT
C2: 2
7.9
EELT
C2: 2
7.8
NL
HU
B: 2
2.6
BEH
UB:
22.
5LT
C1: 2
2.5
LTC4
: 22.
5LN
G: 2
2.6
SILT
C2: 3
2.2
LTC3
: 33
025
050
0ki
lom
etre
sSo
urce
: © E
urog
eogr
aphi
c fo
r th
e ad
min
istr
ativ
e bo
unda
ries;
Ene
rgy
DG
- J
une
2012
Mal
ta
Cypr
us
LTC:
gas
del
iver
ed u
nder
long
term
con
trac
tual
arr
ange
men
ts.
LTC
pric
es a
re im
port
pric
es (d
omes
tic p
rices
not
tak
en in
to a
ccou
nt)
LTC1
pric
es a
re e
stim
atio
ns o
f bo
rder
pric
es
for
gas
from
Nor
way
LTC2
pric
es a
re e
stim
atio
ns o
f bo
rder
pric
esfo
r ga
s fr
om R
ussi
a
LTC3
pric
es a
re e
stim
atio
ns o
f bo
rder
pric
esfo
r ga
s fr
om A
lger
ia
LTC4
pric
es a
re e
stim
atio
ns o
f bo
rder
pric
esfo
r ga
s fr
om t
he N
ethe
rland
s
The
colo
ur c
ode
for
each
MS
is d
efine
d ac
cord
ing
to a
sim
ple
aver
age
of a
ll av
aila
ble
type
s of
pric
es
(hub
, LTC
, LN
G) i
n th
at M
S
Sour
ces:
LT
C an
d LN
G: E
STAT
CO
MEX
T;
HU
B: P
latt
s
* G
erm
an L
TC e
stim
atio
ns b
ased
on
data
from
the
sec
ond
half
of
2011
** R
egul
ated
pric
es f
or n
atur
al g
as in
Pol
and,
net
of t
rans
mis
sion
cha
rges
, as
of 1
6.12
.201
0;
Re
cipi
ents
of
high
nat
ural
gas
(con
sum
er g
roup
E)
Pric
e in
€/M
Wh
< 20
.01
20.0
1 -
24.0
0
24.0
1 -
28.0
0
> 28
.00
no d
ata

EN
ER
GY
M
AR
KE
TS
I
N
TH
E
EU
RO
PE
AN
U
NI
ON
I
N
20
11
/
2
7
Turning now to LNG prices, the continuing increases in the production of unconventional gas in the United States (US) in 2011 ensured that the US remained well supplied in gas, with the result that the discount between the price for LNG deliveries in the US and the EU continued to increase, as shown in Figure 24.
In spite of that, the difference between the prices paid for LNG deliveries to Japan and Korea on EU LNG prices increased further in 2011. This premium was attractive to LNG producers, and explains the declining imports of LNG in the EU that were observed in the second half of 2011, as
reported previously. The significant increases in demand for LNG from Japan, following the Fukushima nuclear outages earlier in the year caused by the tsunami, also provided a fresh opportunity for LNG exporters, following the loss of much of the US market. This combination of events in the US and Japan has led to a shift, in a relatively short period of time, from the EU being primarily in competition with the US for LNG supplies, to competing with Asia and the Far-East.
More detailed information on developments in the EU markets for natural gas can be found in the European Commission’s Quarterly Reports on European Gas Markets (QREGaM)15.
15. Publicly available at:
http://ec.europa.eu/energy/observatory/gas/gas_en.htm
F I G U R E 2 4 - P R I C E S O F L N G ( $/MMBtu)
Avg EU* Japan** Korea** US**
0
2
4
6
12
14
8
10
16
18
7 8 9 10 11 12 1 2 3 4 5 6 7 8 9 10 11 12 1 2 3 4 5 6 7 8 9 10 11 12 2009 2010 2011
Sources: Eurostat COMEXT, Gas Strategies
Notes: * ‘Avg EU’ is a weighted average price for monthly LNG deliveries in: Belgium, Portugal, Spain, UK, Italy (from January 2009) and France
(from January 2010) as reported by Eurostat. ** The formula for calculating monthly prices in Japan, Korea and the US was modified in Q4 2009.
Previously these prices were an average of prices charged by different suppliers. Starting from October 2009, the averages have been weighted
by the monthly LNG deliveries of each supplier.

EN
ER
GY
M
AR
KE
TS
I
N
TH
E
EU
RO
PE
AN
U
NI
ON
I
N
20
11
/
2
8
2.2. Market structure and unbundling
For the majority of Member States the number of operators working on the transmission and distribution grid of the gas system remained stable between 2009 and 2010.
By 2010, most Member States had 10 or more gas-supplying companies.
TA B L E 3 - U N B U N D L I N G O F T R A N S M I S S I O N S Y S T E M O P E R ATO R S ( T S O s ) I N G A S - 2 0 1 0
N U M B E R O F T S O s
OW N E R S H I P U N B U N D L E D
T S O S% O F P U B L I C OW N E R S H I P
% O F P R I VAT E OW N E R S H I P
L EG A L LY U N B U N D L E D T S O S
with network assets
without network assets
BELGIUM 1 1 89.97 10.03 1 0
BULGARIA 1 1 100 0 1 0
CZECH REPUBLIC 1 0 0 100 1 0
DENMARK 1 1 100 0 1 0
GERMANY 18 2 0 100 9 9
ESTONIA 1 0 0 100 0 1
IRELAND 0 0 0 0 0 0
GREECE 0 0 0 0 0 0
SPAIN 17 1 5 95 17 0
FRANCE 2 0 36 64 2 0
ITALY 3 1 1.6 98.4 3 0
CYPRUS 0 0 0 0 0 0
LATVIA 0 0 0 0 0 0
LITHUANIA 1 0 17.7 76 0 0
LUXEMBOURG 1 0 42.5 57.5 1 0
HUNGARY 1 1 0 100 1 0
MALTA 0 0 0 0 0 0
NETHERLANDS 2 2 100 0 N/A N/A
AUSTRIA 3 0 31.5 68.5 5 2
POLAND 1 1 100 0 1 0
PORTUGAL 1 1 51 49 1 0
ROMANIA 1 1 73.51 26.49 1 N/A
SLOVENIA 1 0 0 100 1 0
SLOVAKIA 1 0 51 49 0 1
FINLAND 1 0 24 76 N/A N/A
SWEDEN 2 2 0 100 2 0
UNITED KINGDOM 1 1 0 100 1 0
Source: CEER database

EN
ER
GY
M
AR
KE
TS
I
N
TH
E
EU
RO
PE
AN
U
NI
ON
I
N
20
11
/
2
9
As far as the number of gas importers is concerned, fewer than half of the gas importing Member States had more than ten gas importing companies. Furthermore, the market share of the largest gas importers was over 50% in 14 out of the 20 Member States for which information is available
(and over 80% in five Member States). On the gas retail side, while all but six Member States had ten or more suppliers of natural gas to final consumers, the market share of the largest retailer exceeded 50% in 13 Member States (it also exceeded 80% in 8 Member States).
TA B L E 4 - U N B U N D L I N G O F D I S T R I B U T I O N S Y S T E M O P E R ATO R S ( D S O s ) I N G A S – 2 0 1 0
N U M B E R O F
D S O s
OW N E R S H I P U N B U N D L E D
D S O s
L E G A L LY U N B U N D L E D
D S O s
A P P L I C AT I O N O F 1 0 0 0 0 0 C U S TO M E R E X E M P T I O N
D S O s W I T H F E W E R T H A N
1 0 0 0 0 0 C U S TO M E R S
BELGIUM 18 5 18 NO 8
BULGARIA 31 N/A 0 YES 31
CZECH REPUBLIC 77 0 6 YES 71
DENMARK 3 0 3 NO 1
GERMANY 713 N/A 146 YES 643
ESTONIA 25 N/A 1 YES 25
IRELAND 0 0 0 0 0
GREECE 0 0 0 0 0
SPAIN 24 1 24 NO 13
FRANCE 25 0 3 YES 22
ITALY 247 128 243 YES 205
CYPRUS 0 0 0 0 0
LATVIA 0 0 0 0 0
LITHUANIA 6 0 0 YES 5
LUXEMBOURG 4 0 1 YES 4
HUNGARY 10 0 5 YES 5
MALTA 0 0 0 0 0
NETHERLANDS 8 6 8 NO 1
AUSTRIA 20 0 9 YES 14
POLAND 6 0 6 YES 1
PORTUGAL 11 0 4 YES 7
ROMANIA 39 2 2 YES 37
SLOVENIA 19 0 0 YES 19
SLOVAKIA 49 0 1 YES 48
FINLAND 23 0 0 YES 23
SWEDEN 5 0 5 YES 5
UNITED KINGDOM 19 14 5 NO 8
Source: CEER database

EN
ER
GY
M
AR
KE
TS
I
N
TH
E
EU
RO
PE
AN
U
NI
ON
I
N
20
11
/
3
0
TA B L E 5 - S T R U C T U R E O F T H E G A S M A R K E T I N 2 0 1 0
N U M B E R O F E N T I T I E S
B R I N G I N G NATURAL GAS INTO COUNTRY
N U M B E R O F M A I N G A S E N T I T I E S ( 1)
M A R K E T SHARE OF
THE LARGEST E N T I T Y
B R I N G I N G NATURAL GAS
NUMBER OF R E TA I L E R S S E N D I N G
NATURAL GAS TO F I N A L
C U S TO M E R S
N U M B E R O F M A I N N AT U R A L
G A S RETAILERS (2)
M A R K E T S H A R E O F
THE LARGEST NATURAL GAS
R E TA I L E R
BELGIUM 4 3 70% 41 5 31%
BULGARIA* 3 1 97% 18 2 94% (*)
CZECH REPUBLIC 24 3 73% 28 2 62%
DENMARK 2 2 N/A 13 5 N/A
GERMANY 22 7 N/A 820 2 25%
ESTONIA 1 1 100% 22 1 97%
IRELAND 13 6 36% 8 5 65%
GREECE 4 3 88% 4 3 85%
SPAIN 18 5 44% 32 6 27%
FRANCE 16 3 73% 50 3 65%
ITALY 63 3 39% 305 5 N/A
CYPRUS N/A N/A N/A N/A N/A N/A
LATVIA 1 1 100% 1 1 100%
LITHUANIA 5 4 51% 5 1 98%
LUXEMBOURG 4 1 N/A 8 4 N/A
HUNGARY 22 6 33% 28 10 16%
MALTA N/A N/A N/A N/A N/A N/A
NETHERLANDS N/A N/A N/A N/A 3 N/A
AUSTRIA 15 4 N/A 40 3 43%
POLAND 17 1 97% 52 1 93%
PORTUGAL 7 2 96% 18 6 36%
ROMANIA 19 2 48% 63 5 26%
SLOVENIA 4 2 94% 19 4 70%
SLOVAKIA 7 3 78% 14 3 76%
FINLAND 1 1 100% 25 1 95%
SWEDEN 2 2 52% 5 4 47%
UNITED KINGDOM** 25 6 22% 19 6 55% (**)
Sources: Eurostat, 2010 data, and National Regulators
(1) Entities are considered as ‘main’ if they deal with at least 5% of the natural gas (indigeneous production or import).
(2) Retailers are considered as ‘main’ if they sell at least 5% of the total natural gas consumed by final customers.
(*) aggregated share of top 2 retailers. (**) aggregated share of top 3 retailers. N/A: not available or not applicable.
As a rule, local consumers in the majority of Member States have access to a restricted number of offers, and those local suppliers may have difficulties in negotiating competitive conditions with the importing company. Regulated prices are another reason why competition appears limited.
Table 6 below illustrates the importance of having guidelines and network codes for access conditions to gas transmission networks. Member States tend to apply a varied range of tariff models, congestion management procedures, capacity allocation mechanisms and balancing models, which are not
always friendly to market operators and do not send efficient market signals about the value of existing and new capacity that the market may need.
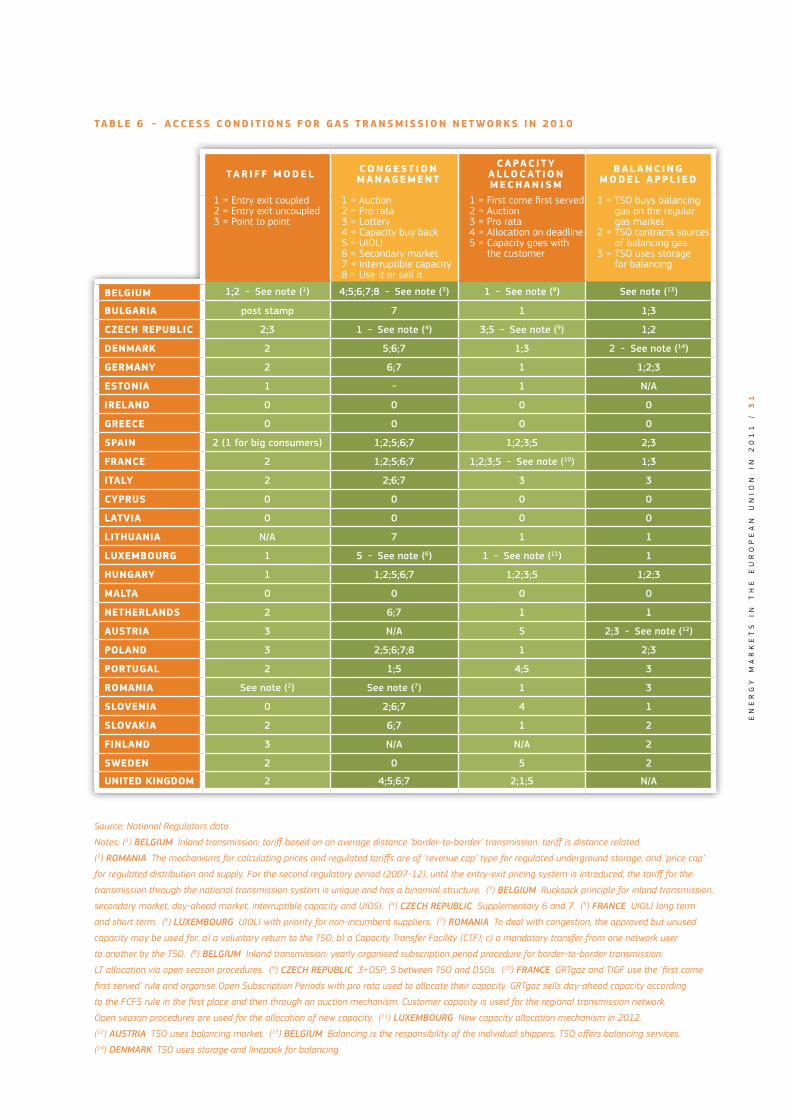
EN
ER
GY
M
AR
KE
TS
I
N
TH
E
EU
RO
PE
AN
U
NI
ON
I
N
20
11
/
3
1
TA B L E 6 - AC C E S S C O N D I T I O N S FO R G A S T R A N S M I S S I O N N E T WO R K S I N 2 0 1 0
TA R I F F M O D E L C O N G E S T I O N M A N AG E M E N T
C A PAC I T Y A L LO C AT I O N M E C H A N I S M
B A L A N C I N G M O D E L A P P L I E D
1 = Entry exit coupled2 = Entry exit uncoupled3 = Point to point
1 = Auction2 = Pro rata3 = Lottery4 = Capacity buy back5 = UIOLI6 = Secondary market7 = Interruptible capacity8 = Use it or sell it
1 = First come first served2 = Auction3 = Pro rata4 = Allocation on deadline5 = Capacity goes with
the customer
1 = TSO buys balancing gas on the regular gas market
2 = TSO contracts sources of balancing gas
3 = TSO uses storage for balancing
BELGIUM 1;2 - See note (1) 4;5;6;7;8 - See note (3) 1 - See note (8) See note (13)
BULGARIA post stamp 7 1 1;3
CZECH REPUBLIC 2;3 1 - See note (4) 3;5 - See note (9) 1;2
DENMARK 2 5;6;7 1;3 2 - See note (14)
GERMANY 2 6;7 1 1;2;3
ESTONIA 1 - 1 N/A
IRELAND 0 0 0 0
GREECE 0 0 0 0
SPAIN 2 (1 for big consumers) 1;2;5;6;7 1;2;3;5 2;3
FRANCE 2 1;2;5;6;7 1;2;3;5 - See note (10) 1;3
ITALY 2 2;6;7 3 3
CYPRUS 0 0 0 0
LATVIA 0 0 0 0
LITHUANIA N/A 7 1 1
LUXEMBOURG 1 5 - See note (6) 1 - See note (11) 1
HUNGARY 1 1;2;5;6;7 1;2;3;5 1;2;3
MALTA 0 0 0 0
NETHERLANDS 2 6;7 1 1
AUSTRIA 3 N/A 5 2;3 - See note (12)
POLAND 3 2;5;6;7;8 1 2;3
PORTUGAL 2 1;5 4;5 3
ROMANIA See note (2) See note (7) 1 3
SLOVENIA 0 2;6;7 4 1
SLOVAKIA 2 6;7 1 2
FINLAND 3 N/A N/A 2
SWEDEN 2 0 5 2
UNITED KINGDOM 2 4;5;6;7 2;1;5 N/A
Source: National Regulators data
Notes: (1) BELGIUM Inland transmission: tariff based on an average distance ‘border-to-border’ transmission: tariff is distance related.
(2) ROMANIA The mechanisms for calculating prices and regulated tariffs are of ‘revenue cap’ type for regulated underground storage, and ‘price cap’
for regulated distribution and supply. For the second regulatory period (2007-12), until the entry-exit pricing system is introduced, the tariff for the
transmission through the national transmission system is unique and has a binomial structure. (3) BELGIUM Rucksack principle for inland transmission,
secondary market, day-ahead market, interruptible capacity and UIOSI. (4) CZECH REPUBLIC Supplementary 6 and 7. (5) FRANCE UIOLI long term
and short term. (6) LUXEMBOURG UIOLI with priority for non-incumbent suppliers. (7) ROMANIA To deal with congestion, the approved but unused
capacity may be used for: a) a voluntary return to the TSO; b) a Capacity Transfer Facility (CTF); c) a mandatory transfer from one network user
to another by the TSO. (8) BELGIUM Inland transmission: yearly organised subscription period procedure for border-to-border transmission:
LT allocation via open season procedures. (9) CZECH REPUBLIC 3+OSP; 5 between TSO and DSOs. (10) FRANCE GRTgaz and TIGF use the ‘first come
first served’ rule and organise Open Subscription Periods with pro rata used to allocate their capacity. GRTgaz sells day-ahead capacity according
to the FCFS rule in the first place and then through an auction mechanism. Customer capacity is used for the regional transmission network.
Open season procedures are used for the allocation of new capacity. (11) LUXEMBOURG New capacity allocation mechanism in 2012.
(12) AUSTRIA TSO uses balancing market. (13) BELGIUM Balancing is the responsibility of the individual shippers. TSO offers balancing services.
(14) DENMARK TSO uses storage and linepack for balancing.

EN
ER
GY
M
AR
KE
TS
I
N
TH
E
EU
RO
PE
AN
U
NI
ON
I
N
20
11
/
3
2
2.3. Retail markets
Switching rates
Data on switching rates are incomplete for many EU Member States, as Table 7 shows. The available data show that, in 2010, switching rates remained relatively low in most Member States across all categories of consumers.
In Member States for which data are available across the three industry groups, there are signs that switching rates are lowest in the small industry and household category.
TA B L E 7 - S W I TC H I N G R AT E – G A S (by meter points, values are in %)
E N T I R E R E TA I L M A R K E T
L A R G E I N D U S T RY
M E D I U M I N D U S T RY
S M A L L I N D U S T RY A N D H O U S E H O L D S
2008 2009 2010 2008 2009 2010 2008 2009 2010 2008 2009 2010
BELGIUM N/A 8.40 11.15 N/A N/A N/A N/A N/A N/A N/A N/A N/A
BULGARIA 0.00 0.00 0.00 0.00 0.00 0.00 0.00 0.00 0.00 0.00 0.00 0.00
CZECH REPUBLIC 0.02 1.16 2.97 6.70 8.70 12.23 1.20 4.00 9.60 0.20 1.15 2.94
DENMARK 0.60 1.10 0.90 N/A N/A N/A N/A N/A N/A N/A N/A N/A
GERMANY 2.85 3.48 6.70 15.81 4.21 8.42 8.63 3.86 10.31 2.78 3.47 6.67
ESTONIA N/A N/A N/A N/A N/A N/A N/A N/A N/A 2.10 N/A N/A
IRELAND N/A 1.30 N/A N/A 12.80 0.00 N/A 20.70 0.00 N/A 1.27 0.00
GREECE 0.00 0.00 0.00 0.00 0.00 0.00 0.00 0.00 0.00 0.00 0.00 0.00
SPAIN 4.10 5.50 11.60 9.00 15.00 24.00 8.00 15.00 24.00 4.00 5.60 11.50
FRANCE 9.81 4.00 3.50 N/A 13.20 N/A N/A N/A N/A 9.82 4.00 3.50
ITALY 1.20 2.00 4.50 28.80 34.40 38.20 3.70 7.60 8.60 1.10 1.90 4.40
CYPRUS N/A N/A N/A N/A N/A 0.00 N/A N/A 0.00 N/A N/A 0.00
LATVIA 0.00 0.00 N/A 0.00 0.00 0.00 0.00 0.00 0.00 0.00 0.00 0.00
LITHUANIA 0.00 0.00 0.00 0.00 0.00 0.00 0.00 0.00 0.00 0.00 0.00 0.00
LUXEMBOURG 0.04 0.02 0.05 0.00 0.00 0.00 73.00 12.00 0.00 0.01 0.01 0.05
HUNGARY N/A N/A N/A N/A N/A N/A N/A N/A N/A N/A N/A N/A
MALTA 0.00 0.00 N/A 0.00 0.00 0.00 0.00 0.00 0.00 0.00 0.00 0.00
NETHERLANDS 9.10 11.80 8.90 N/A N/A N/A N/A N/A N/A 9.10 11.80 8.90
AUSTRIA 0.50 0.90 0.70 6.70 17.50 7.80 5.80 7.50 7.50 0.50 0.90 0.70
POLAND 0.00 0.00 0.00 0.00 0.00 0.00 0.00 0.00 0.00 0.00 0.00 0.00
PORTUGAL 0.00 0.00 N/A N/A N/A N/A N/A N/A N/A N/A N/A N/A
ROMANIA N/A N/A N/A N/A N/A N/A N/A N/A N/A N/A N/A N/A
SLOVENIA 0.06 0.13 0.15 11.76 17.64 2.63 1.20 2.53 10.53 0.32 0.00 0.00
SLOVAKIA 0.00 0.00 0.21 0.00 4.40 10.10 0.00 0.40 2.70 0.00 0.00 0.20
FINLAND N/A N/A N/A N/A N/A N/A N/A N/A N/A N/A N/A N/A
SWEDEN 0.80 1.20 1.05 8.70 11.90 5.80 8.70 11.90 5.80 0.30 0.50 0.40
UNITED KINGDOM N/A N/A N/A N/A N/A N/A N/A N/A N/A 18.90 17.30 16.10
Source: CEER database
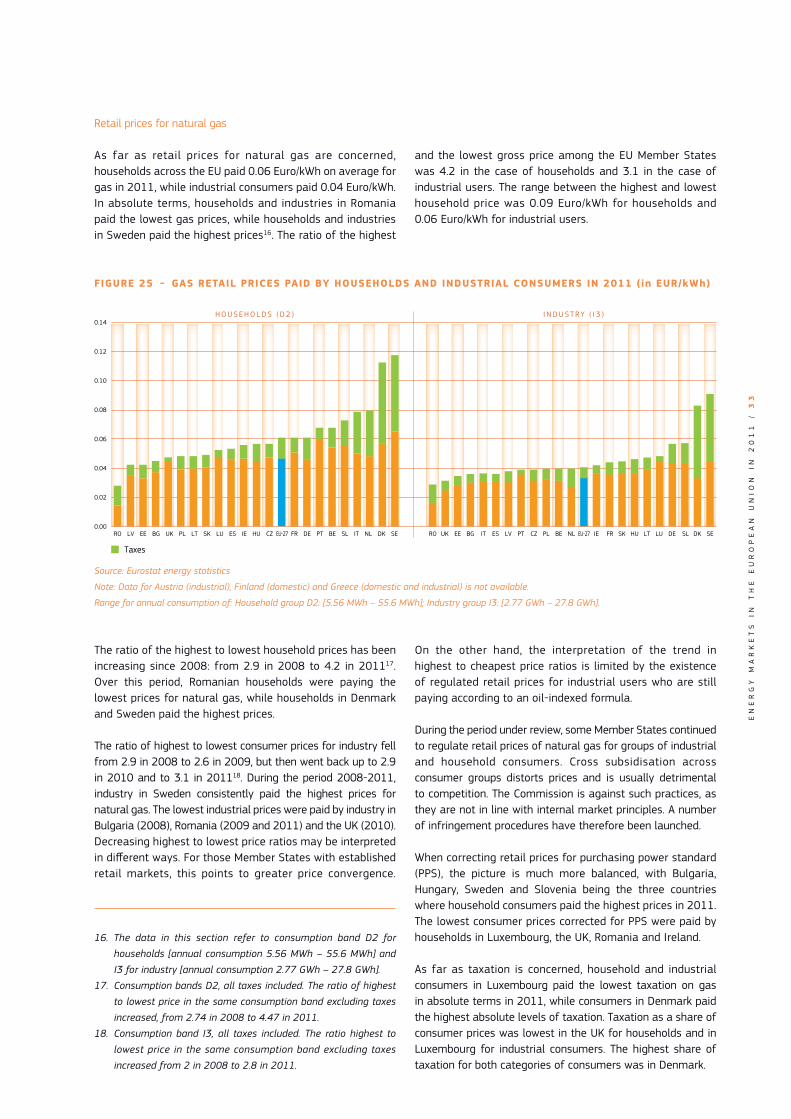
EN
ER
GY
M
AR
KE
TS
I
N
TH
E
EU
RO
PE
AN
U
NI
ON
I
N
20
11
/
3
3
Retail prices for natural gas
As far as retail prices for natural gas are concerned, households across the EU paid 0.06 Euro/kWh on average for gas in 2011, while industrial consumers paid 0.04 Euro/kWh. In absolute terms, households and industries in Romania paid the lowest gas prices, while households and industries in Sweden paid the highest prices16. The ratio of the highest
and the lowest gross price among the EU Member States was 4.2 in the case of households and 3.1 in the case of industrial users. The range between the highest and lowest household price was 0.09 Euro/kWh for households and 0.06 Euro/kWh for industrial users.
The ratio of the highest to lowest household prices has been increasing since 2008: from 2.9 in 2008 to 4.2 in 201117. Over this period, Romanian households were paying the lowest prices for natural gas, while households in Denmark and Sweden paid the highest prices.
The ratio of highest to lowest consumer prices for industry fell from 2.9 in 2008 to 2.6 in 2009, but then went back up to 2.9 in 2010 and to 3.1 in 201118. During the period 2008-2011, industry in Sweden consistently paid the highest prices for natural gas. The lowest industrial prices were paid by industry in Bulgaria (2008), Romania (2009 and 2011) and the UK (2010). Decreasing highest to lowest price ratios may be interpreted in different ways. For those Member States with established retail markets, this points to greater price convergence.
16. The data in this section refer to consumption band D2 for
households [annual consumption 5.56 MWh – 55.6 MWh] and
I3 for industry [annual consumption 2.77 GWh – 27.8 GWh].
17. Consumption bands D2, all taxes included. The ratio of highest
to lowest price in the same consumption band excluding taxes
increased, from 2.74 in 2008 to 4.47 in 2011.
18. Consumption band I3, all taxes included. The ratio highest to
lowest price in the same consumption band excluding taxes
increased from 2 in 2008 to 2.8 in 2011.
On the other hand, the interpretation of the trend in highest to cheapest price ratios is limited by the existence of regulated retail prices for industrial users who are still paying according to an oil-indexed formula.
During the period under review, some Member States continued to regulate retail prices of natural gas for groups of industrial and household consumers. Cross subsidisation across consumer groups distorts prices and is usually detrimental to competition. The Commission is against such practices, as they are not in line with internal market principles. A number of infringement procedures have therefore been launched.
When correcting retail prices for purchasing power standard (PPS), the picture is much more balanced, with Bulgaria, Hungary, Sweden and Slovenia being the three countries where household consumers paid the highest prices in 2011. The lowest consumer prices corrected for PPS were paid by households in Luxembourg, the UK, Romania and Ireland.
As far as taxation is concerned, household and industrial consumers in Luxembourg paid the lowest taxation on gas in absolute terms in 2011, while consumers in Denmark paid the highest absolute levels of taxation. Taxation as a share of consumer prices was lowest in the UK for households and in Luxembourg for industrial consumers. The highest share of taxation for both categories of consumers was in Denmark.
FIGURE 25 - GAS RETAIL PRICES PAID BY HOUSEHOLDS AND INDUSTRIAL CONSUMERS IN 2011 (in EUR/kWh)
H O U S E H O L D S ( D 2 ) I N D U S T R Y ( I 3 )
0.00
0.02
0.08
0.10
0.04
0.06
0.12
0.14
RO LV EE BG UK PL LT SK LU ES IE HU CZ DE PT BE SL IT NL DK SEEU-27 FR RO LVEE BGUK PL LTSK LUES IE HUCZ DEPT BE SLIT NL DK SEEU-27 FR
Taxes
Source: Eurostat energy statistics
Note: Data for Austria (industrial), Finland (domestic) and Greece (domestic and industrial) is not available.
Range for annual consumption of: Household group D2: [5.56 MWh – 55.6 MWh]; Industry group I3: [2.77 GWh – 27.8 GWh].

EN
ER
GY
M
AR
KE
TS
I
N
TH
E
EU
RO
PE
AN
U
NI
ON
I
N
20
11
/
3
4
M A P 2 - G A S P R I C E S ( I N C L U S I V E O F TA X E S ) H O U S E H O L D S - S E C O N D S E M E S T E R 2 0 1 1
61°41°
21°
21°
1°
1°-19°
59°
59°
39°
39°
Prices per kWh (c€)
no data
< 6.01
6.01 - 8.00
8.01 - 10.00
> 10.00
Band D1: 0 MWh < consumption < 5.56 MWh
0 500 1.000 kilometres
EU Average: 9.38 c€ *
* Preliminary assessment excluding FI, GR, CY and MT
Source: © Eurogeographic for the administrative boundaries; Eurostat, May 2012
n.a.
n.a.
n.a.
n.a.6.87
5.9
13.03
18.14
10.49
2.78
5.94
10.93
4.61
6.25
9.34
8.74
9.45
7.19
7.48
7.33
3.72
5.94
10.14
9.61
12.25
8.92
10.85
7.25
As Map 2 above shows, in the smallest household consumption band19 the average consumer price in the second half of 2011 was 0.094 Euro/kWh, with households in Belgium, Czech Republic, Denmark, Germany, France, Italy, the Netherlands, Slovakia and Sweden paying higher than average prices.
19. Consumption band D1 for households: annual consumption up to 5.56 MWh.
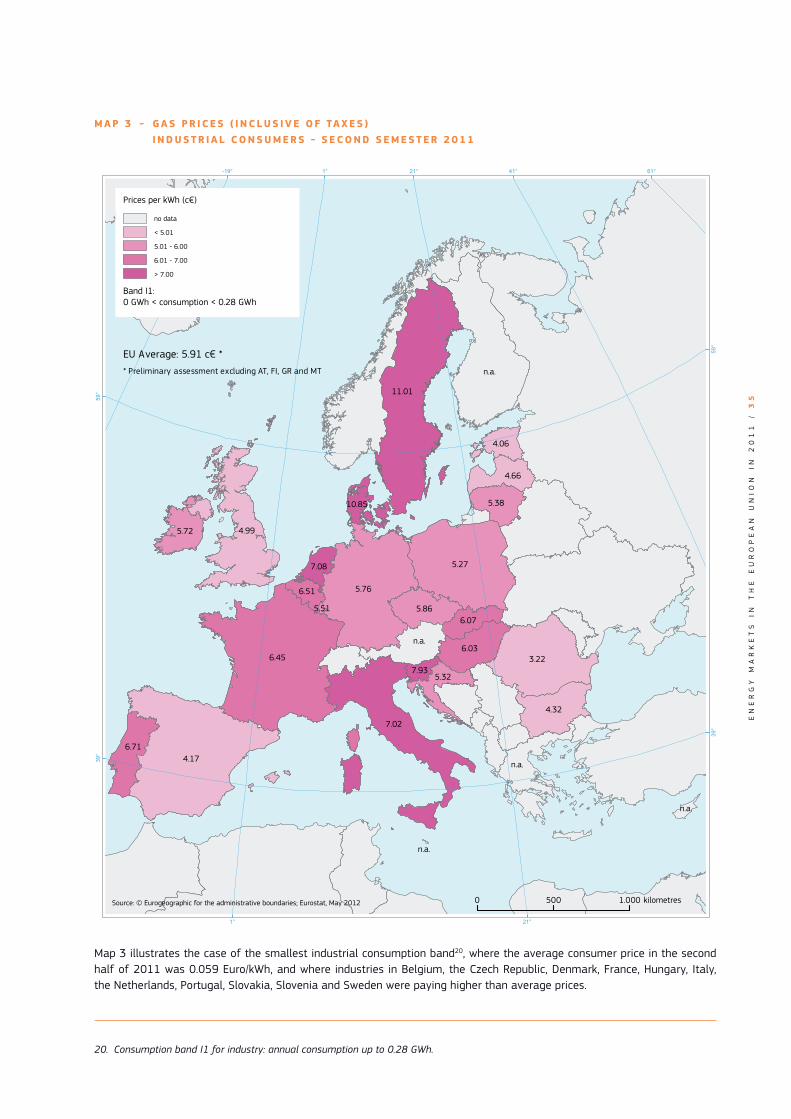
EN
ER
GY
M
AR
KE
TS
I
N
TH
E
EU
RO
PE
AN
U
NI
ON
I
N
20
11
/
3
5
M A P 3 - G A S P R I C E S ( I N C L U S I V E O F TA X E S ) I N D U S T R I A L C O N S U M E R S - S E C O N D S E M E S T E R 2 0 1 1
61°41°
21°
21°
1°
1°-19°
59°
59°
39°
39°
Prices per kWh (c€)
no data
< 5.01
5.01 - 6.00
6.01 - 7.00
> 7.00
Band I1:0 GWh < consumption < 0.28 GWh
0 500 1.000 kilometres
EU Average: 5.91 c€ *
* Preliminary assessment excluding AT, FI, GR and MT
Source: © Eurogeographic for the administrative boundaries; Eurostat, May 2012
n.a.
n.a.
n.a.
n.a.4.17
5.27
6.45
11.01
5.76
3.22
4.99
7.02
4.32
6.03
6.71
n.a.
5.86
5.72
5.38
4.66
5.32
4.06
6.07
6.51
7.08
7.93
10.85
5.51
Map 3 illustrates the case of the smallest industrial consumption band20, where the average consumer price in the second half of 2011 was 0.059 Euro/kWh, and where industries in Belgium, the Czech Republic, Denmark, France, Hungary, Italy, the Netherlands, Portugal, Slovakia, Slovenia and Sweden were paying higher than average prices.
20. Consumption band I1 for industry: annual consumption up to 0.28 GWh.
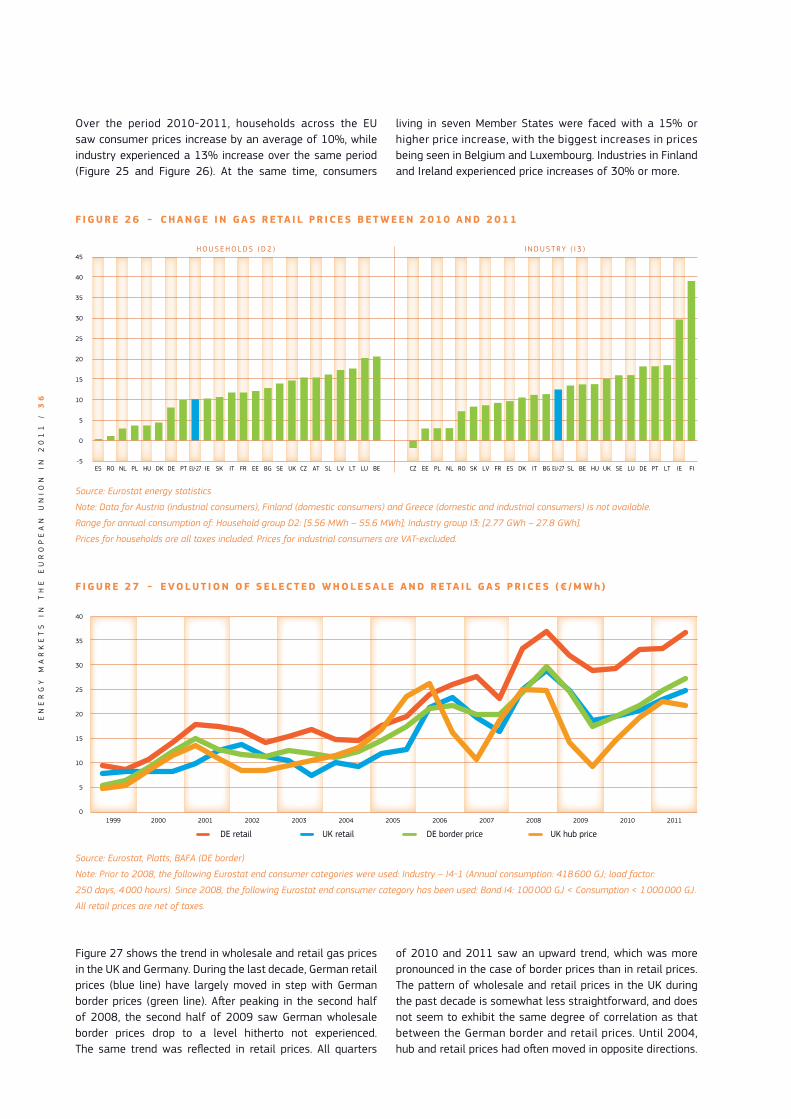
EN
ER
GY
M
AR
KE
TS
I
N
TH
E
EU
RO
PE
AN
U
NI
ON
I
N
20
11
/
3
6
Over the period 2010-2011, households across the EU saw consumer prices increase by an average of 10%, while industry experienced a 13% increase over the same period (Figure 25 and Figure 26). At the same time, consumers
living in seven Member States were faced with a 15% or higher price increase, with the biggest increases in prices being seen in Belgium and Luxembourg. Industries in Finland and Ireland experienced price increases of 30% or more.
Figure 27 shows the trend in wholesale and retail gas prices in the UK and Germany. During the last decade, German retail prices (blue line) have largely moved in step with German border prices (green line). After peaking in the second half of 2008, the second half of 2009 saw German wholesale border prices drop to a level hitherto not experienced. The same trend was reflected in retail prices. All quarters
of 2010 and 2011 saw an upward trend, which was more pronounced in the case of border prices than in retail prices.The pattern of wholesale and retail prices in the UK during the past decade is somewhat less straightforward, and does not seem to exhibit the same degree of correlation as that between the German border and retail prices. Until 2004, hub and retail prices had often moved in opposite directions.
F I G U R E 2 6 - C H A N G E I N G A S R E TA I L P R I C E S B E T W E E N 2 0 1 0 A N D 2 0 1 1
H O U S E H O L D S ( D 2 ) I N D U S T R Y ( I 3 )
-5
0
5
25
20
30
10
15
40
35
45
ROES LVEE BG UKPL LTSKEU-27 LUIEHU CZDE PT BEAT SLITNL DK SEFR RO ESLVEE BG UKPL LTSK EU-27 LU IEHUCZ DE PTBE FISLITNL DK SEFR
Source: Eurostat energy statistics
Note: Data for Austria (industrial consumers), Finland (domestic consumers) and Greece (domestic and industrial consumers) is not available.
Range for annual consumption of: Household group D2: [5.56 MWh – 55.6 MWh]; Industry group I3: [2.77 GWh – 27.8 GWh].
Prices for households are all taxes included. Prices for industrial consumers are VAT-excluded.
F I G U R E 2 7 - E VO L U T I O N O F S E L E C T E D W H O L E S A L E A N D R E TA I L G A S P R I C E S ( € / M W h )
DE retail UK retail DE border price UK hub price
0
5
10
25
30
15
20
35
40
1999 2009 2000 2010 2001 2002 2003 2004 2005 2006 2007 2008 2011
Source: Eurostat, Platts, BAFA (DE border)
Note: Prior to 2008, the following Eurostat end consumer categories were used: Industry – I4-1 (Annual consumption: 418 600 GJ; load factor:
250 days, 4 000 hours). Since 2008, the following Eurostat end consumer category has been used: Band I4: 100 000 GJ < Consumption < 1 000 000 GJ.
All retail prices are net of taxes.
EN
ER
GY
M
AR
KE
TS
I
N
TH
E
EU
RO
PE
AN
U
NI
ON
I
N
20
11
/
3
7
Between 2005 and 2007, UK retail prices followed the same evolution of hub prices with a certain time lag. The retail price peak in 2008 came at a time of initially stable, and then falling, hub prices. There was then a better alignment between the evolution of hub and retail prices in the UK in 2009. Since then, both hub and retail prices have been pursuing an upward course, with convergence over the second half of 2010 and the first half of 2011, and decoupling during the second half of 2011.
3. European electricity markets
While traded volumes of power in the EU have not grown to the same extent as traded volumes of gas in recent years, power market liquidity21 showed an almost continuous increase between 2005 and 2011. Increasing market liquidity is essential for the proper functioning of a wholesale market and for the formation of competitive prices, ensuring welfare benefits for consumers.
As a direct result of the increasing role of wholesale power trading markets in Europe, electricity prices are increasingly being determined by the relationship of demand and supply in the market.
In the process of integration of wholesale electricity markets among neighbouring countries, market coupling in the EU is playing an increasingly important role. Market coupling enables players to trade directly between markets by benefiting automatically from cross-border capacities without having explicitly acquired the necessary transmission capacity in individual markets.
In the power markets of Central Western Europe (CWE), where market coupling took place in November 2010, a steep drop in adverse power flows (flows going from a high price area to a low price area) was observed in Q4 2010, and adverse flows became virtually non-existent in the region from the first quarter of 2011 onwards. The disappearance of adverse flows and a high ratio of hourly converging prices within an observed time period both point to a properly functioning, integrated wholesale power market.
The lack of market coupling prevents prices from acting as effective signals for the direction of power flows between markets. It should therefore be regarded as a market-based and effective tool contributing to the achievement of a single European wholesale electricity market.
Better integration of European wholesale power markets, which has enabled more convergent wholesale power prices, could be one reason why power prices did not follow the sharp increase in fossil fuel prices in the last two or so
21. See definition under section 3.1
years. This achievement also underscores the importance of European-level electricity market policy, and the need to fully implement the successive energy packages adopted in the last couple of years.
3.1. Power supply sources and wholesale markets
Table 8 provides information on the most important factors that influence the electricity import dependency/exporting capacity of each Member State of the EU. It is plain to see that the ratio of both power import and export flows are low compared to the electricity consumption in those countries which are either geographically isolated from other European markets, or have only few interconnections (islands such as Cyprus, Malta, the UK or Ireland) On the other hand, smaller countries (such as Luxembourg, Slovenia or the Baltic States), with good power grid connections to their neighbours, have high import or export power flow ratios compared to their annual electricity demand.
Maximum generation capacity plays an important role in import dependency, because Member States that have large generation capacities (e.g. Germany, France, Italy or Spain) are able to produce more electricity than they consume, and to export the surplus power that they generate.
According to the data presented above, a distinction can be made between net electricity exporting countries (e.g. Bulgaria, Estonia, Czech Republic) and net electricity importing countries (e.g. Hungary, Lithunania or Latvia). The position of a given country as a net exporter or importer position depends on the availability of cheap domestic power generation sources, the size of the generation capacities compared to the annual power demand and the cost of importing electricity from neigbouring countries.
The trend in the traded volume of power in the European wholesale markets also serves as a useful pointer to how the European internal electricity market is evolving. The next chart shows the combined traded volume of the European wholesale day-ahead power markets, including data from all available trading platforms. Between 2005 and 2008 the combined traded volume of power showed dynamic growth and, after a transitory decrease triggered by the economic downturn in 2009, it stabilised in 2010-2011 at a level slightly higher than the pre-crisis peak of 2008.

EN
ER
GY
M
AR
KE
TS
I
N
TH
E
EU
RO
PE
AN
U
NI
ON
I
N
20
11
/
3
8
TA B L E 8 - E L E C T R I C I T Y G E N E R AT I O N , F LOW S A N D C O N S U M P T I O N – 2 0 1 0
DEMAND (CONSUMPTION)
(TWh)
IMPORT LOAD FLOWS/
CONSUMPTION (%)
EXPORT LOAD FLOWS/ CONSUMPTION
(%)
NATIONAL ANNUAL MAX.
LOAD (GW)
MAXIMUM GENERATION
CAPACITY (GW)
BELGIUM 95.67 13.0% 12.4% 14.17 18.69
BULGARIA 38.21 3.1% 25.2% 7.27 12.07
CZECH REPUBLIC 70.96 9.4% 30.4% 10.38 18.94
DENMARK 37.65 28.2% 31.2% 6.35 13.38
GERMANY 612.96 7.0% 9.4% 79.90 152.20
ESTONIA 9.71 11.3% 44.8% 1.59 2.48
IRELAND 29.08 2.6% 1.0% 5.09 8.47
GREECE 63.10 13.5% 4.5% 9.79 13.93
SPAIN 294.76 1.8% 4.6% 44.49 96.31
FRANCE 538.25 3.6% 9.3% 96.71 123.51
ITALY 346.22 13.3% 0.5% 56.43 106.49
CYPRUS 5.35 0.0% 0.0% 1.15 1.47
LATVIA 7.50 53.0% 41.3% 1.32 2.46
LITHUANIA 11.74 69.6% 18.6% 1.71 3.61
LUXEMBOURG 8.66 84.1% 37.2% 1.11 1.73
HUNGARY 42.57 23.3% 11.0% 6.06 8.75
MALTA 2.11 0.0% 0.0% 0.71 0.87
NETHERLANDS 120.92 12.9% 10.6% 17.73 25.47
AUSTRIA 73.46 27.1% 23.9% 10.76 21.09
POLAND 156.30 4.0% 4.9% 23.58 33.31
PORTUGAL 56.71 10.3% 5.6% 9.40 17.91
ROMANIA 58.35 1.3% 5.2% 8.46 17.05
SLOVENIA 14.31 56.0% 70.8% 1.97 3.04
SLOVAKIA 28.88 25.4% 21.8% 4.34 7.78
FINLAND 91.17 17.2% 5.7% 14.59 17.08
SWEDEN 150.69 9.9% 8.5% 26.69 35.70
UNITED KINGDOM 383.79 1.9% 1.2% 60.10 79.71
Source: Eurostat, ENTSO-E
Between 2005 and 2011, there was an almost continuous increase in market liquidity, which is measured as the ratio of the traded volume of wholesale day-ahead power contracts and the annual gross inland electricity consumption in a given country (or group of countries). Increasing market liquidity is essential to the proper functioning of a wholesale market and for the formation of competitive prices, ensuring welfare benefits for consumers. Although there was no significant increase in power traded volumes between 2008 and 2011, there was a rise in the liquidity ratio during that period as a result of decreasing power consumption, which was due to the sluggish economic recovery and to the increasing efficiency of electricity use in many European economies.
The broadening role of wholesale power trading markets in Europe has meant that electricity prices are increasingly
being determined by the relationship of demand and supply in the market.
The next chart shows the trend of the Platts European Power Index (PEP, which is a composite price index of the major European markets) side-by-side with developments in prices of the Brent crude oil spot, German import gas and coal import contracts between 2002 and 2011. Although the first half of the period exhibited a strong correlation between the evolution of wholesale power prices and fossil fuel prices, the increase in fossil fuel prices in more recent years substantially exceeded the rise in the PEP index. Moreover, although both power and fuel prices did recover from the lows recorded in the first half of 2009, the increase in power prices was relatively modest compared to those of coal, gas and – especially − oil.
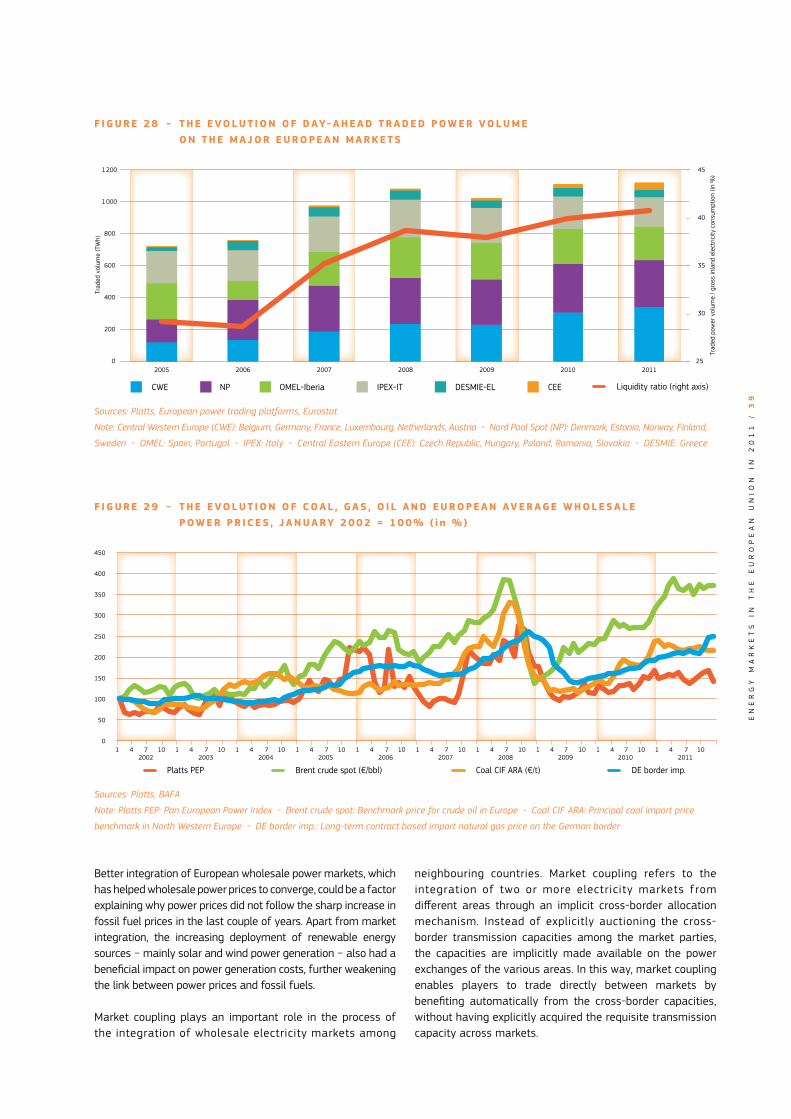
EN
ER
GY
M
AR
KE
TS
I
N
TH
E
EU
RO
PE
AN
U
NI
ON
I
N
20
11
/
3
9
F I G U R E 2 8 - T H E E VO L U T I O N O F D AY- A H E A D T R A D E D P OW E R VO L U M E O N T H E M A J O R E U R O P E A N M A R K E T S
CWE IPEX-IT DESMIE-EL CEE OMEL-Iberia NP
2005 2006 2007 2008 2009 2010 2011
Liquidity ratio (right axis)
Trad
ed p
ower
vol
ume
/ gro
ss in
land
ele
ctric
ity c
onsu
mpt
ion
(in %
)
0
200
400
600
800
1 000
1 200
25
30
35
40
45
Trad
ed v
olum
e (T
Wh)
Sources: Platts, European power trading platforms, Eurostat
Note: Central Western Europe (CWE): Belgium, Germany, France, Luxembourg, Netherlands, Austria - Nord Pool Spot (NP): Denmark, Estonia, Norway, Finland,
Sweden - OMEL: Spain, Portugal - IPEX: Italy - Central Eastern Europe (CEE): Czech Republic, Hungary, Poland, Romania, Slovakia - DESMIE: Greece
F I G U R E 2 9 - T H E E VO L U T I O N O F C O A L , G A S , O I L A N D E U R O P E A N AV E R AG E W H O L E S A L E P OW E R P R I C E S , J A N U A RY 2 0 0 2 = 1 0 0 % ( i n % )
2002 2003 2004 2005 2006 2007 2008 2009 2010 20111 1074 1 1074 1 1074 1 1074 1 1074 1 1074 1 1074 1 1074 1 1074 1 1074
Platts PEP Brent crude spot (€/bbl) Coal CIF ARA (€/t) DE border imp.
0
200
250
300
50
100
150
350
400
450
Sources: Platts, BAFA
Note: Platts PEP: Pan European Power Index - Brent crude spot: Benchmark price for crude oil in Europe - Coal CIF ARA: Principal coal import price
benchmark in North Western Europe - DE border imp.: Long-term contract based import natural gas price on the German border
Better integration of European wholesale power markets, which has helped wholesale power prices to converge, could be a factor explaining why power prices did not follow the sharp increase in fossil fuel prices in the last couple of years. Apart from market integration, the increasing deployment of renewable energy sources − mainly solar and wind power generation − also had a beneficial impact on power generation costs, further weakening the link between power prices and fossil fuels.
Market coupling plays an important role in the process of the integration of wholesale electricity markets among
neighbouring countries. Market coupling refers to the integration of two or more electricity markets from different areas through an implicit cross-border allocation mechanism. Instead of explicitly auctioning the cross-border transmission capacities among the market parties, the capacities are implicitly made available on the power exchanges of the various areas. In this way, market coupling enables players to trade directly between markets by benefiting automatically from the cross-border capacities, without having explicitly acquired the requisite transmission capacity across markets.

EN
ER
GY
M
AR
KE
TS
I
N
TH
E
EU
RO
PE
AN
U
NI
ON
I
N
20
11
/
4
0
The next chart illustrates the benefits of market coupling. It shows the quarterly trend of adverse power flow ratios between neighbouring European markets in 2010-2011. Adverse cross border flows occur when commercial nominations for cross border capacities are such that power is set to flow from a higher price area to a lower price area. Adverse power flow ratios are calculated as the number of hours during which adverse flow occurred in a quarter compared to the number of hours of available power flow data for that quarter.
In those Central Western Europe (CWE) markets where market coupling took place in November 2010, a steep fall in adverse power flows was observed in Q4 2010, and adverse flows were virtually non-existent in the region from the first quarter of 2011 onwards. Disappearing adverse flows and a high ratio of hourly converging prices within an observed time period both point to a properly functioning, integrated wholesale power market. In 2011, the difference in hourly power prices in the CWE region was less than 1% between all participating markets in 64% of all hourly price observations.
By contrast, in the Central Eastern European (CEE) region, where market coupling exists only between the Czech Republic and Slovakia, adverse flow ratios remained permanently high during the period presented in the above chart. The absence of market coupling prevents prices from acting as effective signals for the direction of power flows between markets. In practice, it prevents flows being directed from low price to high price areas, even in cases where there are considerable price differentials between neighbouring markets. Besides high adverse flow ratios, the CEE region can also be characterised by a low proportion of price-converging hours among the different markets. The difference in power prices in the CEE region was less than 1% in only 3-15% of the total hourly observations in 2011, which was significantly lower than in the case of the CWE region.
The obvious difference between the CWE and the CEE regions, as far as the number of ‘price-converging’ hours and adverse flow frequencies is concerned, further underlines the importance of promoting market coupling in those power regions where it does not exist at present. Market coupling should be regarded as a market-based and effective tool contributing to the achievement of a single European wholesale electricity market.
The next table provides an overview of the trend in the annual average day-ahead baseload power prices in the European power markets between 2009 and 2011. Prices in most of the observed markets in 2010 showed a significant upturn compared to 2009, mainly as a result of the increasing demand for power, in parallel with the economic recovery and increasing fossil fuel prices. In 2011, prices rose further in many markets, although they fell in the Nordic countries due to a milder winter and better hydro availability. Annual average wholesale power prices in the CWE region rose in 2011 compared to 2010; this was also due to the impact of the German government’s decision to immediately take eight nuclear reactors out of the power grid in spring 2011, following the Fukushima nuclear power plant accident in Japan. Although Austria is not part of the market coupling in the region, its price trends closely follow those of the German market, due to the agreement between EXAA and EPEX markets that enables market participants to trade on both platforms.
The Nord Pool Spot market is the other large market coupling area in Europe where prices were among the lowest on the continent, since the abundant hydro-based power generation in Norway and Sweden had a beneficial impact on the whole region. However, this effect was more limited in those countries (e.g. Finland or Denmark) which have fewer direct interconnections to these cheap hydro-power sources.
F I G U R E 3 0 - T H E E VO L U T I O N O F A DV E R S E P OW E R F LOW R AT I O S I N T H E C E N T R A L W E S T E R N A N D C E N T R A L E A S T E R N E U R O P E A N R E G I O N ( i n % )
2010q3 2010q4 2011q1 2011q2 2011q3 2011q4
BE-NL DE-NL DE-FR DE-CZ AT-HU SK-HU CZ-SK CZ-PL
0
10
20
30
40
50
60
Sources: ENTSO-E, Platts, Power trading platforms and own computations
Note: The Market Coupling took place on 9 November 2010 in the Central West European Region.
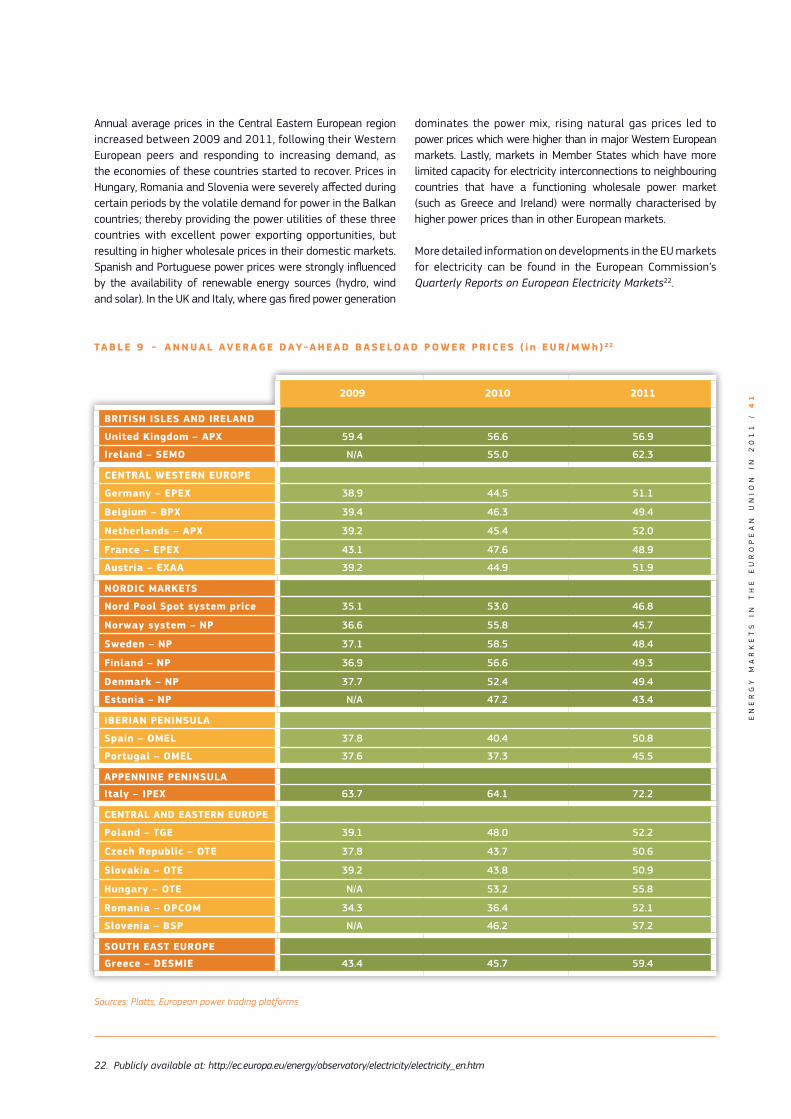
EN
ER
GY
M
AR
KE
TS
I
N
TH
E
EU
RO
PE
AN
U
NI
ON
I
N
20
11
/
4
1
Annual average prices in the Central Eastern European region increased between 2009 and 2011, following their Western European peers and responding to increasing demand, as the economies of these countries started to recover. Prices in Hungary, Romania and Slovenia were severely affected during certain periods by the volatile demand for power in the Balkan countries; thereby providing the power utilities of these three countries with excellent power exporting opportunities, but resulting in higher wholesale prices in their domestic markets.Spanish and Portuguese power prices were strongly influenced by the availability of renewable energy sources (hydro, wind and solar). In the UK and Italy, where gas fired power generation
dominates the power mix, rising natural gas prices led to power prices which were higher than in major Western European markets. Lastly, markets in Member States which have more limited capacity for electricity interconnections to neighbouring countries that have a functioning wholesale power market (such as Greece and Ireland) were normally characterised by higher power prices than in other European markets.
More detailed information on developments in the EU markets for electricity can be found in the European Commission’s Quarterly Reports on European Electricity Markets22.
TA B L E 9 - A N N U A L AV E R AG E D AY- A H E A D B A S E LO A D P OW E R P R I C E S ( i n E U R / M W h ) 2 2
2009 2010 2011
BRITISH ISLES AND IRELAND
United Kingdom – APX 59.4 56.6 56.9
Ireland – SEMO N/A 55.0 62.3
CENTRAL WESTERN EUROPE
Germany – EPEX 38.9 44.5 51.1
Belgium – BPX 39.4 46.3 49.4
Netherlands – APX 39.2 45.4 52.0
France – EPEX 43.1 47.6 48.9
Austria – EXAA 39.2 44.9 51.9
NORDIC MARKETS
Nord Pool Spot system price 35.1 53.0 46.8
Norway system – NP 36.6 55.8 45.7
Sweden – NP 37.1 58.5 48.4
Finland – NP 36.9 56.6 49.3
Denmark – NP 37.7 52.4 49.4
Estonia – NP N/A 47.2 43.4
IBERIAN PENINSULA
Spain – OMEL 37.8 40.4 50.8
Portugal – OMEL 37.6 37.3 45.5
APPENNINE PENINSULA
Italy – IPEX 63.7 64.1 72.2
CENTRAL AND EASTERN EUROPE
Poland – TGE 39.1 48.0 52.2
Czech Republic – OTE 37.8 43.7 50.6
Slovakia – OTE 39.2 43.8 50.9
Hungary – OTE N/A 53.2 55.8
Romania – OPCOM 34.3 36.4 52.1
Slovenia – BSP N/A 46.2 57.2
SOUTH EAST EUROPE
Greece – DESMIE 43.4 45.7 59.4
Sources: Platts, European power trading platforms
22. Publicly available at: http://ec.europa.eu/energy/observatory/electricity/electricity_en.htm

EN
ER
GY
M
AR
KE
TS
I
N
TH
E
EU
RO
PE
AN
U
NI
ON
I
N
20
11
/
4
2
3.2. Market structure and unbundling
There are significant differences between Member States in terms of the structure of the electricity generation and retail distribution markets. Although there are between one and eight electricity utilities with more than 5% share of total national generation, the total number of power generation companies representing at least 95% of national generation reached a three-digit or even a four-digit figure in certain EU countries (e.g. Germany, the Netherlands and Denmark, see next table). However, such a low concentration of electricity generation is unusual in the EU. As the table also shows, concentration in electricity generation is high in most of the EU Member States.
On the retail side, there is a similar picture as far as the number of market participants that provide at least 5% of the national electricity consumption - and also the number of retail companies - are concerned. However, the link between the concentration in power generation and in the retail sector is not particularly strong, as there are many countries where higher concentration in power generation does not necessarily involve a high concentration in the retail sector or vice versa.
TA B L E 1 0 - S T R U C T U R E O F T H E E L E C T R I C I T Y M A R K E T I N 2 0 1 0
N U M B E R O F C O M PA N I E S R E P R E S E N T I N G AT L E A S T 9 5 %
O F N E T E L E C T R I C I T Y G E N E R AT I O N
N U M B E R O F M A I N
E L E C T R I C I T Y C O M PA N I E S ( 1)
M A R K E T S H A R E O F T H E
L A R G E S T G E N E R ATO R
I N T H E E L E C T R I C I T Y
M A R K E T
TOTA L N U M B E R OF ELECTRIC ITY
R E TA I L E R S TO F I N A L
C O N S U M E R S
N U M B E R O F M A I N
E L E C T R I C I T Y R E TA I L E R S ( 2)
BELGIUM 4 3 79.1% 37 3
BULGARIA 22 5 N/A 36 5
CZECH REPUBLIC 24 1 73.0% 324 3
DENMARK > 1000 2 46.0% 33
GERMANY > 450 4 28.4% > 1000 3
ESTONIA 6 1 89.0% 41 1
IRELAND 8 6 34.0% 8 5
GREECE 4 1 85.1% 11 1
SPAIN N/A 4 24.0% 202 4
FRANCE > 5 1 86.5% 177 1
ITALY 217 5 28.0% 342 3
CYPRUS 1 1 100.0% 1 1
LATVIA 45 1 88.0% 4 1
LITHUANIA 17 5 35.4% 15 3
LUXEMBOURG 3 2 85.4% 11 4
HUNGARY 68 3 42.1% 38 5
MALTA 1 1 100.0% 1 1
NETHERLANDS 7 5 N/A 36 3
AUSTRIA 126 4 N/A 129 6
POLAND 68 5 17.4% 146 7
PORTUGAL 107 2 47.2% 10 4
ROMANIA 10 6 35.6% 56 8
SLOVENIA 3 2 56.3% 16 7
SLOVAKIA 8 1 80.9% 77 5
FINLAND 29 4 26.6% 72 3
SWEDEN 24 5 42.0% 134 5
UNITED KINGDOM 19 9 20.0% 22 6
Sources: Eurostat, 2010 data and National Regulators
(1) Companies are considered as ‘main’ if they produce at least 5% of the national net electricity generation.
(2) Retailers are considered as ‘main’ if they sell at least 5% of the total national electricity consumption.
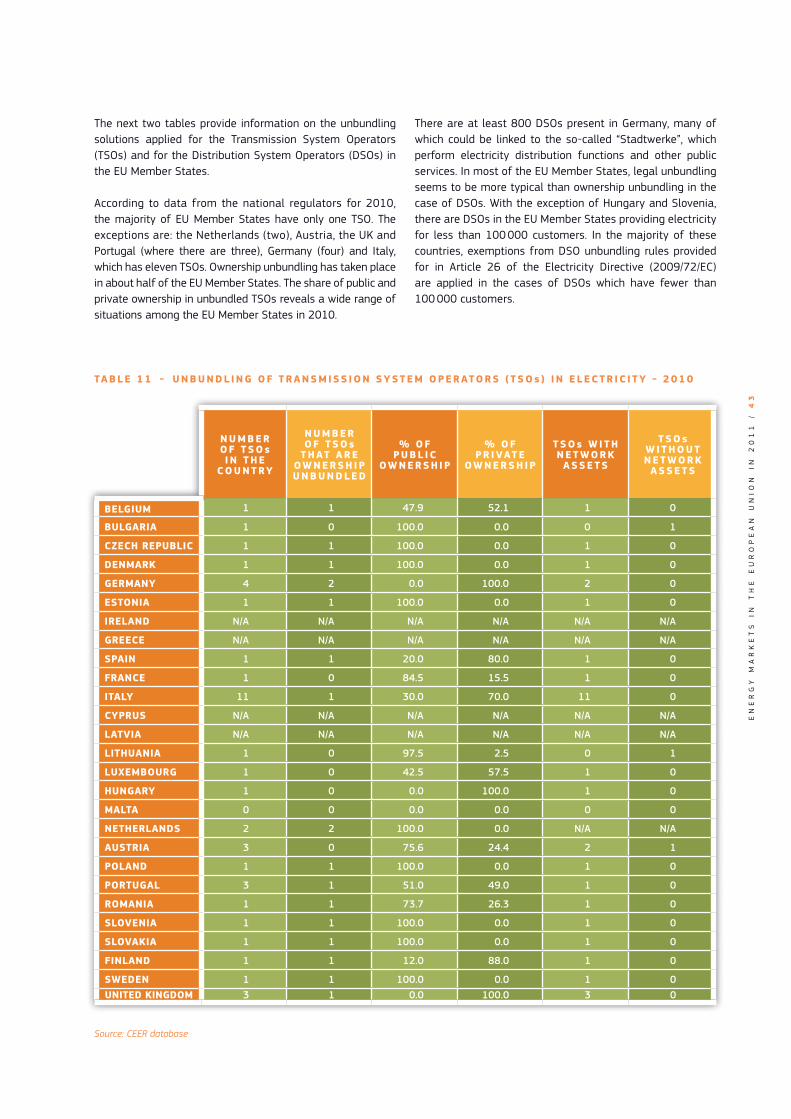
EN
ER
GY
M
AR
KE
TS
I
N
TH
E
EU
RO
PE
AN
U
NI
ON
I
N
20
11
/
4
3
The next two tables provide information on the unbundling solutions applied for the Transmission System Operators (TSOs) and for the Distribution System Operators (DSOs) in the EU Member States.
According to data from the national regulators for 2010, the majority of EU Member States have only one TSO. The exceptions are: the Netherlands (two), Austria, the UK and Portugal (where there are three), Germany (four) and Italy, which has eleven TSOs. Ownership unbundling has taken place in about half of the EU Member States. The share of public and private ownership in unbundled TSOs reveals a wide range of situations among the EU Member States in 2010.
There are at least 800 DSOs present in Germany, many of which could be linked to the so-called “Stadtwerke”, which perform electricity distribution functions and other public services. In most of the EU Member States, legal unbundling seems to be more typical than ownership unbundling in the case of DSOs. With the exception of Hungary and Slovenia, there are DSOs in the EU Member States providing electricity for less than 100 000 customers. In the majority of these countries, exemptions from DSO unbundling rules provided for in Article 26 of the Electricity Directive (2009/72/EC) are applied in the cases of DSOs which have fewer than 100 000 customers.
TA B L E 1 1 - U N B U N D L I N G O F T R A N S M I S S I O N S Y S T E M O P E R ATO R S ( T S O s ) I N E L E C T R I C I T Y - 2 0 1 0
N U M B E R O F T S O s I N T H E
C O U N T RY
N U M B E R O F T S O s
T H AT A R E OW N E R S H I P U N B U N D L E D
% O F P U B L I C
OW N E R S H I P
% O F P R I VAT E
OW N E R S H I P
T S O s W I T H N E T WO R K
A S S E T S
T S O s W I T H O U T N E T WO R K
A S S E T S
BELGIUM 1 1 47.9 52.1 1 0
BULGARIA 1 0 100.0 0.0 0 1
CZECH REPUBLIC 1 1 100.0 0.0 1 0
DENMARK 1 1 100.0 0.0 1 0
GERMANY 4 2 0.0 100.0 2 0
ESTONIA 1 1 100.0 0.0 1 0
IRELAND N/A N/A N/A N/A N/A N/A
GREECE N/A N/A N/A N/A N/A N/A
SPAIN 1 1 20.0 80.0 1 0
FRANCE 1 0 84.5 15.5 1 0
ITALY 11 1 30.0 70.0 11 0
CYPRUS N/A N/A N/A N/A N/A N/A
LATVIA N/A N/A N/A N/A N/A N/A
LITHUANIA 1 0 97.5 2.5 0 1
LUXEMBOURG 1 0 42.5 57.5 1 0
HUNGARY 1 0 0.0 100.0 1 0
MALTA 0 0 0.0 0.0 0 0
NETHERLANDS 2 2 100.0 0.0 N/A N/A
AUSTRIA 3 0 75.6 24.4 2 1
POLAND 1 1 100.0 0.0 1 0
PORTUGAL 3 1 51.0 49.0 1 0
ROMANIA 1 1 73.7 26.3 1 0
SLOVENIA 1 1 100.0 0.0 1 0
SLOVAKIA 1 1 100.0 0.0 1 0
FINLAND 1 1 12.0 88.0 1 0
SWEDEN 1 1 100.0 0.0 1 0 UNITED KINGDOM 3 1 0.0 100.0 3 0
Source: CEER database

EN
ER
GY
M
AR
KE
TS
I
N
TH
E
EU
RO
PE
AN
U
NI
ON
I
N
20
11
/
4
4
TA B L E 1 2 - U N B U N D L I N G O F D I S T R I B U T I O N S Y S T E M O P E R ATO R S ( D S O s ) I N E L E C T R I C I T Y – 2 0 1 0
N U M B E R O F D S O s I N T H E
C O U N T RY
N U M B E R O F D S O s T H AT A R E
OW N E R S H I P U N B U N D L E D
N U M B E R O F D S O s T H AT A R E L E G A L LY
U N B U N D L E D
A P P L I C AT I O N OF THE 100 000
C U S TO M E R E X E M P T I O N
IN THE COUNTRY
N U M B E R O F D S O s
W I T H F E W E R T H A N 1 0 0 0 0 0
C U S TO M E R S
BELGIUM 27 11 27 NO 12
BULGARIA 4 4 4 NO 1
CZECH REPUBLIC 3 0 3 YES 297
DENMARK 77 0 77 NO 71
GERMANY 869 0 146 YES 794
ESTONIA 37 N/A 1 YES 36
IRELAND N/A N/A N/A N/A N/A
GREECE N/A N/A N/A N/A N/A
SPAIN 351 0 351 YES 345
FRANCE 148 0 5 YES 143
ITALY 144 119 10 YES 134
CYPRUS N/A N/A N/A N/A N/A
LATVIA N/A N/A N/A N/A N/A
LITHUANIA 2 0 2 YES 4
LUXEMBOURG 6 0 1 YES 5
HUNGARY 6 0 6 NO 0
MALTA 1 0 0 NO 0
NETHERLANDS 7 5 7 NO 3
AUSTRIA 128 0 11 YES 117
POLAND 22 0 7 YES 15
PORTUGAL 13 10 11 YES 10
ROMANIA 37 5 8 YES 29
SLOVENIA 1 0 1 NO 0
SLOVAKIA 3 0 3 YES 162
FINLAND 85 0 51 NO 82
SWEDEN 173 0 173 YES 167
UNITED KINGDOM 19 13 6 NO 5
Source: CEER database
3.3. Retail markets
Switching rates
Properly functioning retail electricity markets rely on the awareness of consumers to choose their electricity suppliers. Although all consumers were given the option to switch between power utilities in the EU since 2007, it was mainly the medium-to-large size industrial consumers that switched suppliers in 2010 in most of the EU Member States. In the case of household consumers, progress was slow in 2009-2010, with fewer than 10% of households switching suppliers in the majority of Member States. As far as industrial consumers are concerned, the issue of cost-effectiveness seems to be more relevant than in the case
of households, and the competition between power utilities for industrial consumers is likely to be stronger than for household customers. Furthermore, in many countries a significant percentage of households are not sufficiently informed about switching possibilities, which also leads to lower household switching rates than in the case of industrial consumers.

EN
ER
GY
M
AR
KE
TS
I
N
TH
E
EU
RO
PE
AN
U
NI
ON
I
N
20
11
/
4
5
TA B L E 1 3 - E L E C T R I C I T Y S W I TC H I N G R AT E S FO R C U S TO M E R T Y P E S I N 2 0 0 9 A N D 2 0 1 0 ( i n % )
2010: per cent. Change compared to 2009: percentage points.
W H O L E R E TA I L
M A R K E THOUSEHOLDS
NON-HOUSEHOLD CUSTOMERS
LARGE INDSUTRIAL CUSTOMERS
M E D I U M -S I Z E D
I N D U S T RY
SMALL INDUSTRY
AND HOUSEHOLDS
2010CHANGE COMP.
TO 20092010
CHANGE COMP.
TO 20092010
CHANGE COMP.
TO 20092010
CHANGE COMP.
TO 20092010
CHANGE COMP.
TO 20092010
CHANGE COMP.
TO 2009
BELGIUM 10.0 3.1 8.8 2.4 16.0 5.9 N/A N/A N/A N/A N/A N/A
BULGARIA N/A N/A N/A N/A N/A N/A N/A N/A N/A N/A N/A N/A
CZECH REPUBLIC 3.3 1.8 3.2 2.1 7.9 3.8 72.0 -1.0 30.0 8.0 3.3 1.8
DENMARK 4.3 -1.9 4.2 -1.9 11.4 -5.1 N/A N/A 11.4 -5.1 4.3 -1.8
GERMANY 6.3 1.4 6.0 1.3 7.5 1.6 13.9 -1.7 7.4 1.5 6.3 1.5
ESTONIA N/A N/A 0.0 0.0 N/A N/A N/A N/A N/A N/A 0.0 0.0
IRELAND N/A N/A N/A N/A N/A N/A N/A N/A N/A N/A N/A N/A
GREECE N/A N/A N/A N/A N/A N/A N/A N/A N/A N/A N/A N/A
SPAIN 7.4 6.6 2.1 1.6 17.3 8.2 14.9 4.2 29.7 14.6 2.5 1.7
FRANCE 2.0 -1.4 2.3 -1.4 0.9 -0.4 N/A N/A N/A N/A 2.1 -1.5
ITALY 5.9 1.4 4.1 1.8 12.4 -0.1 17.8 -7.9 28.8 -8.5 5.8 1.4
CYPRUS N/A N/A N/A N/A N/A N/A N/A N/A N/A N/A N/A N/A
LATVIA N/A N/A N/A N/A N/A N/A N/A N/A N/A N/A N/A N/A
LITHUANIA 1.3 1.3 0.0 0.0 4.1 4.1 0.8 0.8 3.3 3.3 0.0 0.0
LUXEMBOURG 0.2 0.0 0.2 0.1 0.6 0.1 2.3 -1.0 0.6 0.1 0.2 0.1
HUNGARY N/A N/A N/A N/A N/A N/A N/A N/A N/A N/A N/A N/A
MALTA N/A N/A N/A N/A N/A N/A N/A N/A N/A N/A N/A N/A
NETHERLANDS 8.9 -2.1 N/A N/A N/A N/A N/A N/A N/A N/A 8.9 -2.1
AUSTRIA 1.8 0.5 1.7 0.5 2.1 0.4 5.2 -3.0 11.6 4.2 1.8 0.5
POLAND 0.1 N/A N/A N/A N/A N/A N/A N/A N/A N/A N/A N/A
PORTUGAL 2.3 0.0 2.1 0.0 27.4 8.2 25.1 -7.6 37.0 12.4 2.2 0.0
ROMANIA 0.1 0.1 0.0 0.0 1.0 N/A 21.6 8.2 4.3 0.1 0.1 0.1
SLOVENIA 1.9 0.5 1.0 -0.1 9.6 4.7 0.0 0.0 16.8 11.1 1.9 0.5
SLOVAKIA 1.0 0.1 0.8 0.3 1.6 -1.0 N/A N/A N/A N/A 1.3 0.4
FINLAND 7.6 -0.5 7.6 -0.5 N/A N/A N/A N/A N/A N/A N/A N/A
SWEDEN 9.4 -1.8 8.2 -1.6 1.2 -0.2 9.0 -1.0 9.0 -1.0 9.5 -1.9
UNITED KINGDOM N/A N/A 17.3 -1.1 N/A N/A N/A N/A N/A N/A 17.3 -1.1
Sources: CEER database and National Regulators
Retail prices for electricity
Although prices between many European wholesale markets have converged to some extent in the last couple of years, significant differences in the retail prices were still being observed in 2011.
Households across the EU paid 0.18 Euro/kWh on average for electricity in 2011, while industrial consumers paid 0.14 Euro/kWh. In absolute terms, households and industries in Bulgaria and Estonia paid the lowest electricity prices, while households and industries in Denmark paid the highest
prices23. The ratio of the highest to the lowest gross price among the EU Member States was 4.2 in the case of households and 3.1 in the case of industrial users. The range between the highest and lowest household price was 0.09 Euro/kWh in the case of households and 0.06 Euro/kWh in the case of industrial users.
23. The data in this section refers to consumption band DC for
households [annual consumption 2 500 KWh - 5 000 KWh] and
IC for industry [annual consumption 500 MWh - 2 000 MWh].
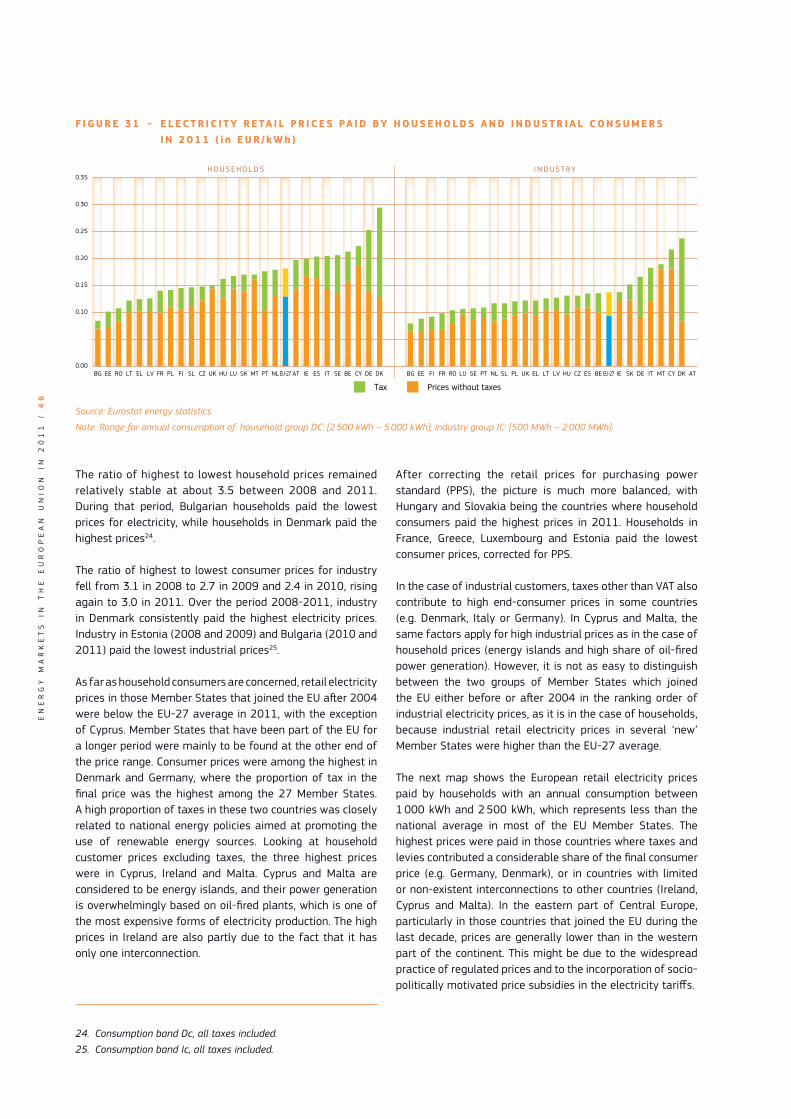
EN
ER
GY
M
AR
KE
TS
I
N
TH
E
EU
RO
PE
AN
U
NI
ON
I
N
20
11
/
4
6
F I G U R E 3 1 - E L E C T R I C I T Y R E TA I L P R I C E S PA I D BY H O U S E H O L D S A N D I N D U S T R I A L C O N S U M E R S I N 2 0 1 1 ( i n E U R / k W h )
H O U S E H O L D S I N D U S T R Y
Tax Prices without taxes
0.00
0.20
0.25
0.10
0.15
0.30
0.35
RO LVEEBG UKPL FILT EL SK MTLU ESIEHUCZ DEPT BE CYSL ITATNL DKSEEU-27FR RO LVEEBG UKPLFI LTEL SK MTLU ES IEHU CZ DEPT BE CYSL IT ATNL DKSE EU-27FR
Source: Eurostat energy statistics
Note: Range for annual consumption of: household group DC: [2 500 kWh – 5 000 kWh]; industry group IC: [500 MWh – 2 000 MWh].
The ratio of highest to lowest household prices remained relatively stable at about 3.5 between 2008 and 2011. During that period, Bulgarian households paid the lowest prices for electricity, while households in Denmark paid the highest prices24.
The ratio of highest to lowest consumer prices for industry fell from 3.1 in 2008 to 2.7 in 2009 and 2.4 in 2010, rising again to 3.0 in 2011. Over the period 2008-2011, industry in Denmark consistently paid the highest electricity prices. Industry in Estonia (2008 and 2009) and Bulgaria (2010 and 2011) paid the lowest industrial prices25.
As far as household consumers are concerned, retail electricity prices in those Member States that joined the EU after 2004 were below the EU-27 average in 2011, with the exception of Cyprus. Member States that have been part of the EU for a longer period were mainly to be found at the other end of the price range. Consumer prices were among the highest in Denmark and Germany, where the proportion of tax in the final price was the highest among the 27 Member States. A high proportion of taxes in these two countries was closely related to national energy policies aimed at promoting the use of renewable energy sources. Looking at household customer prices excluding taxes, the three highest prices were in Cyprus, Ireland and Malta. Cyprus and Malta are considered to be energy islands, and their power generation is overwhelmingly based on oil-fired plants, which is one of the most expensive forms of electricity production. The high prices in Ireland are also partly due to the fact that it has only one interconnection.
24. Consumption band Dc, all taxes included.
25. Consumption band Ic, all taxes included.
After correcting the retail prices for purchasing power standard (PPS), the picture is much more balanced, with Hungary and Slovakia being the countries where household consumers paid the highest prices in 2011. Households in France, Greece, Luxembourg and Estonia paid the lowest consumer prices, corrected for PPS.
In the case of industrial customers, taxes other than VAT also contribute to high end-consumer prices in some countries (e.g. Denmark, Italy or Germany). In Cyprus and Malta, the same factors apply for high industrial prices as in the case of household prices (energy islands and high share of oil-fired power generation). However, it is not as easy to distinguish between the two groups of Member States which joined the EU either before or after 2004 in the ranking order of industrial electricity prices, as it is in the case of households, because industrial retail electricity prices in several ‘new’ Member States were higher than the EU-27 average.
The next map shows the European retail electricity prices paid by households with an annual consumption between 1 000 kWh and 2 500 kWh, which represents less than the national average in most of the EU Member States. The highest prices were paid in those countries where taxes and levies contributed a considerable share of the final consumer price (e.g. Germany, Denmark), or in countries with limited or non-existent interconnections to other countries (Ireland, Cyprus and Malta). In the eastern part of Central Europe, particularly in those countries that joined the EU during the last decade, prices are generally lower than in the western part of the continent. This might be due to the widespread practice of regulated prices and to the incorporation of socio-politically motivated price subsidies in the electricity tariffs.
EN
ER
GY
M
AR
KE
TS
I
N
TH
E
EU
RO
PE
AN
U
NI
ON
I
N
20
11
/
4
7
Further integration of wholesale power markets reduced the price differentials between many EU countries, as can be seen in the case of the Nordic markets and in the Central Western European markets. However, significant price differences were observed between the household retail electricity prices of these countries. This can be explained by differences in network costs and taxation, the latter of which falls within the remit of the national legislations in each Member State. Some countries continue the practice of indexing the retail electricity price to fossil fuel prices, which does not allow changes in prices at the wholesale level to be reflected in retail electricity prices.
Industrial users with annual consumption between 20 MWh and 500 MWh paid retail prices above the EU average of 0.154 Euro/kWh in eleven of the Member States. Again, the highest prices were observed in countries where tax accounted for a larger share of the final consumer price (e.g. Germany, Denmark, Italy, the Netherlands), or in countries with limited or non-existent interconnections to other countries (Ireland, Cyprus and Malta). Unlike in the case of household retail prices, some of the Nordic countries (Norway, Finland and Sweden), along with Luxembourg and France, are among those with the lowest retail prices for industrial consumers.

EN
ER
GY
M
AR
KE
TS
I
N
TH
E
EU
RO
PE
AN
U
NI
ON
I
N
20
11
/
4
8
M A P 4 - E L E C T R I C I T Y P R I C E S ( I N C L U S I V E O F TA X E S ) H O U S E H O L D S - S E C O N D S E M E S T E R 2 0 1 1
61°41°
21°
21°
1°
1°-19°
59°
59°
39°
39°
Prices per kWh (€)
no data
< 0.151
0.151- 0.200
0.201 - 0.250
> 0.250
Band Db : 1 000 kWh < Consumption < 2 500 kWh
0 500 1.000 kilometres
EU Average : 0.196 € ** Preliminary assessment
Source: © Eurogeographic for the administrative boundaries; Eurostat, May 2012
0.161
0.232
0.222
0.278
0.174
0.11
0.144
0.283
0.174
0.173
0.086
0.22 0.166
0.211
0.111*
0.25
0.12
0.228
0.128
0.124
0.191
0.106
0.106
0.237
0.17
0.328
0.241
0.185
0.2
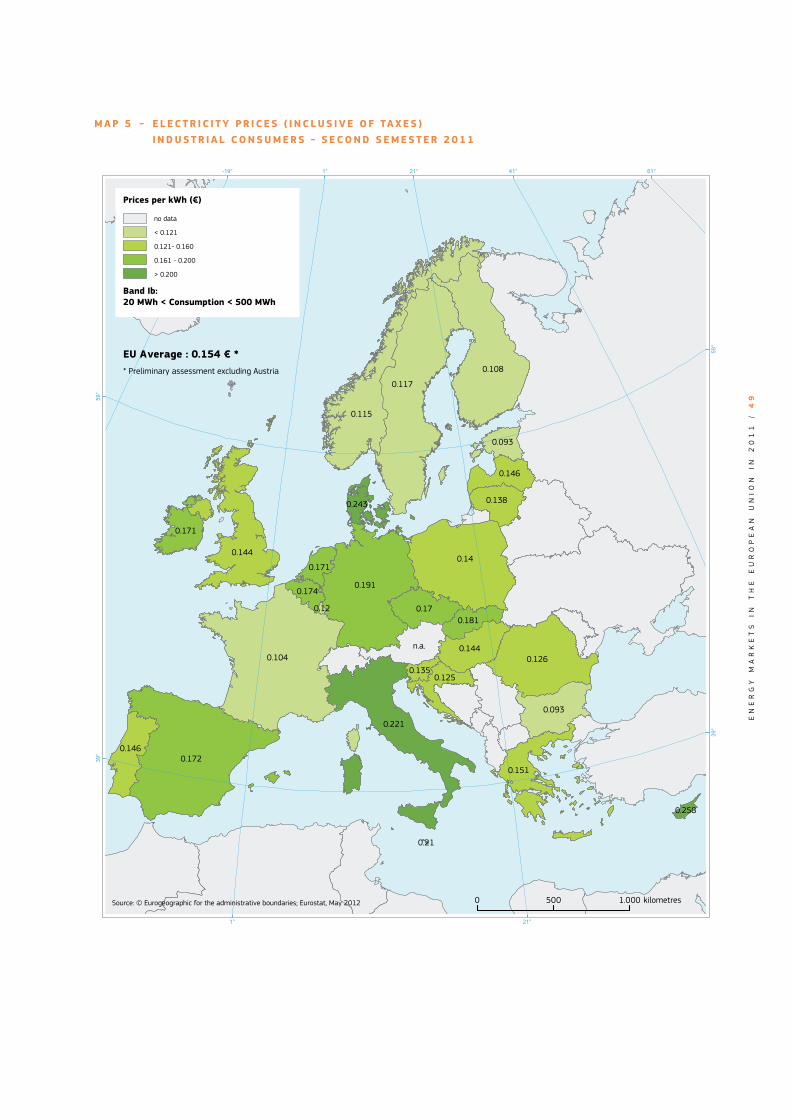
EN
ER
GY
M
AR
KE
TS
I
N
TH
E
EU
RO
PE
AN
U
NI
ON
I
N
20
11
/
4
9
M A P 5 - E L E C T R I C I T Y P R I C E S ( I N C L U S I V E O F TA X E S ) I N D U S T R I A L C O N S U M E R S - S E C O N D S E M E S T E R 2 0 1 1
61°41°
21°
21°
1°
1°-19°
59°
59°
39°
39°
Prices per kWh (€)
no data
< 0.121
0.121- 0.160
0.161 - 0.200
> 0.200
Band Ib:20 MWh < Consumption < 500 MWh
0 500 1.000 kilometres
EU Average : 0.154 € ** Preliminary assessment excluding Austria
Source: © Eurogeographic for the administrative boundaries; Eurostat, May 2012
0.104
0.172
0.117
0.191
0.108
0.126
0.14
0.115
0.221
0.144
0.093
n.a. 0.144
0.146
0.151
0.171
0.146
0.17
0.138
0.125
0.181
0.093
0.171
0.174
0.135
0.243
0.258
0.21
0.12

EN
ER
GY
M
AR
KE
TS
I
N
TH
E
EU
RO
PE
AN
U
NI
ON
I
N
20
11
/
5
0
We turn now to examine the changes in annual average prices between 2010 and 2011. Prices increased for both households and industrial customers in most of the EU Member States, in line with wholesale power prices in the majority of the European electricity markets (See Table 9). In the case of households, however, both prices fell in Luxembourg and Hungary, while decreases in industrial prices were also experienced in Hungary, the Netherlands, Romania, Slovenia, Luxembourg and Poland. In Malta, there was no change in either household or industrial customer prices.
Between 2010 and 2011, retail household electricity prices in the EU rose by an average of 6.7% i.e. slightly higher than the increase in industrial prices (6.1%). Seventeen Member States posted higher increases in household electricity prices than in industrial prices. This difference could be due to the increasing impact of levies and value-added type taxes (and/or decreasing price subsidies) in household prices, while industrial customers continue to benefit from reimbursement of VAT.
Retail electricity price data are available only half-yearly and wholesale price data in the majority of the European power trading platforms date back only a couple of years. There is therefore insufficient data to carry out a proper correlation analysis in the trend in half-year averages of wholesale and retail power prices. Nevertheless, both household and industrial net retail prices (without taxes) seem to be strongly correlated with wholesale power prices in the Nordic countries. On the other hand, there is less of a correlation apparent in the Central Western Europe region, while the correlation was mostly weaker in other countries of the EU than in these two regions. In many countries there was a time lag of half a year between changes in wholesale and retail prices26.
26. More detailed country-specific information can be found in Part
III of this publication.
The distribution of cost factors within consumer electricity prices, broken down by energy and supply costs, network costs and taxes and levies, showed considerable variation among the EU Member States, as well as between household and industrial prices. Energy and supply costs, reflecting the costs of power generation, had a stronger impact on the final price paid by industrial customers than in the case of households. As the next chart shows, there were only five Member States in 2011 where the share of energy and supply costs exceeded 50% of retail electricity prices paid by households, while in the case of industrial customers there were only four countries in which the share of energy and supply costs remained below 50%.
F I G U R E 3 2 - C H A N G E I N E L E C T R I C I T Y R E TA I L P R I C E S B E T W E E N 2 0 1 0 A N D 2 0 1 1
H O U S E H O L D S ( D c ) I N D U S T R Y ( I c )
-10
10
15
0
5
-5
20
25
RO LVEE BG UKPL FILT EL SKMTLU ESIEHU CZDE PTBE CYSL ITAT NL DKSEEU-27FR RO LVEEBG UKPL FILT ELSKMTLU ES IEHU CZ DE PTBE CYSL ITNL DK SE EU-27 FR
Source: Eurostat energy statistics
Note: Range for annual consumption of: Household group DC: [2 500 kWh – 5 000 kWh]; Industry group IC: [500 MWh – 2 000 MWh].
Industrial prices are VAT-excluded. Data for industrial prices in Austria are not available.

EN
ER
GY
M
AR
KE
TS
I
N
TH
E
EU
RO
PE
AN
U
NI
ON
I
N
20
11
/
5
1
F I G U R E 3 3 - D I S T R I B U T I O N O F C O S T FAC TO R S W I T H I N R E TA I L E L E C T R I C I T Y P R I C E S , 2 0 1 1 ( i n % )
H O U S E H O L D S I N D U S T R Y
Non-recoverable taxes and levies Energy and supply Network costs
0
70
80
50
60
40
20
30
10
90
100
RO LVEE BG UKAT PLFILT ELSK MTLU ES IECZ DE PT BE CYSL ITNLDK SE ROLVEE BGUKPL FILT ELSK MTLUES IECZDE PT BE CYSLIT NLDK SE
Source: Eurostat energy statistics
Notes: Prices for households are all taxes included. Prices for industrial consumers are VAT-excluded. Consumption bands Dc and Ic according
to Eurostat classification. Ic denotes an industrial consumer with an annual consumption in a range of 500 MWh – 2 000 MWh and Dc denotes
a household consumer with an annual consumption of 2 500 KWh – 5 000 KWh. Data for industrial prices in Austria, France and Hungary broken
down into cost factors are not available. Data for household prices in Hungary and France broken down into cost factors are not available.
Network charges were normally higher for households than for industrial customers, both in absolute amounts and in terms of their relative share in the final price. This is not surprising, given that distribution system operators apply higher charges for households, to reflect higher power transportation costs.
In eight EU Member States, industrial customers were faced with electricity prices where the tax share exceeded 10%. Industrial electricity retail prices in Italy and Germany had a tax component above 25%27. High shares of taxes and levies in industrial retail prices often reflect national energy policies that are designed to shift the power generation mixes in the direction of an energy source composition that is more climate-friendly and more sustainable, by promoting an increase in shares of renewable energy use. In the case of household consumers in the large majority of EU Member States, non-recoverable taxes and levies (including VAT) accounted for around 20% or more of consumer prices.
27. Note that industrial consumer prices are quoted without VAT
due to the fact that industrial consumers recover VAT payments.


EN
ER
GY
M
AR
KE
TS
I
N
TH
E
EU
RO
PE
AN
U
NI
ON
I
N
20
11
/
5
3 3. Country reports

EN
ER
GY
M
AR
KE
TS
I
N
TH
E
EU
RO
PE
AN
U
NI
ON
I
N
20
11
/
5
4
1. General overview
Most of the energy consumed (42%) consists of crude oil and petroleum products. Gas (28%) and nuclear energy (20%) are also significant in the energy mix, while solid fuels and renewable energy sources (RES) are less so. Renewable energy accounts for 4.2% of consumption, about half the EU-27 average. The power generation (95.1 TWh) mix in Belgium is dominated by nuclear generation (50.4%) and natural gas (34.9%), while RES and solid fuels accounted for only 8.3% and 4.4% respectively. The country’s 2020 RES target indicator for the energy sector (the share of RES in Gross Final Energy Consumption) is 13%, below the EU-27 average (20%). Between 2006 and 2010, the share of RES grew slowly, from 2.7% to 5.2%. The share of electricity from cogeneration28 reached 16% in 2010, almost doubling since 2005 (8.5%).
2. Regulatory framework
2.1. General: Following the opening of infringement proceedings in September 2011 for non-transposition, Belgium has notified full transposition of the Third Package Directives.
28. The share of electricity produced in combined heat and power
plants (CHP).
C H A R T S 1 A N D 2
Gross inland consumption (as % of total Mtoe) - 2010
Crude oil and petroleum products 41.7%
Natural gas27.6%
Other 1.3%
Renewables4.2%
Solid fuels5.2%
Total Mtoe: 61.50
Nuclear20.1%
Gross electricity generation (as % of TWh) - 2010
Crude oil and petroleum products0.4%
Natural gas34.9%
Other 1.6%
Renewables8.3%
Solid fuels4.4%
Total TWh: 95.12
Nuclear50.4%
Source: Eurostat
Key Issues
→ With regard to electricity, the high level of concentration at generation and wholesale level still gives rise to concern, as about 70% of all generation remains in the hands of the incumbent. To provide a stable framework for investment, any remaining uncertainty about the life expectancy of existing nuclear plants should be removed as a matter of urgency.
→ At retail level in both electricity and gas, competition is still relatively weak, though switching seems to have increased recently and the market share of the incumbent has decreased. Measures strengthening competition in retail markets, as recommended by the Council, are needed to activate consumers and remove obstacles to switching, such as local collective tendering initiatives, and have started to stimulate competition to the benefit of consumers. While taking into account universal service obligation and effective protection of vulnerable customers, market measures such as price freezes, which have a negative impact on competition and investment, should be rolled back as soon as possible.
→ Distribution costs in Belgium account for a large proportion of the domestic and SME consumer bill. Proper regulatory oversight needs to be put in place also at regional level to ensure that all network tariffs reflect efficient costs and are incentive-based. Regulators must be given sufficient resources to do so.
→ With regard to gas, swift implementation of the new market model introducing a virtual trading point and a genuine entry and exit system will further facilitate wholesale trading and lead to more efficient use of the Belgian transmission system at the heart of the EU.
BELGIUM

EN
ER
GY
M
AR
KE
TS
I
N
TH
E
EU
RO
PE
AN
U
NI
ON
I
N
20
11
/
5
5
B E L G I U M
2.2. National Energy Regulator: The Belgian National Regulatory Authority, Commission de Régulation de l’Électricité et du Gaz (CREG), in operation since 2000, employed 72 staff in 2011 with an annual budget of about EUR 15 million. CREG has challenged the new Belgian energy law transposing the Third Package Directives at the Belgian Constitutional Court, arguing that it does not grant CREG sufficient powers or autonomy. There are also three regional regulators (VREG for Flanders, CWAPE for the Walloon region and BRUGEL for the Brussels region). Cooperation between the four regulators is essential to ensure there is a consistent, effective regulatory framework across the country. The regional regulators need to be reinforced to exercise proper regulatory oversight over distribution network charges due to the further regionalisation of distribution tariffs competences.
2.3. Unbundling: The Transmission System Operators (TSOs) at federal level are ELIA for electricity and Fluxys for gas. In 2010, Electrabel/GdF/Suez withdrew from ELIA and Fluxys, moving towards ownership unbundling. Both companies are currently being certified.
3. Wholesale markets
3.1. Electricity: The three biggest producers together generated around 95% of the total power produced. In the case of large-scale customers connected to the federal grid (voltage higher than 70 kV), Electrabel’s share was 90.2% in 2011. At the wholesale trade level, the market share of the three biggest firms (ECS, Electrabel, SPE) was 85.9% in 2011. At generation and wholesale level, markets are highly concentrated. Integration with neighbouring markets was successfully carried out through the Trilateral Market Coupling, involving Belgium, the Netherlands and France. In 2010, Belgian and French markets (Belpex and EPEX) were coupled 87% of the time, and Belgian and Dutch markets were coupled 73% of the time. In November 2010, market coupling was extended to the entire Central West European Area. In 2011, the annual average wholesale day-ahead baseload power price was EUR 49.4/MWh, slightly higher than the average for 2010 (EUR 46.3/MWh). The ratio of traded volume of power and gross electricity consumption was 15% in 2011. The annual traded volume of day-ahead contracts on the Belpex platform was around 10-12 TWh between 2008 and 2011, representing 13.4% of national electricity consumption in 2010 (14.3% in 2011), lower than the volumes traded on the APX platform in the Netherlands.
3.2. Gas: Belgium does not produce gas. In 2010, annual gas imports amounted to 20 bcm, with pipeline imports accounting for 16.2 bcm and LNG imports for 3.3 bcm. In 2010, the main suppliers were Norway (37%), the Netherlands (30%) and Qatar (14%). Though gas is imported mainly through long-term contracts, Belgium has a physical wholesale gas trading platform at Zeebrugge. In the past, development of the hub has suffered from the lack of an entry-exit tariff system and from large amounts of transmission capacity being locked in transit contracts. This situation is likely to improve considerably with the introduction of a new market and transmission model on 1 October 2012. This has introduced an entry-exit model and a newly-established virtual trading point, the Zeebrugge Trading Point (ZTP), thus significantly improving trading opportunities for energy companies. Today, however, on a number of interconnection points, contractual congestion (capacity booked, but not used) is still a problem. The gas market in Belgium is characterised by a high degree of concentration. At wholesale level, the three largest suppliers (Distrigaz, ECS, SPE) covered 86% of the market by available gas29. In 2011, the annual average day-ahead gas price at Zeebrugge was EUR 22.5/MWh, significantly higher than in 2010 (EUR 17.2/MWh), reflecting an increase in global LNG prices after the Fukushima nuclear accident. Annual traded volume of day-ahead gas contracts in 2009 amounted to 143.4 TWh, reaching 185.5 TWh in 2010, then falling back to EUR 158.4/MWh in 2011. The average monthly churn rates have fluctuated within a range of 4-6 for most of the last three years. Even though liquidity is increasing, OTC trade accounts for most Zeebrugge transactions.
4. Retail markets
4.1. Electricity: Market concentration was high with a dominant supplier — Electrabel Customers Service (ECS). In 2011, for customers connected to the distribution and local transmission grid, ECS had a market share of 45% (Electrabel, supplying bigger customers, has a 17% share of this market). Until 2012, electricity prices had not been regulated for domestic or industrial consumers. However, in March 2012, the Belgian government introduced a temporary freeze of the indexing of the energy components of electricity and gas prices for residential customers and SMEs for nine months, starting in April 2012. The government said the freeze was intended to implement structural measures to stabilise prices and foster competitiveness. However, the measure negatively impacts on the
29. Production plus imports minus exports and changes in stocks.

EN
ER
GY
M
AR
KE
TS
I
N
TH
E
EU
RO
PE
AN
U
NI
ON
I
N
20
11
/
5
6
B E L G I U M
investment climate and disproportionately affects new entrants who are obliged to source large volumes on the wholesale market. It should be ended as soon as possible. In the case of household consumers, in 2011, energy and supply costs accounted for 48% of the net price, with network costs accounting for 52%. In the case of industrial prices, the ratio was quite different (67% vs. 33%). The significant difference between the cost structures of the two customer categories reflects the fact that network costs were almost three times higher for domestic consumers, while energy and supply costs were similar for households and industrial consumers. Regulated distribution charges, which currently include of the costs of public service obligations, should be reviewed so that they reflect costs more accurately, and they should be incentive based. Switching of suppliers is increasing steadily. In Flanders, 6.68% of customers switched in 2010, rising to 8.16% in 2011. The number of green contracts has risen notably; in Wallonia and the Brussels region, the switching rate was around 4%. For gas, the figures are similar. There are indications that switching increased rapidly in the first half of 2012 due to growing consumer awareness.
4.2. Gas: Market concentration remained very high. The dominant supplier is ECS. At federal level, the three biggest gas suppliers on the retail market covered 94% of consumption. Until 2012, gas prices had not been
regulated in Belgium, but the government decision to freeze retail prices as described above also applies to the gas market. Following the price fall in the wholesale market, retail prices decreased in 2009 and started to rise again in 2011 in line with wholesale prices. In the case of industrial prices, a similar trajectory was observed, though the impact of the decrease in wholesale prices in 2009 was stronger on retail prices. Retail prices followed changes in wholesale prices with a time lag of a couple of months. In gas, switching rates are even higher for Flanders: 7.06% in 2010 and 9.22% in 2011.
4.3. Consumers: Consumers’ assessment of the gas retail market is the lowest in the EU, with particularly low scores on trust in providers (lowest of all countries) and comparability (third lowest). In addition, consumers experience considerably more problems than their counterparts elsewhere in the EU. The electricity retail market is also assessed below the EU average (19th place out of 27)30. There are 12% more complaints in both electricity and gas markets than in the EU on average. Regulators provide an online price comparability tool for electricity and gas, and this is generally considered as effective. The Flemish regional energy regulator reported that in the first half of 2012, 1.3 million people took the comparability tool test. Since 2010, consumers can seek information and make complaints regarding electricity
30. 8th Consumer Markets Scoreboard, 2012, European Commission,
DG SANCO, http://ec.europa.eu/consumers/consumer_research/
editions/cms8_en.htm
C H A R T S 3 A N D 4
Electricity - Retail prices in Belgium (in €/kWh)
H O U S E H O L D S I N D U S T R Y
VAT Other taxes Net price
2004 2005 2006 2007 2008 2009 2010 2011 2004 2005 2006 2007 2008 2009 2010 20110.00
0.02
0.04
0.06
0.08
0.10
0.12
0.14
0.16
0.18
0.20
0.22
Source: Eurostat
Natural gas - Retail prices in Belgium (in euro cent/kWh)
VAT Other taxes Net price
H O U S E H O L D S I N D U S T R Y
2004 2005 2006 2007 2008 2009 2010 2011 2004 2005 2006 2007 2008 2009 2010 20110
1
2
3
4
6
5
8
7

EN
ER
GY
M
AR
KE
TS
I
N
TH
E
EU
RO
PE
AN
U
NI
ON
I
N
20
11
/
5
7
B E L G I U M
and gas at a single point of contact, managed by the Federal Mediator and Ombudsman (Service de Médiation Fédéral de l’Energie). Alternative Dispute Resolution (ADR) procedures can be initiated by the Federal Mediator and Ombudsman or by the regional mediator in Wallonia or the ‘chambre des litiges’ in Brussels and Flanders. Vulnerable consumers and low-income consumers can benefit from social tariffs. A cost benefit analysis for the roll-out of smart meters has been conducted. However, there is no legal framework in place to roll these out and all three regions (Wallonia, Flanders and Brussels Region) privilege a voluntary roll out of smart meters rather than a mandatory one.
5. Infrastructure
5.1. Electricity: In terms of investment in generation capacity, a number of expansion and reinforcement projects are ongoing. By 2011, a total of 946 MW were under construction, 3 455 MW were authorised and 2 502 MW were planned. The development of off-shore wind parks requires further grid development. Further efforts are needed to enhance interconnection capacity and to integrate the physical electricity grid with neighbouring markets. However, in the summer of 2012, the testing of the flow-based market coupling mechanism was postponed.
5.2. Gas: The country’s only storage facility, in Loenhout, was expanded in 2010. The increase in entry capacity at the Eynatten and Gravenvoeren interconnection points helps to alleviate the congestion that has occurred for years at these points. In addition, the east-west axis of the Fluxys network was reinforced and the Zelzate interconnection point at the Dutch border is now bi-directional.
B E LG I U M – K E Y I N D I C ATO R S O F T H E E L E C T R I C I T Y A N D N AT U R A L G A S M A R K E T S
E L E C T R I C I T Y G A S
Number of companies representing at least 95% of net power generation 4 Number of entities bringing natural gas into country 4
Number of main power-generation companies (1) 3 Number of main gas entities (4) 3
Market share of the largest power-generation company 79.1% Market share of the largest entity bringing natural gas 70.0%
Number of electricity retailers 37 Number of retailers selling natural gas to final customers 41
Number of main electricity retailers (2) 3 Number of main natural gas retailers (5) 5
Switching rates (entire electricity retail market) 10.0% Switching rates for gas (entire retail market) 11.2%
Regulated prices for households – electricity NO Regulated prices for households – gas NO
Regulated prices for non-households – electricity NO Regulated prices for non-households – gas NO
HHI in power-generation market (3) 5 380 HHI in gas supply market (3) 4 000
HHI in electricity retail market (3) 3 000 HHI in gas retail market (3) 3 900
Electricity market value (bn €) (6) 10.634 Gas market value (bn €) (6) 11.737
Sources: Eurostat, CEER, National Regulatory Authority, EC calculations.
(1) Companies are considered as ‘main’ if they produce at least 5% of the national net electricity generation.
(2) Retailers are considered as ‘main’ if they sell at least 5% of the total national electricity consumption.
(3) The HHI (Herfindahl-Hirschman Index) is a commonly accepted measure of market concentration. It is calculated by squaring the market share
of each firm competing in the market and then summing the resulting numbers (the higher the index, the more concentrated the market).
Moderate concentration: 750-1 800; high concentration: 1 800-5 000; very high concentration: above 5 000.
(4) Entities are considered as ‘main’ if they deal with at least 5% of the natural gas (indigenous production or import).
(5) Retailers are considered as ‘main’ if they sell at least 5% of the total natural gas consumed by final customers.
(6) Market value is an estimation of the size of the retail electricity and gas markets. It is calculated using data on electricity and gas consumption
in the household and non-household sectors and annual average retail prices.

EN
ER
GY
M
AR
KE
TS
I
N
TH
E
EU
RO
PE
AN
U
NI
ON
I
N
20
11
/
5
8
1. General overview
Solid fuels, with lignite and brown coal making up more than 90%, represented almost 39% of gross inland energy consumption, followed by petroleum products (22.6%). Solid fuels were also dominant in electricity generation, accounting for 48.5% in Bulgaria’s power mix. Nuclear accounted for 32.7% of the country’s electricity production of almost 47 TWh in 2010. The third most important power source was renewables (RES), with a share of 13.8%. Bulgaria’s 2020 RES target is 16%. From 2006 to 2010, its RES indicator increased from 9.3% to 13.8%. The share of cogeneration31 was 8% in 2010, being slightly higher than in 2005 (6%).
2. Regulatory framework
2.1. General: Following the opening of infringement proceedings in September 2011 for non-transposition, Bulgaria has notified only partial transposition of the Third Energy Package Directives. Moreover, one other infringement procedure is still open on the Second Energy Package concerning the lack of transparency in conditions for third-party access to natural gas transmission networks and the lack of an adequate
31. The share of electricity produced in combined heat and power
plants (CHP).
Key Issues
→ With regard to electricity, the public provider system, which entrenches market domination by NEK, should be eliminated in favour of a market-based approach where generators and suppliers are free to choose their contracting parties. While taking into account universal service obligation and effective protection of vulnerable customers, Bulgaria needs to gradually phase out regulated prices for household customers and small and medium-sized businesses (SMEs) and eliminate all transaction-related transmission charges that distort the free flow of electricity across borders. It needs to continue working on setting up a power exchange in order to facilitate organised trading in electricity and increase integration with neighbouring countries, as recommended by the Council. It should ensure the independence of transmission and distribution system operators and organise a properly functioning balancing market. Bulgaria needs to safeguard the independence of the National Regulatory Authority.
→ With regard to gas, Bulgaria should set up an organised wholesale market in order to allow competitors of Bulgargaz to enter the market. Full third-party access to gas pipelines should be implemented, including virtual reverse-flows on all pipelines. The national pipeline system should be fully connected with the ‘transit’ system and supply sources diversified in view of high dependence on imports from Russia. While ensuring adequate protection of vulnerable customers, regulated prices must be gradually phased out. Regulatory obstacles to supplier switching (such as additional costs) must be removed, and switching must be proactively supported through transparency measures. Bulgaria should continue developing demand-side measures (e.g. interruptible contracts) to manage demand especially in the event of supply disruptions. Expanding underground storage capacity and interconnection capacity would help to reduce exposure to external events, as also recommended by the Council.
BULGARIA
C H A R T S 1 A N D 2
Gross inland consumption (as % of total Mtoe) - 2010
Petroleum products 22.6%
Gases12.6%
Other 7.6%
Renewables8.0%
Solid fuels38.6%
Total Mtoe: 17.83
Nuclear10.6%
Gross electricity generation (as % of TWh) - 2010
Petroleum products
0.8%Gases4.2%
Other 0.0%
Renewables13.8%
Solid fuels48.5%
Total TWh: 46.65
Nuclear32.7%
Source: Eurostat

EN
ER
GY
M
AR
KE
TS
I
N
TH
E
EU
RO
PE
AN
U
NI
ON
I
N
20
11
/
5
9
B U L G A R I A
system of penalties in the event of breaches of the Gas Regulation32.
2.2. National Energy Regulator: The Bulgarian National Regulatory Authority, the State Energy and Water Regulatory Commission (SEWRC), in operation since 1999, employed 128 staff in 2011 with an annual budget of BGN 3.6 million [EUR 1.87 million]. SEWRC has 4 territorial divisions. Its budget is insufficient to cover oversight of all the sectors it is responsible for and there are concerns about the stability of its management. The government has intervened in regulatory and management matters.
2.3. Unbundling: Both TSOs for electricity and gas are legally unbundled. While the electricity TSO, ‘Electricity System Operator EAD’ (ESO), is a subsidiary of the electricity supply incumbent ‘Natsionalna Elektricheska Kompania’ EAD (NEK), the gas TSO, ‘Bulgartransgaz’ EAD, no longer has any direct corporate links with the gas supplier incumbent ‘Bulgargaz’ EAD. All these companies are fully owned subsidiaries of ‘Bulgarian Energy Holding’ EAD, which in turn is fully state-owned. The TSOs have not yet been certified. Bulgaria plans to implement the Independent Transmission System Operator (ITO) model for both TSOs. The electricity distribution network is privatised and owned by CEZ, EVN and Energo Pro. The distribution and supply businesses are legally unbundled. There are 29 gas distribution companies. They are not legally unbundled because they each have fewer than 100 000 customers.
3. Wholesale markets
3.1. Electricity: The most important market player on the Bulgarian electricity market is the state-owned, vertically integrated group, BEH. It owns the Kozloduy nuclear power plant and a major lignite-fired power plant, Maritza East II, along with the main hydro producer and wholesaler NEK. Altogether, the BEH group produces around 60% of total electricity output in Bulgaria. At production level, besides the BEH group, there are six other producers in Bulgaria, operating medium to large thermal power plants. These producers generate approximately 27.5% of electricity output (according to the data available for 2011).
32. The matter was referred to the Court of Justice by the College of
Commissioners in November 2011 (see IP/11/1437). In concrete
terms, the Commission considers that Bulgaria does not offer
interruptible backhaul capacity at all interconnection points. The
inclusion of backhaul capacity is essential to use the network
to its maximum capacity. Moreover, interruptible capacity and
short-term services are vital for newcomers to enter the market.
Regulated and free markets coexist at wholesale level, where NEK plays a central role on both. On the regulated market, NEK purchases electricity under quota obligation at regulated prices from independent producers and partly from own generation mix, and sells it at regulated prices to four distributors supplying households and SMEs. NEK also purchases electricity from combined heat and power generators (CHP) and from renewable energy sources (RES) at feed-in tariffs established by SEWRC. Separately, NEK purchases electricity at non-regulated prices on the free wholesale electricity market from thermo power producers under long-term contracts.
NEK owns the transmission network (high- and medium-level voltage network) and supplies large industrial customers as a supplier of last resort. NEK’s subsidiary ESO operates the network and organises the balancing market, where NEK also plays a key role.
There is no power exchange and no organised day-ahead market in electricity. Since 2010, rules for trading in electricity (including day-ahead trading) have been tested. Testing was also started in 2012 for launching a power exchange. A quota system paralyses the functioning of the wholesale market, as generators are obliged to sell their output to NEK at regulated prices and cannot freely contract with suppliers. In addition, Bulgaria has a system of transaction-based transmission charges, including a number of network surcharges, which act as a barrier to exports and hinder the free flow of electricity across borders. The level of market integration is low: coordinated bilateral capacity allocations at borders are not offered for all timeframes from Bulgaria to Romania and Greece.
3.2. Gas: Bulgaria is totally dependent on imports from Russia, mostly based on long-term contracts with intermediary companies, to satisfy its domestic gas demand. Gas imports amounted to 2.6 bcm in 2011. There is no functioning wholesale market. Bulgargaz EAD is the only importer, conducting wholesale trade at regulated prices. It had a market share of 84.16% in 2011; the remaining 15.84% was from domestic extraction. Melrose Resources Sarl and OGEP AD are the companies engaged in domestic extraction. They also supply gas to final customers.
4. Retail markets
4.1. Electricity: The three biggest utilities controlled 76% of the market in 2010, resulting in a high market concentration. There has been no switching in past years, with no market opening at end-consumer level. Electricity prices for households and SMEs are still

EN
ER
GY
M
AR
KE
TS
I
N
TH
E
EU
RO
PE
AN
U
NI
ON
I
N
20
11
/
6
0
B U L G A R I A
regulated33. In 2011 energy and supply costs accounted for 58% of the household electricity prices (without taxes), while the share of network costs was 42%. For industrial consumers, the share of energy and supply costs was one of the highest in the EU (78%), while network costs only accounted for only 22% of the net industrial prices. Network costs were among the lowest in the EU.
4.2. Gas: Bulgargaz is the sole importer and main retail gas supplier on the market for large industrial customers. The three largest suppliers control about 72% of the country’s retail gas market, resulting in a high concentration. Retail prices (both household and industrial) are still regulated. There is no switching. This is in part because consumers who switch away from their licensed regional supplier have to pay an additional transmission price for each 1 000 cubic metres of transmitted gas to the gas distribution company whose territory it crosses. Even though gas retail prices in Bulgaria are amongst the lowest in Europe, they have risen substantially over recent years.
33. According to SEWRC, regulated prices have applied since July
2012 to household consumers and enterprises with less than
50 employees, and an annual turnover below BGN 19.5 million,
which have not selected another supplier or have left the
electricity market.
4.3. Consumers: The retail electricity and gas markets are assessed the lowest and second lowest in the EU, respectively. In both markets, the scores for trust and overall satisfaction are within the two lowest ratings in the EU. Bulgaria has the highest number of problems with both gas and electricity — in the latter market, more than twice above the EU average34. Although there is no price comparison tool, SEWRC requires suppliers to provide information on prices to consumers. Electricity and gas distribution companies provide consumers with online price calculators. Consumers have to file complaints in two steps: first, a complaint has to be addressed to the energy company, and, then, if the reply is not satisfactory, forwarded to SEWRC. SEWRC contributes to the voluntary settlement of disputes by providing a conciliation commission for the out-of-court settlement of consumer disputes. There is no official plan for the roll-out of smart meters and no official cost-benefit analysis has been submitted to the Commission.
34. 8th Consumer Markets Scoreboard, 2012, European Commission,
DG SANCO, http://ec.europa.eu/consumers/consumer_research/
editions/cms8_en.htm
C H A R T S 3 A N D 4
Electricity - Retail prices in Bulgaria (in €/kWh)
H O U S E H O L D S I N D U S T R Y
VAT Other taxes Net price
2004 2005 2006 2007 2008 2009 2010 2011 2004 2005 2006 2007 2008 2009 2010 20110.00
0.02
0.04
0.06
0.08
0.10
Source: Eurostat
Natural gas - Retail prices in Bulgaria (in euro cent/kWh)
H O U S E H O L D S I N D U S T R Y
VAT Other taxes Net price
2005 2006 2007 2008 2009 2010 2011 2005 2006 2007 2008 2009 2010 20110
1
2
3
4
5
6

EN
ER
GY
M
AR
KE
TS
I
N
TH
E
EU
RO
PE
AN
U
NI
ON
I
N
20
11
/
6
1
B U L G A R I A
5. Infrastructure
5.1. Electricity: At transmission system level, Bulgaria does not face significant congestion. However, some investments are planned to develop RES in certain regions of the country, mainly wind power in north-east Bulgaria and solar power in the south of Bulgaria. Bulgaria will also require more cross-border transmission infrastructure to strengthen the country’s interconnection with Central/Western Europe and possibly to export RES.
5.2. Gas: All gas imports come from Russia through a single route, the Ukrainian-Western Balkan pipeline. This, in addition to the very limited availability of storage capacity, makes Bulgaria particularly vulnerable from a security of supply standpoint. At the same time, Bulgaria is an important transit country for the supply of Russian gas to the Balkan region, Greece, Turkey and the Former Yugoslav Republic of Macedonia. In an attempt to address its poor security of supply situation and to diversify supply, some investments have been
made. A project has been launched for better connecting and expanding the capacity and withdrawal rate of the Chiren gas storage facility and steps have been taken to connect Bulgaria’s gas transmission systems with Romania, Serbia and Greece. However, reverse-flow capacity at the borders with Romania and Greece is still quite limited. Further expansion of underground storage capacity would help to reduce the exposure to external events. Supply disruptions could also be tackled by the use of demand-side measures such as interruptible contracts. For improving and developing gas distribution networks , an amount of BGN 68.808 million (EUR 35.07 million) was invested in 2010. Over 400 000 km of distribution pipelines were constructed.
B U LG A R I A – K E Y I N D I C ATO R S O F T H E E L E C T R I C I T Y A N D N AT U R A L G A S M A R K E T S
E L E C T R I C I T Y G A S
Number of companies representing at least 95% of net power generation 22 Number of entities bringing natural gas into country 3
Number of main power-generation companies (1) 5 Number of main gas entities (4) 1
Market share of the largest power-generation company N/A Market share of the largest entity bringing natural gas 97.1%
Number of electricity retailers 36 Number of retailers selling natural gas to final customers 18
Number of main electricity retailers (2) 5 Number of main natural gas retailers (5) 2
Switching rates (entire electricity retail market) N/A Switching rates for gas (entire retail market) 0.0%
Regulated prices for households – electricity YES Regulated prices for households – gas YES
Regulated prices for non-households – electricity YES Regulated prices for non-households – gas YES
HHI in power-generation market (3) N/A HHI in gas supply market (3) N/A
HHI in electricity retail market (3) 2 247 HHI in gas retail market (3) 2 718
Electricity market value (bn €) (6) N/A Gas market value (bn €) (6) 1.087
Sources: Eurostat, CEER, National Regulatory Authority, EC calculations.
(1) Companies are considered as ‘main’ if they produce at least 5% of the national net electricity generation.
(2) Retailers are considered as ‘main’ if they sell at least 5% of the total national electricity consumption.
(3) The HHI (Herfindahl-Hirschman Index) is a commonly accepted measure of market concentration. It is calculated by squaring the market share
of each firm competing in the market and then summing the resulting numbers (the higher the index, the more concentrated the market).
Moderate concentration: 750-1 800; high concentration: 1 800-5 000; very high concentration: above 5 000.
(4) Entities are considered as ‘main’ if they deal with at least 5% of the natural gas (indigenous production or import).
(5) Retailers are considered as ‘main’ if they sell at least 5% of the total natural gas consumed by final customers.
(6) Market value is an estimation of the size of the retail electricity and gas markets. It is calculated using data on electricity and gas consumption
in the household and non-household sectors and annual average retail prices.

EN
ER
GY
M
AR
KE
TS
I
N
TH
E
EU
RO
PE
AN
U
NI
ON
I
N
20
11
/
6
2
1. General overview
Solid fuels made up most of the energy and electricity mix in 2010. Together with nuclear power plants, they accounted for almost 90% of gross electricity consumption. Hydro power contributed more than 50% of renewable electricity, followed by biomass. As far as the 2020 target for RES is concerned, the Czech target is 13%35. This indicator improved from 6.4% in 2006 to 9.2% in 2010. The share of cogeneration36 was 14.2% in 2010, showing a decrease compared to the share in 2005 (16.8%).
2. Regulatory framework
2.1. General: As the Czech Republic had notified full transposition of the Third Package Directives by the end of September 2011, no infringement proceedings for non-transposition have been opened.
2.2. National Energy Regulator: The Czech National Authority, Energetický regulační úřad (ERO), in operation since 2001, employed 102 staff in 2010 with an annual budget of almost CZK 112 023 million (about EUR 4.43 million). Over the years, the regulator has acquired considerable independence from government and industry and is generally seen as a credible independent actor in the energy market. Its budget is not linked to any ministry and is decided by Parliament.
35. This is the share of renewables in Gross Final Energy Consumption.
36. The share of electricity produced in combined heat and power
plants (CHP).
C H A R T S 1 A N D 2
Gross inland consumption (as % of total Mtoe) - 2010
Crude oiland petroleum
products20.4%
Natural gas17.5%
Other 0.0%
Renewables6.1%
Solid fuels40.3%
Total Mtoe: 44.77
Nuclear15.8%
Gross electricity generation (as % of TWh) - 2010
Natural gas4.8%
Other 0.0%
Renewables7.6%
Solid fuels55.0%
Total TWh: 85.91
Nuclear32.7%
Source: Eurostat
Key Issues
→ With regard to electricity, the possibilities of market coupling with more neighbouring states should be further explored. The Czech Republic should increase the capacity at certain local points of its distribution system to balance RES at local level (solar) and put in place regionally coordinated procedures for the calculation and allocation of cross-border capacity in cooperation with other NRAs from the CEE region. The Czech Republic has the highest overall level of interconnection capacity within the CEE region but its transmission capacity is reduced because of loop flows originating mostly from Germany and flowing via Poland to the Czech Republic. Therefore the Czech Republic needs to continue engaging with its neighbours in order to identify appropriate short and long term solutions to this problem.
→ With regard to gas, the progress made in 2010 and 2011 is noted, inter alia by the introduction of a virtual trading point with a view to improve liquidity and enhance competition on the Czech wholesale market. The Czech Republic should continue diversifying its portfolio of gas sources. Bi-directional reverse-flow capacities were introduced in 2011 on some main pipelines and should also be introduced on other existing and newly planned pipelines. For gas infrastructure, permitting procedures need to be streamlined.
CZECH REPUBLIC

EN
ER
GY
M
AR
KE
TS
I
N
TH
E
EU
RO
PE
AN
U
NI
ON
I
N
20
11
/
6
3
C Z E C H R E P U B L I C
2.3. Unbundling: CEPS is the country’s electricity transmission operator, majority-owned by the state. The model chosen is ownership unbundling. The NRA notified its draft decision to the Commission in August and the Commission issued its opinion in October. With regard to gas, the transmission system operator NET4GAS (formerly RWE Transgas Net) will be operating as an ITO, due to be certified in autumn 2012. As far as distribution is concerned, there are six regional gas distribution companies serving more than 90 000 customers. Four are members of the RWE group and functionally unbundled. There are also 71 ‘local distribution companies’ each serving fewer than 90 000 customers. For electricity, distribution is split between CEZ, E.ON and Prazska energetika, with a further 200-300 small local DSOs. CEZ, E.ON and Prazska energetika are also active in distribution and supply.
3. Wholesale markets
3.1. Electricity: At generation level the market is highly concentrated. The incumbent and state-owned CEZ continues to be the dominant electricity producer, with a market share of 75% in 2010. No other company had a market share exceeding 5%. Electricity is traded at Power Exchange Central Europe a.s. (PXE) under bilateral contracts and on spot markets organised by the market operator OTE. Market integration through market coupling with Slovakia started in 2009 and volumes of traded electricity have been increasing. The market coupling of the Czech, Slovak and Hungarian day-ahead markets started on 11 September 2012. There are plans to extend the market coupling project to other CEE countries. Uniform auction rules are in place with the other countries of the CEE region for the allocation of cross-border transmission capacities (coordinated explicit auctions based on the NTC method), while the possibility of introducing flow-based allocation (FBA) in the CEE region is being explored along with market coupling. The average Czech day-ahead wholesale price in 2011 was EUR 50.6/MWh for baseload power (an increase of 15.8% compared to 2010)37. With regard to liquidity, 8.4 TWh were traded on the spot day-ahead market (13% of national power consumption).
37. For a comparison with wholesale prices in neighbouring countries,
please refer to Table 9 of this Staff Working Document, part II.
3.2. Gas: In 2010, the Czech Republic imported 99% of its domestic consumption. Total imports amounted to 8.5 bcm, with 64.1% from Russia, 23.5% from other EU-countries and 11.4% from Norway.
RWE Transgas remains the largest player on the wholesale market, as it holds all the large import contracts with Russia and RWE Gas Storage ltd. owns six of the eight gas storage facilities in the Czech Republic. However, new suppliers are gaining access to the market with import contracts from Germany and Norway. There is a Virtual Trade Point as a hub only since 2011, so that no reference wholesale price can be given. The estimates of long-term prices for Russian gas indicate an annual average of EUR 29.3/MWh for 2011 (an increase of 24.3% compared to 2010).
4. Retail markets
4.1. Electricity: Market concentration is very high, as the market share of the three largest suppliers (CEZ, E.ON and PRE) is 95%. Supplier switching increased in absolute terms, i.e. almost four times more households switched their supplier in 2010. The switching rate, by number of meter points, was 3.3%. Power prices for households and industry have been increasing, mainly due to the net energy price. Of the taxes paid, VAT accounts for the largest share. In 2011, the share of network costs accounted for 62% of the electricity price for households (without taxes), while energy and supply costs took up the remaining 38%. For industrial consumers, the shares were 34% and 66%, respectively. End-user prices are not regulated, but the correlation analysis does not show any significant correlation between wholesale and retail prices.
4.2. Gas: Market concentration is high with the two largest companies (RWE and PP) holding a combined market share of almost 62.3% in 2011. Switching rates were the highest in the EU in 2012, more than quadrupling between 2010 and 201238. The structure and the movement of retail gas prices were quite similar to those of electricity prices. Nevertheless, prices declined for industrial customers in 2009, showing some adaptability of the sector to general market trends. The share of taxes was low, with VAT dominating the tax structure. End-user prices are not regulated.
38. European Consumer Markets Monitoring Surveys,
http://ec.europa.eu/consumers/strategy/cons_satisfaction_
en.htm

EN
ER
GY
M
AR
KE
TS
I
N
TH
E
EU
RO
PE
AN
U
NI
ON
I
N
20
11
/
6
4
C Z E C H R E P U B L I C
4.3. Consumers: Retail gas market is assessed below EU average (17th position out of 23). However, switching rates are the highest in the EU and have more than quadrupled between 2010 and 2012 while the ease of switching receives the fourth highest score in the EU. Consumer assessment of the electricity retail market is slightly below the EU average (15th place out of 27)39.
ERO provides a price comparison tool for electricity on its website. As far as gas consumers are concerned, a legal definition of ‘vulnerable customers’ is in place since 1 November 2012. Customers can complain to relevant institutions on the basis of the general prohibition of unfair commercial practices. As to the roll-out of smart metering, a cost-benefit analysis in 2012 turned out negative and no legal obligation is in place. However, pilot projects are under way to gather further information for a possible roll-out.
5. Infrastructure
5.1. Electricity: The Czech Republic is a net exporter of electricity. As a result of investment in the development of photovoltaic plants, the total installed capacity of photovoltaic plants has strongly increased. This is the result of a generous feed-in tariff. Installed capacity is able to satisfy peak demand. The Czech Republic has the highest overall level of interconnection capacity within the CEE region. However, transmission capacity
39. 8th Consumer Markets Scoreboard, 2012, European Commission,
DG SANCO, http://ec.europa.eu/consumers/consumer_research/
editions/cms8_en.htm
is reduced because of loop flows originating mostly from Germany and flowing via Poland to the Czech Republic. The expansion of wind generation in northern Europe will place further constraints on the internal transmission grid.
5.2. Gas: The Czech Republic is an important transit country for Russian gas to Western Europe. Most of this gas enters from Slovakia at the Lanzhot interconnection point and leaves the country on the German border at Waidhaus and Hora Svate Kateriny. The Czech Republic has recently built the first interconnector to Poland with a capacity of 0.5 bcm/year. The new 30 bcm GAZELLE Pipeline will, as of the end of 2012, connect the Czech grid with the new northern route for Russian gas flowing into Europe via Nordstream and OPAL. Other investment projects focus on increasing flexibility, through underground gas storage and reverse flow capabilities. The EEPR programme is co-financing gas storage extension in UGS Tranovice and UGS Tvrdonice. The high number of permits needed for construction is delaying implementation of the project.
C H A R T S 3 A N D 4
Electricity - Retail prices in Czech Republic (in €/kWh)
H O U S E H O L D S I N D U S T R Y
VAT Other taxes Net price
2004 2005 2006 2007 2008 2009 2010 2011 2004 2005 2006 2007 2008 2009 2010 20110.00
0.02
0.04
0.06
0.08
0.10
0.12
0.14
0.16
Source: Eurostat
Natural gas - Retail prices in Czech Republic (in euro cent/kWh)
H O U S E H O L D S I N D U S T R Y
VAT Other taxes Net price
2005 2006 2007 2008 2009 2010 2011 2005 2006 2007 2008 2009 2010 20110
1
2
3
4
6
5

EN
ER
GY
M
AR
KE
TS
I
N
TH
E
EU
RO
PE
AN
U
NI
ON
I
N
20
11
/
6
5
C Z E C H R E P U B L I C
C Z E C H R E P U B L I C – K E Y I N D I C ATO R S O F T H E E L E C T R I C I T Y A N D N AT U R A L G A S M A R K E T S
E L E C T R I C I T Y G A S
Number of companies representing at least 95% of net power generation 24 Number of entities bringing natural gas into country 24
Number of main power-generation companies (1) 1 Number of main gas entities (4) 3
Market share of the largest power-generation company 73.0% Market share of the largest entity bringing natural gas 72.6%
Number of electricity retailers 324 Number of retailers selling natural gas to final customers 28
Number of main electricity retailers (2) 3 Number of main natural gas retailers (5) 2
Switching rates (entire electricity retail market) 3.3% Switching rates for gas (entire retail market) 3.0%
Regulated prices for households – electricity NO Regulated prices for households – gas NO
Regulated prices for non-households – electricity NO Regulated prices for non-households – gas NO
HHI in power-generation market (3) > 5 000 HHI in gas supply market (3) 5 370
HHI in electricity retail market (3) appr. 4 000 HHI in gas retail market (3) appr. 4 000
Electricity market value (bn €) (6) 6.810 Gas market value (bn €) (6) 4.680
Sources: Eurostat, CEER, National Regulatory Authority, EC calculations.
(1) Companies are considered as ‘main’ if they produce at least 5% of the national net electricity generation.
(2) Retailers are considered as ‘main’ if they sell at least 5% of the total national electricity consumption.
(3) The HHI (Herfindahl-Hirschman Index) is a commonly accepted measure of market concentration. It is calculated by squaring the market share
of each firm competing in the market and then summing the resulting numbers (the higher the index, the more concentrated the market).
Moderate concentration: 750-1 800; high concentration: 1 800-5 000; very high concentration: above 5 000.
(4) Entities are considered as ‘main’ if they deal with at least 5% of the natural gas (indigenous production or import).
(5) Retailers are considered as ‘main’ if they sell at least 5% of the total natural gas consumed by final customers.
(6) Market value is an estimation of the size of the retail electricity and gas markets. It is calculated using data on electricity and gas consumption
in the household and non-household sectors and annual average retail prices.

EN
ER
GY
M
AR
KE
TS
I
N
TH
E
EU
RO
PE
AN
U
NI
ON
I
N
20
11
/
6
6
1. General overview
Denmark has a high share of crude oil and petroleum products in its energy mix. This can partly be explained by the fact that Denmark is an important oil producer. In 2010, renewables made up the second largest share of its energy mix, with wind energy as the most important source, representing two thirds of all renewable electricity. Denmark’s target for 2020 is 30% of renewables,40 which is higher than the EU-27 average (20%). Between 2006 and 2010 the country’s RES indicator increased from 16.5% to 22.2%. The share of cogeneration41 in electricity production was 49.2% in 2010, being the highest in the EU which reflects Denmark’s long-standing commitment to energy efficiency.
2. Regulatory framework
2.1. General: Following the opening of infringement proceedings in September and November 2011 for non-transposition, Denmark has notified full transposition of the Third Energy Package Directives.
2.2. National Energy Regulator: The Danish regulator is the Danish Energy Regulatory Authority, DERA; it has been operating since 2000, employs some 50 staff and has an annual budget of around EUR 5 million.
2.3. Unbundling: Denmark has a state-owned TSO, Energinet.dk, which owns and operates the transmission networks for both electricity and gas. The model chosen is ownership unbundling and the certification procedure for Energinet.dk has been completed. For electricity, there are another twelve (or 10) regional network operators, which are fully or partly vertically integrated with other companies engaged in competitive activities, such as trading, production and generation. With effect from 1 January 2012, the 10 regional transmission
40. This is the share of renewables in Gross Final Energy Consumption.
41. The share of electricity produced in combined heat and power
plants (CHP).
companies were bought by the Danish TSO, Energinet.dk. Hence, complete ownership unbundling of regional transmission companies and DSOs has been achieved.
There are 77 electricity DSOs and three gas DSOs, most of which are fully or partly vertically integrated.
C H A R T S 1 A N D 2
Gross inland consumption (as % of total Mtoe) - 2010
Crude oil and petroleum products 36.2%
Natural gas23.3%
Renewables20.5%
Solid fuels20.0%
Total Mtoe: 19.32
Gross electricity generation (as % of TWh) - 2010
Crude oil and petroleum
products 2.4%
Other2%
Renewables40.4%
Solid fuels55.0%
Total TWh: 38.79
Source: Eurostat
Key Issues
→ Challenges of electricity supply imbalances stemming from future energy scenarios (renewables objectives, energy mix) have to be assessed and appropriate solutions and measures prepared and implemented.
→ Efforts to ensure adequate gas capacity at the DE/DK border must be continued so as to improve market integration and allow for a proper level of secure gas supply to Denmark (and Sweden).
→ With regard to electricity and gas, the system of price regulation for consumers who do not actively choose a supplier to enter the market needs to be abandoned in order to create proper competition among suppliers. This should be done taking into account universal service obligation and effective protection of vulnerable customers.
DENMARK

EN
ER
GY
M
AR
KE
TS
I
N
TH
E
EU
RO
PE
AN
U
NI
ON
I
N
20
11
/
6
7
D E N M A R K
3. Wholesale markets
3.1. Electricity: In 2010, at the generation level, the market was dominated by two big players, Dong Energy and Vattenfall, who together accounted for almost two thirds of the total capacity. The remaining third was provided by a large number of smaller companies, including cooperatives and municipal companies. Market integration with neighbouring markets is adequate. In the Nordic countries, roughly 75% of energy is traded on the power exchange, Nord Pool Spot (NPS). Volume coupling is used by the EMCC on the borders with Germany. In November 2010 this coupling was extended to the Central Western Europe region, and about 60% of Europe’s electricity is connected via this new coupling. Danish electricity is traded on the Nord Pool power exchange. The country is divided into two market areas, east and west. The average wholesale price in 2011 for baseload power was EUR 49.4/MWh for the east (a decrease of 13.5% compared to 2010) and EUR 48.0/MWh for the west (an increase of 3.3%)42. The price is often lower in the west than in the east due to its high level of wind generation with low marginal costs. In terms of liquidity, volumes traded on Nord Pool are the highest of all European power exchanges. Danish volumes reached 28 TWh (11 TWh for the east and 17 TWh for the west), representing 81% of the national electricity consumption.
3.2. Gas: Denmark is a net exporter of natural gas. In 2010 it exported approximately 3.2 bcm of gas: 46% to Sweden, 32% to Germany and the rest to the Netherlands. Physical imports of gas into Denmark were not possible until October 2010. However, physical imports from Germany were made possible by a pressure service agreement with the owners of the DEUDAN pipeline, and approximately 0.15 bcm of gas were imported in 2010 (3% of consumption). In Denmark there are two natural gas hubs, the Gas Transfer Facility (GTF) and the Nord Pool Gas Facility (NPTF)43. The average day-ahead wholesale price on the Nord Pool Gas exchange (NPG) was EUR 23.3/MWh in 2011 (an increase of 26.6% compared to 2010), and around 7% of the gross inland consumption was traded on the day-ahead market. In 2010, DERA conducted a survey that showed that around 90% of the total volume traded on the wholesale market in 2009 and 2010 was done under long-term take-or-pay contracts, while only 9% and 1% of the volume was done under OTC contracts and exchange contracts respectively. However, more recent figures show an increase in hub-based
42. For a comparison with wholesale prices in neighbouring countries,
please refer to Table 9 of this Staff Working Document, part II.
43. The GTF serves as a delivery point for the OTC market, whereas
the NPTF is a delivery point for the Danish gas exchange, Nord
Pool Gas (NPG).
pricing. Furthermore, the market share of the Nord Pool Gas exchange has been growing rapidly, and the volumes traded on the gas exchange in 2012 account for about 15% of the total consumption on the Danish gas market.
4. Retail markets
Danish consumers of electricity and gas have access to the free market without price regulation. However, consumers must choose a supplier to enter the market, and by default they are supplied by the energy supplier that has a licence for ‘obligation to supply’ in a specific geographical region. The four new suppliers that entered the market in 2010 compete mainly for household customers. This is a very important development, especially considering that about 90% of Danish household consumers are still in the regulated segment.
4.1. Electricity: There are a total of 55 suppliers of electricity to households in Denmark. Each of the 33 supply obligation companies has been granted a concession for a specific geographic region where they supply households and small businesses that have not concluded an individual contract. Between 90 and 95% of the Danish households and small businesses are supply obligation customers. The remainder of the trading companies supply small customers (who have used the liberalised market and changed supplier), larger businesses and enterprises. Price regulation exists for household and industrial consumers. The switching rate for households and small business was 3.5% in 2011, lower than in previous years (4.2% in 2010 and 6.1% in 2009). DERA considers that a possible reason for this is a decrease in information campaigns encouraging the change of supplier. Power prices are characterised by high taxes, representing approximately 51% of the final price44. Network costs accounted for 49% of the power price for Danish households (without taxes) in 2011, with energy and supply costs making up the other 50%. In the case of industrial electricity prices, the percentages were 43% and 57% respectively. The correlation analysis shows a considerable correlation between the wholesale and the retail price. There are no legal provisions for smart meters for customers consuming less than 100 000 kWh per year, since the cost-benefit study addressing a mandatory roll-out was negative in 2009. Nevertheless, approximately half of all households are equipped with advanced electronic meters enabling remote reading.
44. Another important component is the public service obligations
(PSO) tariff. This tariff mostly covers subsidies for renewable
generation, which in turn are linked to the Nord Pool price. The
net energy price itself is also linked to the price on Nord Pool,
where most of Denmark’s power consumption is traded.

EN
ER
GY
M
AR
KE
TS
I
N
TH
E
EU
RO
PE
AN
U
NI
ON
I
N
20
11
/
6
8
D E N M A R K
4.2. Gas: In 2010, there were 17 gas suppliers. There were six incumbent suppliers: three were supply obligation companies with regulated prices (DONG Energy Gasforsyning, NGF Gazelle Gasforsyning and HMN Salg) and three were affiliated commercial supply companies (DONG Naturgas, HMN Handel and NGF Gazelle). Even though the Danish retail market for gas was liberalised in 2004, regulated prices (for households and industry) still coexist with market prices. As in the case of power prices, gas prices are heavily taxed in Denmark. Apart from VAT, consumers pay an energy tax and a CO2 tax, which together can sometimes exceed the price of gas itself (depending on price developments on gas exchanges).
4.3. Consumers: Danish consumers rate the performance of their retail electricity and gas market above the EU average (12th place out of 27 and 9th place out of 23, respectively). The incidence of problems is, respectively, the lowest and third lowest in the EU while trust in providers and overall consumer satisfaction are above EU average (both score 3rd highest for gas market). On the other hand, comparability is amongst the three lowest ratings in the EU for both markets and the scores for choice, ease of switching, and actual switching are also below the EU average, probably due to the system of regulated prices that is still applied in Denmark45.
45. 8th Consumer Markets Scoreboard, 2012, European Commission,
DG SANCO, http://ec.europa.eu/consumers/consumer_research/
editions/cms8_en.htm
The Danish Energy Association publishes the electricity prices online. The Danish gas TSO does the same for gas. Complaints arising from the contractual relationship between household energy consumers and suppliers are dealt with by the Energy Supplies Complaint Board. The Board’s decisions are not binding or enforceable and the matter can be taken to court. There are no specific provisions regarding vulnerable consumers in energy law; instead this issue is dealt with in social legislation.
5. Infrastructure
5.1. Electricity: The supply system is historically robust, with only few system failures. Nevertheless, the European objectives on renewable energy could pose a challenge to the supply system. ENTSO-E has predicted power balance problems for Denmark in winters starting from 201646. The Great Belt interconnection between Eastern and Western Denmark has operated from August 2010. Despite intensive usage, existing price differences between Danish regions may make further expansion of capacity necessary.
46. These projections do not take account of recent developments in Ger-
many, where production from nuclear plants will possibly be reduced
in the future, increasing the need to tackle the challenges posed.
C H A R T S 3 A N D 4
Electricity - Retail prices in Denmark (in €/kWh)
H O U S E H O L D S I N D U S T R Y
VAT Other taxes Net price
2004 2005 2006 2007 2008 2009 2010 2011 2004 2005 2006 2007 2008 2009 2010 20110.00
0.05
0.10
0.15
0.20
0.25
0.30
0.35
Source: Eurostat
Natural gas - Retail prices in Denmark (in euro cent/kWh)
H O U S E H O L D S I N D U S T R Y
VAT Other taxes Net price
2005 2006 2007 2008 2009 2010 2011 2005 2006 2007 2008 2009 2010 20110
4
2
8
6
10
14
12

EN
ER
GY
M
AR
KE
TS
I
N
TH
E
EU
RO
PE
AN
U
NI
ON
I
N
20
11
/
6
9
D E N M A R K
5.2. Gas: ENTSO-G has identified potential shortcomings with respect to demand versus entry capacity in the Denmark/Sweden region from 2014 onwards. The main cause is insufficient capacity at the German-Danish border, which cannot offset the depletion of Danish off-shore fields. Following an investment decision, a new 94 km gas pipeline in southern Jutland and a new compressor station in Egtved will probably be ready to transmit natural gas to Danish and Swedish consumers in October 2013. The pipeline, which will run from Ellund near the German border to Egtved, together with the compressor station in Egtved, will increase the capacity of the gas transmission network, allowing Denmark to import natural gas when gas production in the Danish part of the North Sea starts to decline. The expansion is expected to improve security of supply and increase competition in the gas market to the benefit of consumers.
D E N M A R K – K E Y I N D I C ATO R S O F T H E E L E C T R I C I T Y A N D N AT U R A L G A S M A R K E T S
E L E C T R I C I T Y G A S
Number of companies representing at least 95% of net power generation > 1 000 Number of entities bringing natural gas into country 2
Number of main power-generation companies (1) 2 Number of main gas entities (4) 2
Market share of the largest power-generation company 46.0% Market share of the largest entity bringing natural gas N/A
Number of electricity retailers 33 Number of retailers selling natural gas to final customers 13
Number of main electricity retailers (2) N/A Number of main natural gas retailers (5) 5
Switching rates (entire electricity retail market) 4.3% Switching rates for gas (entire retail market) 0.9%
Regulated prices for households – electricity YES Regulated prices for households – gas YES
Regulated prices for non-households – electricity YES Regulated prices for non-households – gas YES
HHI in power-generation market (3) N/A HHI in gas supply market (3) N/A
HHI in electricity retail market (3) N/A HHI in gas retail market (3) 5 600
Electricity market value (bn €) (6) 7.034 Gas market value (bn €) (6) 5.060
Sources: Eurostat, CEER, National Regulatory Authority, EC calculations.
(1) Companies are considered as ‘main’ if they produce at least 5% of the national net electricity generation.
(2) Retailers are considered as ‘main’ if they sell at least 5% of the total national electricity consumption.
(3) The HHI (Herfindahl-Hirschman Index) is a commonly accepted measure of market concentration. It is calculated by squaring the market share
of each firm competing in the market and then summing the resulting numbers (the higher the index, the more concentrated the market).
Moderate concentration: 750-1 800; high concentration: 1 800-5 000; very high concentration: above 5 000.
(4) Entities are considered as ‘main’ if they deal with at least 5% of the natural gas (indigenous production or import).
(5) Retailers are considered as ‘main’ if they sell at least 5% of the total natural gas consumed by final customers.
(6) Market value is an estimation of the size of the retail electricity and gas markets. It is calculated using data on electricity and gas consumption
in the household and non-household sectors and annual average retail prices.

EN
ER
GY
M
AR
KE
TS
I
N
TH
E
EU
RO
PE
AN
U
NI
ON
I
N
20
11
/
7
0
1. General overview
In 2010, the energy mix was dominated by fossil fuels, with crude oil and petroleum products accounting for more than one third. Solid fuels were almost equally divided between lignite and hard coal. In the electricity mix, fossil fuels had again the highest share, but solid fuels were the main source. The main source of renewable electricity was wind, contributing 38 TWh in 2010. As far as the renewable target for 2020 is concerned, the goal for Germany is an 18% share of renewable energy47. This improved from 7.1% in 2006 to 11% in 2010. The production of renewable energy has substantially increased in Germany, meeting 20% of consumption in 2011. Germany intends to increase this figure further to 35% by 2020. The share of electricity from cogeneration48 was 13.2% in 2010, which is a slight increase compared to the 2005 level of 12.6%.
2. Regulatory framework
2.1. General: As Germany had notified full transposition of the Third Package Directives by the end of September 2011, no infringement proceedings for non-transposition have been opened. One infringement procedure is still open on the Second Package, concerning the lack of congestion management and transparency provisions for access to the network for the cross-border exchange of electricity.
47. This is the share of renewables in Gross Final Energy Consumption.
48. The share of electricity produced in combined heat and power
plants (CHP).
C H A R T S 1 A N D 2
Gross inland consumption (as % of total Mtoe) - 2010
Crude oil and petroleum products 34.0%
Natural gas21.8%
Other 0.8%
Renewables9.7%
Solid fuels22.9%
Total Mtoe: 336.09
Nuclear10.8%
Gross electricity generation (as % of TWh) - 2010
Natural gas15.6%
Other1%
Renewables17.8%
Solid fuels42.4%
Total TWh: 627.92
Nuclear22.7%
Source: Eurostat
Key Issues
→ With regard to electricity, Germany has a relatively well developed market. However, there are serious issues as regards infrastructure bottlenecks within the country. These lead to significant loop flows through the networks of neighbouring countries (especially Poland and the Czech Republic). This development has been reinforced by the sharp increase in power generation from renewable energy sources in Germany. The potential challenges arising from such an increase need to be addressed, in particular to prevent obstacles to integration with neighbouring markets. Therefore Germany should continue working together with its neighbours with a view to identifying appropriate solutions to the problems. In particular, congestion management and transparency provisions for access to the network for the cross-border exchange of electricity should be introduced and national transmission capacity in the north-south direction reinforced, particularly in the light of offshore expansion plans and the integration of onshore renewables from wind and solar. Germany should also finalise its implementation of the European target model for electricity markets by 2014 on all of its borders.
→ With regard to gas, Germany should assess the correlation between gas and electricity demand, notably during cold weather periods. Infrastructure improvements are needed, as recommended by the Council, to address internal bottlenecks in the south, limiting north-south gas flows, and constraints in the network preventing gas from underground storage being fed into the transmission system. Major border points remain congested, preventing cross-border trade.
GERMANY

EN
ER
GY
M
AR
KE
TS
I
N
TH
E
EU
RO
PE
AN
U
NI
ON
I
N
20
11
/
7
1
G E R M A N Y
2.2. National Energy Regulator: In 2010, the German national regulatory authority, the Bundesnetzagentur, employed 2600 employees, with 185 working on energy issues, and had an annual budget of EUR 155.4 million, including around EUR 18 million for energy regulation.
2.3. Unbundling: Germany’s power transmission system comprises four TSOs: Tennet, Amprion, 50Hertz and TransnetBW. There are 54 regional utilities responsible for distribution and over 800 municipal distributors. For gas, there were 18 transmission system operators in 2010, down from 22 in 2006, the largest being Open Grid Europe, Wingas, Ontras, and Thyssengas, and 27 regional network operators. In 2011, there were 743 distribution system operators. The certification of most TSOs is under way. The German TSOs have opted for different unbundling models, i.e. partly for ownership unbundling (OU), partly for the Independent Transmission Operator (ITO) model. Both choices are as such legitimate under German law.
3. Wholesale markets
3.1. Electricity: Generation is still dominated by four large private companies, E.ON, RWE, EnBW and Vattenfall. Al-though their share was reduced after antitrust investiga-tions by the Commission and the commitment by E.ON to divest 5 000 MW of its generation capacity,49 the four largest producers together still controlled 82% of the Ger-man electricity wholesale market in 201050. The special regime for renewable power generation in terms of pric-ing and marketing in Germany poses specific challenges in that it tends to weaken the strength of market signals.
The German and Austrian wholesale markets are largely integrated51. Market integration with other neighbouring markets is progressing thanks to the introduction of market coupling in the CWE and Northern regions. Through the coupling of electricity markets in north-western Europe, the national electricity spot markets of 9 countries are now integrated at wholesale level. The power exchange EEX, located in Leipzig, operates the German power derivatives market (futures and options), whereas the German spot market (day-ahead and intra-day) is operated by EPEX Spot in Paris. Liquidity on both EEX and EPEX Spot is high. Regarding the trade in day-ahead volumes, this reached 238 TWh on EPEX Spot in 201152
49. See European Commission, press release IP/08/1774, Antitrust:
Commission opens German electricity market to competition,
26.11.08.
50. However, this figure does not take into account subsidised
renewable electricity production. If this is included, the four
accounted for around 70% of generation in 2010.
51. Germany and Austria form one trading area.
52. Source: EEX annual report.
(47.1% of German power consumption). The average day-ahead wholesale price in 2011 for baseload power was EUR 51.1/MWh (an increase of 14.8% compared to 2010). Compared to neighbouring countries53, the German energy price at wholesale level is fairly competitive, which can be explained partly by favourable weather conditions for the production of renewable electricity (mostly wind) and also its maturing technology, which decreases the marginal costs of wind power.
3.2. Gas: Germany produced approximately 13% of its con-sumption in 2010, with net imports accounting for 82%. In volume, natural gas imports amounted to 88.7 bcm with the following breakdown: 37% Russia, 33% Norway, 25% Netherlands and 5% other countries. The German gas market has seen significant developments towards more competition over recent years. The German regula-tor has implemented an entry-exit system, reformed the balancing rules and reduced the number of market areas drastically, from more than 20 in 2006 to six in 2009 and only two market areas today. Today, Germany has a dual-quality market area (the L-gas and H-gas networks re-quiring separate operation for technical reasons) with all customers included in one large balancing area. Two anti-trust decisions by the Commission addressed the problem of insufficient access to transport capacity in Germany. The Commission’s intervention led RWE to divest its gas transport network and E.ON to release significant volumes at the entry points to its gas networks. Congestion of main import/export points due to long-term bookings remains an obstacle to cross-border trade and competition.
Recent German legislation on capacity allocation and con-gestion management is intended to improve the situation, particularly by increasing the use of capacity auctions on a centralised booking platform. Both German virtual points (hubs), NCG and Gaspool, have grown significantly since 2007. The volume of trading on the exchange has grown steadily, recording an increase of 216% in 2010 compared to 2009. One main reason for this was addi-tional procurement on the exchange for system balancing energy by the two balancing zone operators, NetCologne Germany and Gaspool54. The average day-ahead whole-sale price in 2011 was EUR 22.9/MWh on both hubs (an increase of 30.9% compared to 2010, which reversed the significant drop in 2009). This was due to the improve-ment in the economic climate and the rise in gas demand. Regarding liquidity, 9 TWh in day-ahead volumes were traded in 2011, compared to the national consumption
53. For a comparison with wholesale prices in neighbouring countries,
please refer to Table 9 of this Staff Working Document, part II.
54. Nonetheless, the 47 110 GWh traded on the EEX for spot and
futures products was less than 3% of OTC trading. In parallel,
there was strong growth in OTC trading, so the volume traded
on the EEX hardly changed in percentage terms.

EN
ER
GY
M
AR
KE
TS
I
N
TH
E
EU
RO
PE
AN
U
NI
ON
I
N
20
11
/
7
2
G E R M A N Y
of 870 TWh. With a churn rate of 2.1 for H-gas zones, as compared to that for TTF (3.4), there is a potential to increase liquidity. Gas delivered through Nord Stream is expected to contribute to a higher churn rate.
4. Retail markets
4.1. Electricity: In 2010, the share of the four largest elec-tricity suppliers for household customers at national level was 43.8% (a drop of 6.3% within two years). However, this trend at national level has not affected the continuing dominant position of local basic suppliers at regional level, such as Stadtwerke. Household customers are still reluc-tant to switch away from local basic suppliers despite price discrepancies and the presence of competitors. Supplier switching increased from 4.9% in 2009 to 6.3% in 2010. Power prices for households and industrial consumers have increased in recent years. The structure of retail prices reveals that net power prices have changed only marginal-ly, decreasing slightly for industrial consumers. The increase in retail prices is mostly due to taxes and levies. Network costs accounted for 42% of the electricity bill for German households (without taxes) in 2011, while energy and sup-ply costs took up 58%. In the case of industrial electricity prices these proportions were 27% and 73% respectively. End-user prices are not regulated. A correlation analysis of half-yearly averages for industry shows a moderate influence of the wholesale price on the retail price with a time lag of six months. For households, this influence was less apparent. German law requires smart meters to be installed in new buildings, in buildings undergoing major re-furbishment and for customers consuming over 6000 kWh per year. No nationwide roll-out schedule is in place yet.
4.2. Gas: In 2010, some 720 000 household customers switched gas suppliers. The volume of gas supplied to customers who had already switched doubled from 47.18 TWh in 2009 to 110.38 TWh in 2010. This corresponds to a switching rate of 10.88%. In 2010, most household customers had a choice of between 11 and 20 gas suppliers. In 36 network areas, a household customer could already choose from over 50 suppliers. Another important trend is the fact that the wholesale prices for gas, which had decreased significantly since the second half of 2008, has had a positive influence on household customer prices.
Gas prices for final consumers were more volatile than power prices. For both households and industry, they decreased after 2008 and increased again in 2011. This can be explained by the general drop in energy prices due to the economic slowdown in 2009 and the subsequent recovery. Unlike for power prices, taxes had less impact on price movements. The correlation analysis of half-yearly prices points to a significant influence of the wholesale price on retail prices for households and industry. For industry, the correlation is stronger within the same half-year, but for households it increases with a lag of six months. End-user prices are not regulated.
4.3. Consumers: German consumers rate the performance of their retail electricity market third highest of all EU countries and scores on choice, comparability and ease of switching are amongst the three highest in the EU. A similar picture is observed for the retail gas market (ranked 6th highest in the EU), where the scores for ‘choice’ and ease of switching are the highest in the EU and the number of complaints is the second lowest;55 While there is no officially recognised online price comparability tool, there are a number of privately run
55. 8th Consumer Markets Scoreboard, 2012, European Commission,
DG SANCO, http://ec.europa.eu/consumers/consumer_research/
editions/cms8_en.htm
C H A R T S 3 A N D 4
Electricity - Retail prices in Germany (in €/kWh)
H O U S E H O L D S I N D U S T R Y
VAT Other taxes Net price
2004 2005 2006 2007 2008 2009 2010 2011 2004 2005 2006 2007 2008 2009 2010 20110.00
0.05
0.10
0.15
0.20
0.25
0.30
Source: Eurostat
Natural gas - Retail prices in Germany (in euro cent/kWh)
H O U S E H O L D S I N D U S T R Y
VAT Other taxes Net price
2005 2006 2007 2008 2009 2010 2011 2005 2006 2007 2008 2009 2010 20110
1
2
3
4
8
7
6
5

EN
ER
GY
M
AR
KE
TS
I
N
TH
E
EU
RO
PE
AN
U
NI
ON
I
N
20
11
/
7
3
G E R M A N Y
online price comparison services for electricity and gas. Bun-desnetzagentur provides advice for energy consumers via a hotline. Complaints are handled by the NRA, although it does not settle disputes between customers and suppliers. For out of court settlements, this task was attributed to a special arbitration body for energy. Germany does not specifically define ‘vulnerable consumers’ in energy law, but assistance is provided under general social laws and related support schemes. This includes bill rebates, discounted tariffs, benefit entitlement checks, and debt advice to low-income families with several family members and specific needs.
5. Infrastructure
5.1. Electricity: In the light of the Fukushima accident and following review of its policy on nuclear energy, Ger-many decided to shut 8 nuclear power plants in 2011 (8300 MW). This has led to a significant drop in capacity in the south of Germany and increased the need for power transportation from north to south. North-south and east-west power flows in Germany increased in the first half of 2011. With new wind parks being developed in the North and Baltic Seas and a further increase in the share of renewable generation (35% planned for 2020), the exist-ing bottleneck on the north-south axis will be further ex-acerbated. The German electricity grid is expected to see increasing electricity imports, and network constraints will significantly aggravate the current problem of loop flows
on neighbouring systems. In 2011, Germany passed a law requiring a network development plan to be prepared jointly by all TSOs, with the aim of streamlining planning procedures at federal level. Technical, financial and en-vironmental expertise has been brought together within Bundesnetzagentur. Until recently, priority projects were progressing only slowly due to public acceptance issues and the separation of spatial and regional plan approval regimes. This situation might improve now that Germany has a streamlined approval regime at federal level.
Under the European Energy Programme for Recovery (EEPR), one important north-south link, the Halle-Schweinfurt elec-tricity line, has received funding of EUR 100 000 000 and should be completed in the coming years.
5.2. Gas: After the UK, Germany is the EU’s second largest gas market, accounting for 17% of EU gas consumption. 86% of its imports arrive via pipelines. It has the largest gas storage capacity in the EU (20 bcm). In November 2011, the first arm of Nord Stream came online, the second arm followed in October 2012. Nord Stream has the capacity to bring a total of 55 bcm/y of Russian gas to Germany by the end of 2012. Germany will have to enhance the interconnectivity of its gas infrastructure to neighbouring countries, including reverse flows, and develop new north-south and east-west transport capacity. Good progress is being made on reverse flows with Austria. Significant bottlenecks remain at the borders with Denmark (Ellund) and Poland (Lasow), within southern Germany and on the north-south route.
G E R M A N Y – K E Y I N D I C ATO R S O F T H E E L E C T R I C I T Y A N D N AT U R A L G A S M A R K E T S
E L E C T R I C I T Y G A S
Number of companies representing at least 95% of net power generation > 450 Number of entities bringing natural gas into country 22
Number of main power-generation companies (1) 4 Number of main gas entities (4) 7
Market share of the largest power-generation company 28.4% Market share of the largest entity bringing natural gas N/A
Number of electricity retailers > 1 000 Number of retailers selling natural gas to final customers 820
Number of main electricity retailers (2) 3 Number of main natural gas retailers (5) 2
Switching rates (entire electricity retail market) 6.3% Switching rates for gas (entire retail market) 6.7%
Regulated prices for households – electricity NO Regulated prices for households – gas NO
Regulated prices for non-households – electricity NO Regulated prices for non-households – gas NO
HHI in power-generation market (3) 2 021 HHI in gas supply market (3) 1 886
HHI in electricity retail market (3) N/A HHI in gas retail market (3) appr. 300
Electricity market value (bn €) (6) 88.054 Gas market value (bn €) (6) 55.250
Sources: Eurostat, CEER, National Regulatory Authority, EC calculations.
(1) Companies are considered as ‘main’ if they produce at least 5% of the national net electricity generation.
(2) Retailers are considered as ‘main’ if they sell at least 5% of the total national electricity consumption.
(3) The HHI (Herfindahl-Hirschman Index) is a commonly accepted measure of market concentration. It is calculated by squaring the market share
of each firm competing in the market and then summing the resulting numbers (the higher the index, the more concentrated the market).
Moderate concentration: 750-1 800; high concentration: 1 800-5 000; very high concentration: above 5 000.
(4) Entities are considered as ‘main’ if they deal with at least 5% of the natural gas (indigenous production or import).
(5) Retailers are considered as ‘main’ if they sell at least 5% of the total natural gas consumed by final customers.
(6) Market value is an estimation of the size of the retail electricity and gas markets. It is calculated using data on electricity and gas consumption
in the household and non-household sectors and annual average retail prices.

EN
ER
GY
M
AR
KE
TS
I
N
TH
E
EU
RO
PE
AN
U
NI
ON
I
N
20
11
/
7
4
1. General overview
Solid fuels, predominantly oil shale, were the most important energy source in 2010. Estonia is one of the largest producers of oil shale in the world and its energy sector relies heavily on this source, from which the bulk of its electricity also originates. Nevertheless, the share of renewables in the energy mix has been increasing; it tripled compared to 1990, reaching 13% in 2010. Estonia set a target of 25% of renewables in Gross Final Energy Consumption by 2020. In 2006 this share was 16.1% and in 2010 it was 24.3%. The share of cogeneration56 was 10.3% in 2010, remaining practically unchanged compared to 2005 (10.2%).
2. Regulatory framework
2.1. General: Following the opening of infringement proceedings in September 2011 for non-transposition, Estonia has declared that the Third Energy Package Directives have been now fully transposed. The Commission is conducting a prima-facie examination of the completeness of the transposition based on the measures notified and other information provided in the proceedings.
2.2. National Energy Regulator: The Estonian Competition Authority (ECA) also acts as regulator for several sectors. It has been in operation since 1998, and employs 62 staff (14 of whom work on energy issues) with an annual budget of almost EUR 1.83 million in 2011, both of which are low figures.
56. The share of electricity produced in combined heat and power
plants (CHP).
C H A R T S 1 A N D 2
Gross inland consumption (as % of total Mtoe) - 2010
Crude oiland petroleum
products16.5%
Natural gas 8.8%
Renewables13.3%
Solid fuels61.4% Total Mtoe: 6.10
Gross electricity generation (as % of TWh) - 2010
Natural gas5.5%
Other0.3%
Renewables8.1%
Solid fuels86.1%
Total TWh: 12.96
Source: Eurostat
Key Issues
→ Estonia is planning to phase out regulated prices for electricity. It also intends to continue working (in BEMIP) towards the creation of a Baltic regional market in electricity. Continued cooperation with the EU in negotiations with Russia and Belarus is necessary for the operation of the electricity network in the Baltic States. As far as infrastructure is concerned, it is essential that Estonia should complete Estlink2 − the second electricity interconnection with Finland − and also work with Latvia on improving interconnections between both Member States, as recommended by the Council. The electricity infrastructure could be upgraded to integrate increasing amounts of wind energy.
→ As far as gas is concerned, Estonia is an energy island that is not connected with the rest of the EU. Preparations should be made to end this isolation, as also recommended by the Council and create market structures by 2014, which will involve further work under the BEMIP initiative. Estonia should continue its efforts to ensure the implementation of ownership unbundling in practice in the gas sector and address its dependence on long-term oil-indexed contracts with Russia. It should participate in the project to diversify natural gas supply within the region, via a regional LNG terminal in the Baltic States or Finland and a possible interconnection of the Baltic States with Poland and/or Finland.
ESTONIA

EN
ER
GY
M
AR
KE
TS
I
N
TH
E
EU
RO
PE
AN
U
NI
ON
I
N
20
11
/
7
5
E S T O N I A
2.3. Unbundling: The electricity TSO, Elering AS, is state-owned and plans to apply for certification under the ownership unbundling model. There is one single operator in gas, namely AS EG Võrguteenus, which provides transmission and distribution services and belongs to the dominant gas trader AS Eesti Gaas, the main shareholders of which are Gazprom, E.On and Fortum. At the time of writing, this TSO is only legally unbundled, but the Estonian Parliament has recently adopted the Gas Law, which requires ownership unbundling to be implemented by 2015 (despite a derogation from the unbundling rules).
3. Wholesale markets
3.1. Electricity: The Estonian electricity market is very small. Effective competition is limited by the dominant position of Eesti Energia, which accounted for 89% of total electricity production in 2010. The Nord Pool Tallinn power exchange, which started in April 2010,57 is expected to generate more competition on the market. In 2011 there were 17 traders (including undertakings from Latvia and Lithuania) that operated in the NPS Estonia price area. From January 2011, the three Baltic TSOs decided to use implicit auctions to allocate capacity. From a technical perspective, the Estonian electricity system operates in synchronous mode with the systems in Russia, Belarus, Latvia and Lithuania. This interdependency requires an agreement with Russia and Belarus on how to operate the networks. Such an agreement will to allow Estonia also to explore fully the potential of integration with Nord Pool Spot. The Commission is negotiating this agreement on behalf of the EU. The average day-ahead wholesale price in 2011 for baseload power was EUR 43.4/MWh (looking at the period from April to December 2010, the price was 7% lower in 2011 within the same period)58. In terms of liquidity, 5.8 TWh of this power was traded in the same year (72% of electricity consumed).
3.2. Gas: Estonia imports natural gas exclusively from OAO Gazprom from Russia. In winter time, the Inčukalns underground gas storage facility is used. In 2011, 0.63 bcm were imported (100% of gross inland consumption). Estonia has cross-border connections with Russia and Latvia only, and Russia is the sole supplier of gas in all three Baltic countries. Hence there
57. Estonian power is also traded on the Baltic power exchange
BaltPool in Lithuania, although no data on Estonian volumes
and prices alone are available.
58. For a comparison with wholesale prices in neighbouring countries,
please refer to Table 9 of this Staff Working Document, part II.
is no competition between sellers. There is no organised hub, and therefore it is impossible to give a reference wholesale price. The estimates of long-term prices for Russian gas result in an annual average of EUR 27.8/MWh for 2011 (an increase of 6.8% compared to 2010).
4. Retail markets
4.1. Electricity: Estonia, in accordance with exemptions under the second energy package, is now in a transitional period towards market opening, and only eligible customers − who accounted for 33.2% of the total consumption in 2011 − can switch suppliers. In 2010, Eesti Energia AS had a market share of almost 88%. The second and third largest undertakings (VKG Elektrivõrgud OÜ and Imatra Elekter AS) have more or less the same share, namely 5.4%. The market will be fully opened in 2013, which is likely to have beneficial effects on competition. Electricity retail prices increased (see chart 3), mostly because of the net energy price, but also due to taxes. In 2011 the share of network costs within the household price (without taxes) accounted for 58%, while energy and supply costs accounted for 42%. The proportions for industrial electricity prices were 51% and 49% respectively. Prices are regulated for households and industry. The roll-out of smart meters is due to be dealt with in the next Energy Sector Development Plan 2030, which should be ready by the end of next year. The Estonian grid code determines that all consumers must be provided with a ‘remote reading device’ by 2017. No cost-benefit analysis has yet been carried out.
4.2. Gas: Because there is no proper wholesale gas market, the retail market for gas is not developed either. Eesti Gaas is in a dominant position in the retail market too. Its retail market share has consistently been above 90%. Gas retail prices were more volatile than electricity prices. Any changes were chiefly due to the variations in the net energy price. The import price of gas is calculated according to the changes in the average price of heavy and light fuel oil, which explains the volatility of the gas price. End users pay the full import price, transportation cost and a regulated profit margin.

EN
ER
GY
M
AR
KE
TS
I
N
TH
E
EU
RO
PE
AN
U
NI
ON
I
N
20
11
/
7
6
E S T O N I A
4.3. Consumers: The retail gas market is assessed third highest in the EU, with the second highest score on comparability. However, consumer assessment of choice, switching and ease of switching is amongst the three lowest in the EU and has been falling since 2010. Also the performance of the retail electricity market is assessed above EU average (8th position out of 27), with the highest score in the EU on comparability of services59. There is no price comparison site available for the electricity and gas retail market. The NRA acts as an alternative dispute resolution body. Consumers can also contact the Consumer Protection Board of Estonia.
5. Infrastructure
5.1. Electricity: Estonia is interconnected to the EU electricity market through Estlink1, and recently joined Nord Pool Spot by creating the Estlink price area for day-ahead market and trading in the power exchange. The limited capacity of the connection between Estonia and Latvia creates cross-border bottlenecks, which have an adverse impact on the electricity markets of Estonia and the other Baltic States.
59. 8th Consumer Markets Scoreboard, 2012, European Commission,
DG SANCO, http://ec.europa.eu/consumers/consumer_research/
editions/cms8_en.htm
5.2. Gas: Estonia’s gas grid is connected to the gas system of the Russian Federation as well as to that of Latvia. There is no link with the rest of the EU gas market. There is one gas supply contract with Gazprom, which ends in 2015. Eesti Gaas AS expects to extend this contract for a further period. As part of the BEMIP initiative, there are plans to end Estonia’s isolation from the EU market. Significant infrastructure investment is needed in order to diversify sources and increase security of supply. An interconnection between Lithuania and Poland, as well as a regional LNG terminal in the Baltic States or Finland, are among the topics under discussion. In order for the investments to reach the potentially necessary scale, the connection to Finland may also be needed. This could be done via the planned Balticconnector.
C H A R T S 3 A N D 4
Electricity - Retail prices in Estonia (in €/kWh)
H O U S E H O L D S I N D U S T R Y
VAT Other taxes Net price
2004 2005 2006 2007 2008 2009 2010 2011 2004 2005 2006 2007 2008 2009 2010 20110.00
0.02
0.04
0.06
0.08
0.10
0.12
Source: Eurostat
Natural gas - Retail prices in Estonia (in euro cent/kWh)
H O U S E H O L D S I N D U S T R Y
VAT Other taxes Net price
2005 2006 2007 2008 2009 2010 2011 2005 2006 2007 2008 2009 2010 20110
1
2
3
5
4

EN
ER
GY
M
AR
KE
TS
I
N
TH
E
EU
RO
PE
AN
U
NI
ON
I
N
20
11
/
7
7
E S T O N I A
E S TO N I A – K E Y I N D I C ATO R S O F T H E E L E C T R I C I T Y A N D N AT U R A L G A S M A R K E T S
E L E C T R I C I T Y G A S
Number of companies representing at least 95% of net power generation 6 Number of entities bringing natural gas into country 1
Number of main power-generation companies (1) 1 Number of main gas entities (4) 1
Market share of the largest power-generation company 89.0% Market share of the largest entity bringing natural gas 100%
Number of electricity retailers 41 Number of retailers selling natural gas to final customers 22
Number of main electricity retailers (2) 1 Number of main natural gas retailers (5) 1
Switching rates (entire electricity retail market) N/A Switching rates for gas (entire retail market) N/A
Regulated prices for households – electricity YES Regulated prices for households – gas NO
Regulated prices for non-households – electricity YES Regulated prices for non-households – gas NO
HHI in power-generation market (3) > 7 500 HHI in gas supply market (3) > 7 500
HHI in electricity retail market (3) > 9 000 HHI in gas retail market (3) > 7 500
Electricity market value (bn €) (6) 0.656 Gas market value (bn €) (6) 0.261
Sources: Eurostat, CEER, National Regulatory Authority, EC calculations.
(1) Companies are considered as ‘main’ if they produce at least 5% of the national net electricity generation.
(2) Retailers are considered as ‘main’ if they sell at least 5% of the total national electricity consumption.
(3) The HHI (Herfindahl-Hirschman Index) is a commonly accepted measure of market concentration. It is calculated by squaring the market share
of each firm competing in the market and then summing the resulting numbers (the higher the index, the more concentrated the market).
Moderate concentration: 750-1 800; high concentration: 1 800-5 000; very high concentration: above 5 000.
(4) Entities are considered as ‘main’ if they deal with at least 5% of the natural gas (indigenous production or import).
(5) Retailers are considered as ‘main’ if they sell at least 5% of the total natural gas consumed by final customers.
(6) Market value is an estimation of the size of the retail electricity and gas markets. It is calculated using data on electricity and gas consumption
in the household and non-household sectors and annual average retail prices.
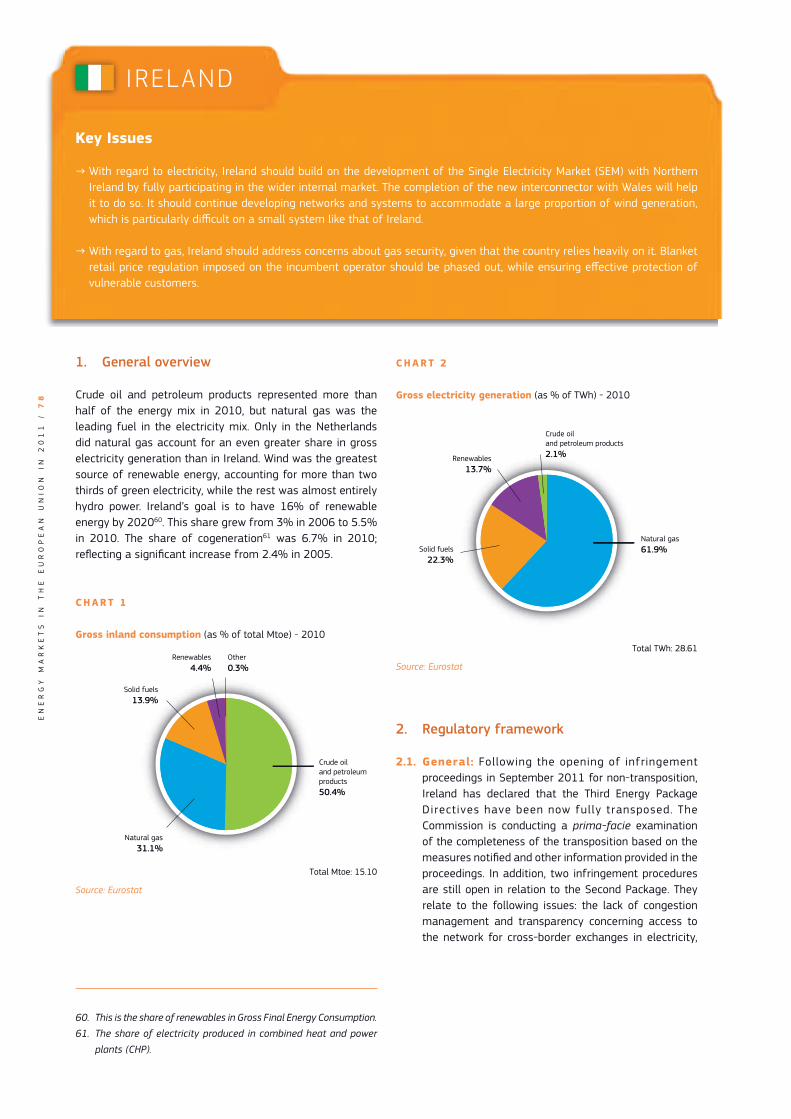
EN
ER
GY
M
AR
KE
TS
I
N
TH
E
EU
RO
PE
AN
U
NI
ON
I
N
20
11
/
7
8
1. General overview
Crude oil and petroleum products represented more than half of the energy mix in 2010, but natural gas was the leading fuel in the electricity mix. Only in the Netherlands did natural gas account for an even greater share in gross electricity generation than in Ireland. Wind was the greatest source of renewable energy, accounting for more than two thirds of green electricity, while the rest was almost entirely hydro power. Ireland’s goal is to have 16% of renewable energy by 202060. This share grew from 3% in 2006 to 5.5% in 2010. The share of cogeneration61 was 6.7% in 2010; reflecting a significant increase from 2.4% in 2005.
C H A R T 1
Gross inland consumption (as % of total Mtoe) - 2010
Crude oil and petroleum products 50.4%
Natural gas31.1%
Other 0.3%
Renewables4.4%
Solid fuels13.9%
Total Mtoe: 15.10
Source: Eurostat
60. This is the share of renewables in Gross Final Energy Consumption.
61. The share of electricity produced in combined heat and power
plants (CHP).
C H A R T 2
Gross electricity generation (as % of TWh) - 2010
Crude oil and petroleum products2.1%
Natural gas61.9%
Renewables13.7%
Solid fuels22.3%
Total TWh: 28.61
Source: Eurostat
2. Regulatory framework
2.1. General: Following the opening of infringement proceedings in September 2011 for non-transposition, Ireland has declared that the Third Energy Package Directives have been now fully transposed. The Commission is conducting a prima-facie examination of the completeness of the transposition based on the measures notified and other information provided in the proceedings. In addition, two infringement procedures are still open in relation to the Second Package. They relate to the following issues: the lack of congestion management and transparency concerning access to the network for cross-border exchanges in electricity,
Key Issues
→ With regard to electricity, Ireland should build on the development of the Single Electricity Market (SEM) with Northern Ireland by fully participating in the wider internal market. The completion of the new interconnector with Wales will help it to do so. It should continue developing networks and systems to accommodate a large proportion of wind generation, which is particularly difficult on a small system like that of Ireland.
→ With regard to gas, Ireland should address concerns about gas security, given that the country relies heavily on it. Blanket retail price regulation imposed on the incumbent operator should be phased out, while ensuring effective protection of vulnerable customers.
IRELAND

EN
ER
GY
M
AR
KE
TS
I
N
TH
E
EU
RO
PE
AN
U
NI
ON
I
N
20
11
/
7
9
I R E L A N D
and the lack of transparency of conditions for access to the natural gas transmission network62.
2.2. National Energy Regulator: The Irish National Regulatory Authority, the Commission for Energy Regulation (CER), in operation since 1999, employed a staff of 66 in 2010, with a budget of EUR 10 million.
2.3. Unbundling: The Irish electricity incumbent, the state-owned ESB, owns the electricity transmission system. The system is operated by EirGrid, the system operator. ESB has applied for these arrangements to be certified as guaranteeing effective unbundling in line with Article 9(9) of the Electricity Directive, however, neither the Irish regulator CER nor the Commission have made a decision on this application. EirGrid plc also owns the Northern-Ireland system operator SONI, and the Northern Ireland transmission system is owned by ESB subsidiary NIE. ESB also owns the distribution system, operated by ESB Networks Ltd. The Irish gas transmission and distribution networks are owned by the Irish government through Bord Gáis Energy (BGE). They are operated by Gaslink. Ireland plans to adopt the ITO unbundling model in gas, but the Government has also decided to sell supply interests, thereby moving to full ownership unbundling, which is expected to be implemented early in 2014.
3. Wholesale markets
3.1. Electricity: The wholesale electricity market for Ireland is the SEM. It is jointly regulated by the CER and its counterpart in Belfast, the Northern Ireland Authority for Utility Regulation (NIAUR). The major supplier in the Irish market is the ESB. It owns roughly 41% of dispatchable capacity on the island63. Endesa is the second largest supplier (15.5%). It is currently building a new CCGT. This will increase the percentage of its
62. The decision for referral of the matter to the Court of Justice
has been taken by the College of Commissioners in January
2012 (see IP 12/52). In concrete terms, the Commission
considers that, in violation of EU gas rules, the maximum
interconnection capacity is not offered in the UK and Ireland
as the pipeline connecting Northern Ireland and Ireland is not
open to the market. This means that gas companies in Ireland
cannot directly trade gas with Northern Ireland or vice versa.
On the pipeline connecting Scotland to Northern Ireland short-
term services are not available and neither is virtual reverse
flow capacity based on netting off physical forward flow to
make capacity available for commercial trade as required by
EU legislation. However, following the decision, the national
authorities have taken some steps towards complying with EU
law and the Commission is overseeing progress in this respect.
63. This figure does not include the capacity of interconnectors or
wind generation.
capacity and reduce that of the ESB’s. The regulators require the ESB to offer a certain number of directed contracts to reduce the level of market concentration.
With regard to market integration, day-ahead market coupling between the SEM and the wholesale electricity market in Great Britain is being considered. The SEM pool is the common and mandatory wholesale electricity spot market. The average wholesale day-ahead price in Ireland in 2011 for baseload power was EUR 62.0/MWh64 (14.8% higher than in 2010) and 34 TWh were traded (compared to 35 TWh for the SEM area).
3.2. Gas: Irish gas imports (exclusively coming from the UK) amounted to 5.1 bcm in 2010, accounting for 93% of national consumption. Most of this is used to generate electricity. Indigenous production accounts for around 7% of electricity generation, while the rest is imported from the UK through two interconnectors. As a result, wholesale prices are closely linked to the United Kingdom’s NBP hub. BGE dominates the Irish wholesale market. The CER traditionally regulated BGE’s tariffs, but this changed in October 2010 for large customers, who now have access to an unregulated tariff. There are some new entrants in the different segments of the wholesale market focusing on large customers. They tend to use BGE’s regulated tariff as a benchmark.
4. Retail markets
4.1. Electricity: There are eight suppliers in the retail electricity market. The state-owned ESB (Electric Ireland as of 2012) supplies most domestic customers. By the end of 2011, it accounted for 57% of domestic electricity consumption, BGE for 23% and Airtricity for 20%. In 2010, the annual switching rate in the whole retail market was very high. At over 28%, it was one of the highest switching rates ever seen in Europe, with 40% of domestic customers having switched between 2009 and April 2011. The annual switching rate was 15% in 2011. End user prices are not regulated. Power prices for industrial customers were more volatile than household prices. The industrial price decreased after 2008. This appears to be linked to the economic slowdown. Network costs accounted for 29% of the power price for Irish industrial customers (before taxes) in the second half of 2010, while energy and supply costs accounted for 71%. Based on a positive cost-benefit analysis, the CER has developed national roll-out scenarios for electricity and gas smart meters. In June 2012, it published its decision on proceeding to the next phase of the smart metering project.
64. For a comparison with wholesale prices in neighbouring countries,
please refer to Table 9 of this Staff Working Document, part II.

EN
ER
GY
M
AR
KE
TS
I
N
TH
E
EU
RO
PE
AN
U
NI
ON
I
N
20
11
/
8
0
I R E L A N D
4.2. Gas: Historically, BGE has dominated the Irish retail market. Traditionally, it supplied energy to 97% of residential customers. However, in May 2010 a new supplier, Airtricity, entered the market. There was a large increase in the number of customers who switched supplier as a result. In April 2011, Electric Ireland also entered the gas market. By the end of 2011, BGE had 73% (~78% GWhs) of gas domestic customers, Airtricity had 19% (17.4% GWhs), Flogas had 4% and Electric Ireland had 4%. Tariffs for BGE customers are still regulated. End user prices are not regulated for those who consume between 5.5 GWh and 264 GWh. Gas prices for final consumers dropped after 2008 for both households and industry, but the price for households took some time to respond. In general, as Ireland sources gas from the UK, the Irish gas commodity price is determined by changes in the UK price. Domestic taxation also affected the price.
4.3. Consumers: Irish consumers score the performance of their retail electricity and gas markets above the EU average (6th place out of 27 and 7th place out of 23, respectively). In both markets, switching rates and ease of switching are the second highest of all EU countries65. The CER has implemented an accreditation framework for independently run private online price comparison services. It acts as a single contact point for consumers by giving them information on electricity and gas. It also acts as a dispute resolution body. Irish legislation introduced the concept of vulnerable consumers in 2004 for electricity and in 2005 for gas. Recently transposed legislation ensures that energy
65. 8th Consumer Markets Scoreboard, 2012, European Commission,
DG SANCO, http://ec.europa.eu/consumers/consumer_research/
editions/cms8_en.htm
is supplied to these two categories of household: households that are critically dependent on electrically powered equipment, which includes life-protecting devices and medical equipment, and households that are particularly vulnerable if disconnected during the winter on account of advanced age or poor health.
5. Infrastructure
5.1. Electricity: The East-West Interconnector between Ireland and the UK was inaugurated on 20 September 2012 and doubles the interconnection capacity between the two systems. The project for establishing a second high-capacity connection between Northern Ireland and Ireland is at an advanced planning stage. Alongside these projects, work on the transmission grid in Ireland aims to improve the grid configuration in order to integrate generation from renewable sources, mainly from wind parks. All of this greatly helps to improve the security of supply to Ireland, while making the grid flexible and reliable.
5.2. Gas: There are no plans to develop gas connections with the UK or the continent in the near future. However, the Corrib gas field is expected to commence production early in 2015. Work on the first LNG terminal in Shannon is progressing slowly and the terminal could be operational in 2017. These two projects can play an important role in improving the security of supply and fostering competition.
C H A R T S 3 A N D 4
Electricity - Retail prices in Ireland (in €/kWh)
H O U S E H O L D S I N D U S T R Y
VAT Other taxes Net price
2004 2005 2006 2007 2008 2009 2010 2011 2004 2005 2006 2007 2008 2009 2010 20110.00
0.05
0.10
0.15
0.20
0.25
Source: Eurostat
Natural gas - Retail prices in Ireland (in euro cent/kWh)
H O U S E H O L D S I N D U S T R Y
VAT Other taxes Net price
2005 2006 2007 2008 2009 2010 2011 2007 2008 2009 2010 20110
1
2
3
7
6
5
4

EN
ER
GY
M
AR
KE
TS
I
N
TH
E
EU
RO
PE
AN
U
NI
ON
I
N
20
11
/
8
1
I R E L A N D
I R E L A N D – K E Y I N D I C ATO R S O F T H E E L E C T R I C I T Y A N D N AT U R A L G A S M A R K E T S
E L E C T R I C I T Y G A S
Number of companies representing at least 95% of net power generation 8 Number of entities bringing natural gas into country 13
Number of main power-generation companies (1) 6 Number of main gas entities (4) 6
Market share of the largest power-generation company 34.0% Market share of the largest entity bringing natural gas 36.3%
Number of electricity retailers 8 Number of retailers selling natural gas to final customers 8
Number of main electricity retailers (2) 5 Number of main natural gas retailers (5) 5
Switching rates (entire electricity retail market) N/A Switching rates for gas (entire retail market) N/A
Regulated prices for households – electricity N/A Regulated prices for households – gas N/A
Regulated prices for non-households – electricity N/A Regulated prices for non-households – gas N/A
HHI in power-generation market (3) 1 150 HHI in gas supply market (3) 6 009
HHI in electricity retail market (3) appr. 2 200 HHI in gas retail market (3) 4 500
Electricity market value (bn €) (6) N/A Gas market value (bn €) (6) N/A
Sources: Eurostat, CEER, National Regulatory Authority, EC calculations.
(1) Companies are considered as ‘main’ if they produce at least 5% of the national net electricity generation.
(2) Retailers are considered as ‘main’ if they sell at least 5% of the total national electricity consumption.
(3) The HHI (Herfindahl-Hirschman Index) is a commonly accepted measure of market concentration. It is calculated by squaring the market share
of each firm competing in the market and then summing the resulting numbers (the higher the index, the more concentrated the market).
Moderate concentration: 750-1 800; high concentration: 1 800-5 000; very high concentration: above 5 000.
(4) Entities are considered as ‘main’ if they deal with at least 5% of the natural gas (indigenous production or import).
(5) Retailers are considered as ‘main’ if they sell at least 5% of the total natural gas consumed by final customers.
(6) Market value is an estimation of the size of the retail electricity and gas markets. It is calculated using data on electricity and gas consumption
in the household and non-household sectors and annual average retail prices.

EN
ER
GY
M
AR
KE
TS
I
N
TH
E
EU
RO
PE
AN
U
NI
ON
I
N
20
11
/
8
2
1. General overview
Oil and petroleum products represented 53.2% of Greece’s energy consumption mix in 2010, followed by solid fuels (27.8%), natural gas (11.4%) and renewables (7.6%) (Chart 1). Power is mainly produced from solid fuels (Chart 2). Greece’s 2020 renewable target indicator66 increased from 7.2% (2006) to 9.2% (2010), and it aims to reach 18% by 2020. The share of cogeneration67 was 4.3% in 2010, which is a significant increase compared to the share of 1.7% in 2005.
2. Regulatory framework
2.1. General: As Greece had notified full transposition of the Third Energy Package Directives by the end of September 2011, no infringement proceedings for non-transposition have been opened. Two infringement procedures are still open on the Second Energy Package concerning: i) lack of transparency of conditions for access to the natural gas transmission network and ii) regulated prices for non-household customers for electricity.
2.2. National Energy Regulator: The Regulatory Authority for Energy (RAE), established in 1999, operates with 88 staff and a budget of EUR 8.3 million (2010). The Third Energy Package transposition law provides for stronger independence of the RAE. However, in practice, RAE’s autonomy in implementing the allocated budget, as planned under the transposition law, is severely compromised by the austerity measures that affect
66. This is the share of renewables in Gross Final Energy Consumption.
67. The share of electricity produced in combined heat and power
plants (CHP).
Key Issues
→ With regard to electricity, Greece should pursue efforts to develop a competitive and open electricity market. This should include phasing-out blanket price regulation until June 2013, also for household customers, while taking into account universal service obligation and effective protection of vulnerable customers, in line with the roadmap adopted by the Greek government, introducing measures to increase competition, developing a power exchange, improving the efficiency of the incumbent company PPC and reforming the renewables system.
→ With regard to gas, Greece should step up efforts to facilitate a functioning wholesale market in particular through integration with neighbouring Member States and setting up a spot market. Greece should foster competition at the retail level to allow customers to switch suppliers. A first step in this direction would be to end exclusive rights of regional gas suppliers. Non-discriminatory allocation of capacity on the interconnectors is a further precondition to boost competition on the Greek gas market. In light of its geographical location, Greece should play a leading role in the southern and central European gas market. It should facilitate cross-regional projects aiming at market integration and diversification of supply sources.
GREECE
C H A R T S 1 A N D 2
Gross inland consumption (as % of total Mtoe) - 2010
Crude oil and petroleum products 53.2%
Natural gas11.4%
Renewables7.6%
Solid fuels27.8%
Total Mtoe: 28.84
Gross electricity generation (as % of TWh) - 2010
Crude oiland petroleum
products10.6%
Natural gas17.1%
Renewables18.4%
Solid fuels53.7%
Other 0.2%
Total TWh: 57.39
Source: Eurostat

EN
ER
GY
M
AR
KE
TS
I
N
TH
E
EU
RO
PE
AN
U
NI
ON
I
N
20
11
/
8
3
G R E E C E
all public administrations in Greece. RAE has not been allowed to fill vacant posts, despite the fact that in the last two years, more than a third of RAE’s scientific personnel has sought employment elsewhere. Half of this group has left, after their salaries were cut by over 50% in many cases. This situation is starting to impact on RAE’s ability to fulfil its tasks.
2.3. Unbundling: ADMIE, the newly established TSO in electricity, is a wholly owned subsidiary of the incumbent electricity company PPC S.A., which in turn is majority owned by the Greek State68. The incumbent TSO in the gas sector is DESFA, which operates both the national grid and the Revithoussa LNG terminal. DESFA belongs to DEPA, which is majority state-owned. The Greek energy law provides for an ITO solution for the electricity TSO and either ownership unbundling or ITO for the gas TSO69. The certification process is ongoing. Regarding distribution, an electricity DSO, DEDDIE, has been recently established, which is wholly owned by PPC. Legal and functional unbundling have been implemented; the network assets, however, still belong to PPC. In gas, Greece is still developing its market and therefore applies derogations, including from market opening and unbundling, for the establishment of gas distribution companies.
3. Wholesale markets
3.1. Electricity: Regarding generation, PPC S.A. accounts for 75% of total electricity production, which is a pronounced decrease from almost 100% in 2009. Independent producers achieved a share of 20%, mostly from the use of gas-fired power generation (Elpedison 8.9%, Mytilinaios 5.6% and Heron Thermoelectric 5.3%). The wholesale market is also still highly concentrated, but some competition is emerging. 2010 was a significant year for the Greek wholesale electricity market as a market design reform was completed, which introduced a distinction between day-ahead markets and balancing mechanisms, as is the case in other countries with mandatory pools70. Market integration with neighbouring markets remains very low and consequently price differentials with neighbouring countries are high: the 2011 annual average wholesale price in Greece was EUR 59.36/MWh (corresponding
68. Greece has to privatise parts of its shares in PPC in the coming
months.
69. The final unbundling solution in gas depends on the way DEPA will
be privatised, i.e. as an integrated company or in an unbundled way.
70. In the Greek mandatory pool, all power trading is compulsorily
carried out through the pool, LAGIE, the new market operator
(as opposed to bilateral trading between buyers and sellers on
other markets).
to a 30% increase compared to 2010), which is above most wholesale prices in the EU71.
3.2. Gas: Greece imports its entire gas demand. In 2010, 3.9 bcm of natural gas were imported with 52% coming from Russia, 31% from Algeria and 17% from Turkey. Until 2010, the Greek wholesale market for gas was foreclosed due to incumbent DEPA’s exclusive rights for imports, transmission and supply. However, at the beginning of 2010, Greece introduced third-party access to the transmission grid and to the Revithoussa LNG Terminal. This allowed the first non-DEPA gas imports via the Revithoussa Terminal in May 2010, de facto opening up the Greek market. Despite this positive development, there is still no functioning wholesale market and there is no spot market. Consumers who want to have access to gas without contracting with DEPA need to make a bilateral contract with a supplier of LNG and book capacity in the LNG terminal separately. RAE has taken the first steps towards more transparency on the gas market by publishing data on a monthly basis on the weighted-average import price of natural gas into the National Natural Gas System (NNGS).
4. Retail markets
4.1. Electricity: The retail market remained highly concentrated in 2010. Only about 7% of industrial and commercial customers connected to the medium voltage network switched supplier (a volume of 8.42%)72. Switching by customers connected to the low-voltage market (including all household and smaller commercial customers) remained insignificant due to limited competition and price regulation below cost-reflective levels. By the end of 2011, nearly 6.18% of industrial and commercial customers connected to the medium voltage network had switched supplier. The percentage in the low-voltage market segment, by number of eligible meter points, was around 2% for household customers and 2.4% for small industry customers.
Power prices for households increased in 2010 and in 2011, mainly due to a sharp rise in VAT and other taxes, but also as a consequence of adjustments in regulated tariffs to bring them more in line with costs. From 2009
71. For a comparison with wholesale prices in neighbouring countries,
please refer to Table 9 of this Staff Working Document, part II.
72. At the beginning of 2012, the licenses of the two main
competitors of the incumbent supplier, PPC, were suspended
following criminal investigations and the freezing of the bank
accounts of these suppliers.
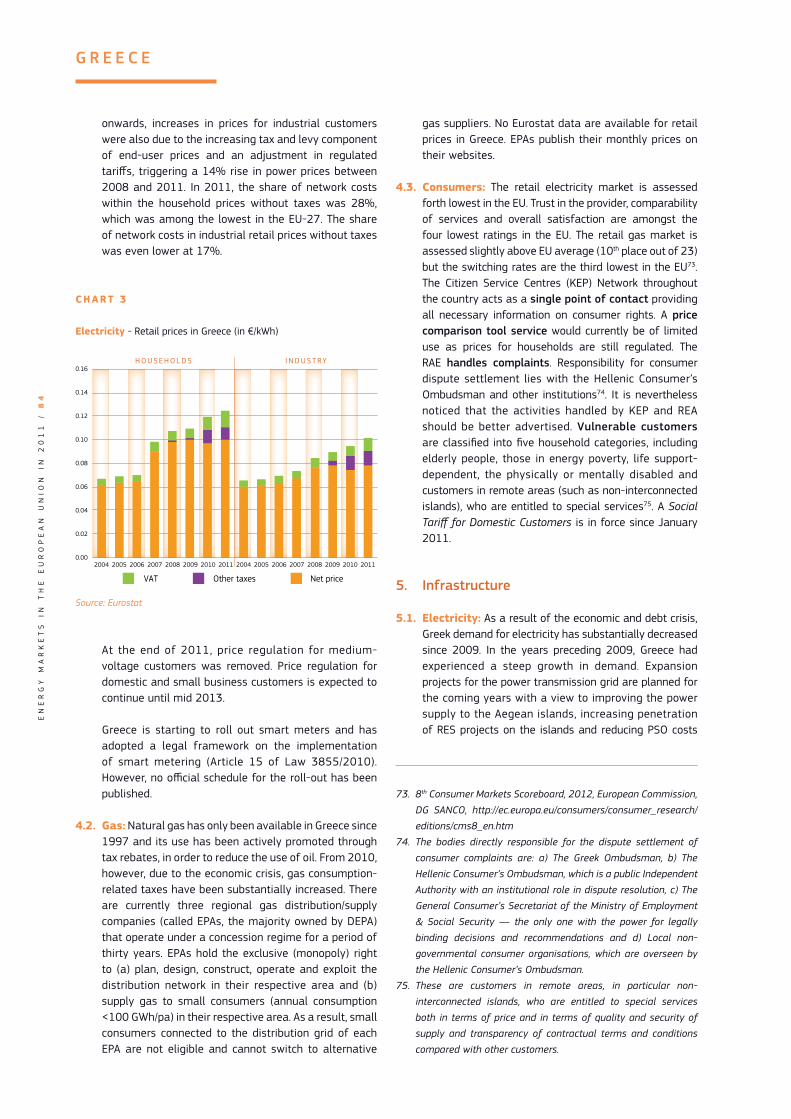
EN
ER
GY
M
AR
KE
TS
I
N
TH
E
EU
RO
PE
AN
U
NI
ON
I
N
20
11
/
8
4
G R E E C E
onwards, increases in prices for industrial customers were also due to the increasing tax and levy component of end-user prices and an adjustment in regulated tariffs, triggering a 14% rise in power prices between 2008 and 2011. In 2011, the share of network costs within the household prices without taxes was 28%, which was among the lowest in the EU-27. The share of network costs in industrial retail prices without taxes was even lower at 17%.
C H A R T 3
Electricity - Retail prices in Greece (in €/kWh)
H O U S E H O L D S I N D U S T R Y
VAT Other taxes Net price
2004 2005 2006 2007 2008 2009 2010 2011 2004 2005 2006 2007 2008 2009 2010 20110.00
0.02
0.04
0.06
0.08
0.10
0.12
0.14
0.16
Source: Eurostat
At the end of 2011, price regulation for medium-voltage customers was removed. Price regulation for domestic and small business customers is expected to continue until mid 2013.
Greece is starting to roll out smart meters and has adopted a legal framework on the implementation of smart metering (Article 15 of Law 3855/2010). However, no official schedule for the roll-out has been published.
4.2. Gas: Natural gas has only been available in Greece since 1997 and its use has been actively promoted through tax rebates, in order to reduce the use of oil. From 2010, however, due to the economic crisis, gas consumption-related taxes have been substantially increased. There are currently three regional gas distribution/supply companies (called EPAs, the majority owned by DEPA) that operate under a concession regime for a period of thirty years. EPAs hold the exclusive (monopoly) right to (a) plan, design, construct, operate and exploit the distribution network in their respective area and (b) supply gas to small consumers (annual consumption <100 GWh/pa) in their respective area. As a result, small consumers connected to the distribution grid of each EPA are not eligible and cannot switch to alternative
gas suppliers. No Eurostat data are available for retail prices in Greece. EPAs publish their monthly prices on their websites.
4.3. Consumers: The retail electricity market is assessed forth lowest in the EU. Trust in the provider, comparability of services and overall satisfaction are amongst the four lowest ratings in the EU. The retail gas market is assessed slightly above EU average (10th place out of 23) but the switching rates are the third lowest in the EU73. The Citizen Service Centres (KEP) Network throughout the country acts as a single point of contact providing all necessary information on consumer rights. A price comparison tool service would currently be of limited use as prices for households are still regulated. The RAE handles complaints. Responsibility for consumer dispute settlement lies with the Hellenic Consumer’s Ombudsman and other institutions74. It is nevertheless noticed that the activities handled by KEP and REA should be better advertised. Vulnerable customers are classified into five household categories, including elderly people, those in energy poverty, life support-dependent, the physically or mentally disabled and customers in remote areas (such as non-interconnected islands), who are entitled to special services75. A Social Tariff for Domestic Customers is in force since January 2011.
5. Infrastructure
5.1. Electricity: As a result of the economic and debt crisis, Greek demand for electricity has substantially decreased since 2009. In the years preceding 2009, Greece had experienced a steep growth in demand. Expansion projects for the power transmission grid are planned for the coming years with a view to improving the power supply to the Aegean islands, increasing penetration of RES projects on the islands and reducing PSO costs
73. 8th Consumer Markets Scoreboard, 2012, European Commission,
DG SANCO, http://ec.europa.eu/consumers/consumer_research/
editions/cms8_en.htm
74. The bodies directly responsible for the dispute settlement of
consumer complaints are: a) The Greek Ombudsman, b) The
Hellenic Consumer’s Ombudsman, which is a public Independent
Authority with an institutional role in dispute resolution, c) The
General Consumer’s Secretariat of the Ministry of Employment
& Social Security — the only one with the power for legally
binding decisions and recommendations and d) Local non-
governmental consumer organisations, which are overseen by
the Hellenic Consumer’s Ombudsman.
75. These are customers in remote areas, in particular non-
interconnected islands, who are entitled to special services
both in terms of price and in terms of quality and security of
supply and transparency of contractual terms and conditions
compared with other customers.
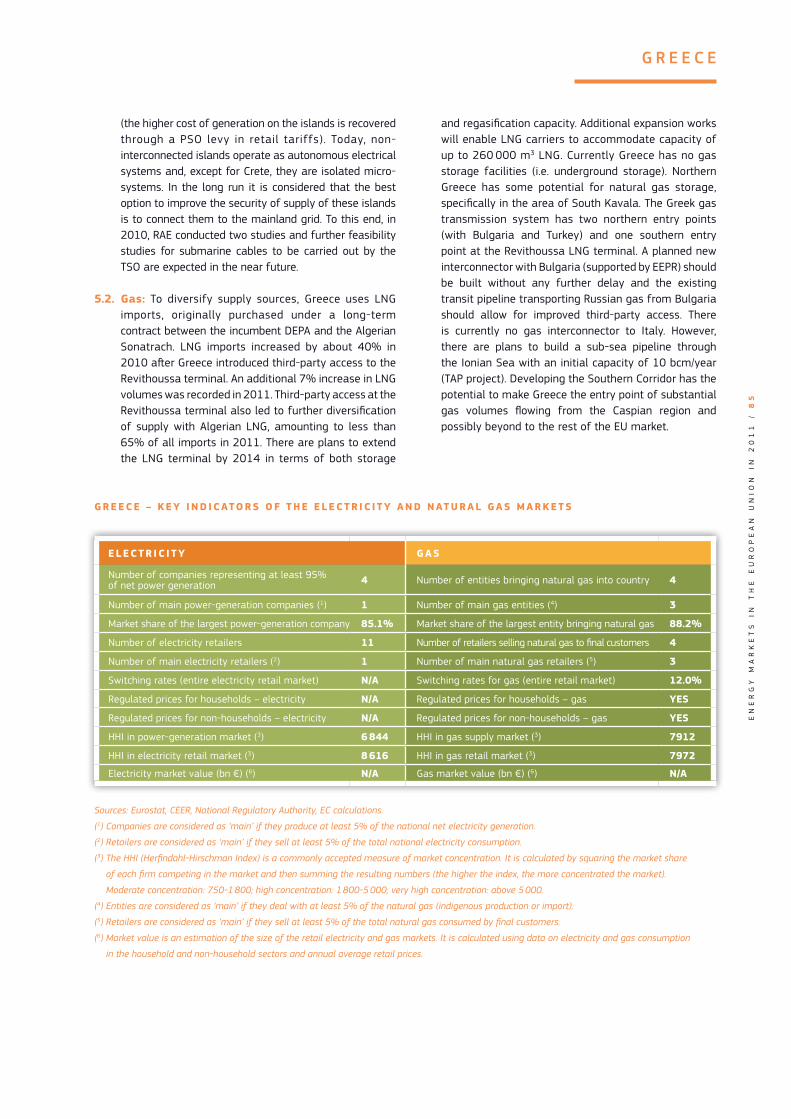
EN
ER
GY
M
AR
KE
TS
I
N
TH
E
EU
RO
PE
AN
U
NI
ON
I
N
20
11
/
8
5
G R E E C E
(the higher cost of generation on the islands is recovered through a PSO levy in retail tariffs). Today, non-interconnected islands operate as autonomous electrical systems and, except for Crete, they are isolated micro-systems. In the long run it is considered that the best option to improve the security of supply of these islands is to connect them to the mainland grid. To this end, in 2010, RAE conducted two studies and further feasibility studies for submarine cables to be carried out by the TSO are expected in the near future.
5.2. Gas: To diversify supply sources, Greece uses LNG imports, originally purchased under a long-term contract between the incumbent DEPA and the Algerian Sonatrach. LNG imports increased by about 40% in 2010 after Greece introduced third-party access to the Revithoussa terminal. An additional 7% increase in LNG volumes was recorded in 2011. Third-party access at the Revithoussa terminal also led to further diversification of supply with Algerian LNG, amounting to less than 65% of all imports in 2011. There are plans to extend the LNG terminal by 2014 in terms of both storage
and regasification capacity. Additional expansion works will enable LNG carriers to accommodate capacity of up to 260 000 m3 LNG. Currently Greece has no gas storage facilities (i.e. underground storage). Northern Greece has some potential for natural gas storage, specifically in the area of South Kavala. The Greek gas transmission system has two northern entry points (with Bulgaria and Turkey) and one southern entry point at the Revithoussa LNG terminal. A planned new interconnector with Bulgaria (supported by EEPR) should be built without any further delay and the existing transit pipeline transporting Russian gas from Bulgaria should allow for improved third-party access. There is currently no gas interconnector to Italy. However, there are plans to build a sub-sea pipeline through the Ionian Sea with an initial capacity of 10 bcm/year (TAP project). Developing the Southern Corridor has the potential to make Greece the entry point of substantial gas volumes flowing from the Caspian region and possibly beyond to the rest of the EU market.
G R E E C E – K E Y I N D I C ATO R S O F T H E E L E C T R I C I T Y A N D N AT U R A L G A S M A R K E T S
E L E C T R I C I T Y G A S
Number of companies representing at least 95% of net power generation 4 Number of entities bringing natural gas into country 4
Number of main power-generation companies (1) 1 Number of main gas entities (4) 3
Market share of the largest power-generation company 85.1% Market share of the largest entity bringing natural gas 88.2%
Number of electricity retailers 11 Number of retailers selling natural gas to final customers 4
Number of main electricity retailers (2) 1 Number of main natural gas retailers (5) 3
Switching rates (entire electricity retail market) N/A Switching rates for gas (entire retail market) 12.0%
Regulated prices for households – electricity N/A Regulated prices for households – gas YES
Regulated prices for non-households – electricity N/A Regulated prices for non-households – gas YES
HHI in power-generation market (3) 6 844 HHI in gas supply market (3) 7912
HHI in electricity retail market (3) 8 616 HHI in gas retail market (3) 7972
Electricity market value (bn €) (6) N/A Gas market value (bn €) (6) N/A
Sources: Eurostat, CEER, National Regulatory Authority, EC calculations.
(1) Companies are considered as ‘main’ if they produce at least 5% of the national net electricity generation.
(2) Retailers are considered as ‘main’ if they sell at least 5% of the total national electricity consumption.
(3) The HHI (Herfindahl-Hirschman Index) is a commonly accepted measure of market concentration. It is calculated by squaring the market share
of each firm competing in the market and then summing the resulting numbers (the higher the index, the more concentrated the market).
Moderate concentration: 750-1 800; high concentration: 1 800-5 000; very high concentration: above 5 000.
(4) Entities are considered as ‘main’ if they deal with at least 5% of the natural gas (indigenous production or import).
(5) Retailers are considered as ‘main’ if they sell at least 5% of the total natural gas consumed by final customers.
(6) Market value is an estimation of the size of the retail electricity and gas markets. It is calculated using data on electricity and gas consumption
in the household and non-household sectors and annual average retail prices.

EN
ER
GY
M
AR
KE
TS
I
N
TH
E
EU
RO
PE
AN
U
NI
ON
I
N
20
11
/
8
6
1. General overview
The highest share in the energy mix came from crude oil and petroleum products. In the electricity mix, the shares were more equally divided between natural gas, renewables and nuclear energy. The share of renewable electricity was above 33%, mainly hydro and wind. In 2010 Spain was the country with the highest wind energy output in the EU (16%). As far as the 2020 goal is concerned, Spain’s national overall target is to achieve a share of 20% energy from renewable sources76. This share improved from 9.4% in 2006 to 13.8% in 2010. The share of cogeneration77 in the overall electricity production was 7.4% in 2010, being close to the share measured in 2005 (7.4%).
2. Regulatory framework
2.1. General: After the Commission launched an infringe-ment procedure for non-transposition in September 2011, Spain has notified full transposition of the Direc-tives of the Third Energy Package.
2.2. National Energy Regulator: The Spanish National Energy Regulatory Authority, Comisión Nacional de Energia (CNE), which has been in operation since 1998, employed 213 staff in 2010 with a budget of almost EUR 30 million. The CNE is a public body with its own legal personality and the capacity to act independently. In March 2012 the Spanish Government presented a proposal to merge the Spanish competition authority and various national sector regulatory bodies, including the energy regulator, into a single organisation. In the area of energy, Spain must ensure that the designated authority has the powers
76. The share of renewables in Gross Final Energy Consumption.
77. The share of electricity produced in combined heat and power
plants (CHP).
Key Issues
→ With regard to electricity, the aim is to eliminate the large tariff deficit, in particular by improving the cost efficiency of electricity supply, as recommended by the Council. This process should be accompanied by a phasing out of regulated tariffs for households, while taking into account universal service obligation and effective protection of vulnerable customers. Spain has one of the lowest levels of interconnection in the EU. It is particularly important to increase cross-border capacity with France and Portugal.
→ With regard to gas, the development of the Africa-Spain-France gas corridor and the establishment of a functioning Iberian gas hub (Mibgas) should be major priorities. They will foster competition between gas companies, increase the liquidity of the market, provide diversification, security of supply and a transparent wholesale price for gas. This process should be accompanied by a phasing out of regulated tariffs for households Also the interconnection capacity with Portugal should be reinforced. Spain should ensure the implementation of a transparent and non-discriminatory transmission tariff structure.
→ In view of the proposal to merge various regulators, Spain must ensure that the energy regulator retains its powers and fulfils the independence as required by the Third Energy Package.
SPAIN
C H A R T S 1 A N D 2
Gross inland consumption (as % of total Mtoe) - 2010
Crude oil and petroleum products 46.4%
Natural gas23.9%
Renewables11.5%
Solid fuels6.0%
Total Mtoe: 130.22
Nuclear12.2%
Gross electricity generation (as % of TWh) - 2010
Crude oiland petroleum products
6.0%
Natural gas32.2%
Other0.3%
Renewables33.2%
Solid fuels8.4%
Total TWh: 303.09
Nuclear20.5%
Source: Eurostat

EN
ER
GY
M
AR
KE
TS
I
N
TH
E
EU
RO
PE
AN
U
NI
ON
I
N
20
11
/
8
7
S P A I N
and duties required by the Directives of the Third Energy Package and that it fulfils the criteria for independence.
2.3. Unbundling: The TSO (transmission system operator) in electricity is Red Eléctrica de España (REE). In 2010 Endesa, Gas Natural Fenosa and EDP-Hidrocantábrico sold their remaining transmission assets to complete the process of establishing REE as the sole, ownership unbundled TSO. Following the recent sale of gas transmission assets to ENAGAS, the main gas TSO that possesses the majority of transmission network assets, CNE issued the final certification decisions, in line with the model of ownership unbundling, in July 2012. The electricity and gas DSOs (distribution system operators) are legally and functionally unbundled.
3. Wholesale markets
3.1. Electricity: In 2010 there were five major groups competing in the market at the generation level: Iberdrola (24.3%), Endesa (19.6%), Gas natural Fenosa (15%), EDP-Hidrocantábrico (5.3%) and E.On (3.5%). Furthermore, the overall share of generation in the so-called ‘special regime’ - RES (renewable energy sources) and CHP (combined heat and power) - of other groups amounted to 25.9%. Spanish and Portuguese day-ahead and intraday electricity markets have been fully integrated in MIBEL (Iberian electricity market) since July 2007. While interconnection capacity has been increasing significantly across the Pyrenees (from 3% to 6%), interconnection capacity between Spain and France is still scarce, limiting cross-border trade and undermining security of supply. In 2010 Spain was a net exporter of electricity, including to France. The degree of congestion in the Portuguese-Spanish interconnection has been strongly decreasing each year and in 2011 was at 9%. The energy traded in the power futures markets during 2011 amounted to 32.9 TWh in the OMIP market and 284.1 TWh in the OTC market, a total of 317 TWh (+12% compared to 2010). In 2011 the wholesale price for day-ahead baseload power was EUR 49.9/MWh on average (an increase of 35% compared to 2010)78. It was lower compared to many other EU countries because Spain has a very favourable electricity mix, which allows it to produce at lower costs (also taking advantage of mature renewable technologies). On the Iberian power exchange OMIE 182.29 TWh of day-ahead baseload power were traded in Spain in 2011 (72% of power consumption). The rest of energy was traded on the OMIE intraday market.
Spain should adopt strict measures to eliminate the tariff deficit. The measures adopted in March 2012 included
78. For a comparison with wholesale prices in neighbouring countries,
please refer to Table 9 of this Staff Working Document, part II.
reducing regulated costs in the electricity sector and an increase in tariffs. Further increases in taxes related to electricity generation and consumption of fossil fuels were proposed in September 2012. However, these measures should be followed up by further reform of the energy sector to improve cost effectiveness of electricity generation and supply activities and provide a stable and certain legal framework for investors. The reform of the electricity sector should include the gradual phasing out of the regulated tariff system. Moreover, market rules must incentivise decentralised generation, while a renewables support scheme should be adapted in a predictable way, with the view to reflect falling production costs and learning curve gains. The infrastructure investment plan must be revised to reflect updated supply and demand forecasts in order to avoid underutilising assets.
3.2. Gas: In 2010 Spain imported 36.7 bcm of natural gas to satisfy its entire consumption. The three main supplier countries were Algeria (33%), Nigeria (20%) and Qatar (16%). Typical for Spain is a wide diversification of sources (up to 14 countries) and high import capacities for LNG (76% of imported gas in 2010 was LNG and the rest was pipeline gas). No reference wholesale price can be given because there is no organised hub. However, based on monthly average import prices, an annual average of EUR 18.5/MWh for imported gas is estimated for 2010. Compared to EUR 19.0/MWh on the French hub PEG Sud, this appears to be a reasonable estimate, as Spain can take advantage of the variety of its sources and its proximity to the North African gas fields.
In the absence of a gas hub, most of the wholesale trade materialises through bilateral OTC transactions that are reported to the TSO balancing platform with high liquidity. Traded volumes reached 1004.7 TWh, while consumption was around 400 TWh.
A postitive development is the publication by CNE in April 2010 of a roadmap to develop a gas hub (Mibgas) in the for the Spanish and Portuguese markets with a view to promoting greater transparency and competition in the wholesale market79. This roadmap should be implemented without delay.
4. Retail markets
4.1. Electricity: Spanish consumers’ rating of the performance of their retail electricity market is the second lowest of all EU countries in terms of trust in providers and comparability. The retail gas market scores below the EU average on most indicators, such as trust, comparability,
79. The establishment by CNE of transparent cost-oriented and
non-discriminatory transmission tariffs should be dealt with as
a priority.

EN
ER
GY
M
AR
KE
TS
I
N
TH
E
EU
RO
PE
AN
U
NI
ON
I
N
20
11
/
8
8
S P A I N
overall satisfaction and choice80. Market concentration at retail level has not changed significantly, but each supplier’s share of the liberalised market has changed as Endesa decreased its share to the benefit of Iberdrola. The majority of Spanish consumers (almost 20.8 million out of 27.7 million) are still supplied by last-resort suppliers at regulated tariffs. Endesa and Iberdrola account for around 80% of these customers. Nonetheless, all consumers in Spain can freely choose their electricity supplier. There has been a significant and steady increase in the observed switching rate (from 5.2% in 2009 to 7.4% in 2010 and 10.6% in 2011). More than 70% of all switches correspond to movements from the last-resort tariff to the free market. In the period from July 2009 to December 2011, around 4 million customers switched from last-resort supply to the liberalised market, as the result of a stimulation policy which introduced a fee on top of the last resort tariff. However, there is still a gap between tariff incomes and regulated costs, causing a tariff deficit.
Power prices for households increased considerably between 2008 and 2011. From July 2009 to July 2012, grid charges increased by 25%, and the energy component by 28%. The industrial price increase was more moderate. In 2011, the share of network costs81 in the household price (without taxes) accounted for 45%, while energy and supply costs accounted for 55%. In the case of industrial electricity prices, the proportions were 30% and 70% respectively. End-user price regulation exists for households below 10 kW of contracted capacity (the aforementioned last-resort tariff).
80. European Consumer Markets Monitoring Surveys,
http://ec.europa.eu/consumers/strategy/cons_satisfaction_en.htm
81. In the case of Spain Eurostat takes into account the costs arising from
renewables support schemes among the network costs, whereas costs
of renewable support schemes are normally included among taxes.
Spain has not published a cost-benefit analysis of smart meters. Nevertheless, its 2007 substitution plan for end-users up to 15 kW calls for a full rollout of smart meters by the end of 2018. Large-scale deployment of smart meters has started.
4.2. Gas: By the end of 2010, approximately 4.2 million consumers were supplied at a free market price (58% of all consumers). In all, 834 115 customers have switched, more than double the number in 2009. The gas switching rate is very high, increasing from 11.6% of customers in 2010 to 19.5% in 2011.
Gas prices, as reported by Eurostat for reference customers, decreased after 2008 for households and industry, reflecting a similar pattern in global oil and gas markets. End-user price regulation exists for households only and not for industrial consumers. Regulated tariffs apply to households consuming less than 50 000 kWh/year and connected to a network at a pressure below 4 bars.
4.3. Consumers: Spanish consumers rate the performance of their retail electricity market third lowest of all EU countries. The scores on trust in providers and comparability are second lowest in the EU while the incidence of problems and consumer complaints are second and third highest, respectively. The retail gas market is ranked third lowest in the EU, with the highest incidence of consumer complaints across EU countries82. This is most likely linked to aggressive
82. 8th Consumer Markets Scoreboard, 2012, European Commission,
DG SANCO, http://ec.europa.eu/consumers/consumer_research/
editions/cms8_en.htm
C H A R T S 3 A N D 4
Electricity - Retail prices in Spain (in €/kWh)
H O U S E H O L D S I N D U S T R Y
VAT Other taxes Net price
2004 2005 2006 2007 2008 2009 2010 2011 2005 2006 2007 2008 2009 2010 20110.00
0.05
0.10
0.15
0.20
0.25
Source: Eurostat
Natural gas - Retail prices in Spain (in euro cent/kWh)
H O U S E H O L D S I N D U S T R Y
VAT Other taxes Net price
2005 2006 2007 2008 2009 2010 2011 2005 2006 2007 2008 2009 2010 20110
1
2
3
7
5
6
4

EN
ER
GY
M
AR
KE
TS
I
N
TH
E
EU
RO
PE
AN
U
NI
ON
I
N
20
11
/
8
9
S P A I N
(and sometimes fraudulent) marketing sales practices denounced by consumers associations. Since 2011, CNE provides an on-line price comparability tool for electricity and gas prices as well as information on the rights of customers, complaints procedures, suppliers and prices of the offers on the market. There is no single contact point in place. CNE has recently been asked to ‘report, attend to and process consumers´ complaints, in coordination with competent regional and local Administrations. CNE also settles disputes related to access to the grid. Electricity and gas suppliers can join the ‘Juntas arbitrales de consumo’, which acts as the alternative dispute resolution scheme and is managed by the regional administration. However, only a few companies participate in this scheme. Since 2009, social laws classify vulnerable electricity customers in three household categories: (i) large families; (ii) pensioners (over 60, with low-income); and (iii) households where all members are unemployed.
5. Infrastructure
5.1. Electricity: Power generation capacity (100 GW) in Spain by far outweighs the country’s current peak demand (44 GW). Strong government support for renewables generation in combination with the sudden and deep economic crisis have led to this situation of overcapacity. In terms of cross-border transmission capacity, Spain is
increasingly well connected to Portugal but congestions still occur. Cross-border capacity was increased in 2011 and projects are planned to further increase available capacities up to 3 000 MW in 2015. The capacity on the French border, which is still allocated via an explicit auction, is much lower (around 3% of the peak demand). Spain and France are developing the Baixas (FR) — Santa Llogaia (ES) interconnector, which should become operational in 2014. The EU is supporting the project in the context of the EEPR and EUR 225 million have been granted to the Spanish (REE) and French (RTE) TSOs for its construction.
5.2. Gas: Spain has six LNG terminals and a seventh will be ready for use in 2013. The transmission system is connected to Algeria and France via pipelines. In April 2011, the 8 bcm Medgaz pipeline between Spain and Algeria entered into operation. Spain is reinforcing its level of interconnection with France, in particular at the Biriatiu and Larrau points (with support of EUR 45 million from the EEPR programme), which should be operational by 2013-2014. Further increases of capacity with France and Portugal should be considered to promote the export of gas to neighbouring countries and develop a liquid and competitive regional gas market in South-West Europe. Spain has 3 underground gas storage sites (Serrablo, Yela and, since 2012, Marismas) that are an important source of flexibility and security of supply. Two further underground storage sites (Yela and Castor) are under construction.
S PA I N – K E Y I N D I C ATO R S O F T H E E L E C T R I C I T Y A N D N AT U R A L G A S M A R K E T S
E L E C T R I C I T Y G A S
Number of companies representing at least 95% of net power generation N/A Number of entities bringing natural gas into country 18
Number of main power-generation companies (1) 4 Number of main gas entities (4) 5
Market share of the largest power-generation company 24.0% Market share of the largest entity bringing natural gas 43.7%
Number of electricity retailers 202 Number of retailers selling natural gas to final customers 32
Number of main electricity retailers (2) 4 Number of main natural gas retailers (5) 6
Switching rates (entire electricity retail market) 7.4% Switching rates for gas (entire retail market) 11.6%
Regulated prices for households – electricity YES Regulated prices for households – gas YES
Regulated prices for non-households – electricity NO Regulated prices for non-households – gas NO
HHI in power-generation market (3) 1 361 HHI in gas supply market (3) 2 445
HHI in electricity retail market (3) 2 543 HHI in gas retail market (3) 1 932
Electricity market value (bn €) (6) 31.806 Gas market value (bn €) (6) 16.028
Sources: Eurostat, CEER, National Regulatory Authority, EC calculations.
(1) Companies are considered as ‘main’ if they produce at least 5% of the national net electricity generation.
(2) Retailers are considered as ‘main’ if they sell at least 5% of the total national electricity consumption.
(3) The HHI (Herfindahl-Hirschman Index) is a commonly accepted measure of market concentration. It is calculated by squaring the market share
of each firm competing in the market and then summing the resulting numbers (the higher the index, the more concentrated the market).
Moderate concentration: 750-1 800; high concentration: 1 800-5 000; very high concentration: above 5 000.
(4) Entities are considered as ‘main’ if they deal with at least 5% of the natural gas (indigenous production or import).
(5) Retailers are considered as ‘main’ if they sell at least 5% of the total natural gas consumed by final customers.
(6) Market value is an estimation of the size of the retail electricity and gas markets. It is calculated using data on electricity and gas consumption
in the household and non-household sectors and annual average retail prices.
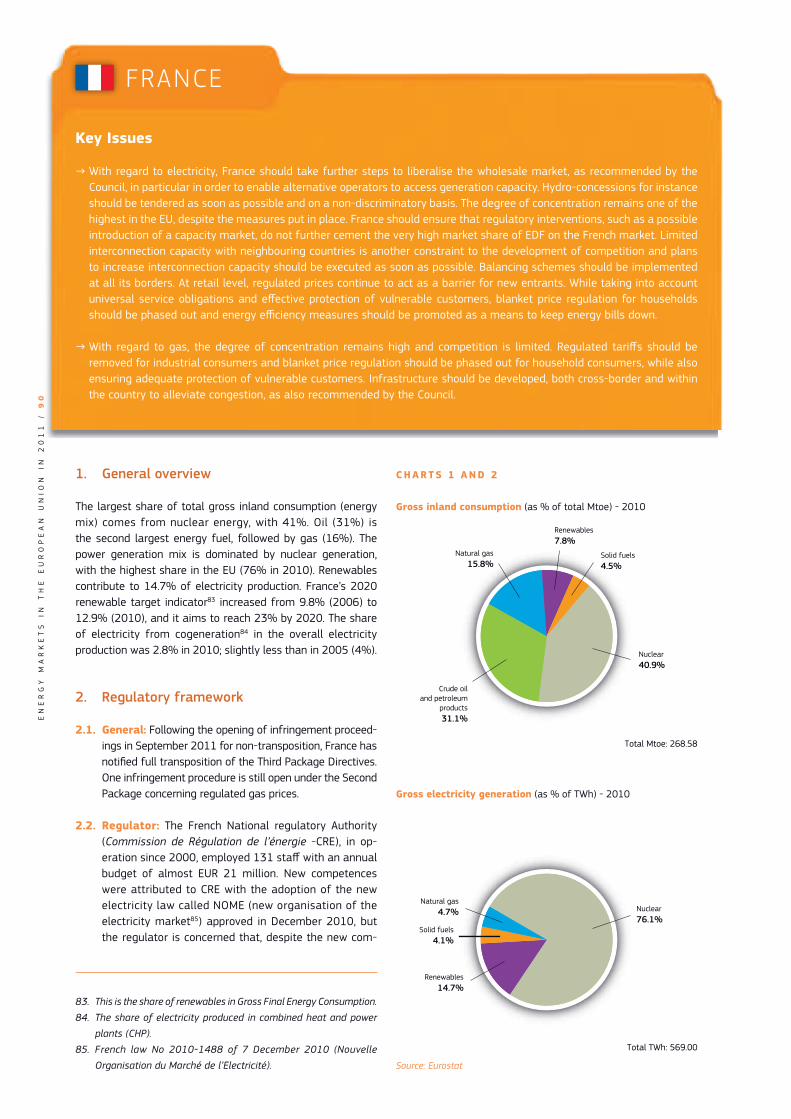
EN
ER
GY
M
AR
KE
TS
I
N
TH
E
EU
RO
PE
AN
U
NI
ON
I
N
20
11
/
9
0
1. General overview
The largest share of total gross inland consumption (energy mix) comes from nuclear energy, with 41%. Oil (31%) is the second largest energy fuel, followed by gas (16%). The power generation mix is dominated by nuclear generation, with the highest share in the EU (76% in 2010). Renewables contribute to 14.7% of electricity production. France’s 2020 renewable target indicator83 increased from 9.8% (2006) to 12.9% (2010), and it aims to reach 23% by 2020. The share of electricity from cogeneration84 in the overall electricity production was 2.8% in 2010; slightly less than in 2005 (4%).
2. Regulatory framework
2.1. General: Following the opening of infringement proceed-ings in September 2011 for non-transposition, France has notified full transposition of the Third Package Directives. One infringement procedure is still open under the Second Package concerning regulated gas prices.
2.2. Regulator: The French National regulatory Authority (Commission de Régulation de l’énergie -CRE), in op-eration since 2000, employed 131 staff with an annual budget of almost EUR 21 million. New competences were attributed to CRE with the adoption of the new electricity law called NOME (new organisation of the electricity market85) approved in December 2010, but the regulator is concerned that, despite the new com-
83. This is the share of renewables in Gross Final Energy Consumption.
84. The share of electricity produced in combined heat and power
plants (CHP).
85. French law No 2010-1488 of 7 December 2010 (Nouvelle
Organisation du Marché de l’Electricité).
Key Issues
→ With regard to electricity, France should take further steps to liberalise the wholesale market, as recommended by the Council, in particular in order to enable alternative operators to access generation capacity. Hydro-concessions for instance should be tendered as soon as possible and on a non-discriminatory basis. The degree of concentration remains one of the highest in the EU, despite the measures put in place. France should ensure that regulatory interventions, such as a possible introduction of a capacity market, do not further cement the very high market share of EDF on the French market. Limited interconnection capacity with neighbouring countries is another constraint to the development of competition and plans to increase interconnection capacity should be executed as soon as possible. Balancing schemes should be implemented at all its borders. At retail level, regulated prices continue to act as a barrier for new entrants. While taking into account universal service obligations and effective protection of vulnerable customers, blanket price regulation for households should be phased out and energy efficiency measures should be promoted as a means to keep energy bills down.
→ With regard to gas, the degree of concentration remains high and competition is limited. Regulated tariffs should be removed for industrial consumers and blanket price regulation should be phased out for household consumers, while also ensuring adequate protection of vulnerable customers. Infrastructure should be developed, both cross-border and within the country to alleviate congestion, as also recommended by the Council.
FRANCE
C H A R T S 1 A N D 2
Gross inland consumption (as % of total Mtoe) - 2010
Crude oiland petroleum
products31.1%
Natural gas15.8%
Renewables7.8%
Solid fuels4.5%
Total Mtoe: 268.58
Nuclear40.9%
Gross electricity generation (as % of TWh) - 2010
Natural gas4.7%
Renewables14.7%
Solid fuels4.1%
Total TWh: 569.00
Nuclear76.1%
Source: Eurostat
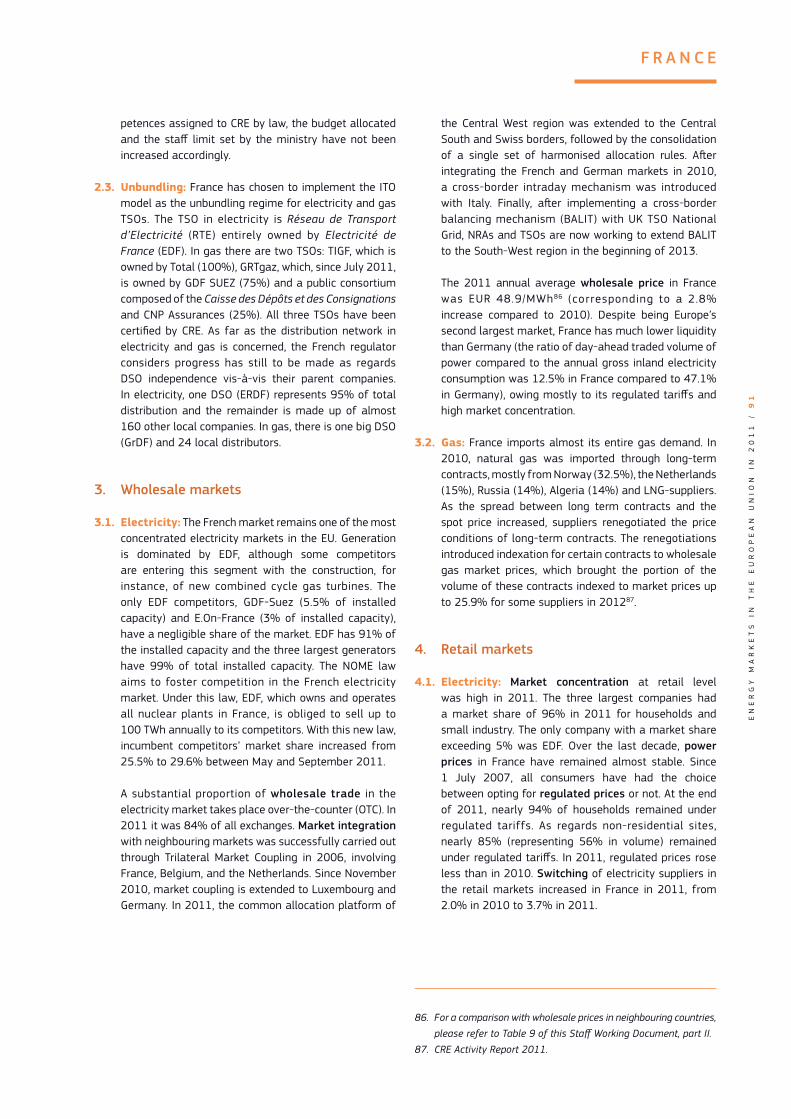
EN
ER
GY
M
AR
KE
TS
I
N
TH
E
EU
RO
PE
AN
U
NI
ON
I
N
20
11
/
9
1
F R A N C E
petences assigned to CRE by law, the budget allocated and the staff limit set by the ministry have not been increased accordingly.
2.3. Unbundling: France has chosen to implement the ITO model as the unbundling regime for electricity and gas TSOs. The TSO in electricity is Réseau de Transport d’Electricité (RTE) entirely owned by Electricité de France (EDF). In gas there are two TSOs: TIGF, which is owned by Total (100%), GRTgaz, which, since July 2011, is owned by GDF SUEZ (75%) and a public consortium composed of the Caisse des Dépôts et des Consignations and CNP Assurances (25%). All three TSOs have been certified by CRE. As far as the distribution network in electricity and gas is concerned, the French regulator considers progress has still to be made as regards DSO independence vis-à-vis their parent companies. In electricity, one DSO (ERDF) represents 95% of total distribution and the remainder is made up of almost 160 other local companies. In gas, there is one big DSO (GrDF) and 24 local distributors.
3. Wholesale markets
3.1. Electricity: The French market remains one of the most concentrated electricity markets in the EU. Generation is dominated by EDF, although some competitors are entering this segment with the construction, for instance, of new combined cycle gas turbines. The only EDF competitors, GDF-Suez (5.5% of installed capacity) and E.On-France (3% of installed capacity), have a negligible share of the market. EDF has 91% of the installed capacity and the three largest generators have 99% of total installed capacity. The NOME law aims to foster competition in the French electricity market. Under this law, EDF, which owns and operates all nuclear plants in France, is obliged to sell up to 100 TWh annually to its competitors. With this new law, incumbent competitors’ market share increased from 25.5% to 29.6% between May and September 2011.
A substantial proportion of wholesale trade in the electricity market takes place over-the-counter (OTC). In 2011 it was 84% of all exchanges. Market integration with neighbouring markets was successfully carried out through Trilateral Market Coupling in 2006, involving France, Belgium, and the Netherlands. Since November 2010, market coupling is extended to Luxembourg and Germany. In 2011, the common allocation platform of
the Central West region was extended to the Central South and Swiss borders, followed by the consolidation of a single set of harmonised allocation rules. After integrating the French and German markets in 2010, a cross-border intraday mechanism was introduced with Italy. Finally, after implementing a cross-border balancing mechanism (BALIT) with UK TSO National Grid, NRAs and TSOs are now working to extend BALIT to the South-West region in the beginning of 2013.
The 2011 annual average wholesale price in France was EUR 48.9/MWh86 (corresponding to a 2.8% increase compared to 2010). Despite being Europe’s second largest market, France has much lower liquidity than Germany (the ratio of day-ahead traded volume of power compared to the annual gross inland electricity consumption was 12.5% in France compared to 47.1% in Germany), owing mostly to its regulated tariffs and high market concentration.
3.2. Gas: France imports almost its entire gas demand. In 2010, natural gas was imported through long-term contracts, mostly from Norway (32.5%), the Netherlands (15%), Russia (14%), Algeria (14%) and LNG-suppliers. As the spread between long term contracts and the spot price increased, suppliers renegotiated the price conditions of long-term contracts. The renegotiations introduced indexation for certain contracts to wholesale gas market prices, which brought the portion of the volume of these contracts indexed to market prices up to 25.9% for some suppliers in 201287.
4. Retail markets
4.1. Electricity: Market concentration at retail level was high in 2011. The three largest companies had a market share of 96% in 2011 for households and small industry. The only company with a market share exceeding 5% was EDF. Over the last decade, power prices in France have remained almost stable. Since 1 July 2007, all consumers have had the choice between opting for regulated prices or not. At the end of 2011, nearly 94% of households remained under regulated tariffs. As regards non-residential sites, nearly 85% (representing 56% in volume) remained under regulated tariffs. In 2011, regulated prices rose less than in 2010. Switching of electricity suppliers in the retail markets increased in France in 2011, from 2.0% in 2010 to 3.7% in 2011.
86. For a comparison with wholesale prices in neighbouring countries,
please refer to Table 9 of this Staff Working Document, part II.
87. CRE Activity Report 2011.

EN
ER
GY
M
AR
KE
TS
I
N
TH
E
EU
RO
PE
AN
U
NI
ON
I
N
20
11
/
9
2
F R A N C E
4.2. Gas: Similarly to the electricity market, concentration at retail level in gas was high in 2011. The three largest companies had a market share of 95% in 2011 for households and small industry (86% of market share in volume). Consumers have had the choice between opting for regulated prices or not, since 1 July 2004 for non-household customers and 1 July 2007 for household customers. In 2011, 86% of residential sites and 58% of non-residential sites connected to the distribution network remained under regulated tariffs. In order to take into account the new indexing of certain long-term contracts to wholesale gas market prices, the regulated tariff formula was revised by law on 22 December 2011. Switching of gas suppliers in the retail markets increased slightly in 2011, from 3.5% in 2010 to 4.5% in 2011.
4.3. Consumers: French consumers rate the performance of their retail electricity market above the EU average (9th place out of 27), with the second lowest incidence of problems and the lowest percentage of complaints. However, switching is about one third of the EU average (second lowest in the EU). The assessment of the retail gas market is just below the EU average (13th place out of 23)88. In 2009, the NRA together with the National Energy Ombudsman introduced an on-line price comparability tool for electricity and gas prices. In France, complaints handling is shared among various institutions, depending on the nature of the complaint. France has not yet defined a category of ‘vulnerable consumers’ but it does guarantee access
88. 8th Consumer Markets Scoreboard, 2012, European Commission,
DG SANCO, http://ec.europa.eu/consumers/consumer_research/
editions/cms8_en.htm
to gas and electricity to people in precarious situations, who can benefit from specific regulated tariffs for the first 100 kWh of electricity every month and for gas through the Housing Solidarity Fund (FSL).
5. Infrastructure
5.1. Electricity: France is interconnected with all its neighbouring countries, the United Kingdom, Belgium, Germany, Switzerland, Italy and Spain, but capacity is currently insufficient. In order to better integrate the markets, foster competition and reduce congestion, the French TSO (RTE) is reinforcing its interconnections with Spain by building the Baixas-Santa Llogaia high voltage line to reach a total capacity of 2 600 MW by 2014. For this project, the authorisation process was, after many years, completed in 2011 and construction work has already started. The European Investment Bank will provide a EUR 350 million loan to the French and Spanish TSOs. The project also receives a EUR 225 million EU grant under the European Energy Programme for Recovery. In addition, the French (RTE) and the Italian (TERNA) TSOs are optimising the existing interconnection and have agreed to develop a new one of 1 000 MW between Savoie and Piedmont by 2017. During the summer of 2012, the British and French TSOs launched submarine studies for a new interconnection between France and the United Kingdom and an investment decision is expected for the beginning of 2013. Additional interconnector
C H A R T S 3 A N D 4
Electricity - Retail prices in France (in €/kWh)
H O U S E H O L D S I N D U S T R Y
VAT Other taxes Net price
2004 2005 2006 2007 2008 2009 2010 2011 2004 2005 2006 2007 2008 2009 2010 20110.00
0.02
0.04
0.06
0.08
0.10
0.12
0.14
0.16
0.18
0.20
Source: Eurostat
Natural gas - Retail prices in France (in euro cent/kWh)
H O U S E H O L D S I N D U S T R Y
VAT Other taxes Net price
2005 2006 2007 2008 2009 2010 2011 2005 2006 2007 2008 2009 2010 20110
1
2
3
7
5
6
4

EN
ER
GY
M
AR
KE
TS
I
N
TH
E
EU
RO
PE
AN
U
NI
ON
I
N
20
11
/
9
3
F R A N C E
projects are also under consideration, in particular a DC link in the Western part of the France-Spain border, expected to reach a total capacity of 4000 MW. The French regulator is contemplating implementing specific incentive measures to foster interconnection investments.
5.2. Gas: France depends on gas imports (98.5%). France has six interconnections with neighbouring countries, one interconnection with a subsea pipeline (Dunkirk) and three LNG terminals. A fourth LNG terminal (Dunkirk) is
being developed for completion by 2015. The French network is being reinforced to improve interconnection capacity, notably with Germany, Belgium and Spain, and to increase the liquidity of the gas market.
The European Energy Programme for Recovery (EEPR) has granted to the French TSOs (GRT-Gas and TIGF) € 283.7 million to reinforce the French Network and increase the interconnection capacities with Spain and Belgium.
F R A N C E – K E Y I N D I C ATO R S O F T H E E L E C T R I C I T Y A N D N AT U R A L G A S M A R K E T S
E L E C T R I C I T Y G A S
Number of companies representing at least 95% of net power generation > 5 Number of entities bringing natural gas into country 16
Number of main power-generation companies (1) 1 Number of main gas entities (4) 3
Market share of the largest power-generation company 86.5% Market share of the largest entity bringing natural gas 73.0%
Number of electricity retailers 177 Number of retailers selling natural gas to final customers 50
Number of main electricity retailers (2) 1 Number of main natural gas retailers (5) 3
Switching rates (entire electricity retail market) 2.0% Switching rates for gas (entire retail market) 3.5%
Regulated prices for households – electricity YES Regulated prices for households – gas YES
Regulated prices for non-households – electricity YES Regulated prices for non-households – gas YES
HHI in power-generation market (3) 8 880 HHI in gas supply market (3) 4 374
HHI in electricity retail market (3) 4 000 HHI in gas retail market (3) 4 000
Electricity market value (bn €) (6) 43.579 Gas market value (bn €) (6) 26.726
Sources: Eurostat, CEER, National Regulatory Authority, EC calculations.
(1) Companies are considered as ‘main’ if they produce at least 5% of the national net electricity generation.
(2) Retailers are considered as ‘main’ if they sell at least 5% of the total national electricity consumption.
(3) The HHI (Herfindahl-Hirschman Index) is a commonly accepted measure of market concentration. It is calculated by squaring the market share
of each firm competing in the market and then summing the resulting numbers (the higher the index, the more concentrated the market).
Moderate concentration: 750-1 800; high concentration: 1 800-5 000; very high concentration: above 5 000.
(4) Entities are considered as ‘main’ if they deal with at least 5% of the natural gas (indigenous production or import).
(5) Retailers are considered as ‘main’ if they sell at least 5% of the total natural gas consumed by final customers.
(6) Market value is an estimation of the size of the retail electricity and gas markets. It is calculated using data on electricity and gas consumption
in the household and non-household sectors and annual average retail prices.

EN
ER
GY
M
AR
KE
TS
I
N
TH
E
EU
RO
PE
AN
U
NI
ON
I
N
20
11
/
9
4
1. General overview
Crude oil and petroleum products dominate the energy mix, followed by natural gas. In the electricity mix however, natural gas is the most important fuel, providing more than half of the electricity produced. Renewables are second, two thirds of which originate from hydro power. Italy’s 2020 indicator89 improved from 5.6% in 2006 to 10.1% in 2010, and it aims to reach 17%. Cogeneration90 assured 11.5% of total electricity generation in 2010, showing an increase from 9% in 2005.
2. Regulatory framework
2.1. General: As Italy had notified full transposition of the Third Package Directives by the end of September 2011, no infringement proceedings for non-transposition have been opened. One infringement procedure is still open on the Second Energy Package in relation to the lack of congestion management (cross-border intraday) and transparency concerning access to the network for cross-border exchanges in electricity.
2.2. National Energy Regulator: The Italian National Energy Regulatory Authority, Autorità per l’Energia Elettrica e il Gas (AEEG), in operation since 1997, employed 168 staff in 2011 with an annual budget of EUR 39 million. To cover its budget, AEEG collects levies from energy market stakeholders. The regulator is independent but its budgetary autonomy has been reduced by the parliament in the last couple of years. Law No 214 of December 2011 also gave AEEG
89. This is the share of renewables in Gross Final Energy Consumption.
90. The share of electricity produced in combined heat and power
plants (CHP).
Key Issues
→ With regard to electricity, there is still a high concentration in some areas of the country (mainly the two main islands Sicily and Sardinia), and internal congestion leads to suboptimal use of generation capacity. The transmission grid capacity should be upgraded to fully exploit newly installed efficient thermal and RES generation capacity. The development of the electricity network is expected not only to reduce congestion on the domestic grid, but enhance interconnection capacity with neighbouring markets, as recommended by the Council, improving wholesale price alignment with adjacent countries.
→ With regard to gas, competition remains limited, and there is a high share of imported gas. Import capacity needs to be further expanded to enhance long-term security of supply. New capacity is also needed to develop a liquid spot gas market, which today remains small. The high share of imported gas in electricity generation implies that the security of electricity supply relies on secure gas supply. Italy should therefore continue to actively pursue further diversification of supply sources and routes, including by implementing the Southern Gas Corridor.
→ For both gas and electricity infrastructure, permitting procedures need to be streamlined.
ITALY
C H A R T S 1 A N D 2
Gross inland consumption (as % of total Mtoe) - 2010
Crude oil and petroleum products 40.2%
Natural gas38.8%
Renewables10.3%
Solid fuels8.1%
Total Mtoe: 175.51
Other2.7%
Gross electricity generation (as % of TWh) - 2010
Crude oiland petroleum products
7.2%
Natural gas52.1%
Renewables26.6%
Solid fuels13.2%
Total TWh: 302.06
Other1.0%
Source: Eurostat

EN
ER
GY
M
AR
KE
TS
I
N
TH
E
EU
RO
PE
AN
U
NI
ON
I
N
20
11
/
9
5
I T A LY
responsibility for regulating, controlling and monitoring water services.
2.3. Unbundling: The electricity TSO is TERNA, which had its ownership unbundled in 2004. TERNA owns almost the entire national electricity transmission grid but there are also other smaller operators which own some network elements (a few lines and substations). Snam Rete Gas TSO is a subsidiary of SNAM S.p.A. which in 2011 was owned 52.5% by ENI, 5% by the government and the rest was privately owned. The second operator was the Edison Group. Italy had initially chosen the ITO unbundling model for gas, but in May 2012 the new government issued a decree introducing full ownership unbundling for the gas sector too. In 2011, there were 239 DSOs in gas (430 in 2005) among which ENI was the main one (23.1% in terms of distributed volume). In electricity, the number of DSOs is much lower (145). 10 serve more than 100 000 customers and are therefore legally unbundled. ENEL Distribuzione was the leading distributor with 86% of the volume distributed.
3. Wholesale markets
3.1. Electricity: In terms of generation, the four largest producers together controlled less than 50% of the Italian market. This development is due to a further reduction of ENEL’s market share in electricity production, which dropped from 29.8% in 2009 to 26% in 2011. ENEL’s competitors were ENI (9.4%), Edison (8.5%), E.On (5.1%) and Edipower (4.8%). ENEL’s, E.On’s and Edipower’s market shares decreased to the advantage of other medium and smaller producers. Market integration with neighbouring markets is progressing, but Italy’s interconnectors remain highly utilised. With more than 12 000 MW of interconnection capacity (8 000 MW of Net Transfer Capacity), Italy is one of the best interconnected systems in Europe, but the interconnectors are not always used as efficiently as they could be (e.g. there is no intraday capacity allocation) and internal congestion restricts their potential use. Since 1 January 2011, integration of the Slovenian and Italian markets is based on market coupling for daily capacity allocation. Otherwise yearly, monthly and daily capacity is allocated through explicit auctions (from June 2012 intraday explicit auctions are in place). In April 2011, TERNA joined — together with other regional TSOs from the central-south region — the Capacity Allocation Service Company (CASC), the company organised by the TSOs of the central-west region to operate as a single auction platform for the region.
Wholesale prices in 2011 were on average EUR 72.2/MWh for Italian day-ahead baseload power (an increase of 13.2% compared to 2010)91. The Italian wholesale price is considerably higher than in other EU countries. Internally, congestion is managed through market splitting into several zones. Externally, a better management, and possibly expansion, of interconnections with other countries could also help align wholesale prices. An important pricing factor for electricity is the wholesale price for gas, which is also above the European average.
With regard to liquidity, 180 TWh of day-ahead baseload power were traded in 2011 on the Italian power exchange IPEX (55% of gross inland consumption).
3.2. Gas: In 2011, Italy imported 70.3 bcm of natural gas, corresponding to 90% of its gross inland consumption of natural gas in 2010. The three main importer countries were Algeria (37%), Russia (20%) and Libya (12.5%), and 12.8% of imported gas was LNG. Domestic production of natural gas rose slightly in the last year from 8 to 8.4 bcm. In 2011 ENI, Edison and Enel covered 74.3% of the total gas supplied (in 2009 their share was 79.3%). Wholesale prices remain higher in Italy than in any other European country with a gas trading hub. Gas prices remain mainly linked to take-or-pay contracts. The volume of spot imports has slightly decreased (from 10.6% in 2010 to 9.5% in 2011).
The day-ahead wholesale price of natural gas on the Italian hub PSV reached an average of EUR 28.2/MWh in 2011 (20.5% higher than in 2010), higher than the price on the other hubs. It appears that the distance from the larger hubs where most European wholesale trading takes place and limited access to gas traded on spot markets contribute to this situation. In terms of traded volume and liquidity, PSV is the smallest gas hub in the EU. In terms of volume, 65.5% of the gas consumed in Italy in 2011 was traded on the hub92. The virtual trading point PSV moved towards a real gas exchange in May 2010 when a new trading platform, P-Gas, was set up and importers and producers became obliged to place their gas there. A new balancing mechanism was launched in December 2011. The results have so far showed a promising trend towards alignment with the spot prices of the other hubs.
91. For a comparison with wholesale prices in neighbouring countries,
please refer to Table 9 of this Staff Working Document, part II.
92. The reporting methodologies differ among hubs, therefore the
volumes are not entirely comparable.

EN
ER
GY
M
AR
KE
TS
I
N
TH
E
EU
RO
PE
AN
U
NI
ON
I
N
20
11
/
9
6
I T A LY
4. Retail markets
4.1. Electricity: Enel remained the strongest player (36.8%), followed by Edison (8.2%) and Acea/Electrabel (4.6%). Their joint market share dropped to 49.6% (2011) from 54% (2010). Consumers have been able to choose their own supplier since January 2007. Consumers that do not choose a supplier remain with a default supplier, the local DSO, which provides electricity according to a ‘standard offer’. In this case, the local DSOs buy electricity from the Single Buyer at wholesale market price. Today the majority (77%) of households and SMEs are still served on the base of this ‘standard offer’. Other consumers (i.e. other than households and SMEs) are obliged to find a supplier, but if they cannot find a suitable offer, electricity is supplied by a Last Resort Supplier, selected through an open auction.
The switching rate of suppliers was 7% in 2011 (11.7% for non-households and 5.8% for households) up from 5.9% in 2010. In 2011, the share of network costs within the household prices (without taxes) was 31%, while energy and supply costs made up 69%. For industrial electricity prices, the proportions were 19% network costs and 81% energy and supply.
At the end of 2006, AEEG issued a regulatory provision defining minimum technical requirements and timing for the mandatory roll-out of smart meters: 95% of the entire low voltage customer-base was to be equipped with smart meters by the end of 2011. The roll-out is highly focused on reducing non-technical losses, rather than on making energy savings.
4.2. Gas: The level of concentration of the total market has fallen: the share of three largest companies was 53.1% in 2011 (down from 57.4% in 2009) of which ENI 29.6%, Edison 13.5% and ENEL 10%. Consumers have been able to choose their own supplier since January 2003. Around 10.4% of the residential sector is now in the free market. In 2011, 5.3% of all final customers switched suppliers, mainly large consumers. The share of the tax component was low for industrial consumers, but high for household customers. The correlation analysis shows that there is a rather strong correlation between the wholesale and retail gas prices. Provisions for rolling out smart gas meters were introduced by Regulatory Order ARG/gas 155/08 and recently updated by Regulatory Order 28/2012/R/gas, which prescribes a 60% roll-out to residential consumers by 2018.
4.3. Consumers: Italian consumer assessment of both retail electricity and gas markets is below the EU average (17th place out of 27 and 16th place out of 23, respectively). In both markets, trust in providers is the fourth lowest in the EU. In 2009, AEEG introduced the on-line price comparability tool (Il Trova-Offerte) for electricity and in 2010 for gas prices. Since 2009, consumers have also been able to send requests for information and complaints on electricity and gas to a single contact point (Sportello per il consumatore di Energia). The NRA has a role in guaranteeing an efficient handling of the Alternative Dispute Resolution procedure between customers and energy suppliers or the DSO. Since 2007, social laws classify vulnerable customers into three household categories including (i) income thresholds, (ii) offspring and (iii) life support dependence. These categories of consumers can have a rebate on their bills.
C H A R T S 3 A N D 4
Electricity - Retail prices in Italy (in €/kWh)
H O U S E H O L D S I N D U S T R Y
VAT Other taxes Net price
2004 2005 2006 2007 2008 2009 2010 2011 2004 2005 2006 2007 2008 2009 2010 20110.00
0.05
0.10
0.15
0.20
0.25
Source: Eurostat
Natural gas - Retail prices in Italy (in euro cent/kWh)
H O U S E H O L D S I N D U S T R Y
VAT Other taxes Net price
2005 2006 2007 2008 2009 2010 2011 2005 2006 2007 2008 2009 2010 20110
1
2
3
8
7
5
6
4

EN
ER
GY
M
AR
KE
TS
I
N
TH
E
EU
RO
PE
AN
U
NI
ON
I
N
20
11
/
9
7
I T A LY
5. Infrastructure
Although the permitting and authorisation processes for new energy infrastructure have been streamlined in recent years, there is still the need to enhance coordination and address public concerns.
5.1. Electricity: In response to the power deficits of 2003 and 2004, a strong increase in installed capacity (including in thermal and RES generation capacity) led to a generation surplus of as much as 12.6 GW. The increased generation capacity led to constraints in the transmission network, which still suffers from congestion. In particular, the south is poorly interconnected to central-northern Italy. At the end of 2009, the new 1 000 MW SA.PE.I Cable, connecting Sardinia to the mainland, was inaugurated. The cable is expected to reduce congestion between Sardinia and the Italian peninsula and improve competition on the Sardinia market. A new 2 GW sub-sea transmission cable to better connect Sicily to the Italian peninsula is also under construction.
5.2. Gas: Natural gas is imported via five pipelines and two LNG facilities, with the total import capacity around 120 Bcm. In the past, most of the import pipelines were owned and operated by ENI, but following a competition case analysing the potential abuse of its dominant position, ENI committed to divest its shares in the TAG pipeline, which imports gas from Russia. These were sold to Italian state lender Cassa Depositi e Prestiti, and shares in Transitgas and TENP, which import gas from north-west Europe were sold to Belgian gas infrastructure company Fluxys Europe. More LNG terminals are planned and are at different stages of the authorisation process. A further diversification of supply sources could be achieved through new pipeline projects such as Galsi and TAP. Major steps have been taken regarding gas storage, with the Bordolano storage starting to inject cushion gas in 2010 and a number or other projects getting closer to completing the authorisation process. Moreover, ENI is obliged by law to build an additional 4 Bcm of storage and offer it to the market.
I TA LY – K E Y I N D I C ATO R S O F T H E E L E C T R I C I T Y A N D N AT U R A L G A S M A R K E T S
E L E C T R I C I T Y G A S
Number of companies representing at least 95% of net power generation 217 Number of entities bringing natural gas into country 63
Number of main power-generation companies (1) 5 Number of main gas entities (4) 3
Market share of the largest power-generation company 27.5% Market share of the largest entity bringing natural gas 39.2%
Number of electricity retailers 342 Number of retailers selling natural gas to final customers 305
Number of main electricity retailers (2) 3 Number of main natural gas retailers (5) 5
Switching rates (entire electricity retail market) 5.9% Switching rates for gas (entire retail market) 4.5%
Regulated prices for households – electricity NO Regulated prices for households – gas NO
Regulated prices for non-households – electricity NO Regulated prices for non-households – gas NO
HHI in power-generation market (3) 1 087 HHI in gas supply market (3) 2 575
HHI in electricity retail market (3) 1 763 HHI in gas retail market (3) 1 102
Electricity market value (bn €) (6) 49.501 Gas market value (bn €) (6) 41.699
Sources: Eurostat, CEER, National Regulatory Authority, EC calculations.
(1) Companies are considered as ‘main’ if they produce at least 5% of the national net electricity generation.
(2) Retailers are considered as ‘main’ if they sell at least 5% of the total national electricity consumption.
(3) The HHI (Herfindahl-Hirschman Index) is a commonly accepted measure of market concentration. It is calculated by squaring the market share
of each firm competing in the market and then summing the resulting numbers (the higher the index, the more concentrated the market).
Moderate concentration: 750-1 800; high concentration: 1 800-5 000; very high concentration: above 5 000.
(4) Entities are considered as ‘main’ if they deal with at least 5% of the natural gas (indigenous production or import).
(5) Retailers are considered as ‘main’ if they sell at least 5% of the total natural gas consumed by final customers.
(6) Market value is an estimation of the size of the retail electricity and gas markets. It is calculated using data on electricity and gas consumption
in the household and non-household sectors and annual average retail prices.
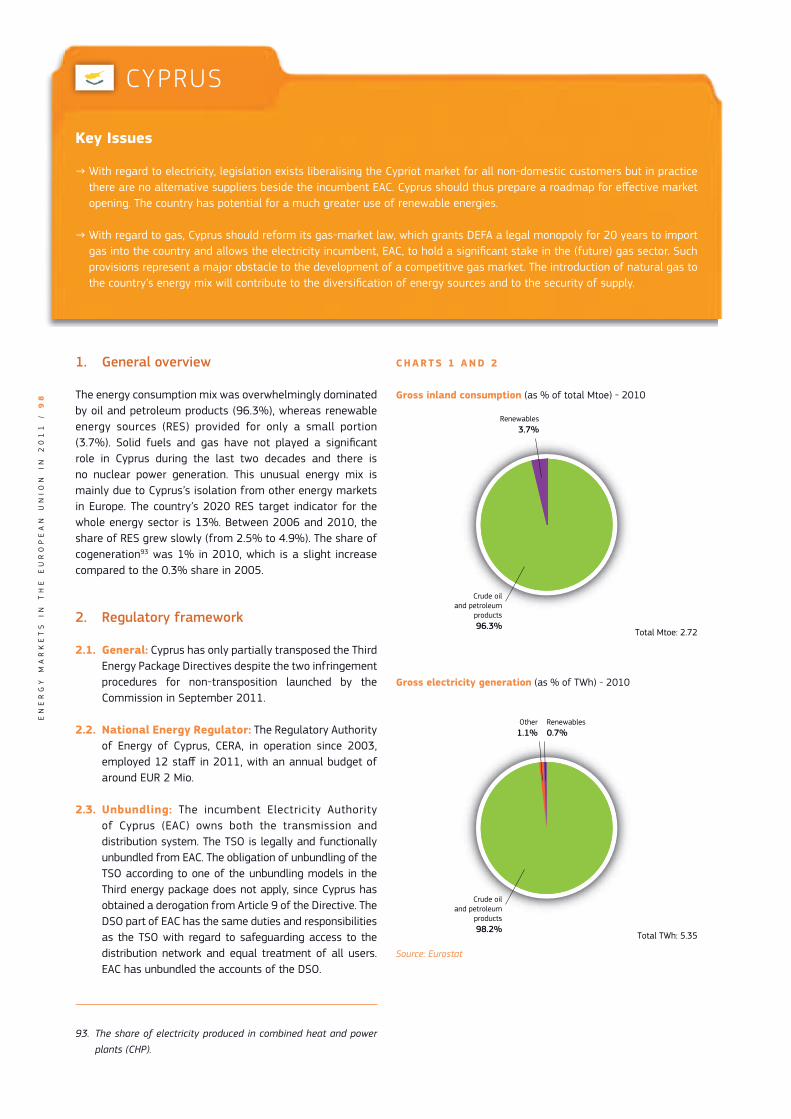
EN
ER
GY
M
AR
KE
TS
I
N
TH
E
EU
RO
PE
AN
U
NI
ON
I
N
20
11
/
9
8
1. General overview
The energy consumption mix was overwhelmingly dominated by oil and petroleum products (96.3%), whereas renewable energy sources (RES) provided for only a small portion (3.7%). Solid fuels and gas have not played a significant role in Cyprus during the last two decades and there is no nuclear power generation. This unusual energy mix is mainly due to Cyprus’s isolation from other energy markets in Europe. The country’s 2020 RES target indicator for the whole energy sector is 13%. Between 2006 and 2010, the share of RES grew slowly (from 2.5% to 4.9%). The share of cogeneration93 was 1% in 2010, which is a slight increase compared to the 0.3% share in 2005.
2. Regulatory framework
2.1. General: Cyprus has only partially transposed the Third Energy Package Directives despite the two infringement procedures for non-transposition launched by the Commission in September 2011.
2.2. National Energy Regulator: The Regulatory Authority of Energy of Cyprus, CERA, in operation since 2003, employed 12 staff in 2011, with an annual budget of around EUR 2 Mio.
2.3. Unbundling: The incumbent Electricity Authority of Cyprus (EAC) owns both the transmission and distribution system. The TSO is legally and functionally unbundled from EAC. The obligation of unbundling of the TSO according to one of the unbundling models in the Third energy package does not apply, since Cyprus has obtained a derogation from Article 9 of the Directive. The DSO part of EAC has the same duties and responsibilities as the TSO with regard to safeguarding access to the distribution network and equal treatment of all users. EAC has unbundled the accounts of the DSO.
93. The share of electricity produced in combined heat and power
plants (CHP).
C H A R T S 1 A N D 2
Gross inland consumption (as % of total Mtoe) - 2010
Crude oiland petroleum
products96.3%
Renewables3.7%
Total Mtoe: 2.72
Gross electricity generation (as % of TWh) - 2010
Crude oiland petroleum
products98.2%
Other1.1%
Renewables0.7%
Total TWh: 5.35
Source: Eurostat
Key Issues
→ With regard to electricity, legislation exists liberalising the Cypriot market for all non-domestic customers but in practice there are no alternative suppliers beside the incumbent EAC. Cyprus should thus prepare a roadmap for effective market opening. The country has potential for a much greater use of renewable energies.
→ With regard to gas, Cyprus should reform its gas-market law, which grants DEFA a legal monopoly for 20 years to import gas into the country and allows the electricity incumbent, EAC, to hold a significant stake in the (future) gas sector. Such provisions represent a major obstacle to the development of a competitive gas market. The introduction of natural gas to the country’s energy mix will contribute to the diversification of energy sources and to the security of supply.
CYPRUS

EN
ER
GY
M
AR
KE
TS
I
N
TH
E
EU
RO
PE
AN
U
NI
ON
I
N
20
11
/
9
9
C Y P R U S
3. Wholesale markets
3.1. Electricity: There is only one generating company, EAC, which is also the supplier. There is no wholesale market in Cyprus. Cyprus has been granted the status of a ‘small isolated system’ under both the Second and Third Energy Packages. It is not integrated and not interconnected at all with neighbouring systems. As a small isolated system, Cyprus can derogate from the application of several Articles of Directive 72/2009/EC. On July 2011, an explosion at the Vasilikos Power station more than halved electricity production. EAC’s response was fast and effective, reactivating old decommissioned equipment and installing mobile generators. However, generation costs, passed on to consumers, rose to a level that triggered widespread protests. The two small wind parks turned out to be useful and more widely used photovoltaic generation would have reduced discomfort. Five wind parks, with a total capacity of 147MW, are currently in operation.
3.2. Gas: Preparations were underway to import gas to a new LNG facility to be built near the site of the now severely damaged Vasilikos power plant; the plant was scheduled to begin operations in 2014. A national gas company, DEFA, has been set up. DEFA is a state-owned monopolist in the sense that it was supposed to be the only party to contract LNG shipments for the new terminal. In addition, as part of the LNG facility, a gas-storage facility was planned. These plans have become obsolete since the discovery of a significant amount of gas in the Aphrodite gas field, within the Cyprus EEZ, close to the larger Israeli Leviathan field. Cyprus will no longer need to import gas and is planning to build export facilities, although no final decision has yet been taken. A new national hydrocarbon company, focused on export, will be established following a decision by the Council of Ministers. The gas will first be used to fuel the three existing power plants (Moni, Vasilikos and Dhekelia) by means of dedicated pipelines. The future gas networks will later be expanded to supply industries, hotels and households — in that order of priority.
4. Retail markets
4.1. Electricity: EAC is the only supplier of electricity in Cyprus. The consequence of having only one supplier is that customer switching cannot take place. In 2009, electricity prices fell significantly only to surge again since 2010. These price trends mirror those of crude
oil and oil products. In 2011, the share of energy and supply costs within net consumer prices was the second-highest in the EU behind Malta (82% for household consumers and 88% for industrial consumers). Network costs accounted for 18% and 12% of the net household and industrial prices, respectively. The high share of energy and supply costs could be explained by the dominance in the electricity mix of the consumption of imported oil, one of the costliest ways of generating power. CERA is currently in the process of developing an Electricity Roadmap aimed at removing obstacles to the opening of the market and will conduct a study to examine the existing market model.
In 2010, the DSO of Cyprus started a pilot project to install 3 000 smart meters. This project will generate information for the cost-benefit analysis report which is planned for 2012. So far, there is no legal requirement for a mandatory rollout.
4.2. Consumers: The retail electricity market is assessed second lowest in the EU. The number of complaints is the highest in the EU; trust in the provider, transparancy of billing, comparability of services, and overall satisfaction are amongst the three lowest ratings in the EU94. Customer protection, and in particular protection of those who are living in rural areas, elderly or face difficulties, is entrusted to CERA. Vulnerable consumers are covered through social measures.
94. 8th Consumer Markets Scoreboard, 2012, European Commission,
DG SANCO, http://ec.europa.eu/consumers/consumer_research/
editions/cms8_en.htm
C H A R T 3
Electricity - Retail prices in Cyprus (in €/kWh)
H O U S E H O L D S I N D U S T R Y
VAT Other taxes Net price
2004 2005 2006 2007 2008 2009 2010 2011 2004 2005 2006 2007 2008 2009 2010 20110.00
0.04
0.08
0.12
0.16
0.20
0.24
Source: Eurostat

EN
ER
GY
M
AR
KE
TS
I
N
TH
E
EU
RO
PE
AN
U
NI
ON
I
N
20
11
/
1
00
C Y P R U S
5. Infrastructure
As there are no oil and gas pipelines or power lines that link Cyprus to other parts of Europe, the country can be described as an energy island, a situation aggravated so far by an almost 100% dependence on external primary energy supplies. On the island there are three power plants, all oil-fired. There are over one hundred dams in Cyprus, but none is used for electricity generation or pump storage.
C Y P R U S – K E Y I N D I C ATO R S O F T H E E L E C T R I C I T Y A N D N AT U R A L G A S M A R K E T S
E L E C T R I C I T Y G A S
Number of companies representing at least 95% of net power generation 1 Number of entities bringing natural gas into country N/A
Number of main power-generation companies (1) 1 Number of main gas entities (4) N/A
Market share of the largest power-generation company 100.0% Market share of the largest entity bringing natural gas N/A
Number of electricity retailers 1 Number of retailers selling natural gas to final customers N/A
Number of main electricity retailers (2) 1 Number of main natural gas retailers (5) N/A
Switching rates (entire electricity retail market) N/A Switching rates for gas (entire retail market) N/A
Regulated prices for households – electricity YES Regulated prices for households – gas N/A
Regulated prices for non-households – electricity YES Regulated prices for non-households – gas N/A
HHI in power-generation market (3) N/A HHI in gas supply market (3) N/A
HHI in electricity retail market (3) N/A HHI in gas retail market (3) N/A
Electricity market value (bn €) (6) N/A Gas market value (bn €) (6) N/A
Sources: Eurostat, CEER, National Regulatory Authority, EC calculations.
(1) Companies are considered as ‘main’ if they produce at least 5% of the national net electricity generation.
(2) Retailers are considered as ‘main’ if they sell at least 5% of the total national electricity consumption.
(3) The HHI (Herfindahl-Hirschman Index) is a commonly accepted measure of market concentration. It is calculated by squaring the market share
of each firm competing in the market and then summing the resulting numbers (the higher the index, the more concentrated the market).
Moderate concentration: 750-1 800; high concentration: 1 800-5 000; very high concentration: above 5 000.
(4) Entities are considered as ‘main’ if they deal with at least 5% of the natural gas (indigenous production or import).
(5) Retailers are considered as ‘main’ if they sell at least 5% of the total natural gas consumed by final customers.
(6) Market value is an estimation of the size of the retail electricity and gas markets. It is calculated using data on electricity and gas consumption
in the household and non-household sectors and annual average retail prices.

EN
ER
GY
M
AR
KE
TS
I
N
TH
E
EU
RO
PE
AN
U
NI
ON
I
N
20
11
/
1
01
1. General overview
The country’s energy-consumption mix has the highest renewable energy (RES) share (34.6%) in the whole EU-27. The country’s RES target for 2020 is 40%95. Natural gas accounted for 32.2% of gross inland energy consumption while the share of crude oil and petroleum products (28.5%) was also significant. Nuclear-based electricity generation does not exist at all. RES had a dominant share in the country’s electricity generation mix (54.9%); followed by natural gas (45.1%). Cogeneration96 provided for 45% of total electricity generation in 2010, which was a high share compared to other EU countries and was up from 30.7% measured in 2005.
2. Regulatory framework
2.1. General: As Latvia had notified full transposition of the Third Package Directives by the end of September 2011, no infringement proceedings for non-transposition have been opened.
2.2. National Energy Regulator: The Latvian national regulator, Sabiedrisko pakalpojumu regulēšanas komisija, the Public Utilities Commission — PUC, is a multi-sector regulator. In operation since 2001, it employed 110 staff (of whom 20 were responsible for energy) in 2010 and had a budget of around EUR 3 million.
95. Share of RES in Gross Final Energy Consumption.
96. The share of electricity produced in combined heat and power
plants (CHP).
C H A R T S 1 A N D 2
Gross inland consumption (as % of total Mtoe) - 2010
Crude oiland petroleum products
28.5%
Natural gas32.2%
Renewables34.6%
Solid fuels2.4%
Total Mtoe: 4.54
Other2.3%
Gross electricity generation (as % of TWh) - 2010
Natural gas45.1%
Renewables54.9%
Total TWh: 6.63
Source: Eurostat
Key Issues
→ As recommended by the Council, Latvia should promote competition and improve connectivity with EU energy networks.
→ With regard to electricity, Latvia should continue cooperation with the EC in negotiations with Russia and Belarus on the operation of the electricity networks in the Baltic states and continue work (in BEMIP) towards joining Nord Pool Spot and the creation of a Baltic regional electricity market. The Latvian network needs to be reinforced in order to be able to transport significant amounts of energy via the Baltic transmission system from Finland, Sweden or Poland.
→ With regard to gas, Latvia should take the necessary steps to end the isolation of its gas network from the rest of the EU, particularly in the context of the BEMIP initiative; the planned regional LNG terminal is one of the key projects. In addition to the implementation of the LV/LT reverse-flow project, infrastructure developments identified during the risk-assessment exercise (concluded by the three Baltic TSOs) should be started.
→ Latvia should gradually abolish regulated electricity prices, while taking into account universal service obligation and effective protection of vulnerable customers.
→ Competition should be promoted throught the supply chain in both gas and electricity. Wholesale and retail markets are heavily concentrated.
LATVIA
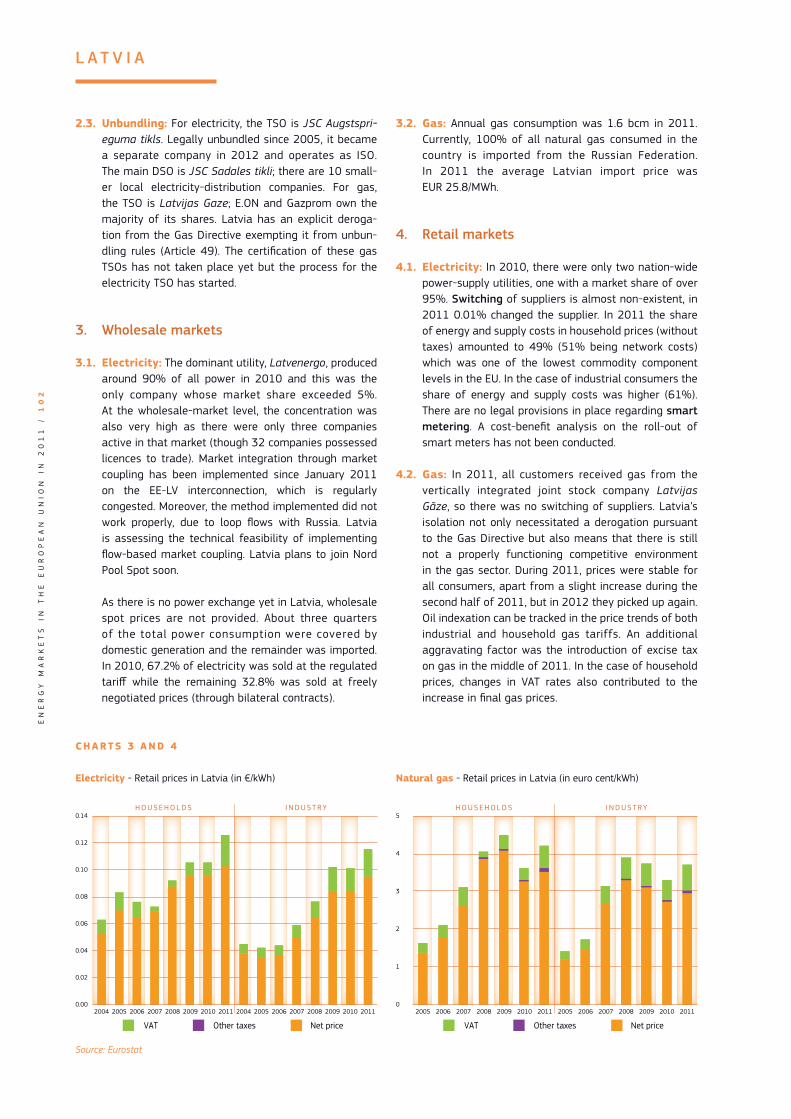
EN
ER
GY
M
AR
KE
TS
I
N
TH
E
EU
RO
PE
AN
U
NI
ON
I
N
20
11
/
1
02
L A T V I A
2.3. Unbundling: For electricity, the TSO is JSC Augstspri-eguma tikls. Legally unbundled since 2005, it became a separate company in 2012 and operates as ISO. The main DSO is JSC Sadales tikli; there are 10 small-er local electricity-distribution companies. For gas, the TSO is Latvijas Gaze; E.ON and Gazprom own the majority of its shares. Latvia has an explicit deroga-tion from the Gas Directive exempting it from unbun-dling rules (Article 49). The certification of these gas TSOs has not taken place yet but the process for the electricity TSO has started.
3. Wholesale markets
3.1. Electricity: The dominant utility, Latvenergo, produced around 90% of all power in 2010 and this was the only company whose market share exceeded 5%. At the wholesale-market level, the concentration was also very high as there were only three companies active in that market (though 32 companies possessed licences to trade). Market integration through market coupling has been implemented since January 2011 on the EE-LV interconnection, which is regularly congested. Moreover, the method implemented did not work properly, due to loop flows with Russia. Latvia is assessing the technical feasibility of implementing flow-based market coupling. Latvia plans to join Nord Pool Spot soon.
As there is no power exchange yet in Latvia, wholesale spot prices are not provided. About three quarters of the total power consumption were covered by domestic generation and the remainder was imported. In 2010, 67.2% of electricity was sold at the regulated tariff while the remaining 32.8% was sold at freely negotiated prices (through bilateral contracts).
3.2. Gas: Annual gas consumption was 1.6 bcm in 2011. Currently, 100% of all natural gas consumed in the country is imported from the Russian Federation. In 2011 the average Latvian import price was EUR 25.8/MWh.
4. Retail markets
4.1. Electricity: In 2010, there were only two nation-wide power-supply utilities, one with a market share of over 95%. Switching of suppliers is almost non-existent, in 2011 0.01% changed the supplier. In 2011 the share of energy and supply costs in household prices (without taxes) amounted to 49% (51% being network costs) which was one of the lowest commodity component levels in the EU. In the case of industrial consumers the share of energy and supply costs was higher (61%). There are no legal provisions in place regarding smart metering. A cost-benefit analysis on the roll-out of smart meters has not been conducted.
4.2. Gas: In 2011, all customers received gas from the vertically integrated joint stock company Latvijas Gāze, so there was no switching of suppliers. Latvia’s isolation not only necessitated a derogation pursuant to the Gas Directive but also means that there is still not a properly functioning competitive environment in the gas sector. During 2011, prices were stable for all consumers, apart from a slight increase during the second half of 2011, but in 2012 they picked up again. Oil indexation can be tracked in the price trends of both industrial and household gas tariffs. An additional aggravating factor was the introduction of excise tax on gas in the middle of 2011. In the case of household prices, changes in VAT rates also contributed to the increase in final gas prices.
C H A R T S 3 A N D 4
Electricity - Retail prices in Latvia (in €/kWh)
H O U S E H O L D S I N D U S T R Y
VAT Other taxes Net price
2004 2005 2006 2007 2008 2009 2010 2011 2004 2005 2006 2007 2008 2009 2010 20110.00
0.02
0.04
0.06
0.08
0.10
0.12
0.14
Source: Eurostat
Natural gas - Retail prices in Latvia (in euro cent/kWh)
H O U S E H O L D S I N D U S T R Y
VAT Other taxes Net price
2005 2006 2007 2008 2009 2010 2011 2005 2006 2007 2008 2009 2010 20110
1
2
3
5
4
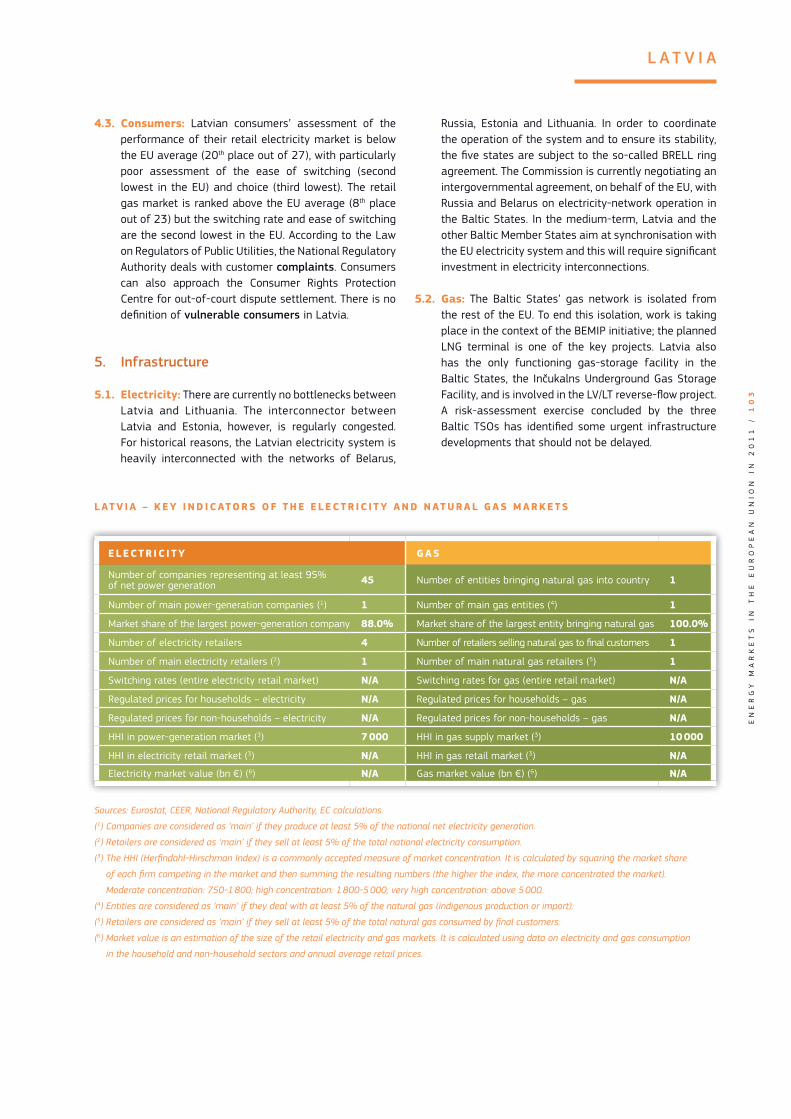
EN
ER
GY
M
AR
KE
TS
I
N
TH
E
EU
RO
PE
AN
U
NI
ON
I
N
20
11
/
1
03
L A T V I A
4.3. Consumers: Latvian consumers’ assessment of the performance of their retail electricity market is below the EU average (20th place out of 27), with particularly poor assessment of the ease of switching (second lowest in the EU) and choice (third lowest). The retail gas market is ranked above the EU average (8th place out of 23) but the switching rate and ease of switching are the second lowest in the EU. According to the Law on Regulators of Public Utilities, the National Regulatory Authority deals with customer complaints. Consumers can also approach the Consumer Rights Protection Centre for out-of-court dispute settlement. There is no definition of vulnerable consumers in Latvia.
5. Infrastructure
5.1. Electricity: There are currently no bottlenecks between Latvia and Lithuania. The interconnector between Latvia and Estonia, however, is regularly congested. For historical reasons, the Latvian electricity system is heavily interconnected with the networks of Belarus,
Russia, Estonia and Lithuania. In order to coordinate the operation of the system and to ensure its stability, the five states are subject to the so-called BRELL ring agreement. The Commission is currently negotiating an intergovernmental agreement, on behalf of the EU, with Russia and Belarus on electricity-network operation in the Baltic States. In the medium-term, Latvia and the other Baltic Member States aim at synchronisation with the EU electricity system and this will require significant investment in electricity interconnections.
5.2. Gas: The Baltic States’ gas network is isolated from the rest of the EU. To end this isolation, work is taking place in the context of the BEMIP initiative; the planned LNG terminal is one of the key projects. Latvia also has the only functioning gas-storage facility in the Baltic States, the Inčukalns Underground Gas Storage Facility, and is involved in the LV/LT reverse-flow project. A risk-assessment exercise concluded by the three Baltic TSOs has identified some urgent infrastructure developments that should not be delayed.
L AT V I A – K E Y I N D I C ATO R S O F T H E E L E C T R I C I T Y A N D N AT U R A L G A S M A R K E T S
E L E C T R I C I T Y G A S
Number of companies representing at least 95% of net power generation 45 Number of entities bringing natural gas into country 1
Number of main power-generation companies (1) 1 Number of main gas entities (4) 1
Market share of the largest power-generation company 88.0% Market share of the largest entity bringing natural gas 100.0%
Number of electricity retailers 4 Number of retailers selling natural gas to final customers 1
Number of main electricity retailers (2) 1 Number of main natural gas retailers (5) 1
Switching rates (entire electricity retail market) N/A Switching rates for gas (entire retail market) N/A
Regulated prices for households – electricity N/A Regulated prices for households – gas N/A
Regulated prices for non-households – electricity N/A Regulated prices for non-households – gas N/A
HHI in power-generation market (3) 7 000 HHI in gas supply market (3) 10 000
HHI in electricity retail market (3) N/A HHI in gas retail market (3) N/A
Electricity market value (bn €) (6) N/A Gas market value (bn €) (6) N/A
Sources: Eurostat, CEER, National Regulatory Authority, EC calculations.
(1) Companies are considered as ‘main’ if they produce at least 5% of the national net electricity generation.
(2) Retailers are considered as ‘main’ if they sell at least 5% of the total national electricity consumption.
(3) The HHI (Herfindahl-Hirschman Index) is a commonly accepted measure of market concentration. It is calculated by squaring the market share
of each firm competing in the market and then summing the resulting numbers (the higher the index, the more concentrated the market).
Moderate concentration: 750-1 800; high concentration: 1 800-5 000; very high concentration: above 5 000.
(4) Entities are considered as ‘main’ if they deal with at least 5% of the natural gas (indigenous production or import).
(5) Retailers are considered as ‘main’ if they sell at least 5% of the total natural gas consumed by final customers.
(6) Market value is an estimation of the size of the retail electricity and gas markets. It is calculated using data on electricity and gas consumption
in the household and non-household sectors and annual average retail prices.

EN
ER
GY
M
AR
KE
TS
I
N
TH
E
EU
RO
PE
AN
U
NI
ON
I
N
20
11
/
1
04
1. General overview
In 2010, oil and natural gas had almost the same share in the energy mix. Nuclear energy was still very important in 2009, but at the end of the year the second reactor of Ignalina nuclear power plant (NPP) was shut down as foreseen in Protocol n°4 on the Ignalina nuclear power plant in Lithuania attached to the Accession Treaty. With the decommissioning of the Ignalina NPP, which accounted for 80% of national electricity production, Lithuania has become the most dependent EU Member State on electricity supply from abroad. Currently up to 80% of Lithuanian primary energy mix is provided by import. This phasing out is planned to be offset mainly through an increased share of natural gas, but also through renewables (RES). In the electricity mix, the share of RES amounted to 29% in 2010 (from 9% in 2009). Lithuania has set a target of 23% of RES in gross final energy consumption by 2020. In 2010 this share was 19.7%. About 35% of the total electricity generation in 2010 was provided by cogeneration97, while in 2005 this share was 15.5%, putting the country in a good position compared to other EU countries. In the mid-term Lithuania plans to build a new nuclear power plant at Visaginas, although a recent referendum shows growing popular resistance to nuclear power.
97. The share of electricity produced in combined heat and power
plants (CHP).
C H A R T S 1 A N D 2
Gross inland consumption (as % of total Mtoe) - 2010
Crude oil and petroleum products 40.7%
Natural gas39.2%
Renewables16.8%
Solid fuels3.2%
Total Mtoe: 6.86
Gross electricity generation (as % of TWh) - 2010
Crude oiland petroleum products
11.3%
Natural gas55.4%
Renewables29%
Other 4.3%
Total TWh: 5.75
Source: Eurostat
Key Issues
→ As recommended by the Council, Lithuania should promote competition and improve connectivity with EU energy networks.
→ With regard to electricity, there is only limited competition in Lithuania and the market is concentrated. Lithuania has joined Nord Pool Spot, which might help to spur competition at the wholesale level, but Lithuania should still continue work in BEMIP towards the creation of a Baltic regional electricity market. While taking into account universal service obligation and effective protection of vulnerable customers, Lithuania should continue phasing out price regulation, as planned. It is essential to continue cooperation with the European Commission in negotiations with Russia and Belarus on electricity network operation in the Baltic States. Lithuania should complete the electricity interconnection with Sweden and develop cross-border interconnection with Poland, which could help reduce market concentration at wholesale and retail level.
→ With regard to gas, Lithuania relies on only one supply source. As a result, Lithuania should take the necessary measures to end isolation of its gas network from the EU, in particular by working in the context of the BEMIP initiative and diversification of supply with a regional LNG terminal in the Baltic States (which is planned for 2014) and interconnection with Poland.
→ Since the adoption of national legislation at the beginning of 2012, Lithuania has made some effort to strengthen its regulator. Further efforts are required to ensure independent, economic-based regulation.
L ITHUANIA

EN
ER
GY
M
AR
KE
TS
I
N
TH
E
EU
RO
PE
AN
U
NI
ON
I
N
20
11
/
1
05
L I T H U A N I A
2. Regulatory framework
2.1. General: Following the opening of infringement proceedings in September 2011 for non-transposition, Lithuania has notified full transposition of the Electricity Directive and partial transposition of the Gas Directive of the Third Package. As regards the Electricity Directive, the Commission is conducting a prima-facie examination of the completeness of the transposition based on the measures notified and other information provided in the proceedings. Lithuania, like Latvia, Estonia and Finland, has no interconnections with the EU gas network. It only has an interconnection to Latvia. Unlike the other three Member States, Lithuania did not request an explicit derogation pursuant to Article 49 of the Gas Directive during the Third Package negotiations.
2.2. National Energy Regulator: The Lithuanian regulator, the National Control Commission for Prices and Energy (NCC), in operation since 1997, employed 46 staff (of which only 15 work on the regulation of electricity and gas) with an annual budget of almost EUR 0.92 million in 2011. These are low figures compared to those of other Member States, even in relative terms.
2.3. Unbundling: In electricity the OU model was chosen for unbundling the state-owned TSO (Litgrid AB). There is one major DSO (AB LESTO) and five smaller DSOs in electricity. Both the TSO and the DSO were given additional time to complete their unbundling (until 31 October 2012, and 30 June 2012 respectively). The gas TSO is Lietuvos Dujos of which E.On, Gazprom and the Lithuanian Government are the main shareholders. Lietuvos Dujos submitted its unbundling plan to the NCC on 31 May 2012. In parallel, negotiations between Lithuania, Gazprom and E.ON are underway concerning ownership unbundling. In the gas distribution sector Lietuvos Dujos AB has a market share of 99%. Five other companies were entitled to engage in distribution activities, but they provided distribution services only to a few regions and their total distribution market share was 1%.
3. Wholesale markets
3.1. Electricity: The closure of Ignalina NPP in 2009 removed a monopoly power supplier and created room for new suppliers on the market. However, the Lithuanian electricity market is still concentrated. In 2010, INTER RAO Lietuva UAB and Lietuvos Energija AB each had a 40% share of the wholesale electricity market and 18 other market players had a combined market share of 20%. In 2011, INTER RAO Lietuva UAB had a share in energy exchange of 19.3% (sales share) and 44% (purchase share). Lietuvos energija had a share of 45.1% and 17.4% respectively. Nord Pool Spot started in Lithuania in June 2012. Since then, electricity trading is based on the Nord Pool Spot model, taking place on
the Lithuanian electricity market and through bilateral exchanges between producers, importers and suppliers. In 2011 the average day-ahead wholesale price for baseload power was EUR 45.2/MWh (a decrease of 2.6% compared to 2010)98. In terms of liquidity concerned, 8 TWh were traded on the exchange in 2011 (75% of gross electricity consumption).
3.2. Gas: Lithuania does not have its own natural gas resources. All gas is imported from a single source - Russia (via a single pipeline from Belarus). In 2011 3.4 bcm of gas were imported. Correspondingly, competition has not developed in the wholesale sector of the natural gas market. All the natural gas is purchased from one company. Incumbent companies AB ‘Lietuvos dujos’ (the largest player) and UAB ‘Haupas’ purchase from Gazprom directly (as well as AB ‘Achema’ and UAB ‘Kauno termofikacijos elektrinė‘). UAB ‘Dujotekana’ purchases from Gazprom via Gas Stream AG LT. Nevertheless, a gas exchange was launched on 1 March 2012. Wholesale trading of natural gas administered by exchange operator Baltpool takes place on the commodities exchange by trading natural gas or transferring the right to acquisition of natural gas. As trade on the natural gas exchange is local for the time being and just getting off the ground, no reference wholesale price can be given. Estimates of long-term prices for Russian gas result in an annual average of EUR 33.7/MWh for 2011 (an increase of 26.4% in relation to 2010).
4. Retail markets
4.1. Electricity: In 2010, Rytu Skirstomieji Tinklai AB and VST AB together supplied 65% of the market, with 59 independent suppliers having a combined market share of 35% (the number of independent suppliers had doubled in relation to 2009). At the end of 2010, Rytų Skirstomieji Tinklai AB and VST AB merged into one single operator, AB LESTO; and in 2011 LESTO supplied 53.1% of the market. Supplier switching among non-household consumers has been rising gradually since 2010. End-user price regulation still exists for household consumers, but will be fully removed for industrial consumers in 2013. By a decree of 2009 the Lithuanian Government instituted a plan for the gradual phasing out by January 2015 of regulated end-user tariffs for electricity. Regulated end-user tariffs will continue to apply to vulnerable customers only. Power prices for households and industrial consumers have been increasing in recent years, mostly due to the net commodity price in 2010, but also to public interest
98. For a comparison with wholesale prices in neighbouring countries,
please refer to Table 9 of this Staff Working Document, part II.

EN
ER
GY
M
AR
KE
TS
I
N
TH
E
EU
RO
PE
AN
U
NI
ON
I
N
20
11
/
1
06
L I T H U A N I A
services’ supply in 2011-2012. The former is related to the closure of the Ignalina power plant and the switch to other sources of electricity. Lithuania also increased the rate of VAT from 19% to 21% in September 2009. In 2011 and in the first semester of 2012 the share of network costs in the power price for households (without taxes) was 55% while the share of energy and supply costs was 45%. In the case of industrial electricity prices, these proportions were 40% and 60% respectively. A cost-benefit analysis addressing smart meters is currently being carried out.
4.2. Gas: The functioning of the natural gas retail market is determined by the situation on the wholesale market. Theoretically, the market is 100% liberalised. In practice, as there is only one external gas supplier, no switching occurred in 2011. As in previous years, in 2011 customers were supplied with natural gas by the two main suppliers, Lietuvos Dujos AB and Dujotekana UAB. Gas quotas are allocated to those undertakings by a single external supplier (Gazprom RAB). There is therefore no competition between the main suppliers, which means that there is no real switching option. There are another five gas supply companies, whose combined market share is as low as 1.2% of the retail market. Prices for final consumers followed a similar trajectory to electricity prices. The increase in the price of natural gas and in VAT contributed to higher retail prices. A comparison of the development of estimated long-term gas import prices and retail prices highlights some correlation for industrial consumers. In 2009 there was a sharp drop in industrial retail prices, followed by a gradual increase in subsequent years. This corresponded closely to the movement of the import price of natural gas.
4.3. Consumers: The NCC, the State Energy Inspectorate and the State Consumer Rights Protection Authority investigate individual consumer complaints depending on the nature of the complaint. Lithuanian consumers rate the performance of their retail gas market 5th highest in the EU, with the highest score on comparability of all EU countries. The assessment of the retail electricity market is below the EU average (18th place out of 27), with the third highest percentage of consumers reporting a problem. Disputes are settled out of court by both authorities. The regulator established a single point of contact in March, 2012. As regards the definition of vulnerable consumers and measures to protect them, Lithuanian law provides that the non-interruptible supply of natural gas is guaranteed as a matter of priority to those groups of vulnerable consumers — household customers and non-household customers — which consume up to 20 thousand cubic metres of gas per year.
5. Infrastructure
5.1. Electricity: Lithuania is not directly connected to the European grid and therefore should continue working in BEMIP towards the creation of a Baltic regional electricity market. Plans are in place to build the 700 MW Nordbalt interconnector to Sweden by 2015 as well as an interconnection to Poland by 2016. In 2011, NCC and TSO agreed on financing terms for NordBalt. The Baltic States operate within the BRELL synchronous system. Electricity flows changed after the shut-down of Ignalina NPP, resulting in congestion in Latvia-Estonia interconnections, especially during the summer.
C H A R T S 3 A N D 4
Electricity - Retail prices in Lithuania (in €/kWh)
H O U S E H O L D S I N D U S T R Y
VAT Other taxes Net price
2004 2005 2006 2007 2008 2009 2010 2011 2004 2005 2006 2007 2008 2009 2010 20110.00
0.02
0.04
0.06
0.08
0.10
0.12
0.14
Source: Eurostat
Natural gas - Retail prices in Lithuania (in euro cent/kWh)
H O U S E H O L D S I N D U S T R Y
VAT Other taxes Net price
2005 2006 2007 2008 2009 2010 2011 2005 2006 2007 2008 2009 2010 20110
1
3
5
7
2
4
6

EN
ER
GY
M
AR
KE
TS
I
N
TH
E
EU
RO
PE
AN
U
NI
ON
I
N
20
11
/
1
07
L I T H U A N I A
5.2. Gas: The grid is connected with the Belarusian, Latvian and Russian Federation (Kaliningrad enclave) gas systems. Work should continue in BEMIP to end the isolation of Lithuania’s gas network from the EU. Investments in a Lithuanian-Polish interconnector and enhancement of the Latvian-Lithuanian interconnection have been submitted as potential projects of common interest in gas infrastructure. In June 2012 the Lithuanian Parliament adopted the law on the LNG Terminal, thus ensuring the required legal framework for the construction of an LNG Terminal.
L I T H U A N I A – K E Y I N D I C ATO R S O F T H E E L E C T R I C I T Y A N D N AT U R A L G A S M A R K E T S
E L E C T R I C I T Y G A S
Number of companies representing at least 95% of net power generation 17 Number of entities bringing natural gas into country 5
Number of main power-generation companies (1) 5 Number of main gas entities (4) 4
Market share of the largest power-generation company35.4% Market share of the largest entity bringing natural gas 50.5%
Number of electricity retailers 15 Number of retailers selling natural gas to final customers 5
Number of main electricity retailers (2) 3 Number of main natural gas retailers (5) 1
Switching rates (entire electricity retail market) 1.3% Switching rates for gas (entire retail market) 0.0%
Regulated prices for households – electricity YES Regulated prices for households – gas YES
Regulated prices for non-households – electricity NO Regulated prices for non-households – gas NO
HHI in power-generation market (3) 4092 HHI in gas supply market (3) 6 048
HHI in electricity retail market (3) appr. 5 000 HHI in gas retail market (3) appr. 6 000
Electricity market value (bn €) (6) 0.940 Gas market value (bn €) (6) 1.524
Sources: Eurostat, CEER, National Regulatory Authority, EC calculations.
(1) Companies are considered as ‘main’ if they produce at least 5% of the national net electricity generation.
(2) Retailers are considered as ‘main’ if they sell at least 5% of the total national electricity consumption.
(3) The HHI (Herfindahl-Hirschman Index) is a commonly accepted measure of market concentration. It is calculated by squaring the market share
of each firm competing in the market and then summing the resulting numbers (the higher the index, the more concentrated the market).
Moderate concentration: 750-1 800; high concentration: 1 800-5 000; very high concentration: above 5 000.
(4) Entities are considered as ‘main’ if they deal with at least 5% of the natural gas (indigenous production or import).
(5) Retailers are considered as ‘main’ if they sell at least 5% of the total natural gas consumed by final customers.
(6) Market value is an estimation of the size of the retail electricity and gas markets. It is calculated using data on electricity and gas consumption
in the household and non-household sectors and annual average retail prices.

EN
ER
GY
M
AR
KE
TS
I
N
TH
E
EU
RO
PE
AN
U
NI
ON
I
N
20
11
/
1
08
1. General overview
In 2010, the energy mix was dominated by crude oil and petroleum products. Together with natural gas, these sources represented close to 90% of the mix. The most important renewable sources were biomass and waste (88%) followed by hydro power (7%). However, hydro power provided one third of gross electricity production. As far as the 2020 goal is concerned, the national overall target is an 11% share of energy from renewables99. In 2006 this share was 1.4% and in 2010 it was 2.8%. Cogeneration100 assured 9.6% of total electricity generation in 2010; similarly to the previous five-year period, when its share ranged between 9.9% and 11.9%.
2. Regulatory framework
2.1. General: Following the opening of infringement proceedings in September 2011 for non-transposition, Luxembourg has declared that the Third Energy Package Directives have been now fully transposed. The Commission is conducting a prima-facie examination of the completeness of the transposition based on the measures notified and other information provided in the proceedings.
2.2. National Energy Regulator: In 2010, the Luxem-bourgish national regulatory authority, the Institut Lux-embourgeois de Régulation (ILR), employed 41 staff and had an annual budget of almost EUR 7 million. It has been in operation since 1997 and is also in charge of regulating the telecoms and postal sectors.
99. This is the share of renewables in Gross Final Energy Consumption.
100. The share of electricity produced in combined heat and power
plants (CHP).
C H A R T S 1 A N D 2
Gross inland consumption (as % of total Mtoe) - 2010
Crude oil and petroleum products 62.6%
Natural gas26.1%
Renewables2.9%
Other8.4%
Total Mtoe: 4.66
Gross electricity generation (as % of TWh) - 2010
Renewables35.4%
Other64.6%
Total TWh: 4.59
Source: Eurostat
Key Issues
→ With regard to electricity, the share of renewable energy sources is low due to limited national capabilities. Increasing imports of electricity from renewable sources from neighbouring countries would require additional interconnections.
→ With regard to gas, Luxembourg is suffering from limited availability of firm entry capacity, especially on its German and Belgian connections. A better congestion management mechanism could help to address this situation. Negotiations with neighbours to strengthen the interconnections (for gas and electricity) should be intensified and could lead to positive results.
LUXEMBOURG
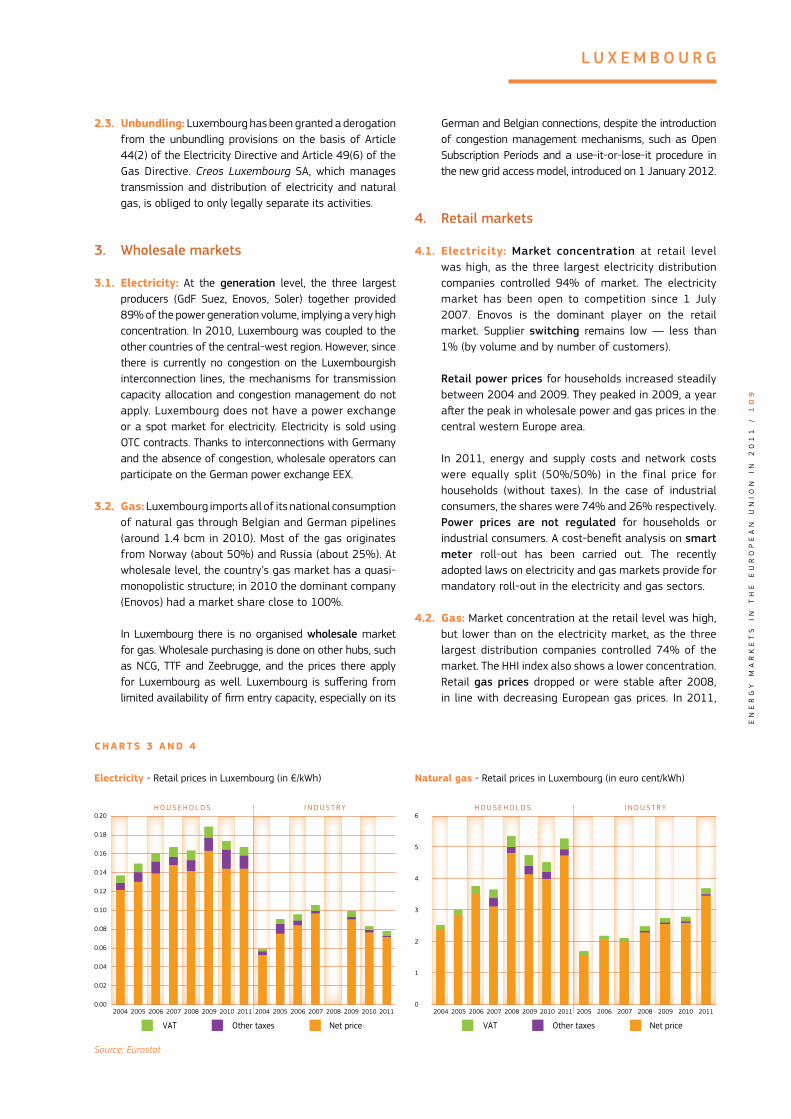
EN
ER
GY
M
AR
KE
TS
I
N
TH
E
EU
RO
PE
AN
U
NI
ON
I
N
20
11
/
1
09
L U X E M B O U R G
2.3. Unbundling: Luxembourg has been granted a derogation from the unbundling provisions on the basis of Article 44(2) of the Electricity Directive and Article 49(6) of the Gas Directive. Creos Luxembourg SA, which manages transmission and distribution of electricity and natural gas, is obliged to only legally separate its activities.
3. Wholesale markets
3.1. Electricity: At the generation level, the three largest producers (GdF Suez, Enovos, Soler) together provided 89% of the power generation volume, implying a very high concentration. In 2010, Luxembourg was coupled to the other countries of the central-west region. However, since there is currently no congestion on the Luxembourgish interconnection lines, the mechanisms for transmission capacity allocation and congestion management do not apply. Luxembourg does not have a power exchange or a spot market for electricity. Electricity is sold using OTC contracts. Thanks to interconnections with Germany and the absence of congestion, wholesale operators can participate on the German power exchange EEX.
3.2. Gas: Luxembourg imports all of its national consumption of natural gas through Belgian and German pipelines (around 1.4 bcm in 2010). Most of the gas originates from Norway (about 50%) and Russia (about 25%). At wholesale level, the country’s gas market has a quasi-monopolistic structure; in 2010 the dominant company (Enovos) had a market share close to 100%.
In Luxembourg there is no organised wholesale market for gas. Wholesale purchasing is done on other hubs, such as NCG, TTF and Zeebrugge, and the prices there apply for Luxembourg as well. Luxembourg is suffering from limited availability of firm entry capacity, especially on its
German and Belgian connections, despite the introduction of congestion management mechanisms, such as Open Subscription Periods and a use-it-or-lose-it procedure in the new grid access model, introduced on 1 January 2012.
4. Retail markets
4.1. Electricity: Market concentration at retail level was high, as the three largest electricity distribution companies controlled 94% of market. The electricity market has been open to competition since 1 July 2007. Enovos is the dominant player on the retail market. Supplier switching remains low — less than 1% (by volume and by number of customers).
Retail power prices for households increased steadily between 2004 and 2009. They peaked in 2009, a year after the peak in wholesale power and gas prices in the central western Europe area.
In 2011, energy and supply costs and network costs were equally split (50%/50%) in the final price for households (without taxes). In the case of industrial consumers, the shares were 74% and 26% respectively. Power prices are not regulated for households or industrial consumers. A cost-benefit analysis on smart meter roll-out has been carried out. The recently adopted laws on electricity and gas markets provide for mandatory roll-out in the electricity and gas sectors.
4.2. Gas: Market concentration at the retail level was high, but lower than on the electricity market, as the three largest distribution companies controlled 74% of the market. The HHI index also shows a lower concentration. Retail gas prices dropped or were stable after 2008, in line with decreasing European gas prices. In 2011,
C H A R T S 3 A N D 4
Electricity - Retail prices in Luxembourg (in €/kWh)
H O U S E H O L D S I N D U S T R Y
VAT Other taxes Net price
2004 2005 2006 2007 2008 2009 2010 2011 2004 2005 2006 2007 2008 2009 2010 20110.00
0.02
0.04
0.06
0.08
0.10
0.12
0.14
0.16
0.18
0.20
Source: Eurostat
Natural gas - Retail prices in Luxembourg (in euro cent/kWh)
H O U S E H O L D S I N D U S T R Y
VAT Other taxes Net price
2004 2005 2006 2007 2008 2009 2010 2011 2005 2006 2007 2008 2009 2010 20110
1
2
3
6
5
4

EN
ER
GY
M
AR
KE
TS
I
N
TH
E
EU
RO
PE
AN
U
NI
ON
I
N
20
11
/
1
10
L U X E M B O U R G
following the upturn in wholesale gas prices, retail prices went up again (see Chart 4). Gas prices are not regulated for households and industrial consumers.
4.3. Consumers: Consumers’ overall assessment of the electricity and gas retail markets is the highest and second highest in the EU, respectively. Likewise, the scores for trust are the highest and second highest across all EU countries. Consumers face fewer problems in the gas and especially the electricity retail markets compared to EU averages, and complaints also tend to be lower than average (3rd and 2nd lowest numbers, respectively, in electricity services) However, actual switching rates in both markets are among the lowest in the EU (less than half the EU average)101. An on-line price comparability tool is not yet in place, but the NRA is planning to set one up in the near future102. There is a single point of contact under the National Consumer Rights Protection Association. The recently adopted laws authorise ILR to act as the single point of contact. The regulator handles disputes between
101. 8th Consumer Markets Scoreboard, 2012, European Commission,
DG SANCO, http://ec.europa.eu/consumers/consumer_research/
editions/cms8_en.htm
102. http://www.ilr.public.lu/stroumagas/comparaison_des_prix/
index.html
customers and suppliers and between consumers and DSOs, and provides an alternative dispute resolution service. While the laws on the organisation of electricity and gas markets refer to vulnerable consumers, there is no clarity as to the content of the term. The legislation contains provisions for consumers in remote areas.
5. Infrastructure
Luxembourg is dependent on imports for all its energy needs. More than 50% of the gas is used for generating electricity in CCGTs. Luxembourg does not have sufficient generation capacity to meet its electricity demand. However, in order to secure supply it can use its interconnections with neighbouring countries. The current n-1 secure interconnection capacity with Germany (980 MVA) is currently sufficient to cover demand. This situation is, however, subject to review as a result of the German nuclear phase-out and the anticipated growth in demand.
L U X E M B O U R G – K E Y I N D I C ATO R S O F T H E E L E C T R I C I T Y A N D N AT U R A L G A S M A R K E T S
E L E C T R I C I T Y G A S
Number of companies representing at least 95% of net power generation 3 Number of entities bringing natural gas into country 4
Number of main power-generation companies (1) 2 Number of main gas entities (4) 1
Market share of the largest power-generation company 85.4% Market share of the largest entity bringing natural gas N/A
Number of electricity retailers 11 Number of retailers selling natural gas to final customers 8
Number of main electricity retailers (2) 4 Number of main natural gas retailers (5) 4
Switching rates (entire electricity retail market) 0.2% Switching rates for gas (entire retail market) 0.0%
Regulated prices for households – electricity NO Regulated prices for households – gas NO
Regulated prices for non-households – electricity NO Regulated prices for non-households – gas NO
HHI in power-generation market (3) 7 362 HHI in gas supply market (3) 9 083
HHI in electricity retail market (3) 3 136 HHI in gas retail market (3) 4 037
Electricity market value (bn €) (6) 0.571 Gas market value (bn €) (6) 0.767
Sources: Eurostat, CEER, National Regulatory Authority, EC calculations.
(1) Companies are considered as ‘main’ if they produce at least 5% of the national net electricity generation.
(2) Retailers are considered as ‘main’ if they sell at least 5% of the total national electricity consumption.
(3) The HHI (Herfindahl-Hirschman Index) is a commonly accepted measure of market concentration. It is calculated by squaring the market share
of each firm competing in the market and then summing the resulting numbers (the higher the index, the more concentrated the market).
Moderate concentration: 750-1 800; high concentration: 1 800-5 000; very high concentration: above 5 000.
(4) Entities are considered as ‘main’ if they deal with at least 5% of the natural gas (indigenous production or import).
(5) Retailers are considered as ‘main’ if they sell at least 5% of the total natural gas consumed by final customers.
(6) Market value is an estimation of the size of the retail electricity and gas markets. It is calculated using data on electricity and gas consumption
in the household and non-household sectors and annual average retail prices.

EN
ER
GY
M
AR
KE
TS
I
N
TH
E
EU
RO
PE
AN
U
NI
ON
I
N
20
11
/
1
11
1. General overview
Natural gas plays the most important role in Hungary’s energy consumption and accounts for 37.8%. Crude oil and petroleum products come second. The power generation mix is dominated by nuclear energy (42%), gas-fired generation (31%) and solid fuels (16.7%). Renewable energy sources (RES) play an increasingly important role in the consumption mix. The share of RES in energy consumption103 rose from 5.2% in 2005 to 8.7% in 2010. Hungary’s 2020 RES target is 13%. However, in the Renewable Action Plan, the government has set a target of 14.65%. The share of cogeneration104 was 19.6% in 2010, showing only a slow progress since 2005 (19.1%).
2. Regulatory framework
2.1. General: As Hungary had notified full transposition of the Third Package Directives by the end of September 2011, no infringement proceedings for non-transposi-tion have been opened.
2.2. National Energy Regulator: The Hungarian National Regulatory Authority, Magyar Energia Hivatal (HEO), in operation since 1994, employs 119 staff with an annual budget of around EUR 12 million. HEO is relatively size-able compared to counterparts elsewhere in the EU, with a fairly wide portfolio of tasks. However, the Hungarian government has recently limited HEO’s powers to set net-work tariffs autonomously. Since 1 January 2012, HEO is obliged to calculate tariffs using the methodology im-
103. This is the share of RES in Gross Final Energy Consumption
(2020 target indicator).
104. The share of electricity produced in combined heat and power plants (CHP).
Key Issues
→ Hungary should gradually abolish regulated energy prices, as recommended by the Council, in all consumer segments, including households, while taking into account universal service obligation and effective protection of vulnerable customers. Hungary should also gradually abolish extra taxes on the energy sector. Such taxes hamper operators’ ability and willingness to invest and innovate in Hungary.
→ The national energy regulator, HEO, should be given powers to set network tariffs autonomously and to organise its structures independently.
→ With regard to electricity, Hungary should continue increasing cross-border network capacities to facilitate trade with neighbouring countries and the integration of renewable energy sources. Regional electricity market integration through market coupling should continue to be a priority.
→ With regard to gas, Hungary should restore non-discriminative network tariffs and third-party access rules to cross-border interconnectors. Measures that have been introduced recently hinder equal access to markets and have the potential to severely distort competition. Hungary should continue its efforts to diversify gas transmission routes through cross-border interconnections (e.g. SK-HU) and implement reverse-flow arrangements on unidirectional pipelines (e.g. HU-RO). These are vital to provide the central European region with access to sources of gas in the south-east. Plans to set up a Hungarian gas exchange should be pursued.
HUNGARY
C H A R T S 1 A N D 2
Gross inland consumption (as % of total Mtoe) - 2010
Crude oiland petroleum products
26.3%
Natural gas37.8%
Renewables7.7%
Solid fuels10.5%
Nuclear15.7%
Other2.1%
Total Mtoe: 25.98
Gross electricity generation (as % of TWh) - 2010
Crude oiland petroleum products
1.3%
Natural gas31.3%
Renewables8.1%
Solid fuels16.7%
Nuclear42.2%
Other0.4%
Total TWh: 37.37
Source: Eurostat

EN
ER
GY
M
AR
KE
TS
I
N
TH
E
EU
RO
PE
AN
U
NI
ON
I
N
20
11
/
1
12
H U N G A R Y
posed by the Ministry. Furthermore, the government has imposed an internal operational and functional structure on the regulator, thereby reducing its independence and scope for autonomous decision-making still further.
2.3. Unbundling: The Hungarian electricity transmission grid is operated by MAVIR Zrt., a subsidiary of MVM. The gas transport network is operated by the gas TSO, Földgázszállitó Zrt, which is fully owned by MOL. Both of the TSOs have been certified as ITOs. There are nine DSOs in gas and six in electricity.
3. Wholesale markets
3.1. Electricity: At generation level, the three biggest firms had a market share of 69.2% in 2011. The power generation market is relatively concentrated, with MVM, a state-owned genera-tion and supply company, classified by HEO as a market par-ticipant with significant power. As such, MVM has to auction part of its generation portfolio to third parties. Hungary is a net importer of electricity and an important transit country, connecting markets in the Balkans to Central Europe. Improv-ing integration among the countries involved to develop more liquid hubs is therefore particularly important. The trilateral Czech-Slovak-Hungarian market coupling, being operational since 11 September 2012, is an important step in the right direction and fits well into wider regional coupling initiatives. It will hopefully help to reduce overall transaction costs and allow Hungary to tap into much-needed sources of flexibility. Hungary’s power exchange, HUPX, a provider of organised access to markets, should continue to facilitate this process. In its first year of operation, it managed to build up an en-couraging level of liquidity, with a total volume of 3.8 TWh of spot traded power. This amounts to 9.4% of the country’s gross inland electricity consumption in 2011.
3.2. Gas: In 2011, 24% of natural gas consumption was supplied from domestic sources, with the rest imported,
mainly from Russia (76% of all imports in 2011). E.On Földgáz Trade is a major player on the wholesale mar-ket and is classified by HEO as having significant market power. Since mid-2009, other licensed parties are also ac-tive on the wholesale market. In 2011, the import capacity of the HAG pipeline at the Hungarian-Austrian border was expanded from 12.1 Mm3/day to 14.4 Mm3/day, enabling imports from central-western European gas hubs to be increased. There are also encouraging plans to set up an organised gas exchange (CEEGEX). Together with new and planned interconnectors to neighbouring countries, the gas exchange is expected to facilitate access to compet-itively-priced sources of gas, providing an alternative to oil-indexed long-term contracts with Russia.
4. Retail markets
4.1. Electricity: Market concentration at retail level was high and the three biggest companies covered 77.6% of the retail market at the end of 2011. Prices are still regulated for certain groups of consumers, including all households and small businesses. Consumers eligible to purchase power at regulated rates now include a large group of public institutions, including all local administrations. The effect of this recent measure diminishes the size of the market segment open to effective competition. As to the roll-out of smart metering, a preliminary cost-benefit analysis of various options for their deployment has been carried out. However until pilot projects are finalised, there is unlikely to be a legal framework for the roll-out in place.
4.2. Gas: Market concentration at retail level is high, as the three largest companies cover 67.4% of the retail market (as at the end of 2011). Prices for consumers with an off-take capacity of up to 20 m3/h, including all domestic consumers, are regulated. In addition, there are measures in place that provide certain groups of consumers with beneficial access to interconnectors and
C H A R T S 3 A N D 4
Electricity - Retail prices in Hungary (in €/kWh)
H O U S E H O L D S I N D U S T R Y
VAT Other taxes Net price
2004 2005 2006 2007 2008 2009 2010 2011 2004 2005 2006 2007 2008 2009 2010 20110.00
0.02
0.04
0.06
0.08
0.10
0.12
0.14
0.16
0.18
Source: Eurostat
Natural gas - Retail prices in Hungary (in euro cent/kWh)
H O U S E H O L D S I N D U S T R Y
VAT Other taxes Net price
2005 2006 2007 2008 2009 2010 2011 2005 2006 2007 2008 2009 2010 20110
1
2
3
7
5
6
4

EN
ER
GY
M
AR
KE
TS
I
N
TH
E
EU
RO
PE
AN
U
NI
ON
I
N
20
11
/
1
13
H U N G A R Y
domestic gas production. Such arrangements may distort markets and reduce the room for effective competition.
4.3. Consumers: The retail gas market is assessed forth lowest in the EU. The percentage of consumers reporting problems is about 80 per cent higher than the EU aver-age (highest incidence in the EU) and overall consumer satisfaction is third lowest in the EU. Consumer assess-ment of the electricity retail market is slightly below the EU average (16th place out of 27), with the second highest number of complaints105. A price comparison tool service is not available. Hungarian consumers can ac-cess information concerning their rights, current legisla-tion and means of settling disputes by contacting HEO and the Hungarian Authority for Consumer Protection (Nemzeti Fogyasztóvédelmi Hatóság, HACP). HACP acts as a single contact point and has an office available in each county. Consumers can also contact the Alternative Dispute Resolution (ADR) procedure, managed by the lo-cal Chamber of Commerce and Industry office. Hungary recognises vulnerable consumers on the basis of their social situation or because of health-related issues (two categories). Vulnerable consumers benefit from various measures, including payment by instalments, or deferred
105. 8th Consumer Markets Scoreboard, 2012, European Commission,
DG SANCO, http://ec.europa.eu/consumers/consumer_research/
editions/cms8_en.htm
payment, prepayment options, debt advice, or individual assistance to help consumers understand their bills, etc.
5. Infrastructure
5.1. Electricity: The Hungarian system has the capacity to handle approximately 3000 MW of transit flows with cross-border profiles to Slovakia, Ukraine, Serbia, Austria, Romania and Croatia. Hungary has relatively strong interconnections with its neighbours, amounting to some 30% of the domestic generation capacity installed. The interconnectors between Szombathely (HU) — Wien Südost (AT) and Pécs (HU) — Ernestinovo (HR) were implemented in 2010. Four new interconnection projects between Hungary and Slovakia are under discussion. These projects are important to provide capacity for increasing power flows from the north of Europe to the south and to further facilitate trade.
5.2. Gas: The interconnectors with Croatia and Romania were finalised in 2010 and 2011 and are now operational. The installation of reverse flow capabilities in the Hungarian transmission system is ongoing. The Slovak-Hungarian interconnector is in the planning phase. The Hungarian gas exchange (CEEGEX) has already obtained a licence and is scheduled to start operation on 1 January 2013.
H U N G A RY – K E Y I N D I C ATO R S O F T H E E L E C T R I C I T Y A N D N AT U R A L G A S M A R K E T S
E L E C T R I C I T Y G A S
Number of companies representing at least 95% of net power generation 68 Number of entities bringing natural gas into country 22
Number of main power-generation companies (1) 3 Number of main gas entities (4) 6
Market share of the largest power-generation company 42.1% Market share of the largest entity bringing natural gas 32.6%
Number of electricity retailers 38 Number of retailers selling natural gas to final customers 28
Number of main electricity retailers (2) 5 Number of main natural gas retailers (5) 10
Switching rates (entire electricity retail market) N/A Switching rates for gas (entire retail market) N/A
Regulated prices for households – electricity YES Regulated prices for households – gas YES
Regulated prices for non-households – electricity YES Regulated prices for non-households – gas YES
HHI in power-generation market (3) 2 151 HHI in gas supply market (3) 2 875
HHI in electricity retail market (3) 950 HHI in gas retail market (3) 923
Electricity market value (bn €) (6) 4.517 Gas market value (bn €) (6) 6.312
Sources: Eurostat, CEER, National Regulatory Authority, EC calculations.
(1) Companies are considered as ‘main’ if they produce at least 5% of the national net electricity generation.
(2) Retailers are considered as ‘main’ if they sell at least 5% of the total national electricity consumption.
(3) The HHI (Herfindahl-Hirschman Index) is a commonly accepted measure of market concentration. It is calculated by squaring the market share
of each firm competing in the market and then summing the resulting numbers (the higher the index, the more concentrated the market).
Moderate concentration: 750-1 800; high concentration: 1 800-5 000; very high concentration: above 5 000.
(4) Entities are considered as ‘main’ if they deal with at least 5% of the natural gas (indigenous production or import).
(5) Retailers are considered as ‘main’ if they sell at least 5% of the total natural gas consumed by final customers.
(6) Market value is an estimation of the size of the retail electricity and gas markets. It is calculated using data on electricity and gas consumption
in the household and non-household sectors and annual average retail prices.

EN
ER
GY
M
AR
KE
TS
I
N
TH
E
EU
RO
PE
AN
U
NI
ON
I
N
20
11
/
1
14
1. General overview
Malta’s energy consumption almost exclusively consists of oil and petroleum products. The country’s dependence on imports of these is close to 100%, and it has not used solid fuels, natural gas or any other non-renewable resource for the past two decades. This unusual situation is due mainly to Malta’s isolation from other energy markets in Europe. As it has no oil, gas pipelines or power lines linking it to other parts of Europe, the country is virtually an energy island. Power generation (2.11 TWh in 2010) is based almost exclusively on petroleum products. The country’s 2020 RES target106 for the whole energy sector is 10%. Between 2006 and 2010, its use of renewable energy sources grew slowly, from next to zero to 0.4%. There are a number of on-going projects, including large-scale wind farms, waste-to-energy and solar photovoltaic installations. In 2010 the share of cogeneration107 in the overall electricity production did not reach a statistically significant level.
2. Regulatory framework
2.1. General: As Malta had notified full transposition of the Third Energy Package Directives by the end of September 2011, no infringement proceedings for non-transposition have been opened.
2.2. National Energy Regulator: The national regulatory authority, Malta Resources Authority (MRA), was set up in 2002, and employed 46 staff as of end-2011, with an annual budget of EUR 2.23 million. The limited budget is a constraint on the effectiveness of the regulator. The Malta Resources Authority’s remit has been extended to cover climate change, as well as petroleum, oil and gas exploration in addition to its regulatory functions. Older tasks cover energy, minerals and water regulation,
106. This the share of renewables in Gross Final Energy Consumption.
107. The share of electricity produced in combined heat and power
plants (CHP).
Key Issues
→ Malta is highly dependent on oil, and there is no infrastructure connecting it to any other country, making it vulnerable as regards security of supply. Malta should prioritise development of its energy infrastructure, as recommended by the Council. In particular, the current EEPR Project for an electrical interconnection with Sicily, with a capacity of 220 MW, should be completed, as this would enable renewable energy to be developed and reduce the use of oil. Building the infrastructure needed to provide natural gas should also be given priority.
→ Malta should further pursue the development of its internal grid to enable a much-needed increase in renewable energy.
MALTA
C H A R T S 1 A N D 2
Gross inland consumption (as % of total Mtoe) - 2010
Crude oiland petroleum products
100%Total Mtoe: 0.91
Gross electricity generation (as % of TWh) - 2010
Crude oiland petroleum products
100%Total TWh: 2.11
Source: Eurostat

EN
ER
GY
M
AR
KE
TS
I
N
TH
E
EU
RO
PE
AN
U
NI
ON
I
N
20
11
/
1
15
M A LT A
energy efficiency and promotion of renewable energy. The Malta Resources Authority also promotes energy efficiency and the development of renewable energy.
2.3. Unbundling: There is no transmission system in Malta, only a distribution system. According to Article 44(2) of Directive 2009/72/EC, Malta has obtained derogations from several provisions of the Electricity Directive (Article 9 on unbundling of TSOs, Article 26 on unbundling of DSOs, Article 32 on third party access and Article 33 on market opening and reciprocity). The island is not supplied with natural gas. There is no gas infrastructure.
3. Wholesale markets
3.1. Electricity: At the generation and wholesale trade level, there is only one market player (Enemalta) that generates Malta’s power, supplied predominantly with imported fuels, mainly heavy fuel oil and gas oil.
3.2. Gas: There is no natural gas in Malta. Households are supplied with liquefied petroleum gas (LPG) for heating and cooking purposes. The LPG market was liberalised in 2011, when Liquigas Malta took over importing and sales from Enemalta, and when MRA authorised a second company, Easygas Malta, to enter the LPG market.
4. Retail markets
4.1. Electricity. There is only one provider, Enemalta, in line with Article 44 of the Electricity Directive. The general situation of Malta as an energy island, the lack of an independent power producer that could compete on wholesale prices, as well as the small size of the market, means that it is difficult for the country to achieve a fully-competitive market of the kind that would benefit consumers and ensure secure supply. Both industrial and domestic power prices are regulated. Electricity prices are among the highest in the EU. Taxes account for a very low part of the final electricity price (5% VAT). Energy and supply costs accounted for 86% of domestic prices, with network costs at 14% in 2011. For industrial consumers, the percentages were 88% and 12% respectively. Energy prices have increased substantially in recent years, due to higher heavy fuel oil and gas oil prices. In 2009, Malta started a mandatory roll-out of smart meters, with a pilot of 5 000 installations. The full replacement of all 245 000 electricity meters started in 2010 and should be completed within three years.
4.2. Consumers. Maltese consumers rate their retail electric-ity market 5th highest in the EU, with the 3rd highest score on trust. The market is assessed above the EU average on all indicators except for problems and complaints, which are slightly more prevalent in Malta than in other
EU countries108. Consumers can obtain information and advice from the Malta Consumer’s Association. The Na-tional Regulatory Authority settles unresolved disputes between consumers and electricity suppliers, thereby pro-viding alternative dispute resolution. It is nevertheless noticed that the activity of the NRA in this regard is not sufficiently advertised. Malta recognises ‘vulnerable con-sumers’ through specific provisions in its social laws.
C H A R T 3
Electricity - Retail prices in Malta (in €/kWh)
H O U S E H O L D S I N D U S T R Y
VAT Other taxes Net price
2004 2005 2006 2007 2008 2009 2010 2011 2004 2005 2006 2007 2008 2009 2010 20110.00
0.02
0.04
0.06
0.08
0.10
0.12
0.14
0.16
0.18
Source: Eurostat
5. Infrastructure
The project to build an interconnection with Italy (Sicily) by a 220 MW HVAC submarine cable is progressing well and the line is expected to be in operation by the end of 2013. In parallel to this project, the national electricity company, Enemalta, is preparing the distribution system so as to accommodate the grid to the new connection. Once this connection is up and running, Malta’s isolation will cease.
With regard to gas, Malta promotes the construction of a floating LNG storage and re-gasification unit (FSRU) with a capacity of 75 Tera BTU (2.1 bcm). The project includes a connection to the European Natural Gas Network via a 150 kilometre 25’ diameter pipeline to Gela in Sicily; and the installation of an FSRU to be supplied with LNG shipments, which would be connected to the Delimara Power Station (via a 12 kilometre pipeline) and to the gas interconnection. An estimated 20% of the FSRU’s natural gas capacity would be for local needs and 80% for export to the European market.
108. 8th Consumer Markets Scoreboard, 2012, European Commission,
DG SANCO, http://ec.europa.eu/consumers/consumer_research/
editions/cms8_en.htm

EN
ER
GY
M
AR
KE
TS
I
N
TH
E
EU
RO
PE
AN
U
NI
ON
I
N
20
11
/
1
16
M A LT A
M A LTA – K E Y I N D I C ATO R S O F T H E E L E C T R I C I T Y A N D N AT U R A L G A S M A R K E T S
E L E C T R I C I T Y G A S
Number of companies representing at least 95% of net power generation 1 Number of entities bringing natural gas into country N/A
Number of main power-generation companies (1) 1 Number of main gas entities (4) N/A
Market share of the largest power-generation company 100.0% Market share of the largest entity bringing natural gas N/A
Number of electricity retailers 1 Number of retailers selling natural gas to final customers N/A
Number of main electricity retailers (2) 1 Number of main natural gas retailers (5) N/A
Switching rates (entire electricity retail market) 0.0% Switching rates for gas (entire retail market) N/A
Regulated prices for households – electricity YES Regulated prices for households – gas N/A
Regulated prices for non-households – electricity YES Regulated prices for non-households – gas N/A
HHI in power-generation market (3) 10 000 HHI in gas supply market (3) N/A
HHI in electricity retail market (3) 10 000 HHI in gas retail market (3) N/A
Electricity market value (bn €) (6) 0.334 Gas market value (bn €) (6) N/A
Sources: Eurostat, CEER, National Regulatory Authority, EC calculations.
(1) Companies are considered as ‘main’ if they produce at least 5% of the national net electricity generation.
(2) Retailers are considered as ‘main’ if they sell at least 5% of the total national electricity consumption.
(3) The HHI (Herfindahl-Hirschman Index) is a commonly accepted measure of market concentration. It is calculated by squaring the market share
of each firm competing in the market and then summing the resulting numbers (the higher the index, the more concentrated the market).
Moderate concentration: 750-1 800; high concentration: 1 800-5 000; very high concentration: above 5 000.
(4) Entities are considered as ‘main’ if they deal with at least 5% of the natural gas (indigenous production or import).
(5) Retailers are considered as ‘main’ if they sell at least 5% of the total natural gas consumed by final customers.
(6) Market value is an estimation of the size of the retail electricity and gas markets. It is calculated using data on electricity and gas consumption
in the household and non-household sectors and annual average retail prices.
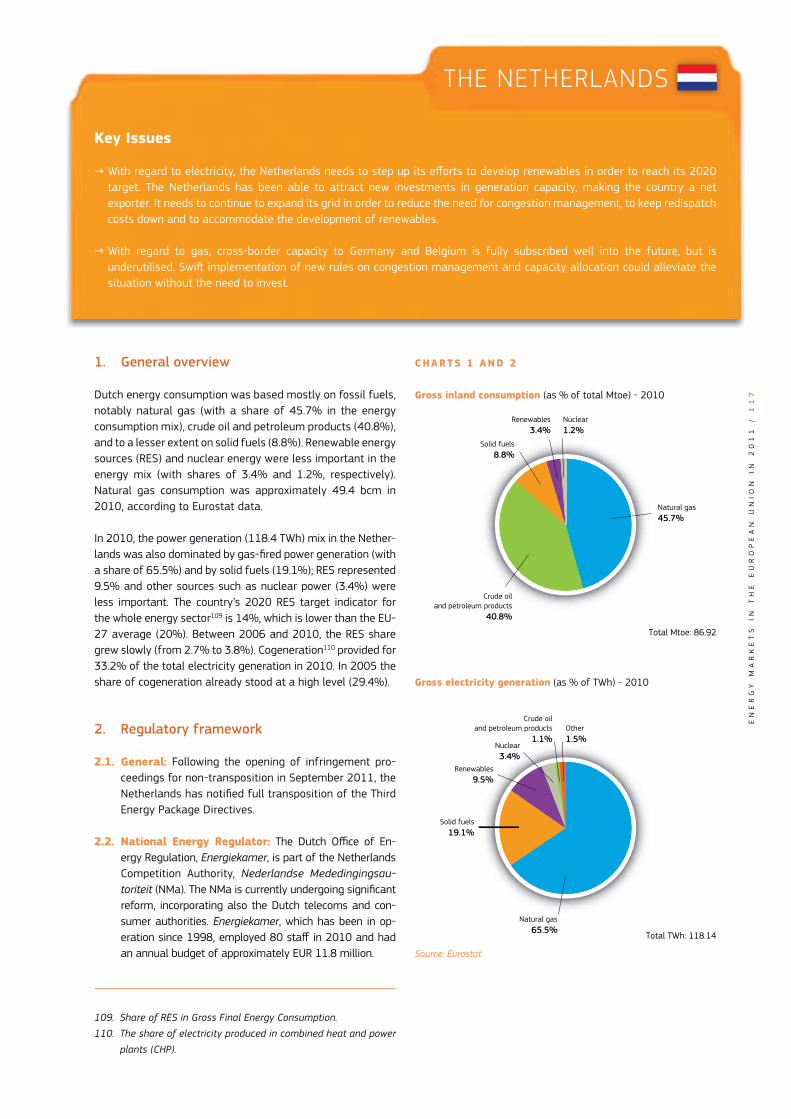
EN
ER
GY
M
AR
KE
TS
I
N
TH
E
EU
RO
PE
AN
U
NI
ON
I
N
20
11
/
1
17
1. General overview
Dutch energy consumption was based mostly on fossil fuels, notably natural gas (with a share of 45.7% in the energy consumption mix), crude oil and petroleum products (40.8%), and to a lesser extent on solid fuels (8.8%). Renewable energy sources (RES) and nuclear energy were less important in the energy mix (with shares of 3.4% and 1.2%, respectively). Natural gas consumption was approximately 49.4 bcm in 2010, according to Eurostat data.
In 2010, the power generation (118.4 TWh) mix in the Nether-lands was also dominated by gas-fired power generation (with a share of 65.5%) and by solid fuels (19.1%); RES represented 9.5% and other sources such as nuclear power (3.4%) were less important. The country’s 2020 RES target indicator for the whole energy sector109 is 14%, which is lower than the EU-27 average (20%). Between 2006 and 2010, the RES share grew slowly (from 2.7% to 3.8%). Cogeneration110 provided for 33.2% of the total electricity generation in 2010. In 2005 the share of cogeneration already stood at a high level (29.4%).
2. Regulatory framework
2.1. General: Following the opening of infringement pro-ceedings for non-transposition in September 2011, the Netherlands has notified full transposition of the Third Energy Package Directives.
2.2. National Energy Regulator: The Dutch Office of En-ergy Regulation, Energiekamer, is part of the Netherlands Competition Authority, Nederlandse Mededingingsau-toriteit (NMa). The NMa is currently undergoing significant reform, incorporating also the Dutch telecoms and con-sumer authorities. Energiekamer, which has been in op-eration since 1998, employed 80 staff in 2010 and had an annual budget of approximately EUR 11.8 million.
109. Share of RES in Gross Final Energy Consumption.
110. The share of electricity produced in combined heat and power
plants (CHP).
C H A R T S 1 A N D 2
Gross inland consumption (as % of total Mtoe) - 2010
Crude oiland petroleum products
40.8%
Natural gas45.7%
Renewables3.4%
Solid fuels8.8%
Nuclear1.2%
Total Mtoe: 86.92
Gross electricity generation (as % of TWh) - 2010
Crude oiland petroleum products
1.1%
Natural gas65.5%
Renewables9.5%
Solid fuels19.1%
Nuclear3.4%
Other 1.5%
Total TWh: 118.14
Source: Eurostat
Key Issues
→ With regard to electricity, the Netherlands needs to step up its efforts to develop renewables in order to reach its 2020 target. The Netherlands has been able to attract new investments in generation capacity, making the country a net exporter. It needs to continue to expand its grid in order to reduce the need for congestion management, to keep redispatch costs down and to accommodate the development of renewables.
→ With regard to gas, cross-border capacity to Germany and Belgium is fully subscribed well into the future, but is underutilised. Swift implementation of new rules on congestion management and capacity allocation could alleviate the situation without the need to invest.
THE NETHERLANDS

EN
ER
GY
M
AR
KE
TS
I
N
TH
E
EU
RO
PE
AN
U
NI
ON
I
N
20
11
/
1
18
T H E N E T H E R L A N D S
2.3. Unbundling: TenneT is the national TSO for the transmission of electricity and Gas Transport Services (GTS) is the TSO for gas. To date, both are fully owned by the Dutch state. The certification of these TSOs has not yet taken place, but they are both expected to apply for certification under the ownership unbundling model. The interconnectors, Britned and BBL, will also be certified as TSOs. At the end of 2010, all (except two) DSOs were fully unbundled from the integrated company and are mostly owned by Dutch municipalities and provinces. There are eight DSOs that supply gas and electricity and two which supply only gas. Due to a court decision, part of the law on unbundling of DSOs expired, leading the two integrated companies that were not yet unbundled to postpone their commitment to Unbundling. The Ministry of Economic Affairs, Agriculture and Innovation appealed to the Supreme Court of the Netherlands and a decision is pending. A request for a preliminary ruling has been addressed to the European Court of Justice.
3. Wholesale markets
3.1. Electricity: At the generation level, the combined market share of the three largest firms in terms of volume of power generation was 59% in 2009 (latest available data). The Dutch power generation market can be deemed to be moderately concentrated, both in terms of the combined power generation capacity of (59%) of the three largest firms and the HHI index for capacity (1 433).
Market integration with neighbouring markets was successfully carried out in 2007 through the Trilateral Market Coupling system involving the Netherlands, Belgium, and France. In late 2010, market coupling was extended to Luxembourg and Germany. The Central Western European (CWE) power region was coupled with the Nordic price area through the Interim Tight Volume Coupling (ITVC) project, which has had a positive effect on the price convergence. Britned, the interconnector between the Netherlands and the United Kingdom, became operational in April 2011, allowing integration of the Dutch and British electricity markets. In its first year of operation, Britned accounted for 7.6 TWh of traded volume in the Netherlands-UK direction and 5.3 TWh of traded volume in the UK-Netherlands direction. Britned offers medium-term products through explicit auctions and a short-term day-ahead product through implicit auctions facilitated by APX-ENDEX. As of May 2012 Britned also offers intraday auctions.
In 2011, the annual average of wholesale day-ahead power prices on the APX market was EUR 52/MWh, up from EUR 45.4/MWh in 2010. The annual traded volume of wholesale day-ahead power in 2011 was 39 TWh, up from 33 TWh in 2010. The number of traders involved in day-ahead power trading on the APX spot market was 56 in 2011. Market liquidity, measured as the ratio of the annual traded volume of day-ahead power to gross inland electricity consumption in the Netherlands, was 33.1% in 2011.
3.2. Gas: The production and wholesale gas markets in the Netherlands are highly concentrated due to the exploitation of the large Groningen field by a single producer. The three largest gas producers covered 93% of the market in terms of available gas111 in 2010, with the Nederlandse Aardolie Maatschappij (NAM) being by far the largest producer. The gas that is produced by NAM is sold exclusively on the wholesale market by the trading company GasTerra to Dutch and foreign customers, most of which are suppliers.
The Netherlands has a well-functioning virtual trading point (the TTF hub) based on an entry-exit system. Gas bought at the TTF is ‘entry-paid’ and can be transported to any exit point in the transmission grid. In 2011, the average day-ahead gas price was EUR 22.6/TWh, up from EUR 17.4/MWh in 2010. The 2011 average price was broadly in line with average prices on the other major west European hubs, ranging from EUR 22-24/MWh. The traded volume of day-ahead gas on the TTF hub increased steeply to 220 TWh in 2011. The introduction of a market-based balancing system contributed considerably to this increase. The churn rate (the ratio of traded volumes to physical gas deliveries) was 4.6 in 2011, up from 3.6 in 2010.
The Netherlands is the biggest natural gas producer in the EU. According to Eurostat data, the country accounted for 40% of EU-27 gas production in 2010. In 2010 the country’s annual production was approximately 63.5 mtoe, however, gas production is forecast to decline significantly by 2020. On the demand side, annual domestic consumption amounted to 39.3 mtoe and exports totalled 42.7 mtoe.
Cross-border interconnection points with Germany and Belgium are fully booked well into the future, but are underutilised, which is inefficient from an economic perspective. Swift implementation of new rules on congestion management and capacity allocation could alleviate the situation without the need to invest.
111. Production plus imports less exports and changes in stocks.

EN
ER
GY
M
AR
KE
TS
I
N
TH
E
EU
RO
PE
AN
U
NI
ON
I
N
20
11
/
1
19
T H E N E T H E R L A N D S
4. Retail markets
4.1. Electricity: Market concentration at retail level was high, as the three largest companies covered 80.3% of the retail market at the end of 2010. Between 2007 and 2011, household prices remained more or less stable. In-dustrial prices decreased slightly during 2010 and 2011.
Energy and supply costs made up 58% of household prices (whereas the share of network costs was 42%) in 2011. For industrial consumers, the share of energy and supply costs of the total price (76%) is high compared to other EU countries, thanks to relatively low network costs (accounting for 24%). There is a correlation between both industrial and household retail prices and wholesale market prices, although it is not strong. It took a couple of months for changes in wholesale prices to be reflected in the retail prices.
The number of customers that switched supplier has decreased compared to 2009 (11%); at the end of 2010 the figure stood at 8.8%.
A legal framework for a voluntary roll-out programme for smart meters was adopted in 2011, which gives house-holds a choice with regard to the installation and use of smart meters. It consists of a two-year trial period (2012-2013) followed by an ‘acceleration’ phase starting in 2014.
4.2. Gas: Even though the market is fully liberalised in the Netherlands, market concentration at the retail level remained high, as the three largest companies covered 78.6% of the retail market at the end of 2010.
Gas prices for both households and industrial consum-ers rose between 2005 and 2008/2009, mainly due to an increase in net prices combined with the general upward trend of wholesale gas prices (see Chart 4). In 2009 the non-VAT tax content of both household and industrial prices was increased. The tax component of the final price was particularly high for households in the Netherlands (39%) in 2011; it was 24% in the case of industrial prices. In 2010 retail gas prices in the Netherlands decreased slightly, while they remained stable in 2011.
There is a strong correlation between wholesale gas prices on the TTF hub and retail prices in the Netherlands (for both industrial and household prices). It took a couple of months for changes in wholesale market prices to be reflected in retail prices.
The number of customers that switched supplier (8.9%) has decreased slightly compared to 2009.
4.3. Consumers: Dutch consumers rate their electricity and gas retail markets above EU average (7th place out of 27 and 11th place out of 23, respectively). Both mar-kets rank well above average on choice (2nd and 3rd highest score in the EU, respectively), switching rates (1st and 5th highest) and satisfaction (highest score in the EU for electricity market). Especially in the gas mar-ket, consumers face fewer problems than the EU-27 average (2nd lowest incidence in the EU); yet complaints are second highest112. Online price comparability tools
112. 8th Consumer Markets Scoreboard, 2012, European Commission,
DG SANCO, http://ec.europa.eu/consumers/consumer_research/
editions/cms8_en.htm
C H A R T S 3 A N D 4
Electricity - Retail prices in Netherlands (in €/kWh)
H O U S E H O L D S I N D U S T R Y
VAT Other taxes Net price
2004 2005 2006 2007 2008 2009 2010 2011 2005 2006 2007 2008 2009 2010 20110.00
0.02
0.04
0.06
0.08
0.10
0.12
0.14
0.16
0.18
0.20
0.22
Source: Eurostat
Natural gas - Retail prices in Netherlands (in euro cent/kWh)
H O U S E H O L D S I N D U S T R Y
VAT Other taxes Net price
2005 2006 2007 2008 2009 2010 2011 2005 2006 2007 2008 2009 2010 20110
1
2
3
9
7
8
6
5
4

EN
ER
GY
M
AR
KE
TS
I
N
TH
E
EU
RO
PE
AN
U
NI
ON
I
N
20
11
/
1
20
T H E N E T H E R L A N D S
for electricity and gas are available and operated by private companies. NMa monitors these tools and pub-lishes the results on the website of the national point of contact, Consuwijzer. Consumers can direct requests for information and complaints to Consuwijzer, which is run by NMa (together with the Dutch telecom and con-sumer authorities). The NRA also handles complaints. The legislation does not define ‘vulnerable customer’, but low-income households benefit from social support schemes and a ‘no-disconnection period’ running from 1 October to 1 April applies to all households.
5. Infrastructure
5.1. Electricity: Generation capacity has been rising sharply since 2008 and this trend is expected to continue, making the Netherlands a potential net exporter of electricity. The downside of this generation surplus is the reduced ability of the transportation grid to accommodate the produced quantities. In an attempt to solve the most urgent problems, Dutch authorities have introduced a congestion management system allowing the TSO to reduce production in one region and increase production in another region of the country. A more sustainable solution lies in the expansion of
the transmission grid by TSO TenneT, which is currently in progress and is expected to result in a strengthening of the 380 kV grid in both the west and the north of the Netherlands.
5.2. Gas: Dutch domestic production from the large Groningen field and numerous small fields is expected to decline in the future, but production currently stands at traditional levels. The Netherlands has retained its position as a net exporter of gas. Nevertheless, the Dutch government is preparing itself for the time when more imports will be necessary by pursuing a strategy to become Europe’s ‘Gas roundabout’ To that end, an LNG terminal near the port of Rotterdam has been constructed which became operational in 2011. Today, H-gas is physically imported from Norway and Russia through interconnection points on the border with Germany. In order to meet peak demand, a new gas storage facility has been built in Zuidwending. Furthermore, several storage facilities (salt caverns) have been built just across the border in Germany, which serve the Dutch market and will all be operational by the end of 2012. In addition a seasonal storage system is being developed by Taqa, which is expected to become operational in 2013.
T H E N E T H E R L A N D S – K E Y I N D I C ATO R S O F T H E E L E C T R I C I T Y A N D N AT U R A L G A S M A R K E T S
E L E C T R I C I T Y G A S
Number of companies representing at least 95% of net power generation 7 Number of entities bringing natural gas into country N/A
Number of main power-generation companies (1) 5 Number of main gas entities (4) N/A
Market share of the largest power-generation company Market share of the largest entity bringing natural gas N/A
Number of electricity retailers 36 Number of retailers selling natural gas to final customers N/A
Number of main electricity retailers (2) 3 Number of main natural gas retailers (5) 3
Switching rates (entire electricity retail market) 8.9% Switching rates for gas (entire retail market) 8.9%
Regulated prices for households – electricity NO Regulated prices for households – gas NO
Regulated prices for non-households – electricity NO Regulated prices for non-households – gas NO
HHI in power-generation market (3) 1 811 HHI in gas supply market (3) 6 535
HHI in electricity retail market (3) 2 264 HHI in gas retail market (3) 2 158
Electricity market value (bn €) (6) 13.661 Gas market value (bn €) (6) 24.321
Sources: Eurostat, CEER, National Regulatory Authority, EC calculations.
(1) Companies are considered as ‘main’ if they produce at least 5% of the national net electricity generation.
(2) Retailers are considered as ‘main’ if they sell at least 5% of the total national electricity consumption.
(3) The HHI (Herfindahl-Hirschman Index) is a commonly accepted measure of market concentration. It is calculated by squaring the market share
of each firm competing in the market and then summing the resulting numbers (the higher the index, the more concentrated the market).
Moderate concentration: 750-1 800; high concentration: 1 800-5 000; very high concentration: above 5 000.
(4) Entities are considered as ‘main’ if they deal with at least 5% of the natural gas (indigenous production or import).
(5) Retailers are considered as ‘main’ if they sell at least 5% of the total natural gas consumed by final customers.
(6) Market value is an estimation of the size of the retail electricity and gas markets. It is calculated using data on electricity and gas consumption
in the household and non-household sectors and annual average retail prices.

EN
ER
GY
M
AR
KE
TS
I
N
TH
E
EU
RO
PE
AN
U
NI
ON
I
N
20
11
/
1
21
1. General
Crude oil and petroleum products were the main energy source in the energy mix with around 38%, while renewables accounted for 26%. The most important renewables are biomass and waste followed by hydro power. Out of 71 TWh of electricity produced in Austria, 68% comes from renewables (chart 2 below), mostly hydro power (58% of total generation). Austria’s indicator for the 2020 renewables target has improved in recent years, from 25.1% (2006) to 30% (2010), the aim being 34% by 2020113. The share of cogeneration114 in the overall electricity production was 15.4% in 2010, which was identical to the share measured in 2005.
2. Regulatory framework
2.1. General: Following the opening of infringement proceedings in September 2011 for non-transposition, Austria has notified full transposition of the Third Energy Package Directives.
2.2. National Energy Regulator: The Austrian National Regulatory Authority, E-Control, in operation since 2001, employed 109 staff in 2011 with an annual budget of EUR 16.2 million. In 2011, E-Control’s powers were increased to monitor price developments. It also obtained more effective sanction mechanisms and the power to launch sector inquiries and to request specific information from companies, as provided for in the directives. However, following the first case of such a sector inquiry in 2011 (on retail margins in electricity), this power was challenged by all retail companies. A decision by the high courts is still pending.
2.3. Unbundling: Austrian Power Grid AG (APG) is the main Austrian electricity TSO, owning approximately 94% of the Austrian high-voltage electricity grid (6 454 km) and operating it as well. APG has been certified as an Independent Transmission Operator (ITO). Austria’s gas TSO
113. This is the share of renewables in Gross Final Energy Consumption.
114. The share of electricity produced in combined heat and power
plants (CHP).
Key Issues
→ Austria should continue efforts to implement day-ahead implicit flow-based electricity transmission capacity allocation procedures for the CEE region in line with the Joint Declaration by ACER and the region’s National Regulatory Authorities. Given the high utilisation levels at the Czech/Austrian border due mainly to high loop flows, Austria should consider building new electricity interconnectors.
→ With regard to gas, Austria is highly dependent on imports. Austria should continue efforts to tackle gas network congestion problems. It should also implement reverse-flow arrangements on the HAG pipeline.
AUSTRIA
C H A R T S 1 A N D 2
Gross inland consumption (as % of total Mtoe) - 2010
Crude oil and petroleum products 37.8%
Renewables 26.2%
Other 2.4% Solid fuels
9.8%
Natural gas23.7%
Total Mtoe: 34.62
Gross electricity generation (as % of TWh) - 2010
Renewables 67.9%
Natural gas22.7%
Crude oiland petroleum
products2%
Other 2.4%
Solid fuels6.9%
Other0.7%
Total TWh: 71.13
Source: Eurostat

EN
ER
GY
M
AR
KE
TS
I
N
TH
E
EU
RO
PE
AN
U
NI
ON
I
N
20
11
/
1
22
A U S T R I A
Gas Connect Austria GmbH has also been certified as an ITO. The certification procedures for Trans Austria Gasleitung GmbH (TAG), Baumgarten Oberkappel Gasleitungsges. m.b.H. (BOG) and Nabucco are still pending. At distribution level in the electricity sector, there are approximately 130 DSOs. Legal ownership unbundling has so far been the preferred unbundling model, leaving DSOs rather limited control over the power grids, which they rent from a vertically integrated producer and/or supplier.
3. Wholesale markets
3.1. Electricity: Austria’s wholesale trading market is joined with Germany and forms a single price zone (both OTC and PX). In this wider market, Austrian traders have a relatively small market share. However, foreign wholesale traders are not very active in Austria, limiting themselves to sales to larger customers consuming between 10-20 GWh. In all, 11 domestic wholesale traders are active in the country. APG is a member of the Central Auction Office (CAO), which brings together the eight TSOs of the Central Eastern European (CEE) region. CAO was established with a view to ensuring coordinated congestion management in the region. It holds daily, monthly and yearly cross-border transmission capacity auctions. APG has agreed intra-day capacity allocation procedures with all its neighbouring TSOs.
Since there are no declared congestions between Austria and Germany, the two countries share a common wholesale electricity market. Through Germany, Austria is partially coupled with the central west European market. On the other hand, it is not yet coupled with its eastern and southern neighbours. In spring 2012, however, ACER and the National Regulatory Authorities in the CEE region (including E-Control) jointly declared their willingness to implement implicit flow-based capacity allocation procedures in the region by the end of 2013.
The average Austrian day-ahead wholesale price on EXAA115 in 2011 was EUR 51.9/MWh for baseload power (15.6% higher than in 2010)116. Relevant factors influencing the wholesale price include the situation in neighbouring countries (notably Germany and the Czech Republic).
3.2. Gas: To satisfy its national gas demand, Austria is highly dependent on imports, its domestic production being lim-ited to 1.7 bcm/y in 2010. In that year, Austria imported 78% of its national consumption, with 67% from Russia,
115. Austrian power is also traded together with German power on
EPEX Spot. For information on prices please see the chapter
on Germany.
116. For a comparison with wholesale prices in neighbouring countries,
please refer to Table 9 of this Staff Working Document, part II.
18% from Germany and the rest from Norway. Both Rus-sia and Norway sell their gas to Austria on the basis of long-term ‘take or pay’ contracts. There is some wholesale trading at the physical trading hub Central European Gas Hub (CEGH) in Baumgarten. Also, Austrian gas traders are active on the NCG and TTF. Furthermore, implementation of the entry-exit access scheme to the gas transmission system, eliminating gas transport along the contractual path and hence the differentiation between gas transit and transmission pipelines, is progressing. Still, the transmis-sion system is highly congested, so access to capacity for new entrants wanting to trade in the Austrian market is limited. In 2009, there was no firm capacity at the Oberka-ppel and Baumgarten entry points (through West Austria Gasleitung [WAG] or Trans-Austria Gasleitung [TAG]) and no firm capacity was available at Control Area East, de-spite capacity often being under-utilised. In 2011, spot gas was sold at the CEGH for EUR 23.8/MWh on average (26.6% higher than in 2010). Despite relative good price alignment with other European hubs, traded volumes were lower compared to other European hubs, with traded day-ahead volumes of 2 TWh, accounting for 7% of gross in-land consumption117. The lack of liquidity of the CEGH is largely due to few sellers of significant volumes.
4. Retail markets
4.1. Electricity: Austria has achieved progress with regard to fostering competition in the retail market for electricity118. In 2010, market concentration at retail level was moderate to high. The market share of the three largest household suppliers was 58%, with the five largest suppliers having 71%. Of the roughly 140 retailers, many operate only at local or regional level. The close cooperation between Wien Energie, ENV and BEWAG through Energieallianz had already increased market concentration at the outset of Austria’s market liberalisation. According to E-Control, several suppliers did not pass on a decrease in network tariffs in early 2011, which points to insufficient competition. In 2011, only 1.5% of household customers switched. Electricity prices are not regulated in Austria, neither for households nor for industrial customers. Since 2008, retail prices have risen gradually in contrast with wholesale market prices. In 2011 the share of network costs in household prices (without taxes) was 44%, around average for the EU, while energy and supply costs accounted for 56%.
4.2. Gas: Market concentration at retail level is high. The combined market share of the three largest suppliers
117. The reporting methodologies differ among hubs, so volumes are
not entirely comparable across them.
118. Council Recommendation on the National Reform Programme
2012 of Austria

EN
ER
GY
M
AR
KE
TS
I
N
TH
E
EU
RO
PE
AN
U
NI
ON
I
N
20
11
/
1
23
A U S T R I A
was 74% in 2010, with the largest market share held by Energieallianz (61%). The twelve gas suppliers in Austria are all majority-owned by regional governments and are partially interlinked. Switching is low, with 1.1% of all end-customers switching supplier in 2011. Since market opening, only around 6% of all final customers have changed supplier. Gas prices are not regulated in Austria, neither for households nor for industrial customers. Generally speaking, there is only little correlation between retail and wholesale prices in the Austrian gas market. In particular, decreases in wholesale prices such as during financial crises are passed on only to a limited extent to household consumers. Since 2006, the number of alternative suppliers in the retail market for small commercial and household customers has increased in eastern Austria. Switching rates grew particularly in the last quarter of 2011, triggered by higher potential savings.
4.3. Consumers: Overall consumer satisfaction with the retail electricity market ranks second highest in the EU. However, consumer satisfaction with the retail gas market is below the EU average119. E-Control provides the Tarifkalkulator, a price comparison tool for both electricity and gas. It is responsible for complaint handling and dispute settlement between consumers and service providers, and also for dealing with disputes concerning access to the grid. The regulatory commission at E-Control can issue a binding decision on the legality of any refusal of system/network access. There is as yet no definition of vulnerable customers, but a protection mechanism does exist. In early 2010, E-Control published a cost-benefit analysis for the roll-out of smart meters. A Ministry of Economics decree
119. European Consumer Markets Monitoring Surveys,
http://ec.europa.eu/consumers/strategy/cons_satisfaction_en.htm
calling for the roll-out of smart meters for 95% of all end consumers by 2019 entered into force in April 2012.
5. Infrastructure
5.1. Electricity: The need for more interconnections with Italy, Slovenia and Switzerland is considerable. The current high levels of utilisation at the Czech/Austrian border may be the result of high loop flows, caused by the generation situation in Germany.
The construction of a 12 km 132 kV interconnector between Arnoldstein and Tarvisio was a positive development in 2011. This was built as a merchant line and TSOs were not directly involved in it.
5.2. Gas: Austria exports approximately 80% of the natural gas it physically imports, with most of these exports going to Italy. Other exports go to Germany. Physical reverse-flow capabilities from Germany to Austria have been operational since April 2011 and from Italy to Austria since October 2011. A new interconnection between the Baumgarten hub and the entry point of the Czech gas pipeline system at Lanzhot is being explored. Austria is part of two major pipeline projects in the region: Nabucco and South Stream. It has large storage capacities, both below and above ground, totalling 7.1 bcm. The reverse-flow projects in Baumgarten and Überackern and along the TAG pipeline, which were co-financed by the EEPR programme, were implemented in 2011. Possibilities to reverse flows on the HAG pipeline should also be put in place.
C H A R T S 3 A N D 4
Electricity - Retail prices in Austria (in €/kWh)
H O U S E H O L D S I N D U S T R Y
VAT Other taxes Net price
2004 2005 2006 2007 2008 2009 2010 2011 2004 2005 2006 2007 2008 2009 2010 20110.00
0.05
0.10
0.15
0.20
0.25
Source: Eurostat
Natural gas - Retail prices in Austria (in euro cent/kWh)
H O U S E H O L D S I N D U S T R Y
VAT Other taxes Net price
2004 2005 2006 2007 2008 2009 2010 2011 2004 2005 2006 2007 2008 2009 2010 20110
1
2
3
4
6
8
5
7
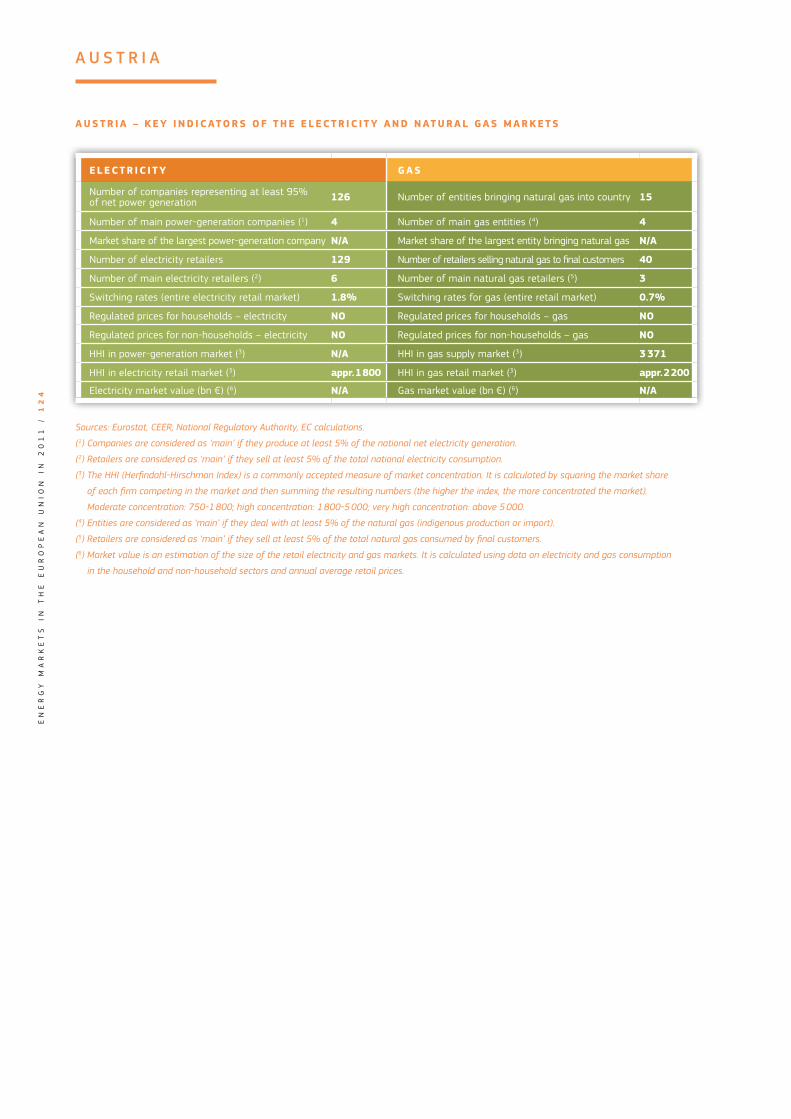
EN
ER
GY
M
AR
KE
TS
I
N
TH
E
EU
RO
PE
AN
U
NI
ON
I
N
20
11
/
1
24
A U S T R I A
A U S T R I A – K E Y I N D I C ATO R S O F T H E E L E C T R I C I T Y A N D N AT U R A L G A S M A R K E T S
E L E C T R I C I T Y G A S
Number of companies representing at least 95% of net power generation 126 Number of entities bringing natural gas into country 15
Number of main power-generation companies (1) 4 Number of main gas entities (4) 4
Market share of the largest power-generation company N/A Market share of the largest entity bringing natural gas N/A
Number of electricity retailers 129 Number of retailers selling natural gas to final customers 40
Number of main electricity retailers (2) 6 Number of main natural gas retailers (5) 3
Switching rates (entire electricity retail market) 1.8% Switching rates for gas (entire retail market) 0.7%
Regulated prices for households – electricity NO Regulated prices for households – gas NO
Regulated prices for non-households – electricity NO Regulated prices for non-households – gas NO
HHI in power-generation market (3) N/A HHI in gas supply market (3) 3 371
HHI in electricity retail market (3) appr. 1 800 HHI in gas retail market (3) appr. 2 200
Electricity market value (bn €) (6) N/A Gas market value (bn €) (6) N/A
Sources: Eurostat, CEER, National Regulatory Authority, EC calculations.
(1) Companies are considered as ‘main’ if they produce at least 5% of the national net electricity generation.
(2) Retailers are considered as ‘main’ if they sell at least 5% of the total national electricity consumption.
(3) The HHI (Herfindahl-Hirschman Index) is a commonly accepted measure of market concentration. It is calculated by squaring the market share
of each firm competing in the market and then summing the resulting numbers (the higher the index, the more concentrated the market).
Moderate concentration: 750-1 800; high concentration: 1 800-5 000; very high concentration: above 5 000.
(4) Entities are considered as ‘main’ if they deal with at least 5% of the natural gas (indigenous production or import).
(5) Retailers are considered as ‘main’ if they sell at least 5% of the total natural gas consumed by final customers.
(6) Market value is an estimation of the size of the retail electricity and gas markets. It is calculated using data on electricity and gas consumption
in the household and non-household sectors and annual average retail prices.

EN
ER
GY
M
AR
KE
TS
I
N
TH
E
EU
RO
PE
AN
U
NI
ON
I
N
20
11
/
1
25
1. General overview
Solid fuel, 83% of which is hard coal, continues to play a major role in Poland’s energy sector. Solid fuel accounts for 54% of the country’s energy consumption mix and nearly 87% in electricity generation. Out of 157.6 TWh of electricity produced in Poland, 7.3% came from renewable energy. Poland’s indicator for the 2020 RES target120 has improved, from 7% in 2006 to 9.4% in 2010. The country’s RES target for 2020 is 15%. The share of cogeneration121 in electricity production was 17.6% in 2010, being slightly higher than in 2006 (16%).
2. Regulatory framework
2.1. General: Poland has not yet fully transposed the Third Energy Package Directives. As regards the Electricity Directive a letter of formal notice was sent in November 2011 and reasoned opinion followed in May 2012. On 24 October 2012, the Commission decided to refer Poland to the Court of Justice for only partially transposing the Directive122. Moreover, three infringement procedures are still open on the Second Energy Package concerning i) regulated wholesale and end user prices in gas; ii) lack of transparency of the conditions for third-party access to natural
120. This is the share of Renewables in Gross Final Energy Consumption.
121. The share of electricity produced in combined heat and power
plants (CHP).
122. IP/12/1139.
Key Issues
→ With regard to electricity, coal is still the main source of fuel for power generation. Poland’s generating capacity is ageing, and the country needs better incentives for investment to replace it with more efficient plant. Poland must fully transpose the Third Energy Package Directives without further delay to liberalise the electricity market. Competition at retail level should be stimulated. Poland needs to continue engaging with its neighbours in order to identify appropriate short and long term solutions to problems caused by loop flows. Poland also needs to reduce congestion on its domestic electricity grid and improve interconnection capacity with neighbouring markets, as recommended by the Council. These shortcomings are slowing down market integration. While taking into account universal service obligations and effective protection of vulnerable customers, retail price regulation for households should be phased out.
→ With regard to gas, Poland should continue its efforts to implement a trading platform and a liquid spot market with commercial balancing and to implement an entry/exit system. It must phase out regulated prices in particular in respect to wholesale markets and gradually in respect to retail markets (always ensuring adequate protection of vulnerable consumers). To tackle temporary shortages, Poland should prioritise market-based measures (e.g. demand-side measures such as interruptible contracts and fuel switching) over non-market-based measures (e.g. release of strategic stocks). Poland should make the Yamal pipeline bi-directional to allow physical reverse flow from the border with Germany to exit points in Poland. Poland should also revise its regulations in respect of tariffs and contracts to enable more easily switching for consumers and less cumbersome procedures for new entry suppliers.
→ Poland must fully transpose the Third Energy Package Directives without further delay to liberalise the electricity and gas markets.
POLAND
C H A R T S 1 A N D 2
Gross inland consumption (as % of total Mtoe) - 2010
Crude oiland petroleum
products26.0%
Natural gas12.6% Renewables
7.2%
Solid fuels53.7%
Other0.6%
Total Mtoe: 101.70
Gross electricity generation (as % of TWh) - 2010
Crude oil andpetroleum products
1.8%Natural gas
4.1%
Renewables7.3%
Solid fuels86.6%
Other0.2%
Total TWh: 157.66
Source: Eurostat

EN
ER
GY
M
AR
KE
TS
I
N
TH
E
EU
RO
PE
AN
U
NI
ON
I
N
20
11
/
1
26
P O L A N D
gas transmission networks and failure to put in place appropriate procedures for dealing with consumer complaints; iii) lack of congestion management and transparency provisions concerning access to the network for cross-border exchanges in electricity and the failure to put in place appropriate procedures for dealing with consumer complaints.
2.2. National Energy Regulator: The Polish National Regulatory Authority, Urząd Regulacji Energetyki (URE), in operation since 1998, employed 300 staff in 2010 with an annual budget of 35 million zloty [about EUR 8.7 million]. The tasks of the regulator were enhanced in 2010, for instance, in the field of consumer protection.
2.3. Unbundling: The TSO in electricity is PSE Operator SA and for gas, Gaz-System SA. Both in electricity and in gas, the TSOs and the vertically-integrated energy companies remain (majority) state-owned. Certification of these TSOs has not yet taken place. By November 2010, Gaz-System S.A. was also appointed operator of the Polish section of the Yamal gas pipeline. The owner of the pipeline remains EuRoPolGaz, owned by PGNiG, Gazprom Export and Gas-Trading. A new intergovernmental agreement was reached between Poland and the Russian Federation, enabling the Polish section of the Yamal pipeline to be operated in line with EU law, and enabling subsequent agreements at company level to reflect the provisions of the intergovernmental agreement.
In 2010, at distribution level, seven out of 22 DSOs in electricity were legally unbundled, while the other 15 were exempted from Unbundling. In gas, there were six DSOs legally unbundled from the PGNiG group and one local DSO, exempted from the unbundling requirement.
3. Wholesale markets
3.1. Electricity: Regarding generation, the three biggest producers together controlled more than 60% of the Polish market. Polska Grupa Energetyczna SA (PGE) had a 36.5% market share, TAURON Polska Energia SA (TAURON) 15.1% and Electricité de France (EDF) 10.2%. Consequently, market concentration remained high. At wholesale trade level, more than two-thirds of elec-tricity was traded through bilateral contracts between producers and distributors in vertically-integrated groups. 17.6% was traded OTC outside the group and only a very small fraction was sold on the POLPX power exchange. One of the positive developments spurring competition was the introduction in 2010 of a legal obligation in the amended Energy Law on genera-tors to sell 15% or 100% (for generators involved in long-term power purchase agreements) of generated electricity through a power exchange, which increased liquidity. Market integration with neighbouring mar-kets, although in general still poor, has also been im-proved thanks to this measure. Increased liquidity ena-
bled Polish and Swedish traders to use capacity on the SwePol interconnector (600 MW) for trading electric-ity between these markets on Nord Pool Spot and the POLPX exchange. Day-ahead trading has been coupled between the Nordic and Polish energy markets since December 2010. The wholesale price in 2011 was on average EUR 52.2/MWh for day-ahead baseload power contracts, up from EUR 48.0/MWh measured in 2010.
3.2. Gas: Annual imports of natural gas were 10.1 bcm in 2010, corresponding to 70% of gross inland consumption. 90% of imports come from Russia under a long-term agreement with Gazprom and 10% from Germany. Domestic production covers around 30% of demand. Poland has considerable potential for developing shale gas extraction and the government has been issuing extraction licences. The country’s shale gas reserves could make it self-sufficient in energy.
Market concentration at the level of imports and production remain very high. Wholesale trade in natural gas in Poland in 2010 took place only within the PGNiG SA group. The market share of PGNiG was 98% in 2010, easing to 97% in 2011, but even companies active in the remaining 2% of the market purchased gas from PGNiG. Wholesale trading remains based exclusively on bilateral contracts. There is no gas trading on exchanges or through hubs. PGNiG SA also booked almost 100% of capacity at all entry points to the Polish gas transmission system with utilisation rates ranging between 50% and 100% of the interconnectors concerned. In November 2011, five companies applied for the virtual reverse flow capacity available on the Yamal pipeline.
Also in 2011, URE initiated a ‘Gas Price Release Programme’ intended to liberalise the Polish market and to foster competition, but the efforts made in this context could be stepped up. There are plans to deregulate tariffs for industrial and commercial customers, and to start trading gas on the gas exchange. In 2011, for the first time, entry-exit rates were introduced into transmission tariffs.
4. Retail markets
4.1. Electricity: In 2010, market concentration was high because most of the sales on the retail market were made by incumbent suppliers which used to be part of the distribution companies before market opening. The three largest companies were TAURON Polska Energia S.A., PGE Dystrybucja S.A. and ENERGA Operator S.A., with a market share of 71%. Switching of suppliers remains insignificant, most likely as a result of regulated prices. In 2011, energy and supply costs accounted for 55% of domestic prices (without taxes), while network costs accounted for 45%. For industrial consumers, the shares were 67% and 33% respectively. The correlation between wholesale and retail prices is distorted due

EN
ER
GY
M
AR
KE
TS
I
N
TH
E
EU
RO
PE
AN
U
NI
ON
I
N
20
11
/
1
27
P O L A N D
to retail price regulation. As for the roll-out of smart meters, an assessment of long-term costs and benefits was implemented in 2012, following a report by the URE in 2008. No legal framework is currently in place.
4.2. Gas: In 2010, market concentration at retail level was very similar to that at wholesale level. The market was dominated by the incumbent PGNiG SA, with its share of approximately 98%, easing to 97% in 2011. The 2% was highly fragmented, with several dozen companies buying gas from PGNiG and reselling it to final customers. No switching took place. Both domestic and industrial prices were subject to regulation. In 2011, gas prices were reduced by 3.23% on average, due to a rebate expected under import agreements which PGNiG S.A. concluded with Gazprom. According to the agreement, 15% of imported gas was covered by a rebate.
4.3. Consumers: Consumers’ overall assessment is just below the EU average for retail gas market (12th place out of 23 countries) and well below for retail electricity market (21st place out of 27). Both markets are ranked below EU average for all indicators, except problems and - in the gas retail market - choice. The number of problems faced fell considerably between 2010 and 2012 while the choice has increased compared to 2011123. In June 2011, URE introduced an on-line price comparability tool for electricity and gas prices, but it does not yet include gas options. Since September 2011, consumers have also been able to obtain information and make complaints on electricity and gas
123. 8th Consumer Markets Scoreboard, 2012, European Commission,
DG SANCO, http://ec.europa.eu/consumers/consumer_research/
editions/cms8_en.htm
to a single contact point at ERO. There appears to be no alternative dispute resolution mechanism of the type required under the Third Energy Package Directives yet. To date, Poland has not defined vulnerable consumers.
5. Infrastructure
5.1. Electricity: Despite the 600 MW SwePol interconnector, the lack of cross-border transmission capacity is a major impediment for integration. This situation is exacerbated by the increasing level of power generated from RES in Northern Germany, which creates loop-flows. Congestion is also caused by the uneven geographic distribution of generation. A feasibility study for a new 500 MW link between Poland and Lithuania (LitPolLink) is being carried out. LitPolLink is part of the Baltic Energy Market Interconnection Plan (BEMIP).
5.2. Gas: There are four projects that recently received support from the European Energy Programme for Recovery (EEPR), two interconnections, PL-DE and PL-CZ, an LNG terminal in Swinoujscie and an upgrade of the transmission system in north-western Poland. The Commission also welcomes an ambitious programme of investment in gas storage, with support from vari-ous European funds. Last year, the virtual reverse flow on the Yamal transit pipeline was made available. Fea-sibility studies are being carried out for interconnec-tions with Slovakia (part of N-S Interconnections) and Lithuania (part of BEMIP).
C H A R T S 3 A N D 4
Electricity - Retail prices in Poland (in €/kWh)
H O U S E H O L D S I N D U S T R Y
VAT Other taxes Net price
2004 2005 2006 2007 2008 2009 2010 2011 2004 2005 2006 2007 2008 2009 2010 20110.00
0.02
0.04
0.06
0.08
0.10
0.12
0.14
0.16
Source: Eurostat
Natural gas - Retail prices in Poland (in euro cent/kWh)
H O U S E H O L D S I N D U S T R Y
VAT Other taxes Net price
2005 2006 2007 2008 2009 2010 2011 2005 2006 2007 2008 2009 2010 20110
1
2
3
5
4

EN
ER
GY
M
AR
KE
TS
I
N
TH
E
EU
RO
PE
AN
U
NI
ON
I
N
20
11
/
1
28
P O L A N D
P O L A N D – K E Y I N D I C ATO R S O F T H E E L E C T R I C I T Y A N D N AT U R A L G A S M A R K E T S
E L E C T R I C I T Y G A S
Number of companies representing at least 95% of net power generation 68 Number of entities bringing natural gas into country 17
Number of main power-generation companies (1) 5 Number of main gas entities (4) 1
Market share of the largest power-generation company 17% Market share of the largest entity bringing natural gas 97%
Number of electricity retailers 146 Number of retailers selling natural gas to final customers 52
Number of main electricity retailers (2) 7 Number of main natural gas retailers (5) 1
Switching rates (entire electricity retail market) 0.05% Switching rates for gas (entire retail market) 0.00%
Regulated prices for households – electricity YES Regulated prices for households – gas YES
Regulated prices for non-households – electricity NO Regulated prices for non-households – gas YES
HHI in power-generation market (3) 1 835 HHI in gas supply market (3) 9 600
HHI in electricity retail market (3) 2 000 HHI in gas retail market (3) 9 500
Electricity market value (bn €) (6) 13.565 Gas market value (bn €) (6) 6.970
Sources: Eurostat, CEER, National Regulatory Authority, EC calculations.
(1) Companies are considered as ‘main’ if they produce at least 5% of the national net electricity generation.
(2) Retailers are considered as ‘main’ if they sell at least 5% of the total national electricity consumption.
(3) The HHI (Herfindahl-Hirschman Index) is a commonly accepted measure of market concentration. It is calculated by squaring the market share
of each firm competing in the market and then summing the resulting numbers (the higher the index, the more concentrated the market).
Moderate concentration: 750-1 800; high concentration: 1 800-5 000; very high concentration: above 5 000.
(4) Entities are considered as ‘main’ if they deal with at least 5% of the natural gas (indigenous production or import).
(5) Retailers are considered as ‘main’ if they sell at least 5% of the total natural gas consumed by final customers.
(6) Market value is an estimation of the size of the retail electricity and gas markets. It is calculated using data on electricity and gas consumption
in the household and non-household sectors and annual average retail prices.

EN
ER
GY
M
AR
KE
TS
I
N
TH
E
EU
RO
PE
AN
U
NI
ON
I
N
20
11
/
1
29
1. General overview
Crude oil and petroleum products make up slightly more than half of the energy mix. Renewable energy sources (RES) were the second most important fuel type in the mix. No nuclear power is generated in Portugal. At 53.2%, the greatest source of power was RES. Portugal’s 2020 RES indicator124 increased from 20.8% in 2006 to 24.6% in 2010. It aims to reach 31%. The share of cogeneration125 in electricity production was 11.8% in 2010, showing a great deal of stability since 2005 when it was 11.6%.
2. Regulatory framework
2.1. General: As Portugal had notified full transposition of the Third Energy Package Directives by the end of September 2011, no infringement proceedings for non-transposition have been opened. Some implementing acts regarding the role of the national regulator are in preparation. Portugal made also several commitments regarding reforms of the energy markets, including abolishment of regulated prices for gas and electricity and further measures protecting vulnerable customers.
2.2. National Energy Regulator: The Portuguese National Energy Regulatory Authority, Entidade Reguladora dos Serviços Energéticos (ERSE), in operation since 1998, employed a staff of 80 in 2010, with a budget of almost EUR 11 million. ERSE’s independence from the Ministry of Energy should be ensured including equipment with suf-ficient financial means allowing fulfilling its functions fore-seen in the Third Package. Its powers with regard to arbi-tration and enforcing penalties should also be guaranteed.
124. This is the share of renewables in Gross Final Energy Consumption.
125. The share of electricity produced in combined heat and power
plants (CHP).
Key Issues
→ With regard to electricity, Portugal should address the economic sustainability of the national electricity system in line with the Memorandum of Understanding with the Commission, the ECB and the IMF, in particular in terms of support for renewables and co-generation, and stranded cost compensation (Cost of Maintenance of Contractual Equilibrium (CMECs)). To this end, it should accelerate convergence to market-based pricing for co-generation operators in parallel with changes in the electricity market. It should aim to increase the number of interconnections with France and Spain. These are essential for the creation of a regional market in the south-western region.
→ With regard to both electricity and gas, while taking into account universal service obligation and effective protection of customers, Portugal should phase out regulated gas prices for end-customers, as envisaged in the legislation that is in force or is being prepared.
→ With regard to the gas wholesale market, Mibgas should be further developed, in particular in terms of harmonising cross-border tariffs with Spain. Portugal should maintain its plans to increase the cross-border capacity of the gas network with Spain by 2015.
→ With regard to regulatory matters, the energy regulator’s independence from the Ministry of Energy should be ensured. Its powers with regard to arbitration and enforcing penalties should also be guaranteed.
PORTUGAL
C H A R T S 1 A N D 2
Gross inland consumption (as % of total Mtoe) - 2010
Crude oiland petroleumproducts50.8%
Natural gas18.4%
Renewables22.5%
Solid fuels6.8%
Other1.5%
Total Mtoe: 24.37
Gross electricity generation (as % of TWh) - 2010
Crude oiland petroleum products
5.6%
Natural gas27.5%
Renewables53.2%
Solid fuels13.1%
Other0.6%
Total TWh: 54.09
Source: Eurostat
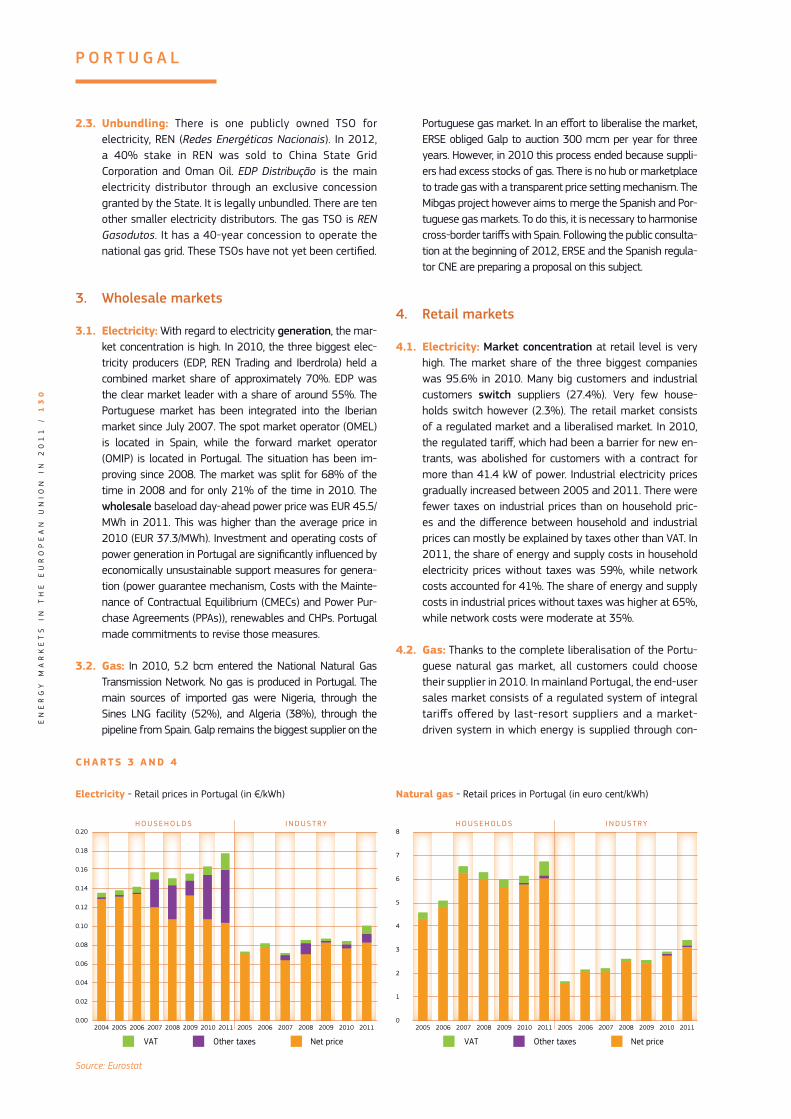
EN
ER
GY
M
AR
KE
TS
I
N
TH
E
EU
RO
PE
AN
U
NI
ON
I
N
20
11
/
1
30
P O R T U G A L
2.3. Unbundling: There is one publicly owned TSO for electricity, REN (Redes Energéticas Nacionais). In 2012, a 40% stake in REN was sold to China State Grid Corporation and Oman Oil. EDP Distribução is the main electricity distributor through an exclusive concession granted by the State. It is legally unbundled. There are ten other smaller electricity distributors. The gas TSO is REN Gasodutos. It has a 40-year concession to operate the national gas grid. These TSOs have not yet been certified.
3. Wholesale markets
3.1. Electricity: With regard to electricity generation, the mar-ket concentration is high. In 2010, the three biggest elec-tricity producers (EDP, REN Trading and Iberdrola) held a combined market share of approximately 70%. EDP was the clear market leader with a share of around 55%. The Portuguese market has been integrated into the Iberian market since July 2007. The spot market operator (OMEL) is located in Spain, while the forward market operator (OMIP) is located in Portugal. The situation has been im-proving since 2008. The market was split for 68% of the time in 2008 and for only 21% of the time in 2010. The wholesale baseload day-ahead power price was EUR 45.5/MWh in 2011. This was higher than the average price in 2010 (EUR 37.3/MWh). Investment and operating costs of power generation in Portugal are significantly influenced by economically unsustainable support measures for genera-tion (power guarantee mechanism, Costs with the Mainte-nance of Contractual Equilibrium (CMECs) and Power Pur-chase Agreements (PPAs)), renewables and CHPs. Portugal made commitments to revise those measures.
3.2. Gas: In 2010, 5.2 bcm entered the National Natural Gas Transmission Network. No gas is produced in Portugal. The main sources of imported gas were Nigeria, through the Sines LNG facility (52%), and Algeria (38%), through the pipeline from Spain. Galp remains the biggest supplier on the
Portuguese gas market. In an effort to liberalise the market, ERSE obliged Galp to auction 300 mcm per year for three years. However, in 2010 this process ended because suppli-ers had excess stocks of gas. There is no hub or marketplace to trade gas with a transparent price setting mechanism. The Mibgas project however aims to merge the Spanish and Por-tuguese gas markets. To do this, it is necessary to harmonise cross-border tariffs with Spain. Following the public consulta-tion at the beginning of 2012, ERSE and the Spanish regula-tor CNE are preparing a proposal on this subject.
4. Retail markets
4.1. Electricity: Market concentration at retail level is very high. The market share of the three biggest companies was 95.6% in 2010. Many big customers and industrial customers switch suppliers (27.4%). Very few house-holds switch however (2.3%). The retail market consists of a regulated market and a liberalised market. In 2010, the regulated tariff, which had been a barrier for new en-trants, was abolished for customers with a contract for more than 41.4 kW of power. Industrial electricity prices gradually increased between 2005 and 2011. There were fewer taxes on industrial prices than on household pric-es and the difference between household and industrial prices can mostly be explained by taxes other than VAT. In 2011, the share of energy and supply costs in household electricity prices without taxes was 59%, while network costs accounted for 41%. The share of energy and supply costs in industrial prices without taxes was higher at 65%, while network costs were moderate at 35%.
4.2. Gas: Thanks to the complete liberalisation of the Portu-guese natural gas market, all customers could choose their supplier in 2010. In mainland Portugal, the end-user sales market consists of a regulated system of integral tariffs offered by last-resort suppliers and a market-driven system in which energy is supplied through con-
C H A R T S 3 A N D 4
Electricity - Retail prices in Portugal (in €/kWh)
H O U S E H O L D S I N D U S T R Y
VAT Other taxes Net price
2004 2005 2006 2007 2008 2009 2010 2011 2005 2006 2007 2008 2009 2010 20110.00
0.02
0.04
0.06
0.08
0.10
0.12
0.14
0.16
0.18
0.20
Source: Eurostat
Natural gas - Retail prices in Portugal (in euro cent/kWh)
H O U S E H O L D S I N D U S T R Y
VAT Other taxes Net price
2005 2006 2007 2008 2009 2010 2011 2005 2006 2007 2008 2009 2010 20110
1
2
3
8
6
7
5
4

EN
ER
GY
M
AR
KE
TS
I
N
TH
E
EU
RO
PE
AN
U
NI
ON
I
N
20
11
/
1
31
P O R T U G A L
tracts with non-regulated prices. During 2010, around 1 100 industrial users, roughly one third, switched gas supplier. Gas prices for industrial consumers were much lower than for households during the last couple of years.
4.3. Consumers: Consumers’ overall assessment of retail gas markets is just below the EU average (14th place out of 23), with the second lowest score on choice. The retail electricity market is ranked 5th lowest in the EU, with particularly poor scores on choice (second lowest in the EU) and ease of switching (third lowest)126. A price comparison tool for electricity is available on the NRA’s website. It is planned to develop such a tool for gas in 2012. In 2011, Portugal passed new legislation on electricity and gas127. It describes the single point of contact as a centralised platform that will give consumers all the information they need to exercise their rights, as well as information about legislation and dispute resolution mechanisms. Complaints should be made to the energy supplier, who must answer within 15 working days. If the supplier does not meet this deadline, the consumer will automatically be compensated. Several bodies are in charge of alternative dispute resolution, such as
126. 8th Consumer Markets Scoreboard, 2012, European Commission,
DG SANCO, http://ec.europa.eu/consumers/consumer_research/
editions/cms8_en.htm
127. Law 77/2011 on electricity and Law 78/2011 on gas.
consumer associations, arbitration centres and public bodies. There is a definition of vulnerable consumers based on social criteria. In 2007, the National Energy Services Entity presented a cost-benefit analysis and a non-legally binding meter substitution plan for the period 2010–15.
5. Infrastructure
5.1. Electricity: Portugal currently has relatively few inter-connections with France and Spain. To reduce splitting in the Iberian Electricity Market, an investment pro-gramme has been put in place to increase the capac-ity of interconnections with the Spanish transmission network. It includes the construction of a new 400 kV line and the construction of two new 400 kV intercon-nections. They will almost double capacity. Under the European Energy Programme for Recovery (EEPR), REN received EUR 45 million to reinforce the two intercon-nections with Spain (Douro Region and the Algarve).
5.2. Gas: Gas is expected to play an increasingly important role as a back-up fuel given the increasing production of electricity from renewable sources. This requires an increase in cross-border capacity. REN Gasodutos received EUR 10.7 million from the EEPR to enable reverse flow capacity into the gas network. This will prepare the network for the development of a third interconnection with Spain.
P O R T U G A L – K E Y I N D I C ATO R S O F T H E E L E C T R I C I T Y A N D N AT U R A L G A S M A R K E T S
E L E C T R I C I T Y G A S
Number of companies representing at least 95% of net power generation 107 Number of entities bringing natural gas into country 7
Number of main power-generation companies (1) 2 Number of main gas entities (4) 2
Market share of the largest power-generation company 47.2% Market share of the largest entity bringing natural gas 95.8%
Number of electricity retailers 10 Number of retailers selling natural gas to final customers 18
Number of main electricity retailers (2) 4 Number of main natural gas retailers (5) 6
Switching rates (entire electricity retail market) 2.3% Switching rates for gas (entire retail market) N/A
Regulated prices for households – electricity YES Regulated prices for households – gas YES
Regulated prices for non-households – electricity YES Regulated prices for non-households – gas NO
HHI in power-generation market (3) 4 068 HHI in gas supply market (3) N/A
HHI in electricity retail market (3) 4 581 HHI in gas retail market (3) 4 391
Electricity market value (bn €) (6) 5.640 Gas market value (bn €) (6) 2.388
Sources: Eurostat, CEER, National Regulatory Authority, EC calculations.
(1) Companies are considered as ‘main’ if they produce at least 5% of the national net electricity generation.
(2) Retailers are considered as ‘main’ if they sell at least 5% of the total national electricity consumption.
(3) The HHI (Herfindahl-Hirschman Index) is a commonly accepted measure of market concentration. It is calculated by squaring the market share
of each firm competing in the market and then summing the resulting numbers (the higher the index, the more concentrated the market).
Moderate concentration: 750-1 800; high concentration: 1 800-5 000; very high concentration: above 5 000.
(4) Entities are considered as ‘main’ if they deal with at least 5% of the natural gas (indigenous production or import).
(5) Retailers are considered as ‘main’ if they sell at least 5% of the total natural gas consumed by final customers.
(6) Market value is an estimation of the size of the retail electricity and gas markets. It is calculated using data on electricity and gas consumption
in the household and non-household sectors and annual average retail prices.

EN
ER
GY
M
AR
KE
TS
I
N
TH
E
EU
RO
PE
AN
U
NI
ON
I
N
20
11
/
1
32
1. General overview
Gas represented 30% of the Romanian energy consumption mix in 2010, followed by petroleum products (26%) and solid fuels (20%). The significant share of RES (16%) and nuclear power (8%) contributes to a balanced energy mix. The power generation mix is mainly shared between solid fuels (34%), renewables (33.5%) and nuclear (19%). The country’s 2020 renewable target indicator128 increased from 17.2% in 2006 to 23.4% in 2010, the aim being 24% by 2020. The share of cogeneration129 in electricity production was 10.8 in 2010.
2. Regulatory framework
2.1. General: Following the opening of infringement proceedings in September 2011 for non-transposition, Romania has declared that the Third Energy Package Directives have been now fully transposed. The Commission is conducting a prima-facie examination of the completeness of the transposition based on the measures notified and other information provided in the proceedings. One infringement procedure is still open on the Second Energy Package concerning the lack of transparency of the conditions for third-party access to natural gas transmission networks and the
128. This is the share of renewables in Gross Final Energy Consumption.
129. The share of electricity produced in combined heat and power
plants (CHP).
Key Issues
→ With regard to electricity, Romania needs to phase out regulated end-user prices for non-household customers by the end of 2013 and for household customers (while taking into account universal service obligation and effective protection of customers) by the end of 2017 in line with the roadmap adopted by the Romanian government in March 2012. Furthermore, Romania should set up a functioning intra-day market and provide for procedures for the allocation of capacities on interconnectors, including implementation of market-based and coordinated congestion management on all its borders. Romania should abolish all transaction-related transmission charges and review discriminatory rules of participation on its power exchange organised by Opcom. Interconnectors also need to be expanded. Romania has an action plan to upgrade and extend its infrastructure, which needs to be updated in accordance with EU and national legislative requirements.
→ With regard to gas, Romania needs to phase out regulated end-user prices for non-household customers by the end of 2014 and for household customers (while also ensuring effective protection of vulnerable customers) by the end of 2018 in line with the roadmap adopted by the Romanian government in June 2012. High market concentration at production level combined with bilateral long-term supply contracts are structural obstacles to more competition in this market. Full third-party access to gas pipelines should be implemented, including virtual backhaul capacity on all pipelines. Romania needs to set up an organised wholesale gas market. The ‘transit’ pipelines need to be linked physically to the Romanian national gas system. Romania should make the new HU-RO interconnection bi-directional and remain committed to timely implementation of the Romania-Bulgaria reverse flow and a new Romania-Bulgaria Interconnection (both EEPR co-financed).
→ Romania needs to restore the independence and financial autonomy of its national regulatory authority ANRE.
ROMANIA
C H A R T S 1 A N D 2
Gross inland consumption (as % of total Mtoe) - 2010
Crude oiland petroleum products
25.8%
Natural gas30.1%Renewables
16.3%
Solid fuels19.5%
Nuclear 8.4%
Total Mtoe: 35.71
Gross electricity generation (as % of TWh) - 2010
Crude oiland petroleum products1.1%Natural gas
12.1%
Renewables33.5%
Solid fuels34.1%
Nuclear19.2%
Total TWh: 60.62
Source: Eurostat

EN
ER
GY
M
AR
KE
TS
I
N
TH
E
EU
RO
PE
AN
U
NI
ON
I
N
20
11
/
1
33
R O M A N I A
lack of an adequate system of penalties in the event of breaches of the Gas Regulation130.
2.2. National Energy Regulator: The Romanian National Regulatory Authority, Autoritatea Nationala de Reglementare in domeniul Energiei (ANRE), has been in operation since 1998. In 2010 it employed 232 staff with an annual budget of EUR 6.6 million and had 10 regional offices. ANRE’s independence and its financial autonomy were seriously curtailed in 2009 and 2010 due to two national laws that changed the regulator’s status.
2.3. Unbundling: The state owns the majority of the shares in the electricity TSO (CN Transelectrica SA) and gas TSO (Transgaz SA). Romania plans to choose the ISO model for both TSOs, a model largely implemented already in 2000. The TSOs currently have no ownership of the transmission systems they operate, which are owned directly by the state. At distribution level, 8 of the 37 electricity DSOs are legally unbundled while the others are exempt from unbundling. In the gas sector, 2 of the 39 DSOs are ownership-unbundled while the others are exempt from unbundling.
3. Wholesale markets
3.1. Electricity: In 2010, at generation level, the three larg-est producers controlled 65% of the market. The gov-ernment owns most of the large generation companies. Further, hydro power from these generators is often sold below market prices131. This situation makes it difficult for independent power producers to compete with the state-owned companies: they do not have access to the low-cost hydro and nuclear generation capabilities. At wholesale level most electricity is sold through bilat-eral contracts, but increasing volumes are sold on the
130. A decision to refer the matter to the Court of Justice by the
College of Commissioners was taken in November 2011 (see
IP/11/1437). In concrete terms, the Commission considers
that Romania does not offer interruptible backhaul capacity at
all interconnection points. The inclusion of backhaul capacity
is essential to use the network to its maximum capacity.
Moreover, interruptible capacity and short-term services are
vital for newcomers to enter the market. In addition, the TSO
in Romania does not entirely comply with EU transparency
requirements. Without information on available capacity,
the gas market cannot become really competitive and new
entrants cannot gain access to it. However, following the
Commission decision, the national authorities have taken some
steps towards complying with EU law and the Commission is
overseeing progress in this respect.
131. The Commission has launched in-depth inquiries into preferential
electricity tariffs granted by Romanian hydroelectricity generator
Hidroelectrica to various companies. See Cases SA. 33451,
33475 and 33581.
Romanian electricity exchange, OPCOM. Trading on the OPCOM Power Exchange accounts for about one quarter of Romania’s electricity supply, and this share is expect-ed to double when regulated prices for non-residential consumers are removed by the end of 2013 and state-owned generators move those volumes from the regu-lated market to OPCOM, as required by law. The growing importance of the power exchange makes it all the more important to review its admission criteria and to imple-ment changes to ensure equal participation for all trad-ers irrespective of their country of establishment.
Romania maintains a system of transmission tariffs which hinders the free flow of electricity across its borders. This not only hinders trade between Member States but also reduces the efficiency of the planned market coupling between Romania and the wider CEE region. The tariff system should therefore be reviewed so as to abolish all transaction-related charges. No functioning intra-day market is yet in place in Romania, but there is a day-ahead market with hourly products for the next day. Market integration with neighbouring markets is still in its infancy. Interconnectors to Bulgaria and Hungary are regularly congested, and trading is still solely through bilaterally coordinated auctions. Romania is a net exporter of electricity. Wholesale prices in 2011 were on average EUR 52.13/MWh for baseload power132 (a 43% increase compared to 2010). Market liquidity was lower than in major central-western European hubs (16-17% in 2010 and 2011), but there is a clear upward trend (in 2008 the ratio was 9.6%).
3.2. Gas: Romania has the third largest gas reserves in the EU. The country imported only 2.3 bcm of natural gas, corresponding to 17% of its gas consumption in 2010 (98% of imports come from Russia). Natural gas is extracted by two companies, Romgaz (state-owned) and Petrom (51% owned by OMV and 20% state-owned). The opening of the new 4.4 bcm Arad-Szeged interconnector with Hungary in October enables gas to be imported from other sources (the reverse flow to Hungary still needs to be implemented). At wholesale level, gas is sold exclusively through long-term bilateral contracts between producers and suppliers. This hampers market entry. There is neither an organised wholesale market nor a spot market. OPCOM has been designated to set up a gas exchange. Transgaz applies the first-come-first-served capacity allocation method, which is not the most suitable for the allocation of scarce capacity. Since 2010, it has been possible to book interruptible capacity products, which gives third parties more opportunities to gain access to the grid.
132. For a comparison with wholesale prices in neighbouring countries,
please refer to Table 9 of this Staff Working Document, part II.

EN
ER
GY
M
AR
KE
TS
I
N
TH
E
EU
RO
PE
AN
U
NI
ON
I
N
20
11
/
1
34
R O M A N I A
4. Retail markets
4.1 Electricity: Market concentration at retail level remains moderate. Price regulation continues to exist for both household and industrial customers. A roadmap was adopted by the Romanian government in March 2012 to phase out regulated electricity prices for non-household customers by the end of 2013 and for household customers by the end of 2017. However, as long as regulated prices remain and are below market prices, switching rates will continue to be negligible (0.06%). Power prices for industrial consumers decreased by 10% between the first half of 2008 and the first half of 2011. In comparison, power prices for households (taxes included) increased by 2% in the same period due to a strong increase in the tax element of the final price (+33%). The share of network costs in Romanian household prices (without taxes) was the highest in the EU-27 in 2010 (60.2%) and in 2011 (61%), while energy and supply costs accounted for only 39.8% in 2010 and 39% in 2011. For industrial electricity prices, the opposite is true: in 2010, network costs accounted for 39% (35% in 2011) of the net industry retail price while the share of commodity and supply costs was 61% (65% in 2011).
4.2. Gas: The Romanian retail gas market consists of a competitive segment and a regulated segment. Almost all of the approximately three million gas consumers in Romania fall under the regulated segment, where prices are set by the regulator rather than being determined by supply and demand. A roadmap was adopted by the Romanian government in June 2012
to phase out regulated gas prices for non-household customers by the end of 2014 and for household customers by the end of 2018. In the regulated segment, two large companies, E.On and GdF Suez, cover around 91% of the market; the rest of the market is covered by 37 very small suppliers. Since prices for the household consumers in this segment are regulated, no switching takes place. Around 1500 consumers are in the competitive segment. As set out in chart 4 below, gas prices for industrial consumers decreased by 13% between the first half of 2008 and the first half of 2011, despite a significant increase in taxes. For households, the trend was similar with taxes accounting for 48% of the final price in 2011. The share of network costs in Romanian household prices (without taxes) was the highest in the EU-27 in 2010 (60.2%), while energy and supply costs accounted for only 39.8%. For industrial electricity prices the opposite is true: network costs accounted for 39% of the net industry retail price while the share of commodity and supply costs was 61%.
4.3. Consumers: Consumers’ overall assessment of the retail gas market is 5th lowest in the EU, with choice, problems and overall satisfaction within the 3 worst ratings in the EU. The electricity market is assessed just above the EU average (14th place out of 27) even though the percentage of consumers experiencing problems is 80% above the EU average (4th highest percentage in the EU)133. The role and responsibilities of the NRA with regard to consumer protection issues are weak. However, a new law regulating ANRE
133. 8th Consumer Markets Scoreboard, 2012, European Commission,
DG SANCO, http://ec.europa.eu/consumers/consumer_research/
editions/cms8_en.htm
C H A R T S 3 A N D 4
Electricity - Retail prices in Romania (in €/kWh)
H O U S E H O L D S I N D U S T R Y
VAT Other taxes Net price
2004 2005 2006 2007 2008 2009 2010 20112005 2006 2007 2008 2009 2010 20110.00
0.02
0.04
0.06
0.08
0.10
0.12
0.14
0.16
0.18
0.20
Source: Eurostat
Natural gas - Retail prices in Romania (in euro cent/kWh)
H O U S E H O L D S I N D U S T R Y
VAT Other taxes Net price
2005 2006 2007 2008 2009 2010 2011 2005 2006 2007 2008 2009 2010 20110
1
2
3
5
4

EN
ER
GY
M
AR
KE
TS
I
N
TH
E
EU
RO
PE
AN
U
NI
ON
I
N
20
11
/
1
35
R O M A N I A
will strengthen its powers in this regard. Also, the roadmaps for phasing out regulated electricity and gas prices provide a number of accompanying measures to enhance ANRE’s powers and responsibilities in the retail market. For example, ANRE will develop a price comparison tool and set up a protection scheme for vulnerable customers. The Energy Act defines the concept of vulnerable consumers, which includes residential consumers who, for reasons such as illness or age and by decision of the government, benefit from subsidies and are ensured connection to the electricity supply service. In 2010, 1.2 million consumers out of a total of 8.3 million benefited from a social tariff.
5. Infrastructure
5.1. Electricity: Romania’s power grid is not well-maintained, resulting in frequent outages, mainly in distribution networks. Power losses are high and electricity theft is frequently encountered. It is estimated that around 13% of generated power is lost for these reasons. The TSO, Transelectrica, has planned investments of over EUR 500 million to upgrade infrastructure, and ANRE has approved a
plan to improve the transmission network from 2009 to 2017. The improvement of interconnections with neighbouring countries is being examined, in particular the construction of a 600 MW sub-sea cable to Turkey and the improvement of connections to Bulgaria, Hungary and Serbia. The EU Synergy Programme helps to finance some of these improvements.
5.2. Gas: Romania’s efforts to diversify its sources of supply are pursuing different options. The national gas system and the ‘transit’ gas system, i.e. the pipelines transporting Russian gas further downstream, need to be physically linked in order to enable more diversification and to support security of supply in Romania. This measure is part of an EERP-financed infrastructure project, which also provides for the implementation of reverse flows on these ‘transit’ pipelines. The Szeged-Arad bi-directional interconnector to Hungary was co-financed by the EERP. Romania is also exploring the possibility to host Nabucco and South Stream as well as a new interconnector to Bulgaria and the Azerbaijan-Georgia-Romania Interconnection (AGRI project), which would bring liquefied Azeri gas to Romania across the Black Sea.
R O M A N I A – K E Y I N D I C ATO R S O F T H E E L E C T R I C I T Y A N D N AT U R A L G A S M A R K E T S
E L E C T R I C I T Y G A S
Number of companies representing at least 95% of net power generation 10 Number of entities bringing natural gas into country 19
Number of main power-generation companies (1) 6 Number of main gas entities (4) 2
Market share of the largest power-generation company 35.6% Market share of the largest entity bringing natural gas 48.4%
Number of electricity retailers 56 Number of retailers selling natural gas to final customers 63
Number of main electricity retailers (2) 8 Number of main natural gas retailers (5) 5
Switching rates (entire electricity retail market) 0.1% Switching rates for gas (entire retail market) N/A
Regulated prices for households – electricity YES Regulated prices for households – gas YES
Regulated prices for non-households – electricity YES Regulated prices for non-households – gas YES
HHI in power-generation market (3) 1 947 HHI in gas supply market (3) N/A
HHI in electricity retail market (3) 1 333 HHI in gas retail market (3) 1 679
Electricity market value (bn €) (6) 3.799 Gas market value (bn €) (6) 4.056
Sources: Eurostat, CEER, National Regulatory Authority, EC calculations.
(1) Companies are considered as ‘main’ if they produce at least 5% of the national net electricity generation.
(2) Retailers are considered as ‘main’ if they sell at least 5% of the total national electricity consumption.
(3) The HHI (Herfindahl-Hirschman Index) is a commonly accepted measure of market concentration. It is calculated by squaring the market share
of each firm competing in the market and then summing the resulting numbers (the higher the index, the more concentrated the market).
Moderate concentration: 750-1 800; high concentration: 1 800-5 000; very high concentration: above 5 000.
(4) Entities are considered as ‘main’ if they deal with at least 5% of the natural gas (indigenous production or import).
(5) Retailers are considered as ‘main’ if they sell at least 5% of the total natural gas consumed by final customers.
(6) Market value is an estimation of the size of the retail electricity and gas markets. It is calculated using data on electricity and gas consumption
in the household and non-household sectors and annual average retail prices.

EN
ER
GY
M
AR
KE
TS
I
N
TH
E
EU
RO
PE
AN
U
NI
ON
I
N
20
11
/
1
36
1. General overview
Crude oil and petroleum products have the largest share in the energy mix, representing one third in 2010. Nuclear energy is also very important, with 20% of the energy mix and the highest percentage in the electricity mix. Hydro power is by far the most significant source of renewable electricity (95% in 2010). Slovenia’s target for 2020 is to have 25% of renewables134. In 2006, it reached 15.5%, rising to 19.8% in 2010. The share of cogeneration135 in electricity production was 6.9% in 2010, which is a slight decrease compared to 2005 when it stood at 7.3%.
2. Regulatory framework
2.1. General: Slovenia has not yet fully transposed the Third Energy Package Directives. Letters of formal notice were sent in September 2011 and reasoned opinions followed in June 2012. On 24 October 2012, the Commission decided to refer Slovenia to the Court of Justice for only partially transposing the two Directives136.
2.2. National Energy Regulator: The Slovenian national regulator, the Energy Agency of the Republic of Slovenia (AGEN-RS) has been in operation since 2000. In 2011 it employed 43 staff with an annual budget of almost EUR 3 million.
2.3. Unbundling: In the electricity sector, Slovenia has one state-owned TSO, ELES, and one DSO, SODO, that cover the entire territory. The gas grid operator is Plinovodi d.o.o., 100% owned by but legally independent from Geoplin since 2005. Geoplin is the biggest gas company in the country. The Commission adopted a certification opinion on Plinovodi in July 2012. Slovenia has opted for the ITO model. Slovenia has 16 gas DSOs, which are mainly owned by the local communities. None of them have more than 100 000 customers and they are not legally unbundled.
134. This is the share of renewables in Gross Final Energy Consumption.
135. The share of electricity produced in combined heat and power
plants (CHP).
136. IP/12/1139.
Key Issues
→ An increase in cross-border capacity could help boost competition in the Slovenian power market, and could improve the market coupling mechanism with Italy. Strengthening the national electricity grid would fill infrastructure gaps and help deal with the loop flow issues.
→ With regard to gas, Slovenia suffers from frequent contractual congestion at its border points. More effective congestion management procedures could help alleviate this problem, whilst allowing for more competition in the market. Cooperation with neighbouring countries should be enhanced. Slovenia should also upgrade its gas transmission system and implement the Recovery fund project, which would enhance cross-border gas transmission in Europe.
SLOVENIA
C H A R T S 1 A N D 2
Gross inland consumption (as % of total Mtoe) - 2010
Crude oiland petroleum products
34.7%
Natural gas11.6%
Renewables14.4%
Solid fuels19.6%
Nuclear19.7%
Total Mtoe: 7.26
Gross electricity generation (as % of TWh) - 2010
Natural gas3.3%
Renewables30.0%
Solid fuels32.2%
Nuclear34.5%
Total TWh: 16.43
Source: Eurostat

EN
ER
GY
M
AR
KE
TS
I
N
TH
E
EU
RO
PE
AN
U
NI
ON
I
N
20
11
/
1
37
S L O V E N I A
3. Wholesale markets
3.1. Electricity: Regarding generation, the state-owned group HSE has a dominant position with a market share of 62.4% in 2011. Together with state-owned GEN energija (26.4%) and TE-TOL (3.7%), the three undertakings have a market share of 92.5%, forming a tight oligopoly. The small Slov-enian electricity market is situated between three regional markets with very different energy prices. In January 2011 Slovenia implemented market coupling with Italy but price convergence has been limited due to limited interconnec-tion capacity and differences in generating capacity.
The organiser of the electricity market in Slovenia is Borzen, and BSP Regional Energy Exchange is the Slov-ene power exchange. The average day-ahead wholesale price in 2011 for baseload power was EUR 57.2/MWh (an increase of 23.8% compared to 2010)137. In terms of liquidity, 1.5 TWh were traded on the spot market, representing 11% of national electricity consumption.
3.2. Gas: In 2011 Slovenia imported 0.9 bcm of gas, of which 48% was supplied from Russia, 23% from Algeria, 22% from Austria and 7% from Italy. These imports are mainly based on long-term contracts with Russia and Algeria. The Slovenian system is connected to the Croatian, Austrian and Italian transmission grids. The utilisation rates are very high and congestion, both contractual and physical, occurs frequently. Currently, the only two applicable congestion management procedures are the offer of interruptible capacity and the possibility to trade capacity on the secondary market.
137. For a comparison with wholesale prices in neighbouring countries,
please refer to Table 9 of this Staff Working Document, part II.
The largest importer, trader and supplier of natural gas is Geoplin, whose share represents 92.8% of all imports in 2010. The other two suppliers are Adriaplin and Petrol Plin.
Slovenia does not have an organised hub and therefore no reference wholesale price can be given. Estimates of long-term prices for Russian gas give an annual average of approximately EUR 32.2/MWh for 2011 (7.3% higher than in 2010).
4. Retail markets
4.1. Electricity: Eight electricity suppliers have a market share of over 5% and all of them are primarily state-owned. Market concentration at retail level is high and the market share of GEN-I is the highest, at 19.9%. In 2010, the annual switching rate in the retail market was 1.9% for households and 4.2% for the whole retail market. Power prices for domestic consumers have increased in recent years. Apart from a higher energy price this was also a consequence of increased taxes and duties. In 2011, the share of network costs within the household prices (without levies and taxes) was 47%, while energy and supply costs accounted for 53%. For industrial electricity prices, the proportions were 75% and 25% respectively. End-user prices are not regulated. No legal framework is in place to address the roll-out of smart metering, but a cost-benefit analysis has been carried out with a positive macroeconomic outcome.
C H A R T S 3 A N D 4
Electricity - Retail prices in Slovenia (in €/kWh)
H O U S E H O L D S I N D U S T R Y
VAT Other taxes Net price
2004 2005 2006 2007 2008 2009 2010 2011 2004 2005 2006 2007 2008 2009 2010 20110.00
0.02
0.04
0.06
0.08
0.10
0.12
0.14
0.16
Source: Eurostat
Natural gas - Retail prices in Slovenia (in euro cent/kWh)
H O U S E H O L D S I N D U S T R Y
VAT Other taxes Net price
2005 2006 2007 2008 2009 2010 2011 2005 2006 2007 2008 2009 2010 20110
1
2
3
8
6
7
5
4
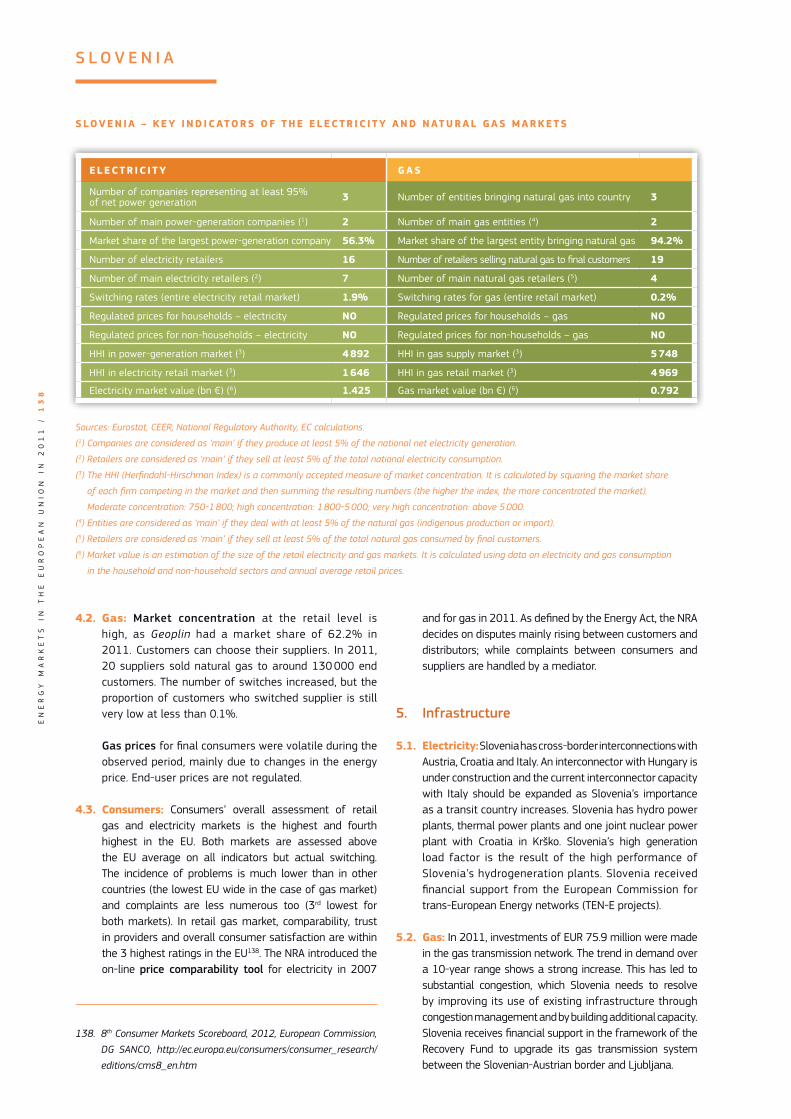
EN
ER
GY
M
AR
KE
TS
I
N
TH
E
EU
RO
PE
AN
U
NI
ON
I
N
20
11
/
1
38
S L O V E N I A
4.2. Gas: Market concentration at the retail level is high, as Geoplin had a market share of 62.2% in 2011. Customers can choose their suppliers. In 2011, 20 suppliers sold natural gas to around 130 000 end customers. The number of switches increased, but the proportion of customers who switched supplier is still very low at less than 0.1%.
Gas prices for final consumers were volatile during the observed period, mainly due to changes in the energy price. End-user prices are not regulated.
4.3. Consumers: Consumers’ overall assessment of retail gas and electricity markets is the highest and fourth highest in the EU. Both markets are assessed above the EU average on all indicators but actual switching. The incidence of problems is much lower than in other countries (the lowest EU wide in the case of gas market) and complaints are less numerous too (3rd lowest for both markets). In retail gas market, comparability, trust in providers and overall consumer satisfaction are within the 3 highest ratings in the EU138. The NRA introduced the on-line price comparability tool for electricity in 2007
138. 8th Consumer Markets Scoreboard, 2012, European Commission,
DG SANCO, http://ec.europa.eu/consumers/consumer_research/
editions/cms8_en.htm
and for gas in 2011. As defined by the Energy Act, the NRA decides on disputes mainly rising between customers and distributors; while complaints between consumers and suppliers are handled by a mediator.
5. Infrastructure
5.1. Electricity: Slovenia has cross-border interconnections with Austria, Croatia and Italy. An interconnector with Hungary is under construction and the current interconnector capacity with Italy should be expanded as Slovenia’s importance as a transit country increases. Slovenia has hydro power plants, thermal power plants and one joint nuclear power plant with Croatia in Krško. Slovenia’s high generation load factor is the result of the high performance of Slovenia’s hydrogeneration plants. Slovenia received financial support from the European Commission for trans-European Energy networks (TEN-E projects).
5.2. Gas: In 2011, investments of EUR 75.9 million were made in the gas transmission network. The trend in demand over a 10-year range shows a strong increase. This has led to substantial congestion, which Slovenia needs to resolve by improving its use of existing infrastructure through congestion management and by building additional capacity. Slovenia receives financial support in the framework of the Recovery Fund to upgrade its gas transmission system between the Slovenian-Austrian border and Ljubljana.
S LOV E N I A – K E Y I N D I C ATO R S O F T H E E L E C T R I C I T Y A N D N AT U R A L G A S M A R K E T S
E L E C T R I C I T Y G A S
Number of companies representing at least 95% of net power generation 3 Number of entities bringing natural gas into country 3
Number of main power-generation companies (1) 2 Number of main gas entities (4) 2
Market share of the largest power-generation company 56.3% Market share of the largest entity bringing natural gas 94.2%
Number of electricity retailers 16 Number of retailers selling natural gas to final customers 19
Number of main electricity retailers (2) 7 Number of main natural gas retailers (5) 4
Switching rates (entire electricity retail market) 1.9% Switching rates for gas (entire retail market) 0.2%
Regulated prices for households – electricity NO Regulated prices for households – gas NO
Regulated prices for non-households – electricity NO Regulated prices for non-households – gas NO
HHI in power-generation market (3) 4 892 HHI in gas supply market (3) 5 748
HHI in electricity retail market (3) 1 646 HHI in gas retail market (3) 4 969
Electricity market value (bn €) (6) 1.425 Gas market value (bn €) (6) 0.792
Sources: Eurostat, CEER, National Regulatory Authority, EC calculations.
(1) Companies are considered as ‘main’ if they produce at least 5% of the national net electricity generation.
(2) Retailers are considered as ‘main’ if they sell at least 5% of the total national electricity consumption.
(3) The HHI (Herfindahl-Hirschman Index) is a commonly accepted measure of market concentration. It is calculated by squaring the market share
of each firm competing in the market and then summing the resulting numbers (the higher the index, the more concentrated the market).
Moderate concentration: 750-1 800; high concentration: 1 800-5 000; very high concentration: above 5 000.
(4) Entities are considered as ‘main’ if they deal with at least 5% of the natural gas (indigenous production or import).
(5) Retailers are considered as ‘main’ if they sell at least 5% of the total natural gas consumed by final customers.
(6) Market value is an estimation of the size of the retail electricity and gas markets. It is calculated using data on electricity and gas consumption
in the household and non-household sectors and annual average retail prices.

EN
ER
GY
M
AR
KE
TS
I
N
TH
E
EU
RO
PE
AN
U
NI
ON
I
N
20
11
/
1
39
1. General overview
In 2010, natural gas was the most important source in the Slovak energy mix, replacing solid fuels, whose share has been steadily decreasing (in 1990 their share was 37%).
In 2010 most electricity was produced from nuclear energy. Even after the closure of two reactors in Jaslovské Bohunice, nuclear energy provides half of the power produced in the country. As far as renewable energy is concerned, Slovakia’s national target is to achieve a share of 14%139. This indicator improved from 6.6% in 2006 to 9.8% in 2010. The share of cogeneration140 in electricity production was 15.9% in 2010; similarly to its share in 2005 (15.3%).
2. Regulatory framework
2.1. General: Following the opening of infringement proceedings in September 2011 for non-transposition, Slovakia has declared that the Third Package Directives have been now fully transposed. The Commission is conducting a prima-facie examination of the completeness of the transposition based on the measures notified and other information provided in the proceedings.
2.2. National Energy Regulator: The Slovakian National Regulatory Authority, Úrad pre reguláciu siet’ových odevetví (URSO), was established in 2001. In 2010 it employed 93 staff and had an annual budget of around EUR 3 million. URSO regulates electricity, gas, water and district heating. The budget, which is voted by the government, is part of the global government budget. Following recent complaints, the Commission is investigating the independence of URSO.
139. The share of renewables in Gross Final Energy Consumption.
140. The share of electricity produced in combined heat and power
plants (CHP).
C H A R T S 1 A N D 2
Gross inland consumption (as % of total Mtoe) - 2010
Crude oiland petroleum
products20%
Natural gas28%
Renewables8%
Solid fuels22%
Nuclear21%
Other1%
Total Mtoe: 17.92
Gross electricity generation (as % of TWh) - 2010
Natural gas9.8%
Renewables22.7%
Solid fuels12.8%
Nuclear52.4%
Other2%
Total TWh: 27.84
Source: Eurostat
Key Issues
→ Slovakia needs to foster the opening of electricity and gas markets and in particular step up its efforts to end the regulation of end-user prices.
→ Slovakia should cooperate with neighbouring countries to solve the problem of loop flows and enhance electricity cross-border capacity.
→ Slovakia should continue its efforts to build strong north-south gas interconnections with Poland and Hungary. These are instrumental in providing the Central European region with access to gas supply sources coming from the south-east. Implementation of the Hungary-Slovakia gas interconnector is particularly important.
SLOVAKIA
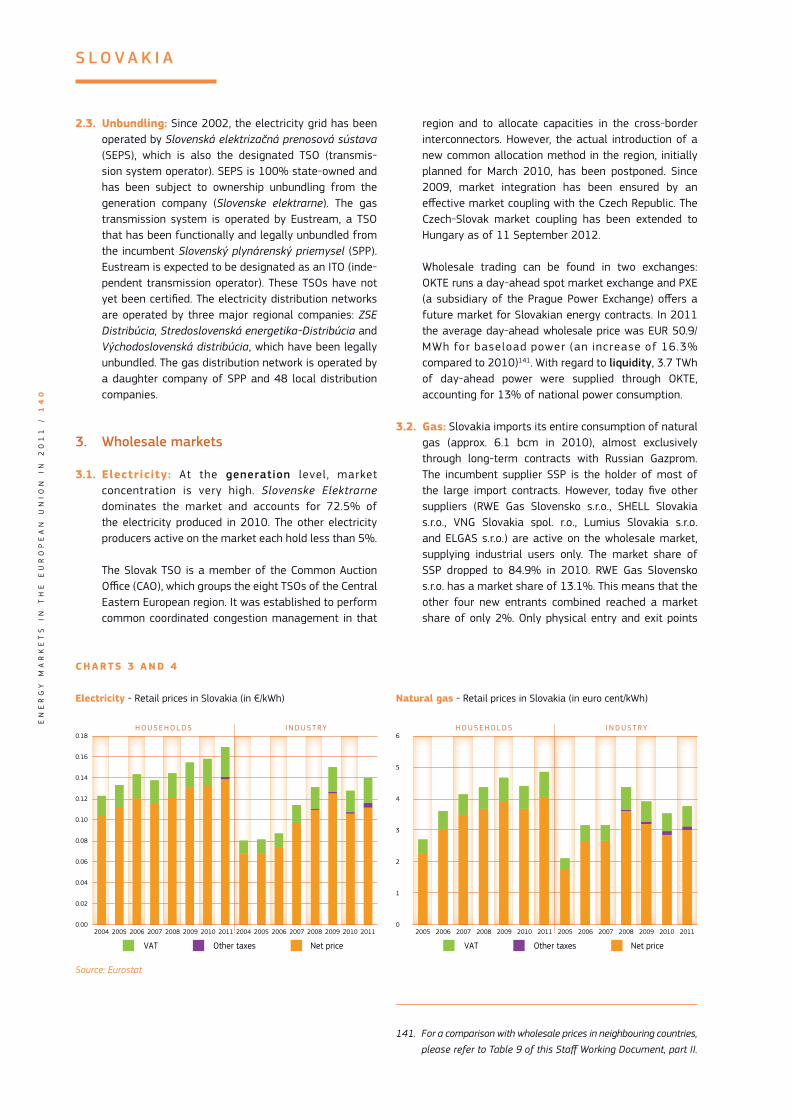
EN
ER
GY
M
AR
KE
TS
I
N
TH
E
EU
RO
PE
AN
U
NI
ON
I
N
20
11
/
1
40
S L O V A K I A
2.3. Unbundling: Since 2002, the electricity grid has been operated by Slovenská elektrizačná prenosová sústava (SEPS), which is also the designated TSO (transmis-sion system operator). SEPS is 100% state-owned and has been subject to ownership unbundling from the generation company (Slovenske elektrarne). The gas transmission system is operated by Eustream, a TSO that has been functionally and legally unbundled from the incumbent Slovenský plynárenský priemysel (SPP). Eustream is expected to be designated as an ITO (inde-pendent transmission operator). These TSOs have not yet been certified. The electricity distribution networks are operated by three major regional companies: ZSE Distribúcia, Stredoslovenská energetika-Distribúcia and Východoslovenská distribúcia, which have been legally unbundled. The gas distribution network is operated by a daughter company of SPP and 48 local distribution companies.
3. Wholesale markets
3.1. Electricity: At the generation level, market concentration is very high. Slovenske Elektrarne dominates the market and accounts for 72.5% of the electricity produced in 2010. The other electricity producers active on the market each hold less than 5%.
The Slovak TSO is a member of the Common Auction Office (CAO), which groups the eight TSOs of the Central Eastern European region. It was established to perform common coordinated congestion management in that
region and to allocate capacities in the cross-border interconnectors. However, the actual introduction of a new common allocation method in the region, initially planned for March 2010, has been postponed. Since 2009, market integration has been ensured by an effective market coupling with the Czech Republic. The Czech-Slovak market coupling has been extended to Hungary as of 11 September 2012.
Wholesale trading can be found in two exchanges: OKTE runs a day-ahead spot market exchange and PXE (a subsidiary of the Prague Power Exchange) offers a future market for Slovakian energy contracts. In 2011 the average day-ahead wholesale price was EUR 50.9/MWh for baseload power (an increase of 16.3% compared to 2010)141. With regard to liquidity, 3.7 TWh of day-ahead power were supplied through OKTE, accounting for 13% of national power consumption.
3.2. Gas: Slovakia imports its entire consumption of natural gas (approx. 6.1 bcm in 2010), almost exclusively through long-term contracts with Russian Gazprom. The incumbent supplier SSP is the holder of most of the large import contracts. However, today five other suppliers (RWE Gas Slovensko s.r.o., SHELL Slovakia s.r.o., VNG Slovakia spol. r.o., Lumius Slovakia s.r.o. and ELGAS s.r.o.) are active on the wholesale market, supplying industrial users only. The market share of SSP dropped to 84.9% in 2010. RWE Gas Slovensko s.r.o. has a market share of 13.1%. This means that the other four new entrants combined reached a market share of only 2%. Only physical entry and exit points
141. For a comparison with wholesale prices in neighbouring countries,
please refer to Table 9 of this Staff Working Document, part II.
C H A R T S 3 A N D 4
Electricity - Retail prices in Slovakia (in €/kWh)
H O U S E H O L D S I N D U S T R Y
VAT Other taxes Net price
2004 2005 2006 2007 2008 2009 2010 2011 2004 2005 2006 2007 2008 2009 2010 20110.00
0.02
0.04
0.06
0.08
0.10
0.12
0.14
0.16
0.18
Source: Eurostat
Natural gas - Retail prices in Slovakia (in euro cent/kWh)
H O U S E H O L D S I N D U S T R Y
VAT Other taxes Net price
2005 2006 2007 2008 2009 2010 2011 2005 2006 2007 2008 2009 2010 20110
1
2
4
6
3
5

EN
ER
GY
M
AR
KE
TS
I
N
TH
E
EU
RO
PE
AN
U
NI
ON
I
N
20
11
/
1
41
S L O V A K I A
to the gas transmission network (Veľké Kapušany, Lanžhot, Baumgarten) or domestic off-take points can be used for trading in natural gas. As it is only at the Austrian Baumgarten-hub that gas can be traded at an exchange, trading is mostly done ‘over the counter’. No wholesale reference price can be provided. Estimates of long-term prices for Russian gas amount to an annual average of around EUR 27.9/MWh in 2011 (an increase of 14.7% compared to 2010).
4. Retail markets
4.1. Electricity: There are three main suppliers in Slovakia (ZSE, SSE and VSE), which are also vertically integrated with the distribution companies. They supply 52.1% of total consumption and are in a dominant position in their regional home markets. As a result of regulated prices of supply for households and small industrial customers, switching of suppliers is insignificant with an overall rate of 0.82% for households and 1.57% for industrial consumers.
Power prices for households have increased in the last couple of years, mostly as a result of the net energy price and the widespread introduction of RES (renewable energy sources) into the national market. In 2011 the share of network costs within the household price (without taxes) accounted for 53% of the price, with 47% for energy and supply costs. In the case of industrial electricity prices, these proportions were 51% and 49% respectively. Price regulation exists for household and small industrial consumers, acting as a barrier to the development of competitive supply markets for these segments.
There is no roll-out plan for smart meters, but Slovakia notified a cost-benefit analysis on smart meters to the Commission in September 2012.
4.2. Gas: Gas prices for final consumers are volatile. It appears that the volatility of energy commodity prices on the global market has had an influence on Slovak retail gas prices. Prices are not regulated for industry, although they are regulated for households with a consumption of under 6 500 m3. The fact that prices for household gas customers are regulated means that there is no switching of suppliers. New suppliers on the Slovak market concentrate on industrial customers, so some switching does take place in that segment of the gas market (10.1%).
4.3. Consumers: Consumers in Slovakia rate their retail electricity market second highest in the EU, with above average scores on all indicators. Trust in providers is the second highest in the EU while comparability and overall consumer satisfaction rank the third highest. A similar picture is observed for the retail gas market (ranked 4th highest in the EU), with scores above the EU average on all indicators but ease of switching. Also, overall consumer satisfaction is the second highest in the EU142. The central authorities responsible for consumer protection are URSO, the Regulation Council and the Ministry of the Economy. URSO provides a price comparison tool and information on consumer rights, relevant legislation and dispute settlement options, and could therefore be viewed as acting as a single point of contact. When consumers need assistance, they can address their complaints to URSO. URSO settles disputes related to grid access only.
5. Infrastructure
5.1. Electricity: Slovakia is interconnected with the Czech Republic, Hungary, Poland and Ukraine. Further interconnections with Hungary are planned. Currently, the main focus of electricity infrastructure investment is on upgrading some of the existing 220 kV lines to 400 kV. The transmission system is affected by loop flows, most often originating in Germany, which are passed through Poland into the Czech Republic and Slovakia.
5.2. Gas: The Slovak gas network is connected with Ukraine, Austria and the Czech Republic. Slovakia also has two gas storage sites. Under the EEPR project, the Commission is co-financing the Hungary-Slovakia interconnector which is in the planning phase.
142. 8th Consumer Markets Scoreboard, 2012, European Commission,
DG SANCO, http://ec.europa.eu/consumers/consumer_research/
editions/cms8_en.htm

EN
ER
GY
M
AR
KE
TS
I
N
TH
E
EU
RO
PE
AN
U
NI
ON
I
N
20
11
/
1
42
S L O V A K I A
S LOVA K I A – K E Y I N D I C ATO R S O F T H E E L E C T R I C I T Y A N D N AT U R A L G A S M A R K E T S
E L E C T R I C I T Y G A S
Number of companies representing at least 95% of net power generation 8 Number of entities bringing natural gas into country 7
Number of main power-generation companies (1) 1 Number of main gas entities (4) 3
Market share of the largest power-generation company 80.9% Market share of the largest entity bringing natural gas 77.7%
Number of electricity retailers 77 Number of retailers selling natural gas to final customers 14
Number of main electricity retailers (2) 5 Number of main natural gas retailers (5) 3
Switching rates (entire electricity retail market) 1.0% Switching rates for gas (entire retail market) 0.2%
Regulated prices for households – electricity YES Regulated prices for households – gas YES
Regulated prices for non-households – electricity YES Regulated prices for non-households – gas NO
HHI in power-generation market (3) 5 280 HHI in gas supply market (3) 7 388
HHI in electricity retail market (3) appr. 1 500 HHI in gas retail market (3) appr. 7 300
Electricity market value (bn €) (6) 3.818 Gas market value (bn €) (6) 2.998
Sources: Eurostat, CEER, National Regulatory Authority, EC calculations.
(1) Companies are considered as ‘main’ if they produce at least 5% of the national net electricity generation.
(2) Retailers are considered as ‘main’ if they sell at least 5% of the total national electricity consumption.
(3) The HHI (Herfindahl-Hirschman Index) is a commonly accepted measure of market concentration. It is calculated by squaring the market share
of each firm competing in the market and then summing the resulting numbers (the higher the index, the more concentrated the market).
Moderate concentration: 750-1 800; high concentration: 1 800-5 000; very high concentration: above 5 000.
(4) Entities are considered as ‘main’ if they deal with at least 5% of the natural gas (indigenous production or import).
(5) Retailers are considered as ‘main’ if they sell at least 5% of the total natural gas consumed by final customers.
(6) Market value is an estimation of the size of the retail electricity and gas markets. It is calculated using data on electricity and gas consumption
in the household and non-household sectors and annual average retail prices.

EN
ER
GY
M
AR
KE
TS
I
N
TH
E
EU
RO
PE
AN
U
NI
ON
I
N
20
11
/
1
43
1. General overview
In 2010, crude oil and petroleum products had the largest share (27.8%) of the country’s energy mix, followed by renewable energy sources (RES). Finland’s power generation mix was dominated by nuclear energy (28.3%) and RES (30%), while solid fuels and natural gas also contributed significantly to electricity production. The share of RES in the country’s gross final energy consumption in 2010 was 32.2%, which is almost three times as high as the EU average of 12.5%. Finland’s overall RES share in 2020 is predicted to be 38%. The share of cogeneration143 was 36.2% in 2010, one of the highest in the EU, however, slightly less than in 2005 (38.9%).
2. Regulatory framework
2.1. General: Following the opening of infringement proceedings in September 2011 for non-transposition, Finland has notified only partial transposition of the Third Package Directives.
2.2. National Energy Regulator: In 2010, the Finnish national regulator, the Energy Market Authority (EMA), employed 45 staff and had an annual budget of almost EUR 5 million. It has been in operation since 1995.
2.3. Unbundling: The electricity TSO is Fingrid, in which the state has a majority stake (about 53%) with institutional investors owning the rest. The certification of this TSO has not yet taken place. There are 87 electricity distribution companies (of which 52 are legally unbundled) and 12 regional network operators. The gas TSO, Gasum, is vertically integrated and the shareholders are Fortum, E.On, Gazprom and the Finnish state. No changes in the ownership structure are envisaged, as Finland has a derogation from the Gas Directive exempting it from legal and operational unbundling (Article 49). There are 23 gas DSOs.
143. The share of electricity produced in combined heat and power
plants (CHP).
C H A R T S 1 A N D 2
Gross inland consumption (as % of total Mtoe) - 2010
Crude oiland petroleumproducts27.8%
Natural gas10.4%
Renewables24.5%
Solid fuels18.6%
Nuclear15.9%
Other2.8%
Total Mtoe: 36.98
Gross electricity generation (as % of TWh) - 2010
Crude oiland petroleum products
0.6%Natural gas
14.7%
Renewables30.0%
Solid fuels25.8%
Nuclear28.3%
Other0.7%
Total TWh: 80.67
Source: Eurostat
Key Issues
→ With regard to electricity, Finland should strive to reinforce its links with the Baltic states in order to become better integrated with the markets of continental Europe and the Baltic states. In particular, Finland should complete the second electricity interconnection with Estonia, Estlink2, in early 2014 as planned. The electricity TSO, Fingrid, should undergo the certification procedure without further delay.
→ With regard to gas, in order to introduce competition to the market, Finland should diversify its gas supply portfolio by means of an LNG terminal or a pipeline interconnection with the Baltic states (Balticconnector).
FINLAND

EN
ER
GY
M
AR
KE
TS
I
N
TH
E
EU
RO
PE
AN
U
NI
ON
I
N
20
11
/
1
44
F I N L A N D
3. Wholesale markets
3.1. Electricity: At the generation level, the market is dominated by two big players, Fortum (which is mostly state owned) and Pohjolan Voima (PVO). The three big-gest companies control approximately 58% of the total installed capacity. The Finnish power market is inte-grated into Nord Pool’s wholesale market144. Electricity is traded via Nord Pool (76% of total volumes in 2011) and bilaterally (24%). In 2010, the Nordic market took steps to become better integrated with the markets of continental Europe and the Baltic states through the opening of the new Estonia bidding area in the Nord Pool Spot market and through the coupling between the Nordic and Central Western European regions. In terms of liquidity, in 2011 51.1% of the country’s gross inland electricity consumption was traded on the Nord Pool Spot.
3.2. Gas: Finland does not produce gas. The country’s imports of gas amounted to 4.7 bcm in 2010, which came exclusively from Russia on the basis of long-term contracts. There is only one importer, Gasum Oy, which is consequently the only party active on the wholesale market. Gasum is a vertically integrated company that also operates the transmission system. Even further downstream, Gasum is also a distribution operator and the supplier (in addition to other DSOs and suppliers). The majority of Gasum Oy’s natural gas customer contracts are based on a public tariff, and are renewable at 4-yearly intervals. In addition to these long term products, Gasum Oy offers short term products that are sold on the Kaasupörssi Oy gas exchange, which has existed since 2002.
144. Nord Pool is the common power exchange for the Nordic
countries and runs the largest electricity market in the world.
4. Retail markets
4.1. Electricity: Market concentration at retail level was moderate in 2010 as there were four retail power utilities whose market share was above 5%, with the three largest actors controlling around 35-40% of the market. Supplier switching is common for industry and big companies but still low for very small commercial and households cus-tomers. Low retail prices do not induce them to change supplier. In 2010 the switching rate was roughly 7.6%, which is slightly down on the previous year (8%). Power prices for both households and industrial consumers have gradually increased between 2005 and 2011, although it is worth noting that industrial prices remained below the level of household prices and VAT-free industrial prices were more stable than those of households. At the be-ginning of 2011, non-refundable taxes increased for both industrial and household consumers. In 2011, network costs accounted for 43% of Finnish household electricity bills (without taxes), while the share of energy and sup-ply costs was 57%. For industrial electricity prices, these ratios were 27% and 73%, respectively. Price regulation does not exist in Finland. A correlation analysis shows a strong correlation between the wholesale and retail elec-tricity prices. Finnish electricity market legislation provides for a roll-out of smart meters by 2014. More than half of the country’s 3.1 million metering points are already equipped with smart meters.
4.2. Gas: Market concentration at the retail level was moderate at the end of 2010, as the share of the top three retail suppliers was about 50% in terms of total gas volume. However, gas retailers in Finland have a monopoly within their own distribution network. There
C H A R T S 3 A N D 4
Electricity - Retail prices in Finland (in €/kWh)
H O U S E H O L D S I N D U S T R Y
VAT Other taxes Net price
2004 2005 2006 2007 2008 2009 2010 2011 2004 2005 2006 2007 2008 2009 2010 20110.00
0.02
0.04
0.06
0.08
0.10
0.12
0.14
0.16
Source: Eurostat
Natural gas - Retail prices in Finland (in euro cent/kWh)
I N D U S T R Y
VAT Other taxes Net price
2005 2006 2007 2008 2009 2010 20110
1
2
3
6
5
4

EN
ER
GY
M
AR
KE
TS
I
N
TH
E
EU
RO
PE
AN
U
NI
ON
I
N
20
11
/
1
45
F I N L A N D
were 23 natural gas suppliers, most of whom had only a dozen customers. The retail supply of natural gas in the distribution network covers only about 5 per cent of the total amount of gas consumption. In Finland there were only about 36 000 customers in the natural gas market, of which the largest segment (29 000 consumers) comprised households that used only 0.02% of the country’s annual gas consumption in 2010.
4.3. Consumers: Finnish consumers rate the performance of their retail electricity market above the EU average (10th place out of 27). The market is assessed slightly above EU average on all indicators with the exception of compa-rability, problems and complaints145. Electricity prices can be compared through a price comparison tool, managed by the National Regulatory Authority. Finland has a sin-gle point of contact for information requests on gas and electricity legislation, prices and consumer rights, which is provided by the NRA. However, responsibility for handling complaints is divided between the NRA and consumer bodies. The Consumer Disputes Board is an impartial body of experts that acts as an alternative dispute resolu-
145. 8th Consumer Markets Scoreboard, 2012, European Commission,
DG SANCO, http://ec.europa.eu/consumers/consumer_research/
editions/cms8_en.htm
tion mechanism. As regards electricity, the legislation pro-vides specific protection to vulnerable customers, typically through time and climate-based restrictions for discon-nection. Social assistance is provided as a last resort to individuals with inadequate income to cover energy bills.
5. Infrastructure
5.1. Electricity: Finland is connected to Sweden, Estonia, Norway and the Russian Federation. The Estlink1 cable between Finland and Estonia has provided Estonia with the opportunity to integrate with the Nordic market. However, interconnection capacity with the Baltic states is insufficient — in 2011 Estonian and Finnish prices differed about half the time. The second interconnection with Estonia, Estlink2 (with the capacity of 650 MW), is planned for early 2014. It should substantially reduce congestion and strengthen Finland’s integration with the continental EU markets, as well as open up the possibility of exporting electricity to Russia (in 2010 electricity imports from Russia were 11.7 TWh, with no possibility of exporting).
5.2. Gas: The Finnish natural gas market is isolated. Finland is connected to the Russian transmission system, but there is no transmission connection to other EU countries.
F I N L A N D – K E Y I N D I C ATO R S O F T H E E L E C T R I C I T Y A N D N AT U R A L G A S M A R K E T S
E L E C T R I C I T Y G A S
Number of companies representing at least 95% of net power generation 29 Number of entities bringing natural gas into country 1
Number of main power-generation companies (1) 4 Number of main gas entities (4) 1
Market share of the largest power-generation company 26.6% Market share of the largest entity bringing natural gas 100%
Number of electricity retailers 72 Number of retailers selling natural gas to final customers 25
Number of main electricity retailers (2) 3 Number of main natural gas retailers (5) 1
Switching rates (entire electricity retail market) 7.6% Switching rates for gas (entire retail market) N/A
Regulated prices for households – electricity NO Regulated prices for households – gas NO
Regulated prices for non-households – electricity NO Regulated prices for non-households – gas NO
HHI in power-generation market (3) N/A HHI in gas supply market (3) N/A
HHI in electricity retail market (3) N/A HHI in gas retail market (3) N/A
Electricity market value (bn €) (6) 8.557 Gas market value (bn €) (6) N/A
Sources: Eurostat, CEER, National Regulatory Authority, EC calculations.
(1) Companies are considered as ‘main’ if they produce at least 5% of the national net electricity generation.
(2) Retailers are considered as ‘main’ if they sell at least 5% of the total national electricity consumption.
(3) The HHI (Herfindahl-Hirschman Index) is a commonly accepted measure of market concentration. It is calculated by squaring the market share
of each firm competing in the market and then summing the resulting numbers (the higher the index, the more concentrated the market).
Moderate concentration: 750-1 800; high concentration: 1 800-5 000; very high concentration: above 5 000.
(4) Entities are considered as ‘main’ if they deal with at least 5% of the natural gas (indigenous production or import).
(5) Retailers are considered as ‘main’ if they sell at least 5% of the total natural gas consumed by final customers.
(6) Market value is an estimation of the size of the retail electricity and gas markets. It is calculated using data on electricity and gas consumption
in the household and non-household sectors and annual average retail prices.

EN
ER
GY
M
AR
KE
TS
I
N
TH
E
EU
RO
PE
AN
U
NI
ON
I
N
20
11
/
1
46 1. General overview
In 2010, a third of the energy mix originated from renewables (RES). The most important source was biomass, which accounted for about two-thirds of renewables. In the electricity mix, renewables accounted for an even higher share. Hydro power plants produced over 80% of renewable electricity. Sweden’s target for 2020 is to have 49% of RES in gross final energy consumption. This share improved from 42.4% in 2006 to 47.9% in 2010. The share of cogeneration146 in electricity production was 12.9% in 2010, showing a significant increase compared to the level of 6.7% in 2005.
2. Regulatory framework
2.1. General: Following the opening of infringement cases for non-transposition in September 2012, Sweden has declared that the Third Energy Package Directives have been now fully transposed. The Commission is conducting a prima-facie examination of the completeness of the transposition based on the measures notified and other information provided in the proceedings. One infringement procedure is still open on the Second Package, concerning the lack of congestion management and a transparency provision concerning access to the network for cross-border exchanges in electricity.
2.2. National Energy Regulator: The Swedish regulator, Energy Market Inspectorate (EI), has been in operation since 2008, employing 95 staff with an annual budget of around EUR 11 million. Despite being an agency administratively attached to the Ministry of Enterprise, Energy and Communication, it is an independent NRA with satisfactory powers.
146. The share of electricity produced in combined heat and power
plants (CHP).
C H A R T S 1 A N D 2
Gross inland consumption (as % of total Mtoe) - 2010
Crude oiland petroleum
products28.3%
Natural gas2.6%
Renewables33.9%
Solid fuels4.9%
Nuclear29.0%
Other1.4%
Total Mtoe: 51.35
Gross electricity generation (as % of TWh) - 2010
Renewables58.2%Nuclear
40.9%
Other0.9%
Total TWh: 148.61
Source: Eurostat
Key Issues
→ The Swedish electricity market works fairly well. Congestion management and transparency provisions for cross-border exchanges give rise to some concerns, however. Reinforcing the grid would reduce congestion within Sweden (between surplus generation areas in the north and deficit consumption areas in the south) and between Sweden and neighbouring countries. Remedies might be sought by allocating significant congestion rents to relevant investments. The Swedish energy regulator should continue efforts to limit the risks arising from structural links between the major competing generators. These links undermine confidence among the other players in the market.
→ With regard to gas, diversifying supply sources would encourage more competition and improve Sweden’s energy security. Sweden should aim to put in place an alternative gas supply infrastructure and meet N-1 infrastructure standards. This would enable it to implement Regulation 994/2010 fully. It currently has an exemption.
SWEDEN

EN
ER
GY
M
AR
KE
TS
I
N
TH
E
EU
RO
PE
AN
U
NI
ON
I
N
20
11
/
1
47
S W E D E N
2.3. Unbundling: Svenska Kraftnät is the TSO for electricity and Swedegas for gas. Both TSOs have been certified under the ownership unbundling model. In electricity, 170 DSOs are functionally unbundled, and in gas, six.
3. Wholesale markets
3.1. Electricity: The Swedish wholesale power market is part of the integrated Nordic power market. In 2010, electricity production was dominated by three companies, Vattenfall, Fortum and E.ON, that together controlled 80% of generation. However, thanks to the connection with Nord Pool, the actual number of players active on the wholesale market is higher. The three incumbents have joint ownership of nuclear power plants, and the Swedish Competition authority is concerned by the inherent risk of information being shared between sites, diminishing confidence in a functioning market. This problem has been addressed by the energy regulator, which forced the owners of nuclear power stations to agree on common ethical rules. However, the risks arising from links among major competing producers still remain and the authority should go on monitoring the situation, intervening when necessary. Nord Pool Spot is the common Nordic market place with which the Swedish wholesale power market is integrated and where three-quarters of Nordic electricity is traded. New interconnections using market coupling between the Continent and Nordic countries (Baltic Cable and SwePol Link) will likely increase continental influence on the Nord Pool system
price. This is seen as the first step towards Europe-wide market integration. The average wholesale price in 2011 was EUR 48.4/MWh (a decrease of 12.6% compared to 2010)147. In terms of liquidity, volumes traded on Nord Pool Spot are the highest on European power exchanges. Swedish volumes reached 131 TWh, 94% of national electricity consumption.
3.2. Gas: Sweden does not produce natural gas. In 2010 it imported all of its requirements, about 1.5 bcm, through the pipeline from Denmark. The Swedish network works as a distribution system for gas consumers. Sweden has around 37 000 end-users, of whom approximately 3 600 are business customers and the remainder domestic. At wholesale level, two operators are active, E.ON Sverige and Dong Energy. There is no wholesale market hub as all gas is imported. To gain access to the Swedish market, a supplier needs to acquire transmission capacity on the Danish interconnector, given that capacity can only be booked as exit capacity from the Danish system. There is currently no congestion on the grid, either nationally or in the import link from Denmark.
4. Retail markets
4.1. Electricity: The same three incumbents in the wholesale market hold about half the retail market. This, unlike the wholesale power market, is national in scope. In 2010, there were 121 electricity suppliers, though smaller players have occasionally found it
147. For a comparison with wholesale prices in neighbouring countries,
please refer to Table 9 of this Staff Working Document, part II.
C H A R T S 3 A N D 4
Electricity - Retail prices in Sweden (in €/kWh)
2004 2005 2006 2007 2008 2009 2010
H O U S E H O L D S I N D U S T R Y
VAT Other taxes Net price
2004 2005 2006 2007 2008 2009 2010 20110.00
0.05
0.10
0.15
0.20
0.25
Source: Eurostat
Natural gas - Retail prices in Sweden (in euro cent/kWh)
H O U S E H O L D S I N D U S T R Y
VAT Other taxes Net price
2005 2006 2007 2008 2009 2010 2011 2007 2008 2009 2010 20110
2
4
6
12
8
1
3
5
10
11
9
7
EN
ER
GY
M
AR
KE
TS
I
N
TH
E
EU
RO
PE
AN
U
NI
ON
I
N
20
11
/
1
48
S W E D E N
difficult to enter the market. Switching of suppliers is high. Around 11% of all domestic customers switched their electricity supplier in 2010. In addition, 24% of consumers re-negotiated their contract with their current supplier. Thus, 35% of all domestic customers took an active part in the retail market during 2010. After a drop in 2009, power prices for Swedish households and industry rose in subsequent years. This was mainly due to higher energy prices. In 2011, network costs in the final price for households (without taxes) accounted for 52%, while energy and supply accounted for the remaining 48%. For industry, these shares were 33% and 67% respectively148. The correlation analysis shows the wholesale price had a significant influence on the retail price, which is not regulated. By 2009, Swedish DSOs were obliged to provide monthly meter readings to household customers and hourly readings to commercial and industrial customers. This resulted in practically a full roll-out of smart meters, enabling remote readings. However, most meters are not suitable for hourly readings without additional investment. Hourly readings are needed for demand response services. As of October 2012, DSOs are obliged to provide hourly meter readings to households requesting them.
4.2. Gas: In 2010, there were five natural gas suppliers. The three largest companies, E.ON, Dong Energy and Göteborg Energi, held around 90% of the market. The Swedish gas retail market consists of around 34 000 domestic customers. It has been a free market since 2007. During 2010, 266 of these households switched suppliers, fewer than in the previous year. The total number of switches continues to remain low, equivalent to about 1% of the total number of domestic customers. This may be due to the small size of the gas market, which does not incentivise suppliers to competition. End-user prices are not regulated. Gas prices for final consumers moved in line with global gas and oil prices. Both households and industry pay high taxes, amounting to almost half the retail price.
4.3. Consumers: Consumers’ overall assessment of retail electricity market is below EU average (22nd place out of 27), with particularly poor score on comparability, trust in providers and consumer satisfaction. The number of problems reported in the electricity retail market is lower than the EU average but complaints are
148. Source: Eurostat data.
more numerous. The scores for choice and switching are significantly above the EU average (highest and third highest in the EU)149. In 2008, EI launched an on-line electricity price comparison site, which enables consumers to compare prices, terms, and conditions for all Swedish suppliers. For gas, there is no single price comparison site. The Alternative Dispute Resolution system (named Allmänna Reklamations Nämnden) is managed by EI. As of 2011, there is a definition of vulnerable consumers in the national legislation. Protection of vulnerable consumers is regulated within the general social welfare acts and recognised by municipalities, which can also provide tax rebates and benefits.
5. Infrastructure
5.1. Electricity: High volumes of hydroelectric power need to be transported from the north to the south. There is at times significant congestion between the two regions. Congestion within the national grid is generally associated with high hydropower generation in the north, which results in pressure to transmit power southwards, where consumption is concentrated. When low reservoir levels coincide with unplanned outage of nuclear power plants, which was the case in January 2010 and 2011, price spikes are likely to occur. This increases the need for reinforced interconnections that reduce congestion within Sweden and between Sweden and neighbouring countries. Enforcing competition rules also enabled the creation of four bidding zones in Sweden, contributing to more efficient management of congestion. This helped to avoid abuse of a dominant position by Svenska Kraftnät, the national TSO150.
5.2. Gas: Sweden has a relatively small gas market, but the fact that it is only interconnected to Denmark makes it vulnerable to disruption. Sweden is currently exempted from the N-1 obligation set out by Regulation 994/2010 concerning measures to safeguard security of gas supply. One possible route for diversification could be the Skanled pipeline running from Norway, although the fate of this project is currently uncertain. Sweden has no significant storage facilities, and needs to rely on foreign storage to balance seasonal swings in demand.
149. 8th Consumer Markets Scoreboard, 2012, European Commission,
DG SANCO, http://ec.europa.eu/consumers/consumer_research/
editions/cms8_en.htm
150. See Commission decision of 14.4.2010, DG COMP Case 39351
— Swedish Interconnectors.
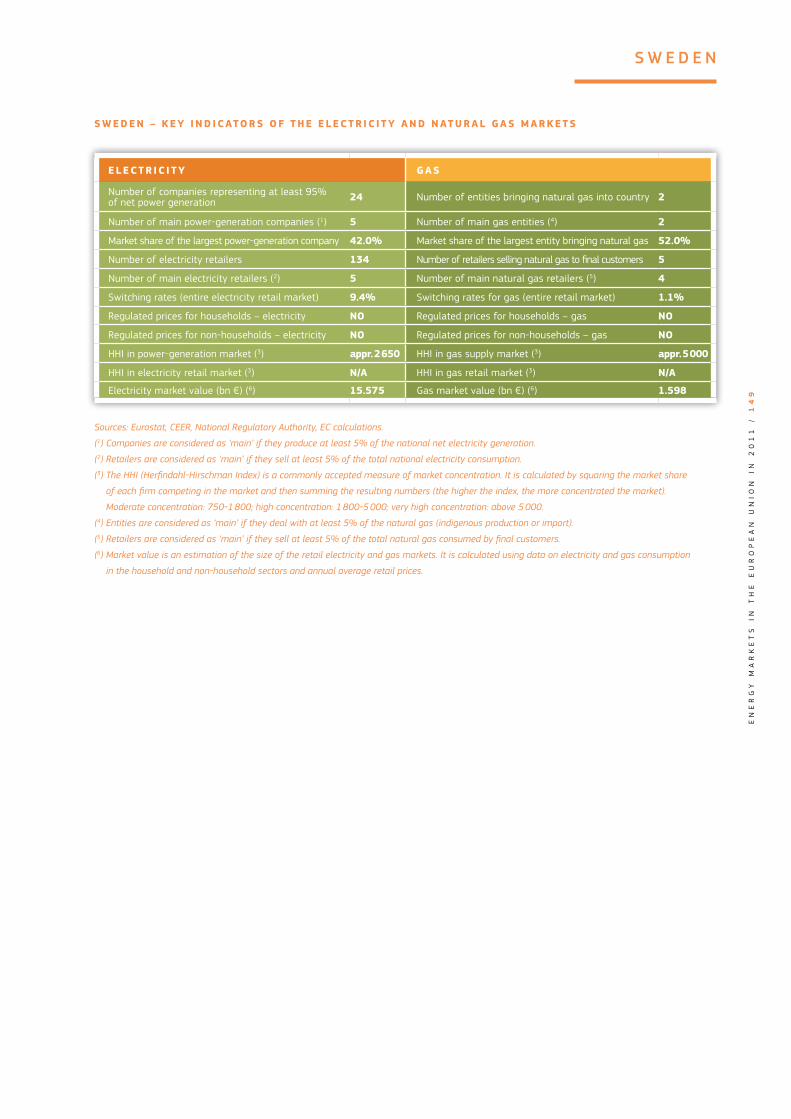
EN
ER
GY
M
AR
KE
TS
I
N
TH
E
EU
RO
PE
AN
U
NI
ON
I
N
20
11
/
1
49
S W E D E N
S W E D E N – K E Y I N D I C ATO R S O F T H E E L E C T R I C I T Y A N D N AT U R A L G A S M A R K E T S
E L E C T R I C I T Y G A S
Number of companies representing at least 95% of net power generation 24 Number of entities bringing natural gas into country 2
Number of main power-generation companies (1) 5 Number of main gas entities (4) 2
Market share of the largest power-generation company 42.0% Market share of the largest entity bringing natural gas 52.0%
Number of electricity retailers 134 Number of retailers selling natural gas to final customers 5
Number of main electricity retailers (2) 5 Number of main natural gas retailers (5) 4
Switching rates (entire electricity retail market) 9.4% Switching rates for gas (entire retail market) 1.1%
Regulated prices for households – electricity NO Regulated prices for households – gas NO
Regulated prices for non-households – electricity NO Regulated prices for non-households – gas NO
HHI in power-generation market (3) appr. 2 650 HHI in gas supply market (3) appr. 5 000
HHI in electricity retail market (3) N/A HHI in gas retail market (3) N/A
Electricity market value (bn €) (6) 15.575 Gas market value (bn €) (6) 1.598
Sources: Eurostat, CEER, National Regulatory Authority, EC calculations.
(1) Companies are considered as ‘main’ if they produce at least 5% of the national net electricity generation.
(2) Retailers are considered as ‘main’ if they sell at least 5% of the total national electricity consumption.
(3) The HHI (Herfindahl-Hirschman Index) is a commonly accepted measure of market concentration. It is calculated by squaring the market share
of each firm competing in the market and then summing the resulting numbers (the higher the index, the more concentrated the market).
Moderate concentration: 750-1 800; high concentration: 1 800-5 000; very high concentration: above 5 000.
(4) Entities are considered as ‘main’ if they deal with at least 5% of the natural gas (indigenous production or import).
(5) Retailers are considered as ‘main’ if they sell at least 5% of the total natural gas consumed by final customers.
(6) Market value is an estimation of the size of the retail electricity and gas markets. It is calculated using data on electricity and gas consumption
in the household and non-household sectors and annual average retail prices.

EN
ER
GY
M
AR
KE
TS
I
N
TH
E
EU
RO
PE
AN
U
NI
ON
I
N
20
11
/
1
50
1. General overview
Fossil fuels play a dominant role in the energy consumption mix. In 2010, natural gas had a 39.9% share of the energy consumption mix, which was the second-highest share among EU countries after the Netherlands. Renewable energy sources (RES) played a less important role in the energy mix (with a share of only 3.2%). Power generation (in total 381.1 TWh in 2010) in the UK was also dominated by gas-fired power plants (with a share of 46.2%) and to a lesser extent by solid fuels (28.3%). RES represented 7.6% of total power production in 2010. The country’s 2020 RES target for the whole energy sector is 15%, which is lower than the EU-27 average (20%). Between 2006 and 2010 the share of RES grew slowly (from 1.5% to 3.2%). The share of cogeneration151 was 6.2% in 2010, showing a slight decrease since 2005 when it was 6.8%.
2. Regulatory framework
2.1. General: Following the opening of infringement proceedings in September 2011 for non-transposition, the UK has still notified only partial transposition of the Third Energy Package Directives. In addition, two infringement procedures are still open under the Second Package. These concern: i) the lack of transparency concerning conditions for third-party
151. The share of electricity produced in combined heat and power
plants (CHP).
Key Issues
→ As recommended by the Council, the UK should improve the capacity of its network infrastructure.
→ With regard to electricity, the United Kingdom (UK) needs substantial investment to decarbonise its electricity generation while minimising the market distortions introduced by the electricity-market reform, ensuring in particular that state intervention is limited to what is necessary and proportionate, and that price signals can continue to be the driving factor in operational decisions for generators. The UK should facilitate the development of additional interconnectors to enhance security of supply and market integration in particular against the background of higher shares of variable wind power in the UK system.
→ The UK should focus more on the transparency of important data and on non-discriminatory third-party access to essential infrastructure such as IUK.
→ The UK should complete the integration of Northern Ireland within the internal gas and electricity market by ensuring that internal-market rules are fully applied.
UNITED KINGDOM
C H A R T S 1 A N D 2
Gross inland consumption (as % of total Mtoe) - 2010
Crude oiland petroleum
products34.8%
Natural gas39.9%
Renewables3.2%
Solid fuels14.3%
Nuclear7.5%
Other0.3%
Total Mtoe: 212.63
Gross electricity generation (as % of TWh) - 2010
Crude oiland petroleum products
1.3%
Natural gas46.2%
Renewables7.6%
Solid fuels28.3%
Nuclear16.3%
Other0.4%
Total TWh: 381.13
Source: Eurostat

EN
ER
GY
M
AR
KE
TS
I
N
TH
E
EU
RO
PE
AN
U
NI
ON
I
N
20
11
/
1
51
U N I T E D K I N G D O M
access to natural-gas-transmission networks;152 and ii) the lack of congestion-management and transparency provisions concerning access to the network for cross-border exchanges in electricity. These relate to the rules applying in Northern Ireland.
2.2. National Energy Regulator: For Great Britain (GB), the national regulatory authority, the Office of Gas and Electricity Markets (OFGEM), has been in operation since 2000; it employed 441 staff in 2011 with an annual budget of almost GBP 79 million. Ofgem is a well-es-tablished and effective regulator. The Northern Ireland Authority for Utility Regulation (UREGNI) has been desig-nated as the regulatory authority for Northern Ireland.
2.3. Unbundling: National Grid owns and manages the electricity transmission network in England and Wales. The Scottish electricity network is owned by SP and SSE. Northern Ireland’s electricity grid is owned by Northern Ireland Electricity (NIE) and operated by SONI. The high-pressure distribution network in GB is owned and operated by National Grid Gas plc (NGG); the low-pressure network is owned and operated by local distribution companies. Bord Gáis Éireann and Mutual Energy own the gas-transmission assets in Northern Ireland. National Grid companies have been certified as full unbundled ownership, and the Scottish companies (SP and SSE) have been certified under Article 9(9) of the Electricity Directive.
3. Wholesale markets
3.1. Electricity: At the generation level, the combined market share of the three largest utilities (EDF Energy, E.ON, Drax) in 2011 was 44% by metered volume of power generation, implying a moderate level of concentration. The UK needs substantial investment to upgrade its electricity generation capacity, given the need to replace much of the existing generating capacity as a result of closures over the next decade and the need to meet the renewable-energy and carbon targets. To address this challenge, the UK Govern-ment is currently preparing proposals for Electricity Mar-ket Reform (EMR). Following a white paper published last
152. The decision for referral of the matter to the Court of Justice was
taken by the College of Commissioners in January 2012 (see
IP 12/52). In concrete terms, the Commission considers that, in
violation of EU gas rules, the maximum interconnection capacity is
not offered in the UK and Ireland as the pipeline connecting Northern
Ireland and Ireland is not open to the market. This means that gas
companies in Ireland cannot directly trade gas with Northern Ireland
or vice versa. On the pipeline connecting Scotland to Northern Ireland
short-term services are not available and neither is virtual reverse
flow capacity based on netting off physical forward flow to make
capacity available for commercial trade as required by EU legislation.
However, following the decision, the national authorities have taken
some steps towards complying with EU law and the Commission is
overseeing progress in this respect.
July, draft legislation was published in May this year that is likely to be laid before Parliament before the end of 2012. The EMR aims to facilitate the transition to a low-carbon economy while maintaining secure and affordable energy supplies. The proposals call for the UK Government to set the prices that each new renewable technology will receive in the energy market via feed-in tariffs with so-called ‘con-tracts for difference’. The implementation of a national carbon-price support (CPS) mechanism and an emissions-performance standard (EPS) on new fossil-fuel plants in addition to the existing EU Emission Trading System (ETS) further aims to support the decarbonising of electricity generation. The UK Government aims to ensure security of supply by designing a capacity market to come into effect in the future if capacity margins are found to have fallen below sufficient levels. It is essential that the interventions ensure the creation of a stable and effective regulatory en-vironment and that they are limited to what is necessary and proportionate. Measures must be compatible with the internal market as well as EU state aid rules.
There are three different exchange providers operating in the UK electricity market: the APX UK, the Nasdaq OMX N2EX and the Intercontinental Exchange (ICE). The latter mainly focuses on trading in future contracts. On the APX Power Exchange, wholesale power traded in the intraday market reached 18.6 TWh in 2010. The APX Day Ahead auction was relaunched in April 2011 with the commissioning of the BritNed interconnector that links the British and Dutch power markets. In 2011 the traded volume in the APX Day Ahead auction was 2.5 TWh. Trading on the N2EX exchange started in January 2010. During the first full year of operation, the amount of day-ahead traded contracts was 2.6 TWh. In 2011, the amount of day-ahead auctions on the N2EX exchange reached 18.7 TWh. It is also worth noting that only 8.5% of power trading was carried out on power exchanges. The bulk of the power was traded over-the-counter (OTC). In 2011, the average day-ahead power price in the UK was EUR 56.5/MWh, higher than other European countries in the Central-West region. The market liquidity churn rate153 in the electricity market was 3.1 in 2011, slightly down from 3.4 in 2010.
3.2. Gas: The UK is the largest gas market in Europe with an annual demand of around 84.9 mtoe in 2010. The UK is one of the most important natural gas producers in the EU; however, domestic production is declining. In 2010, the country’s net annual production was approximately 51.5 mtoe. Imports amounted to 53.8 bcm (45.6 mtoe) with 48.5% coming from Norway and 27% from the Unit-ed Arab Emirates. There were four companies involved in gas production in 2011 with a market share greater than 5%. The three largest gas producers covered 50% of the market with available gas154 in 2010, implying
153. Measured as the ratio of the annual traded volume of power
and volume of generated power.
154. Production plus imports minus exports and changes in stocks.

EN
ER
GY
M
AR
KE
TS
I
N
TH
E
EU
RO
PE
AN
U
NI
ON
I
N
20
11
/
1
52
U N I T E D K I N G D O M
a moderate market concentration. Trade on the whole-sale market consists of both over-the-counter (OTC) trading (through brokers and off-market) and exchange trading. It takes place on the virtual trading hub NBP, which is by far the most liquid hub in Europe. In 2011, the average NBP hub price reached EUR 22.1/MWh, which was higher than the average of the previous year (EUR 16.9/MWh), mainly due to an increase in global LNG demand and a rise in energy-commodity prices. The churn rate was 11.6 in 2010 and in 2011 it rose to 14.5.
4. Retail markets
4.1. Electricity: The British retail electricity market has been open to competition since the late 1990s. At the end of 2011, there were 13 domestic and 24 non-domestic suppliers active in the market. The domestic retail market is characterised by the existence of six large, vertically integrated suppliers (the ‘Big 6’), which account for 99% of the market. These are British Gas, E.ON UK, EDF Energy, RWE npower, Scottish and Southern Energy (SSE), and Scottish Power. All of the Big 6 suppliers have a market share of above 10%. Market concentration at domestic retail level was moderate, yet the incumbent regional supplier from ‘prior to electricity privatisation’ remains dominant. The three largest companies covered 61% of the domestic retail market. The number of customers that switched supplier was among the highest in Europe at 15% in 2011. In 2011, energy and supply costs accounted for 78% of retail power prices (without taxes) in the case of household consumers and the remaining 22% were network costs. For industrial consumers, the distribution of energy supply and network costs
was similar at 74%-26%. The high energy and supply costs could be explained by higher UK wholesale prices compared to the northern and western parts of Europe. The British government has decided to replace all of the nation’s 53 million gas and electricity meters with smart meters. The large-scale rollout, executed by energy suppliers, starts in 2014 and is scheduled to be completed by 2019.
4.2. Gas: The British retail gas market is fully liberalised. At the end of 2011, 13 domestic and 30 non-domestic gas suppliers were active in the market. The so-called ‘Big 6’ suppliers supply 99% of the 22.3 million domestic consumers. British Gas is still the largest party active on the domestic market, with a market share of around 41%. Market concentration at the domestic retail level remained high and the incumbent regional supplier from ‘prior to electricity privatisation’ remains dominant. The three largest companies covered 71% of the domestic retail market at the end of 2011. There is a strong correlation between wholesale gas prices on the NBP hub and retail prices in the UK for both industrial and household prices. In 2011, more than 3.2 million domestic gas customers changed their supplier (on average around 280 000 each month). The switching rate for the year was 15%, which is the highest figure in Europe. In 77% of cases, price was the main motivation for switching.
4.3. Consumers: Consumer overall assessment of retail electricity market is above the EU average (13th place out of 27) but fell in the UK between 2010 and 2012. The assessment of the retail gas market is worse than the EU average (18th place out of 23). Both markets have above average scores for choice, ease of switch-ing and actual switching. In the gas market, choice and
C H A R T S 3 A N D 4
Electricity - Retail prices in United Kingdom (in €/kWh)
H O U S E H O L D S I N D U S T R Y
VAT Other taxes Net price
2004 2005 2006 2007 2008 2009 2010 2011 2004 2005 2006 2007 2008 2009 2010 20110.00
0.02
0.04
0.06
0.08
0.10
0.12
0.14
0.16
Source: Eurostat
Natural gas - Retail prices in United Kingdom (in euro cent/kWh)
H O U S E H O L D S I N D U S T R Y
VAT Other taxes Net price
2005 2006 2007 2008 2009 2010 2011 2005 2006 2007 2008 2009 2010 20110
1
2
3
5
4

EN
ER
GY
M
AR
KE
TS
I
N
TH
E
EU
RO
PE
AN
U
NI
ON
I
N
20
11
/
1
53
U N I T E D K I N G D O M
actual switching rank second and third highest in the EU155. Nevertheless, while switching rates are among the highest in Europe, they have decreased compared to previous years (22% in 2006 and 17% in 2010)156 and between 40-60% of consumers are considered to be disengaged, with only 5-10% being proactively engaged157. As a result – according to estimates by national consumers’ associations - consumers are col-lectively missing out on £4 billion a year from not being on the best deals. To help consumers find the best deal, the consumers’ association set up and run an independ-ent accreditation system for price comparison tools, which in the UK are run by private companies. A sin-gle contact point was recently introduced (April 2012); other sources for advice on energy efficiency and heat-ing are also available. As far as complaint handling is concerned, consumers are advised to contact their energy companies directly. If the query to the energy company is not resolved within eight weeks, the con-
155. 8th Consumer Markets Scoreboard, 2012, European Commission,
DG SANCO, http://ec.europa.eu/consumers/consumer_research/
editions/cms8_en.htm
156. DECC figures
157. OFGEM, The Retail Market Review - Findings and initial proposals,
2011 March, reference 34/11.
sumer can then contact the Energy Ombudsman, who acts as an alternative dispute resolution point. Great Britain grants ‘vulnerable consumers’ electricity-bill rebates, protection from disconnection in winter, benefit-entitlement checks, debt advice, and free or low-cost energy-efficiency measures.
5. Infrastructure
5.1. Electricity: The East-West Interconnector between Ireland and the UK, was inaugurated on 20 September 2012 and doubles the interconnection capacity between the two systems. The 1000 MW HVDC link between the UK and the Netherlands started operating in 2011. The need to establish additional interconnectors with continental Europe has been recognised and Ofgem is currently developing a new regulatory framework for interconnection to support cross-border development. It should be closely monitored whether the new framework delivers effects.
5.2. Gas: No further plans for development of gas connections with the continent are foreseen in the near future. However, the UK should continue to cooperate with its neighbours to ensure effective congestion management and maximize the commercially available capacity on existing interconnectors.
U N I T E D K I N G D O M – K E Y I N D I C ATO R S O F T H E E L E C T R I C I T Y A N D N AT U R A L G A S M A R K E T S
E L E C T R I C I T Y G A S
Number of companies representing at least 95% of net power generation 19 Number of entities bringing natural gas into country 25
Number of main power-generation companies (1) 9 Number of main gas entities (4) 6
Market share of the largest power-generation company 20.0% Market share of the largest entity bringing natural gas 22.0%
Number of electricity retailers 22 Number of retailers selling natural gas to final customers 19
Number of main electricity retailers (2) 6 Number of main natural gas retailers (5) 6
Switching rates (entire electricity retail market) N/A Switching rates for gas (entire retail market) N/A
Regulated prices for households – electricity NO Regulated prices for households – gas NO
Regulated prices for non-households – electricity NO Regulated prices for non-households – gas NO
HHI in power-generation market (3) 947 HHI in gas supply market (3) 1 125
HHI in domestic retail market (3) 1 768 HHI in domestic retail market (3) 2 452
Electricity market value (bn €) (6) 46.824 Gas market value (bn €) (6) 47.539
Sources: Eurostat, CEER, National Regulatory Authority, EC calculations.
(1) Companies are considered as ‘main’ if they produce at least 5% of the national net electricity generation.
(2) Retailers are considered as ‘main’ if they sell at least 5% of the total national electricity consumption.
(3) The HHI (Herfindahl-Hirschman Index) is a commonly accepted measure of market concentration. It is calculated by squaring the market share
of each firm competing in the market and then summing the resulting numbers (the higher the index, the more concentrated the market).
Moderate concentration: 750-1 800; high concentration: 1 800-5 000; very high concentration: above 5 000.
(4) Entities are considered as ‘main’ if they deal with at least 5% of the natural gas (indigenous production or import).
(5) Retailers are considered as ‘main’ if they sell at least 5% of the total natural gas consumed by final customers.
(6) Market value is an estimation of the size of the retail electricity and gas markets. It is calculated using data on electricity and gas consumption
in the household and non-household sectors and annual average retail prices.

EN
ER
GY
M
AR
KE
TS
I
N
EU
RO
PE
I
N
20
11
/
1
54
4. Infringement procedures
on the 2nd and 3rd Energy Package(1)

EN
ER
GY
M
AR
KE
TS
I
N
TH
E
EU
RO
PE
AN
U
NI
ON
I
N
20
11
/
1
55
2 n d E N E R G Y PAC K AG E 3 r d E N E R G Y PAC K AG E
Electricity(2) Gas(3) Electricity(4) Gas(5)
BELGIUM Cases closed Cases closed Non-transposition case closed(*)
Non-transposition case closed(*)
BULGARIA Cases closed One case pending Non-transposition case pending(**)
Non-transposition case pending(**)
CZECH REPUBLIC Cases closed Cases closed No case(*) No case(*)
DENMARK Case closed Case closed Non-transposition case closed(*)
Non-transposition case closed(*)
GERMANY One case pending Cases closed No case(*) No case(*)
ESTONIA Cases closed Case closed Non-transposition case pending(*)
Non-transposition case pending(*)
IRELAND One case pending One case pending Non-transposition case pending(*)
Non-transposition case pending(*)
GREECE One case pending One case pending No case(*) No case(*)
SPAIN Cases closed Cases closed Non-transposition case closed(*)
Non-transposition case closed(*)
FRANCE Cases closed One case pending Non-transposition case closed(*)
Non-transposition case closed(*)
ITALY One case pending Cases closed No case(*) No case(*)
CYPRUS No case No case Non-transposition case pending(**)
Non-transposition case pending(**)
LATVIA Cases closed Cases closed No case(*) No case(*)
LITHUANIA Cases closed Cases closed Non-transposition case pending(*)
Non-transposition case pending(**)
LUXEMBOURG Cases closed Cases closed Non-transposition case pending(*)
Non-transposition case pending(*)
HUNGARY Cases closed Cases closed No case(*) No case(*)
MALTA Case closed No case No case(*) No case(*)
NETHERLANDS Case closed Case closed Non-transposition case closed(*)
Non-transposition case closed(*)
AUSTRIA Cases closed Case closed Non-transposition case closed(*)
Non-transposition case closed(*)
POLAND One case pending Two cases pending Non-transposition case pending(*)
Non-transposition case pending(*)
PORTUGAL Cases closed Cases closed No case(*) No case(*)
ROMANIA Cases closed One case pending Non-transposition case pending(*)
Non-transposition case pending(*)
SLOVENIA Cases closed Case closed Non-transposition case pending(**)
Non-transposition case pending**
SLOVAKIA Cases closed Cases closed Non-transposition case pending(*)
Non-transposition case pending(*)
FINLAND Cases closed Cases closed Non-transposition case pending(**)
Non-transposition case pending(**)
SWEDEN One case pending Cases closed Non-transposition case pending(*)
Non-transposition case pending(*)
UNITED KINGDOM One case pending One case pending Non-transposition case pending(**)
Non-transposition case pending(**)
1. The table reflects the situation on 29th October 2012. As regards the transposition of the 3rd Package, the Commission has not opened (or, respectively,
not pursued further) infringement proceedings against the Member States, which had declared full transposition of the Directives and prima facie
examination of the measures had indicated that the transposition is complete. However, this is without prejudice of the right of the Commission
to pursue at a later stage a failure to transpose certain provisions, should shortcomings be identified at a later stage, e.g. in the context of a con-
conformity check (all received notifications of national transposition measures are subject to examination as to conformity with EU law).
2. Directive 2003/54/EC of the European Parliament and of the Council of 26 June 2003 concerning common rules for the internal market in electricity
and repealing Directive 96/92/EC (OJ L 176, 15.7.2003, p. 37-53) and/or Regulation (EC) No 1228/2003 of the European Parliament and of the Council
of 26 June 2003 on conditions for access to the network for cross-border exchanges in electricity (OJ L 176, 15.7.2003, p. 1-19)
3. Directive 2003/55/EC of the European Parliament and of the Council of 26 June 2003 concerning common rules for the internal market in natural gas
and repealing Directive 98/30/EC (OJ L 176, 15.7.2003, p. 57-78) and/or Regulation (EC) No 1775/2005 of the European Parliament and of the Council
of 28 September 2005 on conditions for access to the natural gas transmission networks (OJ L 289, 3.11.2005, p. 1–13)
4. Directive 2009/72/EC of the European Parliament and of the Council of 13 July 2009 concerning common rules for the internal market in electricity
and repealing Directive 2003/54/EC (OJ L 211, 14.8.2009, p. 55–93)
5. Directive 2009/73/EC of the European Parliament and of the Council of 13 July 2009 concerning common rules for the internal market in natural
gas and repealing Directive 2003/55/EC (OJ L 211, 14.8.2009, p. 94–136)
* The Member State has declared full transposition in its notification of transposition measures.
** The Member State has declared partial transposition in its notification of transposition measures.
EN
ER
GY
M
AR
KE
TS
I
N
TH
E
EU
RO
PE
AN
U
NI
ON
I
N
20
11
/
1
56
GlossaryGross Inland Consumption (GIC) – Gross inland consumption represents the quantity of energy necessary to satisfy inland consumption of the geographical entity under consideration. It is calculated using the following formula: primary production + recovered products + imports + stock changes - exports - international marine bunkers.
Final energy consumption – covers energy supplied to the final consumer’s door for all energy uses. It excludes deliveries to the energy transformation sector and to the energy industries themselves. It is the sum of final energy consumption by industry, transport, households, services, agriculture/forestry, fishing and other unspecified categories.
Electricity mix – gives the share of the various energy sources used for electricity generation.
Electricity generation – is the quantity of electricity produced within the borders of a country.
Coal (hard coal and derivatives) – covers hard coal, coal patent fuels, tar, benzol and coke derived from hard coal.
Crude oil (Crude oil and petroleum products) – covers crude oil, feedstocks and all petroleum products such as LPG, refinery gas, motor spirit, kerosenes, gasoline type jet fuels, kerosene type jet fuels, naphtha, gas/diesel oil, residual fuel oil, white spirit, lubricants, bitumen, petroleum coke and other petroleum products.
Natural gas – Gas covers natural gas and derived gases. Production only includes marketable production, and excludes any quantities that are re-injected, vented and flared, and any extraction losses.
Nuclear – The heat produced in a reactor as a result of nuclear fission is regarded as the primary production of nuclear heat, or in other words nuclear energy. It is the actual heat produced or calculated on the basis of reported gross electricity generation and the thermal efficiency of the nuclear plant.
Geothermal – Geothermal energy is energy available as heat emitted from within the earth’s crust, usually in the form of hot water or steam. It is extracted in suitable sites for electricity generation using dry steam or high enthalphy brine after flashing or directly as heat for district heating, agriculture.
Biomass/Waste – Biomass and wastes cover organic, non-fossilised material of biological origin, which may be used for heat production or electricity generation. They include wood and wood waste, biogas, municipal solid waste and biofuels. Renewable industrial waste should be included in the various categories mentioned. The non-renewable part of industrial waste is not covered here; rather it comes under industrial waste.
Hydro – Hydro power covers potential and kinetic water energy converted into electricity in hydroelectric plants. Electricity generated in pumped storage plants is not included.
Wind – Wind energy covers kinetic wind energy converted into electricity in wind turbines.
Net imports by fuels – Net imports are calculated as total imports minus total exports.
Imports of crude oil – imported crude oil divided by countries of origin. EU-27 data only includes extra-EU imports (intra-EU imports are excluded).
Imports of natural gas – imported natural gas divided by countries of origin. EU-27 data only includes extra-EU imports (intra-EU imports are excluded).
Imports of hard coal – imported hard coal divided by countries of origin. EU-27 data only includes extra-EU imports (intra-EU imports are excluded).
Energy intensity –The energy intensity of an economy is the amount of energy required to produce a unit of economic output (GDP). It is calculated as final energy demand divided by value added at basic prices.
CO2 emissions per capita – are calculated as total CO2 emissions divided by total population.
CO2 intensity – is calculated by dividing total CO2 emissions by the gross inland energy consumption. It is an indicator of the carbon intensity of the energy system.

EN
ER
GY
M
AR
KE
TS
I
N
TH
E
EU
RO
PE
AN
U
NI
ON
I
N
20
11
/
1
57
Import dependency – net imports of a country or region divided by the sum of the gross inland consumption and bunkers of that energy carrier. ‘All Fuels’ shows the import dependency for oil, gas, solid fuels, electricity and renewable energy sources in total. The aggregate ‘renewables’ considers all forms of renewable energy carriers, such as electricity from wind or hydro power, as well as biofuels and biomass in general. A negative import dependency has to be interpreted as net exports.
Industry – the sector is defined according to the following NACE Rev. 2 codes: B (Mining and quarrying), C (Manufacturing) and D (Electricity, gas, steam and air conditioning supply).
Services – the sector is defined according to the following NACE Rev. 2 codes: from G to S.
Transport – the sector covers all types of transport (NACE Rev. 2 H 49-52). In order to calculate energy intensity, the final energy consumption in transport was divided by the value added at basic prices of the whole economy.

EN
ER
GY
M
AR
KE
TS
I
N
TH
E
EU
RO
PE
AN
U
NI
ON
I
N
20
11
/
1
58
Abbreviationsbcm – Billion cubic metres Cap – CapitaCHP – Combined heat and powerCIF Price – Cost, insurance and freight priceCO2 – Carbon dioxide DSO – Distribution System OperatorDutch TTF – Dutch Title Transfer Facility EUR – EuroEUR/bbl – Euro per barrelGDP – Gross Domestic ProductGWh – Gigawatt hourIEA – International Energy AgencyKWh – Kilowatt hourLNG – Liquefied Natural GasMMBtu – Million British Thermal UnitsMt – Million tonnesMtoe – Million tonnes of oil equivalentMWh – Megawatt hourN/A – Not available or not applicableNBP – National Balancing Point (UK)Platts PEP – Platts Pan European Power indexRES – Renewable energy sources TSO – Transmission System OperatorTWh – Terawatt hourVAT – Value added tax


European Commission
Energy Markets in the European Union in 2011
Luxembourg: Publications Office of the European Union
2012 — 160 pp. — 21 x 29.7 cm
ISBN 978-92-79-25489-5 doi:10.2833/12806
How to obtain EU publications
Free publications:
> via EU Bookshop (http://bookshop.europa.eu);> at the EU’s representations or delegations.
You can obtain their contact details on the Internet http://ec.europa.eu or
> by sending a fax to +352 2929-42758
Priced publications:
> via EU Bookshop (http://bookshop.europa.eu). Priced subscriptions (e.g. annual series of the Official Journal of the European Union and reports of cases before the Court of Justice of the European Union):
> via one of the sales agents of the Publications Office of the European Union (http://publications.europa.eu/others/agents/index_en.htm).

MJ-A
E-12-001-EN-C
doi:10.2833/12806


