Embed Size (px)
Citation preview
2013-2022 Hunter Valley Corridor Capacity Strategy
Consultation Draft June 2013
2013-2022 HUNTER VALLEY CORRIDOR CAPACITY STRATEGY - CONSULTATION DRAFT
1
2013-2022 Hunter Valley Corridor Capacity Strategy
Consultation Draft June 2013
© Henry Owen
2013-2022 HUNTER VALLEY CORRIDOR CAPACITY STRATEGY - CONSULTATION DRAFT
2
Introduction
Contents
1 -
What has changed between the last strategy and this one 2
Increasing capacity between Narrabri and Muswellbrook 3
Increasing capacity between Ulan and Muswellbrook 4
Increasing capacity between Muswellbrook and Hexham 5
Terminals, Congestion and System Issues 6
Overview of the recommended projects 7
Network capacity with revised project scope and timing 8
3 12
15
19 21 26 30 33
-
-
-
- - - -
Page
Photography Credits Pages 1, 24 & 28 - Henry Owen | Pages 9 &37 - Peter Reading | Pages 11 & 30 - Lionel Camilleri
| Page 12 & 31 - Michelle Delaney| Page 33 - Mark Woodhead
Chapter
2013-2022 HUNTER VALLEY CORRIDOR CAPACITY STRATEGY—CONSULTATION DRAFT
3
On 5 September 2004, the Australian Rail Track
Corporation (ARTC) commenced a 60-year lease of the
interstate and Hunter Valley rail lines in New South Wales.
ARTC had previously controlled the interstate rail
network within the area bounded by Albury on the NSW/
Victoria border, Kalgoorlie in Western Australia and Broken
Hill in western NSW. The commencement of the NSW lease
consolidated control of most of the interstate rail network
under ARTC.
In early 2005, ARTC began to release annual Hunter
Valley infrastructure enhancement strategies setting out
how ARTC planned to ensure that rail corridor capacity in
the Hunter Valley would stay ahead of coal demand.
This 2013—2022 Hunter Valley Corridor Capacity
Strategy is the seventh of these annual strategies. It
updates the 2012 - 2021 Hunter Valley Corridor Capacity
Strategy (2012 Strategy).
In common with the earlier strategies, it identifies the
future constraints on the coal network’s capacity in the
Hunter Valley, the options to resolve these constraints and
a proposed course of action to achieve increased coal
throughput.
The fundamental approach of ARTC in developing this
Strategy has been to provide sufficient capacity to meet
contracted volumes based on the principles of the ARTC
Hunter Valley Access Undertaking (HVAU), while also having
regard to and identifying those projects that would be
desirable to accommodate prospective volumes that have
not yet been the subject of a contractual commitment. In
particular, this Strategy identifies a preliminary scope of
work to accommodate prospective volumes for 2016 and
beyond that would require the proposed Terminal 4 (T4) on
Kooragang Island or other terminal capacity expansion.
Over the past year there has been a notable decline in
the price of coal, which in turn has impacted future volume
expectations. At the same time, ARTC has completed a
number of major projects. There has also been a notable
increase in average train size, which facilitates volume
increases without additional track infrastructure. As a
result, the scale of work in this Strategy is notably lower
than in recent years.
It is important to note that the whole Hunter Valley coal
supply chain is interlinked. The stockpiling and loading
capability of the mines affects the trains required, the train
numbers affect the rail infrastructure and so on. The
capacity and performance of the system is entirely
interlinked and the capacity of the rail network needs to be
considered in that context.
In determining capacity ARTC makes certain
assumptions which are generally covered in this Strategy.
The delivery of throughput to align to capacity can be
impacted by a range of performance issues across the
supply chain. While some of these performance issues are
covered in this document, it is not the key purpose of the
Strategy.
Volume Forecasts
The move to the new Hunter Valley contractual
arrangements within the framework of the Hunter Valley
Access Undertaking occurred over late 2011 and early
2012 and has provided greater certainty over volume
forecasts.
Currently contracted export coal volumes are around
158 mtpa in 2013 and may be as high as 188 mtpa in
2014 and 197 mtpa in 2015 where they approximately
stabilize until increasing to around 204 mtpa in 2018 and
206 mtpa in 2019. Forward contract volumes are in part
conditional on ARTC projects and HVCCC Coal Chain
Capacity assessment.
During 2012 it became apparent that due to system-
wide congestion issues it would not be possible for the coal
chain to handle the conditional volumes of coal contracted
by producers for 2013, but that at the same time delays in
mine project developments and demand conditions were
leading some producers to prefer to defer increments of
Introduction
1
2013-2022 HUNTER VALLEY CORRIDOR CAPACITY STRATEGY - CONSULTATION DRAFT
4
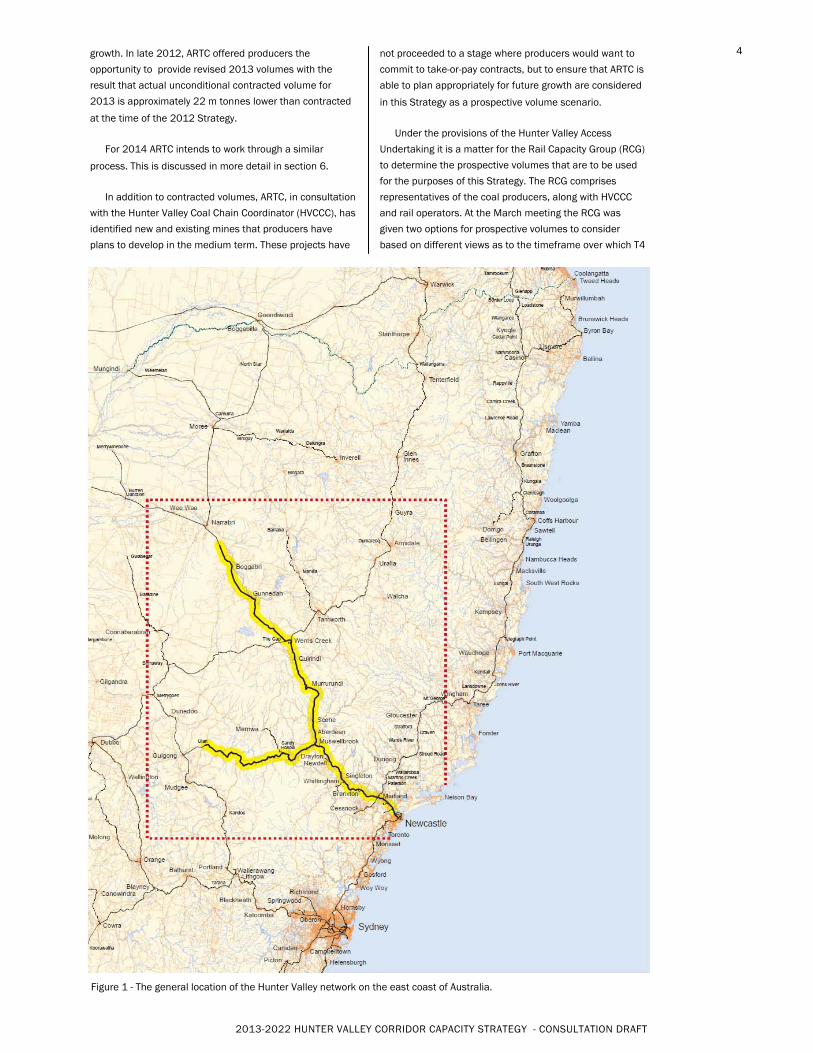
Figure 1 - The general location of the Hunter Valley network on the east coast of Australia.
growth. In late 2012, ARTC offered producers the
opportunity to provide revised 2013 volumes with the
result that actual unconditional contracted volume for
2013 is approximately 22 m tonnes lower than contracted
at the time of the 2012 Strategy.
For 2014 ARTC intends to work through a similar
process. This is discussed in more detail in section 6.
In addition to contracted volumes, ARTC, in consultation
with the Hunter Valley Coal Chain Coordinator (HVCCC), has
identified new and existing mines that producers have
plans to develop in the medium term. These projects have
not proceeded to a stage where producers would want to
commit to take-or-pay contracts, but to ensure that ARTC is
able to plan appropriately for future growth are considered
in this Strategy as a prospective volume scenario.
Under the provisions of the Hunter Valley Access
Undertaking it is a matter for the Rail Capacity Group (RCG)
to determine the prospective volumes that are to be used
for the purposes of this Strategy. The RCG comprises
representatives of the coal producers, along with HVCCC
and rail operators. At the March meeting the RCG was
given two options for prospective volumes to consider
based on different views as to the timeframe over which T4
2013-2022 HUNTER VALLEY CORRIDOR CAPACITY STRATEGY—CONSULTATION DRAFT
5
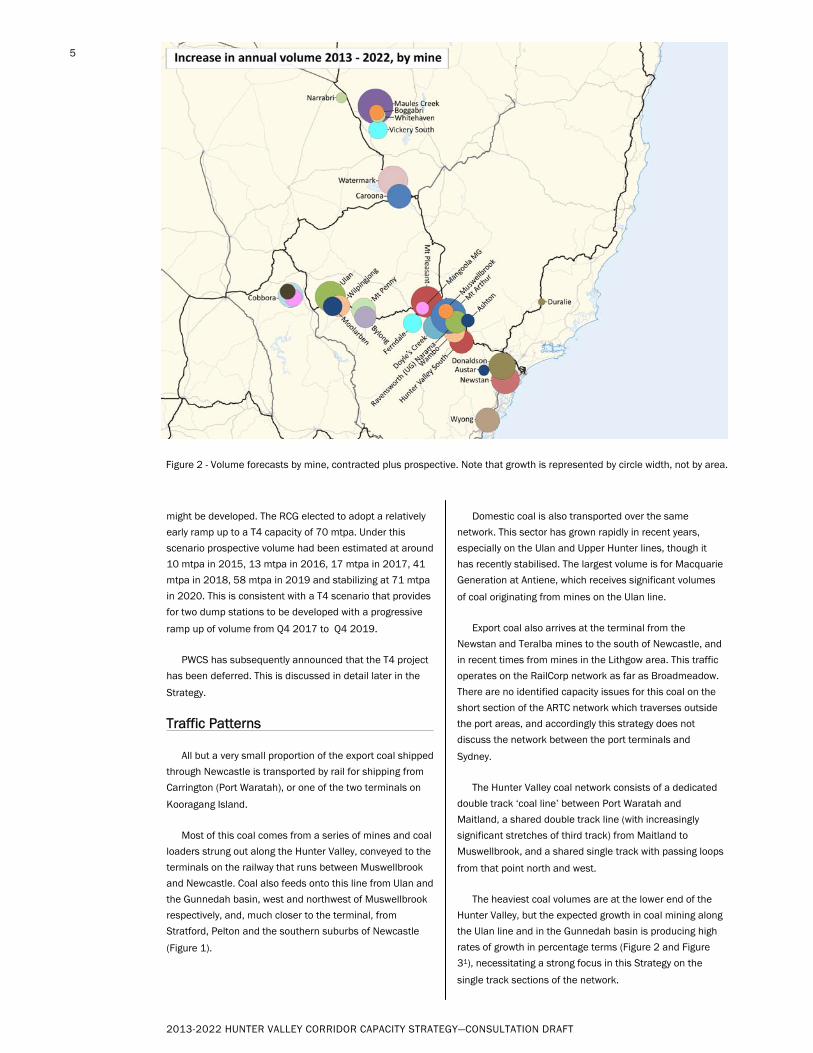
Figure 2 - Volume forecasts by mine, contracted plus prospective. Note that growth is represented by circle width, not by area.
might be developed. The RCG elected to adopt a relatively
early ramp up to a T4 capacity of 70 mtpa. Under this
scenario prospective volume had been estimated at around
10 mtpa in 2015, 13 mtpa in 2016, 17 mtpa in 2017, 41
mtpa in 2018, 58 mtpa in 2019 and stabilizing at 71 mtpa
in 2020. This is consistent with a T4 scenario that provides
for two dump stations to be developed with a progressive
ramp up of volume from Q4 2017 to Q4 2019.
PWCS has subsequently announced that the T4 project
has been deferred. This is discussed in detail later in the
Strategy.
Traffic Patterns
All but a very small proportion of the export coal shipped
through Newcastle is transported by rail for shipping from
Carrington (Port Waratah), or one of the two terminals on
Kooragang Island.
Most of this coal comes from a series of mines and coal
loaders strung out along the Hunter Valley, conveyed to the
terminals on the railway that runs between Muswellbrook
and Newcastle. Coal also feeds onto this line from Ulan and
the Gunnedah basin, west and northwest of Muswellbrook
respectively, and, much closer to the terminal, from
Stratford, Pelton and the southern suburbs of Newcastle
(Figure 1).
Domestic coal is also transported over the same
network. This sector has grown rapidly in recent years,
especially on the Ulan and Upper Hunter lines, though it
has recently stabilised. The largest volume is for Macquarie
Generation at Antiene, which receives significant volumes
of coal originating from mines on the Ulan line.
Export coal also arrives at the terminal from the
Newstan and Teralba mines to the south of Newcastle, and
in recent times from mines in the Lithgow area. This traffic
operates on the RailCorp network as far as Broadmeadow.
There are no identified capacity issues for this coal on the
short section of the ARTC network which traverses outside
the port areas, and accordingly this strategy does not
discuss the network between the port terminals and
Sydney.
The Hunter Valley coal network consists of a dedicated
double track ‘coal line’ between Port Waratah and
Maitland, a shared double track line (with increasingly
significant stretches of third track) from Maitland to
Muswellbrook, and a shared single track with passing loops
from that point north and west.
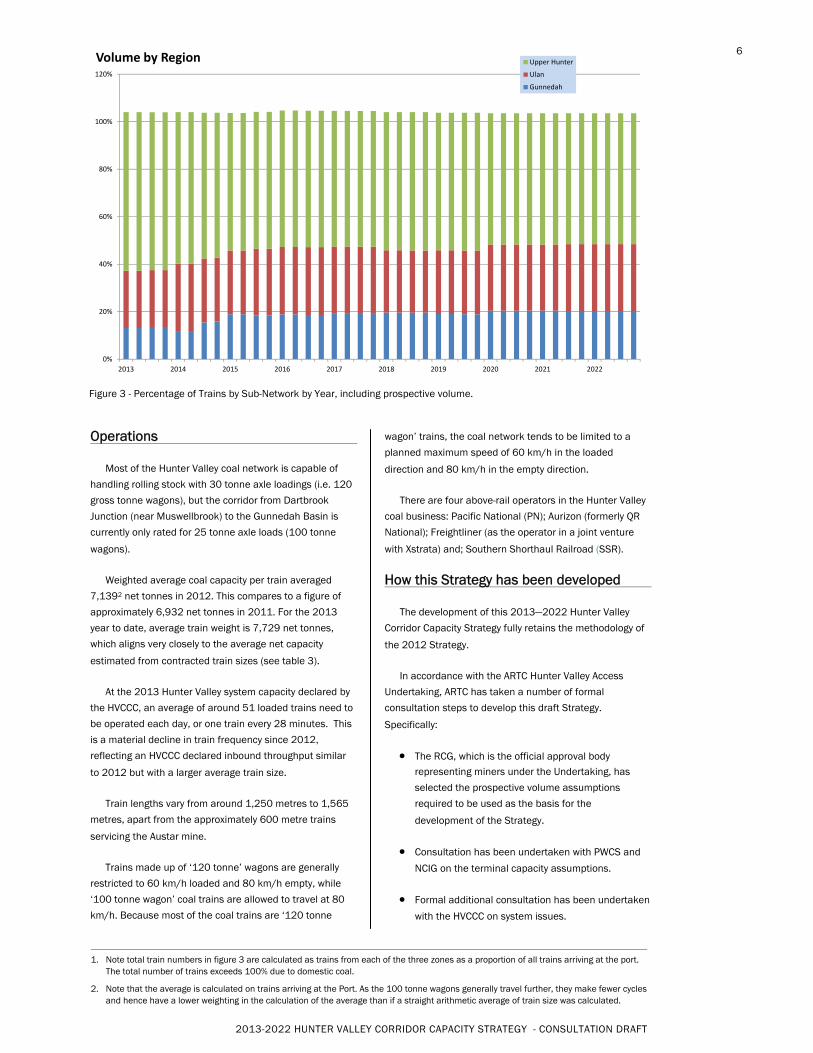
The heaviest coal volumes are at the lower end of the
Hunter Valley, but the expected growth in coal mining along
the Ulan line and in the Gunnedah basin is producing high
rates of growth in percentage terms (Figure 2 and Figure
31), necessitating a strong focus in this Strategy on the
single track sections of the network.
2013-2022 HUNTER VALLEY CORRIDOR CAPACITY STRATEGY - CONSULTATION DRAFT
6
Figure 3 - Percentage of Trains by Sub-Network by Year, including prospective volume.
Operations
Most of the Hunter Valley coal network is capable of
handling rolling stock with 30 tonne axle loadings (i.e. 120
gross tonne wagons), but the corridor from Dartbrook
Junction (near Muswellbrook) to the Gunnedah Basin is
currently only rated for 25 tonne axle loads (100 tonne
wagons).
Weighted average coal capacity per train averaged
7,1392 net tonnes in 2012. This compares to a figure of
approximately 6,932 net tonnes in 2011. For the 2013
year to date, average train weight is 7,729 net tonnes,
which aligns very closely to the average net capacity
estimated from contracted train sizes (see table 3).
At the 2013 Hunter Valley system capacity declared by
the HVCCC, an average of around 51 loaded trains need to
be operated each day, or one train every 28 minutes. This
is a material decline in train frequency since 2012,
reflecting an HVCCC declared inbound throughput similar
to 2012 but with a larger average train size.
Train lengths vary from around 1,250 metres to 1,565
metres, apart from the approximately 600 metre trains
servicing the Austar mine.
Trains made up of ‘120 tonne’ wagons are generally
restricted to 60 km/h loaded and 80 km/h empty, while
‘100 tonne wagon’ coal trains are allowed to travel at 80
km/h. Because most of the coal trains are ‘120 tonne
wagon’ trains, the coal network tends to be limited to a
planned maximum speed of 60 km/h in the loaded
direction and 80 km/h in the empty direction.
There are four above-rail operators in the Hunter Valley
coal business: Pacific National (PN); Aurizon (formerly QR
National); Freightliner (as the operator in a joint venture
with Xstrata) and; Southern Shorthaul Railroad (SSR).
How this Strategy has been developed
The development of this 2013—2022 Hunter Valley
Corridor Capacity Strategy fully retains the methodology of
the 2012 Strategy.
In accordance with the ARTC Hunter Valley Access
Undertaking, ARTC has taken a number of formal
consultation steps to develop this draft Strategy.
Specifically:
The RCG, which is the official approval body representing miners under the Undertaking, has
selected the prospective volume assumptions
required to be used as the basis for the
development of the Strategy.
Consultation has been undertaken with PWCS and
NCIG on the terminal capacity assumptions.
Formal additional consultation has been undertaken
with the HVCCC on system issues.
1. Note total train numbers in figure 3 are calculated as trains from each of the three zones as a proportion of all trains arriving at the port. The total number of trains exceeds 100% due to domestic coal.
2. Note that the average is calculated on trains arriving at the Port. As the 100 tonne wagons generally travel further, they make fewer cycles and hence have a lower weighting in the calculation of the average than if a straight arithmetic average of train size was calculated.
0%
20%
40%
60%
80%
100%
120%
2013 2014 2015 2016 2017 2018 2019 2020 2021 2022
Volume by Region Upper Hunter
Ulan
Gunnedah
2013-2022 HUNTER VALLEY CORRIDOR CAPACITY STRATEGY—CONSULTATION DRAFT
7
This document is released as a draft Strategy for
consultation and a final version will also be released prior
to 30 June 2013 having regard to stakeholder feedback.
In common with the previous Strategies, coal capacity is
analysed using a set of principles for the practical
utilisation of track. Capacity is calculated using headways.
On single track the headway is defined as the time the
front of a train enters a section between loops until the
time that the rear of the train clears the turnout for the loop
at the other end of the section. The longest headway
between two loops on a section of track defines the
capacity limit for that section. This is then adjusted to
reflect practical rather than theoretical capacity using an
adjustment factor of 65%. On double-track, the headways
are calculated on the basis of a ‘double-green’ principle.
Under this principle both the next signal and the one after
are at green, meaning that the driver will never see a yellow
signal. This ensures that drivers should always be able to
drive at full line speed.
On single track there is also a transaction time applied
to recognise the time incurred by trains executing a cross,
specifically signal clearance time, driver reaction time,
acceleration and delays to the through train when it
approaches the loop before the train taking the loop has
fully cleared the mainline. Simultaneous entry loops and
passing lanes reduce this transaction time by reducing
both the probability and time delay from both trains arriving
at the loop at around the same time. This Strategy has
adopted a transaction time of 5 minutes for a standard
crossing loop, 4 minutes where a simultaneous entry loop
is involved and 3 minutes where a passing lane is involved.
After removing capacity lost to background (ie non-coal)
trains, saleable paths are calculated as a percentage of
practical coal paths. This adjustment covers maintenance,
cancellations and a buffer.
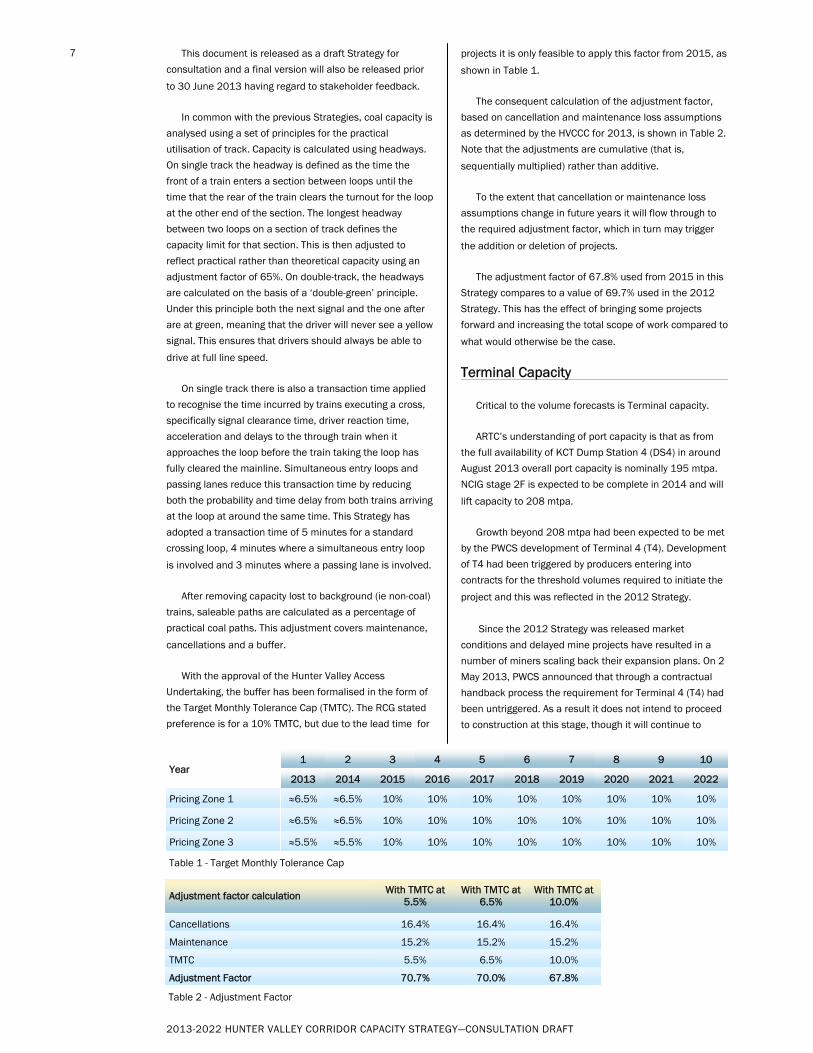
With the approval of the Hunter Valley Access
Undertaking, the buffer has been formalised in the form of
the Target Monthly Tolerance Cap (TMTC). The RCG stated
preference is for a 10% TMTC, but due to the lead time for
projects it is only feasible to apply this factor from 2015, as
shown in Table 1.
The consequent calculation of the adjustment factor,
based on cancellation and maintenance loss assumptions
as determined by the HVCCC for 2013, is shown in Table 2.
Note that the adjustments are cumulative (that is,
sequentially multiplied) rather than additive.
To the extent that cancellation or maintenance loss
assumptions change in future years it will flow through to
the required adjustment factor, which in turn may trigger
the addition or deletion of projects.
The adjustment factor of 67.8% used from 2015 in this
Strategy compares to a value of 69.7% used in the 2012
Strategy. This has the effect of bringing some projects
forward and increasing the total scope of work compared to
what would otherwise be the case.
Terminal Capacity
Critical to the volume forecasts is Terminal capacity.
ARTC’s understanding of port capacity is that as from
the full availability of KCT Dump Station 4 (DS4) in around
August 2013 overall port capacity is nominally 195 mtpa.
NCIG stage 2F is expected to be complete in 2014 and will
lift capacity to 208 mtpa.
Growth beyond 208 mtpa had been expected to be met
by the PWCS development of Terminal 4 (T4). Development
of T4 had been triggered by producers entering into
contracts for the threshold volumes required to initiate the
project and this was reflected in the 2012 Strategy.
Since the 2012 Strategy was released market
conditions and delayed mine projects have resulted in a
number of miners scaling back their expansion plans. On 2
May 2013, PWCS announced that through a contractual
handback process the requirement for Terminal 4 (T4) had
been untriggered. As a result it does not intend to proceed
to construction at this stage, though it will continue to
Year 1 2 3 4 5 6 7 8 9
2013 2014 2015 2016 2017 2018 2019 2020 2021
Pricing Zone 1 ≈6.5% ≈6.5% 10% 10% 10% 10% 10% 10% 10%
Pricing Zone 2 ≈6.5% ≈6.5% 10% 10% 10% 10% 10% 10% 10%
Pricing Zone 3 ≈5.5% ≈5.5% 10% 10% 10% 10% 10% 10% 10%
10
2022
10%
10%
10%
Table 1 - Target Monthly Tolerance Cap
Adjustment factor calculation With TMTC at 5.5%
With TMTC at 6.5%
With TMTC at 10.0%
Cancellations 16.4% 16.4% 16.4%
Maintenance 15.2% 15.2% 15.2%
TMTC 5.5% 6.5% 10.0%
Adjustment Factor 70.7% 70.0% 67.8%
Table 2 - Adjustment Factor
2013-2022 HUNTER VALLEY CORRIDOR CAPACITY STRATEGY - CONSULTATION DRAFT
8
pursue the environmental approvals for the project to
ensure that it can be developed to a faster timeframe in
the event that coal demand again indicates that it should
be built.
For the purposes of this Strategy, the RCG selected a
volume scenario that would align with T4 being delivered
with the first two dump stations in a single stage to give a
throughput of 70 mtpa, with first coal in Q4 2017 and full
throughput reached over a two year ramp-up.
While this scenario is unlikely to eventuate, the Strategy
is still required under the terms of the HVAU to be based on
the RCG endorsed volumes. This does provide a useful
indication of the scale of work required to achieve
particular volume outcomes and is useful in guiding future
decision making.
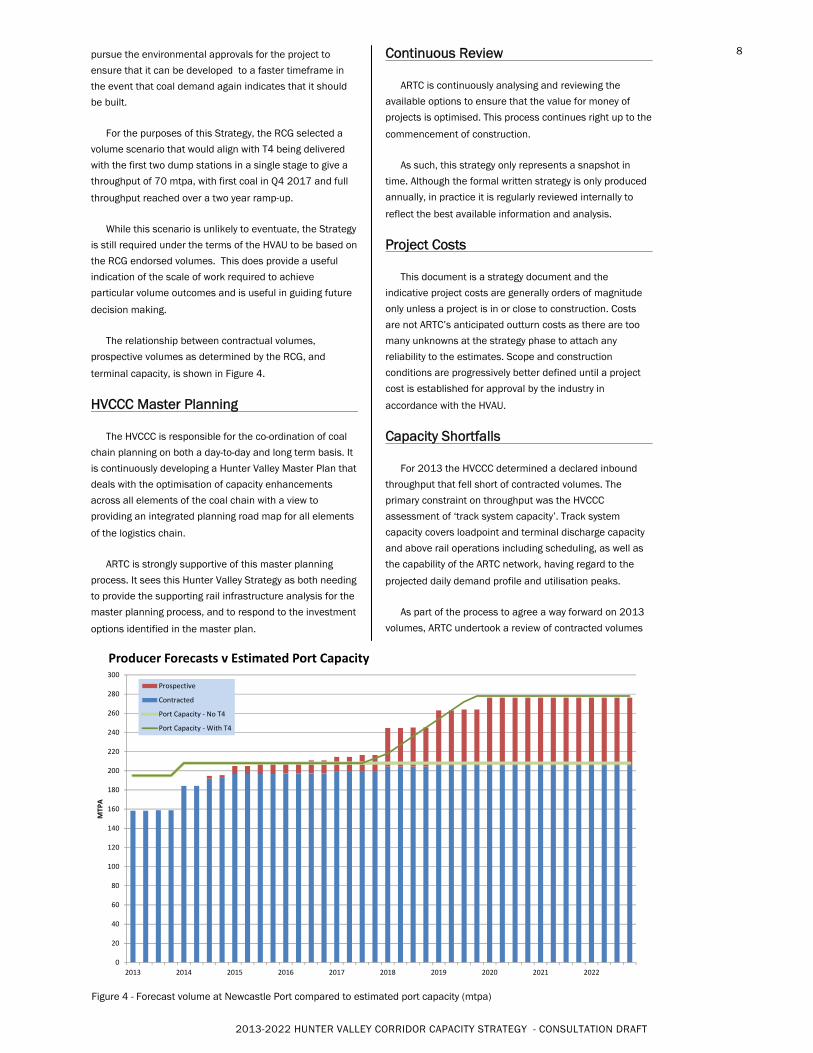
The relationship between contractual volumes,
prospective volumes as determined by the RCG, and
terminal capacity, is shown in Figure 4.
HVCCC Master Planning
The HVCCC is responsible for the co-ordination of coal
chain planning on both a day-to-day and long term basis. It
is continuously developing a Hunter Valley Master Plan that
deals with the optimisation of capacity enhancements
across all elements of the coal chain with a view to
providing an integrated planning road map for all elements
of the logistics chain.
ARTC is strongly supportive of this master planning
process. It sees this Hunter Valley Strategy as both needing
to provide the supporting rail infrastructure analysis for the
master planning process, and to respond to the investment
options identified in the master plan.
Continuous Review
ARTC is continuously analysing and reviewing the
available options to ensure that the value for money of
projects is optimised. This process continues right up to the
commencement of construction.
As such, this strategy only represents a snapshot in
time. Although the formal written strategy is only produced
annually, in practice it is regularly reviewed internally to
reflect the best available information and analysis.
Project Costs
This document is a strategy document and the
indicative project costs are generally orders of magnitude
only unless a project is in or close to construction. Costs
are not ARTC’s anticipated outturn costs as there are too
many unknowns at the strategy phase to attach any
reliability to the estimates. Scope and construction
conditions are progressively better defined until a project
cost is established for approval by the industry in
accordance with the HVAU.
Capacity Shortfalls
For 2013 the HVCCC determined a declared inbound
throughput that fell short of contracted volumes. The
primary constraint on throughput was the HVCCC
assessment of ‘track system capacity’. Track system
capacity covers loadpoint and terminal discharge capacity
and above rail operations including scheduling, as well as
the capability of the ARTC network, having regard to the
projected daily demand profile and utilisation peaks.
As part of the process to agree a way forward on 2013
volumes, ARTC undertook a review of contracted volumes
Figure 4 - Forecast volume at Newcastle Port compared to estimated port capacity (mtpa)
0
20
40
60
80
100
120
140
160
180
200
220
240
260
280
300
2013 2014 2015 2016 2017 2018 2019 2020 2021 2022
MTP
A
Producer Forecasts v Estimated Port Capacity
Prospective
Contracted
Port Capacity ‐ No T4
Port Capacity ‐ With T4
2013-2022 HUNTER VALLEY CORRIDOR CAPACITY STRATEGY—CONSULTATION DRAFT
9
with producers which resulted in some producers aligning
contracts with expected increments of growth. ARTC also
engaged closely with the HVCCC and industry to help
identify short-term initiatives that would assist with
throughput. ARTC committed to and has implemented all of
the initiatives that were identified as within its control and
which would make a positive contribution to throughput.
The review of forward volumes referenced above was
focussed primarily on 2013 and ARTC has initiated a similar
process for 2014 following the completion of the PWCS
contracts review. Specifically, ARTC is engaging with
industry in order to review 2014 growth increments to help
determine likely actual demand. Concurrent with this
review ARTC continues to work with the HVCCC to;
Understand and determine the impact of congestion on the Hunter Valley Coal Chain given likely demand
scenarios and the timing of delivery of projects
identified to address congestion, and
Identify and progress further operational
improvements to maximise throughput.
Based on the above it is expected that ARTC, with the
input of HVCCC, will be in a position to have resolution
around final volume positions for 2014 and future years in
the third quarter of this year.
Operational Initiatives
While this Strategy principally focuses on infrastructure
upgrades, ARTC supports industry initiatives to deliver
operational efficiencies. ARTC is driving or supportive of the
following important initiatives within the Hunter Valley:
The continued support & involvement in the Live Run Implementation Team establishment as proposed by the Live Run Management Group Steering Committee.
Continued regular forums with rail operators, to jointly consider improvements to operational performance.
Consideration jointly with the HVCCC of a potential train parkup strategy to provide for efficient management of excess rollingstock at lower demand periods.
Revised corridor shutdown program reducing the need for short mid-week possessions.
Continued assessment of maintenance practices to reduce the need for track based inspections and physical maintenance interventions.
Completion of the review as required under clause 5.8 of the Hunter Valley Access Undertaking to assess incentive mechanisms to minimise coal chain capacity losses.
Development of train staging and storage initiatives during close-down possessions.
Network Control Optimisation
During 2008 ARTC completed the implementation of
new train control systems and automated signalling
systems during the Train Control Consolidation Project
(TCC). Under the project all 28 of the 19th century manually
operated signal boxes within NSW were fully automated to
Phoenix train control system technology and consolidated
to ARTC’s two Train Control Centres, Network Control Centre
North (NCCN) at Broadmeadow and Network Control Centre
South (NCCS) at Junee. This project realised significant
operational gains, both in improved train transit times
through the use of technology in addition to reduced budget
© Les Coulton 2012
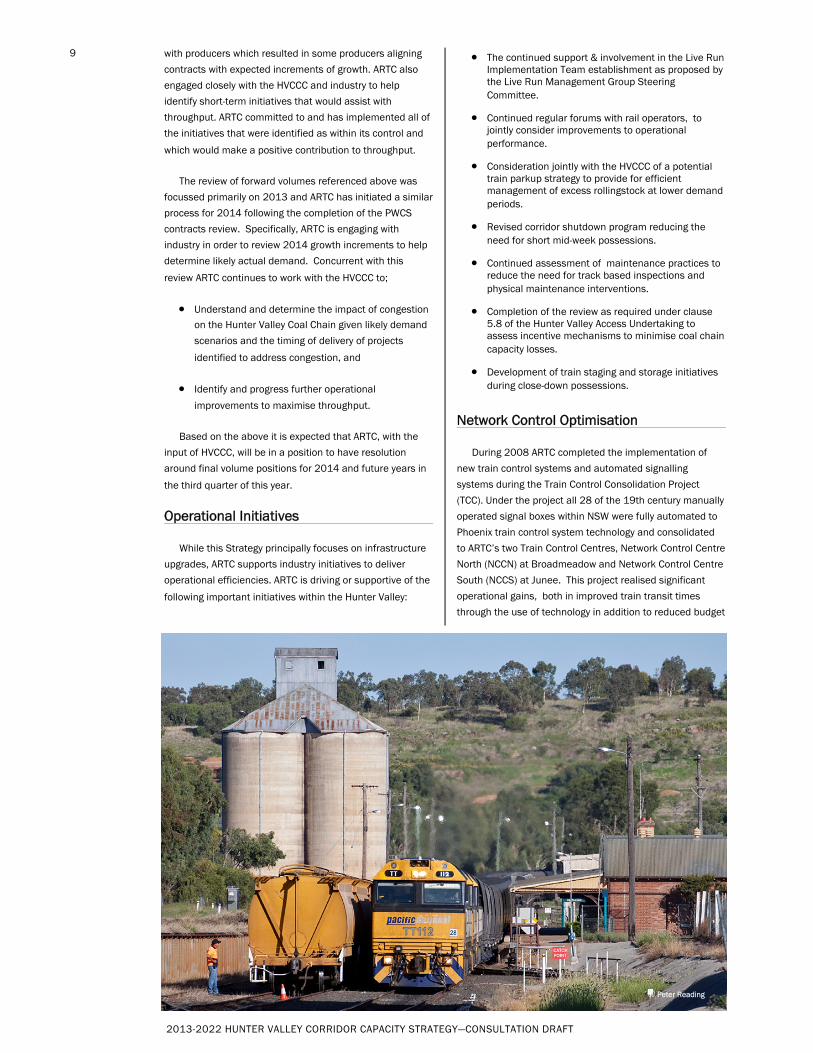
© Peter Reading
2013-2022 HUNTER VALLEY CORRIDOR CAPACITY STRATEGY - CONSULTATION DRAFT
10
2013 2014 2015 2016 2017 2018 2019 2020 2021 2022
Narrabri - Boggabri 6,027 6,027 7,634 7,634 7,634 7,634 7,634 7,634 7,634 7,634
Boggabri - Gunnedah 6,027 6,027 7,634 7,634 7,634 7,634 7,634 7,634 7,634 7,634
Gunnedah - Watermark 6,027 6,027 7,634 7,634 7,634 7,634 7,634 7,634 7,634 7,634
Watermark - Caroona 6,027 6,027 7,634 7,634 7,634 7,634 7,634 7,634 7,634 7,634
Caroona - Werris Creek 6,027 6,027 7,634 7,634 7,634 7,634 7,634 7,634 7,634 7,634
Werris Creek - Muswellbrook 5,897 6,027 7,634 7,634 7,634 7,634 7,634 7,634 7,634 7,634
Cobbora - Ulan - - - - - - - - - -
Ulan - Moolarben 9,016 9,016 9,016 9,016 9,016 9,016 9,016 9,016 9,016 9,016
Moolarben - Wilpingjong 8,404 8,600 8,519 8,519 8,519 8,519 8,519 8,519 8,519 8,519
Wilpingjong - Bylong 8,253 8,412 8,374 8,374 8,374 8,365 8,365 8,365 8,365 8,365
Bylong - Ferndale 8,253 8,412 8,374 8,374 8,374 8,365 8,365 8,365 8,365 8,365
Ferndale - Mangoola 8,253 8,412 8,374 8,374 8,374 8,365 8,365 8,365 8,365 8,365
Mangoola - Mt Pleasant 8,450 8,501 8,463 8,463 8,463 8,454 8,454 8,454 8,454 8,454
Mt Pleasant - Bengalla 8,450 8,463 8,434 8,434 8,434 8,427 8,427 8,427 8,427 8,427
Bengalla - Muswellbrook 8,415 8,435 8,412 8,412 8,412 8,406 8,406 8,406 8,406 8,406
Muswellbrook - Antiene 7,526 7,749 8,163 8,163 8,163 8,161 8,161 8,161 8,161 8,161
Antiene - Drayton 7,526 7,749 8,163 8,163 8,163 8,161 8,161 8,161 8,161 8,161
Drayton - Newdell 7,753 7,894 8,236 8,236 8,236 8,234 8,234 8,234 8,234 8,234
Newdell - Mt Owen 7,785 7,901 8,161 8,161 8,163 8,164 8,165 8,165 8,165 8,165
Mt Owen - Camberwell 7,873 7,970 8,211 8,211 8,212 8,212 8,213 8,213 8,213 8,213
Camberwell - Whittingham 7,839 7,936 8,168 8,168 8,169 8,170 8,172 8,172 8,172 8,172
Whittingham - Maitland 7,953 8,028 8,212 8,212 8,212 8,207 8,208 8,208 8,208 8,208
Maitland - Bloomfield 7,719 7,741 7,995 7,995 7,997 7,998 8,001 8,001 8,001 8,001
Bloomfield - Sandgate 7,729 7,749 8,000 8,000 8,002 8,003 8,005 8,005 8,005 8,005
Kooraganag / Carrington 7,747 7,766 8,009 8,008 8,011 8,011 8,013 8,013 8,013 8,013
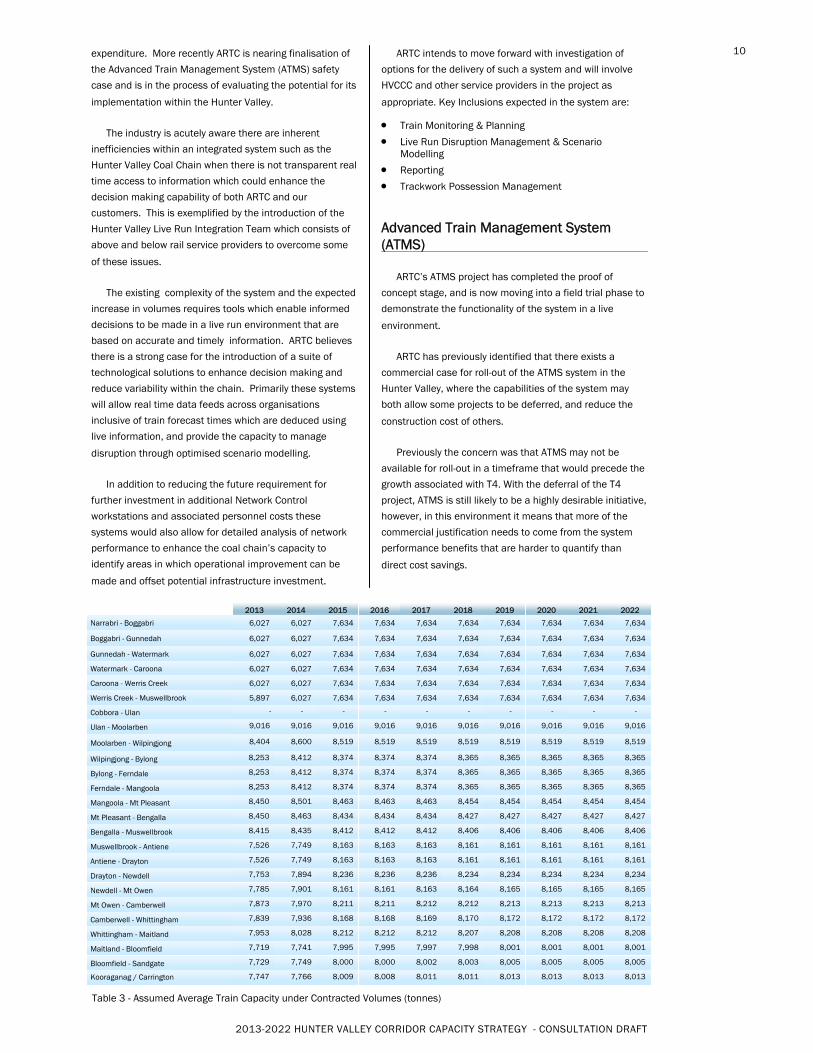
Table 3 - Assumed Average Train Capacity under Contracted Volumes (tonnes)
expenditure. More recently ARTC is nearing finalisation of
the Advanced Train Management System (ATMS) safety
case and is in the process of evaluating the potential for its
implementation within the Hunter Valley.
The industry is acutely aware there are inherent
inefficiencies within an integrated system such as the
Hunter Valley Coal Chain when there is not transparent real
time access to information which could enhance the
decision making capability of both ARTC and our
customers. This is exemplified by the introduction of the
Hunter Valley Live Run Integration Team which consists of
above and below rail service providers to overcome some
of these issues.
The existing complexity of the system and the expected
increase in volumes requires tools which enable informed
decisions to be made in a live run environment that are
based on accurate and timely information. ARTC believes
there is a strong case for the introduction of a suite of
technological solutions to enhance decision making and
reduce variability within the chain. Primarily these systems
will allow real time data feeds across organisations
inclusive of train forecast times which are deduced using
live information, and provide the capacity to manage
disruption through optimised scenario modelling.
In addition to reducing the future requirement for
further investment in additional Network Control
workstations and associated personnel costs these
systems would also allow for detailed analysis of network
performance to enhance the coal chain’s capacity to
identify areas in which operational improvement can be
made and offset potential infrastructure investment.
ARTC intends to move forward with investigation of
options for the delivery of such a system and will involve
HVCCC and other service providers in the project as
appropriate. Key Inclusions expected in the system are:
Train Monitoring & Planning
Live Run Disruption Management & Scenario Modelling
Reporting
Trackwork Possession Management
Advanced Train Management System (ATMS)
ARTC’s ATMS project has completed the proof of
concept stage, and is now moving into a field trial phase to
demonstrate the functionality of the system in a live
environment.
ARTC has previously identified that there exists a
commercial case for roll-out of the ATMS system in the
Hunter Valley, where the capabilities of the system may
both allow some projects to be deferred, and reduce the
construction cost of others.
Previously the concern was that ATMS may not be
available for roll-out in a timeframe that would precede the
growth associated with T4. With the deferral of the T4
project, ATMS is still likely to be a highly desirable initiative,
however, in this environment it means that more of the
commercial justification needs to come from the system
performance benefits that are harder to quantify than
direct cost savings.
2013-2022 HUNTER VALLEY CORRIDOR CAPACITY STRATEGY - CONSULTATION DRAFT
11
This Strategy focuses on the scope of work required for
prospective volumes under a ‘without ATMS’ scenario.
However, section 7 also provides an indication of changes
to scope that would occur if ATMS was adopted.
The 2012 Strategy identified a likely need to make a
decision on ATMS by late 2012. With the changes in the HV
environment and a separate initiative by ARTC to move
ATMS into the field trial phase, this decision has been able
to be deferred.
ARTC has developed an initial analysis of the
commercial benefit of ATMS in the Hunter Valley which
considers the reduced scope of work from implementing
ATMS, as well as identifying the other consequential
benefits from adoption of the technology. This needs to be
extended to consider its impact on system performance
and to this end ARTC is proposing a formal engagement
with the HVCCC and others to consider ways to model
system capacity incorporating ATMS.
Other Assumptions and Qualifications
The following additional qualifications apply to the
analysis and proposals in this Strategy:
Estimates of the numbers of trains required to carry the forecast coal tonnages are generally based on
train consists nominated by producers under the
contracting process. Assumed average train capacity
by section by year is shown in Table 3. Average train
size has increased significantly in the last year and
this is also reflected in the estimated train sizes
going forward. It should be noted that for the
Gunnedah basin it has been assumed that 30
tonne axle loads will apply from Q1 2015 even
though no final decision has been made.
Trains are, on average, loaded to 98% of their
theoretical capacity.
It is assumed that track closures for maintenance purposes will consume the same relative proportion
of capacity as at present. That is, it is assumed that
the same amount of maintenance time is required.
As paths become more closely spaced this will
increase the absolute number of paths lost but the
percentage of paths lost will remain constant.
The capacity gains referred to in this Strategy take no account of the capabilities of loading and
unloading interfaces, including the capabilities of
private rail sidings and loops. In other words, at the
conclusion of each project the identified rail capacity
will be available, but this does not necessarily mean
the coal supply chain will be able to make use of this
capacity at that stage. This broader capacity analysis
is undertaken by the HVCCC.
Infrastructure is treated as being available for a quarter if it is projected to be available by the end of
the first month of the quarter. If it is not expected to
be available until later than the first month of the
quarter it is treated as being available in the
following quarter. For example, if a project is
projected to be completed by 30 April, it is treated
as being available for the second quarter. If it will
not be competed until 1 May it would be treated as
being available for the third quarter.
It is assumed that a flyover for access to the NCIG facility will be constructed as part of Stage 2F of the
development in accordance with its planning
approvals.
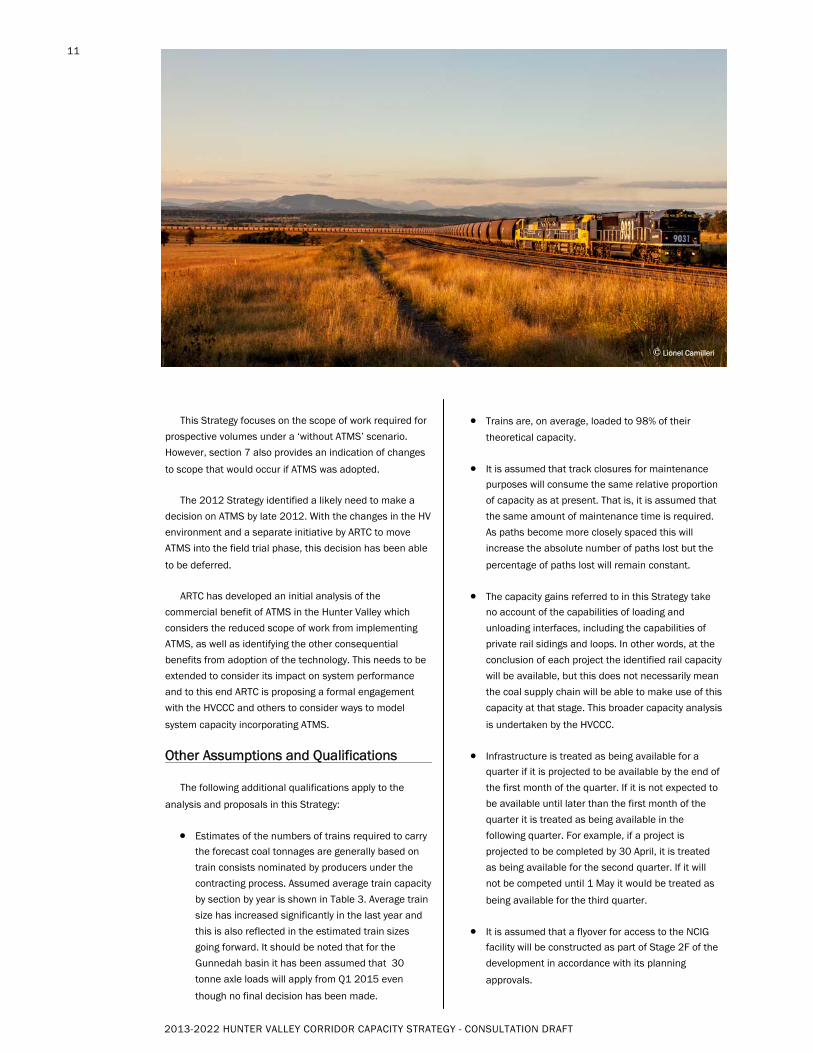
© Lionel Camilleri
2013-2022 HUNTER VALLEY CORRIDOR CAPACITY STRATEGY - CONSULTATION DRAFT
12
This section summarises the key methodology,
assumption and outcome changes between the 2012
Strategy and this 2013 Strategy to allow ready comparison
between the two.
Volume forecasts
Volume forecasts have been updated based on
contracted volumes. This Strategy maintains the distinction
between those volumes that are subject to a binding
contract and those that are associated with projects that
are moving forward but not yet at a stage where producers
wish to commit to a contract. The latter category is referred
to as prospective volumes.
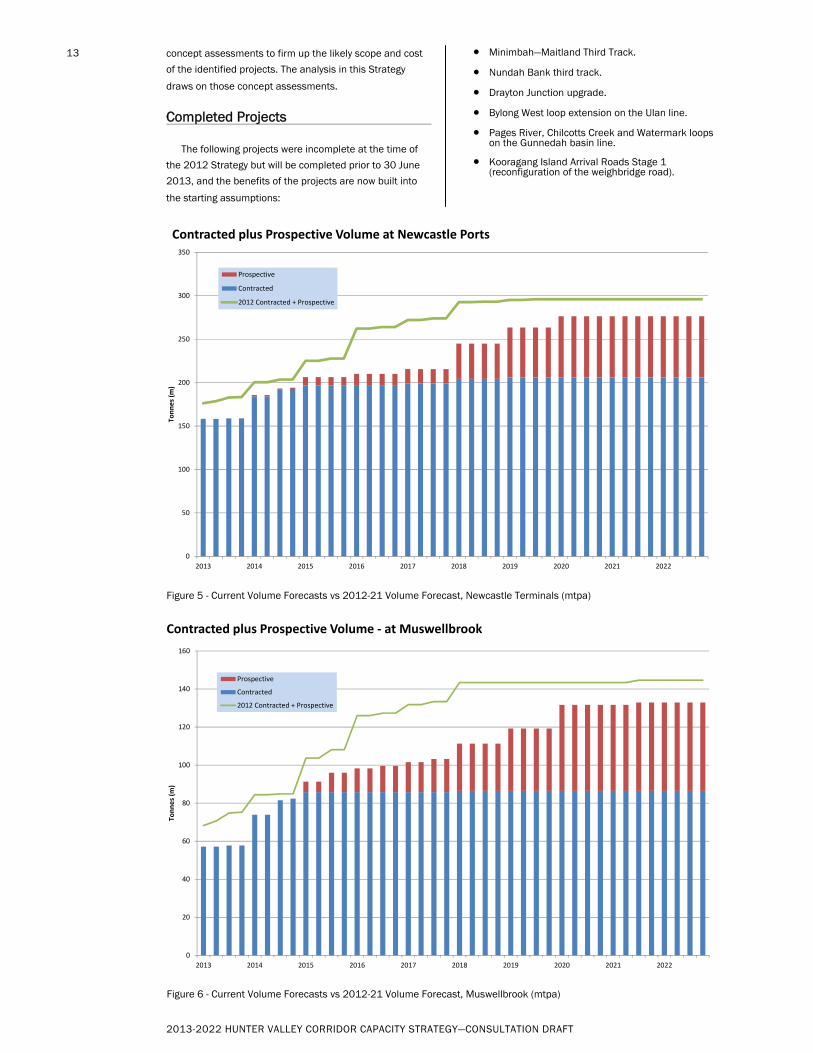
Figures 5 to 8 compare the forecast volumes from the
2012 Strategy with the forecasts used for this Strategy. A
comparison is made at the terminal, at Muswellbrook, for
the Bylong – Mangoola section (which is the majority of the
Ulan line), and Werris Creek – Muswellbrook (which is
representative of most of the Gunnedah basin line).
Capacity Calculation Inputs
As outlined in Chapter 1, the capacity calculation
methodology uses the industry nominated cancelation
losses and non-aligned maintenance losses as determined
by the HVCCC as inputs into the capacity calculation,
together with the target monthly tolerance cap (TMTC) as
determined by the RCG. While the TMTC is constant, the
forecast cancellation and maintenance rates will vary from
year to year.
Ideally the HV Capacity Strategy would be based on
forward estimates of cancellations and maintenance losses
on a year by year basis. However, at this time the HVCCC
only finalises these losses for the year ahead and only does
so when determining the Declared Inbound Throughput
(DIT). Accordingly this HV Strategy is based on the HVCCC
estimates of cancellations and maintenance losses for the
2013 year.
For 2012 the estimated cancellations rate was 15.7%
and the maintenance losses were 12.6%. For this 2013
Strategy these have been updated to 16.4% and 15.2%
The 16.4% cancellation rate equates to the 14.1% loss
rate as per the 2013 DIT assumptions released by the
HVCCC, but is expressed as 16.4% as it is applied as an
escalation rather than a reduction.
Concept Assessments
Following the identification in the 2012 Strategy of a
large program of works likely to be required in conjunction
with T4, ARTC has undertaken an extensive program of
What has changed between the last strategy and this one
2
© Michelle Delaney
2013-2022 HUNTER VALLEY CORRIDOR CAPACITY STRATEGY—CONSULTATION DRAFT
13
Figure 6 - Current Volume Forecasts vs 2012-21 Volume Forecast, Muswellbrook (mtpa)
Figure 5 - Current Volume Forecasts vs 2012-21 Volume Forecast, Newcastle Terminals (mtpa)
concept assessments to firm up the likely scope and cost
of the identified projects. The analysis in this Strategy
draws on those concept assessments.
Completed Projects
The following projects were incomplete at the time of
the 2012 Strategy but will be completed prior to 30 June
2013, and the benefits of the projects are now built into
the starting assumptions:
Minimbah—Maitland Third Track.
Nundah Bank third track.
Drayton Junction upgrade.
Bylong West loop extension on the Ulan line.
Pages River, Chilcotts Creek and Watermark loops on the Gunnedah basin line.
Kooragang Island Arrival Roads Stage 1 (reconfiguration of the weighbridge road).
0
50
100
150
200
250
300
350
2013 2014 2015 2016 2017 2018 2019 2020 2021 2022
Tonnes (m
)
Contracted plus Prospective Volume at Newcastle Ports
Prospective
Contracted
2012 Contracted + Prospective
0
20
40
60
80
100
120
140
160
2013 2014 2015 2016 2017 2018 2019 2020 2021 2022
Tonnes (m
)
Contracted plus Prospective Volume ‐ at Muswellbrook
Prospective
Contracted
2012 Contracted + Prospective
2013-2022 HUNTER VALLEY CORRIDOR CAPACITY STRATEGY - CONSULTATION DRAFT
14
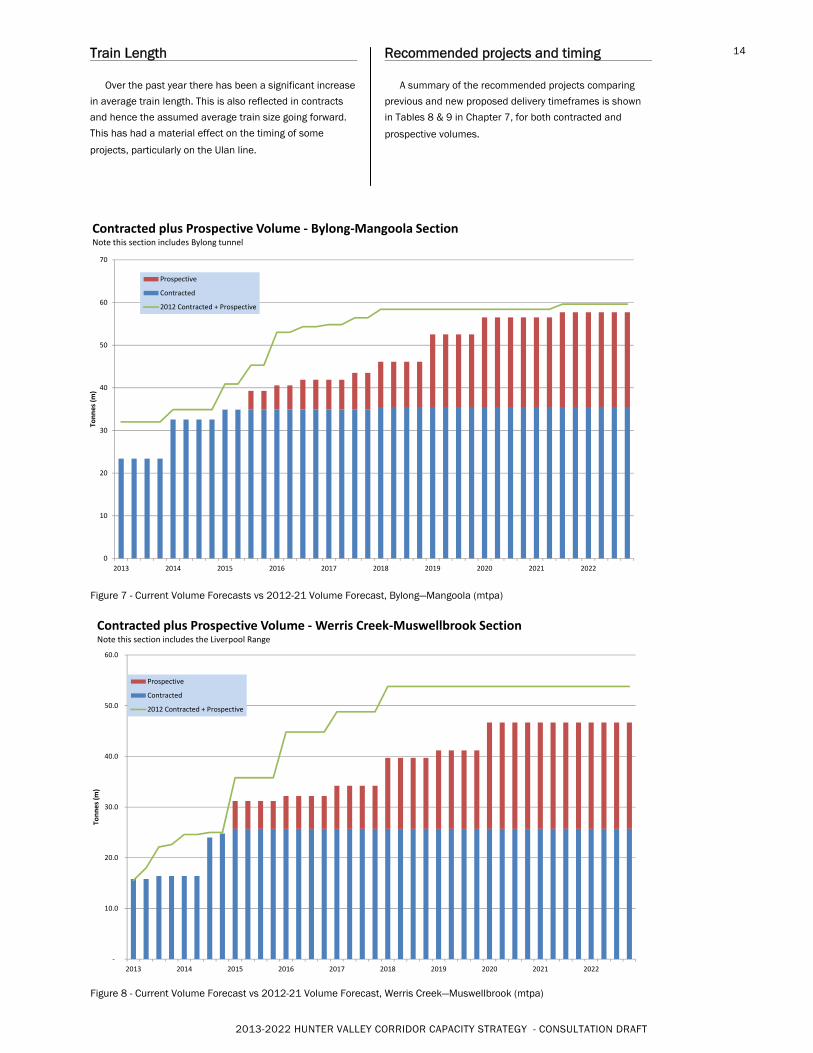
Figure 8 - Current Volume Forecast vs 2012-21 Volume Forecast, Werris Creek—Muswellbrook (mtpa)
Figure 7 - Current Volume Forecasts vs 2012-21 Volume Forecast, Bylong—Mangoola (mtpa)
Train Length
Over the past year there has been a significant increase
in average train length. This is also reflected in contracts
and hence the assumed average train size going forward.
This has had a material effect on the timing of some
projects, particularly on the Ulan line.
Recommended projects and timing
A summary of the recommended projects comparing
previous and new proposed delivery timeframes is shown
in Tables 8 & 9 in Chapter 7, for both contracted and
prospective volumes.
‐
10.0
20.0
30.0
40.0
50.0
60.0
2013 2014 2015 2016 2017 2018 2019 2020 2021 2022
Tonnes (m
)
Contracted plus Prospective Volume ‐Werris Creek‐Muswellbrook SectionNote this section includes the Liverpool Range
Prospective
Contracted
2012 Contracted + Prospective
0
10
20
30
40
50
60
70
2013 2014 2015 2016 2017 2018 2019 2020 2021 2022
Tonnes (m)
Contracted plus Prospective Volume ‐ Bylong‐Mangoola SectionNote this section includes Bylong tunnel
Prospective
Contracted
2012 Contracted + Prospective
2013-2022 HUNTER VALLEY CORRIDOR CAPACITY STRATEGY—CONSULTATION DRAFT
15
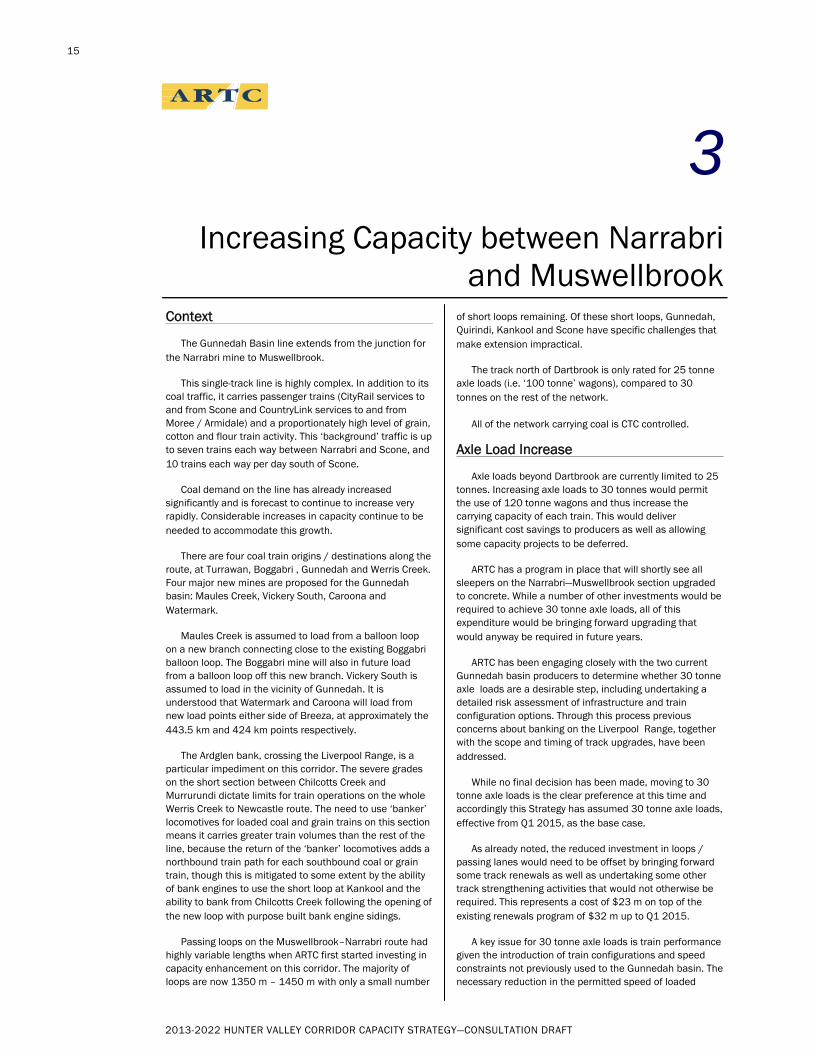
3 Increasing Capacity between Narrabri
and Muswellbrook Context
The Gunnedah Basin line extends from the junction for the Narrabri mine to Muswellbrook.
This single-track line is highly complex. In addition to its coal traffic, it carries passenger trains (CityRail services to and from Scone and CountryLink services to and from Moree / Armidale) and a proportionately high level of grain, cotton and flour train activity. This ‘background’ traffic is up to seven trains each way between Narrabri and Scone, and 10 trains each way per day south of Scone.
Coal demand on the line has already increased significantly and is forecast to continue to increase very rapidly. Considerable increases in capacity continue to be needed to accommodate this growth.
There are four coal train origins / destinations along the route, at Turrawan, Boggabri , Gunnedah and Werris Creek. Four major new mines are proposed for the Gunnedah basin: Maules Creek, Vickery South, Caroona and Watermark.
Maules Creek is assumed to load from a balloon loop on a new branch connecting close to the existing Boggabri balloon loop. The Boggabri mine will also in future load from a balloon loop off this new branch. Vickery South is assumed to load in the vicinity of Gunnedah. It is understood that Watermark and Caroona will load from new load points either side of Breeza, at approximately the 443.5 km and 424 km points respectively.
The Ardglen bank, crossing the Liverpool Range, is a particular impediment on this corridor. The severe grades on the short section between Chilcotts Creek and Murrurundi dictate limits for train operations on the whole Werris Creek to Newcastle route. The need to use ‘banker’ locomotives for loaded coal and grain trains on this section means it carries greater train volumes than the rest of the line, because the return of the ‘banker’ locomotives adds a northbound train path for each southbound coal or grain train, though this is mitigated to some extent by the ability of bank engines to use the short loop at Kankool and the ability to bank from Chilcotts Creek following the opening of the new loop with purpose built bank engine sidings.
Passing loops on the Muswellbrook–Narrabri route had highly variable lengths when ARTC first started investing in capacity enhancement on this corridor. The majority of loops are now 1350 m – 1450 m with only a small number
of short loops remaining. Of these short loops, Gunnedah, Quirindi, Kankool and Scone have specific challenges that make extension impractical.
The track north of Dartbrook is only rated for 25 tonne axle loads (i.e. ‘100 tonne’ wagons), compared to 30 tonnes on the rest of the network.
All of the network carrying coal is CTC controlled.
Axle Load Increase
Axle loads beyond Dartbrook are currently limited to 25 tonnes. Increasing axle loads to 30 tonnes would permit the use of 120 tonne wagons and thus increase the carrying capacity of each train. This would deliver significant cost savings to producers as well as allowing some capacity projects to be deferred.
ARTC has a program in place that will shortly see all sleepers on the Narrabri—Muswellbrook section upgraded to concrete. While a number of other investments would be required to achieve 30 tonne axle loads, all of this expenditure would be bringing forward upgrading that would anyway be required in future years.
ARTC has been engaging closely with the two current Gunnedah basin producers to determine whether 30 tonne axle loads are a desirable step, including undertaking a detailed risk assessment of infrastructure and train configuration options. Through this process previous concerns about banking on the Liverpool Range, together with the scope and timing of track upgrades, have been addressed.
While no final decision has been made, moving to 30 tonne axle loads is the clear preference at this time and accordingly this Strategy has assumed 30 tonne axle loads, effective from Q1 2015, as the base case.
As already noted, the reduced investment in loops / passing lanes would need to be offset by bringing forward some track renewals as well as undertaking some other track strengthening activities that would not otherwise be required. This represents a cost of $23 m on top of the existing renewals program of $32 m up to Q1 2015.
A key issue for 30 tonne axle loads is train performance given the introduction of train configurations and speed constraints not previously used to the Gunnedah basin. The necessary reduction in the permitted speed of loaded
2013-2022 HUNTER VALLEY CORRIDOR CAPACITY STRATEGY - CONSULTATION DRAFT
16
trains to 60 km/h, in line with 30 tonne axle loads elsewhere in the Hunter Valley, has different section time effects on different parts of the corridor. As a result, 30 tonne axle loads will have an effect on the sequencing of projects as well as their timing.
It will also not be possible to be confident about actual performance until operational trials are undertaken, which may lead to some adjustments to the program in the future.
For the purposes of the Strategy, it has been assumed that two different locomotive combinations will operate to the Gunnedah basin, two x 5020 class and three x TT class. These have different performance characteristics and a 30% / 70% ratio has been assumed.
Liverpool Range
In 2007 ARTC completed a study looking at options for a new rail alignment across the Liverpool Range in the vicinity of Ardglen. This report assessed four tunnel options and two surface alignment options as well as duplication of the existing alignment.
In the 2011-2020 Strategy ARTC indicated that its assessment of the costs and benefits of the options suggested that staged duplication of the existing line on the existing gradient was the best solution and that duplication would be treated as the default solution.
The Liverpool Range poses some particular complexities due to grades, curvature and geology. However, the decision to proceed with, initially, additional loops, followed by progressive duplication, means that in practical terms the Liverpool Range will essentially see a similar approach to capacity enhancement as the rest of the corridor. As such the staging of the enhancements is discussed in the context of ‘Loops & Passing Lanes’ below.
Scone Reconfiguration
The passing loop at Scone is short (410 m) and has an asymmetric layout, requiring all trains to negotiate a curved turnout leg and slowing speeds through the station area to 25 km/h. Level crossings and the proximity of the town make an extension of the loop impractical.
Passenger trains are the only services that stop at Scone. It is therefore proposed that the track arrangement at Scone should be altered to give an unrestricted run for through trains. This would save approximately 4 minutes in the section between Togar and Parkville.
At the time of the 2012 Strategy, ARTC had placed this project on hold due to a number of complexities and uncertainties associated with crossing of the New England Highway and construction / environmental issues. While these issues are not fully resolved it has now been recommended to the RCG that this project progress to construction to avoid the Parkville-Murulla section becoming a capacity bottleneck.
Werris Creek Bypass
Long coal trains standing in Werris Creek loop create operational complexities at Werris Creek, where a large proportion of non-coal trains need to access the yard, which can be blocked by a coal train in the loop.
An opportunity exists to resolve this problem and achieve a number of other desirable operational outcomes through reopening and reconfiguration of the alternative Gap – Werrris Creek line. This line is understood to have been constructed in the 1940’s to allow trains from the cross-country line from Dubbo to proceed toward Tamworth (and ultimately Brisbane) without reversing. It fell into disuse during the 1980’s but was partially reinstated in 2005 to provide the track for the Werris Creek mine coal loader.
If the line was reinstated the full way to Gap and a triangle connection established at the Werris Creek end, it would provide an effective bypass of Werris Creek. It would also give tremendous operational flexibility, with trains able to cross through the use of both lines.
The Burilda—Bells Gate section, which includes the Werris Creek bypass option, has now been subjected to a full concept assessment. This assessment looked at loop options as well as the bypass and concluded that the bypass at an estimate cost of $88.9 m could not be justified by the operational benefits compared to the alternative of two loops at an estimated cost of $52.0 m.
Accordingly the Strategy will now focus on the provision of loops north and south of Werris Creek at 414 km and 407 km respectively.
Gunnedah Yard
Gunnedah Yard is an important rail hub. The yard’s configuration and condition is such that it will increasingly become a constraint on the network between the Gunnedah Basin and the Port of Newcastle:
The Gunnedah Yard is currently un-signalled and therefore requires the mainline route to be set (and locked) via the Platform Road to facilitate both freight and passenger movements.
Shunting in the yard necessitates the “release” of the entire yard (including mainline operations) to private operators for manual yard operating.
The normal train speed through the yard is currently limited by permanent speed restrictions through the turnouts in the main line where through traffic diverts to the Platform Road. These turnouts limit speeds to a maximum of 25km/h. The main line track speed in both directions either side of the yard is 75/70 km/h;
Due to the rates of wear on a number of switch blades in critical turnouts, poor track condition, clearance issues between the Platform Road and the Station Platform and between the Platform Road and the Through Road, a further speed restriction of 20 km/h has been imposed through the yard.
The 20 km/h speed restriction blocks road traffic in the centre of town at two level crossings for extended periods.
A number of condition issues in Gunnedah Yard need to be addressed to maintain the track in a fit for purpose state recognising the significant increases in volume through this location. A scope of works that addressed both the condition and functionality issues would have cost synergies and offers the potential to defer construction of
2013-2022 HUNTER VALLEY CORRIDOR CAPACITY STRATEGY—CONSULTATION DRAFT
17
South Gunnedah loop by increasing the speed through
Gunnedah yard. On this basis it was recommended to the
RCG that South Gunnedah loop be placed on hold while a
concept assessment of Gunnedah yard upgrade was
completed.
For the purposes of this Strategy it is assumed that
Gunnedah yard is the preferred option. If it is determined
that the yard project does not offer value for money then
South Gunnedah loop will need to be accelerated to
provide the necessary capacity.
Train Lengths
Refinement of wagon designs has led to the recent
introduction of new wagons that are materially shorter than
the previous fleet. Approximately 82 of these wagons can
fit in the loops built for 72 wagon trains. ARTC has now
approved the introduction of trains of up to 1329 metres.
This represents a practical limit given current loop lengths
and the need to allow a margin at the loop ends. There will
be no further increase in length until the track
configuration changes to facilitate it.
For various operational reasons ARTC has been building
an increasing number of loops with a ‘simultaneous entry’
configuration. This configuration allows for a more efficient
cross to occur when opposing trains arrive at the loop at
around the same time, an event which becomes
increasingly probable as the distance between loops
decreases. A simultaneous entry configuration requires a
minimum extra 300 metres ‘overlap’ to be added to the
loop length, making the loops nominally 1650 metres,
though in the simultaneous entry configuration the extra
length is not available to use for longer trains. However, if
and when ATMS is introduced into the Hunter Valley it will
be possible to allow simultaneous entry without the
additional overlap, meaning that loops built in this style
would immediately be available for trains of the standard
Hunter Valley length of 1565 metres.
Given this opportunity to move progressively towards
the introduction of the standard Hunter Valley train to the
Gunnedah basin, ARTC is moving toward an approach of
building all new loops to the simultaneous entry
configuration where this is practical, which provides short-
term operational benefits and the ability to easily move to
longer trains if and when ATMS is introduced.
Loops & Passing Lanes
Progressive lengthening of selected existing passing
loops, and constructing additional passing loops, has been
the primary mechanism for accommodating volume growth
to date. However, only two loops (Aberdeen and
Murrurundi) remain for potential extension. Opportunities
to insert additional mid-section loops are becoming
constrained due to the effects of grades and level
crossings, while the increasingly short distances between
loops mean that additional mid-section loops are of
declining benefit due to the transaction times at the loop.
Notwithstanding this, the concept assessments
undertaken over the past year on projects required to
accommodate prospective volumes have tended to
conclude that a mid-section loop remains the preferred
solution. In some cases these new loops will be quite close
to existing loops. However, where it is practical to construct
a mid-section loop the additional cost associated with
building a passing lane does not justify the additional
benefit. As a result, passing lanes have only been
recommended where there are physical constraints to a
mid-section loop.
Specifically, the previous Togar North extension has
been replaced by a loop centered around the 311 km point
while the Parkville south extension on the other side of
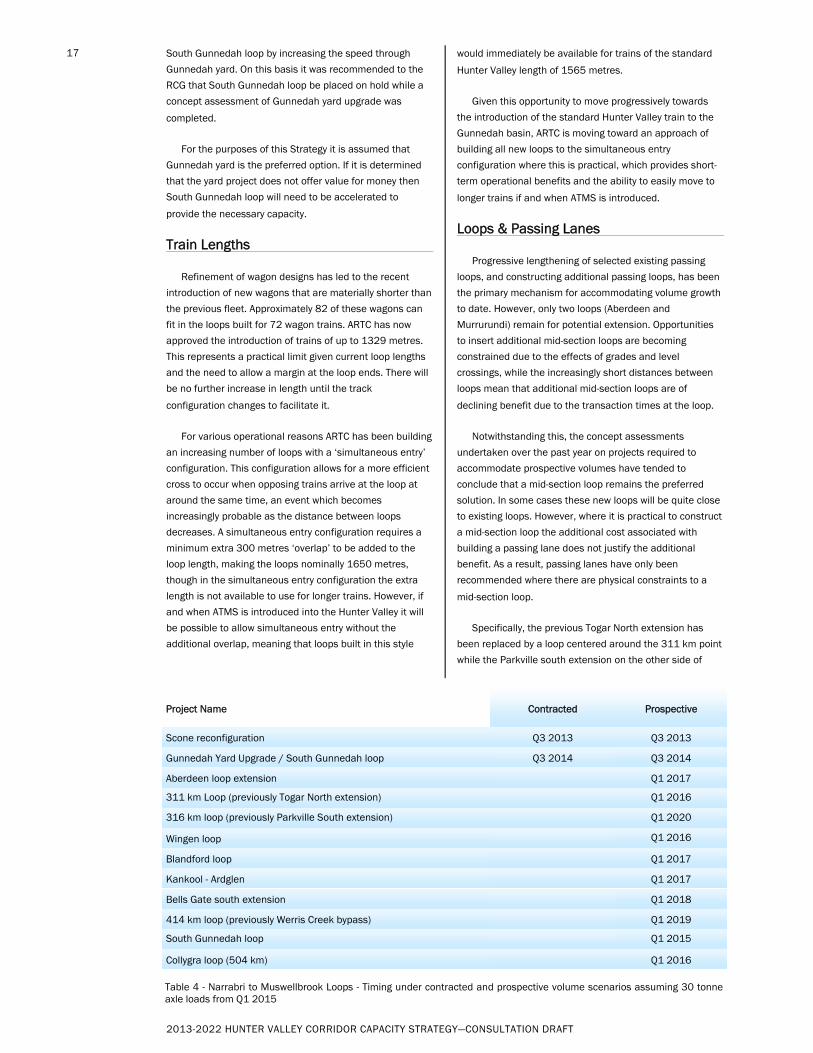
Project Name Contracted Prospective
Scone reconfiguration Q3 2013 Q3 2013
Gunnedah Yard Upgrade / South Gunnedah loop Q3 2014 Q3 2014
Aberdeen loop extension Q1 2017
311 km Loop (previously Togar North extension) Q1 2016
316 km loop (previously Parkville South extension) Q1 2020
Wingen loop Q1 2016
Blandford loop Q1 2017
Kankool - Ardglen Q1 2017
Bells Gate south extension Q1 2018
414 km loop (previously Werris Creek bypass) Q1 2019
Collygra loop (504 km) Q1 2016
South Gunnedah loop Q1 2015
Table 4 - Narrabri to Muswellbrook Loops - Timing under contracted and prospective volume scenarios assuming 30 tonne axle loads from Q1 2015
2013-2022 HUNTER VALLEY CORRIDOR CAPACITY STRATEGY - CONSULTATION DRAFT
18
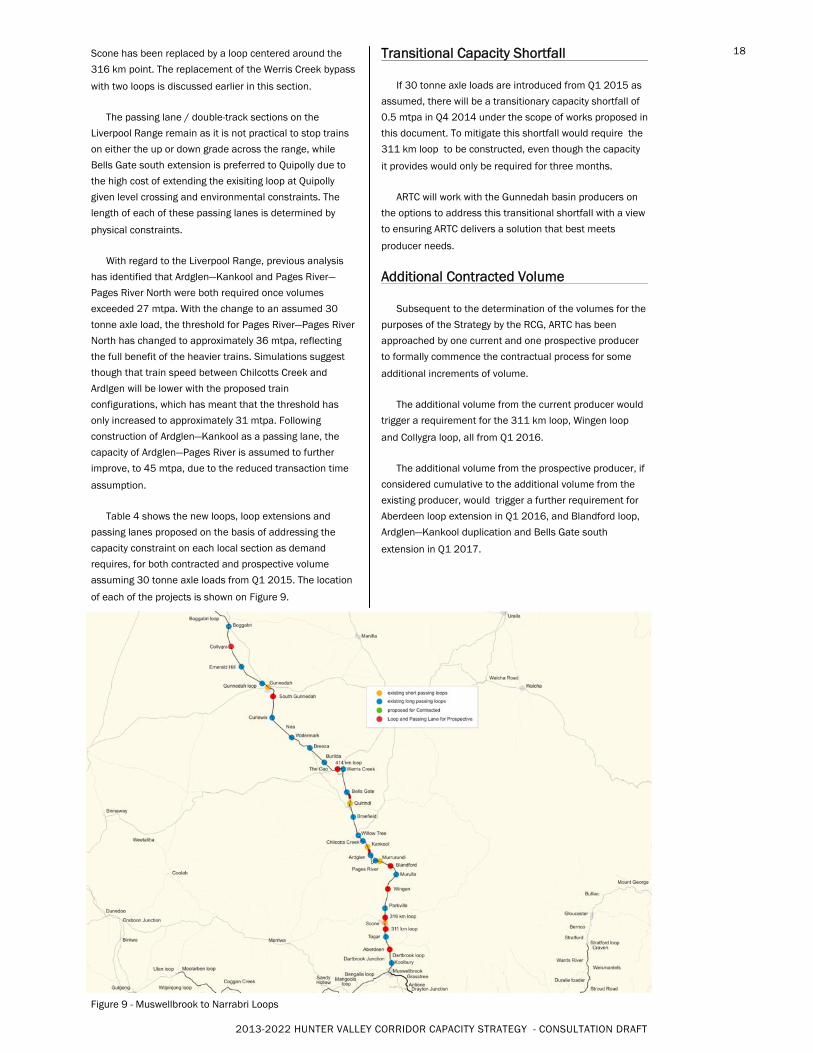
Figure 9 - Muswellbrook to Narrabri Loops
Scone has been replaced by a loop centered around the
316 km point. The replacement of the Werris Creek bypass
with two loops is discussed earlier in this section.
The passing lane / double-track sections on the
Liverpool Range remain as it is not practical to stop trains
on either the up or down grade across the range, while
Bells Gate south extension is preferred to Quipolly due to
the high cost of extending the exisiting loop at Quipolly
given level crossing and environmental constraints. The
length of each of these passing lanes is determined by
physical constraints.
With regard to the Liverpool Range, previous analysis
has identified that Ardglen—Kankool and Pages River—
Pages River North were both required once volumes
exceeded 27 mtpa. With the change to an assumed 30
tonne axle load, the threshold for Pages River—Pages River
North has changed to approximately 36 mtpa, reflecting
the full benefit of the heavier trains. Simulations suggest
though that train speed between Chilcotts Creek and
Ardlgen will be lower with the proposed train
configurations, which has meant that the threshold has
only increased to approximately 31 mtpa. Following
construction of Ardglen—Kankool as a passing lane, the
capacity of Ardglen—Pages River is assumed to further
improve, to 45 mtpa, due to the reduced transaction time
assumption.
Table 4 shows the new loops, loop extensions and
passing lanes proposed on the basis of addressing the
capacity constraint on each local section as demand
requires, for both contracted and prospective volume
assuming 30 tonne axle loads from Q1 2015. The location
of each of the projects is shown on Figure 9.
Transitional Capacity Shortfall
If 30 tonne axle loads are introduced from Q1 2015 as
assumed, there will be a transitionary capacity shortfall of
0.5 mtpa in Q4 2014 under the scope of works proposed in
this document. To mitigate this shortfall would require the
311 km loop to be constructed, even though the capacity
it provides would only be required for three months.
ARTC will work with the Gunnedah basin producers on
the options to address this transitional shortfall with a view
to ensuring ARTC delivers a solution that best meets
producer needs.
Additional Contracted Volume
Subsequent to the determination of the volumes for the
purposes of the Strategy by the RCG, ARTC has been
approached by one current and one prospective producer
to formally commence the contractual process for some
additional increments of volume.
The additional volume from the current producer would
trigger a requirement for the 311 km loop, Wingen loop
and Collygra loop, all from Q1 2016.
The additional volume from the prospective producer, if
considered cumulative to the additional volume from the
existing producer, would trigger a further requirement for
Aberdeen loop extension in Q1 2016, and Blandford loop,
Ardglen—Kankool duplication and Bells Gate south
extension in Q1 2017.
2013-2022 HUNTER VALLEY CORRIDOR CAPACITY STRATEGY—CONSULTATION DRAFT
19
Context
The Ulan line extends approximately 170 km, from Ulan, west of the dividing range, to Muswellbrook in the upper Hunter Valley. It is a single track line, with passing loops at Bengalla, Mangoola, Yarrawa, Sandy Hollow, Kerrabee, Baraemi, Murrumbo, Bylong, Coggan Creek, Wollar, Wilpinjong and Ulan (though the Ulan loop is only 980 m), and is CTC controlled.
Although the line is used mainly by coal trains, it is also used by one or two country ore and grain trains per day and occasionally by interstate freight trains that are bypassing Sydney during possessions. The line services long-standing mines at Bengalla and Ulan. The Wilpinjong, Moolarben and Mangoola mines have all commenced production in recent years.
Five new export coal mines (Mt Pleasant, Ferndale, Bylong and Mt Penny) are at various stages of the develop-ment and approval process.
A fifth mine, Cobbora, located approximately 33 km north-west of Gulgong, is being developed primarily to pro-duce coal suitable for domestic power generation. The Cobbora Coal Project is a NSW government initiative linked to the privatisation of the NSW electricity industry. Last year the Cobbora volumes were treated as contracted as contracts were expected to be completed in the short-term, but for this Strategy they have been treated as prospective.
The mines on this sector are clustered either at the start of the line near Muswellbrook (Bengalla, Mangoola, Mt Pleasant) or at the end of the line around Ulan (Ulan, Wilpingjong, Moolarben). This gives rise to a long section in the middle with homogenous demand. The proposed Mt Penny and Bylong mines will be toward the Ulan end, but 30 km closer to Muswellbrook.
The Ulan line has some difficult geography which con-strains the location of loops. As sections become shorter, the scope to adjust the location of the loop declines. Ac-cordingly, as investigation of nominal sites has progressed, it has become necessary to consider alternative solutions. Specifically, in some cases it has become necessary to construct “passing lanes”, which are effectively short sec-tions of double track. These will necessarily be materially more expensive than straightforward loops.
An unusual capacity constraint is posed by the ventila-tion in the tunnels on the Ulan line, in particular the Bylong tunnel. Although the line only opened in 1982, the four tunnels were built as part of the original uncompleted con-struction of the line which commenced in 1915. According-ly the tunnels were built to a relatively small outline and ventilation in the tunnels has been considered a problem. Train spacing and track maintenance has been limited by the ‘purge times’ for air in the tunnel. Extensive monitoring and analysis has allowed the previous operating rule that limited trains to operating at an arbitrary 30 minute mini-mum frequency to be reduced to 20 minutes. This has largely addressed the ventilation issue.
This analysis of the Ulan line assumes that there is no change to the current pattern of limited background (non-coal) trains on this line.
Tunnel Ventilation
As noted above, it has been possible to manage the immediate tunnel ventilation issue.
In the longer term, it will be necessary to extend the Bylong loop to the western tunnel portal for prospective volumes. This extension would be built to a new vertical alignment, with the track cresting at a point around one kilometre before the portal so that trains are able to start on an acceptable gradient. This will also reduce the re-quirement for trains to be powering as they enter the tun-nel, providing further mitigation of the air quality issue.
Cobbora — Ulan
The Cobbora mine is located approximately 50 km west of Ulan. It is proposed to connect a new branch line with balloon loop to the Gulgong – Merrygoen line at Tallawang. This would add approximately 40 km of track to the net-work used by coal services.
A key issue for this traffic is train length. Existing facili-ties at the Eraring and Vales Point power stations, which connect to the RailCorp network, are length constrained. ARTC has indicated that it would be unacceptable to oper-ate trains on the Ulan line that were significantly shorter than the current fleet. While the power generators have been investigating this issue in detail, it remains unre-solved at this time.
4 Increasing capacity between Ulan and
Muswellbrook
2013-2022 HUNTER VALLEY CORRIDOR CAPACITY STRATEGY - CONSULTATION DRAFT
20
The track between Ulan and Tallawang will require up-grading to accommodate 30 tonne axle loads and the sig-nalling system will need improvement. An additional loop, nominally north of Gulgong, may be required depending on final train size. The indicative Cobbora volumes would also require loops at Mt Pleasant, and Widden Creek and either the Murrumbo west or Bylong east extension.
Denman Bypass
The 2011 Strategy identified an option to construct a bypass of Denman, from just east of Sandy Hollow to just west of Mangoola, as an alternative to an additional loop (nominally at 324 km) on this section. The 11.5 km bypass would provide operational efficiencies (reducing route length by 8.7 km) as well as creating capacity by effectively making the section double track.
The HVCCC has identified the Denman bypass as a potential option for creating additional train park-up capaci-ty. The bypass option will continue to be assessed in the context of all three of these potential sources of benefit noting that the likely trigger for such a project, the con-struction of a loop at 324 km, is now only required under the prospective volume scenario and only by Q1 2018.
Increasing Train Speed
The default solution for increasing capacity is to build additional loops or track. However, there is also an option to reduce section running times, and hence increase ca-
pacity, by lifting train speed. This option was reviewed in the context of the 2011 Strategy and it was determined that there was no scope for significant benefit from this option since in most cases speed is limited by train perfor-mance and curve speeds rather than the maximum speed. However, to ensure that the program is optimised this option will be reviewed periodically.
Additional Passing Loops/Passing Lanes
Additional passing loops, or where necessary passing lanes, represent the main mechanism to deliver further incremental increases in capacity on the line. Site investi-gation and concept development is ongoing to allow refine-ment of the proposed solutions.
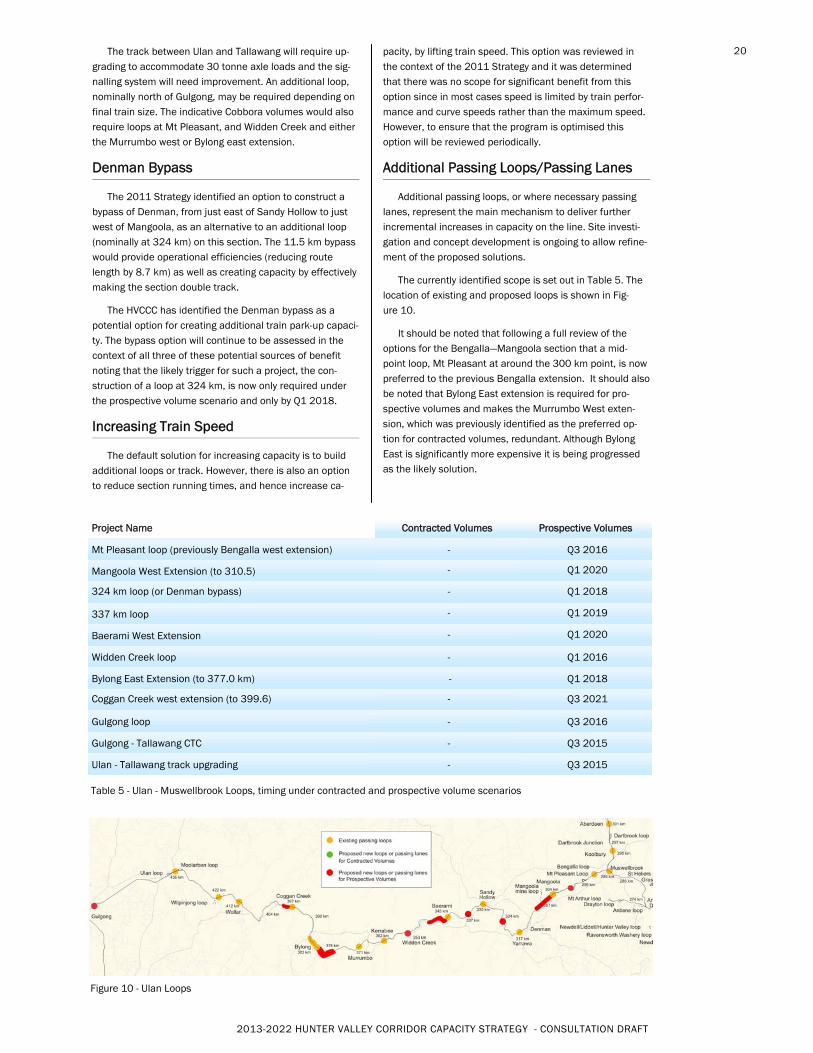
The currently identified scope is set out in Table 5. The location of existing and proposed loops is shown in Fig-ure 10.
It should be noted that following a full review of the options for the Bengalla—Mangoola section that a mid-point loop, Mt Pleasant at around the 300 km point, is now preferred to the previous Bengalla extension. It should also be noted that Bylong East extension is required for pro-spective volumes and makes the Murrumbo West exten-sion, which was previously identified as the preferred op-tion for contracted volumes, redundant. Although Bylong East is significantly more expensive it is being progressed as the likely solution.
Figure 10 - Ulan Loops
Project Name Contracted Volumes Prospective Volumes
Mt Pleasant loop (previously Bengalla west extension) - Q3 2016
Mangoola West Extension (to 310.5) - Q1 2020
324 km loop (or Denman bypass) - Q1 2018
337 km loop - Q1 2019
Baerami West Extension - Q1 2020
Widden Creek loop - Q1 2016
Bylong East Extension (to 377.0 km) - Q1 2018
Coggan Creek west extension (to 399.6) - Q3 2021
Gulgong loop - Q3 2016
Gulgong - Tallawang CTC - Q3 2015
Ulan - Tallawang track upgrading - Q3 2015
Table 5 - Ulan - Muswellbrook Loops, timing under contracted and prospective volume scenarios
2013-2022 HUNTER VALLEY CORRIDOR CAPACITY STRATEGY—CONSULTATION DRAFT
21
Context
The major issues affecting the line between Maitland and Muswellbrook are:
Headways
Junctions
Continuous flow of trains
Headways are fundamentally a function of signal spacing and design. Drivers should ideally only ever see a green signal on double track, so that they do not slow down in anticipation of potentially encountering a red signal. To achieve this outcome, a train needs to be at least 4 signals behind the train in front so that the signal a driver encounters, and the next one beyond, are both at green. Signal spacing also needs to take into account train speed and braking capability. Signals need to be spaced such that a train travelling at its maximum speed and with a given braking capability can stop in the distance between a yellow and a red signal. In some cases these constraints start to overlap, in which case it becomes necessary to go to a fifth signal, with a flashing yellow indication.
Ideally, headways on the whole corridor from Muswellbrook to the Terminal should be consistent so that trains can depart at regular intervals, and as additional trains join the network they can slot in to a spare path without impacting a mainline train. This headway target needs to be around 8 minutes3 once volume exceeds around an average of 84 paths per day, or 245 mtpa at current train lengths.
While this principle has been adopted in the signalling design for new works, there have not as yet been any specific projects directed specifically at reducing signal spacing. At this stage effective headway is at around 8 minutes south of Minimbah, but increases further up the line. Spacing is as high as 16 minutes in the vicinity of Drayton Junction.
It should also be noted that in a live operating environment, all trains will ideally operate at consistent speeds and achieve the section run time. To the extent that they do not it results in drivers encountering yellow signals, which causes them to slow, creating a cascading effect on following trains that will cause a loss of capacity.
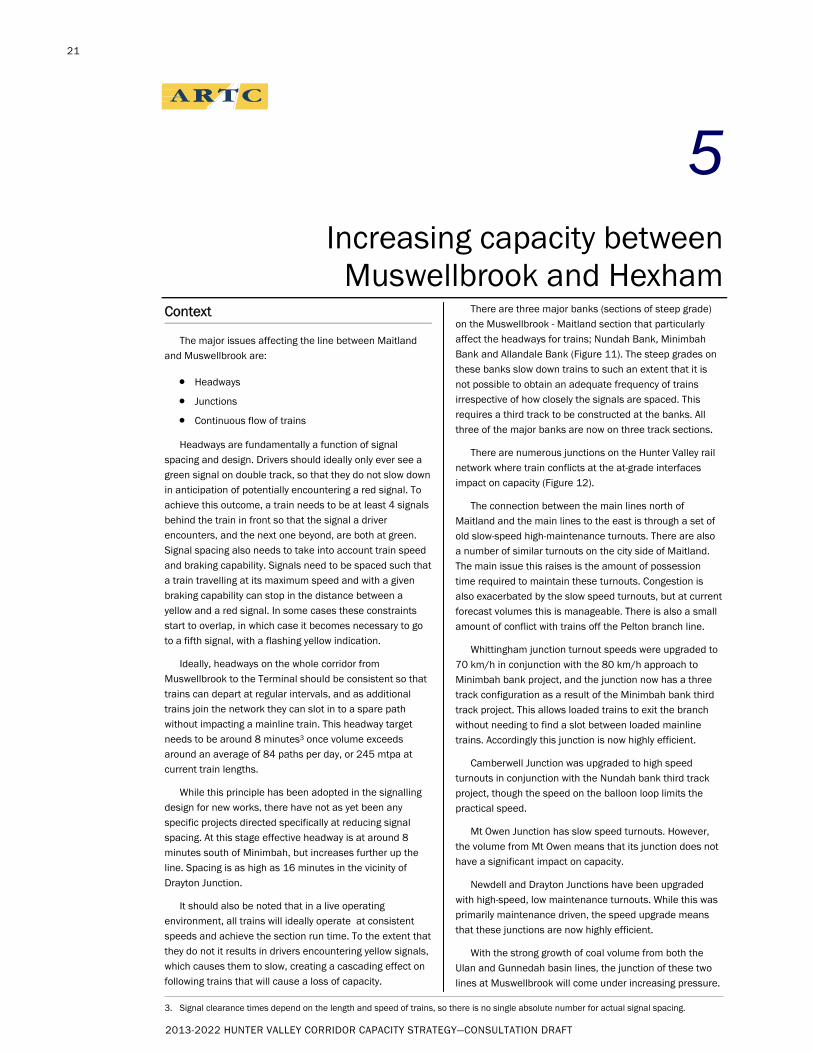
There are three major banks (sections of steep grade) on the Muswellbrook - Maitland section that particularly affect the headways for trains; Nundah Bank, Minimbah Bank and Allandale Bank (Figure 11). The steep grades on these banks slow down trains to such an extent that it is not possible to obtain an adequate frequency of trains irrespective of how closely the signals are spaced. This requires a third track to be constructed at the banks. All three of the major banks are now on three track sections.
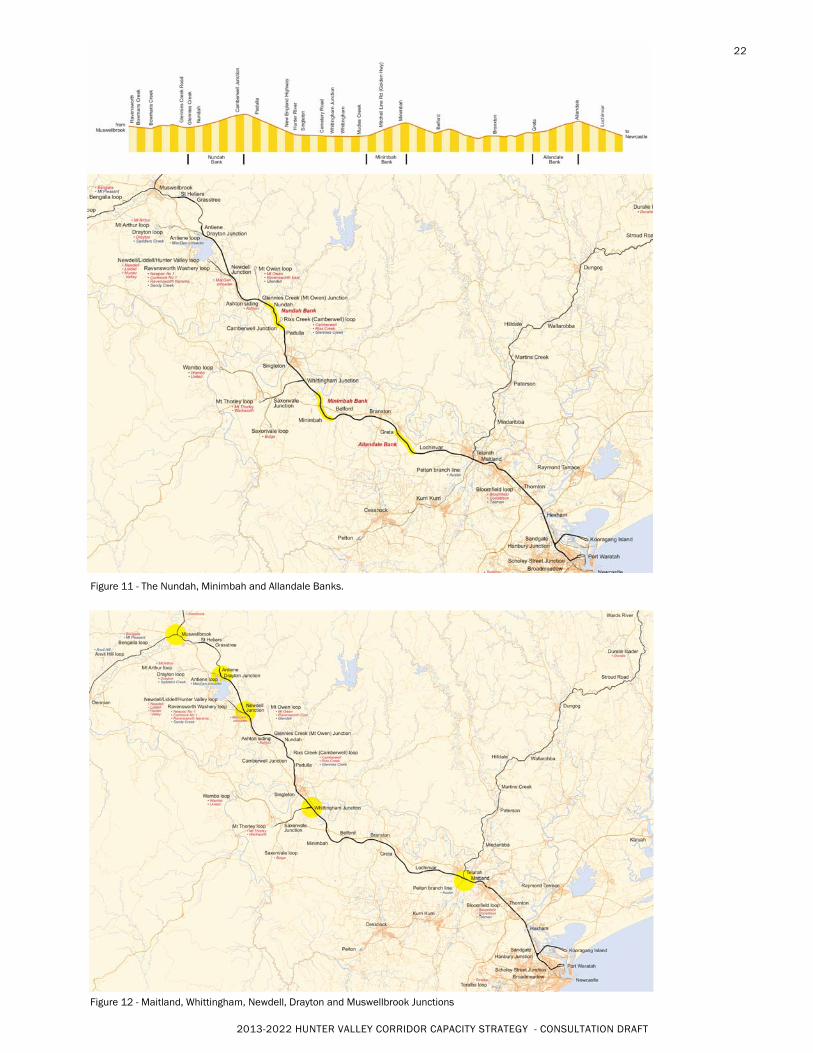
There are numerous junctions on the Hunter Valley rail network where train conflicts at the at-grade interfaces impact on capacity (Figure 12).
The connection between the main lines north of Maitland and the main lines to the east is through a set of old slow-speed high-maintenance turnouts. There are also a number of similar turnouts on the city side of Maitland. The main issue this raises is the amount of possession time required to maintain these turnouts. Congestion is also exacerbated by the slow speed turnouts, but at current forecast volumes this is manageable. There is also a small amount of conflict with trains off the Pelton branch line.
Whittingham junction turnout speeds were upgraded to 70 km/h in conjunction with the 80 km/h approach to Minimbah bank project, and the junction now has a three track configuration as a result of the Minimbah bank third track project. This allows loaded trains to exit the branch without needing to find a slot between loaded mainline trains. Accordingly this junction is now highly efficient.
Camberwell Junction was upgraded to high speed turnouts in conjunction with the Nundah bank third track project, though the speed on the balloon loop limits the practical speed.
Mt Owen Junction has slow speed turnouts. However, the volume from Mt Owen means that its junction does not have a significant impact on capacity.
Newdell and Drayton Junctions have been upgraded with high-speed, low maintenance turnouts. While this was primarily maintenance driven, the speed upgrade means that these junctions are now highly efficient.
With the strong growth of coal volume from both the Ulan and Gunnedah basin lines, the junction of these two lines at Muswellbrook will come under increasing pressure.
5 Increasing capacity between
Muswellbrook and Hexham
3. Signal clearance times depend on the length and speed of trains, so there is no single absolute number for actual signal spacing.
2013-2022 HUNTER VALLEY CORRIDOR CAPACITY STRATEGY - CONSULTATION DRAFT
22
Figure 11 - The Nundah, Minimbah and Allandale Banks.
Figure 12 - Maitland, Whittingham, Newdell, Drayton and Muswellbrook Junctions
2013-2022 HUNTER VALLEY CORRIDOR CAPACITY STRATEGY—CONSULTATION DRAFT
23
Two new junctions are proposed to be added to the network between Muswellbrook and Maitland by producers. The current Ravensworth loop, which is integrated into the Newdell loop, is proposed to be separated and given a new junction at approximately the 259.9 km point, along with a holding loop, while a new balloon loop for the Rix’s Creek mine is proposed with the junction at approximately the 243.5 km point.
A key issue for efficiency at the terminal is the need for the dump stations to receive a continuous flow of trains. When the flow of trains at the dump station is interrupted, this creates a direct unrecoverable loss of coal chain capacity, except to the extent that maintenance downtime of the terminal infrastructure can be aligned to the rail side disruption. A critical consideration for the coal chain as a whole is therefore maximising the continuity of trains rather than simply total track capacity.
The following sections discuss in turn each of the major projects arising from the need to address these issues:
Muswellbrook Junction
In the medium term, the continuing growth from both the Ulan and Gunnedah basin lines means that the capacity of the at-grade junction at Muswellbrook will become stretched. The 2011 Strategy included a discussion that noted that for the then indicatively contracted volumes:
Southbound trains are likely to be delayed around
20% of the time for an average of 6 minutes.
Northbound trains are likely to be delayed around
16% - 20% of the time for an average of 10 minutes.
It noted that while these levels of delay are material, they do not reach a level where they are likely to have a major negative impact on capacity, or the efficient operation of the coal chain, and that on this basis it would be possible to do nothing at Muswellbrook for contractual volumes.
However, it also noted that the HVCCC had floated the concept of having some holding / resequencing capacity in the vicinity of Muswellbrook and recommended that further assessment of options be undertaken, including the feasibility of a long-standing concept to bypass Muswellbrook by connecting the Drayton branch to the Ulan line in the vicinity of Bengalla.
The 2012 Strategy noted that both the Muswellbrook Junction third track and Muswellbrook Bypass options had had further analysis undertaken on them and that the best solution for the Muswellbrook Junction Third Track involved building a new track mostly on the Up side. Due to track geometry issues this would need to extend to the 286.3 km point, giving a third track of approximately 2.6 km standing room.
Further options, including a flyover in Muswellbrook, and duplication of both the Ulan line between Muswellbrook and Bengalla and the Gunnedah line between Muswellbrook and Koolbury, have been assessed, and it has been concluded that the option of a Third Track
heading east from Muswellbrook offers the best operational outcome and value for money.
As noted in the 2011 Strategy, the level of congestion at Muswellbrook, while material under contracted volumes, is tolerable, and the work done to date would suggest that all of the solutions are only worth pursuing once volume growth, and hence congestion, approach a level where a solution is unavoidable. This threshold was nominally set at 130 mtpa, which equated to approximately 45 paths/day. Given the increase in average train size and changes to volume forecasts this threshold is anticipated to now not be reached until Q1 2020 under the prospective volume scenario.
Muswellbrook—Drayton Signal Headways
Signal headways on the Muswellbrook—Drayton section are currently as high as 16 minutes based on the double-green principle. Under the prospective volume scenario this headway will limit capacity from Q1 2020.
A concept assessment of options to address this headway constraint with the objective of achieving 8 minute headways was undertaken, which would then allow a consistent path pattern from Muswellbrook to the port terminals.
This analysis concluded that due to the rising gradient encountered by loaded trains an 8 minute headway would only be possible by construction of a third track or with ATMS.
A 14 minute headway is the best achievable with a signaling solution on its own. However, this is largely dictated by differentials in speed and hence braking capability of different train types. If non-coal freight trains are limited to a lower speed it would be possible to achieve either 12 minute or 10 minute headways with a signaling solution.
On this basis the preferred way forward is to pursue a 12 minute headway. While this does not allow an 8 minute pattern of trains from Muswellbrook, it will allow for an 8 minute pattern from Drayton with 2/3 paths able to start from Muswellbrook based on a 24 minute repeating pattern.
Drayton—Whittingham Bi-directional Signalling
The 2012 Strategy identified that there was increasing pressure for the bi-directional signalling of the Drayton – Whittingham section (the balance of the Muswellbrook—Mailtand corridor is already bi-directionally signalled). This is primarily driven by the growing pressure on maintenance, with maintenance demands growing as volume increases, while the tonnage loss from the same amount of maintenance possession time is also increasing with train frequency. The proposed timing of the project equated to a volume of 175 mt at Camberwell Jct, or approximately 63 trains / day. Under the 2013 assumptions this limit will be reached in Q1 2019 under prospective volumes
However, subsequent to the 2012 Strategy ARTC has been considering alternative maintenance strategies. A
2013-2022 HUNTER VALLEY CORRIDOR CAPACITY STRATEGY - CONSULTATION DRAFT
24
new regime whereby all renewals and capital tie-ins would take place during eight 60 hour possession per year, or a similar approach, appears to have considerable potential. If this approach was adopted it would mean that the Drayton—Whittingham bi-di project may not be required.
Drayton—Whittingham Signal Headways
The Nundah Bank Third Track project was completed in late 2012 and cleared the Newdell—Whittingham section for 10 minute headways.
The 2012 Strategy indicated that to achieve an 8 minute headway it may be necessary to extend the Nundah Bank third track toward Singleton as well as undertaking some resignalling.
A concept assessment of the requirements for this section to achieve 8 minute headways concluded that it would not be necessary to extend the Nundah Bank third track. However, there will be some requirement for resignalling to reduce the headway in some locations between Drayton and Whittingham. It is important to note that this applies in both the Up and Down directions. It is also important to note that this approach will require coal trains to pass a key signal on Nundah bank under full power even when it is at yellow. This approach would be technically acceptable as loaded coal trains are travelling at around 20 km/h at this point and would still have adequate ability to stop if the following signal was red. However, this solution breaches the double-green principle and will therefore require further investigation with rail operators before a solution is confirmed.
At the time of the 2012 Strategy it was anticipated that any resignalling would be undertaken in conjunction with
the installation of bi-directional signaling between Drayton and Whittingham, to ease the impact of track possessions and achieve cost synergies. However, recent consideration of options for future maintenance (discussed above) may make the bi-directional signaling unnecessary. The Nundah—Whittingham resignaling has therefore been split out of the bi-di project and the two projects will be assessed separately.
It will be desirable to implement consistent 8 minute headways once train numbers at Whittingham Jct exceed an average of 80 per day. This is now expected in Q1 2020.
Minimbah Bank Resignalling
The 2012 Strategy identified that to achieve 8 minute headways on Minimbah bank would probably require the removal of the tonnage signal on the Up Main at the bottom of Minimbah bank and some signal adjustments on the Up Main on Minimbah bank.
The constraints have now been analysed in more detail and it has been concluded that trains can operate to an 8-minute headway on Minimbah bank provided they alternate between the Up Main and Up Relief and two additional signals are provided on the Up Main to close up the signal spacing.
Minimbah bank has a tonnage signal on the Up Main that ensures a train does not get onto the bank unless it has a clear run to the top of the bank. This applies to the Up Main due to its 1 in 80 grade but not the Up Relief, which has a 1 in 100 grade. This solution would retain the tonnage signal.
© Henry Owen
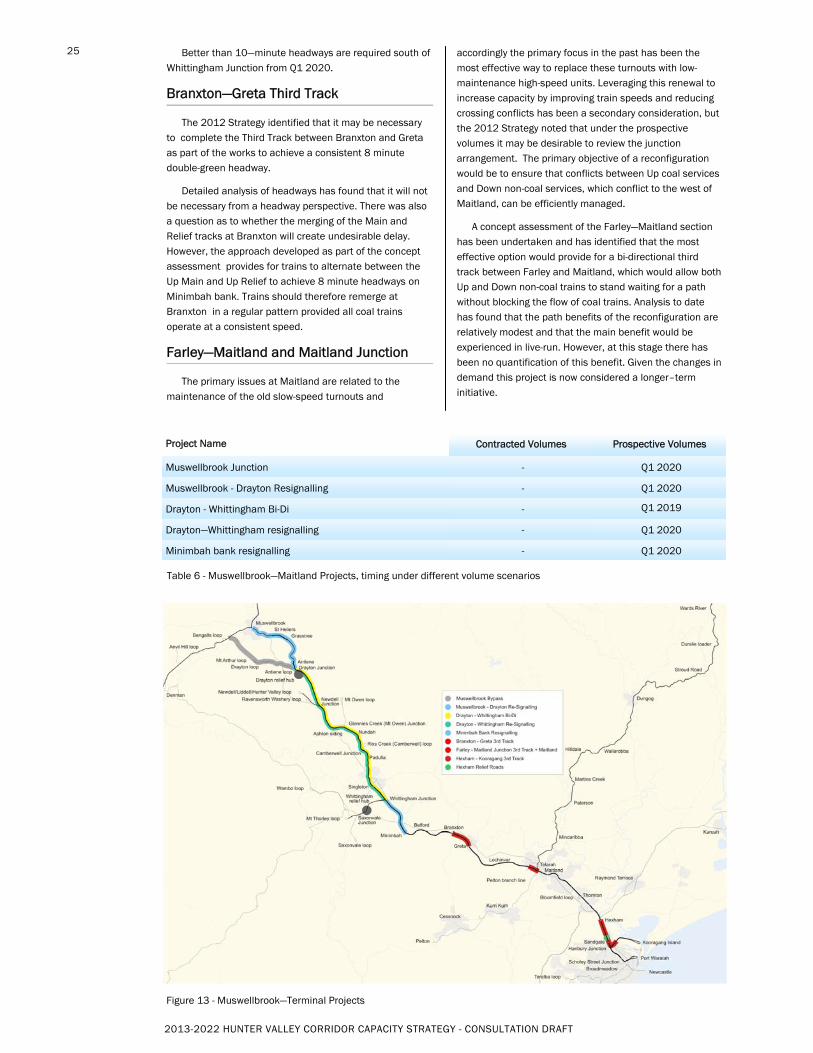
2013-2022 HUNTER VALLEY CORRIDOR CAPACITY STRATEGY - CONSULTATION DRAFT
25
Better than 10—minute headways are required south of Whittingham Junction from Q1 2020.
Branxton—Greta Third Track
The 2012 Strategy identified that it may be necessary to complete the Third Track between Branxton and Greta as part of the works to achieve a consistent 8 minute double-green headway.
Detailed analysis of headways has found that it will not be necessary from a headway perspective. There was also a question as to whether the merging of the Main and Relief tracks at Branxton will create undesirable delay. However, the approach developed as part of the concept assessment provides for trains to alternate between the Up Main and Up Relief to achieve 8 minute headways on Minimbah bank. Trains should therefore remerge at Branxton in a regular pattern provided all coal trains operate at a consistent speed.
Farley—Maitland and Maitland Junction
The primary issues at Maitland are related to the maintenance of the old slow-speed turnouts and
accordingly the primary focus in the past has been the most effective way to replace these turnouts with low-maintenance high-speed units. Leveraging this renewal to increase capacity by improving train speeds and reducing crossing conflicts has been a secondary consideration, but the 2012 Strategy noted that under the prospective volumes it may be desirable to review the junction arrangement. The primary objective of a reconfiguration would be to ensure that conflicts between Up coal services and Down non-coal services, which conflict to the west of Maitland, can be efficiently managed.
A concept assessment of the Farley—Maitland section has been undertaken and has identified that the most effective option would provide for a bi-directional third track between Farley and Maitland, which would allow both Up and Down non-coal trains to stand waiting for a path without blocking the flow of coal trains. Analysis to date has found that the path benefits of the reconfiguration are relatively modest and that the main benefit would be experienced in live-run. However, at this stage there has been no quantification of this benefit. Given the changes in demand this project is now considered a longer–term initiative.
Figure 13 - Muswellbrook—Terminal Projects
Project Name Contracted Volumes Prospective Volumes
Muswellbrook Junction - Q1 2020
Muswellbrook - Drayton Resignalling - Q1 2020
Minimbah bank resignalling - Q1 2020
Drayton - Whittingham Bi-Di - Q1 2019
Drayton—Whittingham resignalling - Q1 2020
Table 6 - Muswellbrook—Maitland Projects, timing under different volume scenarios
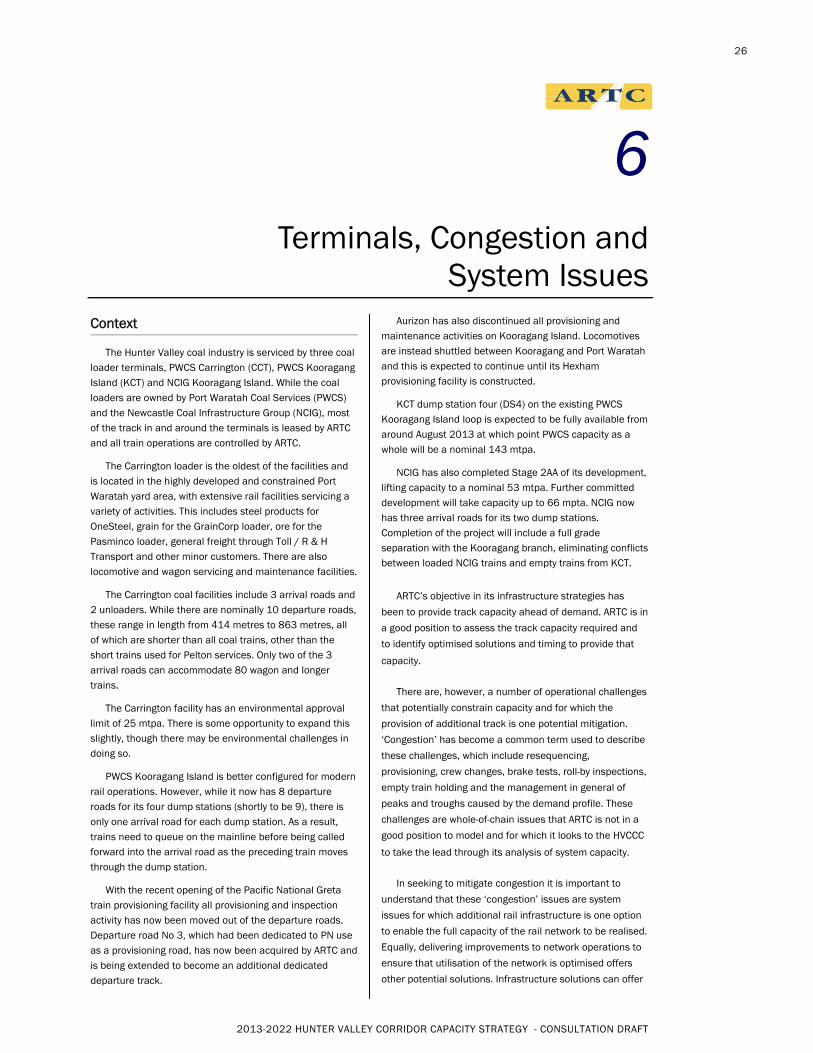
2013-2022 HUNTER VALLEY CORRIDOR CAPACITY STRATEGY - CONSULTATION DRAFT
26
Context
The Hunter Valley coal industry is serviced by three coal loader terminals, PWCS Carrington (CCT), PWCS Kooragang Island (KCT) and NCIG Kooragang Island. While the coal loaders are owned by Port Waratah Coal Services (PWCS) and the Newcastle Coal Infrastructure Group (NCIG), most of the track in and around the terminals is leased by ARTC and all train operations are controlled by ARTC.
The Carrington loader is the oldest of the facilities and is located in the highly developed and constrained Port Waratah yard area, with extensive rail facilities servicing a variety of activities. This includes steel products for OneSteel, grain for the GrainCorp loader, ore for the Pasminco loader, general freight through Toll / R & H Transport and other minor customers. There are also locomotive and wagon servicing and maintenance facilities.
The Carrington coal facilities include 3 arrival roads and 2 unloaders. While there are nominally 10 departure roads, these range in length from 414 metres to 863 metres, all of which are shorter than all coal trains, other than the short trains used for Pelton services. Only two of the 3 arrival roads can accommodate 80 wagon and longer trains.
The Carrington facility has an environmental approval limit of 25 mtpa. There is some opportunity to expand this slightly, though there may be environmental challenges in doing so.
PWCS Kooragang Island is better configured for modern rail operations. However, while it now has 8 departure roads for its four dump stations (shortly to be 9), there is only one arrival road for each dump station. As a result, trains need to queue on the mainline before being called forward into the arrival road as the preceding train moves through the dump station.
With the recent opening of the Pacific National Greta train provisioning facility all provisioning and inspection activity has now been moved out of the departure roads. Departure road No 3, which had been dedicated to PN use as a provisioning road, has now been acquired by ARTC and is being extended to become an additional dedicated departure track.
Aurizon has also discontinued all provisioning and maintenance activities on Kooragang Island. Locomotives are instead shuttled between Kooragang and Port Waratah and this is expected to continue until its Hexham provisioning facility is constructed.
KCT dump station four (DS4) on the existing PWCS Kooragang Island loop is expected to be fully available from around August 2013 at which point PWCS capacity as a whole will be a nominal 143 mtpa.
NCIG has also completed Stage 2AA of its development, lifting capacity to a nominal 53 mtpa. Further committed development will take capacity up to 66 mpta. NCIG now has three arrival roads for its two dump stations. Completion of the project will include a full grade separation with the Kooragang branch, eliminating conflicts between loaded NCIG trains and empty trains from KCT.
ARTC’s objective in its infrastructure strategies has
been to provide track capacity ahead of demand. ARTC is in
a good position to assess the track capacity required and
to identify optimised solutions and timing to provide that
capacity.
There are, however, a number of operational challenges
that potentially constrain capacity and for which the
provision of additional track is one potential mitigation.
‘Congestion’ has become a common term used to describe
these challenges, which include resequencing,
provisioning, crew changes, brake tests, roll-by inspections,
empty train holding and the management in general of
peaks and troughs caused by the demand profile. These
challenges are whole-of-chain issues that ARTC is not in a
good position to model and for which it looks to the HVCCC
to take the lead through its analysis of system capacity.
In seeking to mitigate congestion it is important to
understand that these ‘congestion’ issues are system
issues for which additional rail infrastructure is one option
to enable the full capacity of the rail network to be realised.
Equally, delivering improvements to network operations to
ensure that utilisation of the network is optimised offers
other potential solutions. Infrastructure solutions can offer
6 Terminals, Congestion and
System Issues
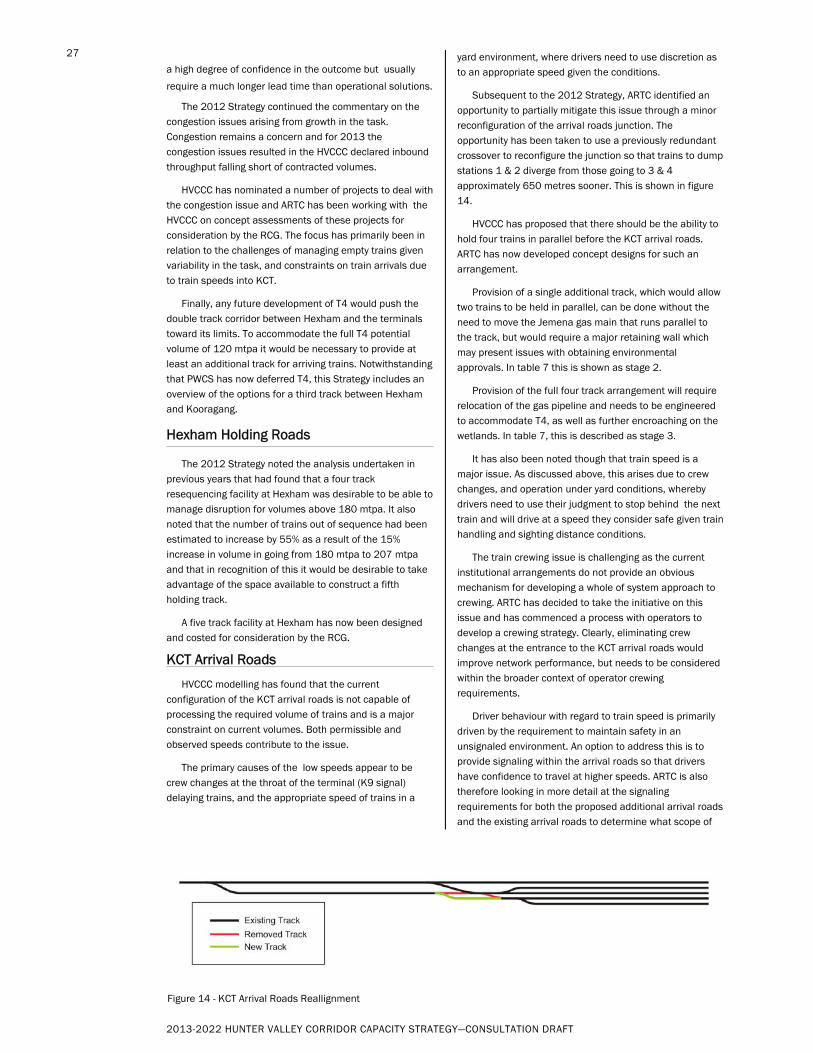
2013-2022 HUNTER VALLEY CORRIDOR CAPACITY STRATEGY—CONSULTATION DRAFT
27
a high degree of confidence in the outcome but usually
require a much longer lead time than operational solutions.
The 2012 Strategy continued the commentary on the congestion issues arising from growth in the task. Congestion remains a concern and for 2013 the congestion issues resulted in the HVCCC declared inbound throughput falling short of contracted volumes.
HVCCC has nominated a number of projects to deal with the congestion issue and ARTC has been working with the HVCCC on concept assessments of these projects for consideration by the RCG. The focus has primarily been in relation to the challenges of managing empty trains given variability in the task, and constraints on train arrivals due to train speeds into KCT.
Finally, any future development of T4 would push the double track corridor between Hexham and the terminals toward its limits. To accommodate the full T4 potential volume of 120 mtpa it would be necessary to provide at least an additional track for arriving trains. Notwithstanding that PWCS has now deferred T4, this Strategy includes an overview of the options for a third track between Hexham and Kooragang.
Hexham Holding Roads
The 2012 Strategy noted the analysis undertaken in previous years that had found that a four track resequencing facility at Hexham was desirable to be able to manage disruption for volumes above 180 mtpa. It also noted that the number of trains out of sequence had been estimated to increase by 55% as a result of the 15% increase in volume in going from 180 mtpa to 207 mtpa and that in recognition of this it would be desirable to take advantage of the space available to construct a fifth holding track.
A five track facility at Hexham has now been designed and costed for consideration by the RCG.
KCT Arrival Roads
HVCCC modelling has found that the current configuration of the KCT arrival roads is not capable of processing the required volume of trains and is a major constraint on current volumes. Both permissible and observed speeds contribute to the issue.
The primary causes of the low speeds appear to be crew changes at the throat of the terminal (K9 signal) delaying trains, and the appropriate speed of trains in a
yard environment, where drivers need to use discretion as to an appropriate speed given the conditions.
Subsequent to the 2012 Strategy, ARTC identified an opportunity to partially mitigate this issue through a minor reconfiguration of the arrival roads junction. The opportunity has been taken to use a previously redundant crossover to reconfigure the junction so that trains to dump stations 1 & 2 diverge from those going to 3 & 4 approximately 650 metres sooner. This is shown in figure 14.
HVCCC has proposed that there should be the ability to hold four trains in parallel before the KCT arrival roads. ARTC has now developed concept designs for such an arrangement.
Provision of a single additional track, which would allow two trains to be held in parallel, can be done without the need to move the Jemena gas main that runs parallel to the track, but would require a major retaining wall which may present issues with obtaining environmental approvals. In table 7 this is shown as stage 2.
Provision of the full four track arrangement will require relocation of the gas pipeline and needs to be engineered to accommodate T4, as well as further encroaching on the wetlands. In table 7, this is described as stage 3.
It has also been noted though that train speed is a major issue. As discussed above, this arises due to crew changes, and operation under yard conditions, whereby drivers need to use their judgment to stop behind the next train and will drive at a speed they consider safe given train handling and sighting distance conditions.
The train crewing issue is challenging as the current institutional arrangements do not provide an obvious mechanism for developing a whole of system approach to crewing. ARTC has decided to take the initiative on this issue and has commenced a process with operators to develop a crewing strategy. Clearly, eliminating crew changes at the entrance to the KCT arrival roads would improve network performance, but needs to be considered within the broader context of operator crewing requirements.
Driver behaviour with regard to train speed is primarily driven by the requirement to maintain safety in an unsignaled environment. An option to address this is to provide signaling within the arrival roads so that drivers have confidence to travel at higher speeds. ARTC is also therefore looking in more detail at the signaling requirements for both the proposed additional arrival roads and the existing arrival roads to determine what scope of
Figure 14 - KCT Arrival Roads Reallignment
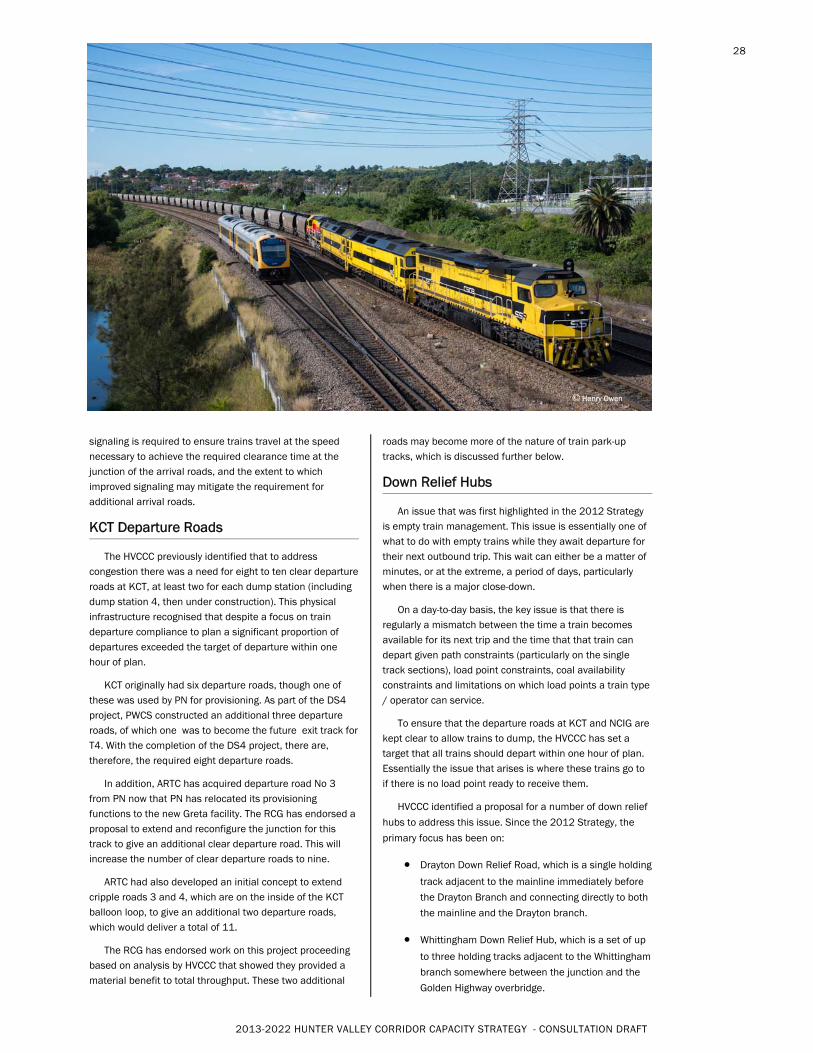
2013-2022 HUNTER VALLEY CORRIDOR CAPACITY STRATEGY - CONSULTATION DRAFT
28
signaling is required to ensure trains travel at the speed necessary to achieve the required clearance time at the junction of the arrival roads, and the extent to which improved signaling may mitigate the requirement for additional arrival roads.
KCT Departure Roads
The HVCCC previously identified that to address congestion there was a need for eight to ten clear departure roads at KCT, at least two for each dump station (including dump station 4, then under construction). This physical infrastructure recognised that despite a focus on train departure compliance to plan a significant proportion of departures exceeded the target of departure within one hour of plan.
KCT originally had six departure roads, though one of these was used by PN for provisioning. As part of the DS4 project, PWCS constructed an additional three departure roads, of which one was to become the future exit track for T4. With the completion of the DS4 project, there are, therefore, the required eight departure roads.
In addition, ARTC has acquired departure road No 3 from PN now that PN has relocated its provisioning functions to the new Greta facility. The RCG has endorsed a proposal to extend and reconfigure the junction for this track to give an additional clear departure road. This will increase the number of clear departure roads to nine.
ARTC had also developed an initial concept to extend cripple roads 3 and 4, which are on the inside of the KCT balloon loop, to give an additional two departure roads, which would deliver a total of 11.
The RCG has endorsed work on this project proceeding based on analysis by HVCCC that showed they provided a material benefit to total throughput. These two additional
roads may become more of the nature of train park-up tracks, which is discussed further below.
Down Relief Hubs
An issue that was first highlighted in the 2012 Strategy is empty train management. This issue is essentially one of what to do with empty trains while they await departure for their next outbound trip. This wait can either be a matter of minutes, or at the extreme, a period of days, particularly when there is a major close-down.
On a day-to-day basis, the key issue is that there is regularly a mismatch between the time a train becomes available for its next trip and the time that that train can depart given path constraints (particularly on the single track sections), load point constraints, coal availability constraints and limitations on which load points a train type / operator can service.
To ensure that the departure roads at KCT and NCIG are kept clear to allow trains to dump, the HVCCC has set a target that all trains should depart within one hour of plan. Essentially the issue that arises is where these trains go to if there is no load point ready to receive them.
HVCCC identified a proposal for a number of down relief
hubs to address this issue. Since the 2012 Strategy, the
primary focus has been on:
Drayton Down Relief Road, which is a single holding
track adjacent to the mainline immediately before
the Drayton Branch and connecting directly to both
the mainline and the Drayton branch.
Whittingham Down Relief Hub, which is a set of up
to three holding tracks adjacent to the Whittingham
branch somewhere between the junction and the
Golden Highway overbridge.
© Henry Owen
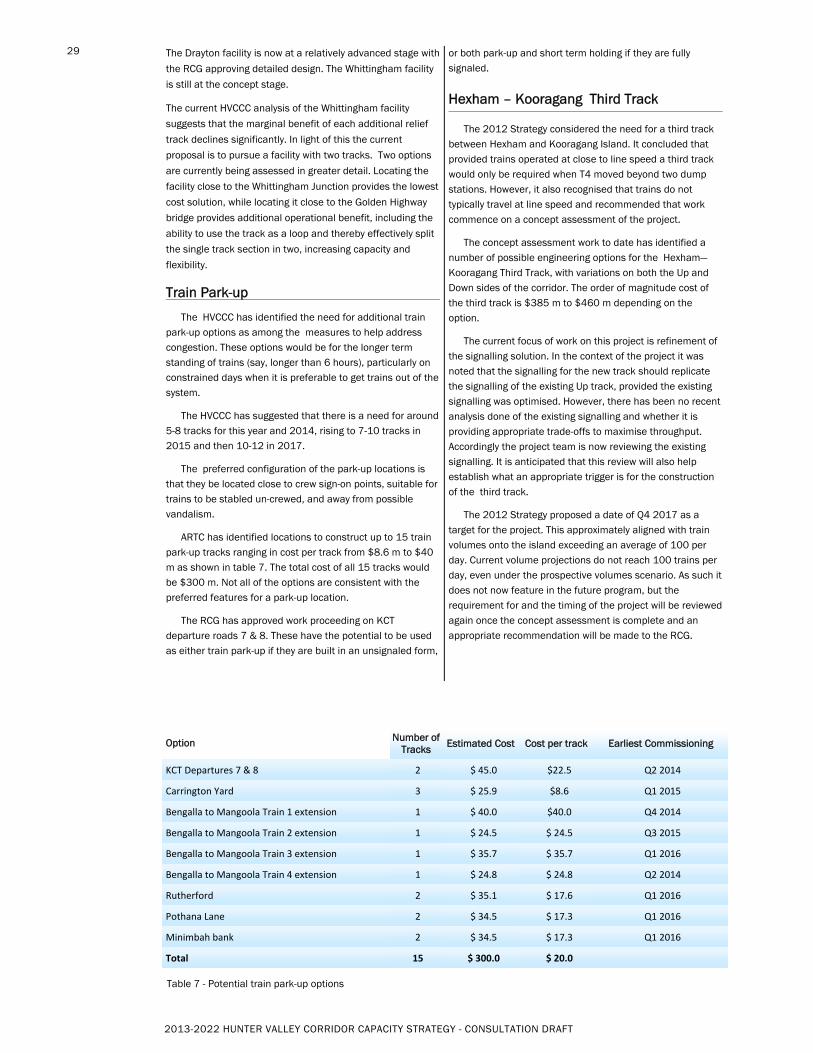
2013-2022 HUNTER VALLEY CORRIDOR CAPACITY STRATEGY - CONSULTATION DRAFT
29
The Drayton facility is now at a relatively advanced stage with
the RCG approving detailed design. The Whittingham facility
is still at the concept stage.
The current HVCCC analysis of the Whittingham facility
suggests that the marginal benefit of each additional relief
track declines significantly. In light of this the current
proposal is to pursue a facility with two tracks. Two options
are currently being assessed in greater detail. Locating the
facility close to the Whittingham Junction provides the lowest
cost solution, while locating it close to the Golden Highway
bridge provides additional operational benefit, including the
ability to use the track as a loop and thereby effectively split
the single track section in two, increasing capacity and
flexibility.
Train Park-up
The HVCCC has identified the need for additional train park-up options as among the measures to help address congestion. These options would be for the longer term standing of trains (say, longer than 6 hours), particularly on constrained days when it is preferable to get trains out of the system.
The HVCCC has suggested that there is a need for around 5-8 tracks for this year and 2014, rising to 7-10 tracks in 2015 and then 10-12 in 2017.
The preferred configuration of the park-up locations is that they be located close to crew sign-on points, suitable for trains to be stabled un-crewed, and away from possible vandalism.
ARTC has identified locations to construct up to 15 train park-up tracks ranging in cost per track from $8.6 m to $40 m as shown in table 7. The total cost of all 15 tracks would be $300 m. Not all of the options are consistent with the preferred features for a park-up location.
The RCG has approved work proceeding on KCT departure roads 7 & 8. These have the potential to be used as either train park-up if they are built in an unsignaled form,
or both park-up and short term holding if they are fully signaled.
Hexham – Kooragang Third Track
The 2012 Strategy considered the need for a third track between Hexham and Kooragang Island. It concluded that provided trains operated at close to line speed a third track would only be required when T4 moved beyond two dump stations. However, it also recognised that trains do not typically travel at line speed and recommended that work commence on a concept assessment of the project.
The concept assessment work to date has identified a number of possible engineering options for the Hexham—Kooragang Third Track, with variations on both the Up and Down sides of the corridor. The order of magnitude cost of the third track is $385 m to $460 m depending on the option.
The current focus of work on this project is refinement of the signalling solution. In the context of the project it was noted that the signalling for the new track should replicate the signalling of the existing Up track, provided the existing signalling was optimised. However, there has been no recent analysis done of the existing signalling and whether it is providing appropriate trade-offs to maximise throughput. Accordingly the project team is now reviewing the existing signalling. It is anticipated that this review will also help establish what an appropriate trigger is for the construction of the third track.
The 2012 Strategy proposed a date of Q4 2017 as a target for the project. This approximately aligned with train volumes onto the island exceeding an average of 100 per day. Current volume projections do not reach 100 trains per day, even under the prospective volumes scenario. As such it does not now feature in the future program, but the requirement for and the timing of the project will be reviewed again once the concept assessment is complete and an appropriate recommendation will be made to the RCG.
Option Number of Tracks
Estimated Cost Cost per track Earliest Commissioning
KCT Departures 7 & 8 2 $ 45.0 $22.5 Q2 2014
Carrington Yard 3 $ 25.9 $8.6 Q1 2015
Bengalla to Mangoola Train 1 extension 1 $ 40.0 $40.0 Q4 2014
Bengalla to Mangoola Train 2 extension 1 $ 24.5 $ 24.5 Q3 2015
Bengalla to Mangoola Train 3 extension 1 $ 35.7 $ 35.7 Q1 2016
Bengalla to Mangoola Train 4 extension 1 $ 24.8 $ 24.8 Q2 2014
Rutherford 2 $ 35.1 $ 17.6 Q1 2016
Pothana Lane 2 $ 34.5 $ 17.3 Q1 2016
Minimbah bank 2 $ 34.5 $ 17.3 Q1 2016
Total 15 $ 300.0 $ 20.0
Table 7 - Potential train park-up options
2013-2022 HUNTER VALLEY CORRIDOR CAPACITY STRATEGY - CONSULTATION DRAFT
30
© Michelle Delaney
A summary of the recommended projects for contracted volumes comparing previous and new proposed delivery timeframes, together with estimated costs at a p754 level, is shown in Table 8.
Proposed delivery dates have been developed based on the ‘required by’ timing, recognising the need to manage resource levels, particularly for project commissioning.
Table 9 shows the same detail as Table 8, for the scope of work required for prospective volumes. In Table 9, costs are shown as both unescalated and escalated based on the ‘proposed by’ delivery dates.
Projects required for both contracted and prospective volumes are shown in both tables as the timing can vary, though congestion projects only appear in table 8.
ATMS
As noted in Chapter 1, ATMS has the potential to replace a number of signalling projects as well as defer and / or save on the costs of other projects. Of the projects required for prospective volumes it could replace:
Minimbah bank resignalling
Drayton—Whittingham bi-di
Drayton—Whittingham resignalling, and
Muswellbrook—Drayton resignalling
Overview of the recommended projects
7
4 A P75 value indicates that the project has been assessed as having a 75% probability of being delivered for the identified cost, or less.
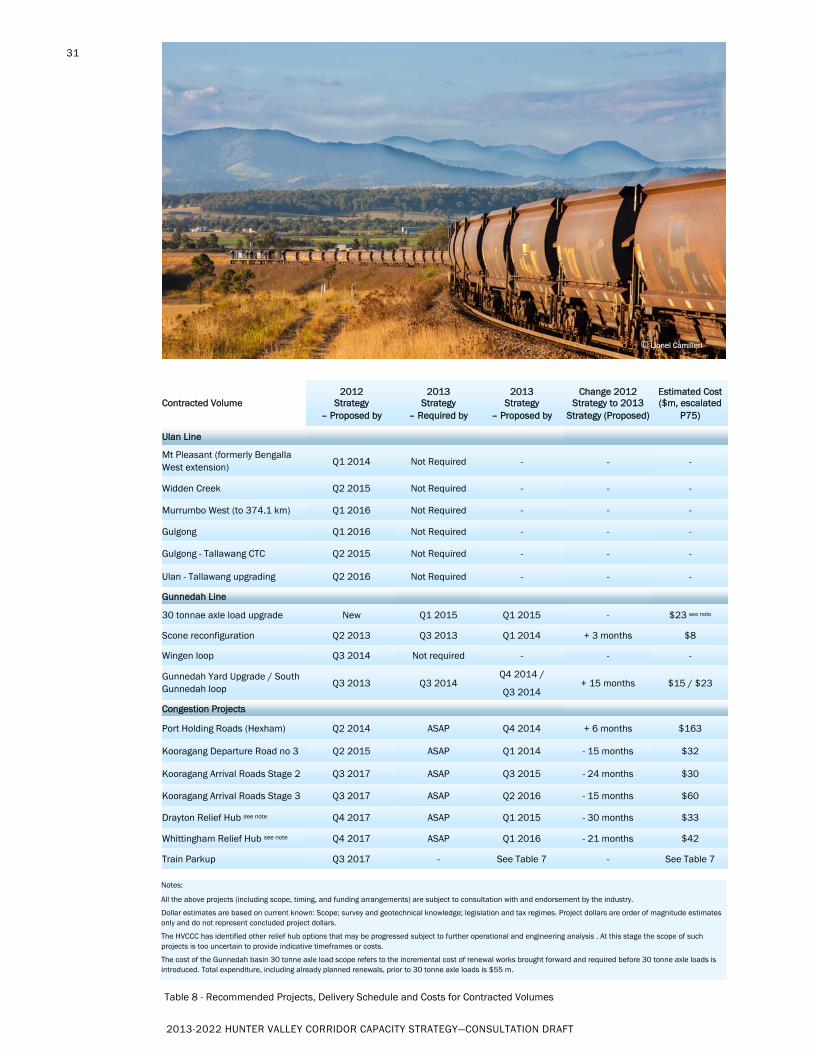
2013-2022 HUNTER VALLEY CORRIDOR CAPACITY STRATEGY—CONSULTATION DRAFT
31
Table 8 - Recommended Projects, Delivery Schedule and Costs for Contracted Volumes
Contracted Volume 2012
Strategy – Proposed by
2013 Strategy
– Required by
2013 Strategy
– Proposed by
Change 2012 Strategy to 2013
Strategy (Proposed)
Estimated Cost ($m, escalated
P75)
Ulan Line
Mt Pleasant (formerly Bengalla West extension) Q1 2014 Not Required - - -
Widden Creek Q2 2015 Not Required - - -
Murrumbo West (to 374.1 km) Q1 2016 Not Required - - -
Gulgong Q1 2016 Not Required - - -
Gulgong - Tallawang CTC Q2 2015 Not Required - - -
Ulan - Tallawang upgrading Q2 2016 Not Required - - -
Gunnedah Line
Scone reconfiguration Q2 2013 Q3 2013 Q1 2014 + 3 months $8
Wingen loop Q3 2014 Not required - - -
Gunnedah Yard Upgrade / South Gunnedah loop Q3 2013 Q3 2014
Q4 2014 /
Q3 2014 + 15 months $15 / $23
Congestion Projects
Port Holding Roads (Hexham) Q2 2014 ASAP Q4 2014 + 6 months $163
Kooragang Departure Road no 3 Q2 2015 ASAP Q1 2014 - 15 months $32
Kooragang Arrival Roads Stage 2 Q3 2017 ASAP Q3 2015 - 24 months $30
Kooragang Arrival Roads Stage 3 Q3 2017 ASAP Q2 2016 - 15 months $60
Drayton Relief Hub see note Q4 2017 ASAP Q1 2015 - 30 months $33
Whittingham Relief Hub see note Q4 2017 ASAP Q1 2016 - 21 months $42
Train Parkup Q3 2017 - See Table 7 - See Table 7
30 tonnae axle load upgrade New Q1 2015 Q1 2015 - $23 see note
Notes:
All the above projects (including scope, timing, and funding arrangements) are subject to consultation with and endorsement by the industry.
Dollar estimates are based on current known: Scope; survey and geotechnical knowledge; legislation and tax regimes. Project dollars are order of magnitude estimates only and do not represent concluded project dollars.
The HVCCC has identified other relief hub options that may be progressed subject to further operational and engineering analysis . At this stage the scope of such projects is too uncertain to provide indicative timeframes or costs.
The cost of the Gunnedah basin 30 tonne axle load scope refers to the incremental cost of renewal works brought forward and required before 30 tonne axle loads is introduced. Total expenditure, including already planned renewals, prior to 30 tonne axle loads is $55 m.
© Lionel Camilleri
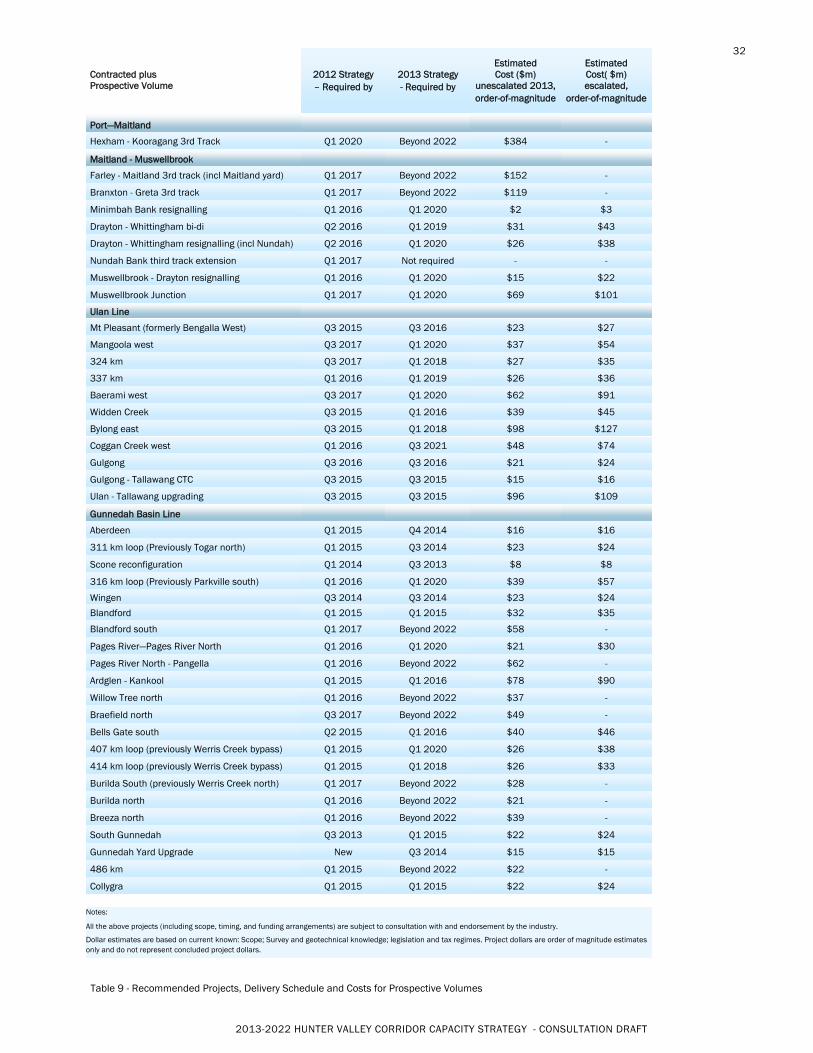
2013-2022 HUNTER VALLEY CORRIDOR CAPACITY STRATEGY - CONSULTATION DRAFT
32
Table 9 - Recommended Projects, Delivery Schedule and Costs for Prospective Volumes
Contracted plus Prospective Volume
2012 Strategy – Required by
2013 Strategy - Required by
Estimated Cost ($m)
unescalated 2013, order-of-magnitude
Estimated Cost( $m) escalated,
order-of-magnitude
Port—Maitland
Hexham - Kooragang 3rd Track Q1 2020 Beyond 2022 $384 -
Maitland - Muswellbrook
Farley - Maitland 3rd track (incl Maitland yard) Q1 2017 Beyond 2022 $152 -
Branxton - Greta 3rd track Q1 2017 Beyond 2022 $119 -
Minimbah Bank resignalling Q1 2016 Q1 2020 $2 $3
Drayton - Whittingham bi-di Q2 2016 Q1 2019 $31 $43
Drayton - Whittingham resignalling (incl Nundah) Q2 2016 Q1 2020 $26 $38
Nundah Bank third track extension Q1 2017 Not required - -
Muswellbrook - Drayton resignalling Q1 2016 Q1 2020 $15 $22
Muswellbrook Junction Q1 2017 Q1 2020 $69 $101
Ulan Line
Mt Pleasant (formerly Bengalla West) Q3 2015 Q3 2016 $23 $27
Mangoola west Q3 2017 Q1 2020 $37 $54
324 km Q3 2017 Q1 2018 $27 $35
337 km Q1 2016 Q1 2019 $26 $36
Baerami west Q3 2017 Q1 2020 $62 $91
Widden Creek Q3 2015 Q1 2016 $39 $45
Bylong east Q3 2015 Q1 2018 $98 $127
Coggan Creek west Q1 2016 Q3 2021 $48 $74
Gulgong Q3 2016 Q3 2016 $21 $24
Gulgong - Tallawang CTC Q3 2015 Q3 2015 $15 $16
Ulan - Tallawang upgrading Q3 2015 Q3 2015 $96 $109
Gunnedah Basin Line
Aberdeen Q1 2015 Q4 2014 $16 $16
311 km loop (Previously Togar north) Q1 2015 Q3 2014 $23 $24
Scone reconfiguration Q1 2014 Q3 2013 $8 $8
316 km loop (Previously Parkville south) Q1 2016 Q1 2020 $39 $57
Wingen Q3 2014 Q3 2014 $23 $24
Blandford Q1 2015 Q1 2015 $32 $35
Blandford south Q1 2017 Beyond 2022 $58 -
Pages River—Pages River North Q1 2016 Q1 2020 $21 $30
Pages River North - Pangella Q1 2016 Beyond 2022 $62 -
Ardglen - Kankool Q1 2015 Q1 2016 $78 $90
Willow Tree north Q1 2016 Beyond 2022 $37 -
Braefield north Q3 2017 Beyond 2022 $49 -
Bells Gate south Q2 2015 Q1 2016 $40 $46
407 km loop (previously Werris Creek bypass) Q1 2015 Q1 2020 $26 $38
414 km loop (previously Werris Creek bypass) Q1 2015 Q1 2018 $26 $33
Burilda South (previously Werris Creek north) Q1 2017 Beyond 2022 $28 -
Burilda north Q1 2016 Beyond 2022 $21 -
Breeza north Q1 2016 Beyond 2022 $39 -
South Gunnedah Q3 2013 Q1 2015 $22 $24
Gunnedah Yard Upgrade New Q3 2014 $15 $15
486 km Q1 2015 Beyond 2022 $22 -
Collygra Q1 2015 Q1 2015 $22 $24
Notes:
All the above projects (including scope, timing, and funding arrangements) are subject to consultation with and endorsement by the industry.
Dollar estimates are based on current known: Scope; Survey and geotechnical knowledge; legislation and tax regimes. Project dollars are order of magnitude estimates only and do not represent concluded project dollars.
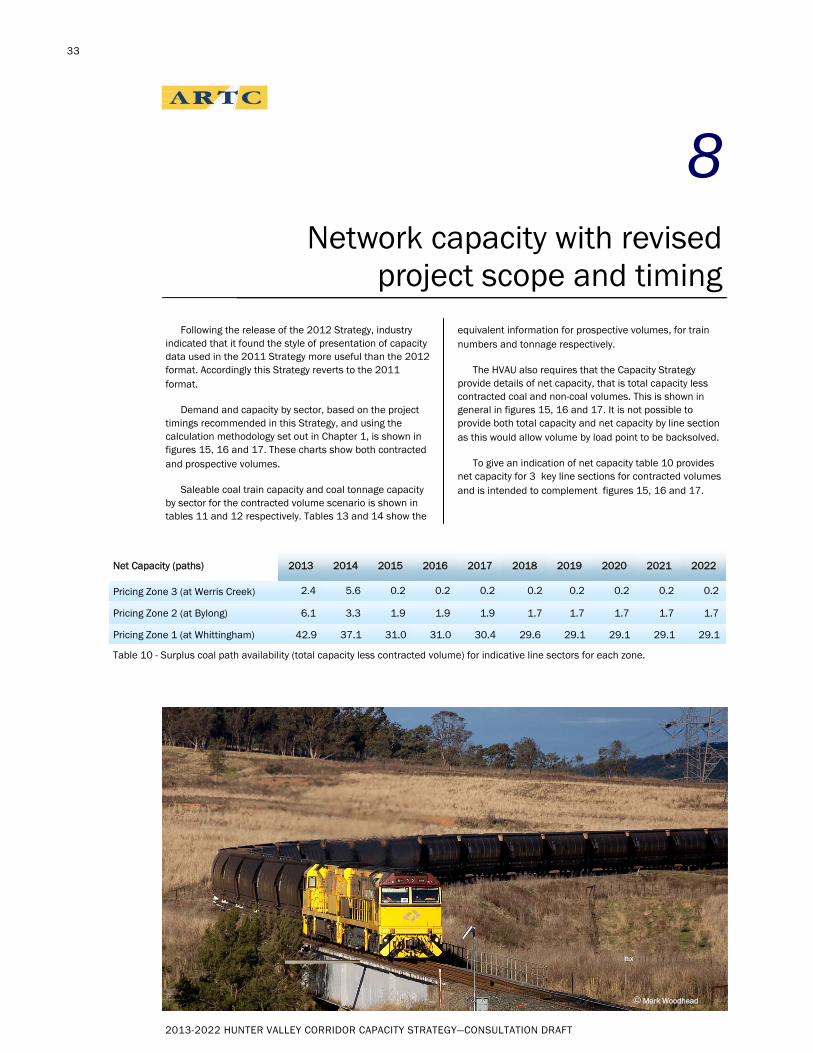
2013-2022 HUNTER VALLEY CORRIDOR CAPACITY STRATEGY—CONSULTATION DRAFT
33
Following the release of the 2012 Strategy, industry indicated that it found the style of presentation of capacity data used in the 2011 Strategy more useful than the 2012 format. Accordingly this Strategy reverts to the 2011 format.
Demand and capacity by sector, based on the project timings recommended in this Strategy, and using the calculation methodology set out in Chapter 1, is shown in figures 15, 16 and 17. These charts show both contracted and prospective volumes.
Saleable coal train capacity and coal tonnage capacity by sector for the contracted volume scenario is shown in tables 11 and 12 respectively. Tables 13 and 14 show the
equivalent information for prospective volumes, for train numbers and tonnage respectively.
The HVAU also requires that the Capacity Strategy provide details of net capacity, that is total capacity less contracted coal and non-coal volumes. This is shown in general in figures 15, 16 and 17. It is not possible to provide both total capacity and net capacity by line section as this would allow volume by load point to be backsolved.
To give an indication of net capacity table 10 provides net capacity for 3 key line sections for contracted volumes and is intended to complement figures 15, 16 and 17.
8 Network capacity with revised
project scope and timing
Net Capacity (paths) 2013 2014 2015 2016 2017 2018 2019 2020 2021 2022
Pricing Zone 3 (at Werris Creek) 2.4 5.6 0.2 0.2 0.2 0.2 0.2 0.2 0.2 0.2
Pricing Zone 2 (at Bylong) 6.1 3.3 1.9 1.9 1.9 1.7 1.7 1.7 1.7 1.7
Pricing Zone 1 (at Whittingham) 42.9 37.1 31.0 31.0 30.4 29.6 29.1 29.1 29.1 29.1
Table 10 - Surplus coal path availability (total capacity less contracted volume) for indicative line sectors for each zone.
© Mark Woodhead
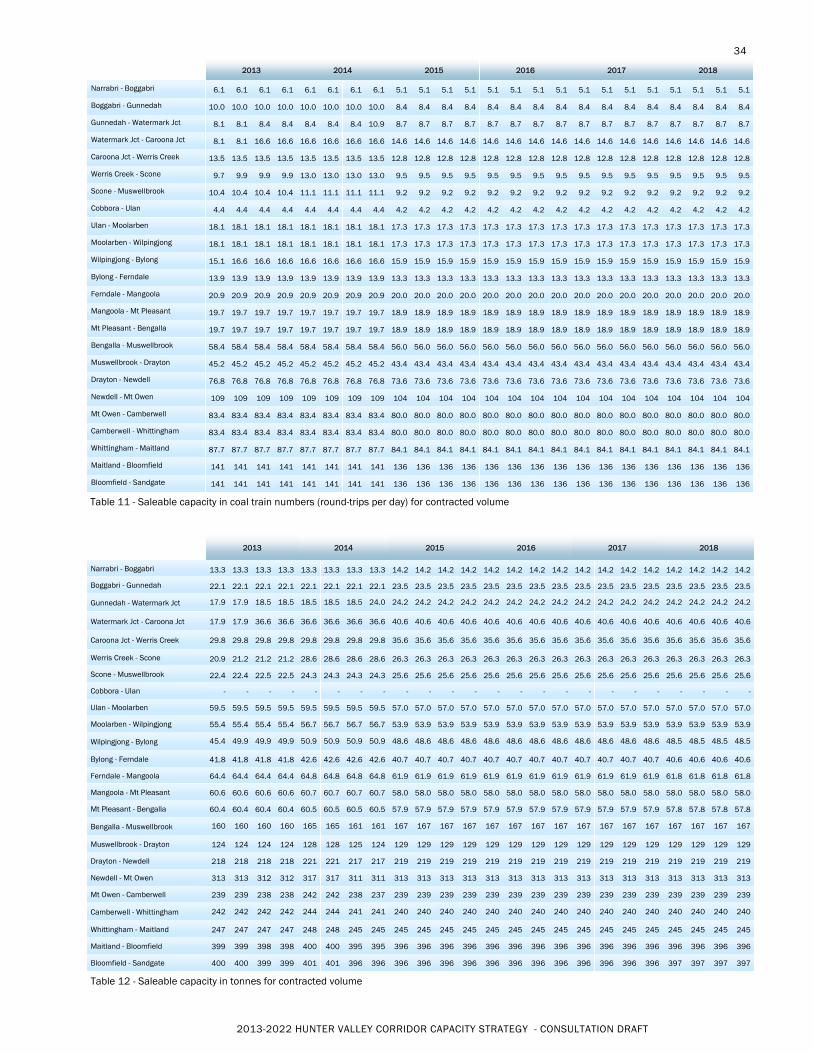
2013-2022 HUNTER VALLEY CORRIDOR CAPACITY STRATEGY - CONSULTATION DRAFT
34
Table 11 - Saleable capacity in coal train numbers (round-trips per day) for contracted volume
2013 2014 2015 2016 2017 2018
Narrabri - Boggabri
13.3
13.3
13.3
13.3
13.3
13.3
13.3
13.3
14.2
14.2
14.2
14.2
14.2
14.2
14.2
14.2
14.2
14.2
14.2
14.2
14.2
14.2
14.2
14.2
Boggabri - Gunnedah
22.1
22.1
22.1
22.1
22.1
22.1
22.1
22.1
23.5
23.5
23.5
23.5
23.5
23.5
23.5
23.5
23.5
23.5
23.5
23.5
23.5
23.5
23.5
23.5
Gunnedah - Watermark Jct
17.9
17.9
18.5
18.5
18.5
18.5
18.5
24.0
24.2
24.2
24.2
24.2
24.2
24.2
24.2
24.2
24.2
24.2
24.2
24.2
24.2
24.2
24.2
24.2
Watermark Jct - Caroona Jct
17.9
17.9
36.6
36.6
36.6
36.6
36.6
36.6
40.6
40.6
40.6
40.6
40.6
40.6
40.6
40.6
40.6
40.6
40.6
40.6
40.6
40.6
40.6
40.6
Caroona Jct - Werris Creek
29.8
29.8
29.8
29.8
29.8
29.8
29.8
29.8
35.6
35.6
35.6
35.6
35.6
35.6
35.6
35.6
35.6
35.6
35.6
35.6
35.6
35.6
35.6
35.6
Werris Creek - Scone
20.9
21.2
21.2
21.2
28.6
28.6
28.6
28.6
26.3
26.3
26.3
26.3
26.3
26.3
26.3
26.3
26.3
26.3
26.3
26.3
26.3
26.3
26.3
26.3
Scone - Muswellbrook
22.4
22.4
22.5
22.5
24.3
24.3
24.3
24.3
25.6
25.6
25.6
25.6
25.6
25.6
25.6
25.6
25.6
25.6
25.6
25.6
25.6
25.6
25.6
25.6
Cobbora - Ulan -
-
-
-
-
-
-
-
-
-
-
-
-
-
-
-
-
-
-
-
-
-
-
-
Ulan - Moolarben
59.5
59.5
59.5
59.5
59.5
59.5
59.5
59.5
57.0
57.0
57.0
57.0
57.0
57.0
57.0
57.0
57.0
57.0
57.0
57.0
57.0
57.0
57.0
57.0
Moolarben - Wilpingjong
55.4
55.4
55.4
55.4
56.7
56.7
56.7
56.7
53.9
53.9
53.9
53.9
53.9
53.9
53.9
53.9
53.9
53.9
53.9
53.9
53.9
53.9
53.9
53.9
Wilpingjong - Bylong
45.4
49.9
49.9
49.9
50.9
50.9
50.9
50.9
48.6
48.6
48.6
48.6
48.6
48.6
48.6
48.6
48.6
48.6
48.6
48.6
48.5
48.5
48.5
48.5
Bylong - Ferndale
41.8
41.8
41.8
41.8
42.6
42.6
42.6
42.6
40.7
40.7
40.7
40.7
40.7
40.7
40.7
40.7
40.7
40.7
40.7
40.7
40.6
40.6
40.6
40.6
Ferndale - Mangoola
64.4
64.4
64.4
64.4
64.8
64.8
64.8
64.8
61.9
61.9
61.9
61.9
61.9
61.9
61.9
61.9
61.9
61.9
61.9
61.9
61.8
61.8
61.8
61.8
Mangoola - Mt Pleasant
60.6
60.6
60.6
60.6
60.7
60.7
60.7
60.7
58.0
58.0
58.0
58.0
58.0
58.0
58.0
58.0
58.0
58.0
58.0
58.0
58.0
58.0
58.0
58.0
Mt Pleasant - Bengalla
60.4
60.4
60.4
60.4
60.5
60.5
60.5
60.5
57.9
57.9
57.9
57.9
57.9
57.9
57.9
57.9
57.9
57.9
57.9
57.9
57.8
57.8
57.8
57.8
Bengalla - Muswellbrook
160
160
160
160
165
165
161
161
167
167
167
167
167
167
167
167
167
167
167
167
167
167
167
167
Muswellbrook - Drayton
124
124
124
124
128
128
125
124
129
129
129
129
129
129
129
129
129
129
129
129
129
129
129
129
Drayton - Newdell
218
218
218
218
221
221
217
217
219
219
219
219
219
219
219
219
219
219
219
219
219
219
219
219
Newdell - Mt Owen
313
313
312
312
317
317
311
311
313
313
313
313
313
313
313
313
313
313
313
313
313
313
313
313
Mt Owen - Camberwell
239
239
238
238
242
242
238
237
239
239
239
239
239
239
239
239
239
239
239
239
239
239
239
239
Camberwell - Whittingham
242
242
242
242
244
244
241
241
240
240
240
240
240
240
240
240
240
240
240
240
240
240
240
240
Whittingham - Maitland
247
247
247
247
248
248
245
245
245
245
245
245
245
245
245
245
245
245
245
245
245
245
245
245
Maitland - Bloomfield
399
399
398
398
400
400
395
395
396
396
396
396
396
396
396
396
396
396
396
396
396
396
396
396
Bloomfield - Sandgate
400
400
399
399
401
401
396
396
396
396
396
396
396
396
396
396
396
396
396
396
397
397
397
397
Table 12 - Saleable capacity in tonnes for contracted volume
2013 2014 2015 2016 2017 2018
Narrabri - Boggabri 6.1 6.1 6.1 6.1 6.1 6.1 6.1 6.1 5.1 5.1 5.1 5.1 5.1 5.1 5.1 5.1 5.1 5.1 5.1 5.1 5.1 5.1 5.1 5.1
Boggabri - Gunnedah 10.0 10.0 10.0 10.0 10.0 10.0 10.0 10.0 8.4 8.4 8.4 8.4 8.4 8.4 8.4 8.4 8.4 8.4 8.4 8.4 8.4 8.4 8.4 8.4
Gunnedah - Watermark Jct 8.1 8.1 8.4 8.4 8.4 8.4 8.4 10.9 8.7 8.7 8.7 8.7 8.7 8.7 8.7 8.7 8.7 8.7 8.7 8.7 8.7 8.7 8.7 8.7
Watermark Jct - Caroona Jct 8.1 8.1 16.6 16.6 16.6 16.6 16.6 16.6 14.6 14.6 14.6 14.6 14.6 14.6 14.6 14.6 14.6 14.6 14.6 14.6 14.6 14.6 14.6 14.6
Caroona Jct - Werris Creek 13.5 13.5 13.5 13.5 13.5 13.5 13.5 13.5 12.8 12.8 12.8 12.8 12.8 12.8 12.8 12.8 12.8 12.8 12.8 12.8 12.8 12.8 12.8 12.8
Werris Creek - Scone 9.7 9.9 9.9 9.9 13.0 13.0 13.0 13.0 9.5 9.5 9.5 9.5 9.5 9.5 9.5 9.5 9.5 9.5 9.5 9.5 9.5 9.5 9.5 9.5
Scone - Muswellbrook 10.4 10.4 10.4 10.4 11.1 11.1 11.1 11.1 9.2 9.2 9.2 9.2 9.2 9.2 9.2 9.2 9.2 9.2 9.2 9.2 9.2 9.2 9.2 9.2
Cobbora - Ulan 4.4 4.4 4.4 4.4 4.4 4.4 4.4 4.4 4.2 4.2 4.2 4.2 4.2 4.2 4.2 4.2 4.2 4.2 4.2 4.2 4.2 4.2 4.2 4.2
Ulan - Moolarben 18.1 18.1 18.1 18.1 18.1 18.1 18.1 18.1 17.3 17.3 17.3 17.3 17.3 17.3 17.3 17.3 17.3 17.3 17.3 17.3 17.3 17.3 17.3 17.3
Moolarben - Wilpingjong 18.1 18.1 18.1 18.1 18.1 18.1 18.1 18.1 17.3 17.3 17.3 17.3 17.3 17.3 17.3 17.3 17.3 17.3 17.3 17.3 17.3 17.3 17.3 17.3
Wilpingjong - Bylong 15.1 16.6 16.6 16.6 16.6 16.6 16.6 16.6 15.9 15.9 15.9 15.9 15.9 15.9 15.9 15.9 15.9 15.9 15.9 15.9 15.9 15.9 15.9 15.9
Bylong - Ferndale 13.9 13.9 13.9 13.9 13.9 13.9 13.9 13.9 13.3 13.3 13.3 13.3 13.3 13.3 13.3 13.3 13.3 13.3 13.3 13.3 13.3 13.3 13.3 13.3
Ferndale - Mangoola 20.9 20.9 20.9 20.9 20.9 20.9 20.9 20.9 20.0 20.0 20.0 20.0 20.0 20.0 20.0 20.0 20.0 20.0 20.0 20.0 20.0 20.0 20.0 20.0
Mangoola - Mt Pleasant 19.7 19.7 19.7 19.7 19.7 19.7 19.7 19.7 18.9 18.9 18.9 18.9 18.9 18.9 18.9 18.9 18.9 18.9 18.9 18.9 18.9 18.9 18.9 18.9
Mt Pleasant - Bengalla 19.7 19.7 19.7 19.7 19.7 19.7 19.7 19.7 18.9 18.9 18.9 18.9 18.9 18.9 18.9 18.9 18.9 18.9 18.9 18.9 18.9 18.9 18.9 18.9
Bengalla - Muswellbrook 58.4 58.4 58.4 58.4 58.4 58.4 58.4 58.4 56.0 56.0 56.0 56.0 56.0 56.0 56.0 56.0 56.0 56.0 56.0 56.0 56.0 56.0 56.0 56.0
Muswellbrook - Drayton 45.2 45.2 45.2 45.2 45.2 45.2 45.2 45.2 43.4 43.4 43.4 43.4 43.4 43.4 43.4 43.4 43.4 43.4 43.4 43.4 43.4 43.4 43.4 43.4
Drayton - Newdell 76.8 76.8 76.8 76.8 76.8 76.8 76.8 76.8 73.6 73.6 73.6 73.6 73.6 73.6 73.6 73.6 73.6 73.6 73.6 73.6 73.6 73.6 73.6 73.6
Newdell - Mt Owen 109 109 109 109 109 109 109 109 104 104 104 104 104 104 104 104 104 104 104 104 104 104 104 104
Mt Owen - Camberwell 83.4 83.4 83.4 83.4 83.4 83.4 83.4 83.4 80.0 80.0 80.0 80.0 80.0 80.0 80.0 80.0 80.0 80.0 80.0 80.0 80.0 80.0 80.0 80.0
Camberwell - Whittingham 83.4 83.4 83.4 83.4 83.4 83.4 83.4 83.4 80.0 80.0 80.0 80.0 80.0 80.0 80.0 80.0 80.0 80.0 80.0 80.0 80.0 80.0 80.0 80.0
Whittingham - Maitland 87.7 87.7 87.7 87.7 87.7 87.7 87.7 87.7 84.1 84.1 84.1 84.1 84.1 84.1 84.1 84.1 84.1 84.1 84.1 84.1 84.1 84.1 84.1 84.1
Maitland - Bloomfield 141 141 141 141 141 141 141 141 136 136 136 136 136 136 136 136 136 136 136 136 136 136 136 136
Bloomfield - Sandgate 141 141 141 141 141 141 141 141 136 136 136 136 136 136 136 136 136 136 136 136 136 136 136 136
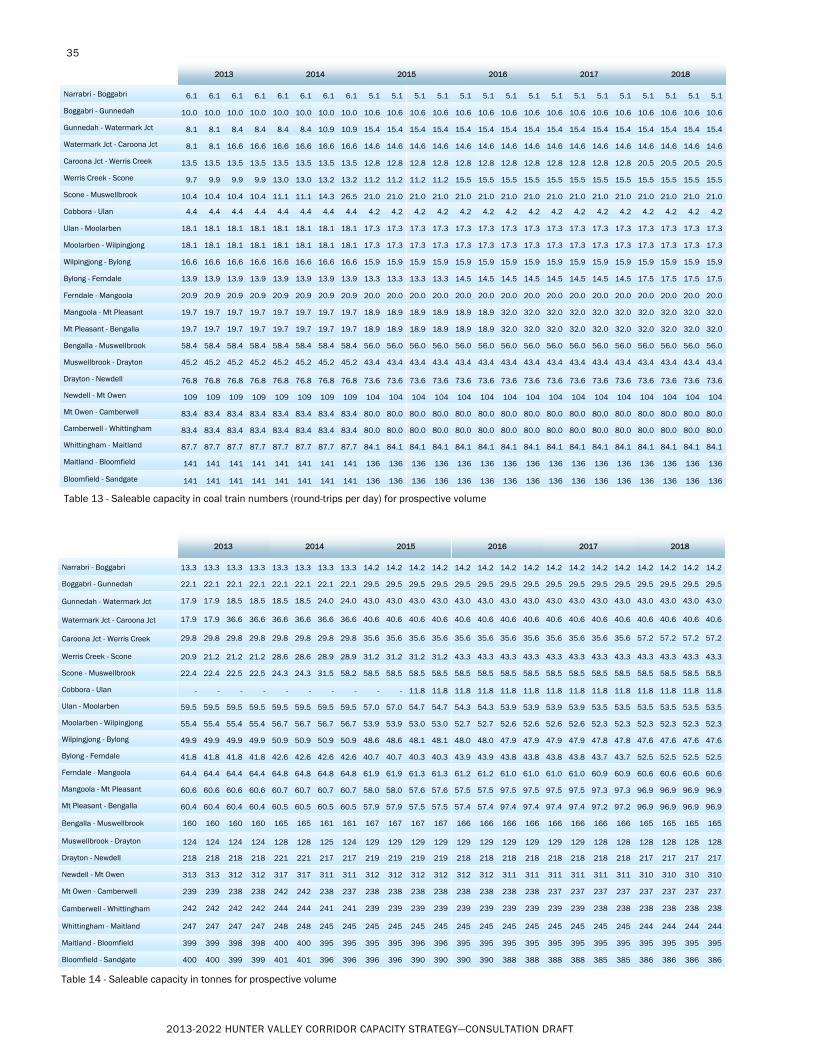
2013-2022 HUNTER VALLEY CORRIDOR CAPACITY STRATEGY—CONSULTATION DRAFT
35
2013 2014 2015 2016 2017 2018
Narrabri - Boggabri
6.1
6.1
6.1
6.1
6.1
6.1
6.1
6.1
5.1
5.1
5.1
5.1
5.1
5.1
5.1
5.1
5.1
5.1
5.1
5.1
5.1
5.1
5.1
5.1
Boggabri - Gunnedah
10.0
10.0
10.0
10.0
10.0
10.0
10.0
10.0
10.6
10.6
10.6
10.6
10.6
10.6
10.6
10.6
10.6
10.6
10.6
10.6
10.6
10.6
10.6
10.6
Gunnedah - Watermark Jct
8.1
8.1
8.4
8.4
8.4
8.4
10.9
10.9
15.4
15.4
15.4
15.4
15.4
15.4
15.4
15.4
15.4
15.4
15.4
15.4
15.4
15.4
15.4
15.4
Watermark Jct - Caroona Jct
8.1
8.1
16.6
16.6
16.6
16.6
16.6
16.6
14.6
14.6
14.6
14.6
14.6
14.6
14.6
14.6
14.6
14.6
14.6
14.6
14.6
14.6
14.6
14.6
Caroona Jct - Werris Creek
13.5
13.5
13.5
13.5
13.5
13.5
13.5
13.5
12.8
12.8
12.8
12.8
12.8
12.8
12.8
12.8
12.8
12.8
12.8
12.8
20.5
20.5
20.5
20.5
Werris Creek - Scone
9.7
9.9
9.9
9.9
13.0
13.0
13.2
13.2
11.2
11.2
11.2
11.2
15.5
15.5
15.5
15.5
15.5
15.5
15.5
15.5
15.5
15.5
15.5
15.5
Scone - Muswellbrook
10.4
10.4
10.4
10.4
11.1
11.1
14.3
26.5
21.0
21.0
21.0
21.0
21.0
21.0
21.0
21.0
21.0
21.0
21.0
21.0
21.0
21.0
21.0
21.0
Cobbora - Ulan 4.4 4.4 4.4 4.4 4.4 4.4 4.4 4.4 4.2 4.2 4.2 4.2 4.2 4.2 4.2 4.2 4.2 4.2 4.2 4.2 4.2 4.2 4.2 4.2
Ulan - Moolarben 18.1 18.1 18.1 18.1 18.1 18.1 18.1 18.1 17.3 17.3 17.3 17.3 17.3 17.3 17.3 17.3 17.3 17.3 17.3 17.3 17.3 17.3 17.3 17.3
Moolarben - Wilpingjong 18.1 18.1 18.1 18.1 18.1 18.1 18.1 18.1 17.3 17.3 17.3 17.3 17.3 17.3 17.3 17.3 17.3 17.3 17.3 17.3 17.3 17.3 17.3 17.3
Wilpingjong - Bylong 16.6 16.6 16.6 16.6 16.6 16.6 16.6 16.6 15.9 15.9 15.9 15.9 15.9 15.9 15.9 15.9 15.9 15.9 15.9 15.9 15.9 15.9 15.9 15.9
Bylong - Ferndale 13.9 13.9 13.9 13.9 13.9 13.9 13.9 13.9 13.3 13.3 13.3 13.3 14.5 14.5 14.5 14.5 14.5 14.5 14.5 14.5 17.5 17.5 17.5 17.5
Ferndale - Mangoola 20.9 20.9 20.9 20.9 20.9 20.9 20.9 20.9 20.0 20.0 20.0 20.0 20.0 20.0 20.0 20.0 20.0 20.0 20.0 20.0 20.0 20.0 20.0 20.0
Mangoola - Mt Pleasant 19.7 19.7 19.7 19.7 19.7 19.7 19.7 19.7 18.9 18.9 18.9 18.9 18.9 18.9 32.0 32.0 32.0 32.0 32.0 32.0 32.0 32.0 32.0 32.0
Mt Pleasant - Bengalla 19.7 19.7 19.7 19.7 19.7 19.7 19.7 19.7 18.9 18.9 18.9 18.9 18.9 18.9 32.0 32.0 32.0 32.0 32.0 32.0 32.0 32.0 32.0 32.0
Bengalla - Muswellbrook 58.4 58.4 58.4 58.4 58.4 58.4 58.4 58.4 56.0 56.0 56.0 56.0 56.0 56.0 56.0 56.0 56.0 56.0 56.0 56.0 56.0 56.0 56.0 56.0
Muswellbrook - Drayton 45.2 45.2 45.2 45.2 45.2 45.2 45.2 45.2 43.4 43.4 43.4 43.4 43.4 43.4 43.4 43.4 43.4 43.4 43.4 43.4 43.4 43.4 43.4 43.4
Drayton - Newdell
76.8
76.8
76.8
76.8
76.8
76.8
76.8
76.8
73.6
73.6
73.6
73.6
73.6
73.6
73.6
73.6
73.6
73.6
73.6
73.6
73.6
73.6
73.6
73.6
Newdell - Mt Owen
109
109
109
109
109
109
109
109
104
104
104
104
104
104
104
104
104
104
104
104
104
104
104
104
Mt Owen - Camberwell
83.4
83.4
83.4
83.4
83.4
83.4
83.4
83.4
80.0
80.0
80.0
80.0
80.0
80.0
80.0
80.0
80.0
80.0
80.0
80.0
80.0
80.0
80.0
80.0
Camberwell - Whittingham
83.4
83.4
83.4
83.4
83.4
83.4
83.4
83.4
80.0
80.0
80.0
80.0
80.0
80.0
80.0
80.0
80.0
80.0
80.0
80.0
80.0
80.0
80.0
80.0
Whittingham - Maitland
87.7
87.7
87.7
87.7
87.7
87.7
87.7
87.7
84.1
84.1
84.1
84.1
84.1
84.1
84.1
84.1
84.1
84.1
84.1
84.1
84.1
84.1
84.1
84.1
Maitland - Bloomfield
141
141
141
141
141
141
141
141
136
136
136
136
136
136
136
136
136
136
136
136
136
136
136
136
Bloomfield - Sandgate
141
141
141
141
141
141
141
141
136
136
136
136
136
136
136
136
136
136
136
136
136
136
136
136
2013 2014 2015 2016 2017 2018
Narrabri - Boggabri
13.3
13.3
13.3
13.3
13.3
13.3
13.3
13.3
14.2
14.2
14.2
14.2
14.2
14.2
14.2
14.2
14.2
14.2
14.2
14.2
14.2
14.2
14.2
14.2
Boggabri - Gunnedah
22.1
22.1
22.1
22.1
22.1
22.1
22.1
22.1
29.5
29.5
29.5
29.5
29.5
29.5
29.5
29.5
29.5
29.5
29.5
29.5
29.5
29.5
29.5
29.5
Gunnedah - Watermark Jct
17.9
17.9
18.5
18.5
18.5
18.5
24.0
24.0
43.0
43.0
43.0
43.0
43.0
43.0
43.0
43.0
43.0
43.0
43.0
43.0
43.0
43.0
43.0
43.0
Watermark Jct - Caroona Jct
17.9
17.9
36.6
36.6
36.6
36.6
36.6
36.6
40.6
40.6
40.6
40.6
40.6
40.6
40.6
40.6
40.6
40.6
40.6
40.6
40.6
40.6
40.6
40.6
Caroona Jct - Werris Creek
29.8
29.8
29.8
29.8
29.8
29.8
29.8
29.8
35.6
35.6
35.6
35.6
35.6
35.6
35.6
35.6
35.6
35.6
35.6
35.6
57.2
57.2
57.2
57.2
Werris Creek - Scone
20.9
21.2
21.2
21.2
28.6
28.6
28.9
28.9
31.2
31.2
31.2
31.2
43.3
43.3
43.3
43.3
43.3
43.3
43.3
43.3
43.3
43.3
43.3
43.3
Scone - Muswellbrook
22.4
22.4
22.5
22.5
24.3
24.3
31.5
58.2
58.5
58.5
58.5
58.5
58.5
58.5
58.5
58.5
58.5
58.5
58.5
58.5
58.5
58.5
58.5
58.5
Cobbora - Ulan -
-
-
-
-
-
-
-
-
-
11.8
11.8
11.8
11.8
11.8
11.8
11.8
11.8
11.8
11.8
11.8
11.8
11.8
11.8
Ulan - Moolarben
59.5
59.5
59.5
59.5
59.5
59.5
59.5
59.5
57.0
57.0
54.7
54.7
54.3
54.3
53.9
53.9
53.9
53.9
53.5
53.5
53.5
53.5
53.5
53.5
Moolarben - Wilpingjong
55.4
55.4
55.4
55.4
56.7
56.7
56.7
56.7
53.9
53.9
53.0
53.0
52.7
52.7
52.6
52.6
52.6
52.6
52.3
52.3
52.3
52.3
52.3
52.3
Wilpingjong - Bylong
49.9
49.9
49.9
49.9
50.9
50.9
50.9
50.9
48.6
48.6
48.1
48.1
48.0
48.0
47.9
47.9
47.9
47.9
47.8
47.8
47.6
47.6
47.6
47.6
Bylong - Ferndale
41.8
41.8
41.8
41.8
42.6
42.6
42.6
42.6
40.7
40.7
40.3
40.3
43.9
43.9
43.8
43.8
43.8
43.8
43.7
43.7
52.5
52.5
52.5
52.5
Ferndale - Mangoola
64.4
64.4
64.4
64.4
64.8
64.8
64.8
64.8
61.9
61.9
61.3
61.3
61.2
61.2
61.0
61.0
61.0
61.0
60.9
60.9
60.6
60.6
60.6
60.6
Mangoola - Mt Pleasant
60.6
60.6
60.6
60.6
60.7
60.7
60.7
60.7
58.0
58.0
57.6
57.6
57.5
57.5
97.5
97.5
97.5
97.5
97.3
97.3
96.9
96.9
96.9
96.9
Mt Pleasant - Bengalla
60.4
60.4
60.4
60.4
60.5
60.5
60.5
60.5
57.9
57.9
57.5
57.5
57.4
57.4
97.4
97.4
97.4
97.4
97.2
97.2
96.9
96.9
96.9
96.9
Bengalla - Muswellbrook
160
160
160
160
165
165
161
161
167
167
167
167
166
166
166
166
166
166
166
166
165
165
165
165
Muswellbrook - Drayton
124
124
124
124
128
128
125
124
129
129
129
129
129
129
129
129
129
129
128
128
128
128
128
128
Drayton - Newdell
218
218
218
218
221
221
217
217
219
219
219
219
218
218
218
218
218
218
218
218
217
217
217
217
Newdell - Mt Owen
313
313
312
312
317
317
311
311
312
312
312
312
312
312
311
311
311
311
311
311
310
310
310
310
Mt Owen - Camberwell
239
239
238
238
242
242
238
237
238
238
238
238
238
238
238
238
237
237
237
237
237
237
237
237
Camberwell - Whittingham
242
242
242
242
244
244
241
241
239
239
239
239
239
239
239
239
239
239
238
238
238
238
238
238
Whittingham - Maitland
247
247
247
247
248
248
245
245
245
245
245
245
245
245
245
245
245
245
245
245
244
244
244
244
Maitland - Bloomfield
399
399
398
398
400
400
395
395
395
395
396
396
395
395
395
395
395
395
395
395
395
395
395
395
Bloomfield - Sandgate
400
400
399
399
401
401
396
396
396
396
390
390
390
390
388
388
388
388
385
385
386
386
386
386
Table 13 - Saleable capacity in coal train numbers (round-trips per day) for prospective volume
Table 14 - Saleable capacity in tonnes for prospective volume
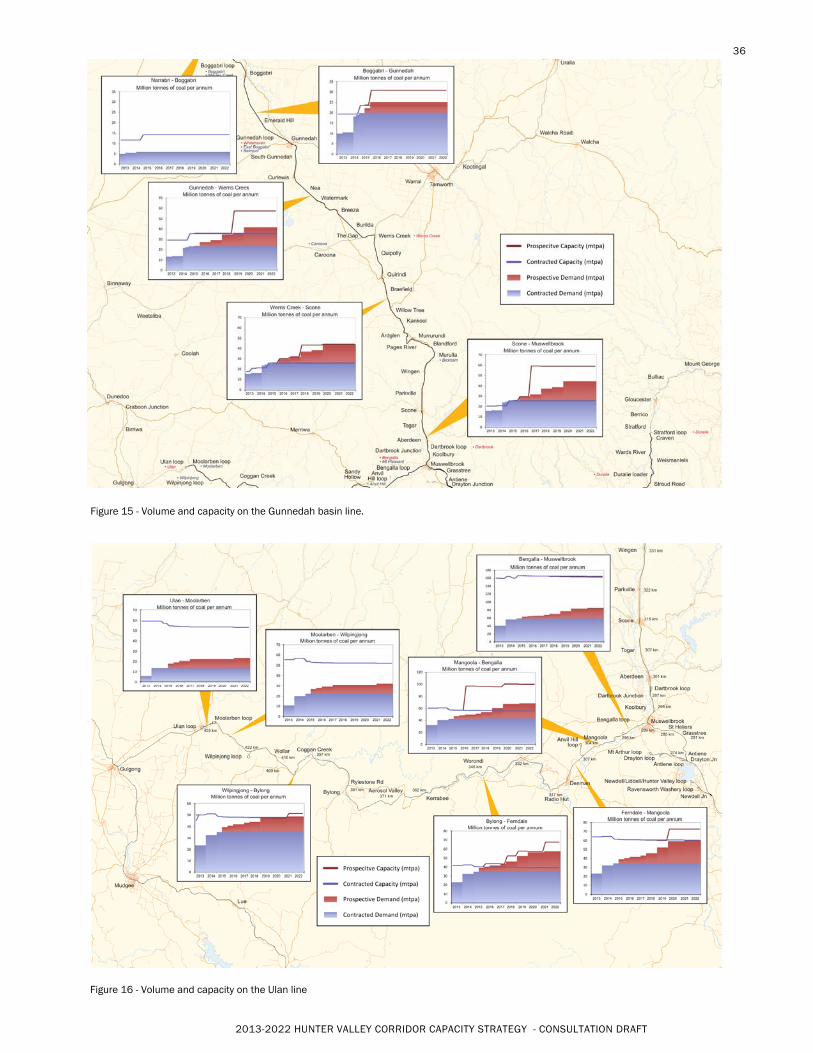
2013-2022 HUNTER VALLEY CORRIDOR CAPACITY STRATEGY - CONSULTATION DRAFT
36
Figure 15 - Volume and capacity on the Gunnedah basin line.
Figure 16 - Volume and capacity on the Ulan line
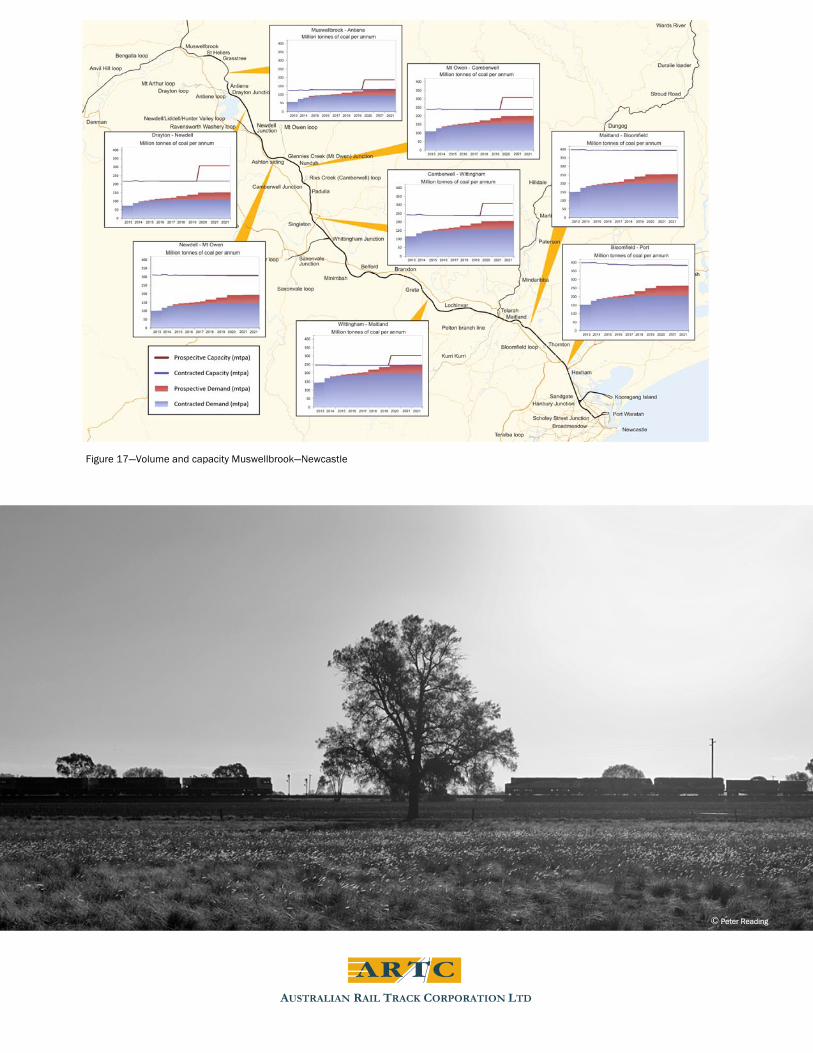
Figure 17—Volume and capacity Muswellbrook—Newcastle
© Peter Reading


![A414 Corridor Strategy - Summary Consultation Report · A414 Corridor Strategy - Summary Consultation Report [Publish Date] 44 Consultees and Participants We received 1,310 responses](https://img.pdfslide.net/doc/110x75/6011ef233f613b7ef63ef22a/a414-corridor-strategy-summary-consultation-report-a414-corridor-strategy-summary.jpg)