Embed Size (px)
Citation preview
2013 ALUMNI SURVEY
Highlights
Office of Institutional Research2
INTRODUCTION
The 2013 COFHE Alumni survey invitation was sent electronically to 2,726 alumni.
Dartmouth has participated in the COFHE Alumni survey since 2000.
This report compares Dartmouth with two peer groups for three separate cohorts (1994, 2002, and 2008):
Peer group 1 (Ivy U): consisted of Ivy schools excluding Dartmouth Peer group 2 (Non-Ivy U): included some private schools
Office of Institutional Research3
METHODS & SAMPLE (cont.)
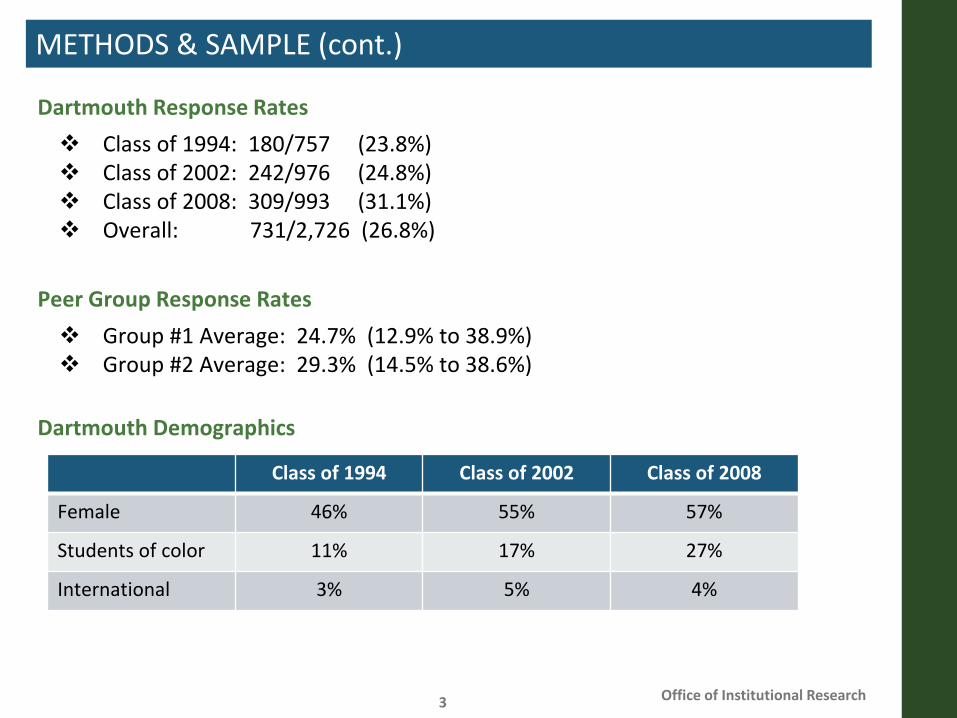
Dartmouth Response Rates Class of 1994: 180/757 (23.8%) Class of 2002: 242/976 (24.8%) Class of 2008: 309/993 (31.1%) Overall: 731/2,726 (26.8%)
Peer Group Response Rates Group #1 Average: 24.7% (12.9% to 38.9%) Group #2 Average: 29.3% (14.5% to 38.6%)
Dartmouth Demographics
Class of 1994 Class of 2002 Class of 2008
Female 46% 55% 57%
Students of color 11% 17% 27%
International 3% 5% 4%

EDUCATION AND CAREER
Office of Institutional Research5
Peer Comparisons
GRADUATE OR PROFESSIONAL SCHOOL
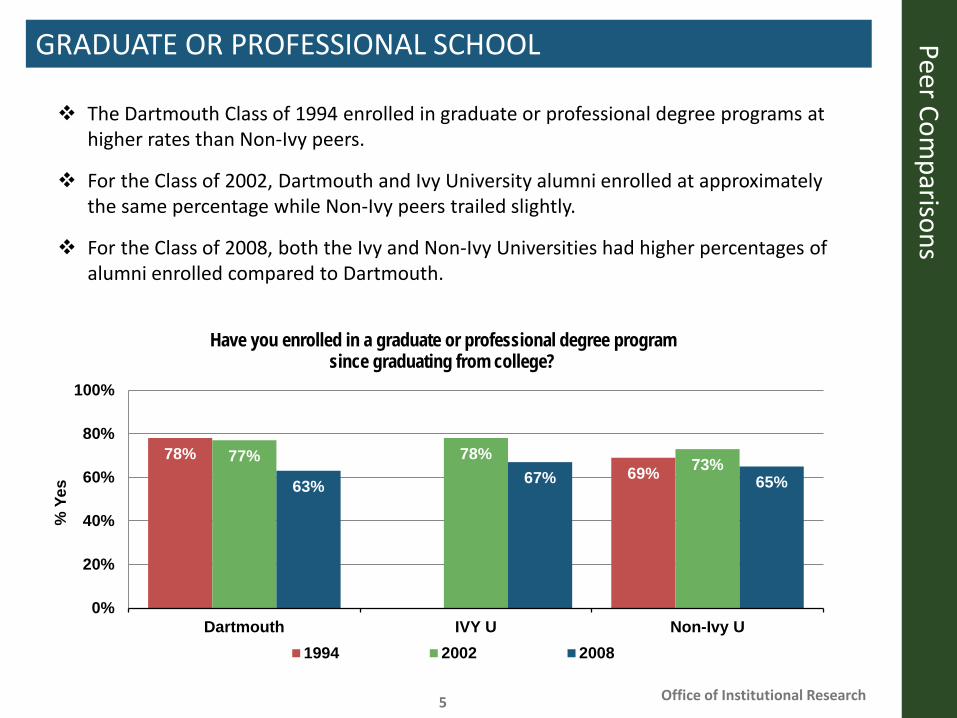
The Dartmouth Class of 1994 enrolled in graduate or professional degree programs at higher rates than Non-Ivy peers.
For the Class of 2002, Dartmouth and Ivy University alumni enrolled at approximately the same percentage while Non-Ivy peers trailed slightly.
For the Class of 2008, both the Ivy and Non-Ivy Universities had higher percentages of alumni enrolled compared to Dartmouth.
78%69%
77% 78% 73%63% 67% 65%
0%
20%
40%
60%
80%
100%
Dartmouth IVY U Non-Ivy U
% Y
es
Have you enrolled in a graduate or professional degree program since graduating from college?
1994 2002 2008
Office of Institutional Research6
Peer Comparisons
GRADUATE OR PROFESSIONAL SCHOOL
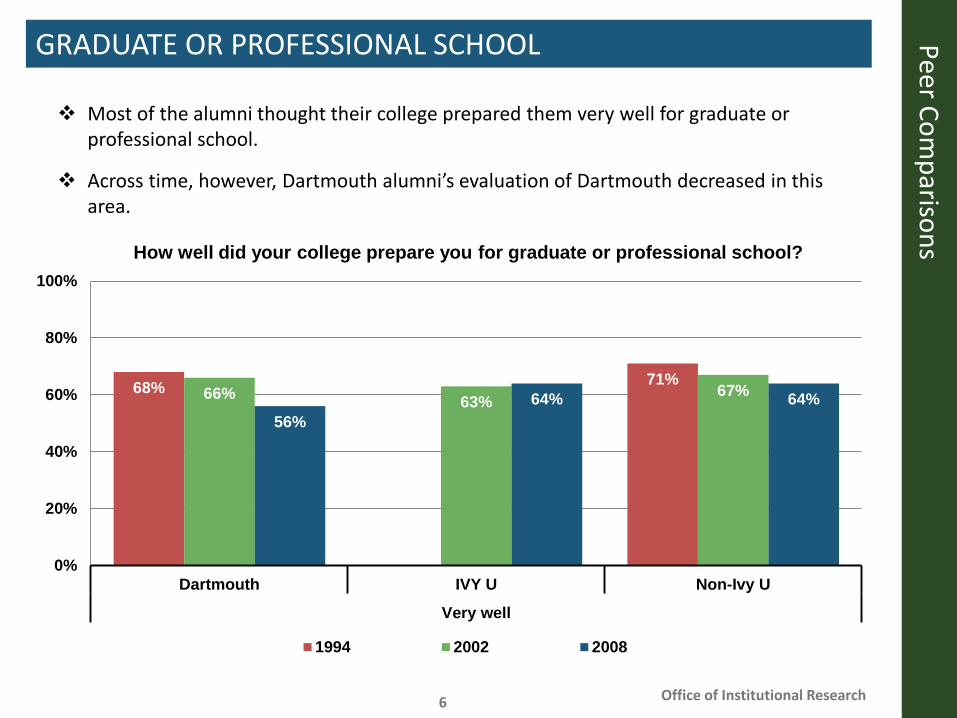
Most of the alumni thought their college prepared them very well for graduate or professional school.
Across time, however, Dartmouth alumni’s evaluation of Dartmouth decreased in this area.
68% 71%66% 63%
67%
56%64% 64%
0%
20%
40%
60%
80%
100%
Dartmouth IVY U Non-Ivy U
Very well
How well did your college prepare you for graduate or professional school?
1994 2002 2008
Office of Institutional Research7
Peer Comparisons
JOBS AND CAREERS
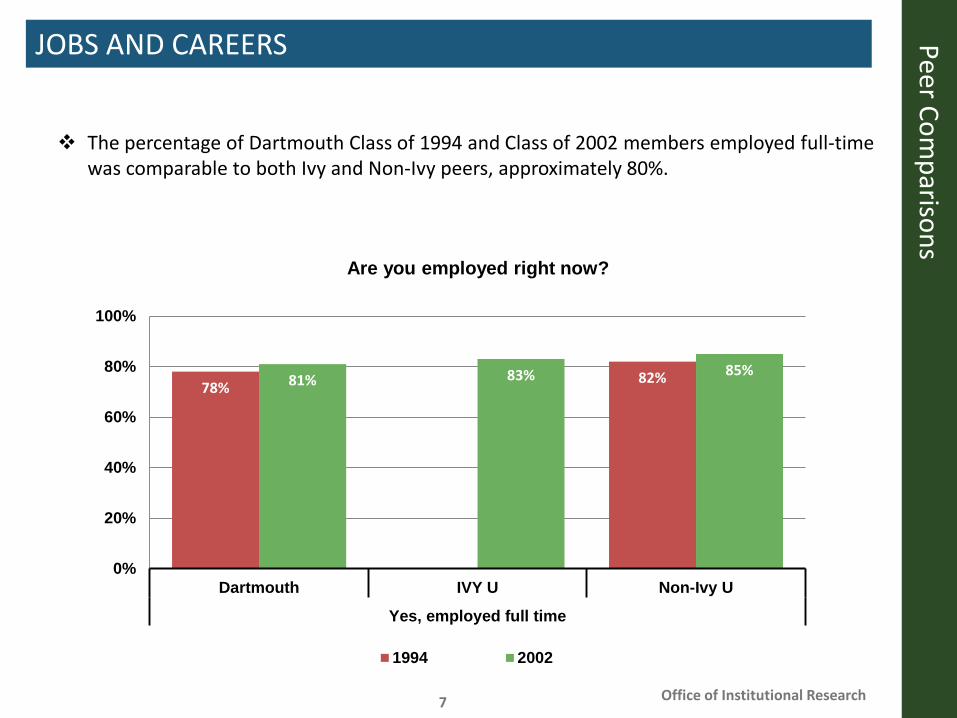
The percentage of Dartmouth Class of 1994 and Class of 2002 members employed full-time was comparable to both Ivy and Non-Ivy peers, approximately 80%.
78%82%81% 83% 85%
0%
20%
40%
60%
80%
100%
Dartmouth IVY U Non-Ivy U
Yes, employed full time
Are you employed right now?
1994 2002
Office of Institutional Research8
Peer Comparisons
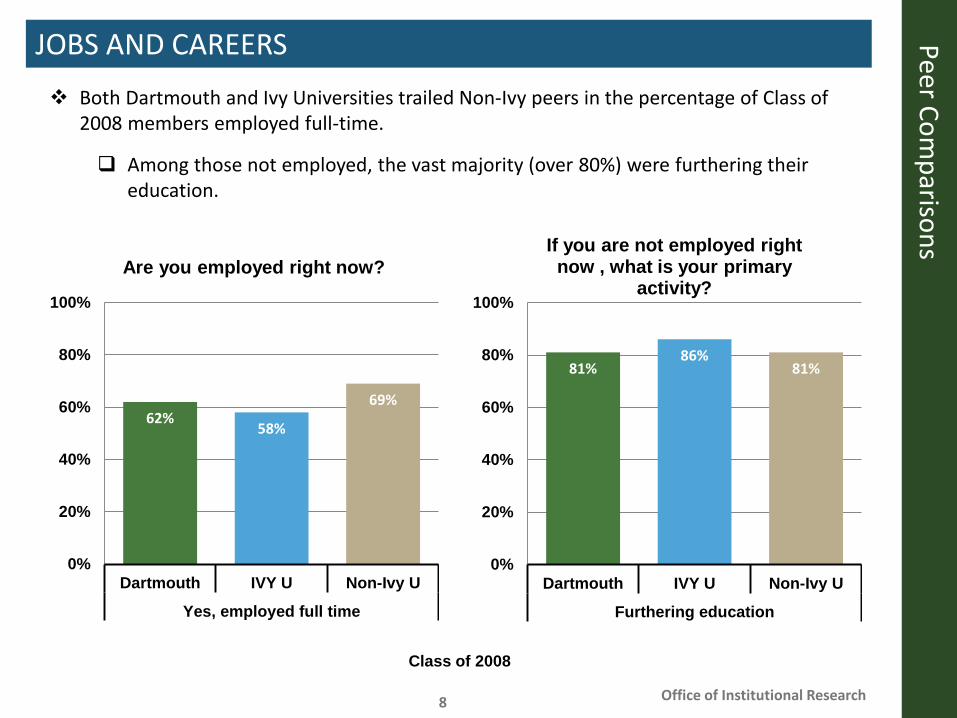
JOBS AND CAREERS Both Dartmouth and Ivy Universities trailed Non-Ivy peers in the percentage of Class of
2008 members employed full-time.
Among those not employed, the vast majority (over 80%) were furthering their education.
62%58%
69%
0%
20%
40%
60%
80%
100%
Dartmouth IVY U Non-Ivy U
Yes, employed full time
Are you employed right now?
81%86%
81%
0%
20%
40%
60%
80%
100%
Dartmouth IVY U Non-Ivy U
Furthering education
If you are not employed right now , what is your primary
activity?
Class of 2008
Office of Institutional Research9
Peer Comparisons
JOBS AND CAREERS
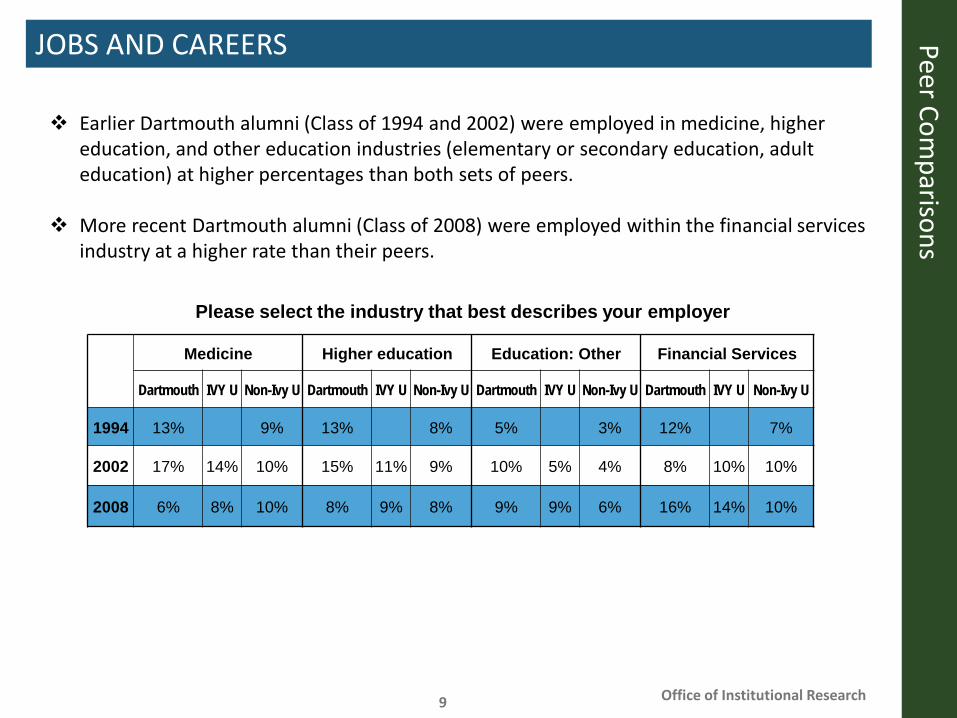
Earlier Dartmouth alumni (Class of 1994 and 2002) were employed in medicine, higher education, and other education industries (elementary or secondary education, adult education) at higher percentages than both sets of peers.
More recent Dartmouth alumni (Class of 2008) were employed within the financial services industry at a higher rate than their peers.
Medicine Higher education Education: Other Financial Services
Dartmouth IVY U Non-Ivy U Dartmouth IVY U Non-Ivy U Dartmouth IVY U Non-Ivy U Dartmouth IVY U Non-Ivy U
1994 13% 9% 13% 8% 5% 3% 12% 7%
2002 17% 14% 10% 15% 11% 9% 10% 5% 4% 8% 10% 10%
2008 6% 8% 10% 8% 9% 8% 9% 9% 6% 16% 14% 10%
Please select the industry that best describes your employer
Office of Institutional Research10
Peer Comparisons
JOBS AND CAREERS
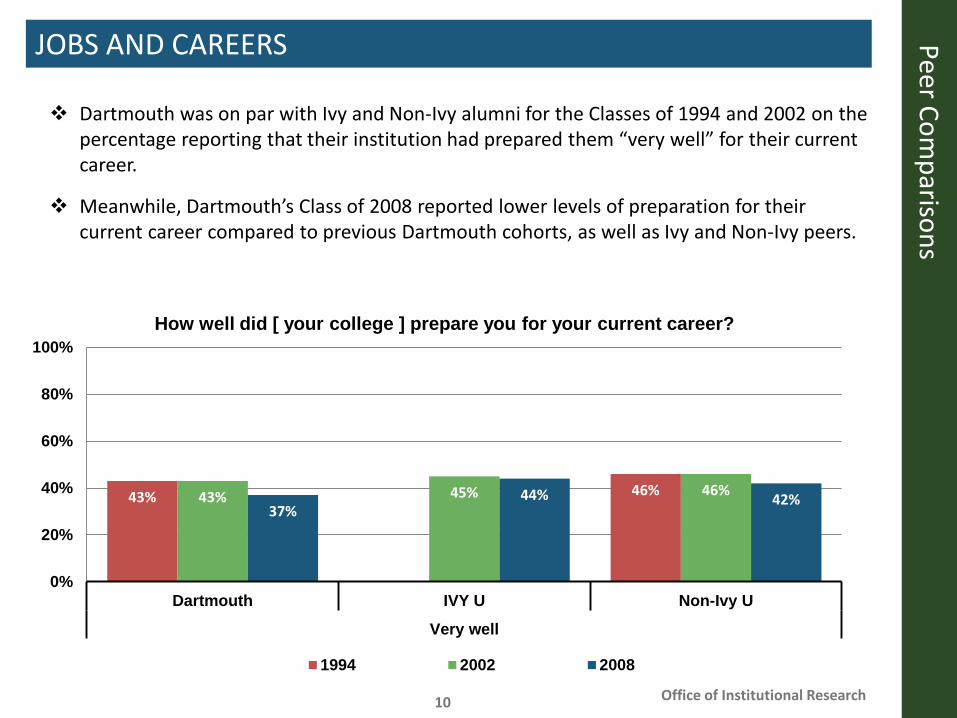
Dartmouth was on par with Ivy and Non-Ivy alumni for the Classes of 1994 and 2002 on the percentage reporting that their institution had prepared them “very well” for their current career.
Meanwhile, Dartmouth’s Class of 2008 reported lower levels of preparation for their current career compared to previous Dartmouth cohorts, as well as Ivy and Non-Ivy peers.
43% 46%43% 45% 46%37%
44% 42%
0%
20%
40%
60%
80%
100%
Dartmouth IVY U Non-Ivy U
Very well
How well did [ your college ] prepare you for your current career?
1994 2002 2008

YOUR LIFE NOW
Office of Institutional Research12
Peer Comparisons
HOW IMPORTANT IS …
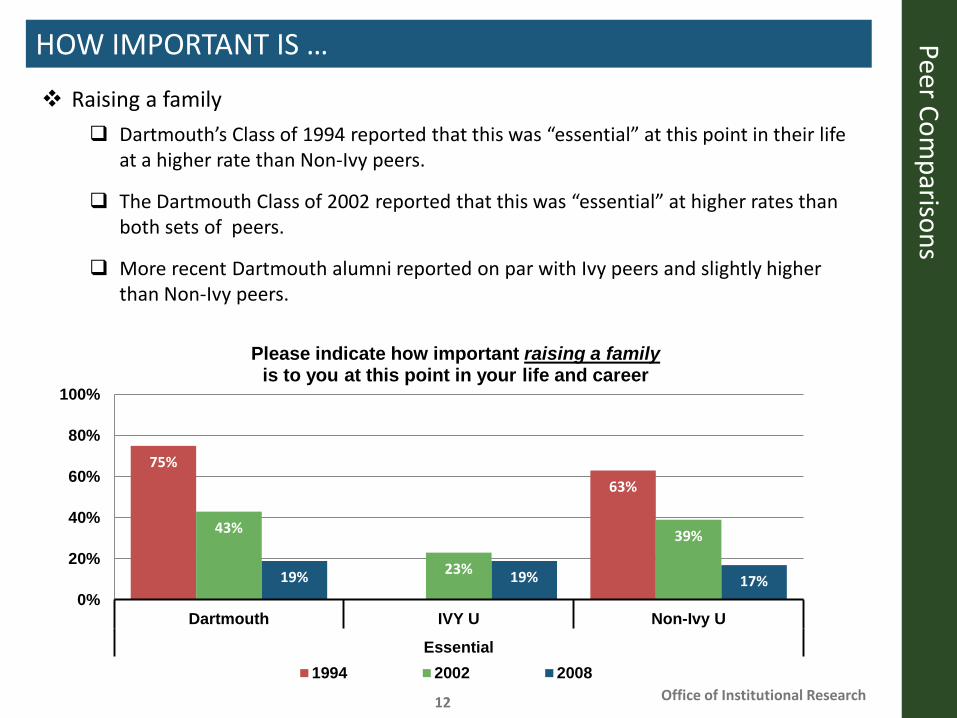
Raising a family Dartmouth’s Class of 1994 reported that this was “essential” at this point in their life
at a higher rate than Non-Ivy peers.
The Dartmouth Class of 2002 reported that this was “essential” at higher rates than both sets of peers.
More recent Dartmouth alumni reported on par with Ivy peers and slightly higher than Non-Ivy peers.
75%63%
43%
23%
39%
19% 19% 17%0%
20%
40%
60%
80%
100%
Dartmouth IVY U Non-Ivy U
Essential
Please indicate how important raising a familyis to you at this point in your life and career
1994 2002 2008
Office of Institutional Research13
Peer Comparisons
HOW IMPORTANT IS …
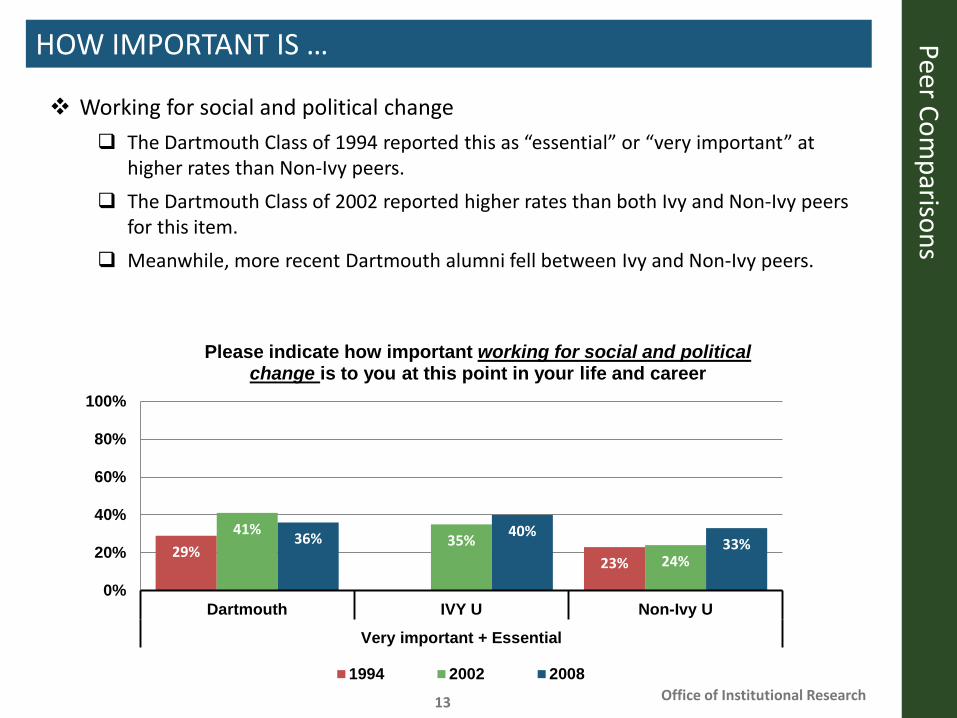
Working for social and political change The Dartmouth Class of 1994 reported this as “essential” or “very important” at
higher rates than Non-Ivy peers. The Dartmouth Class of 2002 reported higher rates than both Ivy and Non-Ivy peers
for this item. Meanwhile, more recent Dartmouth alumni fell between Ivy and Non-Ivy peers.
29%23%
41%35%
24%36% 40%
33%
0%
20%
40%
60%
80%
100%
Dartmouth IVY U Non-Ivy U
Very important + Essential
Please indicate how important working for social and political change is to you at this point in your life and career
1994 2002 2008
Office of Institutional Research14
Peer Comparisons
HOW IMPORTANT IS …
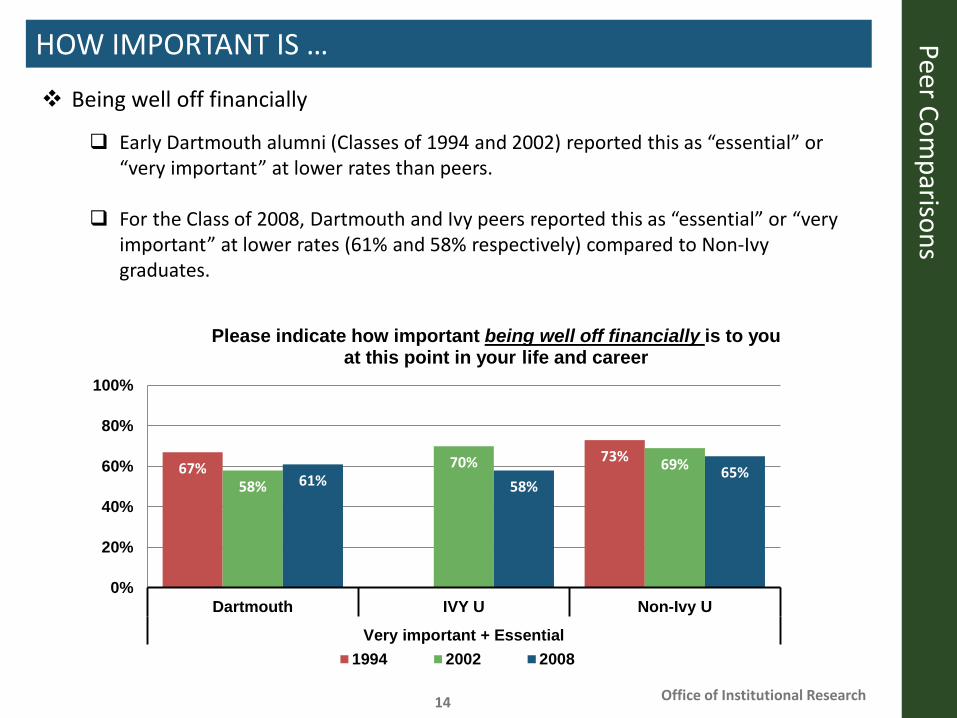
Being well off financially
Early Dartmouth alumni (Classes of 1994 and 2002) reported this as “essential” or “very important” at lower rates than peers.
For the Class of 2008, Dartmouth and Ivy peers reported this as “essential” or “very important” at lower rates (61% and 58% respectively) compared to Non-Ivy graduates.
67%73%
58%70% 69%
61% 58%65%
0%
20%
40%
60%
80%
100%
Dartmouth IVY U Non-Ivy U
Very important + Essential
Please indicate how important being well off financially is to you at this point in your life and career
1994 2002 2008

EVALUATE YOUR SCHOOL
Office of Institutional Research16
Peer Comparisons
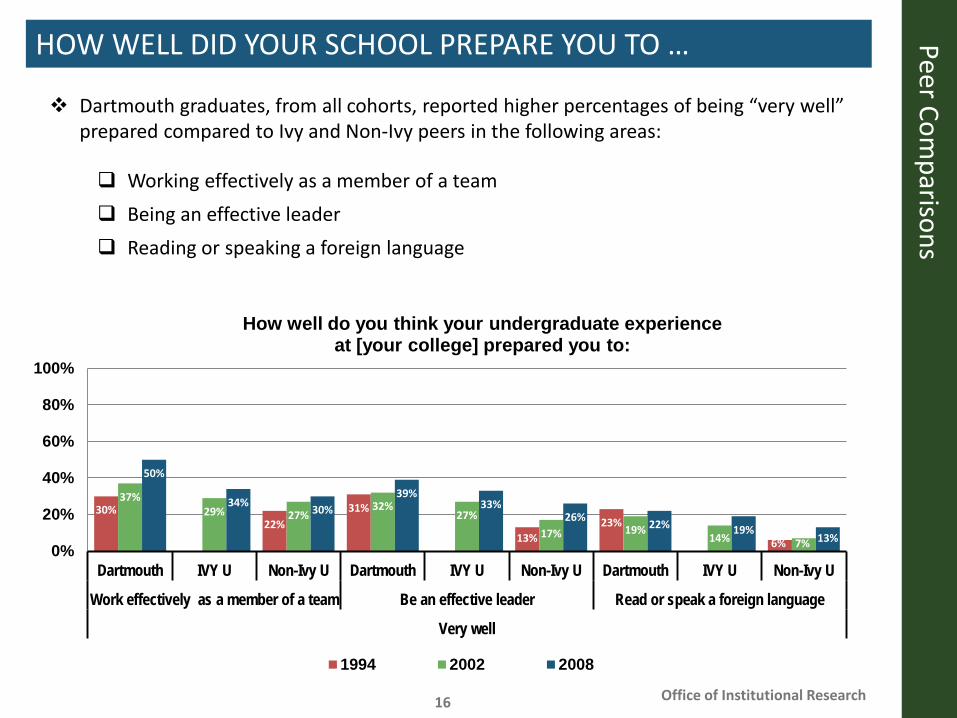
HOW WELL DID YOUR SCHOOL PREPARE YOU TO …
Dartmouth graduates, from all cohorts, reported higher percentages of being “very well” prepared compared to Ivy and Non-Ivy peers in the following areas:
Working effectively as a member of a team Being an effective leader Reading or speaking a foreign language
30%22%
31%
13%23%
6%
37%29% 27%
32%27%
17% 19%14% 7%
50%
34% 30%39%
33%26% 22% 19%
13%0%
20%
40%
60%
80%
100%
Dartmouth IVY U Non-Ivy U Dartmouth IVY U Non-Ivy U Dartmouth IVY U Non-Ivy U
Work effectively as a member of a team Be an effective leader Read or speak a foreign language
Very well
How well do you think your undergraduate experience at [your college] prepared you to:
1994 2002 2008
Office of Institutional Research17
Peer Comparisons
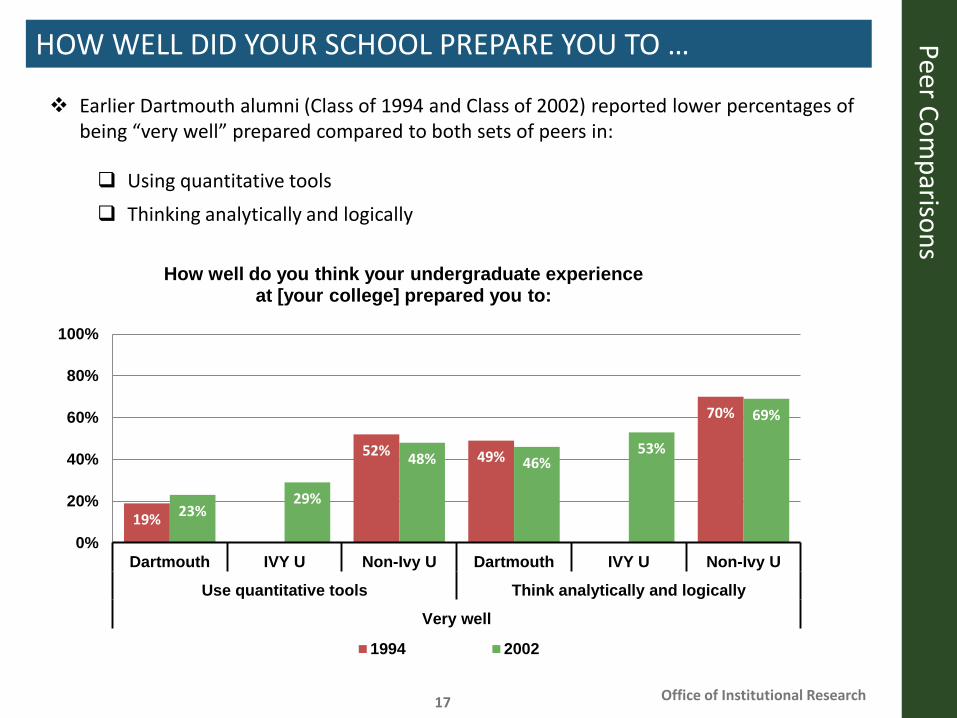
HOW WELL DID YOUR SCHOOL PREPARE YOU TO …
Earlier Dartmouth alumni (Class of 1994 and Class of 2002) reported lower percentages of being “very well” prepared compared to both sets of peers in:
Using quantitative tools Thinking analytically and logically
19%
52% 49%
70%
23%29%
48% 46%53%
69%
0%
20%
40%
60%
80%
100%
Dartmouth IVY U Non-Ivy U Dartmouth IVY U Non-Ivy U
Use quantitative tools Think analytically and logically
Very well
How well do you think your undergraduate experience at [your college] prepared you to:
1994 2002
Office of Institutional Research18
Peer Comparisons
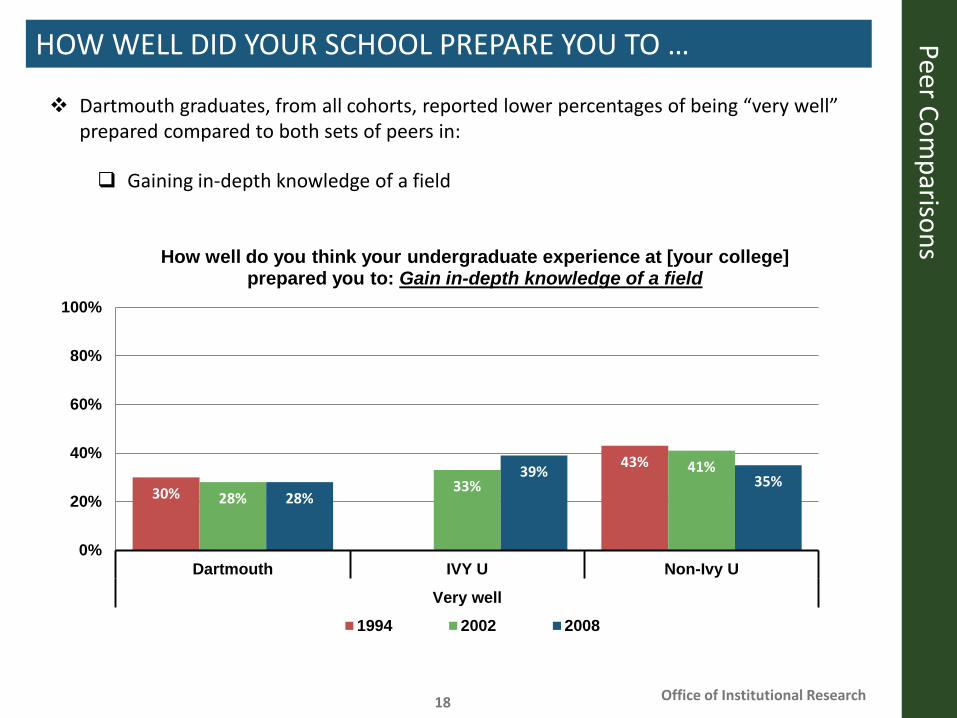
HOW WELL DID YOUR SCHOOL PREPARE YOU TO …
Dartmouth graduates, from all cohorts, reported lower percentages of being “very well” prepared compared to both sets of peers in:
Gaining in-depth knowledge of a field
30%
43%
28%33%
41%
28%
39% 35%
0%
20%
40%
60%
80%
100%
Dartmouth IVY U Non-Ivy U
Very well
How well do you think your undergraduate experience at [your college] prepared you to: Gain in-depth knowledge of a field
1994 2002 2008

UNDERGRADUATE EXPERIENCE
Office of Institutional Research20
Peer Comparisons
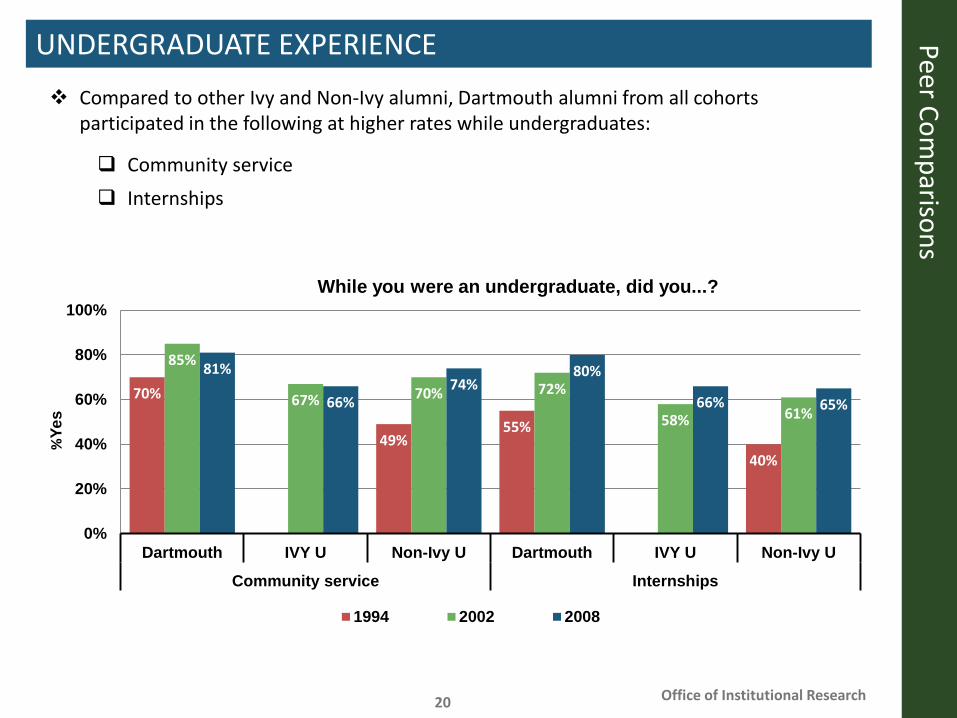
UNDERGRADUATE EXPERIENCE Compared to other Ivy and Non-Ivy alumni, Dartmouth alumni from all cohorts
participated in the following at higher rates while undergraduates:
Community service Internships
70%
49%55%
40%
85%
67% 70% 72%
58% 61%
81%
66%74%
80%
66% 65%
0%
20%
40%
60%
80%
100%
Dartmouth IVY U Non-Ivy U Dartmouth IVY U Non-Ivy U
Community service Internships
%Ye
s
While you were an undergraduate, did you...?
1994 2002 2008
Office of Institutional Research21
Peer Comparisons
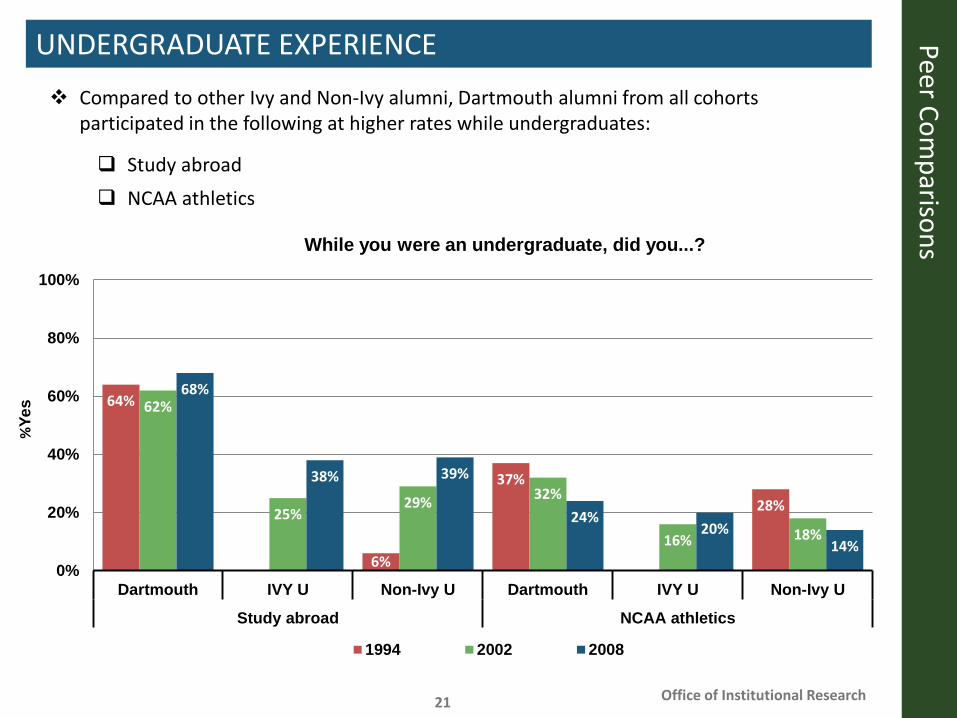
UNDERGRADUATE EXPERIENCE Compared to other Ivy and Non-Ivy alumni, Dartmouth alumni from all cohorts
participated in the following at higher rates while undergraduates:
Study abroad NCAA athletics
64%
6%
37%
28%
62%
25%29% 32%
16% 18%
68%
38% 39%
24%20%
14%0%
20%
40%
60%
80%
100%
Dartmouth IVY U Non-Ivy U Dartmouth IVY U Non-Ivy U
Study abroad NCAA athletics
%Ye
s
While you were an undergraduate, did you...?
1994 2002 2008
Office of Institutional Research22
Peer Comparisons
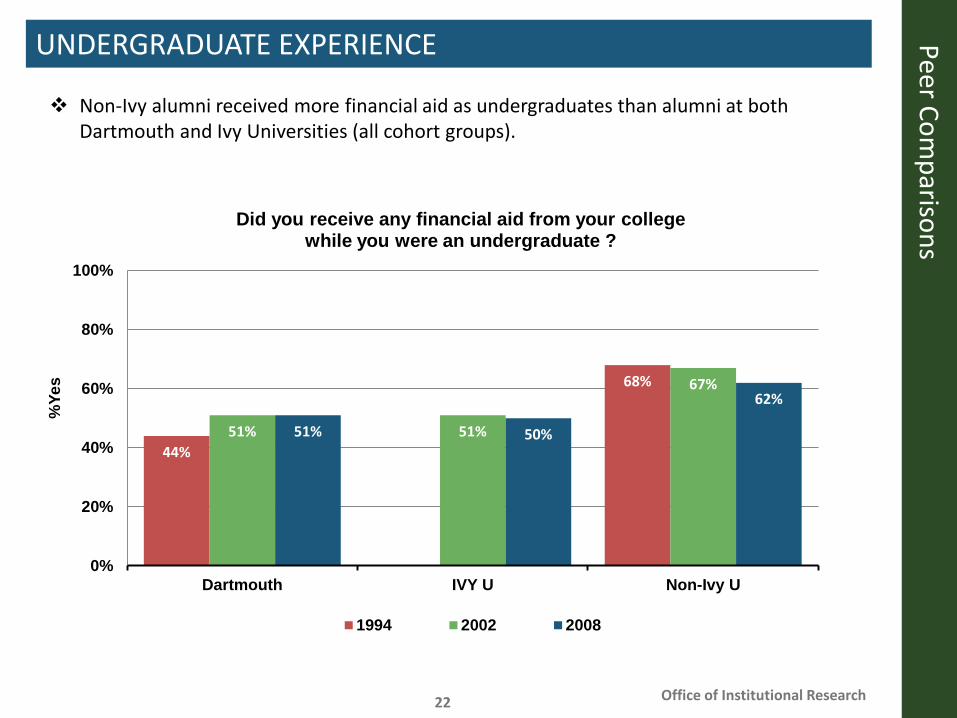
UNDERGRADUATE EXPERIENCE
Non-Ivy alumni received more financial aid as undergraduates than alumni at both Dartmouth and Ivy Universities (all cohort groups).
44%
68%
51% 51%
67%
51% 50%
62%
0%
20%
40%
60%
80%
100%
Dartmouth IVY U Non-Ivy U
%Ye
s
Did you receive any financial aid from your college while you were an undergraduate ?
1994 2002 2008
Office of Institutional Research23
Peer Comparisons
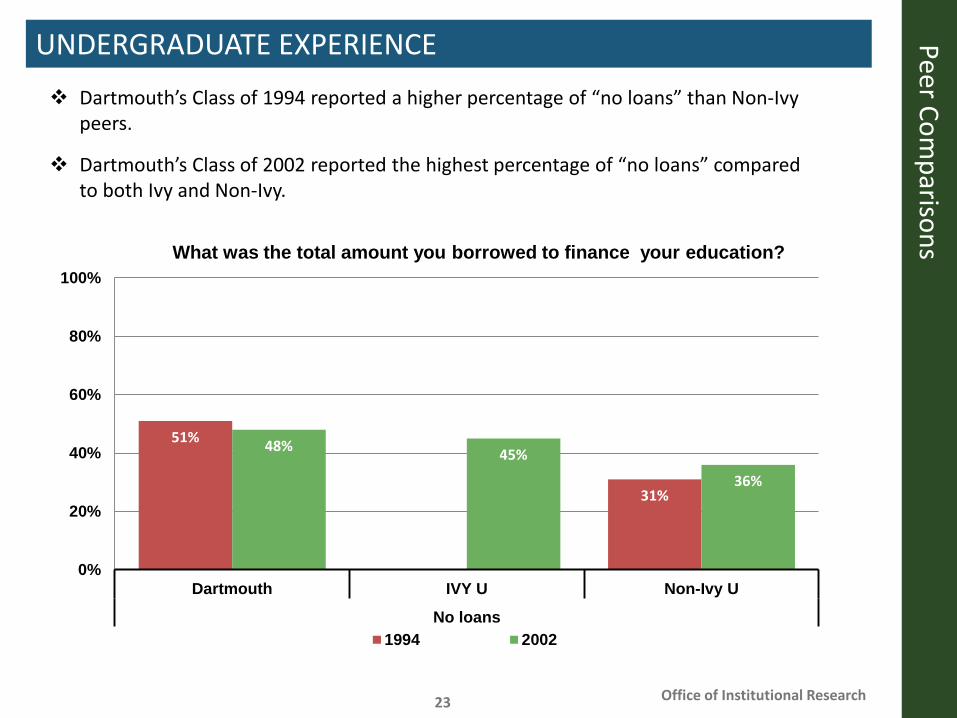
UNDERGRADUATE EXPERIENCE Dartmouth’s Class of 1994 reported a higher percentage of “no loans” than Non-Ivy
peers.
Dartmouth’s Class of 2002 reported the highest percentage of “no loans” compared to both Ivy and Non-Ivy.
51%
31%
48% 45%
36%
0%
20%
40%
60%
80%
100%
Dartmouth IVY U Non-Ivy U
No loans
What was the total amount you borrowed to finance your education?
1994 2002
Office of Institutional Research24
Peer Comparisons
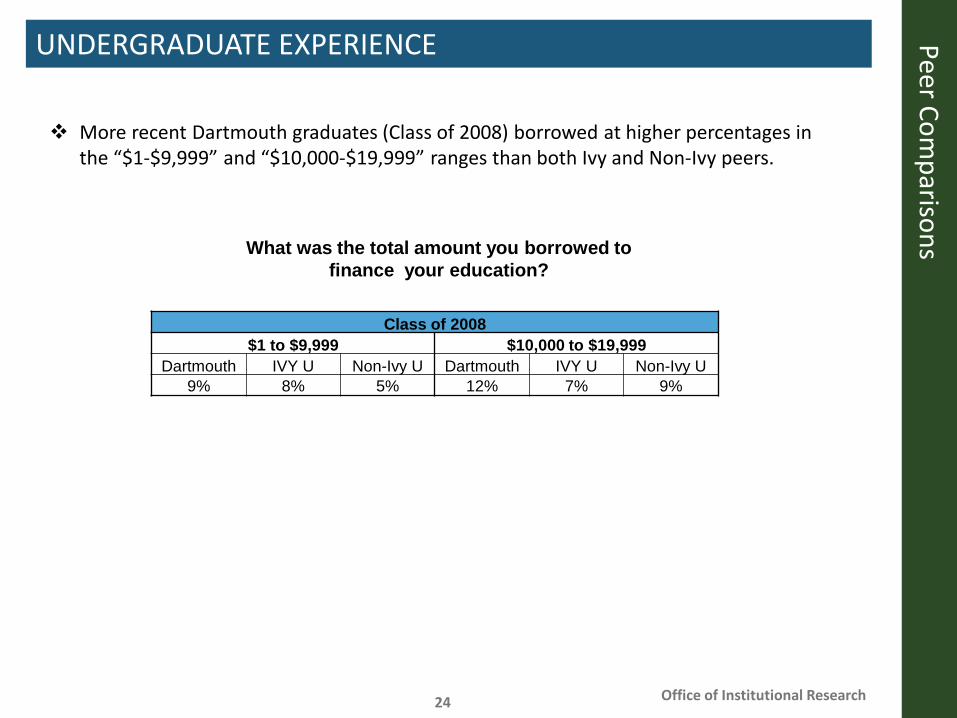
UNDERGRADUATE EXPERIENCE
More recent Dartmouth graduates (Class of 2008) borrowed at higher percentages in the “$1-$9,999” and “$10,000-$19,999” ranges than both Ivy and Non-Ivy peers.
What was the total amount you borrowed to finance your education?
Class of 2008$1 to $9,999 $10,000 to $19,999
Dartmouth IVY U Non-Ivy U Dartmouth IVY U Non-Ivy U9% 8% 5% 12% 7% 9%

PARENTAL EDUCATION AND HOUSEHOLD INCOME
Office of Institutional Research26
Peer Comparisons
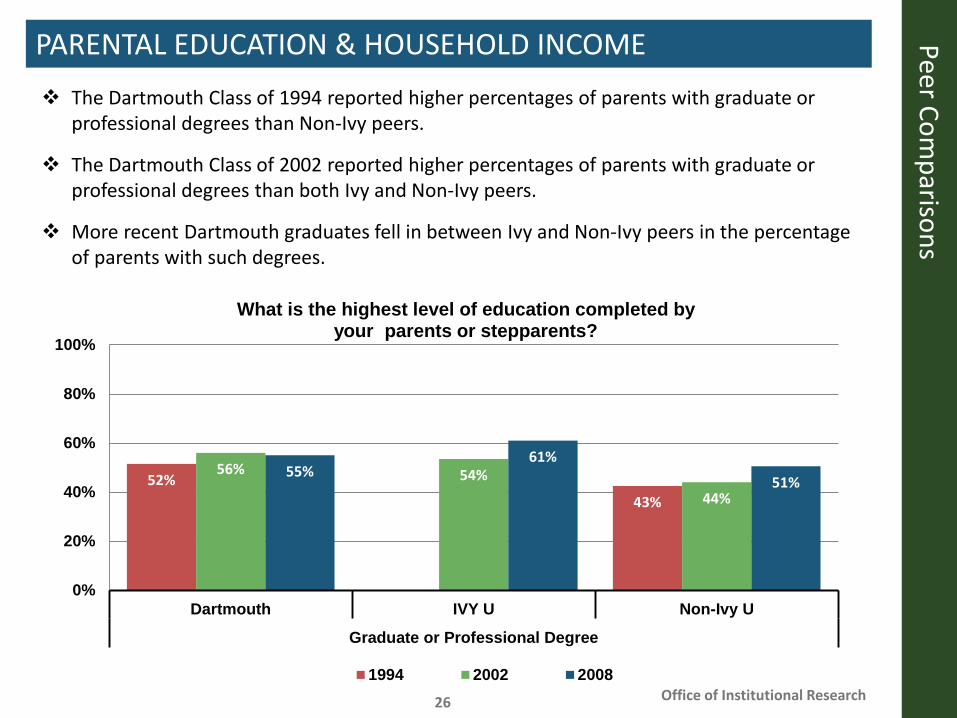
PARENTAL EDUCATION & HOUSEHOLD INCOME The Dartmouth Class of 1994 reported higher percentages of parents with graduate or
professional degrees than Non-Ivy peers.
The Dartmouth Class of 2002 reported higher percentages of parents with graduate or professional degrees than both Ivy and Non-Ivy peers.
More recent Dartmouth graduates fell in between Ivy and Non-Ivy peers in the percentage of parents with such degrees.
52%43%
56% 54%44%
55%61%
51%
0%
20%
40%
60%
80%
100%
Dartmouth IVY U Non-Ivy U
Graduate or Professional Degree
What is the highest level of education completed by your parents or stepparents?
1994 2002 2008
Office of Institutional Research27
Peer Comparisons
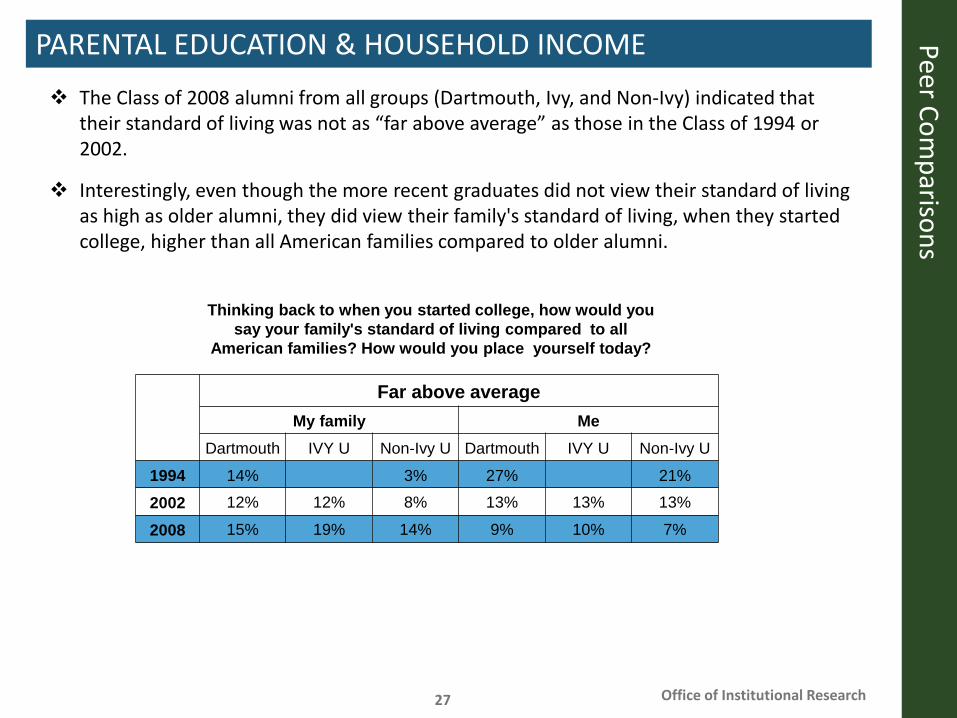
PARENTAL EDUCATION & HOUSEHOLD INCOME The Class of 2008 alumni from all groups (Dartmouth, Ivy, and Non-Ivy) indicated that
their standard of living was not as “far above average” as those in the Class of 1994 or 2002.
Interestingly, even though the more recent graduates did not view their standard of living as high as older alumni, they did view their family's standard of living, when they started college, higher than all American families compared to older alumni.
Thinking back to when you started college, how would you say your family's standard of living compared to all
American families? How would you place yourself today?
Far above averageMy family Me
Dartmouth IVY U Non-Ivy U Dartmouth IVY U Non-Ivy U
1994 14% 3% 27% 21%
2002 12% 12% 8% 13% 13% 13%
2008 15% 19% 14% 9% 10% 7%