Embed Size (px)
DESCRIPTION
2013 AMERCO Annual Report
Citation preview


July 12, 2013
Dear Fellow Shareholders,
In 2013, we continued the implementation of the strategies outlined in my letter of last year. U-Haul Team members again improved the quality of our customer service. The customer again rewarded us with more business.
The correct time period over which to evaluate our results remains much longer than one year. The competitive situation in both the U-Move and U-Store business is intensifying. We are having to step up our game just to maintain position.
We continued to rotate and aggressively expand our rental vehicle fleet in 2013. We are in this for the long term and are digging in, anticipating increasing competitive pressures in our do-it-yourself moving business.
We again added both net rentable square feet and locations in the self-storage business. We brought on about 2 million square feet of product and improved occupancy.
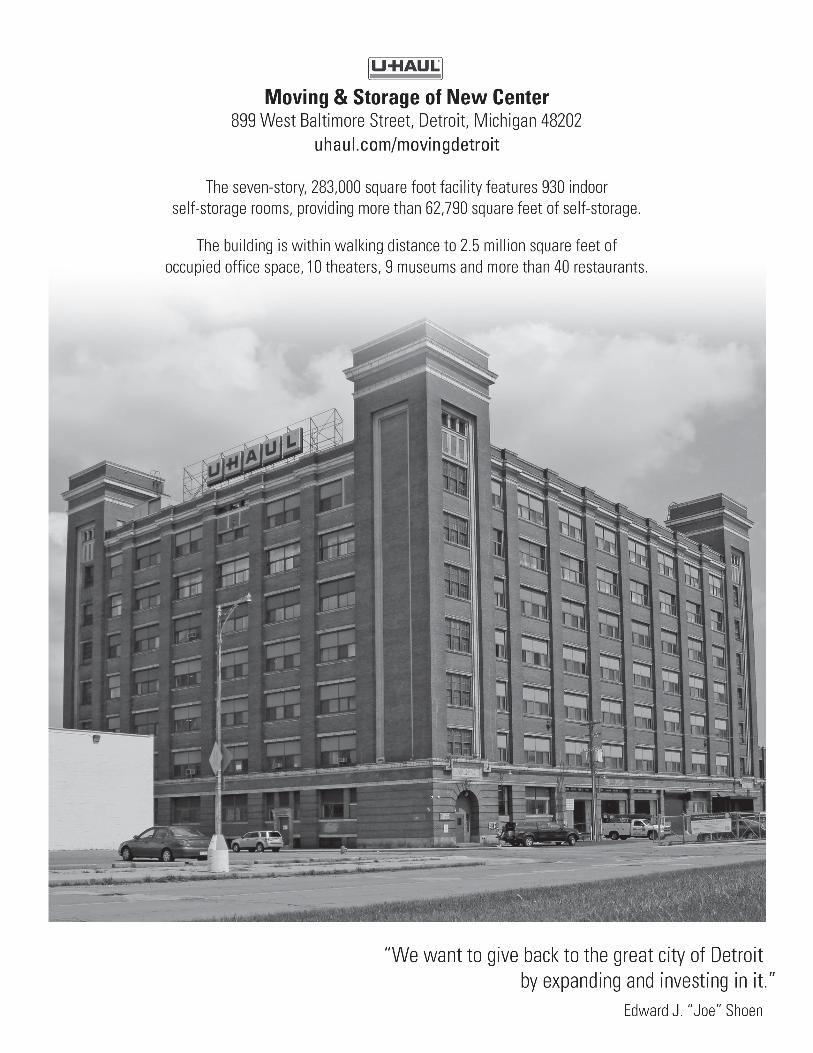
An especially relevant example of our efforts to expand our footprint, grow our developing programs and do so in a way that is consistent with AMERCO’s attitude towards serving those who need us most is our project in Midtown Detroit. This historic building is featured on this report’s cover.
AMERCO intends to manage for the long term. Our U-Box, Moving Help, U-Haul Car Share, Storage Affiliate and College Box programs are all developing. Our sustainability initiatives are resonating with the customer and with Organized Political Society.
Repwest Insurance is performing in a more predictable manner. Oxford Life Insurance is exhibiting steady growth in its target markets.
Our Primary Service Objective is “To provide a better and better product and service to more and more people at a lower and lower cost.” We remain committed to this objective.
My thanks to our customers, Team members, U-Haul dealers, shareholders and lenders for their support.
Sincerely,
Edward J. “Joe” Shoen

Amounts in Millions, Except Share and Per Share Data Fiscal Fiscal Fiscal 2013 2012 2011Segment Results: Moving and Storage Revenues $2,282.3 $2,156.9 $1,977.8 Earnings from operations before equity in earnings of subsidiaries 462.3 432.8 355.2 Property and Casualty Insurance Revenues 48.2 42.6 38.7 Earnings (loss) from operations 14.2 (36.4) 5.6 Life Insurance Revenues 231.5 317.3 240.0 Earnings from operations 23.0 20.1 17.4 Eliminations Revenues (3.4) (4.8) (5.1) Earnings from operations before equity in earnings of subsidiaries (0.3) (0.5) (0.6) Consolidated Results Revenues 2,558.6 2,512.0 2,251.4 Earnings from operations 499.2 416.0 377.7
Net Earnings Available to $264.7 $196.5 $171.0Common Shareholders
Weighted Average Common Shares 19,518,779 19,476,187 19,432,781Outstanding, Basic and Diluted
Net Earnings Per $13.56 $10.09 $8.80Common Share, Basic and Diluted
Preferred Stock Dividends Paid or Accrued (a) - $2.9 $12.4
Common Stock Dividends Paid or Accrued $97.4 $19.5 -
Selected Balance Sheet Data:
Property, Plant and Equipment, Net $2,755.1 $2,372.4 $2,094.6
Total Assets 5,306.6 4,654.1 4,191.4
Notes, Loans and Leases Payable 1,661.8 1,486.2 1,397.8
Stockholders’ Equity 1,229.3 1,035.8 993.0
Closing Common Stock Price Per Share $173.54 $105.51 $97.00As Of March 31 (b) (c)
High And Low Per Share Sales Price $178.70-75.41 $126.14-60.18 $109.11-43.43Of Common Stock
(a) Fiscal 2012 and 2011 refl ect eliminations of $0.3 million and $0.6 million, respectively paid to affi liates.(b) Fiscal 2013 was as of March 28, 2013 because March 29 was Good Friday and March 31 was a Sunday(c) Fiscal 2012 was as of March 30, 2012 because March 31 was a Saturday
F I N A N C I A L H I G H L I G H T S

UNITED STATES SECURITIES AND EXCHANGE COMMISSION Washington, D.C. 20549
Form 10-K (Mark One) [X] ANNUAL REPORT PURSUANT TO SECTION 13 OR 15(d) OF THE SECURITIES EXCHANGE ACT OF 1934.
For the fiscal year ended March 31, 2013
or
[ ] TRANSITION REPORT PURSUANT TO SECTION 13 OR 15(D) OF THE SECURITIES EXCHANGE ACT OF 1934.
For the transition period from __________________ to _________________
Commission File Number
Registrant, State of Incorporation Address and Telephone Number
I.R.S. Employer Identification No.
1-11255 AMERCO 88-0106815
(A Nevada Corporation)
1325 Airmotive Way, Ste. 100
Reno, Nevada 89502-3239
Telephone (775) 688-6300
Securities registered pursuant to Section 12(g) of the Act: None
Indicate by check mark if the registrant is a well-known seasoned issuer, as defined in Rule 405 of the Securities Act. Yes [ ] No [X]
Indicate by check mark if the registrant is not required to file reports pursuant to Section 13 or Section 15(d) of the Securities Act. Yes [ ] No [X]
Indicate by check mark whether the registrant: (1) has filed all reports required to be filed by Section 13 or 15(d) of the Securities Exchange Act of 1934 during the preceding 12 months (or for such shorter period that the registrant was required to file such reports), and (2) has been subject to such filing requirements for the past 90 days. Yes [X] No [ ]
Indicate by check mark whether the registrant has submitted electronically and posted on its corporate Web site, if any, every Interactive Data File required to be submitted and posted pursuant to Rule 405 of Regulation S-T (§232.405 of this chapter) during the preceding 12 months (or for such shorter period that the registrant was required to submit and post such files.) Yes [X] No [ ]
Indicate by check mark if disclosure of delinquent filers pursuant to Item 405 of Regulation S-K (§229.405 of this chapter) is not contained herein, and will not be contained, to the best of the registrant’s knowledge, in definitive proxy or information statements incorporated by reference in Part III of this Form 10-K or any amendment to this Form 10-K. [ ]

Indicate by check mark whether the registrant is a large accelerated filer, an accelerated filer, a non-accelerated filer or a smaller reporting company. See the definitions of a “large accelerated filer,” “accelerated filer” and “smaller reporting company” in Rule 12b-2 of the Exchange Act.
Large accelerated filer [ ] Accelerated filer [X]
Non-accelerated filer [ ] (Do not check if a smaller reporting company) Smaller reporting company [ ]
Indicate by check mark whether the registrant is a shell company (as defined in Rule 12b-2 of the Exchange Act). Yes [ ] No [X]
The aggregate market value of AMERCO common stock held by non-affiliates on September 30, 2012 (AMERCO’s most recently completed second fiscal quarter) was $510,020,982. The aggregate market value was computed using the closing price for the common stock trading on NASDAQ on September 28, 2012 (the last business day of AMERCO’s most recently completed second fiscal quarter). Shares held by AMERCO’s executive officers, directors and persons owning directly or indirectly more than 5% of the outstanding common stock have been excluded from the preceding number because such persons may be deemed to be affiliates of the registrant. This determination of affiliate status is not necessarily a conclusive determination for other purposes.
19,607,788 shares of AMERCO Common Stock, $0.25 par value, were outstanding at May 30, 2013.
Documents incorporated by reference: portions of AMERCO’s definitive proxy statement for the 2013 annual meeting of stockholders, to be filed within 120 days after AMERCO’s fiscal year ended March 31, 2013, are incorporated by reference into Part III of this report.

TABLE OF CONTENTS
Page
PART I Item 1. Business ......................................................................................................................... 1 Item 1A. Risk Factors .................................................................................................................... 7 Item 1B. Unresolved Staff Comments ........................................................................................... 11 Item 2. Properties ....................................................................................................................... 11 Item 3. Legal Proceedings .......................................................................................................... 12 Item 4. Mine Safety Disclosure ................................................................................................... 13
PART II Item 5. Market for the Registrant’s Common Equity, Related Stockholder Matters and Issuer
Repurchases of Equity Securities ................................................................................... 13 Item 6. Selected Financial Data .................................................................................................. 17 Item 7. Management’s Discussion and Analysis of Financial Condition and Results of
Operations ...................................................................................................................... 18 Item 7A. Quantitative and Qualitative Disclosures About Market Risk ......................................... 41 Item 8. Financial Statements and Supplementary Data ............................................................. 42 Item 9. Changes in and Disagreements with Accountants on Accounting and Financial
Disclosure ....................................................................................................................... 42 Item 9A. Controls and Procedures ................................................................................................ 42 Item 9B. Other Information ............................................................................................................ 45
PART III Item 10. Directors, Executive Officers and Corporate Governance ............................................. 45 Item 11. Executive Compensation ................................................................................................ 45 Item 12. Security Ownership of Certain Beneficial Owners and Management and Related
Stockholder Matters ........................................................................................................
45 Item 13. Certain Relationships and Related Transaction, and Director Independence ............... 45 Item 14. Principal Accounting Fees and Services ........................................................................ 45
PART IV Item 15. Exhibits and Financial Statement Schedules ................................................................. 46

1
PART I Item 1. Business
Company Overview We are North America’s largest “do-it-yourself” moving and storage operator through our subsidiary
U-Haul International, Inc. (“U-Haul”). U-Haul is synonymous with “do-it-yourself” moving and storage and is a leader in supplying products and services to help people move and store their household and commercial goods. Our primary service objective is to provide a better and better product or service to more and more people at a lower and lower cost. Unless the context otherwise requires, the term “AMERCO,” “Company,” “we,” “us,” or “our” refers to AMERCO, a Nevada Corporation, and all of its legal subsidiaries, on a consolidated basis.
We were founded in 1945 as a sole proprietorship under the name "U-Haul Trailer Rental Company" and have rented trailers ever since. Starting in 1959, we rented trucks on a one-way and in-town basis exclusively through independent U-Haul dealers. In 1974, we began developing our network of U-Haul managed retail centers, through which we rent our trucks and trailers, self-storage rooms and portable storage boxes and sell moving and self-storage products and services to complement our independent dealer network.
We rent our distinctive orange and white U-Haul trucks and trailers as well as offer self-storage rooms through a network of approximately 1,490 Company operated retail moving centers and approximately 16,400 independent U-Haul dealers. We also sell U-Haul brand boxes, tape and other moving and self-storage products and services to “do-it-yourself” moving and storage customers at all of our distribution outlets and through our eMove® web site.
We believe U-Haul is the most convenient supplier of products and services addressing the needs of North America’s “do-it-yourself” moving and storage market. Our broad geographic coverage throughout the United States and Canada and our extensive selection of U-Haul brand moving equipment rentals, self-storage rooms and related moving and storage products and services provide our customers with convenient “one-stop” shopping.
Since 1945 U-Haul has incorporated sustainable practices into its everyday operations. We believe that our basic business premise of equipment sharing helps reduce greenhouse gas emissions and reduces the need for total large capacity vehicles. We continue to look for ways to reduce waste within our business and are dedicated to manufacturing reusable components and recyclable products. We believe that our commitment to sustainability, through our products and services and everyday operations has helped us to reduce our impact on the environment.
Through Repwest Insurance Company (“Repwest”), our property and casualty insurance subsidiary, we manage the property, liability and related insurance claims processing for U-Haul. Oxford Life Insurance Company (“Oxford”), our life insurance subsidiary, sells life insurance, Medicare supplement insurance, annuities and other related products to non U-Haul customers.
Available Information AMERCO and U-Haul are each incorporated in Nevada. U-Haul’s internet address is uhaul.com. On
AMERCO’s investor relations web site, amerco.com, we post the following filings as soon as practicable after they are electronically filed with or furnished to the United States Securities and Exchange Commission (“SEC”): our Annual Report on Form 10-K, our Quarterly Reports on Form 10-Q, our Current Reports on Form 8-K, our proxy statement related to our annual meeting of stockholders, and any amendments to those reports or statements filed or furnished pursuant to Section 13(a) or 15(d) of the Securities Exchange Act of 1934, as amended (the “Exchange Act”). We also use our investor relations web site as a means of disclosing material non-public information and for complying with our disclosure obligations under Regulation FD. All such filings on our web site are available free of charge. Additionally, you will find these materials on the SEC’s website at sec.gov.

2
Products and Rental Equipment Our customers are primarily “do-it-yourself” household movers. U-Haul moving equipment is
specifically designed, engineered and manufactured for the “do-it-yourself” household mover. These “do-it-yourself” movers include individuals and families moving their belongings from one home to another, college students moving their belongings, vacationers and sports enthusiasts needing extra space or having special towing needs, people trying to save on home furniture and home appliance delivery costs, and “do-it-yourself” home remodeling and gardening enthusiasts who need to transport materials.
As of March 31, 2013, our rental fleet consisted of approximately 112,000 trucks, 90,000 trailers and 34,000 towing devices. This equipment and our U-Haul brand of self-moving products and services are available through our network of managed retail moving centers and independent U-Haul dealers. Independent U-Haul dealers receive rental equipment from the Company, act as rental agents and are paid a commission based on gross revenues generated from their U-Haul rentals.
Our rental truck chassis are manufactured by domestic and foreign truck manufacturers. These chassis are joined with the U-Haul designed and manufactured van boxes primarily at U-Haul operated manufacturing and assembly facilities strategically located throughout the United States. U-Haul rental trucks feature our proprietary Lowest DeckSM, which provides our customers with extra ease of loading. The loading ramps on our trucks are the widest in the industry, which reduce the effort needed to move belongings. Our trucks are fitted with convenient, padded rub rails with tie downs on every interior wall. Our Gentle Ride SuspensionSM helps our customers safely move delicate and prized possessions. Also, the engineers at our U-Haul Technical Center determined that the softest ride in our trucks was at the front of the van box. Consequently, we designed the part of the van box that hangs over the front cab of the truck to be the location for our customers to place their most fragile items during their move. We call this area Mom’s AtticSM.
Our distinctive trailers are also manufactured at these same U-Haul operated manufacturing and assembly facilities. These trailers are well suited to the low profile of many of today’s newly manufactured automobiles. Our engineering staff is committed to making our trailers easy to tow, safe, aerodynamic and fuel efficient.
To provide our self-move customers with added value, our rental trucks and trailers are designed with fuel efficiency in mind. Many of our newer trucks are fitted with fuel economy gauges, another tool that assists our customers in conserving fuel. To help make our rental equipment more reliable, we routinely perform extensive preventive maintenance and repairs.
We also provide customers with equipment to transport their vehicle. We provide two towing options; auto transport, in which all four wheels are off the ground and a tow dolly, in which the front wheels of the towed vehicle are off the ground.
To help our customers load their boxes and larger household appliances and furniture, we offer several accessory rental items. Our utility dolly has a lightweight design and is easy to maneuver. Another rental accessory is our four wheel dolly, which provides a large, flat surface for moving dressers, wall units, pianos and other large household items. U-Haul appliance dollies provide the leverage needed to move refrigerators, freezers, washers and dryers easily and safely. These utility, furniture and appliance dollies, along with the low decks and the wide loading ramps on U-Haul trucks and trailers, are designed for easy loading and unloading of our customers’ belongings.
The total package U-Haul offers the “do-it-yourself” household mover doesn’t end with trucks, trailers and accessory rental items. Our moving supplies include a wide array of affordably priced U-Haul brand boxes, tape and packing materials. We also provide specialty boxes for dishes, computers and sensitive electronic equipment, as well as tape, security locks, and packing supplies. U-Haul brand boxes are specifically sized to make loading easier.

3
We believe that U-Haul is North America’s largest seller and installer of hitches and towing systems. In addition to towing U-Haul equipment, these hitching and towing systems can tow jet skis, motorcycles, boats, campers and horse trailers. Our hitches, ball mounts, and hitch balls undergo stringent testing requirements. Each year, more than one million customers visit our locations for expertise on complete towing systems, trailer rentals and the latest in towing accessories.
U-Haul has one of North America’s largest propane refilling networks, with over 1,080 locations providing this convenient service. We employ trained, certified personnel to refill all propane cylinders and alternative fuel vehicles. Our network of propane dispensing locations is one of the largest automobile alternative refueling networks in North America.
Our self-storage business was a natural outgrowth of our self-moving operations. Conveniently located U-Haul self-storage rental facilities provide clean, dry and secure space for storage of household and commercial goods. Storage units range in size from 6 square feet to over 1,000 square feet. We operate over 1,180 self-storage locations in North America, with nearly 445,000 rentable rooms comprising 40.0 million square feet of rentable storage space. Our self-storage centers feature a wide array of security measures, ranging from electronic property access control gates to individually alarmed storage units. At many centers, we offer climate controlled storage rooms to protect temperature sensitive goods such as video tapes, albums, photographs and precious wood furniture.
Another extension of our strategy to make “do-it-yourself” moving and storage easier is our U-Box® program. A storage container is delivered to a location of our customer’s choosing either by Company personnel or by the customers themselves through the use of a U-Box trailer. This option provides the customer with the greatest scheduling convenience. Once the container is filled it can be stored at the customer’s location, or taken to any of our company operated locations, a participating independent dealer, or moved to a location of the customer’s choice.
Additionally, we offer moving and storage protection packages such as Safemove and Safetow. These programs provide moving and towing customers with a damage waiver, cargo protection and medical and life insurance coverage. Safestor provides protection for storage customers from loss on their goods in storage. For our customers who desire additional coverage over and above the standard Safemove protection, we also offer our Super Safemove product. This package provides the rental customer with a layer of primary liability protection.
We believe that our eMove® web site, eMove.com, is the largest network of customers and independent businesses in the self-moving and self-storage industry. The eMove network consists of channels where customers, businesses and service providers transact business. The eMove Moving Help marketplace connects “do-it-yourself” movers with independent service providers to assist movers in packing, loading, unloading, cleaning, driving and performing other services. Thousands of independent service providers participate in the eMove network.
Through the eMove Storage Affiliate Program, independent storage businesses can join the world’s largest self-storage reservation system. Self-storage customers making a reservation through eMove can access all of the U-Haul self-storage centers and all of our independent storage affiliate partners for even greater convenience to meet their self-storage needs.
Description of Operating Segments AMERCO’s three reportable segments are:
Moving and Storage, comprised of AMERCO, U-Haul, and Real Estate and the subsidiaries of U-Haul and Real Estate,
Property and Casualty Insurance, comprised of Repwest and its subsidiaries and ARCOA, and
Life Insurance, comprised of Oxford and its subsidiaries.
Financial information for each of our operating segments is included in the Notes to Consolidated Financial Statements as part of Item 8: Financial Statements and Supplementary Data of this Annual Report on Form 10-K.

4
Moving and Storage Operating Segments Our Moving and Storage operating segment consists of the rental of trucks, trailers, portable storage
boxes, specialty rental items and self-storage spaces primarily to the household mover as well as sales of moving supplies, towing accessories and propane. Operations are conducted under the registered trade name U-Haul® throughout the United States and Canada.
Net revenue from our Moving and Storage operating segment was approximately 89.1%, 85.8% and 87.7% of consolidated net revenue in fiscal 2013, 2012 and 2011, respectively.
During fiscal 2013, the Company placed approximately 20,800 new trucks in service. These additions and replacements to the fleet were a combination of U-Haul manufactured vehicles and purchases. Typically as new trucks are added to the fleet the Company removes older trucks from the fleet. The total number of rental trucks in the fleet increased during fiscal 2013 as the pace of new additions was slightly greater than those trucks removed for retirement and sale.
Within our truck and trailer rental operation we are focused on expanding our independent dealer network to provide added convenience for our customers. U-Haul maximizes vehicle utilization by effective distribution of the truck and trailer fleets among the approximately 1,490 Company operated centers and approximately 16,400 independent dealers. Utilizing its proprietary reservations management system, the Company’s centers and dealers electronically report their inventory in real-time, which facilitates matching equipment to customer demand. Approximately 54% of all U-Move rental revenue originates from the Company operated centers.
At our owned and operated retail centers we are implementing new initiatives to improve customer service. These initiatives include improving management of our rental equipment to provide our retail centers with the right type of rental equipment, at the right time and at the most convenient location for our customers, effective marketing of our broad line of self-moving related products and services, maintaining longer hours of operation to provide more convenience to our customers, and enhancing our ability to properly staff locations during our peak hours of operations by attracting and retaining “moonlighters” (part-time U-Haul employees with full-time jobs elsewhere) during our peak hours of operation.
Our self-moving related products and services, such as boxes, pads and insurance, help our customers have a better moving experience and help them to protect their belongings from potential damage during the moving process. We are committed to providing a complete line of products selected with the “do-it-yourself” moving and storage customer in mind.
Our self-storage business operations consist of the rental of self-storage rooms, portable storage boxes, sales of self-storage related products, the facilitation of sales of services, and the management of self-storage facilities owned by others.
U-Haul is one of the largest North American operators of self-storage and has been a leader in the self-storage industry since 1974. U-Haul operates nearly 445,000 storage rooms, comprising 40.0 million square feet of storage space with locations in 49 states and 10 Canadian provinces. U-Haul’s owned and managed self-storage facility locations range in size up to 171,200 square feet of storage space, with individual storage units in sizes ranging from 6 square feet to over 1,000 square feet.
The primary market for storage rooms is the storage of household goods. We believe that our self-storage services provide a competitive advantage through such things as Max Security, an electronic system that monitors the storage facility 24 hours a day, climate control, individually alarmed rooms, extended hours access, and an internet-based customer reservation and account management system.
eMove is an online marketplace that connects consumers to independent Moving Help™ service providers and thousands of independent Self-Storage Affiliates. Our network of customer-rated affiliates provides pack and load help, cleaning help, self-storage and similar services all over North America. Our goal is to further utilize our web-based technology platform to increase service to consumers and businesses in the moving and storage market.

5
Our Moving and Storage operating segment business is seasonal and, traditionally, our results of operations and cash flows fluctuate significantly from quarter to quarter. Historically, revenues have been stronger in the first and second fiscal quarters due to the overall increase in moving activity during the spring and summer months. The fourth fiscal quarter is generally our weakest, due to a greater potential for adverse weather conditions.
Property and Casualty Insurance Operating Segment Our Property and Casualty Insurance operating segment provides loss adjusting and claims handling
for U-Haul through regional offices across North America. Our Property and Casualty Insurance operating segment also underwrites components of the Safemove, Safetow, Super Safemove and Safestore protection packages to U-Haul customers. We continue to focus on increasing the penetration of these products into the moving and storage market. The business plan for the Property and Casualty Insurance operating segment includes offering property and casualty products in other U-Haul related programs.
Net revenue from our Property and Casualty Insurance operating segment was approximately 1.9%, 1.6% and 1.7% of consolidated net revenue in fiscal 2013, 2012 and 2011, respectively.
Life Insurance Operating Segment Our Life Insurance operating segment provides life and health insurance products primarily to the
senior market through the direct writing and reinsuring of life insurance, Medicare supplement and annuity policies.
Net revenue from our Life Insurance operating segment was approximately 9.0%, 12.6% and 10.6% of consolidated net revenue in fiscal 2013, 2012 and 2011, respectively.
Employees As of March 31, 2013 and 2012, we employed over 21,600 people and 20,100 people, respectively
throughout North America with approximately 98% of these employees working within our Moving and Storage operating segment and approximately 55% and 54%, respectively of these employees work on a part-time basis.
Sales and Marketing We promote U-Haul brand awareness through direct and co-marketing arrangements. Our direct
marketing activities consist of web based advertising, print and yellow pages as well as trade events, movie cameos of our rental fleet and boxes, and industry and consumer communications. Our rental equipment is our best form of advertisement. We support our independent U-Haul dealers through advertising of U-Haul moving and self-storage rentals, products and services.
Our marketing plan focuses on maintaining our leadership position in the “do-it-yourself” moving and storage industry by continually improving the ease of use and efficiency of our rental equipment, by providing added convenience to our retail centers through independent U-Haul dealers, and by expanding the capabilities of our eMove web sites.
A significant driver of U-Haul’s rental transaction volume is our utilization of an online reservation and sales system, through uhaul.com, eMove.com and our 24-hour 1-800-GO-U-HAUL telephone reservations system. These points of contact are prominently featured and are a major driver of customer lead sources.

6
Competition Moving and Storage Operating Segment
The truck rental industry is highly competitive and includes a number of significant national, regional and local competitors. Generally speaking, we consider there to be two distinct users of rental trucks: commercial and “do-it-yourself” residential users. We primarily focus on the “do-it-yourself” residential user. Within this segment, we believe the principal competitive factors are convenience of rental locations, availability of quality rental moving equipment, breadth of essential products and services, and total cost to the user. Our major national competitors in both the In-Town and one-way moving equipment rental market are Avis Budget Group, Inc. and Penske Truck Leasing. Additionally, we have numerous small local competitors throughout North America who compete with us in the In-Town market.
The self-storage market is large and very fragmented. We believe the principal competitive factors in this industry are convenience of storage rental locations, cleanliness, security and price. Our largest competitors in the self-storage market are Public Storage Inc., Extra Space Storage, Inc., and Sovran Self-Storage Inc.
Insurance Operating Segments The insurance industry is highly competitive. In addition, the marketplace includes financial services
firms offering both insurance and financial products. Some of the insurance companies are owned by stockholders and others are owned by policyholders. Many competitors have been in business for a longer period of time or possess substantially greater financial resources and broader product portfolios than our insurance companies. We compete in the insurance business based upon price, product design, and services rendered to agents and policyholders.
Recent Developments Financial Strength Ratings
In May 2013, A.M. Best affirmed the financial strength rating of B++ (Good) for Oxford and its outlook remains positive.
Repwest maintained a B (Fair) financial strength rating with a stable outlook.
Financial Data of Segment and Geographic Areas For financial data of our segments and geographic areas please see Note 22, Financial Information by
Geographic Area and Note 22A, Consolidating Financial Information by Industry Segment to our Notes to Consolidated Financial Statements. Cautionary Statement Regarding Forward-Looking Statements
This Annual Report on Form 10-K (“Annual Report”), contains “forward-looking statements” regarding future events and our future results of operations. We may make additional written or oral forward-looking statements from time to time in filings with the SEC or otherwise. We believe such forward-looking statements are within the meaning of the safe-harbor provisions of Section 27A of the Securities Act of 1933, as amended, and Section 21E of the Exchange Act. Such statements may include, but are not limited to, projections of revenues, earnings or loss, estimates of capital expenditures, plans for future operations, products or services, financing needs and plans, our perceptions of our legal positions and anticipated outcomes of government investigations and pending litigation against us, liquidity, goals and strategies, plans for new business, storage occupancy, growth rate assumptions, pricing, costs, and access to capital and leasing markets as well as assumptions relating to the foregoing. The words “believe,” “expect,” “anticipate,” “estimate,” “project” and similar expressions identify forward-looking statements, which speak only as of the date the statement was made.
7
Forward-looking statements are inherently subject to risks and uncertainties, some of which we cannot accurately predict or quantify. Factors that could significantly affect results include, without limitation, the risk factors enumerated at the end of this section, as well as the following: our ability to operate pursuant to the terms of its credit facilities; our ability to maintain contracts that are critical to our operations; the costs and availability of financing; our ability to execute our business plan; our ability to attract, motivate and retain key employees; general economic conditions; fluctuations in our costs to maintain and update our fleet and facilities; our ability to refinance our debt; changes in government regulations, particularly environmental regulations; our credit ratings; the availability of credit; changes in demand for our products; changes in the general domestic economy; the degree and nature of our competition; the resolution of pending litigation against us; changes in accounting standards and other factors described in this Annual Report or the other documents we file with the SEC. The above factors, the following disclosures, as well as other statements in this Annual Report and in the Notes to Consolidated Financial Statements, could contribute to or cause such risks or uncertainties, or could cause our stock price to fluctuate dramatically. Consequently, the forward-looking statements should not be regarded as representations or warranties by us that such matters will be realized. We assume no obligation to update or revise any of the forward-looking statements, whether in response to new information, unforeseen events, changed circumstances or otherwise.
Item 1A. Risk Factors
The following discussion of risk factors should be read in conjunction with Management’s Discussion and Analysis of Financial Condition and Results of Operations (“MD&A”) and the Consolidated Financial Statements and related notes. These risk factors may be important in understanding this Annual Report or elsewhere.
We operate in a highly competitive industry. The truck rental industry is highly competitive and includes a number of significant national, regional
and local competitors. We believe the principal competitive factors in this industry are convenience of rental locations, availability of quality rental moving equipment, breadth of essential services and products and total cost. Financial results for the Company can be adversely impacted by aggressive pricing from our competitors. Some of our competitors may have greater financial resources than we have. We cannot assure you that we will be able to maintain existing rental prices or implement price increases. Moreover, if our competitors reduce prices and we are not able or willing to do so as well, we may lose rental volume, which would likely have a materially adverse affect on our results of operations.
The self-storage industry is large and highly fragmented. We believe the principal competitive factors in this industry are convenience of storage rental locations, cleanliness, security and price. Competition in the market areas in which we operate is significant and affects the occupancy levels, rental rates and operating expenses of our facilities. Competition might cause us to experience a decrease in occupancy levels, limit our ability to raise rental rates or require us to offer discounted rates that would have a material affect on results of operations and financial condition. Entry into the self-storage business may be accomplished through the acquisition of existing facilities by persons or institutions with the required initial capital. Development of new self-storage facilities is more difficult however, due to land use, zoning, environmental and other regulatory requirements. The self-storage industry has in the past experienced overbuilding in response to perceived increases in demand. We cannot assure you that we will be able to successfully compete in existing markets or expand into new markets.

8
We are highly leveraged. As of March 31, 2013, we had total debt outstanding of $1,661.8 million and total undiscounted lease
commitments of $236.6 million. Although we believe, based on existing information, that additional leverage can be supported by our operations and revenues, our existing debt could impact us in the following ways among other considerations:
require us to allocate a considerable portion of cash flows from operations to debt service payments;
limit our flexibility in planning for, or reacting to, changes in our business and the industry in which we operate;
limit our ability to obtain additional financing; and
place us at a disadvantage compared to our competitors who may have less debt.
Our ability to make payments on our debt depends upon our ability to maintain and improve our operating performance and generate cash flow. To some extent, this is subject to prevailing economic and competitive conditions and to certain financial, business and other factors, some of which are beyond our control. If we are unable to generate sufficient cash flow from operations to service our debt and meet our other cash needs, we may be forced to reduce or delay capital expenditures, sell assets, seek additional capital or restructure or refinance our indebtedness. If we must sell our assets, it may negatively affect our ability to generate revenue. In addition, we may incur additional debt that would exacerbate the risks associated with our indebtedness.
Economic conditions, including those related to the credit markets, may adversely affect our industry, business and results of operations.
Over the last several years, the United States economy has undergone a period of slowdown and unprecedented volatility, which resulted in a recession. It is difficult to gauge the general economic conditions we will face this year. Consumer and commercial spending is generally affected by the health of the economy, which places some of the factors affecting the success of our business beyond our control. Our industries, although not as traditionally cyclical as some, could experience significant downturns in connection with general economic conditions. In times of declining consumer spending we may be driven, along with our competitors, to reduce pricing which would have a negative impact on gross profit. We cannot predict if another downturn, or sustained lack of recovery, in the economy may occur which could result in reduced revenues and working capital.
Should credit markets in the United States tighten or if interest rates increase significantly we may not be able to refinance existing debt or find additional financing on favorable terms, if at all. If one or more of the financial institutions that support our existing credit facilities fails, we may not be able to find a replacement, which would negatively impact our ability to borrow under credit facilities. While we believe that we have adequate sources of liquidity to meet our anticipated requirement for working capital, debt servicing and capital expenditures through fiscal 2014, if our operating results were to worsen significantly and our cash flows or capital resources prove inadequate, or if interest rates increase significantly, we could face liquidity problems that could materially and adversely affect our results of operations and financial condition.
Our fleet rotation program can be adversely affected by financial market conditions. To meet the needs of our customers, U-Haul maintains a large fleet of rental equipment. Our rental
truck fleet rotation program is funded internally through operations and externally from debt and lease financing. Our ability to fund our routine fleet rotation program could be adversely affected if financial market conditions limit the general availability of external financing. This could lead us to operate trucks longer than initially planned and/or reducing the size of the fleet, either of which could materially and negatively affect our results of operations.

9
Another important aspect of our fleet rotation program is the sale of used rental equipment. The sale of used equipment provides us with funds that can be used to purchase new equipment. Conditions may arise that could lead to the decrease in resale values for our used equipment. This could have a material adverse effect on our financial results, which would result in losses on the sale of equipment and decreases in cash flows from the sales of equipment.
We obtain our rental trucks from a limited number of manufacturers. In recent years, we have purchased the majority of our rental trucks from Ford Motor Company and
General Motors Corporation. Our fleet can be negatively affected by issues our manufacturers may face within their own supply chain. Also, it is possible that our suppliers may face financial difficulties or organizational changes which could negatively impact their ability to accept future orders or fulfill existing orders and we may, at some point, be forced to purchase from other manufacturers. The cost of acquiring new rental trucks could increase materially and negatively affect our ability to rotate new equipment into the fleet. Although we believe that we could contract with alternative manufacturers for our rental trucks, we cannot guarantee or predict how long that would take or if such a decision would result in material cost increases. Ultimately, termination of or changes to our existing relationship with these suppliers could have a material adverse effect on our business, financial condition or results of operations for an indefinite period of time.
We may not be able to effectively hedge against interest rate changes in our variable debt. In certain instances, the Company seeks to manage its exposure to interest rate risk through the use
of hedging instruments including interest rate swap agreements and forward swaps. We enter into these arrangements with counterparties that are significant financial institutions with whom we generally have other financial arrangements. We are exposed to credit risk should these counterparties not be able to perform on their obligations. Additionally, a failure on our part to effectively hedge against interest rate changes may adversely affect our financial condition and results of operations. We are required to record these financial instruments at their fair value. Changes in interest rates can significantly impact the valuation of the instruments resulting in non-cash changes to our financial position.
We are controlled by a small contingent of stockholders. As of March 31, 2013, Edward J. Shoen, President and Chairman of the Board of AMERCO, James P.
Shoen, a director of AMERCO, and Mark V. Shoen collectively are the beneficial owners of 9,139,018 shares (approximately 46.6%) of the outstanding common stock of AMERCO. In addition, Edward J. Shoen, James P. Shoen, Mark V. Shoen, Rosmarie T. Donovan (Trustee of the Shoen Irrevocable Trusts) and David L. Holmes (Successor Trustee of the Irrevocable “C” Trusts) (collectively, the “Reporting Persons”) are parties to a stockholder agreement dated June 30, 2006 in which the Reporting Persons agreed to vote as one as provided in this agreement (the “Stockholder Agreement”). Pursuant to the Stockholder Agreement, a collective 10,897,741 shares (approximately 55.6%) of the Company’s common stock are voted at the direction of a majority in interest of the Reporting Persons. For additional information, refer to the Schedule 13Ds filed on July 13, 2006, March 9, 2007, June 26, 2009 and on May 1, 2013 with the SEC. In addition, 1,450,205 shares (approximately 7.4%) of the outstanding common stock of AMERCO are held by our Employee Savings and Employee Stock Ownership Trust.
As a result of their stock ownership and the Stockholder Agreement, Edward J. Shoen, Mark V. Shoen and James P. Shoen are in a position to significantly influence our business affairs and policies of the Company, including the approval of significant transactions, the election of the members of our Board of Directors (the “Board”) and other matters submitted to our stockholders. There can be no assurance that the interests of the Reporting Persons will not conflict with the interests of our other stockholders. Furthermore, as a result of the Reporting Persons’ voting power, the Company is a “controlled company” as defined in the Nasdaq Listing Rules and, therefore avails itself or may avail itself of certain exemptions under Nasdaq rules, including exemptions from the rules that require us to have (i) a majority of independent directors on the Board; (ii) independent director oversight of executive officer compensation; and (iii) independent director oversight of director nominations.

10
We bear certain risks related to our notes receivable from SAC Holdings. At March 31, 2013, we held $72.4 million of notes receivable from SAC Holdings, which consist of
junior unsecured notes. SAC Holdings is highly leveraged with significant indebtedness to others. If SAC Holdings is unable to meet its obligations to its senior lenders, it could trigger a default of its obligations to us. In such an event of default, we could suffer a loss to the extent the value of the underlying collateral of SAC Holdings is inadequate to repay SAC Holdings senior lenders and our junior unsecured notes. We cannot assure you that SAC Holdings will not default on its loans to its senior lenders or that the value of SAC Holdings assets upon liquidation would be sufficient to repay us in full.
Our quarterly results of operations fluctuate due to seasonality and other factors associated with our industry.
Our business is seasonal and our results of operations and cash flows fluctuate significantly from quarter to quarter. Historically, revenues have been stronger in the first and second fiscal quarters due to the overall increase in moving activity during the spring and summer months. The fourth fiscal quarter is generally weakest, due to a greater potential for adverse weather conditions and other factors that are not necessarily seasonal. As a result, our operating results for any given quarterly period are not necessarily indicative of operating results for an entire year.
Our operations subject us to numerous environmental regulations and the possibility that environmental liability in the future could adversely affect our operations.
Compliance with environmental requirements of federal, state and local governments significantly affects our business. Among other things, these requirements regulate the discharge of materials into the air, land and water and govern the use and disposal of hazardous substances. Under environmental laws or common law principles, we can be held liable for hazardous substances that are found on real property we have owned or operated. We are aware of issues regarding hazardous substances on some of our real estate and we have put in place a remediation plan at each site where we believe such a plan is necessary. See Note 19, Contingencies of the Notes to Consolidated Financial Statements. We regularly make capital and operating expenditures to stay in compliance with environmental laws. In particular, we have managed a testing and removal program since 1988 for our underground storage tanks. Despite these compliance efforts, we believe that the risk of environmental liability is part of the nature of our business.
Environmental laws and regulations are complex, change frequently and could become more stringent in the future. We cannot assure you that future compliance with these regulations, future environmental liabilities, the cost of defending environmental claims, conducting any environmental remediation or generally resolving liabilities caused by us or related third parties will not have a material adverse effect on our business, financial condition or results of operations.
We operate in a highly regulated industry and changes in existing regulations or violations of existing or future regulations could have a material adverse effect on our operations and profitability.
Our truck and trailer rental business is subject to regulation by various federal, state and foreign governmental entities. Specifically, the U.S. Department of Transportation and various state and federal agencies exercise broad powers over our motor carrier operations, safety, and the generation, handling, storage, treatment and disposal of waste materials. In addition, our storage business is also subject to federal, state and local laws and regulations relating to environmental protection and human health and safety. The failure to adhere to these laws and regulations may adversely affect our ability to sell or rent such property or to use the property as collateral for future borrowings. Compliance with changing regulations could substantially impair real property and equipment productivity and increase our costs. In addition, the Federal government may institute some regulation that limits carbon emissions by setting a maximum amount of carbon entities can emit without penalty. This would likely affect everyone who uses fossil fuels and would disproportionately affect users in the highway transportation industries. While there are too many variables at this time to assess the impact of the various proposed federal and state regulations that could affect carbon emissions, many experts believe these proposed rules could significantly affect the way companies operate in their industries.

11
Our ability to attract and retain qualified employees, and changes in laws or other labor issues could adversely affect our business and our results of operations.
The success of our business is predicated upon our workforce providing excellent customer service. Our ability to attract and retain this employee base may be inhibited due to prevailing wage rates, benefit costs and the adoption of new or revised employment and labor laws and regulations. Should this occur we may be unable to provide service in certain areas or we may experience significantly increased costs of labor that could adversely affect our results of operations and financial condition.
We are highly dependent upon our automated systems and the Internet for managing our business.
Our information systems are largely Internet-based, including our point-of-sale reservation system and telephone systems. While our reliance on this technology lowers our cost of providing service and expands our abilities to serve, it exposes us to various risks including natural and man-made disasters. We have put into place backup systems and alternative procedures to mitigate this risk. However, disruptions or breaches in any portion of these systems could adversely affect our results of operations and financial condition.
A.M. Best financial strength ratings are crucial to our life insurance business. In May 2013, A.M. Best affirmed the financial strength rating for Oxford, Christian Fidelity Life
Insurance Company (“CFLIC”), North American Insurance Company (“NAI”) of B++. Oxford’s and CFLIC’s outlook remains positive, whereas NAI’s outlook was stable. Financial strength ratings are important external factors that can affect the success of Oxford’s business plans. Accordingly, if Oxford’s ratings, relative to its competitors, are not maintained or do not continue to improve, Oxford may not be able to retain and attract business as currently planned, which could adversely affect our results of operations and financial condition.
We may incur losses due to our reinsurers’ or counterparties’ failure to perform under existing contracts or we may be unable to secure sufficient reinsurance or hedging protection in the future.
We use reinsurance and derivative contracts to mitigate our risk of loss in various circumstances; primarily at Repwest and for our Moving and Storage operating segment. These agreements do not release us from our primary obligations and therefore we remain ultimately responsible for these potential costs. We cannot provide assurance that these reinsurers or counterparties will fulfill their obligations. Their inability or unwillingness to make payments to us under the terms of the contracts may have a material adverse effect on our financial condition and results of operation.
At December 31, 2012, Repwest reported $1.7 million of reinsurance recoverables, net of allowances and $176.4 million of reserves and liabilities ceded to reinsurers. Of this, Repwest’s largest exposure to a single reinsurer was $72.1 million.
Item 1B. Unresolved Staff Comments We have no unresolved staff comments at March 31, 2013.
Item 2. Properties The Company, through its legal subsidiaries, owns property, plant and equipment that are utilized in
the manufacturing, repair and rental of U-Haul equipment and storage space, as well as providing office space for us. Such facilities exist throughout the United States and Canada. We also manage storage facilities owned by others. We operate approximately 1,490 U-Haul retail centers of which 481 are managed for other owners, and operates 11 manufacturing and assembly facilities. We also operate 150 fixed-site repair facilities located throughout the United States and Canada. These facilities are used primarily for the benefit of our Moving and Storage operating segment.

12
Item 3. Legal Proceedings Shoen
In September 2002, Paul F. Shoen filed a shareholder derivative lawsuit in the Second Judicial District Court of the State of Nevada, Washoe County, captioned Paul F. Shoen vs. SAC Holding Corporation et al., CV 02-05602, seeking damages and equitable relief on behalf of AMERCO from SAC Holdings and certain current and former members of the AMERCO Board of Directors, including Edward J. Shoen, Mark V. Shoen and James P. Shoen as Defendants. AMERCO is named as a nominal Defendant in the case. The complaint alleges breach of fiduciary duty, self-dealing, usurpation of corporate opportunities, wrongful interference with prospective economic advantage and unjust enrichment and seeks the unwinding of sales of self-storage properties by subsidiaries of AMERCO to SAC prior to the filing of the complaint. The complaint seeks a declaration that such transfers are void as well as unspecified damages. In October 2002, the Defendants filed motions to dismiss the complaint. Also in October 2002, Ron Belec filed a derivative action in the Second Judicial District Court of the State of Nevada, Washoe County, captioned Ron Belec vs. William E. Carty, et al., CV 02-06331 and in January 2003, M.S. Management Company, Inc. filed a derivative action in the Second Judicial District Court of the State of Nevada, Washoe County, captioned M.S. Management Company, Inc. vs. William E. Carty, et al., CV 03-00386. Two additional derivative suits were also filed against these parties. Each of these suits is substantially similar to the Paul F. Shoen case. The Court consolidated the five cases and thereafter dismissed these actions in May 2003, concluding that the AMERCO Board of Directors had the requisite level of independence required in order to have these claims resolved by the Board. Plaintiffs appealed this decision and, in July 2006, the Nevada Supreme Court reversed the ruling of the trial court and remanded the case to the trial court for proceedings consistent with its ruling, allowing the Plaintiffs to file an amended complaint and plead in addition to substantive claims, demand futility.
In November 2006, the Plaintiffs filed an amended complaint. In December 2006, the Defendants filed motions to dismiss, based on various legal theories. In March 2007, the Court denied AMERCO’s motion to dismiss regarding the issue of demand futility, stating that “Plaintiffs have satisfied the heightened pleading requirements of demand futility by showing a majority of the members of the AMERCO Board of Directors were interested parties in the SAC transactions.” The Court heard oral argument on the remainder of the Defendants’ motions to dismiss, including the motion (“Goldwasser Motion”) based on the fact that the subject matter of the lawsuit had been settled and dismissed in earlier litigation known as Goldwasser v. Shoen, C.V.N.-94-00810-ECR (D.Nev), Washoe County, Nevada. In addition, in September and October 2007, the Defendants filed Motions for Judgment on the Pleadings or in the Alternative Summary Judgment, based on the fact that the stockholders of the Company had ratified the underlying transactions at the 2007 annual meeting of stockholders of AMERCO. In December 2007, the Court denied this motion. This ruling does not preclude a renewed motion for summary judgment after discovery and further proceedings on these issues. On April 7, 2008, the litigation was dismissed, on the basis of the Goldwasser Motion. On May 8, 2008, the Plaintiffs filed a notice of appeal of such dismissal to the Nevada Supreme Court (the “Court”). On May 20, 2008, AMERCO filed a cross appeal relating to the denial of its Motion to Dismiss in regard to demand futility.
On May 12, 2011, the Nevada Supreme Court affirmed in part, reversed in part, and remanded the case for further proceedings. First, the Court ruled that the Goldwasser settlement did not release claims that arose after the agreement and, therefore, reversed the trial court’s dismissal of the Complaint on that ground. Second, the Court affirmed the district court’s determination that the in pari delicto defense is available in a derivative suit and reversed and remanded to the district court to determine if the defense applies to this matter. Third, the Court remanded to the district court to conduct an evidentiary hearing to determine whether demand upon the AMERCO Board was, in fact, futile. Fourth, the Court invited AMERCO to seek a ruling from the district court as to the legal effect of the AMERCO Shareholders’ 2008 ratification of the underlying AMERCO/SAC transactions.

13
Last, as to individual claims for relief, the Court affirmed the district court’s dismissal of the breach of fiduciary duty of loyalty claims as to all defendants except Mark Shoen. The Court affirmed the district court’s dismissal of the breach of fiduciary duty: ultra vires Acts claim as to all defendants. The Court reversed the district court’s dismissal of aiding and abetting a breach of fiduciary duty and unjust enrichment claims against the SAC entities. The Court reversed the trial court’s dismissal of the claim for wrongful interference with prospective economic advantage as to all defendants.
On remand, on July 22, 2011, AMERCO filed a Motion for Summary Judgment based upon the Shareholder’s Ratification of the SAC transactions. In addition, on August 29, 2011, certain defendants filed a Motion to Dismiss Plaintiffs’ Claim for Wrongful Interference with Prospective Economic Advantage. On August 31, 2011, the trial court held a status conference and entered an order setting forth the briefing schedule for the two motions. On December 23, 2011, the trial court denied AMERCO’s motion for summary judgment and certain defendants’ motion to dismiss. The court set a discovery schedule on the limited issue of demand futility. A four day evidentiary hearing on demand futility was scheduled to begin on August 20, 2012.
On August 6, 2012, Max Belec and Glenbrook Capital Limited Partnership, voluntarily dismissed their complaint with prejudice. On August 20, 2012, the remaining plaintiffs, Paul Shoen and Alan Kahn, dismissed their complaint with prejudice. AMERCO paid none of plaintiffs’ attorneys’ fees or costs. In return, AMERCO released plaintiffs from further related litigation based on plaintiffs’ conduct in this litigation. Moreover, Paul Shoen, Alan Kahn, Grover Wickersham and numerous individuals and entities related to Paul Shoen and Grover Wickersham agreed to sell all of their AMERCO securities in the open market and not sue AMERCO or any of the other defendants for 20 years. If the plaintiffs or the related parties breach this agreement, Paul Shoen will be responsible for $5,000,000 in liquidated damages. The parties filed a final Mutual Release Agreement with the Court on October 16, 2012, thereby terminating the case in its entirety, with prejudice.
Environmental Compliance with environmental requirements of federal, state and local governments may significantly
affect the operation of Real Estate’s business. Among other things, these requirements regulate the discharge of materials into the air, land and water and govern the use and disposal of hazardous substances. Real Estate is aware of issues regarding hazardous substances on some of its properties. Real Estate regularly makes capital and operating expenditures to stay in compliance with environmental laws and has put in place a remedial plan at each site where it believes such a plan is necessary. Since 1988, Real Estate has managed a testing and removal program for underground storage tanks.
Based upon the information currently available to Real Estate, compliance with the environmental laws and its share of the costs of investigation and cleanup of known hazardous waste sites are not expected to result in a material adverse effect on AMERCO’s financial position or results of operations.
Other The Company is named as a defendant in various other litigation and claims arising out of the normal
course of business. In management’s opinion, none of these other matters will individually have a material effect on the Company’s financial position and results of operations.
Item 4. Mine Safety Disclosure Not applicable.
PART II Item 5. Market for the Registrant’s Common Equity, Related Stockholder Matters and Issuer Purchases of Equity Securities
As of May 30, 2013, there were approximately 3,500 holders of record of our common stock. We derived the number of our stockholders using internal stock ledgers and utilizing Mellon Investor Services Stockholder listings. AMERCO’s common stock is listed on the NASDAQ Global Select Market under the trading symbol “UHAL”.

14
The following table sets forth the high and the low sales price of the common stock of AMERCO for the periods indicated:
Years Ended March 31, 2013 2012 High Low High Low First quarter $ 106.71 $ 75.41 $ 103.36 $ 83.90 Second quarter 109.83 87.26 97.25 60.18 Third quarter 126.89 98.74 90.45 60.44 Fourth quarter 178.70 128.42 126.14 89.34
Dividends AMERCO does not have a formal dividend policy. The Board periodically considers the advisability of
declaring and paying dividends to common stockholders in light of existing circumstances. Any past payments of dividends, special or otherwise, is not an indication of a trend on future payments, if any.
On November 7, 2012, the Company declared a special cash dividend on its Common Stock of $5.00 per share to holders of record on November 19, 2012. The dividend was paid on November 30, 2012.
On December 7, 2011, the Company declared a special cash dividend on its Common Stock of $1.00 per share to holders of record on December 23, 2011. The dividend was paid on January 3, 2012.
See Note 21, Statutory Financial Information of Insurance Subsidiaries of the Notes to Consolidated Financial Statements for a discussion of certain statutory restrictions on the ability of the insurance subsidiaries to pay dividends to AMERCO.

15
Performance Graph The following graph compares the cumulative total stockholder return on the Company’s common
stock for the period March 31, 2008 through March 31, 2013 with the cumulative total return on the Dow Jones US Total Market and the Dow Jones US Transportation Average. The comparison assumes that $100 was invested on March 31, 2008 in the Company’s common stock and in each of the comparison indices. The graph reflects the value of the investment based on the closing price of the common stock trading on NASDAQ on March 31, 2009, 2010, 2011, 2012 and 2013.
Fiscal years ended March 31: 2008 2009 2010 2011 2012 2013 AMERCO $ 100 $ 59 $ 95 $ 170 $ 187 $ 321 Dow Jones US Total Market 100 62 95 111 119 136 Dow Jones US Transportation Average 100 57 95 117 118 143
Issuer Purchases of Equity Securities On December 3, 2008, the Board authorized us, using management’s discretion, to buy back shares
from former employees who were participants in our Employee Stock Ownership Plan (“ESOP”). To be eligible for consideration, the employee’s ESOP account balance(s) must be valued at more than $1,000 at the then-prevailing market prices but have less than 100 shares. No such shares have been purchased.

16
On June 1, 2011, we redeemed all 6,100,000 shares of our issued and outstanding Series A 8½% Preferred Stock (“Series A Preferred”) at a redemption price of $25 per share plus accrued d ividends through that date. Pursuant to Financial Accounting Standards Board (“FASB”) Accounting Standards Codification (“ASC”) 260 - Earnings Per Share (“ASC 260”), for earnings per share purposes, we recognized the deficit of the carrying amount of the Series A Preferred over the consideration paid to redeem the shares.
The Series A Preferred was recorded in our Additional Paid-In Capital account, net of original issue costs at $146.3 million prior to the redemption. We paid $152.5 million to redeem the shares on June 1, 2011 of which $7.7 million was paid to our insurance subsidiaries in exchange for their holdings. The difference between what was paid to redeem the shares less their carrying amount on our balance sheet, reduced by our insurance subsidiaries holdings was $5.9 million. This amount was recognized as a reduction to our earnings available to our common shareholders for the purposes of computing earnings per share for fiscal 2012.
From January 1, 2009 through March 31, 2011, our insurance subsidiaries purchased 308,300 shares of Series A Preferred on the open market for $7.2 million. Pursuant to ASC 260 for earnings per share purposes, we recognize the excess or deficit of the carrying amount of the Series A Preferred over the fair value of the consideration paid. For fiscal 2011, this resulted in a $0.2 million charge to net earnings as the amount paid by the insurance companies exceeded the carrying value, net of a prorated portion of original issue costs of the preferred stock.

17
Item 6. Selected Financial Data
The following selected financial data should be read in conjunction with the MD&A, and the Consolidated Financial Statements and related notes in this Annual Report.
Listed below is selected financial data for AMERCO and consolidated subsidiaries for each of the last five years:
Years Ended March 31,
2013 2012 2011 2010 2009
(In thousands, except share and per share data) Summary of Operations: Self-moving equipment rentals $ 1,767,520 $ 1,678,256 $ 1,547,015 $ 1,419,726 $ 1,423,022 Self-storage revenues 152,660 134,376 120,698 110,369 110,548 Self-moving and self-storage products and service sales 221,117 213,854 205,570 198,785 199,394 Property management fees 24,378 23,266 22,132 21,632 23,192 Life insurance premiums 178,115 277,562 206,992 134,345 109,572 Property and casualty insurance premiums 34,342 32,631 30,704 27,625 28,337 Net investment and interest income 82,903 73,552 62,745 60,989 69,845 Other revenue 97,552 78,530 55,503 39,534 40,180
Total revenues 2,558,587 2,512,027 2,251,359 2,013,005 2,004,090 Operating expenses 1,170,568 1,093,190 1,026,577 1,022,061 1,057,880 Commission expenses 228,124 212,190 190,981 169,104 171,303 Cost of sales 107,216 116,542 106,024 104,049 114,387 Benefits and losses 180,676 320,191 200,513 132,105 109,441 Amortization of deferred policy acquisition costs 17,376 13,791 9,494 7,569 12,394 Lease expense 117,448 131,215 150,809 156,951 152,424 Depreciation, net of (gains) losses on disposals (b) 237,996 208,901 189,266 227,629 265,213
Total costs and expenses 2,059,404 2,096,020 1,873,664 1,819,468 1,883,042 Earnings from operations 499,183 416,007 377,695 193,537 121,048
Interest expense (90,696) (90,371) (88,381) (93,347) (98,470) Pretax earnings 408,487 325,636 289,314 100,190 22,578
Income tax expense (143,779) (120,269) (105,739) (34,567) (9,168) Net earnings 264,708 205,367 183,575 65,623 13,410
Less: Excess of redemption value over carrying value of preferred shares redeemed – (5,908) (178) 388 – Less: Preferred stock dividends (a) – (2,913) (12,412) (12,856) (12,963)
Earnings available to common stockholders $ 264,708 $ 196,546 $ 170,985 $ 53,155 $ 447 Basic and diluted earnings per common share $ 13.56 $ 10.09 $ 8.80 $ 2.74 $ 0.02 Weighted average common shares outstanding: Basic and diluted 19,518,779 19,476,187 19,432,781 19,386,791 19,350,041 Cash dividends declared and accrued Preferred stock (a) $ – $ 2,913 $ 12,412 $ 12,856 $ 12,963 Balance Sheet Data: Property, plant and equipment, net $ 2,755,054 $ 2,372,365 $ 2,094,573 $ 1,948,388 $ 2,013,928 Total assets 5,306,601 4,654,051 4,191,433 3,762,454 3,825,073 Notes, loans and leases payable 1,661,845 1,486,211 1,397,842 1,347,635 1,546,490 Stockholders' equity 1,229,259 1,035,820 993,020 812,911 717,629 (a) Fiscal 2012, 2011 and 2010 reflect eliminations of $0.3 million, $0.6 million and $0.1 million, respectivley paid to affiliates.
(b) (Gains) losses were ($22.5) million, ($20.9) million, ($23.1) million, ($2.0) million and $16.6 million for fiscal 2013, 2012, 2011, 2010 and 2009, respectively.
18
Item 7. Management’s Discussion and Analysis of Financial Condition and Results of Operations We begin this MD&A with the overall strategy of AMERCO, followed by a description of and strategy
related to, our operating segments to give the reader an overview of the goals of our businesses and the direction in which our businesses and products are moving. We then discuss our critical accounting policies and estimates that we believe are important to understanding the assumptions and judgments incorporated in our reported financial results. Next, we discuss our results of operations for fiscal 2013 compared with fiscal 2012, and for fiscal 2012 compared with fiscal 2011 which are followed by an analysis of changes in our balance sheets and cash flows, and a discussion of our financial commitments in the sections entitled Liquidity and Capital Resources and Disclosures about Contractual Obligations and Commercial Commitments. We conclude this MD&A by discussing our outlook for fiscal 2014.
This MD&A should be read in conjunction with the other sections of this Annual Report, including Item 1: Business, Item 6: Selected Financial Data and Item 8: Financial Statements and Supplementary Data. The various sections of this MD&A contain a number of forward-looking statements, as discussed under the caption, Cautionary Statements Regarding Forward-Looking Statements, all of which are based on our current expectations and could be affected by the uncertainties and risk factors described throughout this Annual Report and particularly under the section Item 1A: Risk Factors. Our actual results may differ materially from these forward-looking statements.
AMERCO has a fiscal year that ends on the 31st of March for each year that is referenced. Our insurance company subsidiaries have fiscal years that end on the 31st of December for each year that is referenced. They have been consolidated on that basis. Our insurance companies’ financial reporting processes conform to calendar year reporting as required by state insurance departments. Management believes that consolidating their calendar year into our fiscal year financial statements does not materially affect the presentation of financial position or results of operations. We disclose all material events, if any, occurring during the intervening period. Consequently, all references to our insurance subsidiaries’ years 2012, 2011 and 2010 correspond to fiscal 2013, 2012 and 2011 for AMERCO.
Overall Strategy Our overall strategy is to maintain our leadership position in the North American “do-it-yourself”
moving and storage industry. We accomplish this by providing a seamless and integrated supply chain to the “do-it-yourself” moving and storage market. As part of executing this strategy, we leverage the brand recognition of U-Haul with our full line of moving and self-storage related products and services and the convenience of our broad geographic presence.
Our primary focus is to provide our customers with a wide selection of moving rental equipment, convenient self-storage rental facilities and related moving and self-storage products and services. We are able to expand our distribution and improve customer service by increasing the amount of moving equipment and storage rooms and portable storage boxes available for rent, expanding the number of independent dealers in our network and expanding and taking advantage of our eMove capabilities.
Our Property and Casualty Insurance operating segment is focused on providing and administering property and casualty insurance to U-Haul and its customers, its independent dealers and affiliates.
Our Life Insurance operating segment is focused on long-term capital growth through direct writing and reinsuring of life, Medicare supplement and annuity products in the senior marketplace.
Description of Operating Segments AMERCO’s three reportable segments are:
Moving and Storage, comprised of AMERCO, U-Haul, and Real Estate and the subsidiaries of U-Haul and Real Estate,
Property and Casualty Insurance, comprised of Repwest and its subsidiaries and ARCOA,
Life Insurance, comprised of Oxford and its subsidiaries.

19
See Note 1, Basis of Presentation, Note 22, Financial Information by Geographic Area and Note 22A, Consolidating Financial Information by Industry Segment of the Notes to Consolidated Financial Statements included in this Annual Report.
Moving and Storage Operating Segment Our Moving and Storage operating segment consists of the rental of trucks, trailers, portable moving
and storage boxes, specialty rental items and self-storage spaces primarily to the household mover as well as sales of moving supplies, towing accessories and propane. Operations are conducted under the registered trade name U-Haul® throughout the United States and Canada.
With respect to our truck, trailer, specialty rental items and self-storage rental business, we are focused on expanding our dealer network, which provides added convenience for our customers and expanding the selection and availability of rental equipment to satisfy the needs of our customers.
U-Haul brand self-moving related products and services, such as boxes, pads and tape allow our customers to, among other things; protect their belongings from potential damage during the moving process. We are committed to providing a complete line of products selected with the “do-it-yourself” moving and storage customer in mind.
eMove is an online marketplace that connects consumers to independent Moving Help® service providers and thousands of independent Self-Storage Affiliates. Our network of customer rated affiliates and service providers furnish pack and load help, cleaning help, self-storage and similar services, all over North America. Our goal is to further utilize our web-based technology platform to increase service to consumers and businesses in the moving and storage market.
Since 1945 U-Haul has incorporated sustainable practices into its everyday operations. We believe that our basic business premise of equipment sharing helps reduce greenhouse gas emissions and reduces the need for total large capacity vehicles. We continue to look for ways to reduce waste within our business and are dedicated to manufacturing reusable components and recyclable products. We believe that our commitment to sustainability, through our products and services and everyday operations has helped us to reduce our impact on the environment.
Property and Casualty Insurance Operating Segment Our Property and Casualty Insurance operating segment provides loss adjusting and claims handling
for U-Haul through regional offices across North America. Our Property and Casualty Insurance operating segment also underwrites components of the Safemove, Safetow, Super Safemove and Safestor protection packages to U-Haul customers. We continue to focus on increasing the penetration of these products into the moving and storage market. The business plan for our Property and Casualty Insurance operating segment includes offering property and casualty products in other U-Haul related programs.
Life Insurance Operating Segment Our Life Insurance operating segment provides life and health insurance products primarily to the
senior market through the direct writing and reinsuring of life insurance, Medicare supplement and annuity policies.
Critical Accounting Policies and Estimates Our financial statements have been prepared in accordance with the generally accepted accounting
principles (“GAAP”) in the United States. The methods, estimates and judgments we use in applying our accounting policies can have a significant impact on the results we report in our financial statements. Note 3, Accounting Policies of the Notes to Consolidated Financial Statements in Item 8: Financial Statements and Supplementary Data of this Annual Report summarizes the significant accounting policies and methods used in the preparation of our consolidated financial statements and related disclosures. Certain accounting policies require us to make difficult and subjective judgments and assumptions, often as a result of the need to estimate matters that are inherently uncertain.

20
In the following pages we have set forth, with a detailed description, the accounting policies that we deem most critical to us and that require management’s most difficult and subjective judgments. These estimates are based on historical experience, observance of trends in particular areas, information and valuations available from outside sources and on various other assumptions that are believed to be reasonable under the circumstances and which form the basis for making judgments about the carrying values of assets and liabilities that are not readily apparent from other sources. Actual amounts may differ from these estimates under different assumptions and conditions; such differences may be material.
We also have other policies that we consider key accounting policies, such as revenue recognition; however, these policies do not meet the definition of critical accounting estimates, because they do not generally require us to make estimates or judgments that are difficult or subjective. The accounting policies that we deem most critical to us, and involve the most difficult, subjective or complex judgments include the following:
Principles of Consolidation We apply ASC 810 - Consolidation (“ASC 810”) in our principles of consolidation. ASC 810 addresses
arrangements where a company does not hold a majority of the voting or similar interests of a variable interest entity (“VIE”). A company is required to consolidate a VIE if it has determined it is the primary beneficiary. ASC 810 also addresses the policy when a company owns a majority of the voting or similar rights and exercises effective control.
As promulgated by ASC 810, a VIE is not self-supportive due to having one or both of the following conditions: (i) it has an insufficient amount of equity for it to finance its activities without receiving additional subordinated financial support or (ii) its owners do not hold the typical risks and rights of equity owners. This determination is made upon the creation of a variable interest and is re-assessed on an on-going basis should certain changes in the operations of a VIE, or its relationship with the primary beneficiary trigger a reconsideration under the provisions of ASC 810. After a triggering event occurs the facts and circumstances are utilized in determining whether or not a company is a VIE, which other company(s) have a variable interest in the entity, and whether or not the company’s interest is such that it is the primary beneficiary.
We will continue to monitor our relationships with the other entities regarding who is the primary beneficiary, which could change based on facts and circumstances of any reconsideration events.
During the first quarter of fiscal 2013 SAC Holding II fully repaid the $75.0 million outstanding principal balance on its junior note with AMERCO. Pursuant to ASC 810-10-35-4, we considered this a redetermination event which resulted in AMERCO no longer having a variable interest in SAC Holding II. Further, we determined that the repayment of the junior note had no impact on the existing individual operating entity management agreements thereby affirming our finding that these agreements do not constitute variable interests due to the presence of contractual ‘kick-out’ rights. As a result, the reconsideration event had no effect on the consolidation analysis, and thus we have no basis under ASC 810 to consolidate SAC Holding II.
Recoverability of Property, Plant and Equipment Property, plant and equipment are stated at cost. Interest expense incurred during the initial
construction of buildings and rental equipment is considered part of cost. Depreciation is computed for financial reporting purposes using the straight-line or an accelerated method based on a declining balance formula over the following estimated useful lives: rental equipment 2-20 years and buildings and non-rental equipment 3-55 years. We follow the deferral method of accounting based on ASC 908 - Airlines for major overhauls in which engine and transmission overhauls are currently capitalized and amortized over three years. Routine maintenance costs are charged to operating expense as they are incurred. Gains and losses on dispositions of property, plant and equipment are netted against depreciation expense when realized. Equipment depreciation is recognized in amounts expected to result in the recovery of estimated residual values upon disposal, i.e., minimize gains or losses. In determining the depreciation rate, historical disposal experience, holding periods and trends in the market for vehicles are reviewed.
21
We regularly perform reviews to determine whether facts and circumstances exist which indicate that the carrying amount of assets, including estimates of residual value, may not be recoverable or that the useful life of assets are shorter or longer than originally estimated. Reductions in residual values (i.e., the price at which we ultimately expect to dispose of revenue earning equipment) or useful lives will result in an increase in depreciation expense over the life of the equipment. Reviews are performed based on vehicle class, generally subcategories of trucks and trailers. We assess the recoverability of our assets by comparing the projected undiscounted net cash flows associated with the related asset or group of assets over their estimated remaining lives against their respective carrying amounts. We consider factors such as current and expected future market price trends on used vehicles and the expected life of vehicles included in the fleet. Impairment, if any, is based on the excess of the carrying amount over the fair value of those assets. If asset residual values are determined to be recoverable, but the useful lives are shorter or longer than originally estimated, the net book value of the assets is depreciated over the newly determined remaining useful lives.
Management determined that additions to the fleet resulting from purchases should be depreciated on an accelerated method based upon a declining formula. Under the declining balances method (2.4 times declining balance), the book value of a rental truck is reduced approximately 16%, 13%, 11%, 9%, 8%, 7%, and 6% during years one through seven, respectively and then reduced on a straight line basis to a salvage value of 20% by the end of year fifteen. Beginning in October 2012, rental equipment subject to this depreciation schedule will be depreciated to a salvage value of 15%. This change had an immaterial effect on our current financial statements. Comparatively, a standard straight line approach would reduce the book value by approximately 5.7% per year over the life of the truck. For the affected equipment, the accelerated depreciation was $57.0 million, $54.6 million and $44.8 million greater than what it would have been if calculated under a straight line approach for fiscal 2013, 2012 and 2011, respectively.
Although we intend to sell our used vehicles for prices approximating book value, the extent to which we realize a gain or loss on the sale of used vehicles is dependent upon various factors including but not limited to, the general state of the used vehicle market, the age and condition of the vehicle at the time of its disposal and the depreciation rates with respect to the vehicle. We typically sell our used vehicles at our sales centers throughout North America, on our web site at uhaul.com/trucksales or by phone at 1-866-404-0355. Additionally, we sell a large portion of our pickup and cargo van fleet at automobile dealer auctions.
Insurance Reserves Liabilities for life insurance and certain annuity and health policies are established to meet the
estimated future obligations of policies in force, and are based on mortality, morbidity and withdrawal assumptions from recognized actuarial tables which contain margins for adverse deviation. In addition, liabilities for health, disability and other policies include estimates of payments to be made on insurance claims for reported losses and estimates of losses incurred, but not yet reported. Liabilities for annuity contracts consist of contract account balances that accrue to the benefit of the policyholders.
Insurance reserves for our Property and Casualty Insurance operating segment and U-Haul take into account losses incurred based upon actuarial estimates and are management’s best approximation of future payments. These estimates are based upon past claims experience and current claim trends as well as social and economic conditions such as changes in legal theories and inflation. These reserves consist of case reserves for reported losses and a provision for losses incurred but not reported (“IBNR”), both reduced by applicable reinsurance recoverables, resulting in a net liability.
Due to the nature of the underlying risks and high degree of uncertainty associated with the determination of the liability for future policy benefits and claims, the amounts to be ultimately paid to settle these liabilities cannot be precisely determined and may vary significantly from the estimated liability, especially for long-tailed casualty lines of business such as excess workers’ compensation. As a result of the long-tailed nature of the excess workers’ compensation policies written by Repwest during 1983 through 2002, and similar policies assumed by Repwest during 2001 through 2003, it may take a number of years for claims to be fully reported and finally settled.

22
On a regular basis insurance reserve adequacy is reviewed by management to determine if existing assumptions need to be updated. In determining the assumptions for calculating workers’ compensation reserves, management considers multiple factors including the following:
Claimant longevity
Cost trends associated with claimant treatments
Changes in ceding entity and third party administrator reporting practices
Changes in environmental factors including legal and regulatory
Current conditions affecting claim settlements
Future economic conditions including inflation
Significant variables that led to the third quarter of fiscal 2012 reserve strengthening were cost trends associated with claimant treatments, changes related to ceding entity and third party administrator reporting practices, projected longevity of claimants terms and assumptions for future claim settlements.
As part of this latest review, the Company has reserved each claim based upon the accumulation of current claim costs projected through the claimants’ life expectancy, and then adjusted for applicable reinsurance arrangements. Management reviews each claim bi-annually to determine if the estimated life-time claim costs have increased and then adjusts the reserve estimate accordingly at that time. We have factored in an estimate of what the potential cost increases could be in our IBNR liability. We have not assumed settlement of the existing claims in calculating the reserve amount, unless it is in the final stages of completion.
Continued increases in claim costs, including medical inflation and new treatments and medications could lead to future adverse development resulting in additional reserve strengthening. Conversely, settlement of existing claims or if injured workers return to work or expire prematurely, could lead to future positive development.
Impairment of Investments Investments are evaluated pursuant to guidance contained in ASC 320 - Investments - Debt and
Equity Securities to determine if and when a decline in market value below amortized cost is other-than-temporary. Management makes certain assumptions or judgments in its assessment including but not limited to: ability and intent to hold the security, quoted market prices, dealer quotes or discounted cash flows, industry factors, financial factors, and issuer specific information such as credit strength. Other-than-temporary impairment in value is recognized in the current period operating results. We recognized other-than-temporary impairments of $0.1 million and $0.8 million for fiscal 2012 and 2011, respectively. There were no write downs in fiscal 2013.
Income Taxes Our tax returns are periodically reviewed by various taxing authorities. The final outcome of these
audits may cause changes that could materially impact our financial results.
AMERCO files a consolidated tax return with all of its legal subsidiaries.
Fair Values Fair values of cash equivalents approximate carrying value due to the short period of time to maturity.
Fair values of short term investments, investments available-for-sale, long term investments, mortgage loans and notes on real estate, and interest rate swap contracts are based on quoted market prices, dealer quotes or discounted cash flows. Fair values of trade receivables approximate their recorded value.
Our financial instruments that are exposed to concentrations of credit risk consist primarily of temporary cash investments, trade receivables, reinsurance recoverables and notes receivable. Limited credit risk exists on trade receivables due to the diversity of our customer base and their dispersion across broad geographic markets. We place our temporary cash investments with financial institutions and limits the amount of credit exposure to any one financial institution.
23
We have mortgage receivables, which potentially expose us to credit risk. The portfolio of notes is principally collateralized by self-storage facilities and commercial properties. We have not experienced any material losses related to the notes from individual or groups of notes in any particular industry or geographic area. The estimated fair values were determined using the discounted cash flow method and using interest rates currently offered for similar loans to borrowers with similar credit ratings.
The carrying amount of long term debt and short term borrowings are estimated to approximate fair value as the actual interest rate is consistent with the rate estimated to be currently available for debt of similar term and remaining maturity.
Other investments including short term investments are substantially current or bear reasonable interest rates. As a result, the carrying values of these financial instruments approximate fair value.
Subsequent Events Our management has evaluated subsequent events occurring after March 31, 2013, the date of our
most recent balance sheet date, through the date our financial statements were issued. We do not believe any other subsequent events have occurred that would require further disclosure or adjustment to our financial statements other than those stated below.
Financial Strength Ratings In May 2013, A.M. Best affirmed the financial strength rating of B++ (Good) for Oxford and its outlook
remains positive.
Recent Accounting Pronouncements In February 2013, the FASB issued Accounting Standards Update (“ASU”) 2013-02, Reporting of
Amounts Reclassified Out of Accumulated Other Comprehensive Income, an amendment to FASB ASC Topic 220. The update requires disclosure of amounts reclassified out of accumulated other comprehensive income by component. In addition, an entity is required to present either on the face of the statement of operations or in the notes, significant amounts reclassified out of accumulated other comprehensive income by the respective line items of net income but only if the amount reclassified is required to be reclassified to net income in its entirety in the same reporting period. For amounts not reclassified in their entirety to net income, an entity is required to cross-reference to other disclosures that provide additional detail about those amounts. This ASU is effective prospectively for the Company’s fiscal years, and interim periods within those years beginning after December 15, 2012. We do not believe the adoption of this will have a material impact on our financial statements.
Adoption of New Accounting Pronouncements In October 2010, the FASB issued ASU 2010-26, Financial Services – Insurance (Topic 944) (“ASU
2010-26”) which amended FASB ASC 944-30 to provide further guidance regarding the capitalization of costs relating to the acquisition or renewal of insurance contracts. Specifically, only qualifying costs associated with successful contract acquisitions are permitted to be deferred. We adopted ASU 2010-26 in the first quarter of fiscal 2013 and it resulted in a $1.7 million reduction in beginning retained earnings on our financial statements.
In May 2011, the FASB issued ASU 2011-04, Amendments to Achieve Common Fair Value Measurement and Disclosure Requirements in U.S. GAAP and International Financial Reporting Standards (“IFRS”) (“ASU 2011-04”). This pronouncement was issued to provide a consistent definition of fair value and ensure that the fair value measurement and disclosure requirements are similar between U.S. GAAP and IFRS. ASU 2011-04 changes certain fair value measurement principles and enhances the disclosure requirements particularly for Level 3 fair value measurements. We adopted ASU 2011-04 in the first quarter of fiscal 2013 and it did not have a material impact on our financial statements.

24
In July 2012, the FASB issued ASU 2012-02, Intangibles – Goodwill and Others (Topic 350) (“ASU 2012-02”) which allows an entity to first assess qualitative factors to determine whether it is necessary to perform a quantitative impairment test of an indefinite-lived intangible asset. Per the terms of ASU 2012-02, an entity would not be required to calculate the fair value of an indefinite-lived intangible asset unless the entity determines, based on qualitative assessment, that it is not more likely than not, the indefinite-lived intangible asset is impaired. We adopted ASU 2012-02 in the third quarter of fiscal 2013 and it did not have a material impact on our financial statements.
From time to time, new accounting pronouncements are issued by the FASB or the SEC that are adopted by the Company as of the specified effective date. Unless otherwise discussed, these ASU’s entail technical corrections to existing guidance or affect guidance related to specialized industries or entities and therefore will have minimal, if any, impact on our financial position or results of operations upon adoption.
AMERCO and Consolidated Subsidiaries Fiscal 2013 Compared with Fiscal 2012
Listed below, on a consolidated basis, are revenues for our major product lines for fiscal 2013 and fiscal 2012:
Year Ended March 31, 2013 2012 (In thousands)
Self-moving equipment rentals $ 1,767,520 $ 1,678,256 Self-storage revenues 152,660 134,376 Self-moving and self-storage products and service sales 221,117 213,854 Property management fees 24,378 23,266 Life insurance premiums 178,115 277,562 Property and casualty insurance premiums 34,342 32,631 Net investment and interest income 82,903 73,552 Other revenue 97,552 78,530
Consolidated revenue $ 2,558,587 $ 2,512,027
Self-moving equipment rental revenues increased $89.3 million for fiscal 2013, compared with fiscal 2012. Growth in In-Town and one-way transactions was the most significant factor influencing the growth in revenues during fiscal 2013. Truck, trailers and towing devices all experienced transaction and revenue growth as compared to fiscal 2012. We believe the improvement in revenue occurred in conjunction with growth in our independent dealer network, expansion of company operated locations and an increase in the number of trucks and trailers in the fleet. Our focus continues to be on improving the rental experience for our customers through the availability of equipment, convenient access to rental locations and ease of the rental process.
Self-storage revenues increased $18.3 million for fiscal 2013, compared with fiscal 2012. Average monthly occupancy for fiscal 2013 increased by 1.6 million square feet compared to the same period last year. These occupancy gains have come from a combination of improvements at existing locations as well as the acquisition of new facilities. Over the last twelve months we have added approximately 2.1 million net rentable square feet.
Sales of self-moving and self-storage products and services increased $7.3 million for fiscal 2013, compared with fiscal 2012. Increases were recognized from the sale of moving supplies as well as towing accessories and installation.
Property management fees increased $1.1 million for fiscal 2013, compared with fiscal 2012. The calculation of these fees is largely based upon revenues collected at the facilities managed by the Company. As these underlying revenues increase, the fees we collect for management services increase as well.

25
Life insurance premiums decreased $99.4 million for fiscal 2013, compared with fiscal 2012. During fiscal 2012 we purchased a block of life insurance policies which resulted in the recording of $83.4 million of premium upon acquisition; fiscal 2013 did not include a similar acquisition.
Property and casualty insurance premiums increased $1.7 million for fiscal 2013, compared with fiscal 2012 primarily from policies sold in conjunction with U-Haul rental transactions. As moving transactions have increased this year so have the related premiums.
Net investment and interest income increased $9.4 million for fiscal 2013, compared with fiscal 2012. Realized gains from mortgage loans held for investment were approximately $13.2 million. The Life Insurance operating segment reported additional interest income resulting from a larger invested asset portfolio. Partially offsetting this was a decrease resulting from the first quarter of fiscal 2013 SAC Holdings repayment to AMERCO of $127.3 million for notes and interest outstanding. These notes carried interest rates of 9% and the loss of this yield caused an $11.0 million decline in interest income for fiscal 2013.
Other revenue increased $19.0 million for fiscal 2013, compared with fiscal 2012 primarily from the expansion of new business initiatives including our U-Box program.
As a result of the items mentioned above, revenues for AMERCO and its consolidated entities were $2,558.6 million for fiscal 2013 as compared with $2,512.0 million for fiscal 2012.
Listed below are revenues and earnings (loss) from operations at each of our operating segments for fiscal 2013 and 2012. The insurance companies’ years ended December 31, 2012 and 2011.
Year Ended March 31, 2013 2012 (In thousands)
Moving and storage Revenues $ 2,282,342 $ 2,156,923 Earnings from operations before equity in earnings of subsidiaries 462,328 432,766
Property and casualty insurance Revenues 48,200 42,586 Earnings (loss) from operations 14,194 (36,426)
Life insurance Revenues 231,490 317,274 Earnings from operations 22,955 20,149
Eliminations Revenues (3,445) (4,756) Earnings from operations before equity in earnings of subsidiaries (294) (482)
Consolidated Results Revenues 2,558,587 2,512,027 Earnings from operations 499,183 416,007
Total costs and expenses decreased $36.6 million for fiscal 2013 as compared to fiscal 2012. Our Life Insurance operating segment accounted for $88.6 million of the decrease primarily due to the decline in business acquisitions. Our Property and Casualty Insurance operating segment accounted for $45.0 million of the decrease. The third quarter of fiscal 2012 included $48.3 million of charges related to excess workers’ compensation reserves and reinsurance contracts;; these charges did not recur in fiscal 2013.

26
Total costs and expenses at the Moving and Storage operating segment increased $95.9 million for fiscal 2013 as compared to fiscal 2012. Operating expenses increased $74.9 million primarily from spending on personnel, accruals for liability costs, legal expense, property taxes and operating costs associated with the U-Box program. Commission expenses increased in relation to the associated revenues. Cost of sales declined due to a reduction in the price of propane combined with a reduction in the volume purchased. Depreciation expense, net, increased $29.1 million while lease expense decreased $14.8 million as a result of the Company’s shift in financing new equipment on the balance sheet versus through operating leases.
As a result of the above mentioned changes in revenues and expenses, earnings from operations increased to $499.2 million for fiscal 2013, compared with $416.0 million for fiscal 2012.
Interest expense for fiscal 2013 was $90.7 million, compared with $90.4 million for fiscal 2012 due to an increase in average borrowings partially offset by a decrease in average borrowing costs.
Income tax expense was $143.8 million for fiscal 2013, compared with $120.3 million for fiscal 2012. The increase was due to higher pretax earnings for fiscal 2013.
Dividends accrued or paid on our Series A Preferred were $2.9 million for fiscal 2012. There were no payments made or accrued in fiscal 2013. All of the Series A Preferred stock was redeemed on June 1, 2011; therefore, no dividends were accrued in fiscal 2013. Fiscal 2012 included a $5.9 million non-recurring charge related to the redemption of the Series A Preferred Stock.
As a result of the above mentioned items, earnings available to common shareholders were $264.7 million for fiscal 2013, compared with $196.5 million for fiscal 2012.
Basic and diluted earnings per common share for fiscal 2013 were $13.56, compared with $10.09 for fiscal 2012.
The weighted average common shares outstanding basic and diluted were 19,518,779 for fiscal 2013, compared with 19,476,187 for fiscal 2012.
Fiscal 2012 Compared with Fiscal 2011 Listed below, on a consolidated basis, are revenues for our major product lines for fiscal 2012 and
fiscal 2011:
Year Ended March 31, 2012 2011 (In thousands)
Self-moving equipment rentals $ 1,678,256 $ 1,547,015 Self-storage revenues 134,376 120,698 Self-moving and self-storage products and service sales 213,854 205,570 Property management fees 23,266 22,132 Life insurance premiums 277,562 206,992 Property and casualty insurance premiums 32,631 30,704 Net investment and interest income 73,552 62,745 Other revenue 78,530 55,503 Consolidated revenue $ 2,512,027 $ 2,251,359
Self-moving equipment rental revenues increased $131.2 million for fiscal 2012, compared with fiscal 2011. The largest contributor to the revenue improvement was the increase in both In-Town and one-way moving transactions across both our truck and trailer fleets. We believe the growth in the number of transactions was influenced by our continuing customer service enhancements which allowed us to better serve the existing customer base combined with an increase in overall demand for our services. We were also better able to serve our customers through an increase in the amount of equipment in our fleet throughout the year. Other factors that contributed to the revenue improvement included an increase in our average revenue per transaction and utilization of the fleet. Factors which contribute to changes in revenue per transaction include the mix of equipment type rented and rental rates charged.

27
Self-storage revenues increased $13.7 million for fiscal 2012, compared with fiscal 2011 due primarily to an increase in the number of rooms rented combined with a modest improvement in overall rates per occupied square foot. The average amount of occupied square feet increased by approximately 10% for fiscal 2012 compared to the same period last year. A portion of this improvement comes from the additional capacity added to the portfolio; total net rentable square feet increased by 1.4 million over the last twelve months.
Sales of self-moving and self-storage products and services increased $8.3 million for fiscal 2012, compared with fiscal 2011. Increases were recognized in the sale of propane and towing accessories/installation with the majority of the improvement coming from the sales of moving supplies.
Life insurance premiums increased $70.6 million for fiscal 2012, compared with fiscal 2011 primarily from entering into a new reinsurance agreement for a block of life insurance policies combined with increased Medicare supplement premiums from last year’s acquisition.
Property and casualty insurance premiums increased $1.9 million for fiscal 2012, compared with fiscal 2011 due to increases in Safestor and Safemove which resulted from the increase in equipment rental transactions and self storage rentals.
Net investment and interest income increased $10.8 million for fiscal 2012, compared with fiscal 2011 primarily due to an increased asset base at the Life Insurance operating segment combined with improved yields across all three segments due to the investment of excess cash balances.
Other revenue increased $23.0 million for fiscal 2012, compared with fiscal 2011 primarily due to the expansion of new business initiatives including our U-Box program.
As a result of the items mentioned above, revenues for AMERCO and its consolidated subsidiaries were $2,512.0 million for fiscal 2012, compared with $2,251.4 million for fiscal 2011.
Listed below are revenues and earnings (loss) from operations at each of our operating segments for fiscal 2012 and 2011. The insurance companies’ years ended December 31, 2011 and 2010.
Year Ended March 31, 2012 2011 (In thousands)
Moving and storage Revenues $ 2,156,923 $ 1,977,826 Earnings from operations before equity in earnings of subsidiaries 432,766 355,173
Property and casualty insurance Revenues 42,586 38,663 Earnings from operations (36,426) 5,638
Life insurance Revenues 317,274 239,995 Earnings from operations 20,149 17,435
Eliminations Revenues (4,756) (5,125) Earnings from operations before equity in earnings of subsidiaries (482) (551)
Consolidated Results Revenues 2,512,027 2,251,359 Earnings from operations 416,007 377,695
Total costs and expenses increased $222.4 million for fiscal 2012, compared with fiscal 2011. The Life Insurance operating segment accounted for $74.6 million of the increase primarily due to entering into the new reinsurance agreement. The Property and Casualty Insurance operating segment accounted for $46.0 million of the increase largely due to the reserve increases associated with their closed block of workers’ compensation policies.

28
Operating expenses for the Moving and Storage operating segment increased $101.5 million due largely to spending on personnel, rental equipment maintenance and operating costs associated with the U-Box program. Cost of sales and commission expenses increased in relation to the associated revenues. Depreciation expense, before gains on the disposal of equipment, increased $17.5 million while lease expense decreased $19.6 million. Over the last several years the Company has decreased its use of operating leases for funding new equipment acquisitions and increased its use of term loans and securitizations, which are the primary causes of the decrease in lease expense and increase in depreciation expense.
As a result of the above mentioned changes in revenues and expenses, earnings from operations increased to $416.0 million for fiscal 2012, compared with $377.7 million for fiscal 2011.
Interest expense for fiscal 2012 was $90.4 million, compared with $88.4 million for fiscal 2011 due to an increase in average borrowings partially offset by a decrease in average borrowing costs.
Income tax expense was $120.3 million for fiscal 2012, compared with $105.7 million for fiscal 2011. The increase was due to higher pretax earnings for fiscal 2012.
Dividends paid or accrued on our Series A Preferred were $2.9 million and $12.4 million for fiscal 2012 and 2011, respectively. Fiscal 2012 included a $5.9 million non-recurring charge related to the redemption of the Series A Preferred Stock. All of our Series A Preferred stock was redeemed on June 1, 2011; therefore, no dividends were accrued with respect to the Series A Preferred for the second, third and fourth quarters of fiscal 2012.
As a result of the above mentioned items, earnings available to common shareholders were $196.5 million for fiscal 2012, compared with $171.0 million for fiscal 2011.
Basic and diluted earnings per common share for fiscal 2012 were $10.09, compared with $8.80 for fiscal 2011.
The weighted average common shares outstanding basic and diluted were 19,476,187 for fiscal 2012, compared with 19,432,781 for fiscal 2011.
Moving and Storage Fiscal 2013 Compared with Fiscal 2012
Listed below are revenues for the major product lines at our Moving and Storage operating segment for fiscal 2013 and fiscal 2012:
Year Ended March 31, 2013 2012 (In thousands)
Self-moving equipment rentals $ 1,769,058 $ 1,679,963 Self-storage revenues 152,660 134,376 Self-moving and self-storage products and service sales 221,117 213,854 Property management fees 24,378 23,266 Net investment and interest income 18,622 27,132 Other revenue 96,507 78,332
Moving and Storage revenue $ 2,282,342 $ 2,156,923
Self-moving equipment rental revenues increased $89.1 million for fiscal 2013 as compared to fiscal 2012. Growth in In-Town and one-way transactions was the single largest driver of growth in revenues during fiscal 2013. Truck, trailers and towing devices all experienced transaction and revenue growth as compared to fiscal 2012. We believe the improvement in revenue occurred in conjunction with growth in our independent dealer network, expansion of company operated locations and an increase in the number of trucks and trailers in the fleet. Our focus continues to be on improving the rental experience for our customers through the availability of equipment, convenient access to rental locations and ease of the rental process.

29
Self-storage revenues increased $18.3 million for fiscal 2013, compared with fiscal 2012. Average monthly occupancy for fiscal 2013 increased by 1.6 million square feet compared to the same period last year. These occupancy gains have come from a combination of improvements at existing locations as well as the acquisition of new facilities. Over the last twelve months we have added approximately 2.1 million net rentable square feet.
Sales of self-moving and self-storage products and services increased $7.3 million for fiscal 2013 as compared to fiscal 2012. We earned increases from the sale of moving supplies as well as towing accessories and installation.
Property management fees increased $1.1 million for fiscal 2013 as compared to fiscal 2012. The calculation of these fees is largely based upon revenues collected at the facilities managed by the Company. As these underlying revenues increase, the fees we collect for management services increase as well.
Net investment and interest income decreased $8.5 million for fiscal 2013 as compared to fiscal 2012. During the first quarter of fiscal 2013, SAC Holdings repaid AMERCO $127.3 million for notes and interest outstanding. These notes carried interest rates of 9% and the loss of this yield caused an $11.0 million decline in interest income for fiscal 2013 as compared to fiscal 2012. This decline was partially offset by gains from mortgage loans held for investment at the Moving and Storage operating segment.
Other revenue increased $18.2 million for fiscal 2013 as compared to fiscal 2012 primarily from the expansion of new business initiatives including our U-Box program.
The Company owns and manages self-storage facilities. Self-storage revenues reported in the consolidated financial statements represent Company-owned locations only. Self-storage data for our owned storage locations follows:
Year Ended March 31, 2013 2012 (In thousands, except occupancy rate) Room count as of March 31 186 165 Square footage as of March 31 16,034 13,889 Average monthly number of rooms occupied 139 123 Average monthly occupancy rate based on room count 78.7% 76.9% Average monthly square footage occupied 11,999 10,401
Total costs and expenses increased $95.9 million for fiscal 2013 as compared to fiscal 2012. Operating expenses increased $74.9 million primarily from spending on personnel, accruals for liability costs, legal expense, property taxes and operating costs associated with the U-Box program. Commission expenses increased in relation to the associated revenues. Cost of sales declined due to a reduction in the price of propane combined with a reduction in the volume purchased. Depreciation expense, net, increased $29.1 million while lease expense decreased $14.8 million as a result of the Company’s shift in financing new equipment on the balance sheet versus through operating leases.
During the third quarter of fiscal 2013 Hurricane Sandy struck the Northeastern portion of the United States interrupting business at approximately 100 stores. All of these stores were operational within a few days, but for the most part, required some additional time to reach full operational strength. We estimated losses related to destroyed rental equipment of approximately $0.8 million and this was recorded as an expense in the third quarter. We maintain property and business interruption insurance coverage with independent third parties to mitigate the financial impact of these types of catastrophic events. Our insurance deductible is $0.3 million and this was recorded as an expense in the third quarter.
As a result of the above mentioned changes in revenues and expenses, earnings from operations for the Moving and Storage operating segment before consolidation of the equity in the earnings of the insurance subsidiaries increased to $462.3 million for fiscal 2013 as compared with $432.8 million for fiscal 2012.
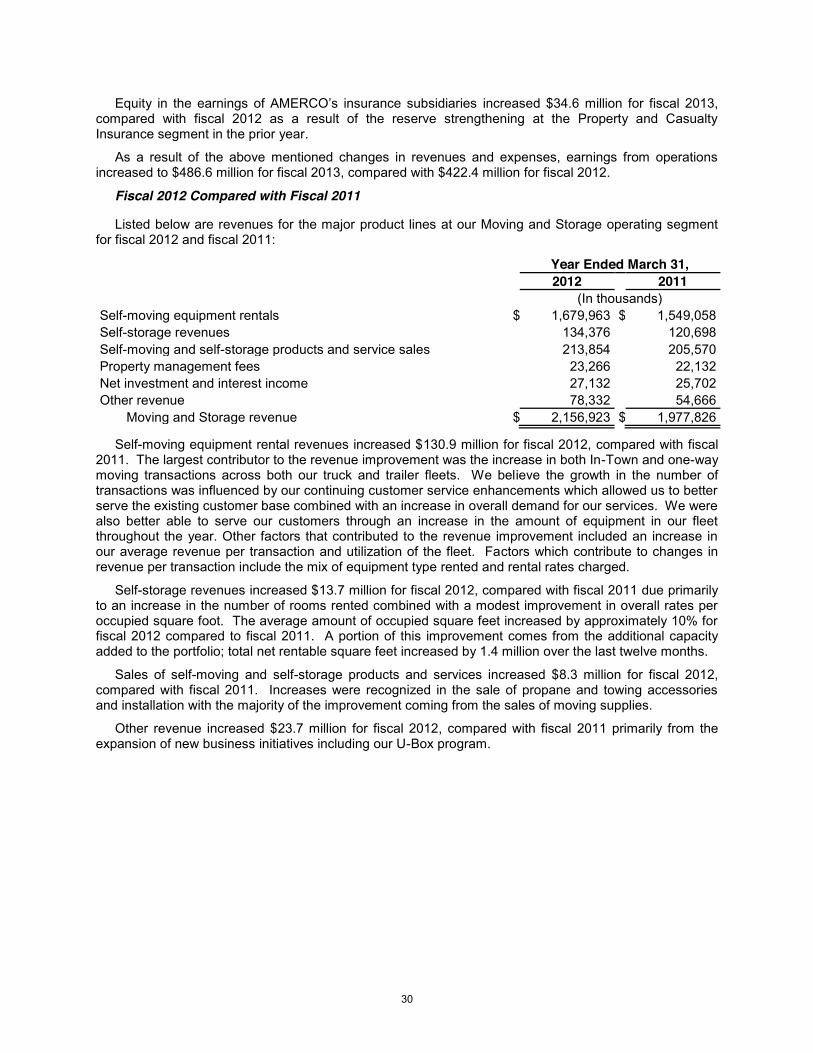
30
Equity in the earnings of AMERCO’s insurance subsidiaries increased $34.6 million for fiscal 2013, compared with fiscal 2012 as a result of the reserve strengthening at the Property and Casualty Insurance segment in the prior year.
As a result of the above mentioned changes in revenues and expenses, earnings from operations increased to $486.6 million for fiscal 2013, compared with $422.4 million for fiscal 2012.
Fiscal 2012 Compared with Fiscal 2011
Listed below are revenues for the major product lines at our Moving and Storage operating segment for fiscal 2012 and fiscal 2011:
Year Ended March 31, 2012 2011 (In thousands)
Self-moving equipment rentals $ 1,679,963 $ 1,549,058 Self-storage revenues 134,376 120,698 Self-moving and self-storage products and service sales 213,854 205,570 Property management fees 23,266 22,132 Net investment and interest income 27,132 25,702 Other revenue 78,332 54,666
Moving and Storage revenue $ 2,156,923 $ 1,977,826
Self-moving equipment rental revenues increased $130.9 million for fiscal 2012, compared with fiscal 2011. The largest contributor to the revenue improvement was the increase in both In-Town and one-way moving transactions across both our truck and trailer fleets. We believe the growth in the number of transactions was influenced by our continuing customer service enhancements which allowed us to better serve the existing customer base combined with an increase in overall demand for our services. We were also better able to serve our customers through an increase in the amount of equipment in our fleet throughout the year. Other factors that contributed to the revenue improvement included an increase in our average revenue per transaction and utilization of the fleet. Factors which contribute to changes in revenue per transaction include the mix of equipment type rented and rental rates charged.
Self-storage revenues increased $13.7 million for fiscal 2012, compared with fiscal 2011 due primarily to an increase in the number of rooms rented combined with a modest improvement in overall rates per occupied square foot. The average amount of occupied square feet increased by approximately 10% for fiscal 2012 compared to fiscal 2011. A portion of this improvement comes from the additional capacity added to the portfolio; total net rentable square feet increased by 1.4 million over the last twelve months.
Sales of self-moving and self-storage products and services increased $8.3 million for fiscal 2012, compared with fiscal 2011. Increases were recognized in the sale of propane and towing accessories and installation with the majority of the improvement coming from the sales of moving supplies.
Other revenue increased $23.7 million for fiscal 2012, compared with fiscal 2011 primarily from the expansion of new business initiatives including our U-Box program.

31
The Company owns and manages self-storage facilities. Self-storage revenues reported in the consolidated financial statements represent Company-owned locations only. Self-storage data for our owned storage locations follows:
Year Ended March 31, 2012 2011 (In thousands, except occupancy rate) Room count as of March 31 165 153 Square footage as of March 31 13,889 12,534 Average monthly number of rooms occupied 123 113 Average monthly occupancy rate based on room count 76.9% 75.8% Average monthly square footage occupied 10,401 9,437
Total costs and expenses increased $101.5 million for fiscal 2012, compared with fiscal 2011. Operating expenses increased $69.8 million due largely to spending on personnel, rental equipment maintenance and operating costs associated with the U-Box program. Cost of sales and commission expenses increased in relation to the associated revenues. Depreciation expense, before gains on the disposal of equipment, increased $17.5 million while lease expense decreased $19.6 million. Over the last several years the Company has decreased its use of leases for funding new equipment acquisitions and increased its use of term loans and securitizations, which are the primary causes of the decrease in lease expense and increase in depreciation expense.
As a result of the above mentioned changes in revenues and expenses, earnings from operations for the Moving and Storage operating segment before consolidation of the equity in the earnings of the insurance subsidiaries, increased to $432.8 million for fiscal 2012, compared with $355.2 million for the fiscal 2011.
Equity in the earnings of AMERCO’s insurance subsidiaries decreased $25.3 million for fiscal 2012, compared with fiscal 2011 as a result of the reserve strengthening at the Property and Casualty Insurance operating segment.
As a result of the above mentioned changes in revenues and expenses, earnings from operations increased to $422.4 million for fiscal 2012, compared with $370.1 million for fiscal 2011.
Property and Casualty Insurance 2012 Compared with 2011
Net premiums were $34.3 million and $32.6 million for the years ended December 31, 2012 and 2011, respectively. A significant portion of Repwest’s premiums are from policies sold in conjunction with U-Haul rental transactions. The increase corresponded with the increased moving and storage transactions at U-Haul.
Net investment income was $13.9 million and $10.0 million for the years ended December 31, 2012 and 2011, respectively. The increase was due to $4.6 million of gains on mortgage loans offset by a $0.8 million decrease in real estate income.
Net operating expenses were $18.0 million and $13.3 million for the years ended December 31, 2012 and 2011. The increase was primarily due to a $4.1 million write-off for reinsurance deemed uncollectible combined with $0.7 million in legal fees related to this transaction.
Benefits and losses incurred were $16.0 million and $65.7 million for the years ended December 31, 2012 and 2011, respectively. The decrease was primarily due to reserve strengthening in 2011 on terminated workers’ compensation programs originally written or reinsured between 1983 and 2003. Losses in this line of business increased $53.8 million of which $48.3 million was recognized in the third quarter of fiscal 2012.
As a result of the above mentioned changes in revenues and expenses, pretax earnings (loss) from operations were $14.2 million and ($36.4) million for the years ended December 31, 2012 and 2011, respectively.
32
Property and Casualty Insurance 2011 Compared with 2010
Net premiums were $32.6 million and $30.7 million for the years ended December 31, 2011 and 2010, respectively. A portion of Repwest’s premiums are from policies sold in conjunction with U-Haul rental transactions. The increase corresponded with the increased moving and storage transactions at U-Haul.
Net investment income was $10.0 million and $8.0 million for the years ended December 31, 2011 and 2010, respectively. The increase was due to $1.0 million of gains on assets disposed and higher returns from assets invested in mortgage loans.
Net operating expenses were $13.3 million and $15.8 million for the years ended December 31, 2011 and 2010. The decrease was due to a $1.1 million payment related to an excess workers’ compensation treaty payment in 2010 with no similar expense in 2011 and a $1.2 million decrease in net loss adjusting expense in 2011.
Benefits and losses incurred were $65.7 million and $17.2 million for the years ended December 31, 2011 and 2010, respectively. The increase was primarily due to reserve strengthening on terminated workers’ compensation programs originally written or reinsured between 1983 and 2003. Losses in this line of business increased $53.8 million of which $48.3 million was recognized in the third quarter of fiscal 2012. The Company determined that claims have been developing much more adversely than previously anticipated. A combination of issues including medical inflation, additional treatments, longer claim terms and underestimation of claims costs by third party administrators and reinsurers contributed to these adjustments. These updated assumptions led to the revision in the Company’s loss assumptions for this business.
As a result of the above mentioned changes in revenues and expenses, pretax earnings (loss) from operations were ($36.4) million and $5.6 million for the years ended December 31, 2011 and 2010, respectively.
Life Insurance 2012 Compared with 2011
Net premiums were $178.1 million and $277.6 million for the years ended December 31, 2012 and 2011, respectively. During the third quarter of 2011 Oxford entered into a coinsurance arrangement for a block of whole life insurance policies resulting in a one-time increase in premiums of $83.5 million due to the transfer of liabilities. Medicare supplement premiums decreased by $9.5 million compared to the prior year while premiums from other products including life insurance decreased $6.5 million. New business activity in 2012 shifted more towards annuity policies with sales of these products accounted for as deposits on the balance sheet instead of premium income. Annuity deposits increased by $258.5 million compared to 2011.
Net investment income was $50.9 million and $38.1 million for the years ended December 31, 2012 and 2011, respectively. There was an increase of $13.8 million of investment income due to a larger invested asset base and gains on matured mortgage loans purchased at discounts. This was offset by a decrease in realized gains recognized on investments of $0.9 million.
Net operating expenses were $26.5 million and $28.9 million for the years ended December 31, 2012 and 2011, respectively. The variance was due to a reduced Medicare supplement and single premium whole life commissions resulting from a decline in the Medicare supplement policy base along with lower new sales of the life product.
Benefits and losses incurred were $164.7 million and $254.4 million for the years ended December 31, 2012 and 2011, respectively. During the third quarter of 2011 Oxford entered into the coinsurance arrangement for the block of whole life insurance policies resulting in a one-time increase in benefits of $83.5 million due to the transfer of liabilities. Medicare supplement benefits decreased by $9.9 million from a reduction of policies in-force and improved benefit ratios. As a result of the growth in annuity deposits, interest credited to policyholders increased $3.2 million.

33
Amortization of deferred acquisition costs (“DAC”), sales inducement asset (“SIA”) and the value of business acquired (“VOBA”) was $17.4 million and $13.8 million for the years ended December 31, 2012 and 2011, respectively. This was primarily due to amortization related to increased annuity sales and in-force life insurance policies.
As a result of the above mentioned changes in revenues and expenses, pretax earnings from operations were $23.0 million and $20.1 million for the years ended December 31, 2012 and 2011, respectively.
Life Insurance 2011 Compared with 2010
Net premiums were $277.6 million and $207.0 million for the years ended December 31, 2011 and 2010, respectively. During 2011 we entered in a coinsurance arrangement for a block of whole life policies resulting in a one-time increase in premiums of $83.5 million due to the transfer of liabilities. Likewise, 2010 included a $30.8 million increase in premiums related to a coinsurance agreement entered into for a block of final expense whole life policies acquired. Medicare supplement premiums increased $27.1 million, of which $32.6 million was attributable to the 2010 acquisition of a block of existing policies. This was offset by policy terminations which exceeded rate increases on existing business. Other life insurance premiums and annuitizations accounted for a decrease of $9.1 million during the year.
Net investment income was $38.1 million and $30.8 million for the years ended December 31, 2011 and 2010, respectively. The increase was due to an additional $2.9 million in gains on the sale of securities and increased income due to a larger invested asset base.
Net operating expenses were $28.9 million and $29.8 million for the years ended December 31, 2011 and 2010, respectively. An increase in general administrative and commission expense related to current year annuity sales and last year’s Medicare supplement acquisition was offset by a reduction in life insurance commissions.
Benefits and losses incurred were $254.4 million and $183.3 million for the years ended December 31, 2011 and 2010, respectively. There was a net increase of $52.7 million in Life benefits due to the transfer of liabilities for the coinsurance of new blocks of business during both quarters ending December 31, 2011 and 2010. Medicare supplement benefits increased $24.1 million. An increase of $31.1 million was due to the acquisition of last year’s Medicare supplement block of business, which was partially offset by a reduction of $7.0 million in benefits on the existing business. All other business had a net decrease in benefits of $4.9 million for the year.
Amortization of DAC and VOBA was $13.8 million and $9.5 million for the years ended December 31, 2011 and 2010, respectively. Approximately $1.2 million of the increase was due to additional annuity DAC amortization resulting from realized capital gains recognized during the year. An additional $1.5 million was from the acquisition of last year’s Medicare supplement and final expense policies. The remaining increase was spread across various life insurance and annuity products.
As a result of the above mentioned changes in revenues and expenses, pretax earnings from operations were $20.1 million and $17.4 million for the years ended December 31, 2011 and 2010, respectively.
Liquidity and Capital Resources We believe our current capital structure is a positive factor that will enable us to pursue our operational
plans and goals and provide us with sufficient liquidity for the foreseeable future. The majority of our obligations currently in place mature between fiscal years 2016 and 2019. However, since there are many factors which could affect our liquidity, including some which are beyond our control, there is no assurance that future cash flows and liquidity resources will be sufficient to meet our outstanding debt obligations and our other future capital needs.

34
At March 31, 2013, cash and cash equivalents totaled $463.7 million, compared with $357.2 million on March 31, 2012. The assets of our insurance subsidiaries are generally unavailable to fulfill the obligations of non-insurance operations (AMERCO, U-Haul and Real Estate). As of March 31, 2013 (or as otherwise indicated), cash and cash equivalents, other financial assets (receivables, short-term investments, other investments, fixed maturities, and related party assets) and debt obligations of each operating segment were:
Moving & Storage
Property and Casualty
Insurance (a) Life
Insurance (a) (In thousands) Cash and cash equivalents $ 427,560 $ 14,120 $ 22,064 Other financial assets 299,341 420,523 1,072,589 Debt obligations 1,661,845 – – (a) As of December 31, 2012
At March 31, 2013, our Moving and Storage segment had cash available under existing credit facilities of $116.0 million.
A summary of our consolidated cash flows for fiscal 2013, 2012 and 2011 is shown in the table below:
Years Ended March 31, 2013 2012 2011 (In thousands)
Net cash provided by operating activities $ 661,530 $ 669,842 $ 572,863 Net cash used by investing activities (712,213) (582,137) (373,970) Net cash used by financing activities 157,783 (112,745) (60,768) Effects of exchange rate on cash (536) (294) 271 Net cash flow 106,564 (25,334) 138,396 Cash at the beginning of the period 357,180 382,514 244,118 Cash at the end of the period $ 463,744 $ 357,180 $ 382,514
Net cash provided by operating activities decreased $8.3 million in fiscal 2013, compared with fiscal 2012 primarily due to a $132.5 million increase in net federal income tax payments combined with a $133.0 million decline in the Life Insurance segment from reduced business acquisition activity. This is offset by the repayment of $127.3 million of the notes and interest receivables with SAC Holdings and from increased revenues at the Moving and Storage segment.
Net cash used in investing activities increased $130.1 million in fiscal 2013, compared with fiscal 2012. The largest portion of this change came from the Life Insurance segment as funds from new annuity sales led to a net $142.5 increase in net cash used for investing. For our Moving and Storage operating segment, cash received from entering into leases related to the acquisition of new equipment is reported net of the related cash used for the purchases of property, plant and equipment. New equipment leases funded in fiscal 2013 compared to fiscal 2012 increased $99.7 million, while cash used to purchase new rental equipment for fiscal 2013 increased $95.2 million compared to the same period last year. Cash provided from the sales of property, plant and equipment, primarily used trucks increased $51.8 million.
Net cash provided by financing activities increased $270.5 million in fiscal 2013, as compared with fiscal 2012. Net annuity deposits at the Life Insurance operating segment increased $284.0 million in fiscal 2013 compared to the same period last year. This was reduced by the Moving and Storage segment through a net increase in debt repayments as compared to new borrowings. Fiscal 2013 included $97.4 million of cash used to pay the Common Stock dividend, while fiscal 2012 included $152.0 million of cash used to redeem the Series A Preferred.

35
Liquidity and Capital Resources and Requirements of Our Operating Segments Moving and Storage
To meet the needs of our customers, U-Haul maintains a large fleet of rental equipment. Capital expenditures have primarily reflected new rental equipment acquisitions and the buyouts of existing fleet from leases. The capital to fund these expenditures has historically been obtained internally from operations and the sale of used equipment and externally from debt and lease financing. In the future, we anticipate that our internally generated funds will be used to service the existing debt and fund operations. U-Haul estimates that during fiscal 2014 the Company will reinvest in its truck and trailer rental fleet approximately $300 million, net of equipment sales and excluding any lease buyouts. For fiscal 2013, the Company invested, net of sales, approximately $391 million before any lease buyouts in its truck and trailer fleet. Fleet investments in fiscal 2014 and beyond will be dependent upon several factors including availability of capital, the truck rental environment and the used-truck sales market. We anticipate that the fiscal 2014 investments will be funded largely through debt financing, external lease financing and cash from operations. Management considers several factors including cost and tax consequences when selecting a method to fund capital expenditures. Our allocation between debt and lease financing can change from year to year based upon financial market conditions which may alter the cost or availability of financing options.
Real Estate has traditionally financed the acquisition of self-storage properties to support U-Haul's growth through debt financing and funds from operations and sales. The Company’s plan for the expansion of owned storage properties includes the acquisition of existing self-storage locations from third parties, the acquisition and development of bare land, and the acquisition and redevelopment of existing buildings not currently used for self-storage. The Company is funding these development projects through construction loans and internally generated funds. For fiscal 2013, the Company invested nearly $170 million in real estate acquisitions, new construction and renovation and repair. For fiscal 2014, the timing of new projects will be dependent upon several factors including the entitlement process, availability of capital, weather, and the identification and successful acquisition of target properties. U-Haul's growth plan in self-storage also includes the expansion of the eMove program, which does not require significant capital.
Net capital expenditures (purchases of property, plant and equipment less proceeds from the sale of property, plant and equipment and lease proceeds) were $435.3 million, $420.9 million and $300.0 million for fiscal 2013, 2012 and 2011, respectively. The components of our net capital expenditures are provided in the following table:
Years Ended March 31, 2013 2012 2011 (In thousands) Purchases of rental equipment $ 599,044 $ 503,863 $ 386,626 Equipment lease buyouts 60,041 52,340 25,024 Purchases of real estate, construction and renovations 169,535 101,644 64,036 Other capital expenditures 47,330 52,253 49,650 Gross capital expenditures 875,950 710,100 525,336
Less: Lease proceeds (219,966) (120,301) (44,918) Less: Sales of property, plant and equipment (220,699) (168,912) (180,411)
Net capital expenditures 435,285 420,887 300,007
The Moving and Storage operating segment continues to hold significant cash and has access to additional liquidity. Management may invest these funds in our existing operations, expand our product lines or pursue external opportunities in the self-moving and storage market place, or reduce existing indebtedness where possible.

36
Property and Casualty Insurance State insurance regulations restrict the amount of dividends that can be paid to stockholders of
insurance companies. As a result, our Property and Casualty Insurance’s operating segment assets are generally not available to satisfy the claims of AMERCO or its legal subsidiaries.
The Company believes that stockholders equity at the Property and Casualty operating segment remains sufficient and we do not believe that its ability to pay ordinary dividends to AMERCO will be restricted per state regulations.
Stockholder’s equity was $136.9 million, $123.8 million, and $154.6 million at December 31, 2012, 2011, and 2010, respectively. The increase in 2012 compared with 2011 resulted from net earnings of $9.3 million and an increase in other comprehensive income of $2.3 million, along with a capital contribution to ARCOA of $1.5 million. Our Property and Casualty Insurance operating segment does not use debt or equity issues to increase capital and therefore has no direct exposure to capital market conditions other than through its investment portfolio.
Life Insurance The Life Insurance operating segment manages its financial assets to meet policyholder and other
obligations including investment contract withdrawals. Life Insurance’s operating segment net deposits for the year ended December 31, 2012 were $269.8 million. State insurance regulations restrict the amount of dividends that can be paid to stockholders of insurance companies. As a result, Life Insurance’s operating segment funds are generally not available to satisfy the claims of AMERCO or its legal subsidiaries.
Life Insurance’s stockholder’s equity was $242.7 million, $215.8 million, and $188.7 million at December 31, 2012, 2011 and 2010, respectively. The increase in 2012 compared with 2011 resulted from earnings of $15.0 million, an increase in other comprehensive income of $13.6 million and a decrease to beginning retained earnings of $1.7 million in relation to the adoption of ASU 2010-26. Life Insurance operating segment does not use debt or equity issues to increase capital and therefore has no direct exposure to capital market conditions other than through its investment portfolio.
Cash Provided (Used) from Operating Activities by Operating Segments Moving and Storage
Net cash provided by operating activities was $665.6 million, $536.9 million and $471.0 million in fiscal 2013, 2012 and 2011, respectively. The increase was primarily due to repayments of $127.3 million of the notes and interest receivables in the first quarter with SAC Holdings and from increased revenues partially offset by a $132.5 million increase in net federal income tax payments.
Property and Casualty Insurance Net cash provided by operating activities was $0.3 million, $4.7 million, and $4.3 million for the years
ended December 31, 2012, 2011, and 2010, respectively. The decrease was due to a $4.9 million increase in benefit payments.
Our Property and Casualty Insurance’s operating segment cash and cash equivalents and short-term investment portfolios amounted to $45.2 million, $44.1 million, and $76.2 million at December 31, 2012, 2011, and 2010, respectively. This balance reflects funds in transition from maturity proceeds to long term investments. Management believes this level of liquid assets, combined with budgeted cash flow, is adequate to meet foreseeable cash needs. Capital and operating budgets allow our Property and Casualty Insurance operating segment to schedule cash needs in accordance with investment and underwriting proceeds.
Life Insurance Net cash provided (used) by operating activities was ($4.4) million, $128.6 million and $98.1 million for
the years ended December 31, 2012, 2011 and 2010, respectively. The decrease in cash provided was attributable to a cash settlement on the assumption reinsurance transaction as of September 2011. Increased commissions on higher sales of new annuity products in 2012 caused an additional decrease in cash flow from operations.
37
In addition to cash flows from operating activities and financing activities, a substantial amount of liquid funds are available through our Life Insurance’s operating segment short-term portfolio. At December 31, 2012, 2011 and 2010, cash and cash equivalents and short-term investments amounted to $34.6 million, $54.1 million and $53.6 million, respectively. Management believes that the overall sources of liquidity are adequate to meet foreseeable cash needs.
Liquidity and Capital Resources - Summary We believe we have the financial resources needed to meet our business plans including our working
capital needs. The Company continues to hold significant cash and has access to existing credit facilities and additional liquidity to meet our anticipated capital expenditure requirements for investment in our rental fleet, rental equipment and storage acquisitions and build outs.
Our borrowing strategy is primarily focused on asset-backed financing and rental equipment operating leases. As part of this strategy, we seek to ladder maturities and hedge floating rate loans through the use of interest rate swaps. While each of these loans typically contains provisions governing the amount that can be borrowed in relation to specific assets, the overall structure is flexible with no limits on overall Company borrowings. Management feels it has adequate liquidity between cash and cash equivalents and unused borrowing capacity in existing credit facilities to meet the current and expected needs of the Company over the next several years. At March 31, 2013, we had cash availability under existing credit facilities of $116.0 million. It is possible that circumstances beyond our control could alter the ability of the financial institutions to lend us the unused lines of credit. We believe that there are additional opportunities for leverage in our existing capital structure. For a more detailed discussion of our long-term debt and borrowing capacity, please see Note 9, Borrowings of the Notes to Consolidated Financial Statements.
Fair Value of Financial Instruments Assets and liabilities are recorded at fair value on the consolidated balance sheets and are measured
and classified based upon a three tiered approach to valuation. ASC 820 requires that financial assets and liabilities recorded at fair value be classified and disclosed in a Level 1, Level 2 or Level 3 category. For more information, please see Note 16, Fair Value Measurements of the Notes to Consolidated Financial Statements.
The available-for-sale securities held by the Company are recorded at fair value. These values are determined primarily from actively traded markets where prices are based either on direct market quotes or observed transactions. Liquidity is a factor considered during the determination of the fair value of these securities. Market price quotes may not be readily available for certain securities or the market for them has slowed or ceased. In situations where the market is determined to be illiquid, fair value is determined based upon limited available information and other factors including expected cash flows. At March 31, 2013, we had $1.2 million of available-for-sale assets classified in Level 3.
The interest rate swaps held by the Company as hedges against interest rate risk for our variable rate debt are recorded at fair value. These values are determined using pricing valuation models which include broker quotes for which significant inputs are observable. They include adjustments for counterparty credit quality and other deal-specific factors, where appropriate and are classified as Level 2.

38
Disclosures about Contractual Obligations and Commercial Commitments The following table provides contractual commitments and contingencies as of March 31, 2013:
Payment due by Period (as of March 31, 2013)
Contractual Obligations Total 04/01/13 - 03/31/14
04/01/14 - 03/31/16
04/01/16 - 03/31/18 Thereafter
(In thousands) Notes, loans and leases payable - Principal $ 1,661,845 $ 226,944 $ 633,114 $ 455,470 $ 346,317 Notes, loans and leases payable - Interest 315,023 79,607 115,518 50,815 69,083 Revolving credit agreements - Principal – – – – – Revolving credit agreements - Interest – – – – – Operating leases 354,499 120,260 169,429 33,698 31,112 Property and casualty obligations (a) 153,654 15,871 24,170 19,801 93,812 Life, health and annuity obligations (b) 2,715,218 194,365 338,292 329,585 1,852,976 Self insurance accruals (c) 380,824 101,180 161,886 68,256 49,502 Post retirement benefit liability 10,476 493 1,262 1,747 6,974 Total contractual obligations $ 5,591,539 $ 738,720 $ 1,443,671 $ 959,372 $ 2,449,776
(a) These estimated obligations for unpaid losses and loss adjustment expenses include case reserves for reported claims and IBNR claims estimates and are net of expected reinsurance recoveries. The ultimate amount to settle both the case reserves and IBNR is an estimate based upon historical experience and current trends and such estimates could materially differ from actual results. The assumptions do not include future premiums. Due to the significant assumptions employed in this model, the amounts shown could materially differ from actual results.
(b) These estimated obligations are based on mortality, morbidity, withdrawal and lapse assumptions drawn from our historical experience and adjusted for any known trends. These obligations include expected interest crediting but no amounts for future annuity deposits or premiums for life and Medicare supplement policies. The cash flows shown are undiscounted for interest and as a result total outflows for all years shown significantly exceed the corresponding liabilities of $914.8 million included in our consolidated balance sheet as of March 31, 2013. Life Insurance expects to fully fund these obligations from their invested asset portfolio. Due to the significant assumptions employed in this model, the amounts shown could materially differ from actual results.
(c) These estimated obligations are primarily the Company’s self insurance accruals for portions of the liability coverage for our rental equipment. The estimates for future settlement are based upon historical experience and current trends. Due to the significant assumptions employed in this model, the amounts shown could materially differ from actual results.
As presented above, contractual obligations on debt and guarantees represent principal payments while contractual obligations for operating leases represent the notional payments under the lease arrangements.
ASC 740 - Income Taxes liabilities and interest of $18.2 million is not included above due to uncertainty surrounding ultimate settlements, if any.
Off Balance Sheet Arrangements The Company uses off-balance sheet arrangements in situations where management believes that the
economics and sound business principles warrant their use.
AMERCO utilizes operating leases for certain rental equipment and facilities with terms expiring substantially through 2019. In the event of a shortfall in proceeds from the sales of the underlying rental equipment assets, AMERCO has guaranteed $117.9 million of residual values at March 31, 2013 for these assets at the end of their respective lease terms. AMERCO has been leasing rental equipment since 1987. To date, we have not experienced residual value shortfalls related to these leasing arrangements. Using the average cost of fleet related debt as the discount rate, the present value of AMERCO’s minimum lease payments and residual value guarantees were $330.2 million at March 31, 2013.

39
Historically, AMERCO has used off-balance sheet arrangements in connection with the expansion of our self-storage business. For more information please see Note 20, Related Party Transactions of the Notes to Consolidated Financial Statements. These arrangements were primarily used when the Company’s overall borrowing structure was more limited. The Company does not face similar limitations currently and off-balance sheet arrangements have not been utilized in our self-storage expansion in recent years. In the future, we will continue to identify and consider off-balance sheet opportunities to the extent such arrangements would be economically advantageous to us and our stockholders.
We currently manage the self-storage properties owned or leased by SAC Holdings, Mercury Partners, L.P. (“Mercury”), Four SAC Self-Storage Corporation (“4 SAC”), Five SAC Self-Storage Corporation (“5 SAC”), Galaxy Investments, L.P. (“Galaxy”) and Private Mini Storage Realty, L.P. (“Private Mini”) pursuant to a standard form of management agreement, under which we receive a management fee of between 4% and 10% of the gross receipts plus reimbursement for certain expenses. We received management fees, exclusive of reimbursed expenses, of $23.7 million, $22.5 million and $22.0 million from the above mentioned entities during fiscal 2013, 2012 and 2011, respectively. This management fee is consistent with the fee received for other properties we previously managed for third parties. SAC Holdings, 4 SAC, 5 SAC, Galaxy and Private Mini are substantially controlled by Blackwater Investments, Inc. (“Blackwater”). Blackwater is wholly-owned by Mark V. Shoen, a significant shareholder of AMERCO. Mercury is substantially controlled by Mark V. Shoen. James P. Shoen, a significant stockholder and director of AMERCO and an estate planning trust benefitting the Shoen children have an interest in Mercury.
We lease space for marketing company offices, vehicle repair shops and hitch installation centers from subsidiaries of SAC Holdings, 5 SAC and Galaxy. Total lease payments pursuant to such leases were $2.6 million, $2.4 million and $2.5 million in fiscal 2013, 2012 and 2011, respectively. The terms of the leases are similar to the terms of leases for other properties owned by unrelated parties that are leased by us.
At March 31, 2013, subsidiaries of SAC Holdings, 4 SAC, 5 SAC, Galaxy and Private Mini acted as U-Haul independent dealers. The financial and other terms of the dealership contracts with the aforementioned companies and their subsidiaries are substantially identical to the terms of those with the Company’s other independent dealers whereby commissions are paid by us based on equipment rental revenues. We paid the above mentioned entities $43.8 million, $41.7 million and $37.3 million in commissions pursuant to such dealership contracts during fiscal 2013, 2012 and 2011, respectively.
During fiscal 2013, subsidiaries of the Company held various junior unsecured notes of SAC Holdings. Substantially all of the equity interest of SAC Holdings is controlled by Blackwater. The Company does not have an equity ownership interest in SAC Holdings. We recorded interest income of $8.4 million, $19.4 million and $19.2 million and received cash interest payments of $12.6 million, $17.8 million and $15.8 million from SAC Holdings during fiscal 2013, 2012 and 2011, respectively. The largest aggregate amount of notes receivable outstanding during fiscal 2013 was $195.4 million and the aggregate notes receivable balance at March 31, 2013 was $72.4 million. In accordance with the terms of these notes, SAC Holdings may prepay the notes without penalty or premium at any time. The scheduled maturities of these notes are between 2017 and 2019. During the first quarter of fiscal 2013, we received $127.3 million in repayments on the notes and interest receivables.
These agreements along with notes with subsidiaries of SAC Holdings, 4 SAC, 5 SAC, Galaxy and Private Mini, excluding Dealer Agreements, provided revenues of $34.8 million, expenses of $2.6 million and cash flows of $159.6 million during fiscal 2013. Revenues and commission expenses related to the Dealer Agreements were $200.3 million and $43.8 million, respectively during fiscal 2013.
Fiscal 2014 Outlook We will continue to focus our attention on increasing transaction volume and improving pricing,
product and utilization for self-moving equipment rentals. Maintaining an adequate level of new investment in our truck fleet is an important component of our plan to meet our operational goals. Revenue in the U-Move program could be adversely impacted should we fail to execute in any of these areas. Even if we execute our plans, we could see declines in revenues primarily due to the economic conditions or competitive pressures that are beyond our control.

40
We have added new storage locations and expanded at existing locations. In fiscal 2014, we are looking to continue to acquire new locations, complete current projects and increase occupancy in our existing portfolio of locations. New projects and acquisitions will be considered and pursued if they fit our long-term plans and meet our financial objectives. In the current environment we have focused fewer resources on new construction than in recent history. We will continue to invest capital and resources in the U-Box storage container program throughout fiscal 2014.
The Property and Casualty Insurance operating segment will continue to provide loss adjusting and claims handling for U-Haul and underwrite components of the Safemove, Safetow, Super Safemove and Safestor protection packages to U-Haul customers.
The Life Insurance operating segment is pursuing its goal of expanding its presence in the senior market through the sales of its Medicare supplement, life and annuity policies. This strategy includes growing its agency force, expanding its new product offerings, and pursuing business acquisition opportunities.
Quarterly Results (unaudited) The quarterly results shown below are derived from unaudited financial statements for the eight
quarters beginning April 1, 2011 and ending March 31, 2013. We believe that all necessary adjustments have been included in the amounts stated below to present fairly, and in accordance with GAAP, such results. Moving and Storage operations are seasonal and proportionally more of the Company’s revenues and net earnings from its Moving and Storage operations are generated in the first and second quarters of each fiscal year (April through September). The operating results for the periods presented are not necessarily indicative of results for any future period.
Quarter Ended March 31, 2013 December 31, 2012 September 30, 2012 June 30, 2012 (In thousands, except for share and per share data) Total revenues $ 564,307 $ 582,487 $ 744,117 $ 667,676 Earnings from operations 72,036 81,946 194,322 150,879 Net earnings 37,873 36,846 109,420 80,569
Earnings available to common shareholders 37,873 36,846 109,420 80,569 Basic and diluted earnings per common share $ 1.93 $ 1.89 $ 5.61 $ 4.13 Weighted average common shares outstanding: basic and diluted 19,536,630 19,523,794 19,512,550 19,502,369 Quarter Ended March 31, 2012 December 31, 2011 September 30, 2011 June 30, 2011 (In thousands, except for share and per share data) Total revenues $ 525,657 $ 635,429 $ 705,508 $ 645,433 Earnings from operations 58,338 24,873 184,433 148,363 Net earnings 25,405 728 101,011 78,223
Earnings available to common shareholders 25,405 728 101,175 69,238 Basic and diluted earnings per common share $ 1.29 $ 0.04 $ 5.20 $ 3.56 Weighted average common shares outstanding: basic and diluted 19,492,159 19,481,614 19,470,948 19,460,126

41
Item 7A. Quantitative and Qualitative Disclosures about Market Risk We are exposed to financial market risks, including changes in interest rates and currency exchange
rates. To mitigate these risks, we may utilize derivative financial instruments, among other strategies. We do not use derivative financial instruments for speculative purposes.
Interest Rate Risk The exposure to market risk for changes in interest rates relates primarily to our variable rate debt
obligations and one variable rate operating lease. We have used interest rate swap agreements and forward swaps to reduce our exposure to changes in interest rates. We enter into these arrangements with counterparties that are significant financial institutions with whom we generally have other financial arrangements. We are exposed to credit risk should these counterparties not be able to perform on their obligations.
Notional Amount Fair Value Effective
Date Expiration
Date Fixed Rate Floating Rate
(In thousands) $ 15,657 $ (234) 7/10/2006 7/10/2013 5.67% 1 Month LIBOR 234,166 (44,122) 8/18/2006 8/10/2018 5.43% 1 Month LIBOR 10,375 (424) 2/12/2007 2/10/2014 5.24% 1 Month LIBOR 6,795 (292) 3/12/2007 3/10/2014 4.99% 1 Month LIBOR 6,800 (281) 3/12/2007 3/10/2014 4.99% 1 Month LIBOR 8,050 (a) (523) 8/15/2008 6/15/2015 3.62% 1 Month LIBOR 7,997 (564) 8/29/2008 7/10/2015 4.04% 1 Month LIBOR 12,442 (1,004) 9/30/2008 9/10/2015 4.16% 1 Month LIBOR 6,675 (a) (310) 3/30/2009 3/30/2016 2.24% 1 Month LIBOR 8,250 (a) (401) 8/15/2010 7/15/2017 2.15% 1 Month LIBOR 18,438 (a) (966) 6/1/2011 6/1/2018 2.38% 1 Month LIBOR 35,625 (a) (1,273) 8/15/2011 8/15/2018 1.86% 1 Month LIBOR 14,500 (a) (455) 9/12/2011 9/10/2018 1.75% 1 Month LIBOR 13,724 (b) (294) 3/28/2012 3/28/2019 1.42% 1 Month LIBOR 21,563 (292) 4/16/2012 4/1/2019 1.28% 1 Month LIBOR 42,750 (115) 1/15/2013 12/15/2019 1.07% 1 Month LIBOR (a) forward swap (b) operating lease
As of March 31, 2013, we had $464.3 million of variable rate debt obligations and $13.7 million of a variable rate operating lease. If the London Inter-Bank Offer Rate were to increase 100 basis points, the increase in interest expense on the variable rate debt and a variable rate operating lease would decrease future earnings and cash flows by $0.1 million annually (after consideration of the effect of the above derivative contracts).
Additionally, our insurance subsidiaries’ fixed income investment portfolios expose us to interest rate risk. This interest rate risk is the price sensitivity of a fixed income security to changes in interest rates. As part of our insurance companies’ asset and liability management, actuaries estimate the cash flow patterns of our existing liabilities to determine their duration. These outcomes are compared to the characteristics of the assets that are currently supporting these liabilities assisting management in determining an asset allocation strategy for future investments that management believes will mitigate the overall effect of interest rates.

42
Foreign Currency Exchange Rate Risk The exposure to market risk for changes in foreign currency exchange rates relates primarily to our
Canadian business. Approximately 5.8%, 5.9% and 5.8% of our revenue was generated in Canada in fiscal 2013, 2012 and 2011, respectively. The result of a 10.0% change in the value of the U.S. dollar relative to the Canadian dollar would not be material to net income. We typically do not hedge any foreign currency risk since the exposure is not considered material.
Item 8. Financial Statements and Supplementary Data The Report of Independent Registered Public Accounting Firm and Consolidated Financial Statements
of AMERCO and its consolidated subsidiaries including the notes to such statements and the related schedules are set forth on the “F” pages hereto and are incorporated herein.
Item 9. Changes in and Disagreements with Accountants on Accounting and Financial Disclosure
Not applicable.
Item 9A. Controls and Procedures Attached as exhibits to this Annual Report are certifications of our Chief Executive Officer (“CEO”) and
Chief Accounting Officer (“CAO”), which are required in accordance with Rule 13a-14 of the Exchange Act. This "Controls and Procedures" section includes information concerning the controls and procedures evaluation referred to in the certifications and it should be read in conjunction with the certifications for a more complete understanding of the topics presented in the section Evaluation of Disclosure Controls and Procedures.
Following this discussion is the report of BDO USA, LLP, our independent registered public accounting firm, regarding its audit of AMERCO’s internal control over financial reporting as set forth below in this section. This section should be read in conjunction with the certifications of our CEO and CAO and the BDO USA, LLP report for a more complete understanding of the topics presented.
Evaluation of Disclosure Controls and Procedures The Company’s management, with the participation of the CEO and CAO, conducted an evaluation of
the effectiveness of the design and operation of the Company’s "disclosure controls and procedures" (as such term is defined in the Exchange Act Rules 13a-15(e) and 15d-15(e)) (“Disclosure Controls”) as of the end of the period covered by this Annual Report. Our Disclosure Controls are designed to reasonably assure that information required to be disclosed in our reports filed under the Exchange Act, such as this Annual Report, is recorded, processed, summarized and reported within the time periods specified in the SEC's rules and forms. Our Disclosure Controls are also designed to reasonably assure that such information is accumulated and communicated to our management, including the CEO and CAO, as appropriate to allow timely decisions regarding required disclosure. Based upon the controls evaluation, our CEO and CAO have concluded that as of the end of the period covered by this Annual Report, our Disclosure Controls were effective related to the above stated design purposes.

43
Inherent Limitations on Effectiveness of Controls The Company's management, including the CEO and CAO, does not expect that our Disclosure
Controls or our internal control over financial reporting will prevent or detect all error and all fraud. A control system, no matter how well designed and operated, can provide only reasonable, not absolute, assurance that the control system's objectives will be met. The design of a control system must reflect the fact that there are resource constraints, and the benefits of controls must be considered relative to their costs. Further, because of the inherent limitations in all control systems, no evaluation of controls can provide absolute assurance that misstatements due to error or fraud will not occur or that all control issues and instances of fraud, if any, within the Company have been detected. These inherent limitations include the realities that judgments in decision-making can be faulty and that breakdowns can occur because of simple error or mistake. Controls can also be circumvented by the individual acts of some persons, by collusion of two or more people, or by management override of the controls. The design of any system of controls is based in part on certain assumptions about the likelihood of future events, and there can be no assurance that any design will succeed in achieving its stated goals under all potential future conditions. Projections of any evaluation of controls effectiveness to future periods are subject to risks. Over time, controls may become inadequate because of changes in conditions or deterioration in the degree of compliance with policies or procedures.
Changes in Internal Control over Financial Reporting There have not been any changes in the Company’s internal control over financial reporting as such
term is defined in Exchange Act Rules 13a-15(f) and 15d-15(f) during the most recent fiscal quarter that have materially affected, or are reasonably likely to materially affect, the Company’s internal control over financial reporting.
Management’s Report on Internal Control Over Financial Reporting Our management is responsible for establishing and maintaining adequate internal control over
financial reporting (as defined in Exchange Act Rules 13a-15(f) and 15d-15(f)) to provide reasonable assurance regarding the reliability of our financial reporting and the preparation of financial statements for external purposes in accordance with GAAP. Internal control over financial reporting includes those policies and procedures that (i) pertain to the maintenance of records that in reasonable detail accurately and fairly reflect the transactions and dispositions of the assets of the Company; (ii) provide reasonable assurance that transactions are recorded as necessary to permit preparation of financial statements in accordance with GAAP, and that receipts and expenditures of the Company are being made only in accordance with authorizations of management and directors of the Company; and (iii) provide reasonable assurance regarding prevention or timely detection of unauthorized acquisition, use or disposition of the Company's assets that could have a material effect on the financial statements.
Management assessed our internal control over financial reporting as of March 31, 2013, the end of our fiscal year. Management based its assessment on criteria established in Internal Control-Integrated Framework issued by the Committee of Sponsoring Organizations of the Treadway Commission. Management's assessment included evaluation of such elements as the design and operating effectiveness of key financial reporting controls, process documentation, accounting policies, and our overall control environment. This assessment is supported by testing and monitoring performed both by our Internal Audit organization and our Finance organization.
Based on our assessment, management has concluded that our internal control over financial reporting was effective as of the end of the fiscal year 2013. We reviewed the results of management's assessment with the Audit Committee of our Board.
Our independent registered public accounting firm, BDO USA, LLP, has audited the Company's internal control over financial reporting and has issued their report, which is included on the following page.

44
Report of Independent Registered Public Accounting Firm Board of Directors and Stockholders AMERCO Reno, Nevada
We have audited AMERCO and consolidated subsidiaries’ (the “Company”) internal control over financial reporting as of March 31, 2013, based on criteria established in Internal Control – Integrated Framework issued by the Committee of Sponsoring Organizations of the Treadway Commission (the COSO criteria). The Company’s management is responsible for maintaining effective internal control over financial reporting and for its assessment of the effectiveness of internal control over financial reporting, included in the accompanying Item 9A, Management’s Report on Internal Control Over Financial Reporting. Our responsibility is to express an opinion on the Company’s internal control over financial reporting based on our audit.
We conducted our audit in accordance with the standards of the Public Company Accounting Oversight Board (United States). Those standards require that we plan and perform the audit to obtain reasonable assurance about whether effective internal control over financial reporting was maintained in all material respects. Our audit included obtaining an understanding of internal control over financial reporting, assessing the risk that a material weakness exists, and testing and evaluating the design and operating effectiveness of internal control based on the assessed risk. Our audit also included performing such other procedures as we considered necessary in the circumstances. We believe that our audit provides a reasonable basis for our opinion.
A company’s internal control over financial reporting is a process designed to provide reasonable assurance regarding the reliability of financial reporting and the preparation of financial statements for external purposes in accordance with generally accepted accounting principles. A company’s internal control over financial reporting includes those policies and procedures that (1) pertain to the maintenance of records that, in reasonable detail, accurately and fairly reflect the transactions and dispositions of the assets of the company; (2) provide reasonable assurance that transactions are recorded as necessary to permit preparation of financial statements in accordance with generally accepted accounting principles, and that receipts and expenditures of the company are being made only in accordance with authorizations of management and directors of the company; and (3) provide reasonable assurance regarding prevention or timely detection of unauthorized acquisition, use, or disposition of the company’s assets that could have a material effect on the financial statements.
Because of its inherent limitations, internal control over financial reporting may not prevent or detect misstatements. Also, projections of any evaluation of effectiveness to future periods are subject to the risk that controls may become inadequate because of changes in conditions, or that the degree of compliance with the policies or procedures may deteriorate.
In our opinion, AMERCO maintained, in all material respects, effective internal control over financial reporting as of March 31, 2013, based on the COSO criteria.
We also have audited, in accordance with the standards of the Public Company Accounting Oversight Board (United States), the consolidated balance sheets of the Company as of March 31, 2013 and 2012, and the related consolidated statements of operations, changes in stockholders’ equity, comprehensive income, and cash flows for each of the three years in the period ended March 31, 2013 and our report dated June 5, 2013 expressed an unqualified opinion thereon.
/s/ BDO USA, LLP Phoenix, Arizona June 5, 2013

45
Item 9B. Other Information Not applicable.
PART III Item 10. Directors, Executive Officers and Corporate Governance
The information required to be disclosed under this Item 10 is incorporated herein by reference to AMERCO’s definitive proxy statement, in connection with its annual meeting of stockholders (the “Proxy Statement”), which will be filed with the SEC within 120 days after the close of the 2013 fiscal year.
The Company has adopted a Code of Ethics that applies to all directors, officers and employees of the Company, including the Company’s principal executive officer and principal accounting officer. A copy of our Code of Ethics is posted on AMERCO’s web site at amerco.com/governance.aspx. We intend to satisfy the disclosure requirements of Current Report on Form 8-K regarding any amendment to, or waiver from, a provision of our Code of Ethics by posting such information on the Company’s website, at the web address and location specified above, unless otherwise required to file a Current Report on Form 8-K by NASDAQ rules and regulations.
Item 11. Executive Compensation The information required to be disclosed under this Item 11 is incorporated herein by reference to the
Proxy Statement, which will be filed with the SEC within 120 days after the close of the 2013 fiscal year.
Item 12. Security Ownership of Certain Beneficial Owners and Management and Related Stockholder Matters
The information required to be disclosed under this Item 12 is incorporated herein by reference to the Proxy Statement, which will be filed with the SEC within 120 days after the close of the 2013 fiscal year.
Item 13. Certain Relationships and Related Transactions, and Director Independence The information required to be disclosed under this Item 13 is incorporated herein by reference to the
Proxy Statement, which will be filed with the SEC within 120 days after the close of the 2013 fiscal year.
Item 14. Principal Accounting Fees and Services The information required to be disclosed under this Item 14 is incorporated herein by reference to the
Proxy Statement, which will be filed with the SEC within 120 days after the close of the 2013 fiscal year.

46
PART IV Item 15. Exhibits and Financial Statement Schedules
The following documents are filed as part of this Report: Page
1 Financial Statements:
Report of Independent Registered Public Accounting Firm F-1
Consolidated Balance Sheets - March 31, 2013 and 2012 F-2
Consolidated Statements of Operations - Years Ended March 31, 2013, 2012, and 2011 F-3
Consolidated Statement of Comprehensive Income (Loss) - Years Ended March 31, 2013, 2012 and 2011 F-4
Consolidated Statements of Changes in Stockholders' Equity - Years Ended March 31, 2013, 2012, and 2011 F-5
Consolidated Statement of Cash Flows - Years Ended March 31, 2013, 2012 and 2011 F-6
Notes to Consolidated Financial Statements F-7
2 Financial Statement Schedules required to be filed by Item 8:
Schedule I - Condensed Financial Information of AMERCO F-56
Schedule II - AMERCO and Consolidated Subsidiaries Valuation and Qualifying Accounts F-60
Schedule V - AMERCO and Consolidated Subsidiaries Supplemental Information (Concerning Property-Casualty Insurance Operations) F-61
All other schedules are omitted because they are not required, inapplicable, or the information is otherwise shown in the financial statements or notes thereto.
Exhibits:
Exhibit Number Description Page or Method of Filing 3.1 Restated Articles of Incorporation of AMERCO Incorporated by reference to AMERCO’s
Registration Statement on form S-4 filed March 30, 2004, file no. 1-11255
3.2 Restated Bylaws of AMERCO Incorporated by reference to AMERCO’s Current Report on Form 8-K filed on September 10, 2010, file no. 1-11255
4.1 Termination of Rights Agreement, dated as of March 5, 2008
Incorporated by reference to AMERCO’s Current Report on Form 8-K, filed on March 11, 2008, file no. 1-11255
4.2 U-Haul Investors Club Base Indenture, dated February 12, 2011 by and between AMERCO and U. S. Bank National Association
Incorporated by reference to AMERCO’s Current Report on Form 8-K, filed on February 22, 2011, file no. 1-11255
4.3 First Supplemental Indenture, dated February 17, 2011, by and among AMERCO and U.S. Bank National Association
Incorporated by reference to AMERCO’s Current Report on Form 8-K, filed on February 22, 2011, file no. 1-11255
4.4 Second Supplemental Indenture, dated February 17, 2011, by and among AMERCO and U.S. Bank National Association
Incorporated by reference to AMERCO’s Current Report on Form 8-K, filed on February 22, 2011, file no. 1-11255
4.5 Third Supplemental Indenture, dated March 1, 2011, by and among AMERCO and U.S. Bank National Association
Incorporated by reference to AMERCO’s Current Report on Form 8-K, filed on March 4, 2011, file no. 1-11255

47
Exhibit Number Description Page or Method of Filing 4.6 Fourth Supplemental Indenture, dated March 15, 2011,
by and among AMERCO and U.S. Bank National Association
Incorporated by reference to AMERCO’s Current Report on Form 8-K, filed on March 22, 2011, file no. 1-11255
4.7 Fifth Supplemental Indenture, dated March 15, 2011, by and among AMERCO and U.S. Bank National Association
Incorporated by reference to AMERCO’s Current Report on Form 8-K, filed on March 22, 2011, file no. 1-11255
4.8 Sixth Supplemental Indenture, dated March 29, 2011, by and among AMERCO and U.S. Bank National Association
Incorporated by reference to AMERCO’s Current Report on Form 8-K, filed on April 1, 2011, file no. 1-11255
4.9 Seventh Supplemental Indenture, dated March 29, 2011, by and among AMERCO and U.S. Bank National Association
Incorporated by reference to AMERCO’s Current Report on Form 8-K, filed on April 1, 2011, file no. 1-11255
4.10 Ninth Supplemental Indenture, dated April 19, 2011, by and among AMERCO and U.S. Bank National Association
Incorporated by reference to AMERCO’s Current Report on Form 8-K, filed on April 22, 2011, file no. 1-11255
4.11 Tenth Supplemental Indenture, dated June 7, 2011 by and between AMERCO and U.S. Bank National Association
Incorporated by reference to AMERCO’s Current Report on Form 8-K, filed on June 23, 2011, file no. 1-11255
4.12 Eleventh Supplemental Indenture dated June 7, 2011 by and between AMERCO and U.S. Bank National Association
Incorporated by reference to AMERCO’s Current Report on Form 8-K, filed on October 31, 2011, file no. 1-11255
4.13 Twelfth Supplemental Indenture dated June 14, 2011 by and between AMERCO and U.S. Bank National Association
Incorporated by reference to AMERCO’s Current Report on Form 8-K, filed on June 23, 2011, file no. 1-11255
4.14 Thirteenth Supplemental Indenture dated June 28, 2011 by and between AMERCO and U.S. Bank National Association
Incorporated by reference to AMERCO’s Current Report on Form 8-K, filed on July 20, 2011, file no. 1-11255
4.15 Fourteenth Supplemental Indenture dated July 20, 2011 by and between AMERCO and U.S. Bank National Association
Incorporated by reference to AMERCO’s Current Report on Form 8-K, filed on August 17, 2011, file no. 1-11255
4.16 Fifteenth Supplemental Indenture dated July 27, 2011 by and between AMERCO and U.S. Bank National Association
Incorporated by reference to AMERCO’s Current Report on Form 8-K, filed on August 17, 2011, file no. 1-11255
4.17 Sixteenth Supplemental Indenture dated August 31, 2011 by and between AMERCO and U.S. Bank National Association
Incorporated by reference to AMERCO’s Current Report on Form 8-K, filed on September 28, 2011, file no. 1-11255
4.18 Seventeenth Supplemental Indenture dated November 8, 2011 by and between AMERCO and U. S. Bank National Association
Incorporated by reference to AMERCO’s Current Report on Form 8-K, filed on January 18, 2012, file no. 1-11255
4.19 Eighteenth Supplemental Indenture dated January 7, 2012 by and between AMERCO and U. S. Bank National Association
Incorporated by reference to AMERCO’s Current Report on Form 8-K, filed on March 26, 2012, file no. 1-11255
4.20 Nineteenth Supplemental Indenture dated May 14, 2012 by and between AMERCO and U. S. Bank National Association
Incorporated by reference to AMERCO’s Current Report on Form 8-K, filed on May 15, 2012, file no. 1-11255

48
Exhibit Number Description Page or Method of Filing 4.21 Eighth Supplemental Indenture, dated April 12, 2011, by
and between AMERCO and U.S. Bank National Association
Incorporated by reference to AMERCO’s Annual Report on Form 10-K for the year end March 31, 2012, file no. 1-11255
4.22 Twentieth Supplemental Indenture dated September 4, 2012 by and between AMERCO and U. S. Bank National Association
Incorporated by reference to AMERCO’s Current Report on Form 8-K, filed on September 4, 2012, file no. 1-11255
4.23 Twenty-first Supplemental Indenture dated January 15, 2013 by and between AMERCO and U. S. Bank National Association
Incorporated by reference to AMERCO’s Current Report on Form 8-K, filed on January 15, 2013, file no. 1-11255
4.24 Twenty-second Supplemental Indenture dated May 28, 2013 by and between AMERCO and U. S. Bank National Association
Incorporated by reference to AMERCO’s Current Report on Form 8-K, filed on May 30, 2013, file no. 1-11255
10.1 U-Haul Dealership Contract Incorporated by reference to AMERCO’s Annual Report on Form 10-K for the year end March 31, 1993, file no. 1-11255
10.2 Share Repurchase and Registration Rights Agreement with Paul F. Shoen
Incorporated by reference to AMERCO’s Annual Report on Form 10-K for the year ended March 31, 1993, file no. 1-11255
10.3 ESOP Loan Credit Agreement Incorporated by reference to AMERCO’s Annual Report on Form 10-K for the year ended March 31, 1990, file no. 1-11255
10.4 ESOP Loan Agreement Incorporated by reference to AMERCO’s Annual Report on Form 10-K for the year ended March 31, 1990, file no. 1-11255
10.5 Trust Agreement for the AMERCO Employee Savings, Profit Sharing and Employee Stock Ownership Plan
Incorporated by reference to AMERCO’s Annual Report on Form 10-K for the year ended March 31, 1990, file no. 1-11255
10.6 Amended Indemnification Agreement Incorporated by reference to AMERCO’s Annual Report on Form 10-K for the year ended March 31, 1990, file no. 1-11255
10.7 Indemnification Trust Agreement Incorporated by reference to AMERCO’s Annual Report on Form 10-K for the year ended March 31, 1990, file no. 1-11255
10.8 Management Agreement between Four SAC Self-Storage Corporation and subsidiaries of AMERCO
Incorporated by reference to AMERCO’s Annual Report on Form 10-K for the year ended March 31, 1997, file no. 1-11255
10.9 Management Agreement between Five SAC Self-Storage Corporation and subsidiaries of AMERCO
Incorporated by reference to AMERCO’s Annual Report on Form 10-K for the year ended March 31, 1999, file no. 1-11255
10.10 Management Agreement between Nineteen SAC Self-Storage Limited Partnership and U-Haul
Incorporated by reference to AMERCO’s Quarterly Report on Form 10-Q for the quarter ended September 30, 2002, file no. 1-11255

49
Exhibit Number Description Page or Method of Filing 10.11 Property Management Agreement Incorporated by reference to AMERCO’s
Annual Report on Form 10-K for the year ended March 31, 2004, file no. 1-11255
10.12 Property Management Agreements among Three-A through Three-D SAC Self-Storage Limited Partnership and the subsidiaries of U-Haul International, Inc.
Incorporated by reference to AMERCO’s Quarterly Report on Form 10-Q for the quarter ended June 30, 2004, file no. 1-11255
10.13 U-Haul Dealership Contract between U-Haul Leasing & Sales Co., and U-Haul Moving Partners, Inc.
Incorporated by reference to AMERCO’s Quarterly Report on Form 10-Q for the quarter ended June 30, 2004, file no. 1-11255
10.14 Property Management Agreement between Mercury Partners, LP, Mercury 99, LLC and U-Haul Self-Storage Management (WPC), Inc.
Incorporated by reference to AMERCO’s Quarterly Report on Form 10-Q for the quarter ended June 30, 2004, file no. 1-11255
10.15 Property Management Agreement between Three-SAC Self-Storage Corporation and U-Haul Co. (Canada), Ltd.
Incorporated by reference to AMERCO’s Quarterly Report on Form 10-Q for the quarter ended June 30, 2004, file no. 1-11255
10.16 Property Management Agreement among subsidiaries of U-Haul International and Galaxy Storage Two, L.P.
Incorporated by reference to AMERCO’s Quarterly Report on Form 10-Q for the quarter ended December 31, 2004, file no. 1-11255
10.17 Merrill Lynch Commitment Letter (re first mortgage loan) Incorporated by reference to AMERCO’s Current Report on Form 8-K, filed on May 13, 2005, file no. 1-11255
10.18 Morgan Stanley Commitment Letter Incorporated by reference to AMERCO’s Current Report on Form 8-K, filed on May 13, 2005, file no. 1-11255
10.19 Merrill Lynch Commitment Letter (re loan to Amerco Real Estate Company)
Incorporated by reference to AMERCO’s Current Report on Form 8-K, filed on May 13, 2005, file no. 1-11255
10.20 Amended and Restated Credit Agreement, dated June 8, 2005, among Amerco Real Estate Company, Amerco Real Estate Company of Texas, Inc., Amerco Real Estate Company of Alabama Inc., U-Haul Co. of Florida, Inc., U-Haul International, Inc. and Merrill Lynch Commercial Finance Corp.
Incorporated by reference to AMERCO’s Current Report on Form 8-K, filed June 14, 2005, file no. 1-11255
10.21 Security Agreement dated June 8, 2005, by Amerco Real Estate Company, Amerco Real Estate Company of Texas, Inc., Amerco Real Estate Company of Alabama, Inc., U-Haul Co. of Florida, Inc., U-Haul International, Inc. and the Marketing Grantors named therein in favor of Merrill Lynch Commercial Finance Corp.
Incorporated by reference to AMERCO’s Current Report on Form 8-K, filed June 14, 2005, file no. 1-11255
10.22 Guarantee, dated June 8, 2005, by U-Haul International, Inc. in favor of Merrill Lynch Commercial Finance Corp.
Incorporated by reference to AMERCO’s Current Report on Form 8-K, filed June 14, 2005, file no. 1-11255

50
Exhibit Number Description Page or Method of Filing 10.23 Promissory Note, dated June 8, 2005 by Amerco Real
Estate Company, Amerco Real Estate Company of Texas, Inc., Amerco Real Estate Company of Alabama, Inc., U-Haul Co. of Florida, Inc. and U-Haul International, Inc.
Incorporated by reference to AMERCO’s Current Report on Form 8-K, filed June 14, 2005, file no. 1-11255
10.24 Form of Mortgage, Security Agreement, Assignment of Rents and Fixture Filing, dated June 8, 2005 in favor of Morgan Stanley Mortgage Capital Inc.
Incorporated by reference to AMERCO’s Current Report on Form 8-K, filed June 14, 2005, file no. 1-11255
10.25 Form of Promissory Note, dated June 8, 2005, in favor of Morgan Stanley Mortgage Capital Inc.
Incorporated by reference to AMERCO’s Current Report on Form 8-K, filed June 14, 2005, file no. 1-11255
10.26 Form of Mortgage, Security Agreement, Assignment of Rents and Fixture Filing, dated June 8, 2005, in favor of Merrill Lynch Mortgage Lending, Inc.
Incorporated by reference to AMERCO’s Current Report on Form 8-K, filed June 14, 2005, file no. 1-11255
10.27 Form of Promissory Note, dated June 8, 2005, in favor of Merrill Lynch Mortgage Lending, Inc.
Incorporated by reference to AMERCO’s Current Report on Form 8-K, filed June 14, 2005, file no. 1-11255
10.28 Property Management Agreement between Subsidiaries of U-Haul and Five SAC RW MS, LLC., dated August 17, 2005.
Incorporated by reference to AMERCO’s Quarterly Report on Form 10-Q for the quarter ended September 30, 2005, file no. 1-11255
10.29 Property Management Agreement between Subsidiaries of U-Haul and Five SAC 905, LLC., dated September 23, 2005.
Incorporated by reference to AMERCO’s Quarterly Report on Form 10-Q for the quarter ended December 31, 2005, file no. 1-11255
10.30 Property Management Agreements between Subsidiaries of U-Haul and subsidiaries of PM Partners, LP, dated June 25, 2005.
Incorporated by reference to AMERCO’s Annual Report on Form 10-K for the year ended March 31, 2006, file no. 1-11255
10.31 Promissory note, dated December 1, 2005, by Private Mini Storage Realty, LP in favor of AMERCO.
Incorporated by reference to AMERCO’s Annual Report on Form 10-K for the year ended March 31, 2006, file no. 1-11255
10.32 Promissory note dated December 1, 2005 by PMSI Investments, LP in favor of U-Haul International, Inc.
Incorporated by reference to AMERCO’s Annual Report on Form 10-K for the year ended March 31, 2006, file no. 1-11255
10.33 Property Management Agreements between Subsidiaries of U-Haul and subsidiaries of PM Preferred Properties, LP., dated June 25, 2005
Incorporated by reference to AMERCO’s Annual Report on Form 10-K for the year ended March 31, 2006, file no. 1-11255
10.34 Credit Agreement dated June 6, 2006, among U-Haul Leasing and Sales Co., U-Haul Co. of Arizona, and U-Haul International, Inc., and HVB
Incorporated by reference to AMERCO’s Annual Report on Form 10-K for the year ended March 31, 2006, file no. 1-11255
10.35 Security Agreement dated June 6, 2006, among U-Haul Leasing and Sales Co., U-Haul Co. of Arizona, and U-Haul International, Inc. in favor of HVB
Incorporated by reference to AMERCO’s Annual Report on Form 10-K for the year ended March 31, 2006, file no. 1-11255
10.36 Guarantee dated June 6, 2006, made by U-Haul International, Inc. in favor of HVB
Incorporated by reference to AMERCO’s Annual Report on Form 10-K for the year ended March 31, 2006, file no. 1-11255

51
Exhibit Number Description Page or Method of Filing 10.37 Stockholder Agreement dated June 30, 2006 between
Edward J. Shoen, James P. Shoen, Mark V. Shoen, Rosmarie T. Donovan, as Trustee, and Southwest Fiduciary, Inc., as Trustee
Incorporated by reference to Exhibit 99.2, filed with the Schedule 13-D, filed on July 13, 2006, file number 5-39669
10.38 Amendment No. 1 to the Amended and Restated Credit Agreement and Security Agreement, dated as of August 18, 2006, to the Amended and Restated Credit Agreement, dated as of June 8, 2005, among Amerco Real Estate Company of Texas, Inc., Amerco Real Estate Company of Alabama, Inc., U-Haul Co. of Florida, Inc., U-Haul International, Inc. and the Marketing Grantors named therein in favor of Merrill Lynch Commercial Financial Corp.
Incorporated by reference to AMERCO’s Current Report on Form 8-K filed August 23, 2006, file no. 1-11255
10.39 Stockholder Agreement dated March 9, 2007 between Edward J. Shoen, James P. Shoen, Mark V. Shoen, Rosmarie T. Donovan, as Trustee, and Adagio Trust Company, as Trustee
Incorporated by reference to Exhibit 99.2, filed with the Schedule 13-D, filed on March 9, 2007, file number 5-39669
10.40 2007-1 BOX TRUCK BASE INDENTURE, dated as of June 1, 2007, among U-HAUL S FLEET, LLC, 2007 TM-1, LLC, 2007 DC-1, LLC, and 2007 EL-1, LLC and U.S. BANK NATIONAL ASSOCIATION.
Incorporated by reference to AMERCO’s Annual Report on Form 10-K for the year ended March 31, 2007, file no. 1-11255
10.41 SCHEDULE I TO 2007-1 BOX TRUCK BASE INDENTURE, dated as of June 1, 2007.
Incorporated by reference to AMERCO’s Annual Report on Form 10-K for the year ended March 31, 2007, file no. 1-11255
10.42 SERIES 2007-1 SUPPLEMENT, dated as of June 1, 2007, among U-HAUL S FLEET, LLC, 2007 TM-1, LLC, 2007 DC-1, LLC, and 2007 EL-1, LLC, and U.S. BANK NATIONAL ASSOCIATION, to the 2007-1 Box Truck Base Indenture.
Incorporated by reference to AMERCO’s Annual Report on Form 10-K for the year ended March 31, 2007, file no. 1-11255
10.43 Amended and Restated Property Management Agreement among Six-A SAC Self-Storage Corporation and subsidiaries of U-Haul International, Inc.
Incorporated by reference to AMERCO’s Quarterly Report on Form 10-Q for the quarter ended September 30, 2007, file no. 1-11255
10.44 Amended and Restated Property Management Agreement among Six-B SAC Self-Storage Corporation and subsidiaries of U-Haul International, Inc.
Incorporated by reference to AMERCO’s Quarterly Report on Form 10-Q for the quarter ended September 30, 2007, file no. 1-11255
10.45 Amended and Restated Property Management Agreement among Six-C SAC Self-Storage Corporation and subsidiaries of U-Haul International, Inc.
Incorporated by reference to AMERCO’s Quarterly Report on Form 10-Q for the quarter ended September 30, 2007, file no. 1-11255
10.46 Amended and Restated Property Management Agreement among Eight SAC Self-Storage Corporation and subsidiaries of U-Haul International, Inc.
Incorporated by reference to AMERCO’s Quarterly Report on Form 10-Q for the quarter ended September 30, 2007, file no. 1-11255
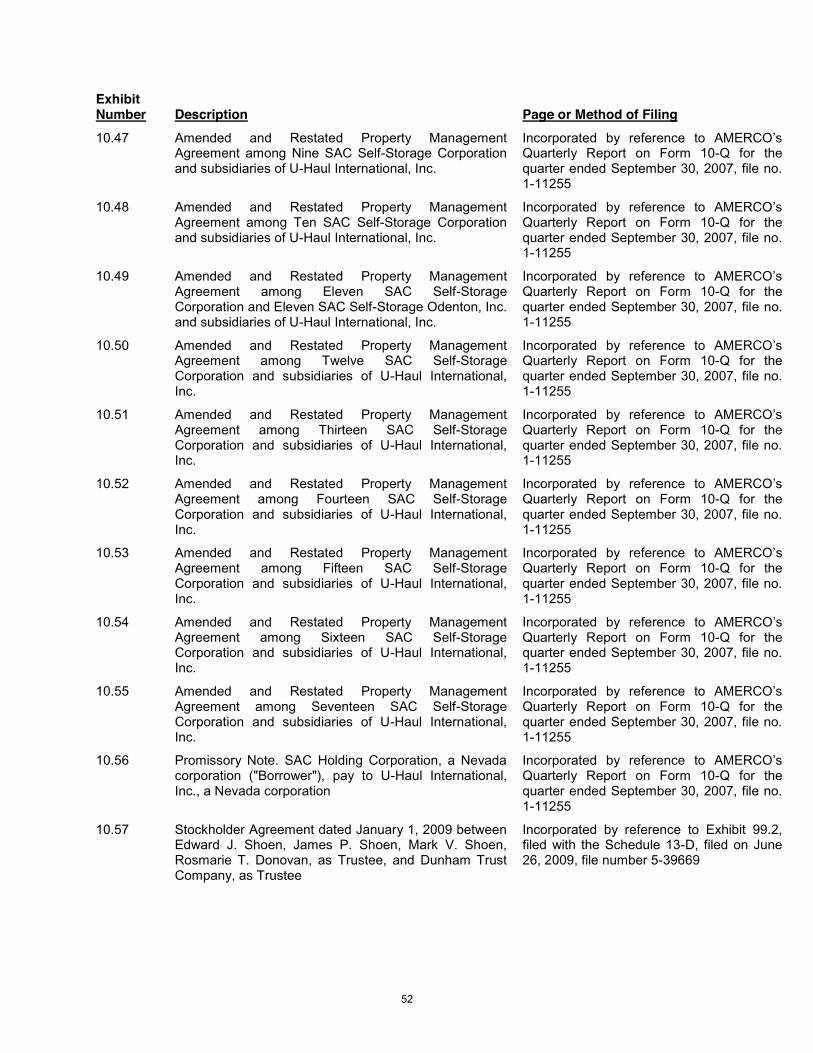
52
Exhibit Number Description Page or Method of Filing 10.47 Amended and Restated Property Management
Agreement among Nine SAC Self-Storage Corporation and subsidiaries of U-Haul International, Inc.
Incorporated by reference to AMERCO’s Quarterly Report on Form 10-Q for the quarter ended September 30, 2007, file no. 1-11255
10.48 Amended and Restated Property Management Agreement among Ten SAC Self-Storage Corporation and subsidiaries of U-Haul International, Inc.
Incorporated by reference to AMERCO’s Quarterly Report on Form 10-Q for the quarter ended September 30, 2007, file no. 1-11255
10.49 Amended and Restated Property Management Agreement among Eleven SAC Self-Storage Corporation and Eleven SAC Self-Storage Odenton, Inc. and subsidiaries of U-Haul International, Inc.
Incorporated by reference to AMERCO’s Quarterly Report on Form 10-Q for the quarter ended September 30, 2007, file no. 1-11255
10.50 Amended and Restated Property Management Agreement among Twelve SAC Self-Storage Corporation and subsidiaries of U-Haul International, Inc.
Incorporated by reference to AMERCO’s Quarterly Report on Form 10-Q for the quarter ended September 30, 2007, file no. 1-11255
10.51 Amended and Restated Property Management Agreement among Thirteen SAC Self-Storage Corporation and subsidiaries of U-Haul International, Inc.
Incorporated by reference to AMERCO’s Quarterly Report on Form 10-Q for the quarter ended September 30, 2007, file no. 1-11255
10.52 Amended and Restated Property Management Agreement among Fourteen SAC Self-Storage Corporation and subsidiaries of U-Haul International, Inc.
Incorporated by reference to AMERCO’s Quarterly Report on Form 10-Q for the quarter ended September 30, 2007, file no. 1-11255
10.53 Amended and Restated Property Management Agreement among Fifteen SAC Self-Storage Corporation and subsidiaries of U-Haul International, Inc.
Incorporated by reference to AMERCO’s Quarterly Report on Form 10-Q for the quarter ended September 30, 2007, file no. 1-11255
10.54 Amended and Restated Property Management Agreement among Sixteen SAC Self-Storage Corporation and subsidiaries of U-Haul International, Inc.
Incorporated by reference to AMERCO’s Quarterly Report on Form 10-Q for the quarter ended September 30, 2007, file no. 1-11255
10.55 Amended and Restated Property Management Agreement among Seventeen SAC Self-Storage Corporation and subsidiaries of U-Haul International, Inc.
Incorporated by reference to AMERCO’s Quarterly Report on Form 10-Q for the quarter ended September 30, 2007, file no. 1-11255
10.56 Promissory Note. SAC Holding Corporation, a Nevada corporation ("Borrower"), pay to U-Haul International, Inc., a Nevada corporation
Incorporated by reference to AMERCO’s Quarterly Report on Form 10-Q for the quarter ended September 30, 2007, file no. 1-11255
10.57 Stockholder Agreement dated January 1, 2009 between Edward J. Shoen, James P. Shoen, Mark V. Shoen, Rosmarie T. Donovan, as Trustee, and Dunham Trust Company, as Trustee
Incorporated by reference to Exhibit 99.2, filed with the Schedule 13-D, filed on June 26, 2009, file number 5-39669

53
Exhibit Number Description Page or Method of Filing 10.58 2010-1 BOX TRUCK BASE INDENTURE, dated as of
October 1, 2010, among 2010 U-HAUL S FLEET, LLC, 2010 TM-1, LLC, 2010 DC-1, LLC, and 2010 TT-1, LLC, and U.S. BANK NATIONAL ASSOCIATION, a national banking association, as trustee.
Incorporated by reference to AMERCO’s Quarterly Report on Form 10-Q for the quarter ended September 30, 2010, file number 1-11255
10.59 Schedule I to 2010-1 Base Indenture – Definitions List Incorporated by reference to AMERCO’s Quarterly Report on Form 10-Q for the quarter ended September 30, 2010, file number 1-11255
10.60 SERIES 2010-1 SUPPLEMENT, dated as of October 1, 2010, among 2010 U-HAUL S FLEET, LLC, 2010 TM-1, LLC, 2010 DC-1, LLC, and 2010 TT-1, LLC, and U.S. BANK NATIONAL ASSOCIATION, a national banking association, as trustee.
Incorporated by reference to AMERCO’s Quarterly Report on Form 10-Q for the quarter ended September 30, 2010, file number 1-11255
10.61 Pledge and Security Agreement, dated February 17, 2011, by and among AMERCO, U-Haul Leasing and Sales Co. and U.S. Bank National Association
Incorporated by reference to AMERCO’s Current Report on Form 8-K, filed on February 22, 2011, file no. 1-11255
10.62 Amended and Restated AMERCO Employee Savings and Profit and Sharing Plan*
Incorporated by reference to AMERCO’s Annual Report on Form 10-K, for the year ended March 31, 2011, file no. 1-11255
10.63 Amended and Restated AMERCO Employee Stock Ownership Plan*
Incorporated by reference to AMERCO’s Annual Report on Form 10-K, for the year ended March 31, 2011, file no. 1-11255
10.64 Credit Agreement, dated April 29, 2011, among Amerco Real Estate Company, U-Haul Company of Florida and J.P. Morgan Chase Bank, N.A.
Incorporated by reference to AMERCO’s Annual Report on Form 10-K, for the year ended March 31, 2011, file no. 1-11255
10.65 Amended and Restated Property Management Agreement among Eighteen SAC Self-Storage Corporation and subsidiaries of U-Haul International, Inc.
Incorporated by reference to AMERCO’s Annual Report on Form 10-K, for the year ended March 31, 2012, file no. 1-11255
10.66 Amended and Restated Property Management Agreement among Twenty SAC Self-Storage Corporation and subsidiaries of U-Haul International, Inc.
Incorporated by reference to AMERCO’s Annual Report on Form 10-K, for the year ended March 31, 2012, file no. 1-11255
10.67 Amended and Restated Property Management Agreement among Twenty-One SAC Self-Storage Corporation and subsidiaries of U-Haul International, Inc.
Incorporated by reference to AMERCO’s Annual Report on Form 10-K, for the year ended March 31, 2012, file no. 1-11255
10.68 Amended and Restated Property Management Agreement among Twenty-Two SAC Self-Storage Corporation and subsidiaries of U-Haul International, Inc.
Incorporated by reference to AMERCO’s Annual Report on Form 10-K, for the year ended March 31, 2012, file no. 1-11255
10.69 Amended and Restated Property Management Agreement among Twenty-Three SAC Self-Storage Corporation and subsidiaries of U-Haul International, Inc.
Incorporated by reference to AMERCO’s Annual Report on Form 10-K, for the year ended March 31, 2012, file no. 1-11255

54
Exhibit Number Description Page or Method of Filing 10.70 Amended and Restated Property Management
Agreement among Twenty-Four SAC Self-Storage Corporation and subsidiaries of U-Haul International, Inc.
Incorporated by reference to AMERCO’s Annual Report on Form 10-K, for the year ended March 31, 2012, file no. 1-11255
10.71 Amended and Restated Property Management Agreement among Twenty-Five SAC Self-Storage Corporation and subsidiaries of U-Haul International, Inc.
Incorporated by reference to AMERCO’s Annual Report on Form 10-K, for the year ended March 31, 2012, file no. 1-11255
10.72 Amended and Restated Property Management Agreement among Twenty-Six SAC Self-Storage Corporation and subsidiaries of U-Haul International, Inc.
Incorporated by reference to AMERCO’s Annual Report on Form 10-K, for the year ended March 31, 2012, file no. 1-11255
10.73 Amended and Restated Property Management Agreement among Twenty-Seven SAC Self-Storage Corporation and subsidiaries of U-Haul International, Inc.
Incorporated by reference to AMERCO’s Annual Report on Form 10-K, for the year ended March 31, 2012, file no. 1-11255
10.74 Amended and Restated Credit Agreement, dated March 15, 2012, among Amerco Real Estate Company, U-Haul Co. of Florida and J.P. Morgan Chase Bank, N.A.
Incorporated by reference to AMERCO’s Annual Report on Form 10-K, for the year ended March 31, 2012, file no. 1-11255
10.75 U-Haul Dealership Contract Addendum Incorporated by reference to AMERCO’s Annual Report on Form 10-K, for the year ended March 31, 2012, file no. 1-11255
10.76 Amendment to the Amended and Restated AMERCO Employee Savings and Profit and Sharing Plan
Incorporated by reference to AMERCO’s Quarterly Report on Form 10-Q, for the year ended December 31, 2012, file no. 1-11255
10.77 Stockholder Agreement dated April 29, 2013 between Edward J. Shoen, James P. Shoen, Mark V. Shoen, Rosmarie T. Donovan, as Trustee, and David L. Holmes, as Trustee
Incorporated by reference to Exhibit 99.2, filed with the Schedule 13-D, filed on May 1, 2013, file number 5-39669
14 Code of Ethics Incorporated by reference to AMERCO’s Current Report on Form 8-K, filed on May 5, 2004, file no. 1-11255
21 Subsidiaries of AMERCO Filed herewith
23.1 Consent of BDO USA, LLP Filed herewith
24 Power of Attorney Refer to signature page
31.1 Rule 13a-14(a)/15d-14(a) Certificate of Edward J. Shoen, President and Chairman of the Board of AMERCO
Filed herewith
31.2 Rule 13a-14(a)/15d-14(a) Certificate of Jason A. Berg, Principal Financial Officer and Chief Accounting Officer of AMERCO
Filed herewith
32.1 Certificate of Edward J. Shoen, President and Chairman of the Board of AMERCO pursuant to Section 906 of the Sarbanes-Oxley Act of 2002
Furnished herewith
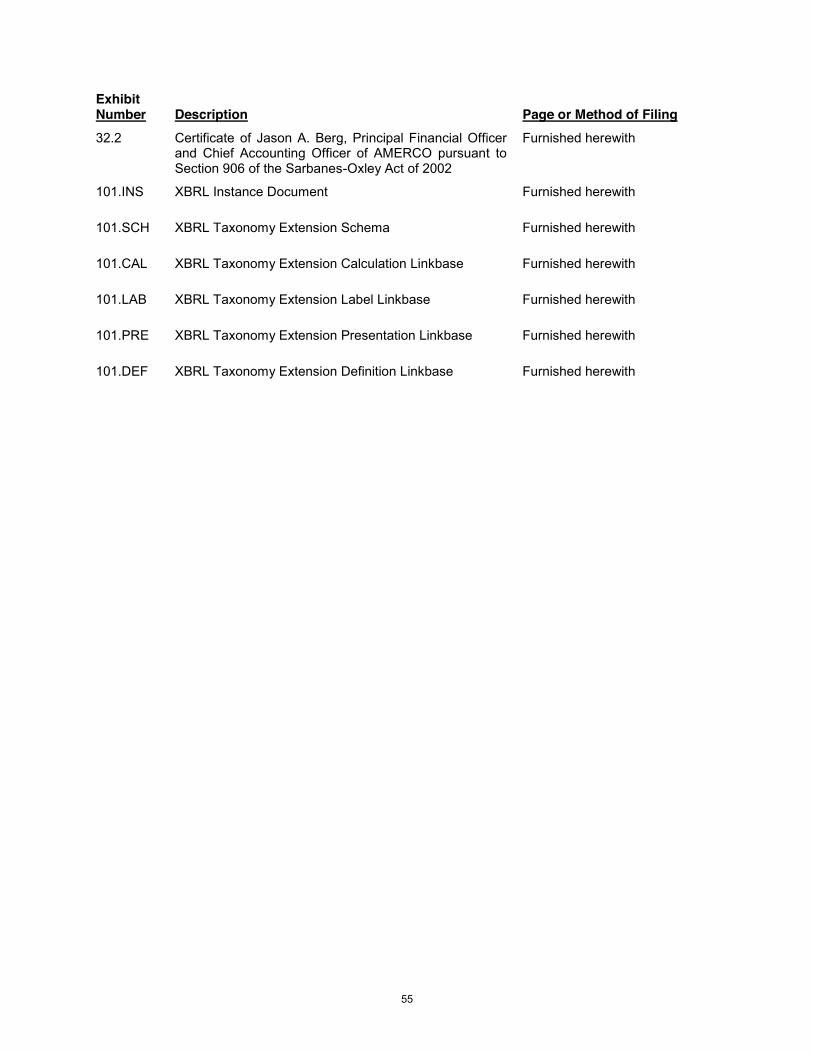
55
Exhibit Number Description Page or Method of Filing 32.2 Certificate of Jason A. Berg, Principal Financial Officer
and Chief Accounting Officer of AMERCO pursuant to Section 906 of the Sarbanes-Oxley Act of 2002
Furnished herewith
101.INS XBRL Instance Document Furnished herewith
101.SCH XBRL Taxonomy Extension Schema Furnished herewith
101.CAL XBRL Taxonomy Extension Calculation Linkbase Furnished herewith
101.LAB XBRL Taxonomy Extension Label Linkbase Furnished herewith
101.PRE XBRL Taxonomy Extension Presentation Linkbase Furnished herewith
101.DEF XBRL Taxonomy Extension Definition Linkbase Furnished herewith
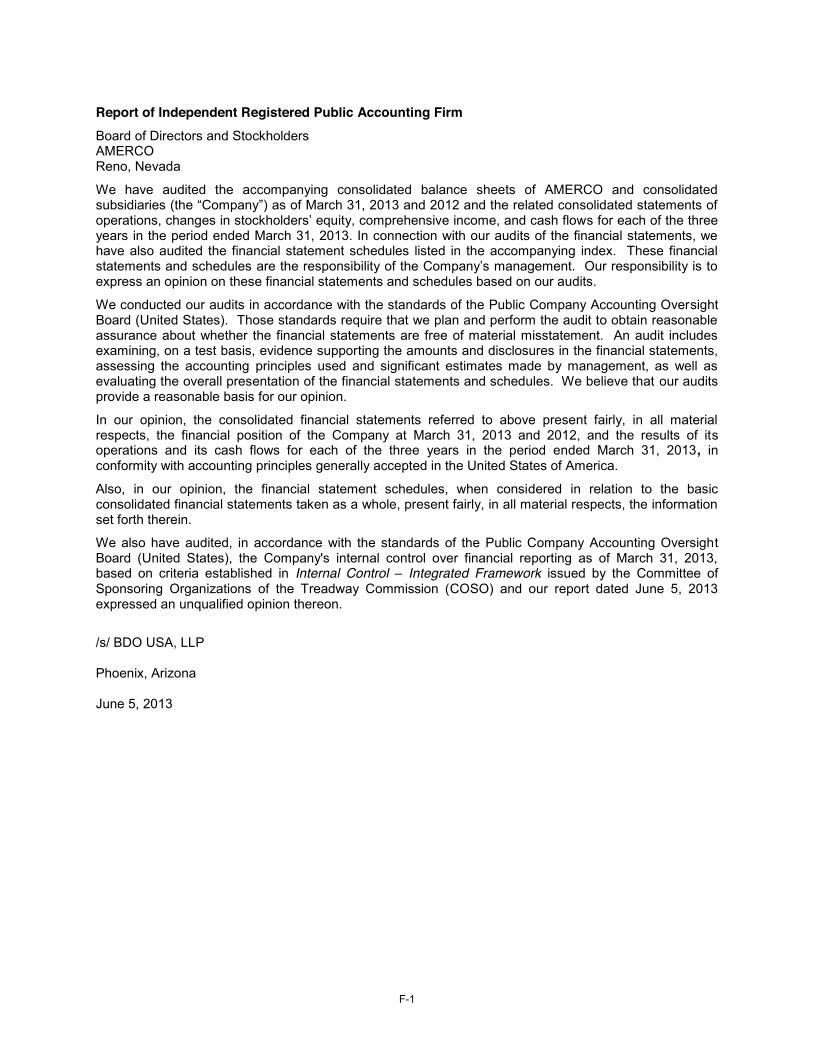
F-1
Report of Independent Registered Public Accounting Firm Board of Directors and Stockholders AMERCO Reno, Nevada
We have audited the accompanying consolidated balance sheets of AMERCO and consolidated subsidiaries (the “Company”) as of March 31, 2013 and 2012 and the related consolidated statements of operations, changes in stockholders’ equity, comprehensive income, and cash flows for each of the three years in the period ended March 31, 2013. In connection with our audits of the financial statements, we have also audited the financial statement schedules listed in the accompanying index. These financial statements and schedules are the responsibility of the Company’s management. Our responsibility is to express an opinion on these financial statements and schedules based on our audits.
We conducted our audits in accordance with the standards of the Public Company Accounting Oversight Board (United States). Those standards require that we plan and perform the audit to obtain reasonable assurance about whether the financial statements are free of material misstatement. An audit includes examining, on a test basis, evidence supporting the amounts and disclosures in the financial statements, assessing the accounting principles used and significant estimates made by management, as well as evaluating the overall presentation of the financial statements and schedules. We believe that our audits provide a reasonable basis for our opinion.
In our opinion, the consolidated financial statements referred to above present fairly, in all material respects, the financial position of the Company at March 31, 2013 and 2012, and the results of its operations and its cash flows for each of the three years in the period ended March 31, 2013, in conformity with accounting principles generally accepted in the United States of America.
Also, in our opinion, the financial statement schedules, when considered in relation to the basic consolidated financial statements taken as a whole, present fairly, in all material respects, the information set forth therein.
We also have audited, in accordance with the standards of the Public Company Accounting Oversight Board (United States), the Company's internal control over financial reporting as of March 31, 2013, based on criteria established in Internal Control – Integrated Framework issued by the Committee of Sponsoring Organizations of the Treadway Commission (COSO) and our report dated June 5, 2013 expressed an unqualified opinion thereon.
/s/ BDO USA, LLP Phoenix, Arizona June 5, 2013

F-2
AMERCO AND CONSOLIDATED SUBSIDIARIES CONSOLIDATED BALANCE SHEETS
March 31, 2013 2012 (In thousands, except share data)
ASSETS Cash and cash equivalents $ 463,744 $ 357,180 Reinsurance recoverables and trade receivables, net 261,789 297,974 Inventories, net 56,396 58,735 Prepaid expenses 57,451 41,858 Investments, fixed maturities and marketable equities 1,095,338 766,792 Investments, other 241,765 258,551 Deferred policy acquisition costs, net 93,043 63,914 Other assets 99,986 120,525 Related party assets 182,035 316,157 2,551,547 2,281,686 Property, plant and equipment, at cost:
Land 333,228 281,140 Buildings and improvements 1,197,875 1,087,119 Furniture and equipment 311,142 308,120 Rental trailers and other rental equipment 317,476 255,010 Rental trucks 2,154,688 1,856,433 4,314,409 3,787,822
Less: Accumulated depreciation (1,559,355) (1,415,457) Total property, plant and equipment 2,755,054 2,372,365
Total assets $ 5,306,601 $ 4,654,051 LIABILITIES AND STOCKHOLDERS' EQUITY
Liabilities: Accounts payable and accrued expenses $ 358,491 $ 335,326 Notes, loans and leases payable 1,661,845 1,486,211 Policy benefits and losses, claims and loss expenses payable 1,115,048 1,145,943 Liabilities from investment contracts 510,789 240,961 Other policyholders' funds and liabilities 7,294 7,273 Deferred income 30,217 31,525 Deferred income taxes 393,658 370,992
Total liabilities 4,077,342 3,618,231 Commitments and contingencies (notes 9, 17, 18, 19 and 20) Stockholders' equity:
Series preferred stock, with or without par value, 50,000,000 shares authorized: Series A preferred stock, with no par value, 6,100,000 shares authorized;
6,100,000 shares issued and none outstanding as of March 31, 2013 and 2012 – – Series B preferred stock, with no par value, 100,000 shares authorized; none
issued and outstanding as of March 31, 2013 and 2012 – – Series common stock, with or without par value, 150,000,000 shares authorized:
Series A common stock of $0.25 par value, 10,000,000 shares authorized; none issued and outstanding as of March 31, 2013 and 2012 – –
Common stock of $0.25 par value, 150,000,000 shares authorized; 41,985,700 issued and 19,607,788 outstanding as of March 31, 2013 and 2012 10,497 10,497
Additional paid-in capital 438,168 433,743 Accumulated other comprehensive loss (22,680) (45,436) Retained earnings 1,482,630 1,317,064 Cost of common shares in treasury, net (22,377,912 shares as of March 31, 2013 and 2012) (525,653) (525,653) Cost of preferred shares in treasury, net (6,100,000 shares as of March 31, 2013 and 2012) (151,997) (151,997) Unearned employee stock ownership plan shares (1,706) (2,398) Total stockholders' equity 1,229,259 1,035,820 Total liabilities and stockholders' equity $ 5,306,601 $ 4,654,051
The accompanying notes are an integral part of these consolidated financial statements.

F-3
AMERCO AND CONSOLIDATED SUBSIDIARIES CONSOLIDATED STATEMENTS OF OPERATIONS
Years Ended March 31, 2013 2012 2011 (In thousands, except share and per share data) Revenues:
Self-moving equipment rentals $ 1,767,520 $ 1,678,256 $ 1,547,015 Self-storage revenues 152,660 134,376 120,698 Self-moving and self-storage products and service sales 221,117 213,854 205,570 Property management fees 24,378 23,266 22,132 Life insurance premiums 178,115 277,562 206,992 Property and casualty insurance premiums 34,342 32,631 30,704 Net investment and interest income 82,903 73,552 62,745 Other revenue 97,552 78,530 55,503
Total revenues 2,558,587 2,512,027 2,251,359
Costs and expenses: Operating expenses 1,170,568 1,093,190 1,026,577 Commission expenses 228,124 212,190 190,981 Cost of sales 107,216 116,542 106,024 Benefits and losses 180,676 320,191 200,513 Amortization of deferred policy acquisition costs 17,376 13,791 9,494 Lease expense 117,448 131,215 150,809 Depreciation, net of (gains) losses on disposals of (($22,496), ($20,888) and ($23,058), respectively) 237,996 208,901 189,266
Total costs and expenses 2,059,404 2,096,020 1,873,664
Earnings from operations 499,183 416,007 377,695 Interest expense (90,696) (90,371) (88,381)
Pretax earnings 408,487 325,636 289,314 Income tax expense (143,779) (120,269) (105,739)
Net earnings 264,708 205,367 183,575 Less: Excess of redemption value over carrying value of preferred shares redeemed – (5,908) (178) Less: Preferred stock dividends – (2,913) (12,412)
Earnings available to common stockholders $ 264,708 $ 196,546 $ 170,985 Basic and diluted earnings per common share $ 13.56 $ 10.09 $ 8.80 Weighted average common shares outstanding: Basic and diluted 19,518,779 19,476,187 19,432,781
Related party revenues for fiscal 2013, 2012 and 2011, net of elimination, were $38,135 thousand, $48,061 thousand and $46,746 thousand, respectively.
Related party costs and expenses for fiscal 2013, 2012, and 2011, net of eliminations, were $46,461 thousand, $44,120 thousand and $39,748 thousand, respectively.
The accompanying notes are an integral part of these consolidated financial statements

F-4
AMERCO AND CONSOLIDATED SUBSIDIARIES
CONSOLIDATED STATEMENTS OF COMPREHENSIVE INCOME Fiscal Year Ended March 31, 2013 Pre-tax Tax Net (In thousands) Comprehensive income:
Net earnings $ 408,487 $ (143,779) $ 264,708 Other comprehensive income:
Foreign currency translation (1,271) – (1,271) Unrealized net gain on investments 29,099 (10,320) 18,779 Change in fair value of cash flow hedges 9,405 (3,574) 5,831 Postretirement benefit obligation loss (974) 391 (583)
Total comprehensive income $ 444,746 $ (157,282) $ 287,464 Fiscal Year Ended March 31, 2012 Pre-tax Tax Net (In thousands) Comprehensive income:
Net earnings $ 325,636 $ (120,269) $ 205,367 Other comprehensive income:
Foreign currency translation (2,854) – (2,854) Unrealized net gain on investments 15,094 (5,089) 10,005 Change in fair value of cash flow hedges (9,179) 3,488 (5,691) Postretirement benefit obligation gain (692) 263 (429)
Total comprehensive income $ 328,005 $ (121,607) $ 206,398 Fiscal Year Ended March 31, 2011 Pre-tax Tax Net (In thousands) Comprehensive income:
Net earnings $ 289,314 $ (105,739) $ 183,575 Other comprehensive income:
Foreign currency translation 3,114 – 3,114 Unrealized net gain on investments 7,468 (2,538) 4,930 Change in fair value of cash flow hedges 2,411 (916) 1,495 Postretirement benefit obligation loss 324 (123) 201
Total comprehensive income $ 302,631 $ (109,316) $ 193,315
The accompanying notes are an integral part of these consolidated financial statements.

F-5
AMERCO AND CONSOLIDATED SUBSIDIARIES CONSOLIDATED STATEMENTS OF CHANGES IN STOCKHOLDERS EQUITY
Description
Common Stock,
$0.25 Par Value
Additional Paid-In Capital
Accumulated Other
Comprehensive Income (Loss)
Retained Earnings
Less: Treasury Common
Stock
Less: Treasury Preferred
Stock
Less: Unearned Employee Stock Ownership Plan
Shares
Total Stockholders'
Equity (In thousands) Balance as of March 31, 2010 $ 10,497 $ 421,996 $ (56,207) $ 969,017 $ (525,653) $ (2,185) $ (4,554) $ 812,911 Increase in market value of released ESOP shares – 3,038 – – – – – 3,038 Release of unearned ESOP shares – – – – – – 1,172 1,172 Foreign currency translation – – 3,114 – – – – 3,114 Unrealized gain on investments, net of tax – – 4,930 – – – – 4,930 Fair market value of cash flow hedges, net of tax – – 1,495 – – – – 1,495 Adjustment to post retirement benefit obligation – – 201 – – – – 201 Net earnings – – – 183,575 – – – 183,575 Less: Excess of redemption value over carrying value of preferred shares redeemed – – – (178) – – – (178) Preferred stock dividends: Series A ($2.13 per share for fiscal 2011) – – – (12,412) – – – (12,412) Redemption of preferred shares – – – – – (5,004) – (5,004) Contribution to related party – 178 – – – – – 178 Net activity – 3,216 9,740 170,985 – (5,004) 1,172 180,109 Balance as of March 31, 2011 $ 10,497 $ 425,212 $ (46,467) $ 1,140,002 $ (525,653) $ (7,189) $ (3,382) $ 993,020 Increase in market value of released ESOP shares – 3,141 – – – – – 3,141 Release of unearned ESOP shares – – – – – – 984 984 Foreign currency translation – – (2,854) – – – – (2,854) Unrealized gain on investments, net of tax – – 10,005 – – – – 10,005 Fair market value of cash flow hedges, net of tax – – (5,691) – – – – (5,691) Adjustment to post retirement benefit obligation – – (429) – – – – (429) Net earnings – – – 205,367 – – – 205,367 Less: Excess of redemption value over carrying value of preferred shares redeemed – – – (5,908) – – – (5,908) Preferred stock dividends: Series A ($0.53 per share for fiscal 2012) – – – (2,913) – – – (2,913) Common stock dividends: ($1.00 per share for fiscal 2012) – – – (19,484) – – – (19,484) Redemption of preferred shares – – – – – (144,808) – (144,808) Contribution to related party – 5,390 – – – – – 5,390 Net activity – 8,531 1,031 177,062 – (144,808) 984 42,800 Balance as of March 31, 2012 $ 10,497 $ 433,743 $ (45,436) $ 1,317,064 $ (525,653) $ (151,997) $ (2,398) $ 1,035,820 Adjustment to initially apply ASU 2010-26 – – – (1,721) – – – (1,721) Increase in market value of released ESOP shares – 4,425 – – – – – 4,425 Release of unearned ESOP shares – – – – – – 692 692 Foreign currency translation – – (1,271) – – – – (1,271) Unrealized gain on investments, net of tax – – 18,779 – – – – 18,779 Fair market value of cash flow hedges, net of tax – – 5,831 – – – – 5,831 Adjustment to post retirement benefit obligation – – (583) – – – – (583) Net earnings – – – 264,708 – – – 264,708 Common stock dividends: ($5.00 per share for fiscal 2013) – – – (97,421) – – – (97,421) Net activity – 4,425 22,756 165,566 – – 692 193,439 Balance as of March 31, 2013 $ 10,497 $ 438,168 $ (22,680) $ 1,482,630 $ (525,653) $ (151,997) $ (1,706) $ 1,229,259
The accompanying notes are an integral part of these consolidated financial statements.

F-6
AMERCO AND CONSOLIDATED SUBSIDIARIES CONSOLIDATED STATEMENTS OF CASH FLOWS
Years Ended March 31, 2013 2012 2011 (In thousands)
Cash flows from operating activities: Net earnings $ 264,708 $ 205,367 $ 183,575 Adjustments to reconcile net earnings to cash provided by operations: Depreciation 260,492 229,789 212,324 Amortization of deferred policy acquisition costs 17,376 13,791 9,494 Change in allowance for losses on trade receivables (134) (208) 28 Change in allowance for inventory reserves 1,133 1,382 (674) Net gain on sale of real and personal property (22,496) (20,888) (23,058) Net gain on sale of investments (8,323) (5,579) (1,135) Deferred income taxes 13,518 104,360 80,898 Net change in other operating assets and liabilities:
Reinsurance recoverables and trade receivables 36,322 (77,115) (5,966) Inventories 1,206 (173) (6,431) Prepaid expenses (15,587) 15,748 (4,244) Capitalization of deferred policy acquisition costs (50,640) (23,166) (25,239) Other assets 21,556 5,992 28,715 Related party assets 133,672 (14,210) (87) Accounts payable and accrued expenses 40,032 19,469 12,547 Policy benefits and losses, claims and loss expenses payable (30,478) 212,330 109,334 Other policyholders' funds and liabilities 21 (1,458) 566 Deferred income (1,312) 4,367 1,967 Related party liabilities 464 44 249
Net cash provided by operating activities 661,530 669,842 572,863 Cash flow from investing activities:
Purchase of: Property, plant and equipment (655,984) (589,799) (480,418) Short term investments (411,638) (291,622) (260,766) Fixed maturity investments (443,262) (220,104) (215,931) Equity securities (16,289) (9,048) (11,550) Preferred stock (6,296) (2,717) (14,352) Real estate (1,073) (7,829) (193) Mortgage loans (80,711) (127,163) (38,558) Other investments – – (2,000)
Proceeds from sales and paydowns of: Property, plant and equipment 220,699 168,912 180,411 Short term investments 417,520 300,893 317,213 Fixed maturity investments 160,806 128,486 131,981 Equity securities 372 10,222 1,198 Preferred stock 7,258 2,352 1,914 Real estate 671 440 1,925 Mortgage loans 95,714 54,840 15,156
Net cash used by investing activities (712,213) (582,137) (373,970) Cash flow from financing activities:
Borrowings from credit facilities 270,546 237,780 321,862 Principal repayments on credit facilities (257,957) (201,888) (288,882) Debt issuance costs (2,223) (2,004) (1,987) Capital lease payments (26,877) (8,328) (11,522) Leveraged Employee Stock Ownership Plan - Repayment from loan 692 984 1,172 Securitization deposits 1,195 42,088 (46,031) Preferred stock redemption paid – (144,289) – Preferred stock dividends paid – (2,913) (12,412) Common stock dividends paid (97,421) (19,484) – Contribution to related party – (518) – Investment contract deposits 301,729 13,854 11,580 Investment contract withdrawals (31,901) (28,027) (34,548)
Net cash used by financing activities 157,783 (112,745) (60,768) Effects of exchange rate on cash (536) (294) 271 Increase (decrease) in cash and cash equivalents 106,564 (25,334) 138,396 Cash and cash equivalents at the beginning of period 357,180 382,514 244,118 Cash and cash equivalents at the end of period $ 463,744 $ 357,180 $ 382,514
The accompanying notes are an integral part of these consolidated financial statements

AMERCO AND CONSOLIDATED SUBSIDIARIES NOTES TO CONSOLIDATED FINANCIAL STATEMENTS
F-7
Note 1. Basis of Presentation AMERCO, a Nevada Corporation (“AMERCO”), has a fiscal year that ends on the 31st of March for
each year that is referenced. Our insurance company subsidiaries have fiscal years that end on the 31st of December for each year that is referenced. They have been consolidated on that basis. Our insurance companies’ financial reporting processes conform to calendar year reporting as required by state insurance departments. Management believes that consolidating their calendar year into our fiscal year financial statements does not materially affect the financial position or results of operations. We disclose any material events occurring during the intervening period. Consequently, all references to our insurance subsidiaries’ years 2012, 2011 and 2010 correspond to fiscal 2013, 2012 and 2011 for AMERCO.
Accounts denominated in non-U.S. currencies have been translated into U.S. dollars. Certain amounts reported in previous years have been reclassified to conform to the current presentation.
Note 2. Principles of Consolidation We apply ASC 810 - Consolidation (“ASC 810”) in our principles of consolidation. ASC 810 addresses
arrangements where a company does not hold a majority of the voting or similar interests of a variable interest entity (“VIE”). A company is required to consolidate a VIE if it has determined it is the primary beneficiary. ASC 810 also addresses the policy when a company owns a majority of the voting or similar rights and exercises effective control.
As promulgated by ASC 810, a VIE is not self-supportive due to having one or both of the following conditions: (i) it has an insufficient amount of equity for it to finance its activities without receiving additional subordinated financial support or (ii) its owners do not hold the typical risks and rights of equity owners. This determination is made upon the creation of a variable interest and is re-assessed on an on-going basis should certain changes in the operations of a VIE, or its relationship with the primary beneficiary trigger a reconsideration under the provisions of ASC 810. After a triggering event occurs the most recent facts and circumstances are utilized in determining whether or not a company is a VIE, which other company(s) have a variable interest in the entity, and whether or not the company’s interest is such that it is the primary beneficiary.
We will continue to monitor our relationships with the other entities regarding who is the primary beneficiary, which could change based on facts and circumstances of any reconsideration events.
During the first quarter of fiscal 2013 SAC Holding II fully repaid the $75.0 million outstanding principal balance on its junior note with AMERCO. Pursuant to ASC 810-10-35-4, we considered this a redetermination event which resulted in AMERCO no longer having a variable interest in SAC Holding II. Further, we determined that the repayment of the junior note had no impact on the existing individual operating entity management agreements thereby affirming our finding that these agreements do not constitute variable interests due to the presence of contractual ‘kick-out’ rights. As a result, the reconsideration event had no effect on the consolidation analysis, and thus we have no basis under ASC 810 to consolidate SAC Holding II.
Intercompany accounts and transactions have been eliminated.
Description of Legal Entities AMERCO is the holding company for:
U-Haul International, Inc (“U-Haul”),
Amerco Real Estate Company (“Real Estate”),
Repwest Insurance Company (“Repwest”), and
Oxford Life Insurance Company (“Oxford”).
Unless the context otherwise requires, the term “Company,” “we,” “us” or “our” refers to AMERCO and all of its legal subsidiaries.

AMERCO AND CONSOLIDATED SUBSIDIARIES NOTES TO CONSOLIDATED FINANCIAL STATEMENTS – (CONTINUED)
F-8
Description of Operating Segments AMERCO has three reportable segments. They are Moving and Storage, Property and Casualty
Insurance and Life Insurance.
The Moving and Storage operating segment includes AMERCO, U-Haul, and Real Estate and the wholly-owned subsidiaries of U-Haul and Real Estate. Operations consist of the rental of trucks and trailers, sales of moving supplies, sales of towing accessories, sales of propane, and the rental of fixed and mobile self-storage spaces to the “do-it-yourself” mover and management of self-storage properties owned by others. Operations are conducted under the registered trade name U-Haul® throughout the United States and Canada.
The Property and Casualty Insurance operating segment includes Repwest and its wholly-owned subsidiaries and ARCOA risk retention group (“ARCOA”). The Property and Casualty Insurance operating segment provides loss adjusting and claims handling for U-Haul through regional offices across North America. The Property and Casualty Insurance operating segment also underwrites components of the Safemove, Safetow, Super Safemove and Safestor protection packages to U-Haul customers. The business plan for the Property and Casualty Insurance operating segment includes offering property and casualty products in other U-Haul related programs. ARCOA is a group captive insurer owned by us and our wholly-owned subsidiaries whose purpose is to provide insurance products related to the moving and storage business.
The Life Insurance operating segment includes Oxford and its wholly-owned subsidiaries. The Life Insurance operating segment provides life and health insurance products primarily to the senior market through the direct writing and reinsuring of life insurance, Medicare supplement and annuity policies.
Note 3. Accounting Policies Use of Estimates
The preparation of financial statements in conformity with the generally accepted accounting principles (“GAAP”) in the United States requires management to make estimates and judgments that affect the amounts reported in the financial statements and accompanying notes. The accounting policies that we deem most critical to us and that require management’s most difficult and subjective judgments include the principles of consolidation, the recoverability of property, plant and equipment, the adequacy of insurance reserves, the recognition and measurement of impairments for investments accounted for under ASC 320 - Investments - Debt and Equity Securities and the recognition and measurement of income tax assets and liabilities. The actual results experienced by us may differ from management’s estimates.
Cash and Cash Equivalents We consider cash and cash equivalents to be highly liquid debt securities with insignificant interest
rate risk with original maturities from the date of purchase of three months or less.
Financial instruments that potentially subject us to concentrations of credit risk consist principally of cash deposits. Accounts at each United States financial institution are insured by the Federal Deposit Insurance Corporation up to $250,000. Accounts at each Canadian financial institution are insured by the Canada Deposit Insurance Corporation up to $100,000 CAD per account. At March 31, 2013 and March 31, 2012, we held cash equivalents in excess of these insured limits. To mitigate this risk, we select financial institutions based on their credit ratings and financial strength.
Investments Fixed Maturities and Marketable Equities. Fixed maturity investments consist of either marketable
debt, equity or redeemable preferred stocks. As of the balance sheet dates, all of our investments in these securities were classified as available-for-sale. Available-for-sale investments are reported at fair value, with unrealized gains or losses recorded net of taxes and applicable adjustments to deferred policy acquisition costs in stockholders’ equity. Fair value for these investments is based on quoted market prices, dealer quotes or discounted cash flows. The cost of investments sold is based on the specific identification method.

AMERCO AND CONSOLIDATED SUBSIDIARIES NOTES TO CONSOLIDATED FINANCIAL STATEMENTS – (CONTINUED)
F-9
In determining if and when a decline in market value below carrying value is an other-than-temporary impairment, management makes certain assumptions or judgments in its assessment including but not limited to: ability to hold the security, quoted market prices, dealer quotes, discounted cash flows, industry factors, financial factors, and issuer specific information. Other-than-temporary impairments, to the extent of the decline, as well as realized gains or losses on the sale or exchange of investments are recognized in the current period operating results.
Mortgage Loans and Notes on Real Estate. Mortgage loans and notes on real estate are reported at their unpaid balance, net of any allowance for possible losses and any unamortized premium or discount.
During fiscal 2013, we recorded $26.1 million of real estate acquisitions obtained through foreclosures or deed-in-lieu of foreclosure on the collateral of assets acquired or originated as mortgage loan investments.
Recognition of Investment Income. Interest income from bonds and mortgage notes is recognized when earned. Dividends on common and preferred stocks are recognized on the ex-dividend dates. Realized gains and losses on the sale or exchange of investments are recognized at the trade date.
Fair Values Fair values of cash equivalents approximate carrying value due to the short period of time to maturity.
Fair values of short-term investments, investments available-for-sale, long-term investments, mortgage loans and notes on real estate, and interest rate swap contracts are based on quoted market prices, dealer quotes or discounted cash flows. Fair values of trade receivables approximate their recorded value.
Our financial instruments that are exposed to concentrations of credit risk consist primarily of temporary cash investments, trade receivables, reinsurance recoverables and notes receivable. Limited credit risk exists on trade receivables due to the diversity of our customer base and their dispersion across broad geographic markets. We place our temporary cash investments with financial institutions and limits the amount of credit exposure to any one financial institution.
We have mortgage receivables, which potentially expose us to credit risk. The portfolio of notes is principally collateralized by self-storage facilities and commercial properties. We have not experienced any material losses related to the notes from individual notes or groups of notes in any particular industry or geographic area. The estimated fair values were determined using the discounted cash flow method and using interest rates currently offered for similar loans to borrowers with similar credit ratings.
The carrying amount of long-term debt and short-term borrowings are estimated to approximate fair value as the actual interest rate is consistent with the rate estimated to be currently available for debt of similar term and remaining maturity.
Other investments including short-term investments are substantially current or bear reasonable interest rates. As a result, the carrying values of these financial instruments approximate fair value.
Derivative Financial Instruments Our objective for holding derivative financial instruments is to manage interest rate risk exposure
primarily through entering interest rate swap agreements. An interest rate swap is a contractual exchange of interest payments between two parties. A standard interest rate swap involves the payment of a fixed rate times a notional amount by one party in exchange for a floating rate times the same notional amount from another party. As interest rates change, the difference to be paid or received is accrued and recognized as interest expense or income over the life of the agreement. We do not enter into these instruments for trading purposes. Counterparties to the interest rate swap agreements are major financial institutions. In accordance with ASC 815 - Derivatives and Hedging, we recognize interest rate swap agreements on the balance sheet at fair value, which is classified as prepaid expenses (asset) or accrued expenses (liability). Derivatives that are not designated as cash flow hedges for accounting purposes must be adjusted to fair value through income. If the derivative qualifies and is designated as a cash flow hedge, changes in its fair value will either be offset against the change in fair value of the hedged item through earnings or recognized in other comprehensive income (loss) until the hedged item is recognized in earnings. See Note 11, Derivatives of the Notes to Consolidated Financial Statements.

AMERCO AND CONSOLIDATED SUBSIDIARIES NOTES TO CONSOLIDATED FINANCIAL STATEMENTS – (CONTINUED)
F-10
Inventories, net Inventories, net were as follows:
March 31, 2013 2012
(In thousands) Truck and trailer parts and accessories (a) $ 51,247 $ 52,973 Hitches and towing components (b) 14,574 13,877 Moving supplies and propane (b) 6,979 7,156
Subtotal 72,800 74,006 Less: LIFO reserves (14,693) (14,541) Less: excess and obsolete reserves (1,711) (730)
Total $ 56,396 $ 58,735 (a) Primarily held for internal usage, including equipment manufacturing and repair (b) Primarily held for retail sales
Inventories consist primarily of truck and trailer parts and accessories used to manufacture and repair rental equipment as well as products and accessories available for retail sale. Inventory is held at our owned locations; our independent dealers do not hold any of our inventory.
Inventory cost is primarily determined using the last-in first-out method (“LIFO”). Inventories valued using LIFO consisted of approximately 96% of the total inventories for March 31, 2013 and 2012. Had we utilized the first-in first-out method (“FIFO”), stated inventory balances would have been $14.7 million and $14.5 million higher at March 31, 2013 and 2012, respectively. In fiscal 2013, the positive effect on income due to liquidation of a portion of the LIFO inventory was $0.1 million.
Property, Plant and Equipment Property, plant and equipment are stated at cost. Interest expense incurred during the initial
construction of buildings and rental equipment is considered part of cost. Depreciation is computed for financial reporting purposes using the straight line or an accelerated method based on a declining balance formula over the following estimated useful lives: rental equipment 2-20 years and buildings and non-rental equipment 3-55 years. We follow the deferral method of accounting based on ASC 908 - Airlines for major overhauls in which engine and transmission overhauls are capitalized and amortized over three years. Routine maintenance costs are charged to operating expense as they are incurred. Gains and losses on dispositions of property, plant and equipment are netted against depreciation expense when realized. The net amount of (gains) or losses netted against depreciation expense were ($22.5) million, ($20.9) million and ($23.1) million during fiscal 2013, 2012 and 2011, respectively. Equipment depreciation is recognized in amounts expected to result in the recovery of estimated residual values upon disposal, i.e., minimize gains or losses. In determining the depreciation rate, historical disposal experience, holding periods and trends in the market for vehicles are reviewed.
We regularly perform reviews to determine whether facts and circumstances exist which indicate that the carrying amount of assets, including estimates of residual value, may not be recoverable or that the useful life of assets are shorter or longer than originally estimated. Reductions in residual values (i.e., the price at which we ultimately expect to dispose of revenue earning equipment) or useful lives will result in an increase in depreciation expense over the life of the equipment. Reviews are performed based on vehicle class, generally subcategories of trucks and trailers. We assess the recoverability of our assets by comparing the projected undiscounted net cash flows associated with the related asset or group of assets over their estimated remaining lives against their respective carrying amounts. We consider factors such as current and expected future market price trends on used vehicles and the expected life of vehicles included in the fleet. Impairment, if any, is based on the excess of the carrying amount over the fair value of those assets If asset residual values are determined to be recoverable, but the useful lives are shorter or longer than originally estimated, the net book value of the assets is depreciated over the newly determined remaining useful lives.

AMERCO AND CONSOLIDATED SUBSIDIARIES NOTES TO CONSOLIDATED FINANCIAL STATEMENTS – (CONTINUED)
F-11
Management determined that additions to the fleet resulting from purchases should be depreciated on an accelerated method based upon a declining formula. Under the declining balances method (2.4 times declining balance), the book value of a rental truck is reduced approximately 16%, 13%, 11%, 9%, 8%, 7%, and 6% during years one through seven, respectively and then reduced on a straight line basis to a salvage value of 20% by the end of year fifteen. Beginning in October 2012, rental equipment subject to this depreciation schedule will be depreciated to a salvage value of 15%. This change had an immaterial effect on our current financial statements. Whereas, a standard straight line approach would reduce the book value by approximately 5.7% per year over the life of the truck. For the affected equipment, the accelerated depreciation was $57.0 million, $54.6 million and $44.8 million greater than what it would have been if calculated under a straight line approach for fiscal 2013, 2012 and 2011, respectively.
Although we intend to sell our used vehicles for prices approximating book value, the extent to which we realize a gain or loss on the sale of used vehicles is dependent upon various factors including but not limited to, the general state of the used vehicle market, the age and condition of the vehicle at the time of its disposal and the depreciation rates with respect to the vehicle. We typically sell our used vehicles at our sales centers throughout North America, on our web site at uhaul.com/trucksales or by phone at 1-866-404-0355. Additionally, we sell a large portion of our pickup and cargo van fleet at automobile dealer auctions.
The carrying value of real estate held for investment, which is lower than market value at the balance sheet date, was $14.3 million and $14.8 million for fiscal 2013 and 2012, respectively, and is included in Investments, other.
Receivables Accounts receivable include trade accounts from moving and self-storage customers and dealers,
insurance premiums and amounts due from re-insurers, less management’s estimate of uncollectible accounts.
Insurance premiums receivable for policies that are billed through contracted agents are recorded net of commission’s payable. A commission payable is recorded as a separate liability for those premiums that are billed direct.
Reinsurance recoverables include case reserves and actuarial estimates of claims incurred but not reported. These receivables are not expected to be collected until after the associated claim has been adjudicated and billed to the re-insurer. The reinsurance recoverables may have little or no allowance for doubtful accounts due to the fact that reinsurance is typically procured from carriers with strong credit ratings. Furthermore, we do not cede losses to a re-insurer if the carrier is deemed financially unable to perform on the contract. Reinsurance recoverables also include insurance ceded to other insurance companies.
Notes and mortgage receivables include accrued interest and are reduced by discounts and amounts considered by management to be uncollectible.
Policy Benefits and Losses, Claims and Loss Expenses Payable Our Life Insurance operating segment’s liabilities for life insurance and certain annuity and health
policies are established to meet the estimated future obligations of policies in force, and are based on mortality, morbidity and withdrawal assumptions from recognized actuarial tables which contain margins for adverse deviation. Liabilities for health, disability and other policies include estimates of payments to be made on insurance claims for reported losses and estimates of losses incurred, but not yet reported. Oxford’s liabilities for deferred annuity contracts consist of contract account balances that accrue to the benefit of the policyholders.

AMERCO AND CONSOLIDATED SUBSIDIARIES NOTES TO CONSOLIDATED FINANCIAL STATEMENTS – (CONTINUED)
F-12
Our Property and Casualty Insurance operating segment’s liability for reported and unreported losses is based on Repwest’s historical data along with industry averages. The liability for unpaid loss adjustment expenses is based on historical ratios of loss adjustment expenses paid to losses paid. Amounts recoverable from re-insurers on unpaid losses are estimated in a manner consistent with the claim liability associated with the re-insured policy. Adjustments to the liability for unpaid losses and loss expenses as well as amounts recoverable from re-insurers on unpaid losses are charged or credited to expense in the periods in which they are made.
Due to the nature of the underlying risks and high degree of uncertainty associated with the determination of the liability for future policy benefits and claims, the amounts to be ultimately paid to settle these liabilities cannot be precisely determined and may vary significantly from the estimated liability, especially for long-tailed casualty lines of business such as excess workers’ compensation. As a result of the long-tailed nature of the excess workers’ compensation policies written by Repwest during 1983 through 2002, and similar policies assumed by Repwest during 2001 through 2003, it may take a number of years for claims to be fully reported and finally settled.
On a regular basis insurance reserve adequacy is reviewed by management to determine if existing assumptions need to be updated.In determining the assumptions for calculating workers’ compensation reserves, management considers multiple factors including the following:
Claimant longevity
Cost trends associated with claimant treatments
Changes in ceding entity and third party administrator reporting practices
Changes in environmental factors including legal and regulatory
Current conditions affecting claim settlements
Future economic conditions including inflation
We have reserved each claim based upon the accumulation of current claim costs projected through the claimants’ life expectancy, then adjusted for applicable reinsurance arrangements. Management reviews each claim bi-annually to determine if the estimated life-time claim costs have increased and then adjusts the reserve estimate accordingly at that time. We have factored in an estimate of what the potential cost increases could be in our incurred but not reported liability. We have not assumed settlement of the existing claims in calculating the reserve amount, unless it is in the final stages of completion.
Increases in claim costs, including medical inflation and new treatments and medications could lead to future adverse development resulting in additional reserve strengthening. Conversely, settlement of existing claims or if injured workers return to work or expire prematurely, could lead to future positive development.
Self-Insurance Reserves U-Haul retains the risk for certain public liability and property damage programs related to the rental
equipment. The consolidated balance sheets include $380.8 million and $380.1 million of liabilities related to these programs as of March 31, 2013 and 2012, respectively. These liabilities are recorded in Policy benefits and losses, claims and loss expenses payable. Management takes into account losses incurred based upon actuarial estimates, past experience, current claim trends, as well as social and economic conditions. This liability is subject to change in the future based upon changes in the underlying assumptions including claims experience, frequency of incidents, and severity of incidents. Based upon additional claims information obtained through the passage of time, we reduced our self-insurance reserve balance associated with prior accident years by $5 million in fiscal 2013 and $20 million in fiscal 2012.

AMERCO AND CONSOLIDATED SUBSIDIARIES NOTES TO CONSOLIDATED FINANCIAL STATEMENTS – (CONTINUED)
F-13
Additionally, as of March 31, 2013 and 2012, the consolidated balance sheets include liabilities of $8.1 million and $6.7 million, respectively, related to our provided medical plan benefits for eligible employees. We estimate this liability based on actual claims outstanding as of the balance sheet date as well as an actuarial estimate of claims incurred but not reported. This liability is reported net of estimated recoveries from excess loss reinsurance policies with unaffiliated insurers of $0.5 million and $0.1 million for fiscal 2013 and 2012, respectively. These amounts are recorded in Accounts payable and accrued expenses on the consolidated balance sheets.
Revenue Recognition Self-moving rentals are recognized for the period that trucks and moving equipment are rented. Self-
storage revenues, based upon the number of paid storage contract days, are recognized as earned during the period. Sales of self-moving and self-storage related products are recognized at the time that title passes and the customer accepts delivery. Property management fee revenues are recognized monthly as services are performed. Property and casualty, traditional life and Medicare supplement insurance premiums are recognized as revenue over the policy periods. For products where premiums are due over a significantly shorter duration than the period over which benefits are provided, such as our single premium whole life product, premiums are recognized when received and excess profits are deferred and recognized in relation to the insurance in force. Interest and investment income are recognized as earned.
Amounts collected from customers for sales tax are recorded on a net basis.
Advertising All advertising costs are expensed as incurred. Advertising expense was $6.7 million, $10.3 million
and $14.9 million in fiscal 2013, 2012 and 2011, respectively.
Deferred Policy Acquisition Costs Commissions and other costs that fluctuate with and are primarily related to the acquisition or renewal
of certain insurance premiums are deferred. For the Life Insurance operating segment’s life and health insurance products, these costs are amortized, with interest, in relation to revenue such that costs are realized as a constant percentage of revenue. For its annuity insurance products the costs are amortized, with interest, in relation to the present value of actual and expected gross profits.
During fiscal 2013, new annuity contract holders were provided with a sales inducement in the form of a premium bonus. Sales inducements are recognized as an asset with a corresponding increase to the policyholder liability and are amortized in a similar manner to deferred acquisition costs. As of December 31, 2012, the sales inducement asset included with Deferred policy acquisition costs, net amounted to $17.2 million on the consolidated balance sheet and amortization expense totaled $ 0.9 million.
Environmental Costs Liabilities are recorded when environmental assessments and remedial efforts, if applicable, are
probable and the costs can be reasonably estimated. The amount of the liability is based on management’s best estimate of undiscounted future costs. Certain recoverable environmental costs related to the removal of underground storage tanks or related contamination are capitalized and amortized over the estimated useful lives of the properties. These costs improve the safety or efficiency of the property or are incurred in preparing the property for sale.
Income Taxes AMERCO files a consolidated tax return with all of its legal subsidiaries. In accordance with ASC 740 -
Income Taxes (“ASC 740”), the provision for income taxes reflects deferred income taxes resulting from changes in temporary differences between the tax basis of assets and liabilities and their reported amounts in the financial statements.
Comprehensive Income (Loss) Comprehensive income (loss) consists of net earnings, foreign currency translation adjustments,
unrealized gains and losses on investments, the change in fair value of cash flow hedges and the change in postretirement benefit obligation.

AMERCO AND CONSOLIDATED SUBSIDIARIES NOTES TO CONSOLIDATED FINANCIAL STATEMENTS – (CONTINUED)
F-14
Recent Accounting Pronouncements In February 2013, the FASB issued Accounting Standards Update (“ASU”) 2013-02, Reporting of
Amounts Reclassified Out of Accumulated Other Comprehensive Income, an amendment to FASB ASC Topic 220. The update requires disclosure of amounts reclassified out of accumulated other comprehensive income by component. In addition, an entity is required to present either on the face of the statement of operations or in the notes, significant amounts reclassified out of accumulated other comprehensive income by the respective line items of net income but only if the amount reclassified is required to be reclassified to net income in its entirety in the same reporting period. For amounts not reclassified in their entirety to net income, an entity is required to cross-reference to other disclosures that provide additional detail about those amounts. This ASU is effective prospectively for the Company’s fiscal years, and interim periods within those years beginning after December 15, 2012. We do not believe the adoption of this will have a material impact on our financial statements.
Adoption of New Accounting Pronouncements In October 2010, the FASB issued ASU 2010-26, Financial Services – Insurance (Topic 944) (“ASU
2010-26”) which amended FASB ASC 944-30 to provide further guidance regarding the capitalization of costs relating to the acquisition or renewal of insurance contracts. Specifically, only qualifying costs associated with successful contract acquisitions are permitted to be deferred. We adopted ASU 2010-26 in the first quarter of fiscal 2013 and it resulted in a $1.7 million reduction in beginning retained earnings on our financial statements.
In May 2011, the FASB issued ASU 2011-04, Amendments to Achieve Common Fair Value Measurement and Disclosure Requirements in U.S. GAAP and International Financial Reporting Standards (“IFRS”) (“ASU 2011-04”). This pronouncement was issued to provide a consistent definition of fair value and ensure that the fair value measurement and disclosure requirements are similar between U.S. GAAP and IFRS. ASU 2011-04 changes certain fair value measurement principles and enhances the disclosure requirements particularly for Level 3 fair value measurements. We adopted ASU 2011-04 in the first quarter of fiscal 2013 and it did not have a material impact on our financial statements.
In July 2012, the FASB issued ASU 2012-02, Intangibles – Goodwill and Others (Topic 350) (“ASU 2012-02”) which allows an entity to first assess qualitative factors to determine whether it is necessary to perform a quantitative impairment test of an indefinite-lived intangible asset. Per the terms of ASU 2012-02, an entity would not be required to calculate the fair value of an indefinite-lived intangible asset unless the entity determines, based on qualitative assessment, that it is not more likely than not, the indefinite-lived intangible asset is impaired. We adopted ASU 2012-02 in the third quarter of fiscal 2013 and it did not have a material impact on our financial statements.
From time to time, new accounting pronouncements are issued by the FASB or the SEC that are adopted by the Company as of the specified effective date. Unless otherwise discussed, these ASU’s entail technical corrections to existing guidance or affect guidance related to specialized industries or entities and therefore will have minimal, if any, impact on our financial position or results of operations upon adoption.
Note 4. Earnings Per Share Net earnings for purposes of computing earnings per common share for fiscal 2012 and 2011 are net
earnings less preferred stock dividends paid, adjusted for the price paid by us for the redemption of our preferred stock less its carrying value on our balance sheet. Preferred stock dividends include accrued dividends of AMERCO. Preferred stock dividends paid to or accrued for entities that are part of the consolidated group are eliminated in consolidation.
The weighted average common shares outstanding exclude post-1992 shares of the employee stock ownership plan that have not been committed to be released. The unreleased shares, net of shares committed to be released, were 66,669; 110,504; and 153,069 as of March 31, 2013, 2012, and 2011, respectively.

AMERCO AND CONSOLIDATED SUBSIDIARIES NOTES TO CONSOLIDATED FINANCIAL STATEMENTS – (CONTINUED)
F-15
On June 1, 2011, we redeemed all 6,100,000 shares of our issued and outstanding Series A 8½% Preferred Stock (“Series A Preferred”) at a redemption price of $25 per share plus accrued dividends through that date. Pursuant to ASC 260 – Earnings Per Share (“ASC 260”), for earnings per share purposes, we recognized the deficit of the carrying amount of the Series A Preferred over the consideration paid to redeem the shares.
The Series A Preferred was recorded in our Additional Paid-In Capital account, net of original issue costs at $146.3 million prior to the redemption. We paid $152.5 million to redeem the shares on June 1, 2011, of which $7.7 million was paid to our insurance subsidiaries in exchange for their holdings. The difference between what was paid to redeem the shares less their carrying amount on our balance sheet, reduced by our insurance subsidiaries holdings was $5.9 million. This amount was recognized as a reduction to our earnings available to our common shareholders for the purposes of computing earnings per share for fiscal 2012.
From January 1, 2009 through March 31, 2011, our insurance subsidiaries purchased 308,300 shares of our Series A Preferred on the open market for $7.2 million. Pursuant to ASC 260 we recognized $0.2 million charge to net earnings for fiscal 2011 in connection with these purchases.
Note 5. Reinsurance Recoverables and Trade Receivables, Net Reinsurance recoverables and trade receivables, net were as follows:
March 31, 2013 2012 (In thousands) Reinsurance recoverable $ 186,533 $ 240,824 Trade accounts receivable 43,413 37,323 Paid losses recoverable 1,677 1,124 Accrued investment income 13,210 9,911 Premiums and agents' balances 2,813 1,717 Independent dealer receivable 334 402 Other receivable 14,803 7,801 262,783 299,102 Less: Allowance for doubtful accounts (994) (1,128) $ 261,789 $ 297,974
Note 6. Investments Expected maturities may differ from contractual maturities as borrowers may have the right to call or
prepay obligations with or without call or prepayment penalties.
We deposit bonds with insurance regulatory authorities to meet statutory requirements. The adjusted cost of bonds on deposit with insurance regulatory authorities was $16.4 million and $16.1 million at March 31, 2013 and 2012, respectively.

AMERCO AND CONSOLIDATED SUBSIDIARIES NOTES TO CONSOLIDATED FINANCIAL STATEMENTS – (CONTINUED)
F-16
Available-for-Sale Investments Available-for-sale investments at March 31, 2013 were as follows:
Amortized
Cost
Gross Unrealized
Gains
Gross Unrealized
Losses More than 12 Months
Gross Unrealized
Losses Less than 12 Months
Estimated Market Value
(In thousands) U.S. treasury securities and government obligations $ 24,518 $ 2,749 $ (3) $ (3) $ 27,261 U.S. government agency mortgage-backed securities 44,934 4,027 (7) (73) 48,881 Obligations of states and political subdivisions 154,692 16,056 (2) (292) 170,454 Corporate securities 729,677 51,596 (373) (2,265) 778,635 Mortgage-backed securities 6,730 282 (27) – 6,985 Redeemable preferred stocks 23,705 751 (214) (30) 24,212 Common stocks 43,729 273 (4,685) (407) 38,910 $ 1,027,985 $ 75,734 $ (5,311) $ (3,070) $ 1,095,338
Available-for-sale investments at March 31, 2012 were as follows:
Amortized
Cost
Gross Unrealized
Gains
Gross Unrealized
Losses More than 12 Months
Gross Unrealized
Losses Less than 12 Months
Estimated Market Value
(In thousands) U.S. treasury securities and government obligations $ 29,152 $ 2,964 $ (18) $ (9) $ 32,089 U.S. government agency mortgage-backed securities 48,938 4,866 (1) (7) 53,796 Obligations of states and political subdivisions 142,824 9,435 – (147) 152,112 Corporate securities 445,433 33,350 (619) (2,236) 475,928 Mortgage-backed securities 11,572 282 (38) (5) 11,811 Redeemable preferred stocks 24,370 1,066 (1,627) (632) 23,177 Common stocks 27,736 37 (9,720) (174) 17,879 $ 730,025 $ 52,000 $ (12,023) $ (3,210) $ 766,792
The tables above include gross unrealized losses that are not deemed to be other-than-temporarily impaired, aggregated by investment category and length of time that individual securities have been in a continuous unrealized loss position.
We sold available-for-sale securities with a fair value of $165.1 million, $141.1 million and $134.7 million in fiscal 2013, 2012 and 2011, respectively. The gross realized gains on these sales totaled $9.5 million, $5.9 million and $2.0 million in fiscal 2013, 2012 and 2011, respectively. We realized gross losses on these sales of $0.7 million, $0.2 million and $0.2 million in fiscal 2013, 2012 and 2011, respectively.
The unrealized losses of more than twelve months in the tables above are considered temporary declines. The majority of this unrealized loss is related to our long term investments in 1.8 million shares of Bank of America common stock. We track each investment with an unrealized loss and evaluate them on an individual basis for other-than-temporary impairments including obtaining corroborating opinions from third party sources, performing trend analysis and reviewing management’s future plans. Certain of these investments may have declines determined by management to be other-than-temporary and we recognized these write-downs through earnings. We recognized other-than-temporary impairments of $0.1 million and $0.8 million in fiscal 2012 and 2011, respectively. There were no write downs in fiscal 2013.

AMERCO AND CONSOLIDATED SUBSIDIARIES NOTES TO CONSOLIDATED FINANCIAL STATEMENTS – (CONTINUED)
F-17
The investment portfolio primarily consists of corporate securities and U.S. government securities. We believe we monitor our investments as appropriate. Our methodology of assessing other-than-temporary impairments is based on security-specific analysis as of the balance sheet date and considers various factors including the length of time to maturity, the extent to which the fair value has been less than the cost, the financial condition and the near-term prospects of the issuer, and whether the debtor is current on its contractually obligated interest and principal payments. Nothing has come to management’s attention that would lead to the belief that each issuer would not have the ability to meet the remaining contractual obligations of the security, including payment at maturity. We have the ability and intent not to sell its fixed maturity and common stock investments for a period of time sufficient to allow us to recover our costs.
The portion of other-than-temporary impairment related to a credit loss is recognized in earnings. The significant inputs utilized in the evaluation of mortgage backed securities credit losses include ratings, delinquency rates, and prepayment activity. The significant inputs utilized in the evaluation of asset backed securities credit losses include the time frame for principal recovery and the subordination and value of the underlying collateral.
Credit losses recognized in earnings for which a portion of an other-than-temporary impairment was recognized in other comprehensive income were as follows:
Credit Loss (In thousands) Balance at March 31, 2012 $ 552 Additions:
Other-than-temporary impairment not previously recognized – Balance at March 31, 2013 $ 552
The adjusted cost and estimated market value of available-for-sale investments at March 31, 2013 and 2012, respectively, by contractual maturity, were as follows:
March 31, 2013 March 31, 2012
Amortized
Cost
Estimated Market Value
Amortized Cost
Estimated Market Value
(In thousands) Due in one year or less $ 43,658 $ 44,333 $ 40,219 $ 40,688 Due after one year through five years 180,448 191,930 157,444 165,852 Due after five years through ten years 281,546 302,188 176,694 188,225 Due after ten years 448,169 486,780 291,990 319,160 953,821 1,025,231 666,347 713,925 Mortgage backed securities 6,730 6,985 11,572 11,811 Redeemable preferred stocks 23,705 24,212 24,370 23,177 Equity securities 43,729 38,910 27,736 17,879 $ 1,027,985 $ 1,095,338 $ 730,025 $ 766,792

AMERCO AND CONSOLIDATED SUBSIDIARIES NOTES TO CONSOLIDATED FINANCIAL STATEMENTS – (CONTINUED)
F-18
Investments, other The carrying value of other investments was as follows:
March 31, 2013 2012 (In thousands) Mortgage loans, net $ 156,934 $ 166,249 Short-term investments 43,574 50,239 Real estate 20,406 20,032 Policy loans 16,460 15,677 Other equity investments 4,391 6,354 $ 241,765 $ 258,551
Mortgage loans are carried at the unpaid balance, less an allowance for probable losses and any unamortized premium or discount. The allowance for probable losses was $0.4 million as of March 31, 2013 and 2012. The estimated fair value of these loans as of March 31, 2013 and 2012 approximated the carrying value. These loans represent first lien mortgages held by us.
Short-term investments consist primarily of investments in money market funds, mutual funds and any other investments with short-term characteristics that have original maturities of less than one year at acquisition. These investments are recorded at cost, which approximates fair value.
Real estate obtained through foreclosure and held for sale is carried at the lower of fair value at time of foreclosure or current estimated fair value less cost to sell. Other equity investments are carried at cost and assessed for impairment.
Insurance policy loans are carried at their unpaid balance.
Note 7. Other Assets Other assets were as follows:
March 31, 2013 2012 (In thousands) Deposits (debt-related) $ 41,153 $ 61,154 Cash surrender value of life insurance policies 30,769 29,785 Excess of loss reinsurance recoverable 15,000 15,000 Deferred charges 8,661 10,647 Other 4,403 3,939 $ 99,986 $ 120,525

AMERCO AND CONSOLIDATED SUBSIDIARIES NOTES TO CONSOLIDATED FINANCIAL STATEMENTS – (CONTINUED)
F-19
Note 8. Net Investment and Interest Income Net investment and interest income, were as follows:
Years Ended March 31, 2013 2012 2011 (In thousands) Fixed maturities $ 50,696 $ 41,439 $ 32,782 Real estate 380 81 361 Insurance policy loans 1,126 489 259 Mortgage loans 17,952 7,002 5,249 Short-term, amounts held by ceding reinsurers, net and other investments
367 1,084 749 Investment income 70,521 50,095 39,400
Less: investment expenses (1,375) (1,338) (1,269) Investment income - Related party 13,757 24,795 24,614 Net investment and interest income $ 82,903 $ 73,552 $ 62,745
Note 9. Borrowings Long-Term Debt
Long-term debt was as follows:
March 31, 2013 Rate (a) Maturities 2013 2012 (In thousands) Real estate loan (amortizing term) 6.93% 2018 $ 235,000 $ 245,000 Real estate loan (revolving credit) – 2018 – – Real estate loan (amortizing term) 2.10% 2016 24,630 25,451 Real estate loan (revolving credit) – 2014 – 23,920 Senior mortgages 4.90% - 5.75% 2015 - 2038 556,522 459,822 Working capital loan (revolving credit) – 2015 – – Fleet loans (amortizing term) 1.75% - 6.92% 2013 - 2020 361,079 384,888 Fleet loan (securitization) 4.90% - 5.56% 2014 - 2017 190,801 228,655 Capital leases (rental equipment) 2.37% - 9.57% 2015 - 2020 273,458 110,256 Other obligations 3.00% - 8.00% 2013 - 2043 20,355 8,219
Total notes, loans and leases payable $ 1,661,845 $ 1,486,211 (a) Interest rate as of March 31, 2013, including the effect of applicable hedging instruments
Real Estate Backed Loans Real Estate Loan
Amerco Real Estate Company and certain of its subsidiaries and U-Haul Company of Florida are borrowers under a Real Estate Loan. The loan has a final maturity date of August 2018. The loan is comprised of a term loan facility with initial availability of $300.0 million and a revolving credit facility with current availability of $41.0 million. As of March 31, 2013, the outstanding balance on the Real Estate Loan was $235.0 million and we had the full $41.0 million available to be drawn. U-Haul International, Inc. is a guarantor of this loan.

AMERCO AND CONSOLIDATED SUBSIDIARIES NOTES TO CONSOLIDATED FINANCIAL STATEMENTS – (CONTINUED)
F-20
The amortizing term portion of the Real Estate Loan requires monthly principal and interest payments, with the unpaid loan balance and accrued and unpaid interest due at maturity. The revolving credit portion of the Real Estate Loan requires monthly interest payments when drawn, with the unpaid loan balance and any accrued and unpaid interest due at maturity. The Real Estate Loan is secured by various properties owned by the borrowers.
The interest rate for the amortizing term portion, per the provisions of the amended loan agreement, is the applicable London Inter-Bank Offer Rate (“LIBOR”) plus the applicable margin. At March 31, 2013, the applicable LIBOR was 0.21% and the applicable margin was 1.50%, the sum of which was 1.71%. The rate on the term facility portion of the Real Estate Loan is hedged with an interest rate swap fixing the rate at 6.93% based on current margin.
The interest rate for the revolving credit facility, per the provision of the amended loan agreement, is the applicable LIBOR plus the applicable margin. The margin ranges from 1.50% to 2.00%.
The default provisions of the Real Estate Loan include non-payment of principal or interest and other standard reporting and change-in-control covenants. There are limited restrictions regarding our use of the funds.
Amerco Real Estate Company and a subsidiary of U-Haul International, Inc. entered into a revolving credit construction loan effective June 29, 2006. This loan was modified and extended on June 27, 2011. This loan is now comprised of a term loan facility with an initial availability of $26.1 million and a final maturity of June 2016. As of March 31, 2013, the outstanding balance was $24.6 million.
This Real Estate Loan requires monthly principal and interest payments, with the unpaid loan balance and any accrued and unpaid interest due at maturity. The interest rate, per the provision of this loan agreement, is the applicable LIBOR plus a margin of 1.90%. At March 31, 2013, the applicable LIBOR was 0.20% and the margin was 1.90%, the sum of which was 2.10%. U-Haul International, Inc. and AMERCO are guarantors of this loan. The default provisions of the loan include non-payment of principal or interest and other standard reporting and change-in-control covenants.
On April 29, 2011, Amerco Real Estate Company and U-Haul Company of Florida entered into a revolving credit agreement for $100.0 million. This agreement was amended in February 2013 and the maturity extended to April 2014 with an option for a one year extension and the revolver balance was reduced to $50.0 million. As of March 31, 2013, we had the full $50.0 million available to be drawn. The interest rate is the applicable LIBOR plus a margin of 1.25%. AMERCO and U-Haul International, Inc. are guarantors of this facility. The default provisions of the loan include non-payment of principal or interest and other standard reporting and change-in-control covenants.
Senior Mortgages
Various subsidiaries of Amerco Real Estate Company and U-Haul International, Inc. are borrowers under certain senior mortgages. These senior mortgage loan balances as of March 31, 2013 were in the aggregate amount of $556.5 million and mature between 2015 and 2038. The senior mortgages require average monthly principal and interest payments with the unpaid loan balance and accrued and unpaid interest due at maturity. The senior mortgages are secured by certain properties owned by the borrowers. The interest rates, per the provisions of the senior mortgages, range between 4.90% and 5.75%. Amerco Real Estate Company and U-Haul International, Inc. have provided limited guarantees of the senior mortgages. The default provisions of the senior mortgages include non-payment of principal or interest and other standard reporting and change-in-control covenants. There are limited restrictions regarding our use of the funds.

AMERCO AND CONSOLIDATED SUBSIDIARIES NOTES TO CONSOLIDATED FINANCIAL STATEMENTS – (CONTINUED)
F-21
Working Capital Loans
Amerco Real Estate Company is a borrower under an asset backed working capital loan. The maximum amount that can be drawn at any one time is $25.0 million. At March 31, 2013, we had the full $25.0 million available to be drawn. This loan is secured by certain properties owned by the borrower. This loan agreement provides for revolving loans, subject to the terms of the loan agreement. This agreement was amended in February 2013 and the maturity extended to April 2015. This loan requires monthly interest payments with the unpaid loan balance and accrued and unpaid interest due at maturity. U-Haul International, Inc. and AMERCO are the guarantors of this loan. The default provisions of the loan include non-payment of principal or interest and other standard reporting and change-in-control covenants. The interest rate, per the provision of this loan agreement, is the applicable LIBOR plus a margin of 1.25%.
Fleet Loans Rental Truck Amortizing Loans
U-Haul International, Inc. and several of its subsidiaries are borrowers under amortizing term loans. The balance of the loans as of March 31, 2013 was $246.1 million with the final maturities between July 2013 and January 2020.
The Amortizing Loans require monthly principal and interest payments, with the unpaid loan balance and accrued and unpaid interest due at maturity. These loans were used to purchase new trucks. The interest rates, per the provision of the Loan Agreements, are the applicable LIBOR plus a margin between 0.90% and 2.63%. At March 31, 2013, the applicable LIBOR was between 0.20% and 0.21% and applicable margins were between 0.90% and 2.63%. The interest rates are hedged with interest rate swaps fixing the rates between 1.75% and 6.92% based on current margins. Additionally, $41.4 million of these loans are carried at fixed rates between 2.59% to 3.94%.
AMERCO and U-Haul International, Inc. are guarantors of these loans. The default provisions of these loans include non-payment of principal or interest and other standard reporting and change-in-control covenants.
On December 31, 2009, a subsidiary of U-Haul International, Inc. entered into an $85.0 million term note that was used to fund cargo van and pickup acquisitions. This term note was amended on August 26, 2011. The amount of the term note was increased to $95.0 million. On December 22, 2011, we entered into another term loan for $20.0 million. The final maturity date of these notes is August 2016. The agreements contain options to extend the maturity through May 2017. These notes are secured by the purchased equipment and the corresponding operating cash flows associated with their operation. These notes have fixed interest rates between 3.52% and 3.53%. At March 31, 2013, the outstanding balance was $115.0 million.
AMERCO and U-Haul International, Inc. are guarantors of these loans. The default provisions of these loans include non-payment of principal or interest and other standard reporting and change-in-control covenants. Rental Truck Securitizations
U-Haul S Fleet and its subsidiaries (collectively, “USF”) issued a $217.0 million asset-backed note (“2007 Box Truck Note”) on June 1, 2007. USF is a bankruptcy-remote special purpose entity wholly-owned by U-Haul International, Inc. The net proceeds from the securitized transaction were used to finance new box truck purchases throughout fiscal 2008. U.S. Bank, NA acts as the trustee for this securitization.
The 2007 Box Truck Note has a fixed interest rate of 5.56% with an expected final maturity of February 2014. At March 31, 2013, the outstanding balance was $82.7 million. The note is secured by the box trucks that were purchased and the corresponding operating cash flows associated with their operation.

AMERCO AND CONSOLIDATED SUBSIDIARIES NOTES TO CONSOLIDATED FINANCIAL STATEMENTS – (CONTINUED)
F-22
The 2007 Box Truck Note has the benefit of a financial guaranty insurance policy which guarantees the timely payment of interest on and the ultimate payment of the principal of this note.
2010 U-Haul S Fleet and its subsidiaries (collectively, “2010 USF”) issued a $155.0 million asset-backed note (“2010 Box Truck Note”) on October 28, 2010. 2010 USF is a bankruptcy-remote special purpose entity wholly-owned by U-Haul International, Inc. The net proceeds from the securitized transaction were used to finance new box truck purchases. U.S. Bank, NA acts as the trustee for this securitization.
The 2010 Box Truck Note has a fixed interest rate of 4.90% with an expected final maturity of October 2017. At March 31, 2013, the outstanding balance was $108.1 million. The note is secured by the box trucks being purchased and the corresponding operating cash flows associated with their operation.
The 2007 Box Truck Note and 2010 Box Truck Note are subject to certain covenants with respect to liens, additional indebtedness of the special purpose entities, the disposition of assets and other customary covenants of bankruptcy-remote special purpose entities. The default provisions of these notes include non-payment of principal or interest and other standard reporting and change-in-control covenants.
Capital Leases
We entered into capital leases for new equipment between April 2008 and March 2013, with terms of the leases between 5 and 7 years. At March 31, 2013, the balance of these leases was $273.5 million.
Other Obligations
In February 2011, the Company and US Bank, National Association (the “Trustee”) entered into the U-Haul Investors Club Indenture. The Company and the Trustee entered into this indenture to provide for the issuance of notes (“U-Notes”) by us directly to investors over our proprietary website, uhaulinvestorsclub.com. The U-Notes are secured by various types of collateral including rental equipment and real estate. U-Notes are issued in smaller series that vary as to principal amount, interest rate and maturity. U-Notes are obligations of the Company and secured by the associated collateral; they are not guaranteed by any of the Company’s affiliates or subsidiaries.
At March 31, 2013 the aggregate outstanding principal balance of the U-Notes issued was $26.9 million of which $6.5 million is with our insurance subsidiaries with interest rates between 3.00% and 8.00% and maturity dates between 2013 and 2043.
Annual Maturities of Notes, Loans and Leases Payable The annual maturities of long-term debt as of March 31, 2013 for the next five years and thereafter are
as follows:
March 31, 2014 2015 2016 2017 2018 Thereafter (In thousands) Notes, loans and leases payable, secured $ 226,944 $ 110,659 $ 522,455 $ 286,445 $ 169,025 $ 346,317

AMERCO AND CONSOLIDATED SUBSIDIARIES NOTES TO CONSOLIDATED FINANCIAL STATEMENTS – (CONTINUED)
F-23
Note 10. Interest on Borrowings Interest Expense
Components of interest expense include the following:
Years Ended March 31, 2013 2012 2011 (In thousands) Interest expense $ 66,159 $ 63,523 $ 60,701 Capitalized interest (415) (221) (425) Amortization of transaction costs 4,133 4,428 4,249 Interest expense resulting from derivatives 20,819 22,641 23,856
Total interest expense $ 90,696 $ 90,371 $ 88,381
Interest paid in cash, including payments related to derivative contracts, amounted to $84.6 million, $87.0 million and $84.7 million for fiscal 2013, 2012 and 2011, respectively.
Interest Rates Interest rates and our borrowings were as follows:
Revolving Credit Activity Years Ended March 31, 2013 2012 2011 (In thousands, except interest rates) Weighted average interest rate during the year 1.25% 1.73% 1.75% Interest rate at year end 0.00% 1.74% 0.00% Maximum amount outstanding during the year $ 48,920 $ 38,920 $ 111,000 Average amount outstanding during the year $ 18,707 $ 24,494 $ 36,942 Facility fees $ 449 $ 521 $ 227

AMERCO AND CONSOLIDATED SUBSIDIARIES NOTES TO CONSOLIDATED FINANCIAL STATEMENTS – (CONTINUED)
F-24
Note 11. Derivatives We manage exposure to changes in market interest rates. Our use of derivative instruments is limited
to highly effective interest rate swaps to hedge the risk of changes in cash flows (future interest payments) attributable to changes in LIBOR rates, the designated benchmark interest rate being hedged on certain of our LIBOR indexed variable rate debt and a variable rate operating lease. The interest rate swaps effectively fix our interest payments on certain LIBOR indexed variable rate debt. We monitor our positions and the credit ratings of its counterparties and does not currently anticipate non-performance by the counterparties. Interest rate swap agreements are not entered into for trading purposes.
Original variable rate
debt and lease amount Agreement Date Effective Date Expiration Date
Designated cash flow hedge date
(In millions) $ 50.0 6/21/2006 7/10/2006 7/10/2013 6/9/2006 300.0 8/16/2006 8/18/2006 8/10/2018 8/4/2006 30.0 2/9/2007 2/12/2007 2/10/2014 2/9/2007 20.0 3/8/2007 3/12/2007 3/10/2014 3/8/2007 20.0 3/8/2007 3/12/2007 3/10/2014 3/8/2007 19.3 (a) 4/8/2008 8/15/2008 6/15/2015 3/31/2008 19.0 8/27/2008 8/29/2008 7/10/2015 4/10/2008 30.0 9/24/2008 9/30/2008 9/10/2015 9/24/2008 15.0 (a) 3/24/2009 3/30/2009 3/30/2016 3/25/2009 14.7 (a) 7/6/2010 8/15/2010 7/15/2017 7/6/2010 25.0 (a) 4/26/2011 6/1/2011 6/1/2018 7/1/2011 50.0 (a) 7/29/2011 8/15/2011 8/15/2018 7/29/2011 20.0 (a) 8/3/2011 9/12/2011 9/10/2018 8/3/2011 15.1 (b) 3/27/2012 3/28/2012 3/28/2019 3/26/2012 25.0 4/13/2012 4/16/2012 4/1/2019 4/12/2012 44.3 1/11/2013 1/15/2013 12/15/2019 7/25/2012 (a) forward swap (b) operating lease
As of March 31, 2013, the total notional amount of our variable interest rate swaps on debt and an operating lease was $450.1 million and $13.7 million, respectively.

AMERCO AND CONSOLIDATED SUBSIDIARIES NOTES TO CONSOLIDATED FINANCIAL STATEMENTS – (CONTINUED)
F-25
The derivative fair values located in Accounts payable and accrued expenses in the balance sheets were as follows:
Liability Derivative Fair Value as of March 31, 2013 March 31, 2012 (In thousands) Interest rate contracts designated as hedging instruments $ 51,550 $ 59,313
The Effect of Interest Rate Contracts on the Statements of
Operations March 31, 2013 March 31, 2012 (In thousands) Loss recognized in income on interest rate contracts $ 20,819 $ 22,641 (Gain) loss recognized in AOCI on interest rate contracts (effective portion) $ (9,405) $ 9,179 Loss reclassified from AOCI into income (effective portion) $ 19,178 $ 23,559 (Gain) loss recognized in income on interest rate contracts (ineffective portion and amount excluded from effectiveness testing) $ 1,641 $ (918)
Gains or losses recognized in income on derivatives are recorded as interest expense in the statement of operations. At March 31, 2013, we expect to reclassify $16.3 million of net losses on interest rate contracts from accumulated other comprehensive income to earnings that will offset interest payments over the next twelve months. Please see Note 3, Accounting Policies in the Notes to Consolidated Financial Statements.
Note 12. Stockholders’ Equity On June 1, 2011, we redeemed all 6,100,000 shares of our issued and outstanding Series A Preferred
at a redemption price of $25 per share plus accrued dividends through that date. Pursuant to ASC 260, for earnings per share purposes, we recognized the deficit of the carrying amount of the Series A Preferred over the consideration paid to redeem the shares.
The Series A Preferred was recorded in our Additional Paid-In Capital account, net of original issue costs at $146.3 million prior to the redemption. We paid $152.5 million to redeem the shares on June 1, 2011, of which $7.7 million was paid to our insurance subsidiaries in exchange for their holdings. The difference between what was paid to redeem the shares less their carrying amount on our balance sheet, reduced by our insurance subsidiaries holdings was $5.9 million. This amount was recognized as a reduction to our earnings available to our common shareholders for the purposes of computing earnings per share for fiscal 2012.
On November 7, 2012, we declared a special cash dividend on our Common Stock of $5.00 per share to holders of record on November 19, 2012. The dividend was paid on November 30, 2012.
Note 13. Change in Excess Workers’ Compensation Reserves Estimate Our policy is to regularly review the adequacy of loss reserves associated with the lines of business of
its insurance subsidiaries. A review of the underlying claims of Repwest’s excess workers’ compensation business in the third quarter of fiscal 2012, indicated that claims have been developing more adversely than previously anticipated based on a combination of issues including medical inflation, additional treatments, longer claim terms and changes in ceding entity and third party administrator reporting practices. As a result, Repwest adjusted its estimate for excess workers’ compensation reserves in the third quarter of fiscal 2012. The effect of this change increased benefits and losses expense by $48.3 million and decreased net earnings by $31.4 million, or $1.61 per share, for fiscal 2012.

AMERCO AND CONSOLIDATED SUBSIDIARIES NOTES TO CONSOLIDATED FINANCIAL STATEMENTS – (CONTINUED)
F-26
Note 14. Provision for Taxes Earnings before taxes and the provision for taxes consisted of the following:
Years Ended March 31, 2013 2012 2011 (In thousands) Pretax earnings:
U.S. $ 389,342 $ 302,748 $ 270,695 Non-U.S. 19,145 22,888 18,619
Total pretax earnings $ 408,487 $ 325,636 $ 289,314 Current provision (benefit)
Federal $ 116,788 $ 10,899 $ 14,784 State 12,199 5,514 7,475 Non-U.S. 3,344 4,786 3,861 132,331 21,199 26,120
Deferred provision (benefit) Federal 8,466 89,327 70,653 State 1,458 8,310 7,300 Non-U.S. 1,524 1,433 1,666 11,448 99,070 79,619
Provision for income tax expense $ 143,779 $ 120,269 $ 105,739 Income taxes paid (net of income tax refunds received) $ 144,682 $ 10,739 $ 14,265
The difference between the tax provision at the statutory federal income tax rate and the tax provision attributable to income before taxes was as follows:
Years Ended March 31, 2013 2012 2011 (In percentages) Statutory federal income tax rate 35.00% 35.00% 35.00% Increase (reduction) in rate resulting from:
State taxes, net of federal benefit 2.08% 2.70% 3.24% Foreign rate differential (0.45)% (0.55)% (0.34)% Federal tax credits (0.51)% (0.21)% (0.18)% Interest on deferred tax 0.00% 0.12% 0.13% Dividend received deduction (0.03)% (0.06)% (0.08)% Other (0.89)% (0.07)% (1.22)%
Actual tax expense of operations 35.20% 36.93% 36.55%

AMERCO AND CONSOLIDATED SUBSIDIARIES NOTES TO CONSOLIDATED FINANCIAL STATEMENTS – (CONTINUED)
F-27
Significant components of our deferred tax assets and liabilities were as follows:
March 31, 2013 2012 (In thousands) Deferred tax assets:
Net operating loss and credit carry forwards $ 2,007 $ 3,080 Accrued expenses 153,807 126,361 Policy benefit and losses, claims and loss expenses payable, net 24,137 15,493 Unrealized losses – 6,649 Other 454 –
Total deferred tax assets $ 180,405 $ 151,583 Deferred tax liabilities:
Property, plant and equipment $ 552,548 $ 519,409 Deferred policy acquisition costs 12,270 2,838 Unrealized gains 9,245 – Other – 328
Total deferred tax liabilities 574,063 522,575 Net deferred tax liability $ 393,658 $ 370,992
The net operating loss and credit carry-forwards in the above table are primarily attributable to $14.7 million of state net operating losses that will begin to expire March 31, 2014 if not utilized.
ASC 740 prescribes a minimum recognition and measurement methodology that a tax position is required to meet before being recognized in the financial statements. The total amount of unrecognized tax benefits at April 1, 2012 was $11.8 million. This entire amount of unrecognized tax benefits if resolved in our favor, would favorably impact our effective tax rate. During the current year we recorded tax expense (net of settlements), resulting from uncertain tax positions in the amount of $2.1 million. At March 31, 2013, the amount of unrecognized tax benefits and the amount that would favorably affect our effective tax rate was $13.9 million.
A reconciliation of the total amounts of unrecognized tax benefits at the beginning and end of the period are as follows:
Unrecognized Tax Benefits
(In thousands) Unrecognized tax benefits as of March 31, 2012 $ 11,780
Additions based on tax positions related to the current year 2,163 Reductions for tax positions of prior years – Settlements (81)
Unrecognized tax benefits as of March 31, 2013 $ 13,862
We recognize interest related to unrecognized tax benefits as interest expense, and penalties as operating expenses. At April 1, 2012, the amount of interest and penalties accrued on unrecognized tax benefits was $4.0 million, net of tax. During the current year we recorded expense from interest in the amount of $0.3 million, net of tax. At March 31, 2013, the amount of interest and penalties accrued on unrecognized tax benefits was $4.3 million, net of tax.
We file income tax returns in the U.S. federal jurisdiction, and various states and foreign jurisdictions. With some exceptions, we are no longer subject to audit for years prior to the fiscal year ended March 31, 2010. No provision was made for U.S. taxes payable on undistributed foreign earnings since these amounts are permanently reinvested.

AMERCO AND CONSOLIDATED SUBSIDIARIES NOTES TO CONSOLIDATED FINANCIAL STATEMENTS – (CONTINUED)
F-28
Note 15. Employee Benefit Plans Profit Sharing Plans
We provide tax-qualified profit sharing retirement plans for the benefit of eligible employees, former employees and retirees in the U.S. and Canada. The plans are designed to provide employees with an accumulation of funds for retirement on a tax-deferred basis and provide for annual discretionary employer contributions. Amounts to be contributed are determined by the President and Chairman of the Board of the Company under the delegation of authority from the Board, pursuant to the terms of the Profit Sharing Plan. No contributions were made to the profit sharing plan during fiscal 2013, 2012 or 2011.
We also provide an employee savings plan which allows participants to defer income under Section 401(k) of the Internal Revenue Code of 1986.
ESOP Plan We sponsor a leveraged ESOP that generally covers all employees with one year or more of service.
The ESOP shares initially were pledged as collateral for its debt which was originally funded by U-Haul. As the debt is repaid, shares are released from collateral and allocated to active employees, based on the proportion of debt service paid in the year. When shares are scheduled to be released from collateral, prorated over the year, we report compensation expense equal to the current market price of the shares scheduled to be released, and the shares become outstanding for earnings per share computations. ESOP compensation expense was $5.0 million, $4.4 million and $3.9 million for fiscal 2013, 2012 and 2011, respectively. Listed below is a summary of these financing arrangements as of fiscal year-end:
Outstanding as of Interest Payments Financing Date March 31, 2013 2013 2012 2011
(In thousands) June, 1991 $ 2,169 $ 250 $ 299 $ 386 March, 1999 – – – – February, 2000 – – – 6 April, 2001 – – 5 9 July, 2009 632 35 15 5
Shares are released from collateral and allocated to active employees based on the proportion of debt service paid in the plan year. Contributions to the Plan Trust during fiscal 2013, 2012 and 2011 were $1.7 million, $2.0 million and $2.1 million, respectively.
Shares held by the Plan were as follows:
Years Ended March 31, 2013 2012 (In thousands) Allocated shares 1,374 1,372 Unreleased shares 76 124 Fair value of unreleased shares $ 13,218 $ 12,841
The fair value of unreleased shares issued prior to 1992 is defined as the historical cost of such shares. The fair value of unreleased shares issued subsequent to December 31, 1992 is defined as the trading value of such shares as of March 31, 2013 and March 31, 2012, respectively.

AMERCO AND CONSOLIDATED SUBSIDIARIES NOTES TO CONSOLIDATED FINANCIAL STATEMENTS – (CONTINUED)
F-29
Post Retirement and Post Employment Benefits We provide medical and life insurance benefits to its eligible employees and their dependents upon
retirement from the Company. The retirees must have attained age sixty-five and earned twenty years of full-time service upon retirement for coverage under the medical plan. The medical benefits are capped at a $20,000 lifetime maximum per covered person. The benefits are coordinated with Medicare and any other medical policies in force. Retirees who have attained age sixty-five and earned at least ten years of full-time service upon retirement from the Company are entitled to group term life insurance benefits. The life insurance benefit is $2,000 plus $100 for each year of employment over ten years. The plan is not funded and claims are paid as they are incurred. We use a March 31 measurement date for our post retirement benefit disclosures.
The components of net periodic post retirement benefit cost were as follows:
Years Ended March 31, 2013 2012 2011 (In thousands) Service cost for benefits earned during the period $ 622 $ 515 $ 462 Interest cost on accumulated postretirement benefit 554 568 567 Other components 4 (16) (39)
Net periodic postretirement benefit cost $ 1,180 $ 1,067 $ 990
The fiscal 2013 and fiscal 2012 post retirement benefit liability included the following components:
Years Ended March 31, 2013 2012 (In thousands) Beginning of year $ 12,493 $ 11,103
Service cost for benefits earned during the period 622 515 Interest cost on accumulated post retirement benefit 554 568 Net benefit payments and expense (271) (369) Actuarial loss 978 676
Accumulated postretirement benefit obligation 14,376 12,493 Current liabilities 493 503 Non-current liabilities 13,883 11,990 Total post retirement benefit liability recognized in statement of financial position
14,376 12,493 Components included in accumulated other comprehensive income:
Unrecognized net gain 205 1,179 Cumulative net periodic benefit cost (in excess of employer contribution) $ 14,581 $ 13,672

AMERCO AND CONSOLIDATED SUBSIDIARIES NOTES TO CONSOLIDATED FINANCIAL STATEMENTS – (CONTINUED)
F-30
The discount rate assumptions in computing the information above were as follows:
Years Ended March 31, 2013 2012 2011 (In percentages)
Accumulated postretirement benefit obligation 3.77% 4.17% 5.00%
In December 2003, the Medicare Prescription Drug Improvement and Modernization Act of 2003 became law. Amounts shown on the previous page include the effect of the subsidy. The discount rate represents the expected yield on a portfolio of high grade (AA to AAA rated or equivalent) fixed income investments with cash flow streams sufficient to satisfy benefit obligations under the plan when due. Fluctuations in the discount rate assumptions primarily reflect changes in U.S. interest rates. The assumed health care cost trend rate used to measure the accumulated postretirement benefit obligation as of the end of fiscal 2013 was 7.8% in the initial year and was projected to decline annually to an ultimate rate of 4.5% in fiscal 2029. The assumed health care cost trend rate used to measure the accumulated postretirement benefit obligation as of the end of fiscal 2012 (and used to measure the fiscal 2013 net periodic benefit cost) was 8.1% in the initial year and was projected to decline annually to an ultimate rate of 4.5% in fiscal 2029.
If the estimated health care cost trend rate assumptions were increased by one percent, the accumulated post retirement benefit obligation as of fiscal year-end would increase by $183,633 and the total of the service cost and interest cost components would increase by $15,182. A decrease in the estimated health care cost trend rate assumption of one percent would decrease the accumulated post retirement benefit obligation as of fiscal year-end by $205,342 and the total of the service cost and interest cost components would decrease by $17,098.
Post employment benefits provided by us, other than upon retirement, are not material.
Future net benefit payments are expected as follows:
Future Net Benefit
Payments (In thousands)
Year-ended: 2014 $ 493 2015 580 2016 682 2017 807 2018 940 2019 through 2023 6,974
Total $ 10,476
Note 16. Fair Value Measurements Fair values of cash equivalents approximate carrying value due to the short period of time to maturity.
Fair values of short term investments, investments available-for-sale, long term investments, mortgage loans and notes on real estate, and interest rate swap contracts are based on quoted market prices, dealer quotes or discounted cash flows. Fair values of trade receivables approximate their recorded value.
Our financial instruments that are exposed to concentrations of credit risk consist primarily of temporary cash investments, trade receivables, reinsurance recoverables and notes receivable. Limited credit risk exists on trade receivables due to the diversity of our customer base and their dispersion across broad geographic markets. We place our temporary cash investments with financial institutions and limits the amount of credit exposure to any one financial institution.

AMERCO AND CONSOLIDATED SUBSIDIARIES NOTES TO CONSOLIDATED FINANCIAL STATEMENTS – (CONTINUED)
F-31
We have mortgage receivables, which potentially expose us to credit risk. The portfolio of notes is principally collateralized by self-storage facilities and commercial properties. We have not experienced any material losses related to the notes from individual or groups of notes in any particular industry or geographic area. The estimated fair values were determined using the discounted cash flow method and using interest rates currently offered for similar loans to borrowers with similar credit ratings.
The carrying amount of long term debt and short term borrowings are estimated to approximate fair value as the actual interest rate is consistent with the rate estimated to be currently available for debt of similar term and remaining maturity.
Other investments including short term investments are substantially current or bear reasonable interest rates. As a result, the carrying values of these financial instruments approximate fair value.
Assets and liabilities are recorded at fair value on the condensed consolidated balance sheets and are measured and classified based upon a three tiered approach to valuation. ASC 820 - Fair Value Measurements and Disclosures (“ASC 820”) requires that financial assets and liabilities recorded at fair value be classified and disclosed in one of the following three categories:
Level 1 - Unadjusted quoted prices in active markets that are accessible at the measurement date for identical, unrestricted assets or liabilities;
Level 2 – Quoted prices for identical or similar financial instruments in markets that are not considered to be active, or similar financial instruments for which all significant inputs are observable, either directly or indirectly, or inputs other than quoted prices that are observable, or inputs that are derived principally from or corroborated by observable market data through correlation or other means;
Level 3 – Prices or valuations that require inputs that are both significant to the fair value measurement and are unobservable. These reflect management’s assumptions about the assumptions a market participant would use in pricing the asset or liability.
A financial instrument’s level within the fair value hierarchy is based on the lowest level of any input that is significant to the fair value measurement. The following table represents the financial assets and liabilities on the condensed consolidated balance sheet at March 31, 2013, that are subject to ASC 820 and the valuation approach applied to each of these items.
Total Level 1 Level 2 Level 3 (In thousands)
Assets Short-term investments $ 434,175 $ 434,175 $ – $ – Fixed maturities - available for sale 1,032,215 951,598 79,437 1,180 Preferred stock 24,212 24,212 – – Common stock 38,911 38,911 – – Derivatives 1,165 – 1,165 –
Total $ 1,530,678 $ 1,448,896 $ 80,602 $ 1,180
Liabilities Guaranteed residual values of TRAC leases $ – $ – $ – $ – Derivatives 51,550 – 51,550 – Other obligations – – – –
Total $ 51,550 $ – $ 51,550 $ –
Our fair value measurements take place at the end of each quarter. At the end of the first quarter of fiscal 2013, we transferred $2.3 million of fixed maturities – available for sale from Level 1 to Level 2 due to a reduction in the pricing source available.

AMERCO AND CONSOLIDATED SUBSIDIARIES NOTES TO CONSOLIDATED FINANCIAL STATEMENTS – (CONTINUED)
F-32
The following tables represent the fair value measurements for our assets at March 31, 2013 using significant unobservable inputs (Level 3).
Fixed Maturities - Asset Backed
Securities (In thousands) Balance at March 31, 2012 $ 1,205
Fixed Maturities - Asset Backed Securities - redemption (43) Fixed Maturities - Asset Backed Securities - gain (realized) 18
Balance at March 31, 2013 $ 1,180
Note 17. Reinsurance and Policy Benefits and Losses, Claims and Loss Expenses Payable During their normal course of business, our insurance subsidiaries assume and cede reinsurance on
both a coinsurance and a risk premium basis. They also obtain reinsurance for that portion of risks exceeding their retention limits. The maximum amount of life insurance retained on any one life is $110,000.
Direct
Amount (a)
Ceded to Other
Companies
Assumed from Other Companies
Net Amount (a)
Percentage of Amount
Assumed to Net (In thousands) Year ended December 31, 2012 Life insurance in force $ 811,035 $ 16,471 $ 1,083,550 $ 1,878,114 58% Premiums earned:
Life $ 52,751 $ 2,685 $ 13,640 $ 63,706 21% Accident and health 106,266 454 3,409 109,221 3% Annuity 6,095 1,208 301 5,188 6% Property and casualty 31,537 – 2,805 34,342 8%
Total $ 196,649 $ 4,347 $ 20,155 $ 212,457 Year ended December 31, 2011 Life insurance in force $ 761,070 $ 14,868 $ 1,142,247 $ 1,888,449 60% Premiums earned:
Life $ 63,396 $ 6,909 $ 94,982 $ 151,469 63% Accident and health 115,599 503 3,635 118,731 3% Annuity 9,049 1,920 233 7,362 3% Property and casualty 30,145 – 2,486 32,631 8%
Total $ 218,189 $ 9,332 $ 101,336 $ 310,193 Year ended December 31, 2010 Life insurance in force $ 668,740 $ 3,567 $ 884,932 $ 1,550,105 57% Premiums earned:
Life $ 77,721 $ – $ 37,300 $ 115,021 32% Accident and health 88,441 575 3,815 91,681 4% Annuity – – 290 290 100% Property and casualty 28,179 68 2,593 30,704 8%
Total $ 194,341 $ 643 $ 43,998 $ 237,696
(a) Balances are reported net of inter-segment transactions.

AMERCO AND CONSOLIDATED SUBSIDIARIES NOTES TO CONSOLIDATED FINANCIAL STATEMENTS – (CONTINUED)
F-33
To the extent that a reinsurer is unable to meet its obligation under the related reinsurance agreements, Repwest would remain liable for the unpaid losses and loss expenses. Pursuant to certain of these agreements, Repwest holds letters of credit at year end in the amount of $0.6 million from re-insurers and has issued letters of credit in the amount of $5.3 million in favor of certain ceding companies.
Policy benefits and losses, claims and loss expenses payable for our Property and Casualty Insurance operating segment were as follows:
Years Ended December 31, 2012 2011 (In thousands) Unpaid losses and loss adjustment expense $ 330,093 $ 382,328 Reinsurance losses payable 91 611
Total $ 330,184 $ 382,939
Activity in the liability for unpaid losses and loss adjustment expenses for our Property and Casualty Insurance operating segment is summarized as follows:
Years Ended December 31, 2012 2011 2010 (In thousands) Balance at January 1 $ 382,328 $ 276,355 $ 271,677
Less: reinsurance recoverable 223,865 167,315 162,711 Net balance at January 1 158,463 109,040 108,966 Incurred related to:
Current year 8,962 9,297 9,453 Prior years 7,036 56,445 7,832
Total incurred 15,998 65,742 17,285 Paid related to:
Current year 4,405 5,049 4,971 Prior years 16,402 11,270 12,240
Total paid 20,807 16,319 17,211 Net balance at December 31 153,654 158,463 109,040
Plus: reinsurance recoverable 176,439 223,865 167,315 Balance at December 31 $ 330,093 $ 382,328 $ 276,355
The liability for incurred losses and loss adjustment expenses (net of reinsurance recoverable of $176.4 million) decreased by $4.8 million in 2012.

AMERCO AND CONSOLIDATED SUBSIDIARIES NOTES TO CONSOLIDATED FINANCIAL STATEMENTS – (CONTINUED)
F-34
Note 18. Contingent Liabilities and Commitments We lease a portion of our rental equipment and certain of our facilities under operating leases with
terms that expire at various dates substantially through 2019. As of March 31, 2013, AMERCO has guaranteed $117.9 million of residual values for these rental equipment assets at the end of the respective lease terms. Certain leases contain renewal and fair market value purchase options as well as mileage and other restrictions. At the expiration of the lease, we have the option to renew the lease, purchase the asset for fair market value, or sell the asset to a third party on behalf of the lessor. AMERCO has been leasing equipment since 1987 and has experienced no material losses relating to these types of residual value guarantees.
Lease expenses were as follows:
Years Ended March 31, 2012 2011 2010 (In thousands) Lease expense $ 117,448 $ 131,215 $ 150,809
Lease commitments for leases having terms of more than one year were as follows:
Property, Plant and
Equipment Rental
Equipment Total (In thousands)
Year-ended March 31: 2014 $ 13,691 $ 83,667 $ 97,358 2015 3,121 60,216 63,337 2016 940 32,455 33,395 2017 838 14,530 15,368 2018 663 11,061 11,724 Thereafter 5,051 10,376 15,427
Total $ 24,304 $ 212,305 $ 236,609

AMERCO AND CONSOLIDATED SUBSIDIARIES NOTES TO CONSOLIDATED FINANCIAL STATEMENTS – (CONTINUED)
F-35
Note 19. Contingencies Shoen
In September 2002, Paul F. Shoen filed a shareholder derivative lawsuit in the Second Judicial District Court of the State of Nevada, Washoe County, captioned Paul F. Shoen vs. SAC Holding Corporation et al., CV 02-05602, seeking damages and equitable relief on behalf of AMERCO from SAC Holdings and certain current and former members of the AMERCO Board of Directors, including Edward J. Shoen, Mark V. Shoen and James P. Shoen as Defendants. AMERCO is named as a nominal Defendant in the case. The complaint alleges breach of fiduciary duty, self-dealing, usurpation of corporate opportunities, wrongful interference with prospective economic advantage and unjust enrichment and seeks the unwinding of sales of self-storage properties by subsidiaries of AMERCO to SAC prior to the filing of the complaint. The complaint seeks a declaration that such transfers are void as well as unspecified damages. In October 2002, the Defendants filed motions to dismiss the complaint. Also in October 2002, Ron Belec filed a derivative action in the Second Judicial District Court of the State of Nevada, Washoe County, captioned Ron Belec vs. William E. Carty, et al., CV 02-06331 and in January 2003, M.S. Management Company, Inc. filed a derivative action in the Second Judicial District Court of the State of Nevada, Washoe County, captioned M.S. Management Company, Inc. vs. William E. Carty, et al., CV 03-00386. Two additional derivative suits were also filed against these parties. Each of these suits is substantially similar to the Paul F. Shoen case. The Court consolidated the five cases and thereafter dismissed these actions in May 2003, concluding that the AMERCO Board of Directors had the requisite level of independence required in order to have these claims resolved by the Board. Plaintiffs appealed this decision and, in July 2006, the Nevada Supreme Court reversed the ruling of the trial court and remanded the case to the trial court for proceedings consistent with its ruling, allowing the Plaintiffs to file an amended complaint and plead in addition to substantive claims, demand futility.
In November 2006, the Plaintiffs filed an amended complaint. In December 2006, the Defendants filed motions to dismiss, based on various legal theories. In March 2007, the Court denied AMERCO’s motion to dismiss regarding the issue of demand futility, stating that “Plaintiffs have satisfied the heightened pleading requirements of demand futility by showing a majority of the members of the AMERCO Board of Directors were interested parties in the SAC transactions.” The Court heard oral argument on the remainder of the Defendants’ motions to dismiss, including the motion (“Goldwasser Motion”) based on the fact that the subject matter of the lawsuit had been settled and dismissed in earlier litigation known as Goldwasser v. Shoen, C.V.N.-94-00810-ECR (D.Nev), Washoe County, Nevada. In addition, in September and October 2007, the Defendants filed Motions for Judgment on the Pleadings or in the Alternative Summary Judgment, based on the fact that the stockholders of the Company had ratified the underlying transactions at the 2007 annual meeting of stockholders of AMERCO. In December 2007, the Court denied this motion. This ruling does not preclude a renewed motion for summary judgment after discovery and further proceedings on these issues. On April 7, 2008, the litigation was dismissed, on the basis of the Goldwasser Motion. On May 8, 2008, the Plaintiffs filed a notice of appeal of such dismissal to the Nevada Supreme Court (the “Court”). On May 20, 2008, AMERCO filed a cross appeal relating to the denial of its Motion to Dismiss in regard to demand futility.
On May 12, 2011, the Nevada Supreme Court affirmed in part, reversed in part, and remanded the case for further proceedings. First, the Court ruled that the Goldwasser settlement did not release claims that arose after the agreement and, therefore, reversed the trial court’s dismissal of the Complaint on that ground. Second, the Court affirmed the district court’s determination that the in pari delicto defense is available in a derivative suit and reversed and remanded to the district court to determine if the defense applies to this matter. Third, the Court remanded to the district court to conduct an evidentiary hearing to determine whether demand upon the AMERCO Board was, in fact, futile. Fourth, the Court invited AMERCO to seek a ruling from the district court as to the legal effect of the AMERCO Shareholders’ 2008 ratification of the underlying AMERCO/SAC transactions.

AMERCO AND CONSOLIDATED SUBSIDIARIES NOTES TO CONSOLIDATED FINANCIAL STATEMENTS – (CONTINUED)
F-36
Last, as to individual claims for relief, the Court affirmed the district court’s dismissal of the breach of fiduciary duty of loyalty claims as to all defendants except Mark Shoen. The Court affirmed the district court’s dismissal of the breach of fiduciary duty: ultra vires Acts claim as to all defendants. The Court reversed the district court’s dismissal of aiding and abetting a breach of fiduciary duty and unjust enrichment claims against the SAC entities. The Court reversed the trial court’s dismissal of the claim for wrongful interference with prospective economic advantage as to all defendants.
On remand, on July 22, 2011, AMERCO filed a Motion for Summary Judgment based upon the Shareholder’s Ratification of the SAC transactions. In addition, on August 29, 2011, certain defendants filed a Motion to Dismiss Plaintiffs’ Claim for Wrongful Interference with Prospective Economic Advantage. On August 31, 2011, the trial court held a status conference and entered an order setting forth the briefing schedule for the two motions. On December 23, 2011, the trial court denied AMERCO’s motion for summary judgment and certain defendants’ motion to dismiss. The court set a discovery schedule on the limited issue of demand futility. A four day evidentiary hearing on demand futility was scheduled to begin on August 20, 2012.
On August 6, 2012, Max Belec and Glenbrook Capital Limited Partnership, voluntarily dismissed their complaint with prejudice. On August 20, 2012, the remaining plaintiffs, Paul Shoen and Alan Kahn, dismissed their complaint with prejudice. AMERCO paid none of plaintiffs’ attorneys’ fees or costs. In return, AMERCO released plaintiffs from further related litigation based on plaintiffs’ conduct in this litigation. Moreover, Paul Shoen, Alan Kahn, Grover Wickersham and numerous individuals and entities related to Paul Shoen and Grover Wickersham agreed to sell all of their AMERCO securities in the open market and not sue AMERCO or any of the other defendants for 20 years. If the plaintiffs or the related parties breach this agreement, Paul Shoen will be responsible for $5,000,000 in liquidated damages. The parties filed a final Mutual Release Agreement with the Court on October 16, 2012, thereby terminating the case in its entirety, with prejudice.
Environmental Compliance with environmental requirements of federal, state and local governments may significantly
affect Real Estate’s business operations. Among other things, these requirements regulate the discharge of materials into the air, land and water and govern the use and disposal of hazardous substances. Real Estate is aware of issues regarding hazardous substances on some of its properties. Real Estate regularly makes capital and operating expenditures to stay in compliance with environmental laws and has put in place a remedial plan at each site where it believes such a plan is necessary. Since 1988, Real Estate has managed a testing and removal program for underground storage tanks.
Based upon the information currently available to Real Estate, compliance with the environmental laws and its share of the costs of investigation and cleanup of known hazardous waste sites are not expected to result in a material adverse effect on AMERCO’s financial position or results of operations.
Other We are named as a defendant in various other litigation and claims arising out of the normal course of
business. In management’s opinion, none of these other matters will have a material effect on our financial position and results of operations.
Note 20. Related Party Transactions As set forth in the Audit Committee Charter and consistent with NASDAQ Listing Rules, the
Company’s Audit Committee (the “Audit Committee”) reviews and maintains oversight over related party transactions which are required to be disclosed under the Securities and Exchange Commission (“SEC”) rules and regulations. Accordingly, all such related party transactions are submitted to the Audit Committee for ongoing review and oversight. Our internal processes ensure that our legal and finance departments identify and monitor potential related party transactions which may require disclosure and Audit Committee oversight.
AMERCO has engaged in related party transactions and has continuing related party interests with certain major stockholders, directors and officers of the consolidated group as disclosed below. Management believes that the transactions described below and in the related notes were completed on terms substantially equivalent to those that would prevail in arm’s-length transactions.
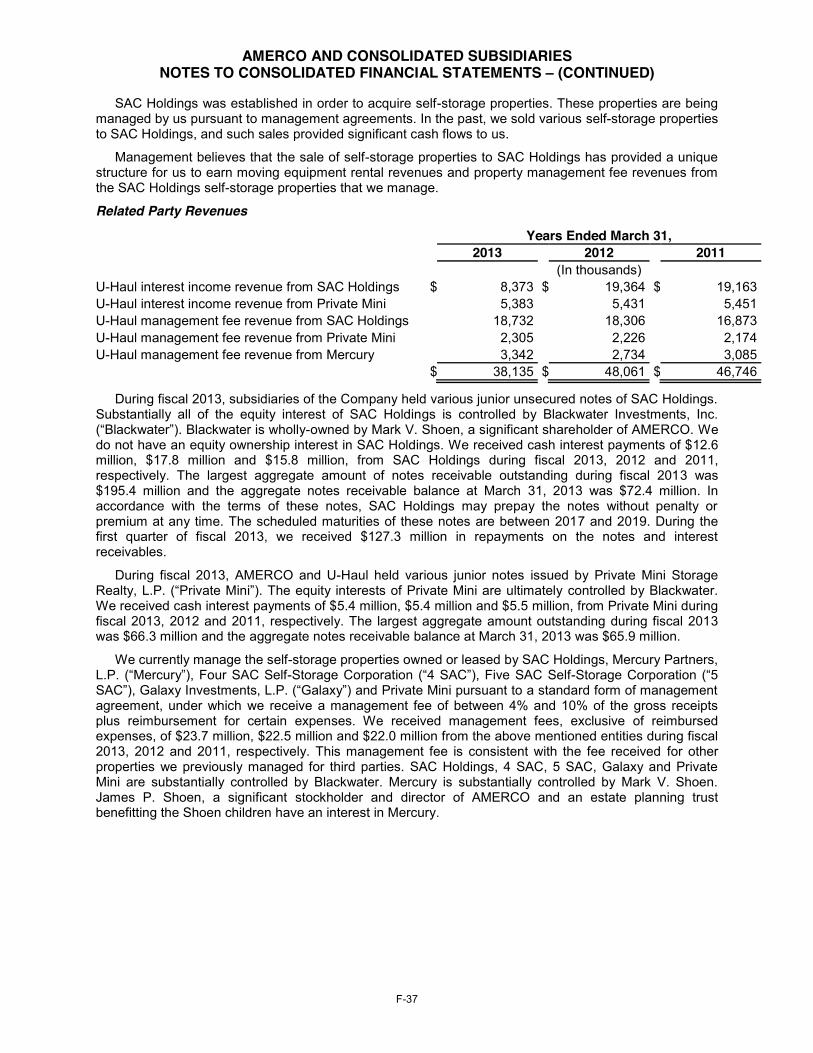
AMERCO AND CONSOLIDATED SUBSIDIARIES NOTES TO CONSOLIDATED FINANCIAL STATEMENTS – (CONTINUED)
F-37
SAC Holdings was established in order to acquire self-storage properties. These properties are being managed by us pursuant to management agreements. In the past, we sold various self-storage properties to SAC Holdings, and such sales provided significant cash flows to us.
Management believes that the sale of self-storage properties to SAC Holdings has provided a unique structure for us to earn moving equipment rental revenues and property management fee revenues from the SAC Holdings self-storage properties that we manage.
Related Party Revenues
Years Ended March 31, 2013 2012 2011 (In thousands) U-Haul interest income revenue from SAC Holdings $ 8,373 $ 19,364 $ 19,163 U-Haul interest income revenue from Private Mini 5,383 5,431 5,451 U-Haul management fee revenue from SAC Holdings 18,732 18,306 16,873 U-Haul management fee revenue from Private Mini 2,305 2,226 2,174 U-Haul management fee revenue from Mercury 3,342 2,734 3,085 $ 38,135 $ 48,061 $ 46,746
During fiscal 2013, subsidiaries of the Company held various junior unsecured notes of SAC Holdings. Substantially all of the equity interest of SAC Holdings is controlled by Blackwater Investments, Inc. (“Blackwater”). Blackwater is wholly-owned by Mark V. Shoen, a significant shareholder of AMERCO. We do not have an equity ownership interest in SAC Holdings. We received cash interest payments of $12.6 million, $17.8 million and $15.8 million, from SAC Holdings during fiscal 2013, 2012 and 2011, respectively. The largest aggregate amount of notes receivable outstanding during fiscal 2013 was $195.4 million and the aggregate notes receivable balance at March 31, 2013 was $72.4 million. In accordance with the terms of these notes, SAC Holdings may prepay the notes without penalty or premium at any time. The scheduled maturities of these notes are between 2017 and 2019. During the first quarter of fiscal 2013, we received $127.3 million in repayments on the notes and interest receivables.
During fiscal 2013, AMERCO and U-Haul held various junior notes issued by Private Mini Storage Realty, L.P. (“Private Mini”). The equity interests of Private Mini are ultimately controlled by Blackwater. We received cash interest payments of $5.4 million, $5.4 million and $5.5 million, from Private Mini during fiscal 2013, 2012 and 2011, respectively. The largest aggregate amount outstanding during fiscal 2013 was $66.3 million and the aggregate notes receivable balance at March 31, 2013 was $65.9 million.
We currently manage the self-storage properties owned or leased by SAC Holdings, Mercury Partners, L.P. (“Mercury”), Four SAC Self-Storage Corporation (“4 SAC”), Five SAC Self-Storage Corporation (“5 SAC”), Galaxy Investments, L.P. (“Galaxy”) and Private Mini pursuant to a standard form of management agreement, under which we receive a management fee of between 4% and 10% of the gross receipts plus reimbursement for certain expenses. We received management fees, exclusive of reimbursed expenses, of $23.7 million, $22.5 million and $22.0 million from the above mentioned entities during fiscal 2013, 2012 and 2011, respectively. This management fee is consistent with the fee received for other properties we previously managed for third parties. SAC Holdings, 4 SAC, 5 SAC, Galaxy and Private Mini are substantially controlled by Blackwater. Mercury is substantially controlled by Mark V. Shoen. James P. Shoen, a significant stockholder and director of AMERCO and an estate planning trust benefitting the Shoen children have an interest in Mercury.

AMERCO AND CONSOLIDATED SUBSIDIARIES NOTES TO CONSOLIDATED FINANCIAL STATEMENTS – (CONTINUED)
F-38
Related Party Costs and Expenses
Years Ended March 31, 2013 2012 2011 (In thousands) U-Haul lease expenses to SAC Holdings $ 2,626 $ 2,430 $ 2,491 U-Haul commission expenses to SAC Holdings 41,185 39,167 34,858 U-Haul commission expenses to Private Mini 2,650 2,523 2,399 $ 46,461 $ 44,120 $ 39,748
We lease space for marketing company offices, vehicle repair shops and hitch installation centers from subsidiaries of SAC Holdings, 5 SAC and Galaxy. The terms of the leases are similar to the terms of leases for other properties owned by unrelated parties that are leased to us.
At March 31, 2013, subsidiaries of SAC Holdings, 4 SAC, 5 SAC, Galaxy and Private Mini acted as U-Haul independent dealers. The financial and other terms of the dealership contracts with the aforementioned companies and their subsidiaries are substantially identical to the terms of those with our other independent dealers whereby commissions are paid by us based upon equipment rental revenue.
These agreements and notes with subsidiaries of SAC Holdings, 4 SAC, 5 SAC, Galaxy and Private Mini, excluding Dealer Agreements, provided revenues of $34.8 million, expenses of $2.6 million and cash flows of $159.6 million during fiscal 2013. Revenues and commission expenses related to the Dealer Agreements were $200.3 million and $43.8 million, respectively for fiscal 2013.
Pursuant to the variable interest entity model under ASC 810 – Consolidation (“ASC 810”), Management determined that the junior notes of SAC Holdings and Private Mini as well as the management agreements with SAC Holdings, Mercury, 4 SAC, 5 SAC, Galaxy, and Private Mini represent potential variable interests for us. Management evaluated whether it should be identified as the primary beneficiary of one or more of these VIE’s using a two step approach in which management (i) identified all other parties that hold interests in the VIE’s, and (ii) determined if any variable interest holder has the power to direct the activities of the VIE’s that most significantly impact their economic performance.
Management determined that they do not have a variable interest in the holding entities Mercury, 4 SAC, 5 SAC, or Galaxy based upon management agreements which are with the individual operating entities or through the issuance of junior debt therefore, we are precluded from consolidating these entities. Additionally, after a redetermination caused by the SAC Holding II repayment of the outstanding principal on its junior notes with AMERCO during the first quarter of fiscal 2013, Management has determined that the Company does not have a variable interest in the SAC Holding II holding entity.
We have junior debt with the holding entities SAC Holding Corporation and Private Mini which represents a variable interest in each individual entity. Though we have certain protective rights within these debt agreements, we have no present influence or control over these holding entities unless their protective rights become exercisable, which management considers unlikely based on their payment history. As a result, we have no basis under ASC 810 to consolidate these entities.
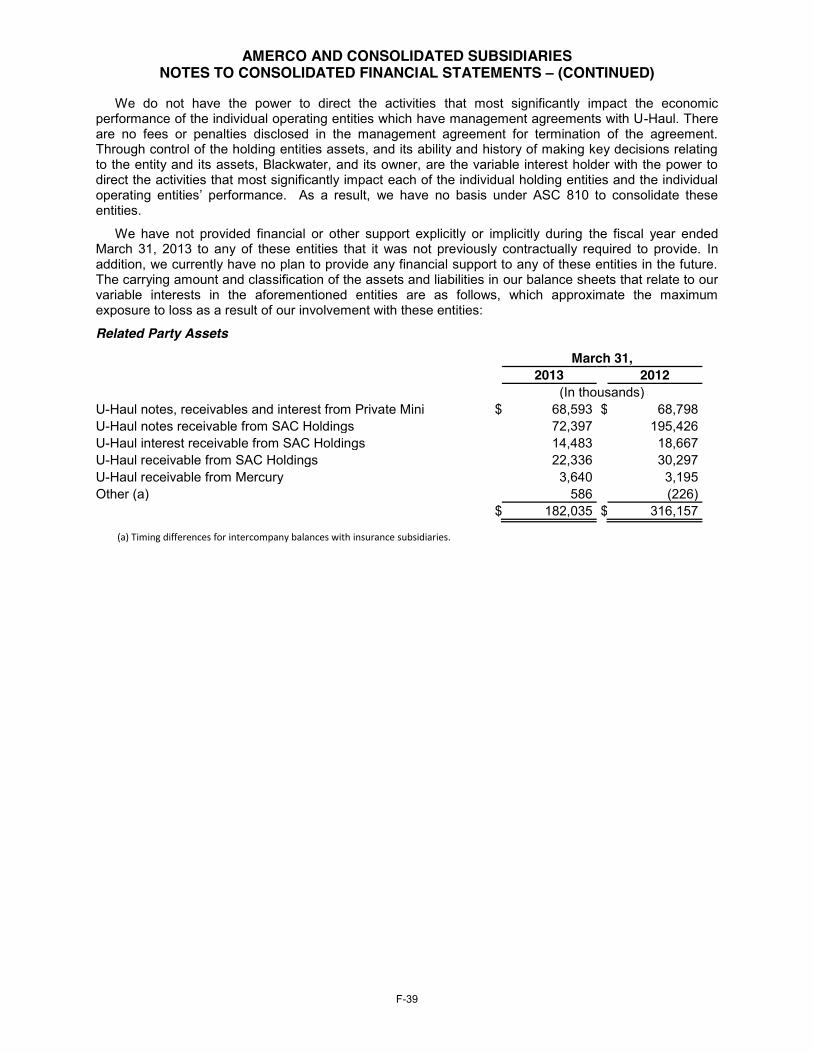
AMERCO AND CONSOLIDATED SUBSIDIARIES NOTES TO CONSOLIDATED FINANCIAL STATEMENTS – (CONTINUED)
F-39
We do not have the power to direct the activities that most significantly impact the economic performance of the individual operating entities which have management agreements with U-Haul. There are no fees or penalties disclosed in the management agreement for termination of the agreement. Through control of the holding entities assets, and its ability and history of making key decisions relating to the entity and its assets, Blackwater, and its owner, are the variable interest holder with the power to direct the activities that most significantly impact each of the individual holding entities and the individual operating entities’ performance. As a result, we have no basis under ASC 810 to consolidate these entities.
We have not provided financial or other support explicitly or implicitly during the fiscal year ended March 31, 2013 to any of these entities that it was not previously contractually required to provide. In addition, we currently have no plan to provide any financial support to any of these entities in the future. The carrying amount and classification of the assets and liabilities in our balance sheets that relate to our variable interests in the aforementioned entities are as follows, which approximate the maximum exposure to loss as a result of our involvement with these entities:
Related Party Assets
March 31, 2013 2012 (In thousands) U-Haul notes, receivables and interest from Private Mini $ 68,593 $ 68,798 U-Haul notes receivable from SAC Holdings 72,397 195,426 U-Haul interest receivable from SAC Holdings 14,483 18,667 U-Haul receivable from SAC Holdings 22,336 30,297 U-Haul receivable from Mercury 3,640 3,195 Other (a) 586 (226) $ 182,035 $ 316,157
(a) Timing differences for intercompany balances with insurance subsidiaries.
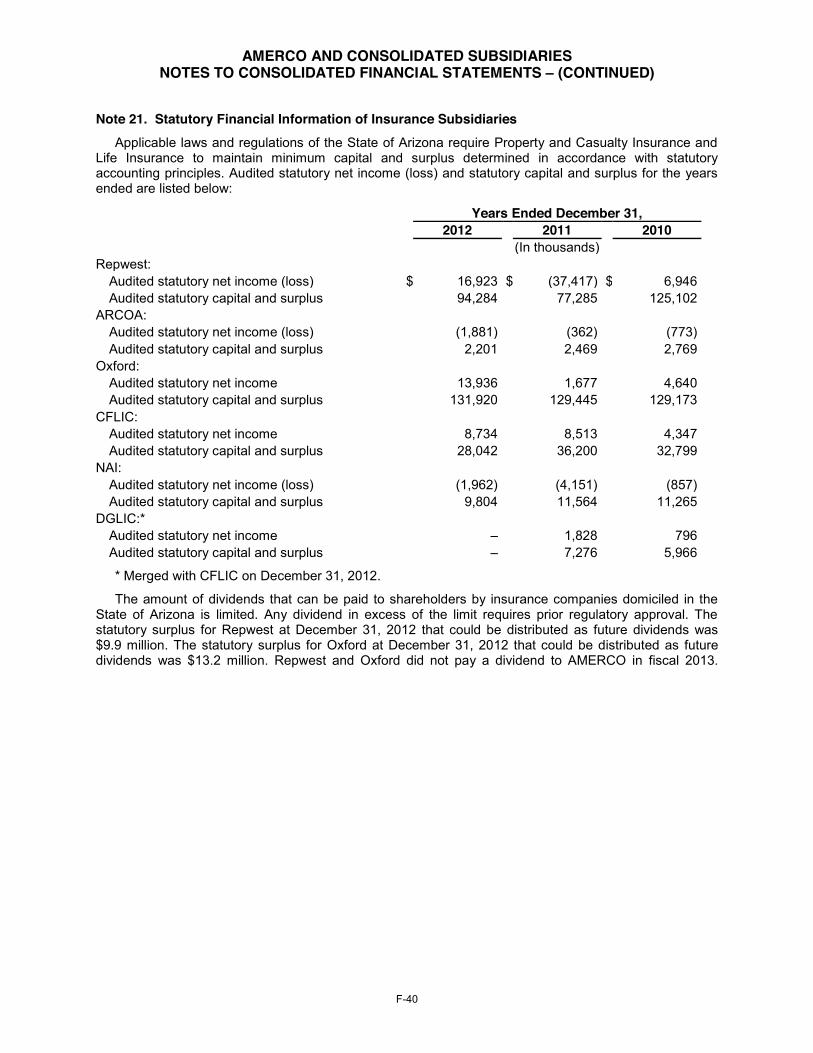
AMERCO AND CONSOLIDATED SUBSIDIARIES NOTES TO CONSOLIDATED FINANCIAL STATEMENTS – (CONTINUED)
F-40
Note 21. Statutory Financial Information of Insurance Subsidiaries Applicable laws and regulations of the State of Arizona require Property and Casualty Insurance and
Life Insurance to maintain minimum capital and surplus determined in accordance with statutory accounting principles. Audited statutory net income (loss) and statutory capital and surplus for the years ended are listed below:
Years Ended December 31, 2012 2011 2010 (In thousands) Repwest:
Audited statutory net income (loss) $ 16,923 $ (37,417) $ 6,946 Audited statutory capital and surplus 94,284 77,285 125,102
ARCOA: Audited statutory net income (loss) (1,881) (362) (773) Audited statutory capital and surplus 2,201 2,469 2,769
Oxford: Audited statutory net income 13,936 1,677 4,640 Audited statutory capital and surplus 131,920 129,445 129,173
CFLIC: Audited statutory net income 8,734 8,513 4,347 Audited statutory capital and surplus 28,042 36,200 32,799
NAI: Audited statutory net income (loss) (1,962) (4,151) (857) Audited statutory capital and surplus 9,804 11,564 11,265
DGLIC:* Audited statutory net income – 1,828 796 Audited statutory capital and surplus – 7,276 5,966
* Merged with CFLIC on December 31, 2012.
The amount of dividends that can be paid to shareholders by insurance companies domiciled in the State of Arizona is limited. Any dividend in excess of the limit requires prior regulatory approval. The statutory surplus for Repwest at December 31, 2012 that could be distributed as future dividends was $9.9 million. The statutory surplus for Oxford at December 31, 2012 that could be distributed as future dividends was $13.2 million. Repwest and Oxford did not pay a dividend to AMERCO in fiscal 2013.

AMERCO AND CONSOLIDATED SUBSIDIARIES NOTES TO CONSOLIDATED FINANCIAL STATEMENTS – (CONTINUED)
F-41
Note 22. Financial Information by Geographic Area
United States Canada Consolidated (All amounts are in thousands U.S. $'s) Fiscal Year Ended March 31, 2013 Total revenues $ 2,409,291 $ 149,296 $ 2,558,587 Depreciation and amortization, net of (gains) losses on disposal 247,413 7,959 255,372 Interest expense 90,137 559 90,696 Pretax earnings 389,342 19,145 408,487 Income tax expense 138,911 4,868 143,779 Identifiable assets 5,160,889 145,712 5,306,601 United States Canada Consolidated (All amounts are in thousands U.S. $'s) Fiscal Year Ended March 31, 2012 Total revenues $ 2,364,560 $ 147,467 $ 2,512,027 Depreciation and amortization, net of (gains) losses on disposal 214,800 7,892 222,692 Interest expense 89,730 641 90,371 Pretax earnings 302,748 22,888 325,636 Income tax expense 114,050 6,219 120,269 Identifiable assets 4,518,772 135,279 4,654,051 United States Canada Consolidated (All amounts are in thousands U.S. $'s) Fiscal Year Ended March 31, 2011 Total revenues $ 2,120,597 $ 130,762 $ 2,251,359 Depreciation and amortization, net of (gains) losses on disposal 192,328 6,432 198,760 Interest expense 87,717 664 88,381 Pretax earnings 270,695 18,619 289,314 Income tax expense 100,212 5,527 105,739 Identifiable assets 4,061,648 129,785 4,191,433
Note 22A. Consolidating Financial Information by Industry Segment AMERCO’s three reportable segments are:
Moving and Storage, comprised of AMERCO, U-Haul, and Real Estate and the subsidiaries of U-Haul and Real Estate,
Property and Casualty Insurance, comprised of Repwest and its subsidiaries and ARCOA,
Life Insurance, comprised of Oxford and its subsidiaries.
Management tracks revenues separately, but does not report any separate measure of the profitability for rental vehicles, rentals of self-storage spaces and sales of products that are required to be classified as a separate operating segment and accordingly does not present these as separate reportable segments. Deferred income taxes are shown as liabilities on the condensed consolidating statements.
The information includes elimination entries necessary to consolidate AMERCO, the parent, with its subsidiaries.
Investments in subsidiaries are accounted for by the parent using the equity method of accounting.
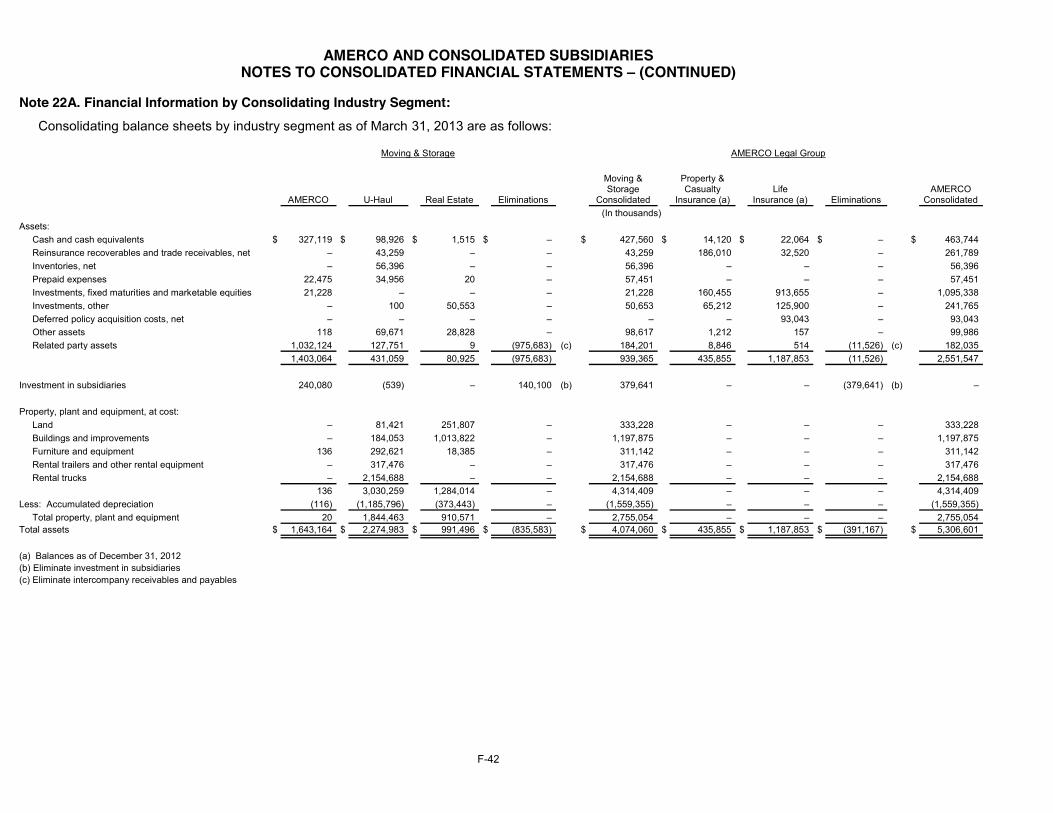
AMERCO AND CONSOLIDATED SUBSIDIARIES NOTES TO CONSOLIDATED FINANCIAL STATEMENTS – (CONTINUED)
F-42
Note 22A. Financial Information by Consolidating Industry Segment: Consolidating balance sheets by industry segment as of March 31, 2013 are as follows:
Moving & Storage AMERCO Legal Group
AMERCO U-Haul Real Estate Eliminations
Moving & Storage
Consolidated
Property & Casualty
Insurance (a) Life
Insurance (a) Eliminations AMERCO
Consolidated (In thousands)
Assets: Cash and cash equivalents $ 327,119 $ 98,926 $ 1,515 $ – $ 427,560 $ 14,120 $ 22,064 $ – $ 463,744 Reinsurance recoverables and trade receivables, net – 43,259 – – 43,259 186,010 32,520 – 261,789 Inventories, net – 56,396 – – 56,396 – – – 56,396 Prepaid expenses 22,475 34,956 20 – 57,451 – – – 57,451 Investments, fixed maturities and marketable equities 21,228 – – – 21,228 160,455 913,655 – 1,095,338 Investments, other – 100 50,553 – 50,653 65,212 125,900 – 241,765 Deferred policy acquisition costs, net – – – – – – 93,043 – 93,043 Other assets 118 69,671 28,828 – 98,617 1,212 157 – 99,986 Related party assets 1,032,124 127,751 9 (975,683) (c) 184,201 8,846 514 (11,526) (c) 182,035
1,403,064 431,059 80,925 (975,683) 939,365 435,855 1,187,853 (11,526) 2,551,547 Investment in subsidiaries 240,080 (539) – 140,100 (b) 379,641 – – (379,641) (b) – Property, plant and equipment, at cost:
Land – 81,421 251,807 – 333,228 – – – 333,228 Buildings and improvements – 184,053 1,013,822 – 1,197,875 – – – 1,197,875 Furniture and equipment 136 292,621 18,385 – 311,142 – – – 311,142 Rental trailers and other rental equipment – 317,476 – – 317,476 – – – 317,476 Rental trucks – 2,154,688 – – 2,154,688 – – – 2,154,688
136 3,030,259 1,284,014 – 4,314,409 – – – 4,314,409 Less: Accumulated depreciation (116) (1,185,796) (373,443) – (1,559,355) – – – (1,559,355)
Total property, plant and equipment 20 1,844,463 910,571 – 2,755,054 – – – 2,755,054 Total assets $ 1,643,164 $ 2,274,983 $ 991,496 $ (835,583) $ 4,074,060 $ 435,855 $ 1,187,853 $ (391,167) $ 5,306,601 (a) Balances as of December 31, 2012 (b) Eliminate investment in subsidiaries (c) Eliminate intercompany receivables and payables

AMERCO AND CONSOLIDATED SUBSIDIARIES NOTES TO CONSOLIDATED FINANCIAL STATEMENTS – (CONTINUED)
F-43
Consolidating balance sheets by industry segment as of March 31, 2013 are as follows: Moving & Storage AMERCO Legal Group
AMERCO U-Haul Real Estate Eliminations
Moving & Storage
Consolidated
Property & Casualty
Insurance (a) Life
Insurance (a) Eliminations AMERCO
Consolidated (In thousands) Liabilities:
Accounts payable and accrued expenses $ 110 $ 345,864 $ 4,378 $ – $ 350,352 $ – $ 8,139 $ – $ 358,491 Notes, loans and leases payable – 881,766 780,079 – 1,661,845 – – – 1,661,845 Policy benefits and losses, claims and loss expenses payable – 380,824 – – 380,824 330,184 404,040 – 1,115,048 Liabilities from investment contracts – – – – – – 510,789 – 510,789 Other policyholders' funds and liabilities – – – – – 3,157 4,137 – 7,294 Deferred income – 30,217 – – 30,217 – – – 30,217 Deferred income taxes 412,089 – – – 412,089 (36,241) 17,810 – 393,658 Related party liabilities – 637,909 347,248 (975,683) (c) 9,474 1,844 208 (11,526) (c) –
Total liabilities 412,199 2,276,580 1,131,705 (975,683) 2,844,801 298,944 945,123 (11,526) 4,077,342 Stockholders' equity :
Series preferred stock: Series A preferred stock – – – – – – – – – Series B preferred stock – – – – – – – – –
Series A common stock – – – – – – – – – Common stock 10,497 1 1 (2) (b) 10,497 3,301 2,500 (5,801) (b) 10,497
Additional paid-in capital 438,378 121,230 147,941 (269,171) (b) 438,378 91,120 26,271 (117,601) (b) 438,168 Accumulated other comprehensive income (loss) (22,680) (62,325) – 62,325 (b) (22,680) 4,568 37,567 (42,135) (b) (22,680) Retained earnings (deficit) 1,482,420 (58,797) (288,151) 346,948 (b) 1,482,420 37,922 176,392 (214,104) (b) 1,482,630 Cost of common shares in treasury, net (525,653) – – – (525,653) – – – (525,653) Cost of preferred shares in treasury, net (151,997) – – – (151,997) – – – (151,997) Unearned employee stock ownership plan shares – (1,706) – – (1,706) – – – (1,706) Total stockholders' equity (deficit) 1,230,965 (1,597) (140,209) 140,100 1,229,259 136,911 242,730 (379,641) 1,229,259 Total liabilities and stockholders' equity $ 1,643,164 $ 2,274,983 $ 991,496 $ (835,583) $ 4,074,060 $ 435,855 $ 1,187,853 $ (391,167) $ 5,306,601 (a) Balances as of December 31, 2012 (b) Eliminate investment in subsidiaries (c) Eliminate intercompany receivables and payables

AMERCO AND CONSOLIDATED SUBSIDIARIES NOTES TO CONSOLIDATED FINANCIAL STATEMENTS – (CONTINUED)
F-44
Consolidating balance sheets by industry segment as of March 31, 2012 are as follows:
Moving & Storage AMERCO Legal Group
AMERCO U-Haul Real Estate Eliminations
Moving & Storage
Consolidated
Property & Casualty
Insurance (a) Life
Insurance (a) Eliminations AMERCO
Consolidated (In thousands)
Assets: Cash and cash equivalents $ 201,502 $ 106,951 $ 775 $ – $ 309,228 $ 22,542 $ 25,410 $ – $ 357,180 Reinsurance recoverables and trade receivables, net – 37,103 – – 37,103 231,211 29,660 – 297,974 Inventories, net – 58,735 – – 58,735 – – – 58,735 Prepaid expenses 9,496 32,051 311 – 41,858 – – – 41,858 Investments, fixed maturities and marketable equities 17,028 – – – 17,028 132,270 617,494 – 766,792 Investments, other – 9,880 42,453 – 52,333 74,757 131,461 – 258,551 Deferred policy acquisition costs, net – – – – – – 63,914 – 63,914 Other assets 483 91,761 26,571 – 118,815 1,507 203 – 120,525 Related party assets 1,201,385 261,341 9 (1,144,545) (c) 318,190 7,542 482 (10,057) (c) 316,157
1,429,894 597,822 70,119 (1,144,545) 953,290 469,829 868,624 (10,057) 2,281,686 Investment in subsidiaries 8,168 – – 331,461 (b) 339,629 – – (339,629) (b) – Property, plant and equipment, at cost:
Land – 67,558 213,582 – 281,140 – – – 281,140 Buildings and improvements – 162,351 924,768 – 1,087,119 – – – 1,087,119 Furniture and equipment 138 289,601 18,381 – 308,120 – – – 308,120 Rental trailers and other rental equipment – 255,010 – – 255,010 – – – 255,010 Rental trucks – 1,856,433 – – 1,856,433 – – – 1,856,433
138 2,630,953 1,156,731 – 3,787,822 – – – 3,787,822 Less: Accumulated depreciation (115) (1,056,854) (358,488) – (1,415,457) – – – (1,415,457)
Total property, plant and equipment 23 1,574,099 798,243 – 2,372,365 – – – 2,372,365 Total assets $ 1,438,085 $ 2,171,921 $ 868,362 $ (813,084) $ 3,665,284 $ 469,829 $ 868,624 $ (349,686) $ 4,654,051 (a) Balances as of December 31, 2011 (b) Eliminate investment in subsidiaries (c) Eliminate intercompany receivables and payables
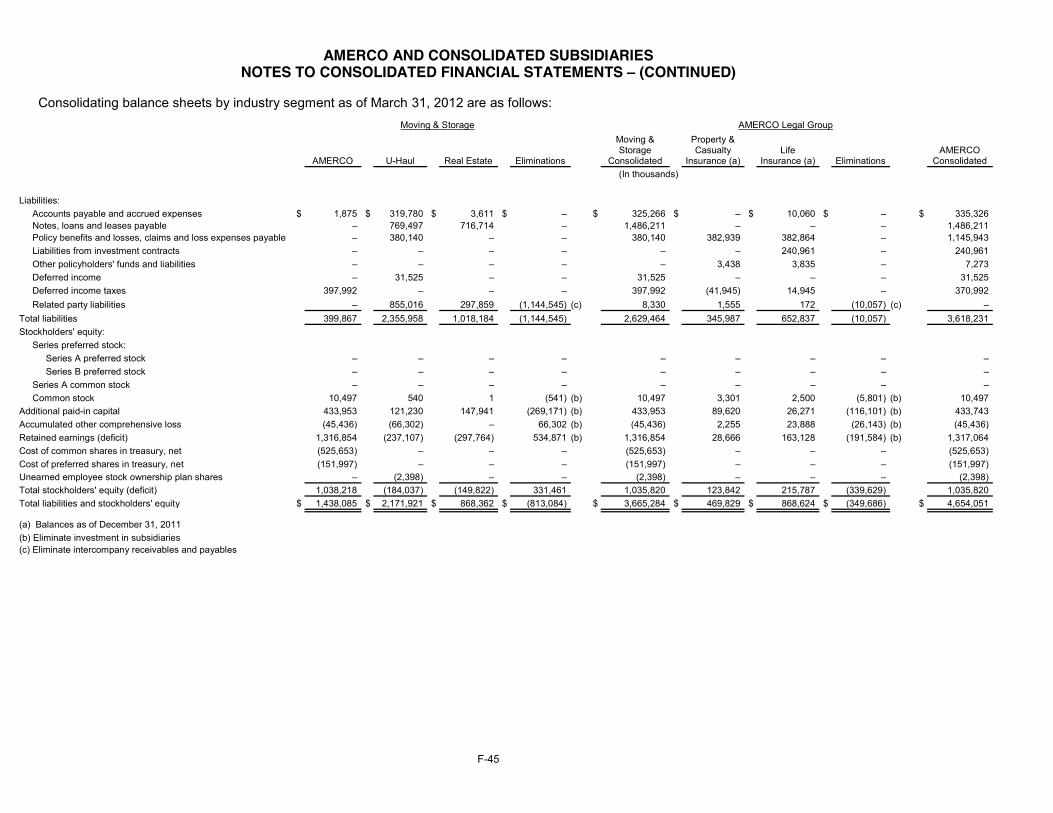
AMERCO AND CONSOLIDATED SUBSIDIARIES NOTES TO CONSOLIDATED FINANCIAL STATEMENTS – (CONTINUED)
F-45
Consolidating balance sheets by industry segment as of March 31, 2012 are as follows: Moving & Storage AMERCO Legal Group
AMERCO U-Haul Real Estate Eliminations
Moving & Storage
Consolidated
Property & Casualty
Insurance (a) Life
Insurance (a) Eliminations AMERCO
Consolidated (In thousands) Liabilities:
Accounts payable and accrued expenses $ 1,875 $ 319,780 $ 3,611 $ – $ 325,266 $ – $ 10,060 $ – $ 335,326 Notes, loans and leases payable – 769,497 716,714 – 1,486,211 – – – 1,486,211 Policy benefits and losses, claims and loss expenses payable – 380,140 – – 380,140 382,939 382,864 – 1,145,943 Liabilities from investment contracts – – – – – – 240,961 – 240,961 Other policyholders' funds and liabilities – – – – – 3,438 3,835 – 7,273 Deferred income – 31,525 – – 31,525 – – – 31,525 Deferred income taxes 397,992 – – – 397,992 (41,945) 14,945 – 370,992 Related party liabilities – 855,016 297,859 (1,144,545) (c) 8,330 1,555 172 (10,057) (c) –
Total liabilities 399,867 2,355,958 1,018,184 (1,144,545) 2,629,464 345,987 652,837 (10,057) 3,618,231 Stockholders' equity:
Series preferred stock: Series A preferred stock – – – – – – – – – Series B preferred stock – – – – – – – – –
Series A common stock – – – – – – – – – Common stock 10,497 540 1 (541) (b) 10,497 3,301 2,500 (5,801) (b) 10,497
Additional paid-in capital 433,953 121,230 147,941 (269,171) (b) 433,953 89,620 26,271 (116,101) (b) 433,743 Accumulated other comprehensive loss (45,436) (66,302) – 66,302 (b) (45,436) 2,255 23,888 (26,143) (b) (45,436) Retained earnings (deficit) 1,316,854 (237,107) (297,764) 534,871 (b) 1,316,854 28,666 163,128 (191,584) (b) 1,317,064 Cost of common shares in treasury, net (525,653) – – – (525,653) – – – (525,653) Cost of preferred shares in treasury, net (151,997) – – – (151,997) – – – (151,997) Unearned employee stock ownership plan shares – (2,398) – – (2,398) – – – (2,398) Total stockholders' equity (deficit) 1,038,218 (184,037) (149,822) 331,461 1,035,820 123,842 215,787 (339,629) 1,035,820 Total liabilities and stockholders' equity $ 1,438,085 $ 2,171,921 $ 868,362 $ (813,084) $ 3,665,284 $ 469,829 $ 868,624 $ (349,686) $ 4,654,051 (a) Balances as of December 31, 2011 (b) Eliminate investment in subsidiaries (c) Eliminate intercompany receivables and payables

AMERCO AND CONSOLIDATED SUBSIDIARIES NOTES TO CONSOLIDATED FINANCIAL STATEMENTS – (CONTINUED)
F-46
Consolidating statements of operations by industry segment for period ending March 31, 2013 are as follows: Moving & Storage AMERCO Legal Group
AMERCO U-Haul Real Estate Eliminations
Moving & Storage
Consolidated
Property & Casualty
Insurance (a) Life
Insurance (a) Eliminations AMERCO
Consolidated (In thousands)
Revenues: Self-moving equipment rentals $ – $ 1,769,058 $ – $ – $ 1,769,058 $ – $ – $ (1,538) (c) $ 1,767,520 Self-storage revenues – 151,512 1,148 – 152,660 – – – 152,660 Self-moving & self-storage products & service sales – 221,117 – – 221,117 – – – 221,117 Property management fees – 24,378 – – 24,378 – – – 24,378 Life insurance premiums – – – – – – 178,115 – 178,115 Property and casualty insurance premiums – – – – – 34,342 – – 34,342 Net investment and interest income 5,248 8,462 4,912 – 18,622 13,858 50,850 (427) (b) 82,903 Other revenue 81 102,776 88,626 (94,976) (b) 96,507 – 2,525 (1,480) (b) 97,552
Total revenues 5,329 2,277,303 94,686 (94,976) 2,282,342 48,200 231,490 (3,445) 2,558,587 Costs and expenses:
Operating expenses 13,611 1,199,550 10,878 (94,976) (b) 1,129,063 18,007 26,482 (2,984) (b,c) 1,170,568 Commission expenses – 228,124 – – 228,124 – – – 228,124 Cost of sales – 107,216 – – 107,216 – – – 107,216 Benefits and losses – – – – – 15,999 164,677 – 180,676 Amortization of deferred policy acquisition costs – – – – – – 17,376 – 17,376 Lease expense 92 117,491 32 – 117,615 – – (167) (b) 117,448 Depreciation, net of (gains) losses on disposals 5 224,407 13,584 – 237,996 – – – 237,996
Total costs and expenses 13,708 1,876,788 24,494 (94,976) 1,820,014 34,006 208,535 (3,151) 2,059,404
Earnings (loss) from operations before equity in earnings of subsidiaries (8,379) 400,515 70,192 – 462,328 14,194 22,955 (294) 499,183
Equity in earnings of subsidiaries 212,164 – – (187,923) (d) 24,241 – – (24,241) (d) – Earnings from operations 203,785 400,515 70,192 (187,923) 486,569 14,194 22,955 (24,535) 499,183
Interest income (expense) 91,125 (124,012) (58,103) – (90,990) – – 294 (b) (90,696) Pretax earnings 294,910 276,503 12,089 (187,923) 395,579 14,194 22,955 (24,241) 408,487
Income tax expense (30,202) (96,099) (4,570) – (130,871) (4,938) (7,970) – (143,779) Earnings available to common shareholders $ 264,708 $ 180,404 $ 7,519 $ (187,923) $ 264,708 $ 9,256 $ 14,985 $ (24,241) $ 264,708 (a) Balances for the year ended December 31, 2012 (b) Eliminate intercompany lease / interest income (c) Eliminate intercompany premiums (d) Eliminate equity in earnings of subsidiaries

AMERCO AND CONSOLIDATED SUBSIDIARIES NOTES TO CONSOLIDATED FINANCIAL STATEMENTS – (CONTINUED)
F-47
Consolidating statements of operations by industry segment for period ending March 31, 2012 are as follows: Moving & Storage AMERCO Legal Group
AMERCO U-Haul Real
Estate Eliminations
Moving & Storage
Consolidated
Property & Casualty
Insurance (a) Life
Insurance (a) Eliminations AMERCO
Consolidated (In thousands)
Revenues: Self-moving equipment rentals $ – $ 1,679,963 $ – $ – $ 1,679,963 $ – $ – $ (1,707) (c) $ 1,678,256 Self-storage revenues – 133,070 1,306 – 134,376 – – – 134,376 Self-moving & self-storage products & service sales – 213,854 – – 213,854 – – – 213,854 Property management fees – 23,266 – – 23,266 – – – 23,266 Life insurance premiums – – – – – – 277,562 – 277,562 Property and casualty insurance premiums – – – – – 32,631 – – 32,631 Net investment and interest income 5,857 20,577 698 – 27,132 9,955 38,127 (1,662) (b,e) 73,552 Other revenue 228 83,894 80,318 (86,108) (b) 78,332 – 1,585 (1,387) (b) 78,530
Total revenues 6,085 2,154,624 82,322 (86,108) 2,156,923 42,586 317,274 (4,756) 2,512,027 Costs and expenses:
Operating expenses 9,081 1,121,681 9,468 (86,108) (b) 1,054,122 13,270 28,885 (3,087) (b,c) 1,093,190 Commission expenses – 212,190 – – 212,190 – – – 212,190 Cost of sales – 116,542 – – 116,542 – – – 116,542 Benefits and losses – – – – – 65,742 254,449 – 320,191 Amortization of deferred policy acquisition costs – – – – – – 13,791 – 13,791 Lease expense 93 132,286 23 – 132,402 – – (1,187) (b) 131,215 Depreciation, net of (gains) losses on disposals 5 195,469 13,427 – 208,901 – – – 208,901
Total costs and expenses 9,179 1,778,168 22,918 (86,108) 1,724,157 79,012 297,125 (4,274) 2,096,020
Earnings (loss) from operations before equity in earnings of subsidiaries (3,094) 376,456 59,404 – 432,766 (36,426) 20,149 (482) 416,007
Equity in earnings of subsidiaries 149,160 – – (159,538) (d) (10,378) – – 10,378 (d) – Earnings from operations 146,066 376,456 59,404 (159,538) 422,388 (36,426) 20,149 9,896 416,007
Interest income (expense) 94,278 (132,781) (52,022) – (90,525) – – 154 (b) (90,371) Pretax earnings (loss) 240,344 243,675 7,382 (159,538) 331,863 (36,426) 20,149 10,050 325,636
Income tax benefit (expense) (34,649) (88,096) (3,423) – (126,168) 12,863 (6,964) – (120,269) Net earnings (loss) 205,695 155,579 3,959 (159,538) 205,695 (23,563) 13,185 10,050 205,367
Less: Excess of redemption value over carrying value of preferred shares redeemed (5,908) – – – (5,908) – – – (5,908) Less: Preferred stock dividends (3,241) – – – (3,241) – – 328 (e) (2,913)
Earnings (loss) available to common shareholders $ 196,546 $ 155,579 $ 3,959 $ (159,538) $ 196,546 $ (23,563) $ 13,185 $ 10,378 $ 196,546 (a) Balances for the year ended December 31, 2011 (b) Eliminate intercompany lease / interest income (c) Eliminate intercompany premiums (d) Eliminate equity in earnings of subsidiaries (e) Elimination of preferred stock dividend paid to affiliate
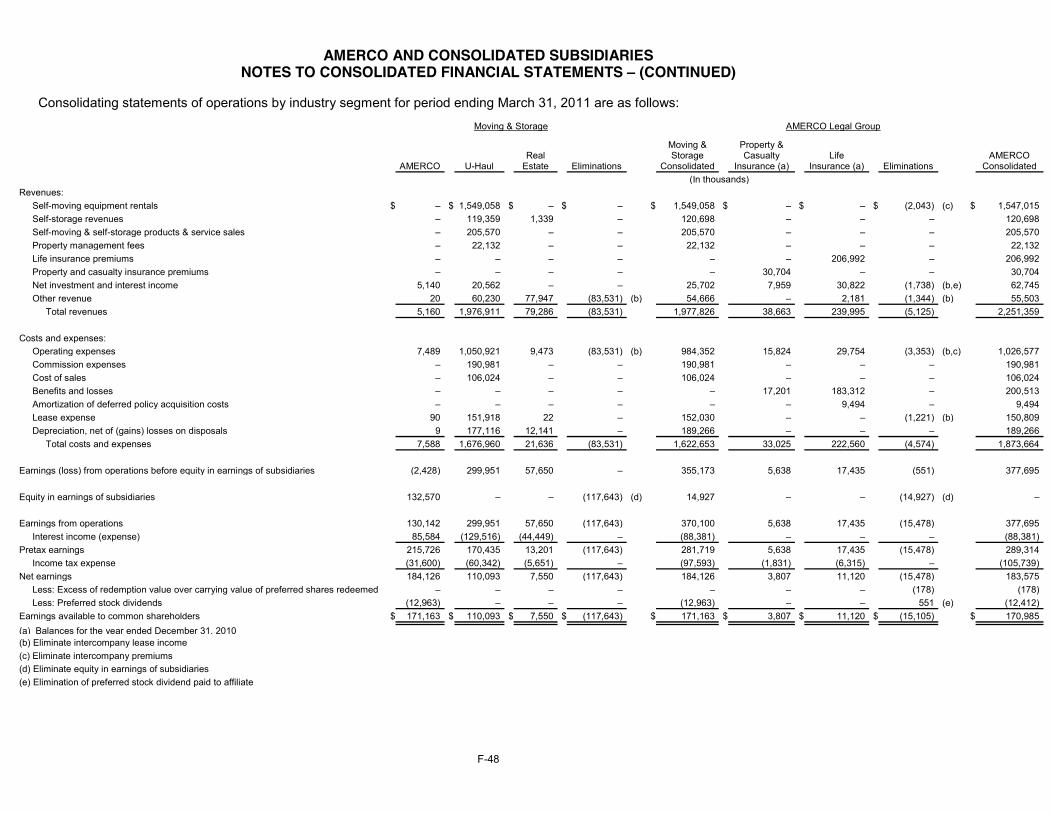
AMERCO AND CONSOLIDATED SUBSIDIARIES NOTES TO CONSOLIDATED FINANCIAL STATEMENTS – (CONTINUED)
F-48
Consolidating statements of operations by industry segment for period ending March 31, 2011 are as follows: Moving & Storage AMERCO Legal Group
AMERCO U-Haul Real
Estate Eliminations
Moving & Storage
Consolidated
Property & Casualty
Insurance (a) Life
Insurance (a) Eliminations AMERCO
Consolidated (In thousands) Revenues:
Self-moving equipment rentals $ – $ 1,549,058 $ – $ – $ 1,549,058 $ – $ – $ (2,043) (c) $ 1,547,015 Self-storage revenues – 119,359 1,339 – 120,698 – – – 120,698 Self-moving & self-storage products & service sales – 205,570 – – 205,570 – – – 205,570 Property management fees – 22,132 – – 22,132 – – – 22,132 Life insurance premiums – – – – – – 206,992 – 206,992 Property and casualty insurance premiums – – – – – 30,704 – – 30,704 Net investment and interest income 5,140 20,562 – – 25,702 7,959 30,822 (1,738) (b,e) 62,745 Other revenue 20 60,230 77,947 (83,531) (b) 54,666 – 2,181 (1,344) (b) 55,503
Total revenues 5,160 1,976,911 79,286 (83,531) 1,977,826 38,663 239,995 (5,125) 2,251,359 Costs and expenses:
Operating expenses 7,489 1,050,921 9,473 (83,531) (b) 984,352 15,824 29,754 (3,353) (b,c) 1,026,577 Commission expenses – 190,981 – – 190,981 – – – 190,981 Cost of sales – 106,024 – – 106,024 – – – 106,024 Benefits and losses – – – – – 17,201 183,312 – 200,513 Amortization of deferred policy acquisition costs – – – – – – 9,494 – 9,494 Lease expense 90 151,918 22 – 152,030 – – (1,221) (b) 150,809 Depreciation, net of (gains) losses on disposals 9 177,116 12,141 – 189,266 – – – 189,266
Total costs and expenses 7,588 1,676,960 21,636 (83,531) 1,622,653 33,025 222,560 (4,574) 1,873,664
Earnings (loss) from operations before equity in earnings of subsidiaries (2,428) 299,951 57,650 – 355,173 5,638 17,435 (551) 377,695
Equity in earnings of subsidiaries 132,570 – – (117,643) (d) 14,927 – – (14,927) (d) – Earnings from operations 130,142 299,951 57,650 (117,643) 370,100 5,638 17,435 (15,478) 377,695
Interest income (expense) 85,584 (129,516) (44,449) – (88,381) – – – (88,381) Pretax earnings 215,726 170,435 13,201 (117,643) 281,719 5,638 17,435 (15,478) 289,314
Income tax expense (31,600) (60,342) (5,651) – (97,593) (1,831) (6,315) – (105,739) Net earnings 184,126 110,093 7,550 (117,643) 184,126 3,807 11,120 (15,478) 183,575
Less: Excess of redemption value over carrying value of preferred shares redeemed – – – – – – – (178) (178) Less: Preferred stock dividends (12,963) – – – (12,963) – – 551 (e) (12,412)
Earnings available to common shareholders $ 171,163 $ 110,093 $ 7,550 $ (117,643) $ 171,163 $ 3,807 $ 11,120 $ (15,105) $ 170,985 (a) Balances for the year ended December 31, 2010 (b) Eliminate intercompany lease income (c) Eliminate intercompany premiums (d) Eliminate equity in earnings of subsidiaries (e) Elimination of preferred stock dividend paid to affiliate
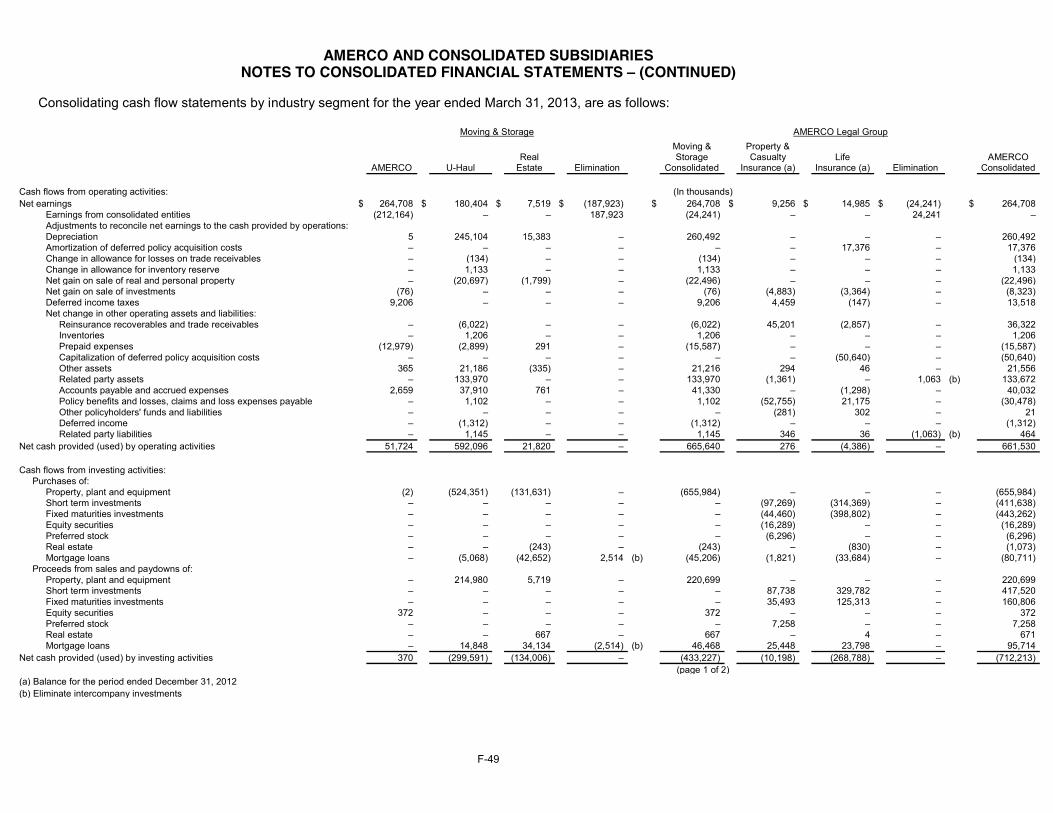
AMERCO AND CONSOLIDATED SUBSIDIARIES NOTES TO CONSOLIDATED FINANCIAL STATEMENTS – (CONTINUED)
F-49
Consolidating cash flow statements by industry segment for the year ended March 31, 2013, are as follows:
Moving & Storage AMERCO Legal Group
AMERCO U-Haul Real
Estate Elimination
Moving & Storage
Consolidated
Property & Casualty
Insurance (a) Life
Insurance (a) Elimination AMERCO
Consolidated
Cash flows from operating activities: (In thousands) Net earnings $ 264,708 $ 180,404 $ 7,519 $ (187,923) $ 264,708 $ 9,256 $ 14,985 $ (24,241) $ 264,708
Earnings from consolidated entities (212,164) – – 187,923 (24,241) – – 24,241 – Adjustments to reconcile net earnings to the cash provided by operations: Depreciation 5 245,104 15,383 – 260,492 – – – 260,492 Amortization of deferred policy acquisition costs – – – – – – 17,376 – 17,376 Change in allowance for losses on trade receivables – (134) – – (134) – – – (134) Change in allowance for inventory reserve – 1,133 – – 1,133 – – – 1,133 Net gain on sale of real and personal property – (20,697) (1,799) – (22,496) – – – (22,496) Net gain on sale of investments (76) – – – (76) (4,883) (3,364) – (8,323) Deferred income taxes 9,206 – – – 9,206 4,459 (147) – 13,518 Net change in other operating assets and liabilities:
Reinsurance recoverables and trade receivables – (6,022) – – (6,022) 45,201 (2,857) – 36,322 Inventories – 1,206 – – 1,206 – – – 1,206 Prepaid expenses (12,979) (2,899) 291 – (15,587) – – – (15,587) Capitalization of deferred policy acquisition costs – – – – – – (50,640) – (50,640) Other assets 365 21,186 (335) – 21,216 294 46 – 21,556 Related party assets – 133,970 – – 133,970 (1,361) – 1,063 (b) 133,672 Accounts payable and accrued expenses 2,659 37,910 761 – 41,330 – (1,298) – 40,032 Policy benefits and losses, claims and loss expenses payable – 1,102 – – 1,102 (52,755) 21,175 – (30,478) Other policyholders' funds and liabilities – – – – – (281) 302 – 21 Deferred income – (1,312) – – (1,312) – – – (1,312) Related party liabilities – 1,145 – – 1,145 346 36 (1,063) (b) 464
Net cash provided (used) by operating activities 51,724 592,096 21,820 – 665,640 276 (4,386) – 661,530 Cash flows from investing activities:
Purchases of: Property, plant and equipment (2) (524,351) (131,631) – (655,984) – – – (655,984) Short term investments – – – – – (97,269) (314,369) – (411,638) Fixed maturities investments – – – – – (44,460) (398,802) – (443,262) Equity securities – – – – – (16,289) – – (16,289) Preferred stock – – – – – (6,296) – – (6,296) Real estate – – (243) – (243) – (830) – (1,073) Mortgage loans – (5,068) (42,652) 2,514 (b) (45,206) (1,821) (33,684) – (80,711)
Proceeds from sales and paydowns of: Property, plant and equipment – 214,980 5,719 – 220,699 – – – 220,699 Short term investments – – – – – 87,738 329,782 – 417,520 Fixed maturities investments – – – – – 35,493 125,313 – 160,806 Equity securities 372 – – – 372 – – – 372 Preferred stock – – – – – 7,258 – – 7,258 Real estate – – 667 – 667 – 4 – 671 Mortgage loans – 14,848 34,134 (2,514) (b) 46,468 25,448 23,798 – 95,714
Net cash provided (used) by investing activities 370 (299,591) (134,006) – (433,227) (10,198) (268,788) – (712,213) (page 1 of 2)
(a) Balance for the period ended December 31, 2012 (b) Eliminate intercompany investments

AMERCO AND CONSOLIDATED SUBSIDIARIES NOTES TO CONSOLIDATED FINANCIAL STATEMENTS – (CONTINUED)
F-50
Continuation of consolidating cash flow statements by industry segment for the year ended March 31, 2013, are as follows:
Moving & Storage AMERCO Legal Group
AMERCO U-Haul Real
Estate Elimination
Moving & Storage
Consolidated
Property & Casualty
Insurance (a) Life
Insurance (a) Elimination AMERCO
Consolidated
Cash flows from financing activities: (In thousands) Borrowings from credit facilities – 108,846 161,700 – 270,546 – – – 270,546 Principal repayments on credit facilities – (159,622) (98,335) – (257,957) – – – (257,957) Debt issuance costs – (301) (1,922) – (2,223) – – – (2,223) Capital lease payments – (26,877) – – (26,877) – – – (26,877) Leveraged Employee Stock Ownership Plan - repayments from loan – 692 – – 692 – – – 692 Securitization deposits – 1,195 – – 1,195 – – – 1,195 Proceeds from (repayment of) intercompany loans 172,444 (223,927) 51,483 – – – – – – Common stock dividends paid (97,421) – – – (97,421) – – – (97,421) Contribution to related party (1,500) – – – (1,500) 1,500 – – – Investment contract deposits – – – – – – 301,729 – 301,729 Investment contract withdrawals – – – – – – (31,901) – (31,901)
Net cash provided (used) by financing activities 73,523 (299,994) 112,926 – (113,545) 1,500 269,828 – 157,783 Effects of exchange rate on cash – (536) – – (536) – – – (536) Increase (decrease) in cash and cash equivalents 125,617 (8,025) 740 – 118,332 (8,422) (3,346) – 106,564 Cash and cash equivalents at beginning of period 201,502 106,951 775 – 309,228 22,542 25,410 357,180 Cash and cash equivalents at end of period $ 327,119 $ 98,926 $ 1,515 $ – $ 427,560 $ 14,120 $ 22,064 $ – $ 463,744 (page 2 of 2) (a) Balance for the period ended December 31, 2012

AMERCO AND CONSOLIDATED SUBSIDIARIES NOTES TO CONSOLIDATED FINANCIAL STATEMENTS – (CONTINUED)
F-51
Consolidating cash flow statements by industry segment for the year ended March 31, 2012, are as follows:
Moving & Storage AMERCO Legal Group
AMERCO U-Haul Real
Estate Elimination
Moving & Storage
Consolidated
Property & Casualty
Insurance (a) Life
Insurance (a) Elimination AMERCO
Consolidated (In thousands)
Cash flows from operating activities: Net earnings (loss) $ 205,695 $ 155,579 $ 3,959 $ (159,538) $ 205,695 $ (23,563) $ 13,185 $ 10,050 $ 205,367
Earnings from consolidated subsidiaries (149,160) – – 159,538 10,378 – – (10,378) – Adjustments to reconcile net earnings to the cash provided by operations: Depreciation 5 216,116 13,668 – 229,789 – – – 229,789 Amortization of deferred policy acquisition costs – – – – – – 13,791 – 13,791 Change in allowance for losses on trade receivables – (206) – – (206) – (2) – (208) Change in allowance for inventory reserve – 1,382 – – 1,382 – – – 1,382 Net gain on sale of real and personal property – (20,647) (241) – (20,888) – – – (20,888) Net gain on sale of investments (488) – – – (488) (810) (4,281) – (5,579) Deferred income taxes 109,680 – – – 109,680 (12,181) 6,861 – 104,360 Net change in other operating assets and liabilities:
Reinsurance recoverables and trade receivables – (17,683) – – (17,683) (57,955) (1,477) – (77,115) Inventories – (173) – – (173) – – – (173) Prepaid expenses 6,470 9,464 (186) – 15,748 – – – 15,748 Capitalization of deferred policy acquisition costs – – – – – – (23,166) – (23,166) Other assets 2,380 1,852 2,282 – 6,514 (630) 108 – 5,992 Related party assets – (14,301) 63 – (14,238) (4,730) (479) 5,237 (b) (14,210) Accounts payable and accrued expenses 4,163 14,215 (228) – 18,150 – 1,319 – 19,469 Policy benefits and losses, claims and loss expenses payable – (16,621) – – (16,621) 106,213 122,738 – 212,330 Other policyholders' funds and liabilities – – – – – (1,382) (76) – (1,458) Deferred income – 4,367 – – 4,367 – – – 4,367 Related party liabilities – 5,514 – – 5,514 (272) 39 (5,237) (b) 44
Net cash provided (used) by operating activities 178,745 338,858 19,317 – 536,920 4,690 128,560 (328) 669,842 Cash flows from investing activities:
Purchases of: Property, plant and equipment (1) (524,298) (65,500) – (589,799) – – – (589,799) Short term investments – – – – – (63,126) (228,496) – (291,622) Fixed maturities investments – – – – – (34,965) (185,139) – (220,104) Equity securities (8,855) – – – (8,855) (193) – – (9,048) Preferred stock – – – – – (2,717) – – (2,717) Real estate – – (5,064) – (5,064) (165) (2,600) – (7,829) Mortgage loans – (8,758) (64,469) – (73,227) (45,189) (33,184) 24,437 (b) (127,163)
Proceeds from sales and paydowns of: Property, plant and equipment – 168,386 526 – 168,912 – – – 168,912 Short term investments – – – – – 96,033 204,860 – 300,893 Fixed maturities investments – – – – – 22,982 105,504 – 128,486 Equity securities 8,800 – – – 8,800 1,422 – – 10,222 Preferred stock – – – – – 7,352 2,708 (7,708) (b) 2,352 Real estate – – – – – 310 130 – 440 Mortgage loans – 9,263 45,685 – 54,948 14,390 9,939 (24,437) (b) 54,840
Net cash provided (used) by investing activities (56) (355,407) (88,822) – (444,285) (3,866) (126,278) (7,708) (582,137) (page 1 of 2)
(a) Balance for the period ended December 31, 2011 (b) Eliminate intercompany investments

AMERCO AND CONSOLIDATED SUBSIDIARIES NOTES TO CONSOLIDATED FINANCIAL STATEMENTS – (CONTINUED)
F-52
Continuation of consolidating cash flow statements by industry segment for the year ended March 31, 2012, are as follows:
Moving & Storage AMERCO Legal Group
AMERCO U-Haul Real
Estate Elimination
Moving & Storage
Consolidated
Property & Casualty
Insurance (a) Life
Insurance (a) Elimination AMERCO
Consolidated (In thousands)
Cash flows from financing activities: Borrowings from credit facilities – 153,860 83,920 – 237,780 – – – 237,780 Principal repayments on credit facilities – (130,641) (71,247) – (201,888) – – – (201,888) Debt issuance costs – (1,402) (602) – (2,004) – – – (2,004) Capital lease payments – (8,328) – – (8,328) – – – (8,328) Leveraged Employee Stock Ownership Plan - repayments from loan – 984 – – 984 – – – 984 Securitization deposits – 42,088 – – 42,088 – – – 42,088 Proceeds from (repayment of) intercompany loans (52,051) (5,401) 57,452 – – – – – – Preferred stock redemption paid (151,997) – – – (151,997) – – 7,708 (b) (144,289) Preferred stock dividends paid (3,241) – – – (3,241) – – 328 (c) (2,913) Common stock dividends paid (19,484) – – – (19,484) – – – (19,484) Contribution to related party (518) – – – (518) – – – (518) Investment contract deposits – – – – – – 13,854 – 13,854 Investment contract withdrawals – – – – – – (28,027) – (28,027)
Net cash provided (used) by financing activities (227,291) 51,160 69,523 – (106,608) – (14,173) 8,036 (112,745) Effects of exchange rate on cash – (294) – – (294) – – – (294) Increase (decrease) in cash and cash equivalents (48,602) 34,317 18 – (14,267) 824 (11,891) – (25,334) Cash and cash equivalents at beginning of period 250,104 72,634 757 – 323,495 21,718 37,301 – 382,514 Cash and cash equivalents at end of period $ 201,502 $ 106,951 $ 775 $ – $ 309,228 $ 22,542 $ 25,410 $ – $ 357,180 (page 2 of 2) (a) Balance for the period ended December 31, 2011 (b) Eliminate intercompany investments (c) Eliminate preferred stock dividends paid to affiliate

AMERCO AND CONSOLIDATED SUBSIDIARIES NOTES TO CONSOLIDATED FINANCIAL STATEMENTS – (CONTINUED)
F-53
Consolidating cash flow statements by industry segment for the year ended March 31, 2011 are as follows:
Moving & Storage AMERCO Legal Group
AMERCO U-Haul Real
Estate Elimination
Moving & Storage
Consolidated
Property & Casualty
Insurance (a) Life
Insurance (a) Elimination AMERCO
Consolidated (In thousands)
Cash flows from operating activities: Net earnings $ 184,126 $ 110,093 $ 7,550 $ (117,643) $ 184,126 $ 3,807 $ 11,120 $ (15,478) $ 183,575
Earnings from consolidated subsidiaries (132,570) – – 117,643 (14,927) – – 14,927 – Adjustments to reconcile net earnings to cash provided by operations: Depreciation 9 198,991 13,324 – 212,324 – – – 212,324 Amortization of deferred policy acquisition costs – – – – – – 9,494 – 9,494 Change in allowance for losses on trade receivables – 30 – – 30 – (2) – 28 Change in allowance for inventory reserve – (674) – – (674) – – – (674) Net gain on sale of real and personal property – (21,875) (1,183) – (23,058) – – – (23,058) Net (gain) loss on sale of investments (65) (11) – – (76) 285 (1,344) – (1,135) Deferred income taxes 73,790 – – – 73,790 1,960 5,148 – 80,898 Net change in other operating assets and liabilities:
Reinsurance recoverables and trade receivables – (1,443) – – (1,443) (5,137) 614 – (5,966) Inventories – (6,431) – – (6,431) – – – (6,431) Prepaid expenses (15,966) 11,773 (51) – (4,244) – – – (4,244) Capitalization of deferred policy acquisition costs – – – – – – (25,239) – (25,239) Other assets 34,937 (6,695) 238 – 28,480 30 205 – 28,715 Related party assets 273 55 (64) – 264 (351) – – (87) Accounts payable and accrued expenses (8,603) 18,923 (486) – 9,834 – 2,713 – 12,547 Policy benefits and losses, claims and loss expenses payable – 10,994 – – 10,994 4,288 94,052 – 109,334 Other policyholders' funds and liabilities – – – – – (789) 1,355 – 566 Deferred income – 1,967 – – 1,967 – – – 1,967 Related party liabilities – 83 – – 83 157 9 – 249
Net cash provided (used) by operating activities 135,931 315,780 19,328 – 471,039 4,250 98,125 (551) 572,863 Cash flows from investing activities:
Purchases of: Property, plant and equipment (5) (407,526) (72,887) – (480,418) – – – (480,418) Short term investments – – – – – (76,381) (184,385) – (260,766) Fixed maturities investments – – – – – (34,580) (181,351) – (215,931) Equity securities (8,253) – – – (8,253) (3,297) – – (11,550) Preferred stock – – – – – (11,644) (2,708) – (14,352) Real estate – – – – – (76) (117) – (193) Mortgage loans – (13,117) (8,692) – (21,809) (13,244) (7,395) 3,890 (b) (38,558) Other investments – – – – – – (2,000) – (2,000)
Proceeds from sales and paydowns of: Property, plant and equipment – 179,043 1,368 – 180,411 – – – 180,411 Short term investments – – – – – 106,130 211,083 – 317,213 Fixed maturities investments – – – – – 23,275 108,706 – 131,981 Equity securities 1,065 – – – 1,065 133 – – 1,198 Preferred stock – – – – – 1,914 – – 1,914 Real estate – – 125 – 125 309 1,491 – 1,925 Mortgage loans – 5,412 2,995 – 8,407 6,106 4,533 (3,890) (b) 15,156
Net cash provided (used) by investing activities (7,193) (236,188) (77,091) – (320,472) (1,355) (52,143) – (373,970) (page 1 of 2)
(a) Balance for the period ended December 31, 2010 (b) Eliminate intercompany investments

AMERCO AND CONSOLIDATED SUBSIDIARIES NOTES TO CONSOLIDATED FINANCIAL STATEMENTS – (CONTINUED)
F-54
Continuation of consolidating cash flow statements by industry segment for the year ended March 31, 2011 are as follows:
Moving & Storage AMERCO Legal Group
AMERCO U-Haul Real
Estate Elimination
Moving & Storage
Consolidated
Property & Casualty
Insurance (a) Life
Insurance (a) Elimination AMERCO
Consolidated (In thousands)
Cash flows from financing activities: Borrowings from credit facilities – 257,728 64,134 – 321,862 – – – 321,862 Principal repayments on credit facilities – (90,084) (198,798) – (288,882) – – – (288,882) Debt issuance costs – (1,987) – – (1,987) – – – (1,987) Capital lease payments – (11,522) – – (11,522) – – – (11,522) Leveraged Employee Stock Ownership Plan - repayments from loan – 1,172 – – 1,172 – – – 1,172 Securitization deposits – (46,031) – – (46,031) – – – (46,031) Proceeds from (repayment of) intercompany loans 30,566 (223,746) 193,180 – – – – – – Preferred stock dividends paid (12,963) – – – (12,963) – – 551 (b) (12,412) Dividend from (to) related party 3,303 – – – 3,303 (3,303) – – – Investment contract deposits – – – – – – 11,580 – 11,580 Investment contract withdrawals – – – – – – (34,548) – (34,548)
Net cash provided (used) by financing activities 20,906 (114,470) 58,516 – (35,048) (3,303) (22,968) 551 (60,768) Effects of exchange rate on cash – 271 – – 271 – – – 271 Increase (decrease) in cash and cash equivalents 149,644 (34,607) 753 – 115,790 (408) 23,014 – 138,396 Cash and cash equivalents at beginning of period 100,460 107,241 4 – 207,705 22,126 14,287 – 244,118 Cash and cash equivalents at end of period $ 250,104 $ 72,634 $ 757 $ – $ 323,495 $ 21,718 $ 37,301 $ – $ 382,514 (page 2 of 2) (a) Balance for the period ended December 31, 2010 (b) Eliminate preferred stock dividends paid to affiliates

AMERCO AND CONSOLIDATED SUBSIDIARIES NOTES TO CONSOLIDATED FINANCIAL STATEMENTS – (CONTINUED)
F-55
Note 23. Subsequent Events Our management has evaluated subsequent events occurring after March 31, 2013, the date of our
most recent balance sheet date, through the date our financial statements were issued. We do not believe any other subsequent events have occurred that would require further disclosure or adjustment to our financial statements than those stated below.
Financial Strength Ratings In May 2013, A.M. Best affirmed the financial strength rating of B++ (Good) for Oxford and its outlook
remains positive.

F-56
SCHEDULE I CONDENSED FINANCIAL INFORMATION OF AMERCO
BALANCE SHEETS March 31, 2013 2012 (In thousands)
ASSETS Cash and cash equivalents $ 327,119 $ 201,502 Investment in subsidiaries 240,080 8,168 Related party assets 1,032,124 1,201,385 Other assets 43,841 27,030
Total assets $ 1,643,164 $ 1,438,085
LIABILITIES AND STOCKHOLDERS' EQUITY Liabilities:
Other liabilities $ 412,199 $ 399,867 412,199 399,867
Stockholders' equity: Preferred stock – – Common stock 10,497 10,497 Additional paid-in capital 438,378 433,953 Accumulated other comprehensive loss (22,680) (45,436) Retained earnings:
Beginning of period 1,316,854 1,139,792 Adjustment to initially apply ASU 2010-26 (1,721) – Net earnings 264,708 205,695 Excess of redemption value over carrying value of preferred shares redeemed
– (5,908) Dividends (97,421) (22,725) End of period 1,482,420 1,316,854
Cost of common shares in treasury (525,653) (525,653) Cost of preferred shares in treasury (151,997) (151,997)
Total stockholders' equity 1,230,965 1,038,218 Total liabilities and stockholders' equity $ 1,643,164 $ 1,438,085
The accompanying notes are an integral part of these condensed consolidated financial statements.

F-57
CONDENSED FINANCIAL INFORMATION OF AMERCO STATEMENTS OF OPERATIONS
Years Ended March 31, 2013 2012 2011 (In thousands, except share and per share data) Revenues:
Net interest income from subsidiaries $ 5,329 $ 6,085 $ 5,160 Expenses:
Operating expenses 13,611 9,081 7,489 Other expenses 97 98 99
Total expenses 13,708 9,179 7,588 Equity in earnings of subsidiaries 212,164 149,160 132,570 Interest income 91,125 94,278 85,584 Pretax earnings 294,910 240,344 215,726 Income tax expense (30,202) (34,649) (31,600)
Net earnings 264,708 205,695 184,126 Less: Excess of redemption value over carrying value of preferred shares redeemed – (5,908) – Less: Preferred stock dividends – (3,241) (12,963)
Earnings available to common stockholders $ 264,708 $ 196,546 $ 171,163 Basic and diluted earnings per common share $ 13.56 $ 10.09 $ 8.81 Weighted average common shares outstanding: Basic and diluted 19,518,779 19,476,187 19,432,781
The accompanying notes are an integral part of these condensed consolidated financial statements.
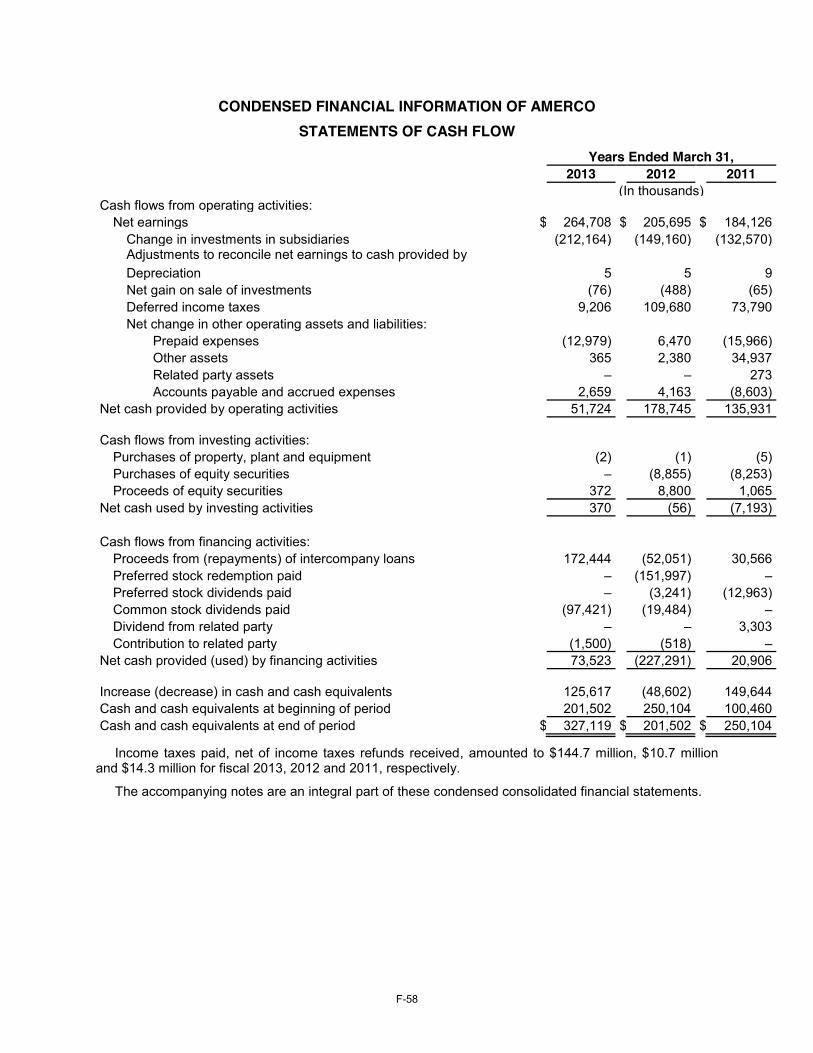
F-58
CONDENSED FINANCIAL INFORMATION OF AMERCO
STATEMENTS OF CASH FLOW Years Ended March 31, 2013 2012 2011 (In thousands)
Cash flows from operating activities: Net earnings $ 264,708 $ 205,695 $ 184,126
Change in investments in subsidiaries (212,164) (149,160) (132,570) Adjustments to reconcile net earnings to cash provided by operations:
Depreciation 5 5 9 Net gain on sale of investments (76) (488) (65) Deferred income taxes 9,206 109,680 73,790 Net change in other operating assets and liabilities:
Prepaid expenses (12,979) 6,470 (15,966) Other assets 365 2,380 34,937 Related party assets – – 273 Accounts payable and accrued expenses 2,659 4,163 (8,603)
Net cash provided by operating activities 51,724 178,745 135,931 Cash flows from investing activities:
Purchases of property, plant and equipment (2) (1) (5) Purchases of equity securities – (8,855) (8,253) Proceeds of equity securities 372 8,800 1,065
Net cash used by investing activities 370 (56) (7,193) Cash flows from financing activities:
Proceeds from (repayments) of intercompany loans 172,444 (52,051) 30,566 Preferred stock redemption paid – (151,997) – Preferred stock dividends paid – (3,241) (12,963) Common stock dividends paid (97,421) (19,484) – Dividend from related party – – 3,303 Contribution to related party (1,500) (518) –
Net cash provided (used) by financing activities 73,523 (227,291) 20,906 Increase (decrease) in cash and cash equivalents 125,617 (48,602) 149,644 Cash and cash equivalents at beginning of period 201,502 250,104 100,460 Cash and cash equivalents at end of period $ 327,119 $ 201,502 $ 250,104
Income taxes paid, net of income taxes refunds received, amounted to $144.7 million, $10.7 million and $14.3 million for fiscal 2013, 2012 and 2011, respectively.
The accompanying notes are an integral part of these condensed consolidated financial statements.

F-59
CONDENSED FINANCIAL INFORMATION OF AMERCO NOTES TO CONDENSED FINANCIAL INFORMATION
MARCH 31, 2013, 2012, AND 2011 1. Summary of Significant Accounting Policies
AMERCO, a Nevada corporation, was incorporated in April, 1969, and is the holding Company for U-Haul International, Inc., Amerco Real Estate Company, Repwest Insurance Company and Oxford Life Insurance Company. The financial statements of the Registrant should be read in conjunction with the Consolidated Financial Statements and notes thereto included in this Annual Report.
AMERCO is included in a consolidated Federal income tax return with all of its U.S. subsidiaries. Accordingly, the provision for income taxes has been calculated for Federal income taxes of AMERCO and subsidiaries included in the consolidated return of the Registrant. State taxes for all subsidiaries are allocated to the respective subsidiaries.
The financial statements include only the accounts of AMERCO, which include certain of the corporate operations of AMERCO. The interest in AMERCO’s majority owned subsidiaries is accounted for on the equity method. The intercompany interest income and expenses are eliminated in the Consolidated Financial Statements.
2. Guarantees AMERCO has guaranteed performance of certain long-term leases and other obligations. See Note
18, Contingent Liabilities and Commitments and Note 20, Related Party Transactions of the Notes to Consolidated Financial Statements.

F-60
SCHEDULE II AMERCO AND CONSOLIDATED SUBSIDIARIES
VALUATION AND QUALIFYING ACCOUNTS FISCAL YEARS ENDED MARCH 31, 2013, 2012 AND 2011
Balance at Beginning
of Year
Additions Charged to Costs and Expenses
Additions Charged to
Other Accounts Deductions
Balance at Year End
Year ended March 31, 2013 (In thousands) Allowance for doubtful accounts
(deducted from trade receivable) $ 1,128 $ 1,184 $ – $ (1,318) $ 994 Allowance for obsolescence
(deducted from inventory) $ 730 $ 981 $ – $ – $ 1,711 Allowance for probable losses
(deducted from mortgage loans) $ 370 $ – $ – $ – $ 370 Year ended March 31, 2012 Allowance for doubtful accounts
(deducted from trade receivable) $ 1,336 $ 1,485 $ – $ (1,693) $ 1,128 Allowance for obsolescence
(deducted from inventory) $ 595 $ 135 $ – $ – $ 730 Allowance for probable losses
(deducted from mortgage loans) $ 370 $ – $ – $ – $ 370 Year ended March 31, 2011 Allowance for doubtful accounts
(deducted from trade receivable) $ 1,308 $ 2,611 $ – $ (2,583) $ 1,336 Allowance for obsolescence
(deducted from inventory) $ 2,600 $ – $ – $ (2,005) $ 595 Allowance for probable losses
(deducted from mortgage loans) $ 370 $ – $ – $ – $ 370

F-61
SCHEDULE V AMERCO AND CONSOLIDATED SUBSIDIARIES
SUPPLEMENTAL INFORMATION (FOR PROPERTY-CASUALTY INSURANCE OPERATIONS) YEARS ENDED DECEMBER 31, 2012, 2011 AND 2010
Fiscal Year
Affiliation with Registrant
Deferred Policy
Acquisition Cost
Reserves for Unpaid
Claims and Adjustment Expenses
Discount if any,
Deducted Unearned Premiums
Net Earned Premiums (1)
Net Investment Income (2)
Claim and Claim
Adjustment Expenses Incurred
Related to Current Year
Claim and Claim
Adjustment Expenses Incurred
Related to Prior Year
Amortization of Deferred
Policy Acquisition
Costs
Paid Claims and Claim
Adjustment Expense
Net Premiums Written (1)
(In thousands) 2013 Consolidated property
casualty entity $ – $ 330,093 $ N/A $ – $ 34,342 $ 8,976 $ 8,962 $ 7,036 $ – $ 20,807 $ 34,378
2012 Consolidated property casualty entity
– 382,328 N/A – 32,631 9,664 9,297 56,445 – 16,319 32,627
2011 Consolidated property casualty entity
– 276,355 N/A 4 30,704 8,234 9,453 7,832 – 17,211 30,706
(1) The earned and written premiums are reported net of intersegment transactions. There were no earned premiums eliminated for the years ended December 31, 2012, 2011 and 2010, respectively.
(2) Net Investment Income excludes net realized (gains) losses on investments of ($4.9) million, ($0.3) million and $0.3 million for the years ended December 31, 2012, 2011 and 2010, respectively.

SIGNATURES
Pursuant to the requirements of Section 13 or 15(d) of the Securities Exchange Act of 1934, the registrant has duly caused this report to be signed on its behalf by the undersigned, thereunto duly authorized.
AMERCO
Date: June 5, 2013 /s/ Edward J. Shoen Edward J. Shoen President and Chairman of the Board (Duly Authorized Officer) Date: June 5, 2013 /s/ Jason A. Berg Jason A. Berg Chief Accounting Officer (Principal Financial Officer)

POWER OF ATTORNEY
KNOW ALL MEN BY THESE PRESENTS, that each person whose signature appears below constitutes and appoints Edward J. Shoen his true and lawful attorney-in-fact and agent, with full power of substitution and resubstitution, for him and in his name, place and stead, in any and all capacities, to sign any and all amendments to this Annual Report on Form 10-K, and to file the same, with all exhibits thereto and other documents in connection therewith with the Securities and Exchange Commission, granting unto said attorney-in-fact and agent, full power and authority to do and perform each and every act or things requisite and necessary to be done in and about the premises, as fully and to all intents and purposes as he might or could do in person hereby ratifying and confirming all that said attorney-in-fact and agent, or his substitute or substitutes, may lawfully do or cause to be done by virtue hereof.
Pursuant to the requirements of the Securities Exchange Act of 1934, this report has been signed below by the following persons on behalf of the registrant and in the capacities and on the dates indicated.
Signature Title Date
/s/ Edward J. Shoen President and Chairman of the Board
(Principal Executive Officer) June 5, 2013 Edward J. Shoen
/s/ Jason A. Berg Chief Accounting Officer
(Principal Financial Officer) June 5, 2013 Jason A. Berg
/s/ Charles J. Bayer Director June 5, 2013 Charles J. Bayer
/s/ John P. Brogan Director June 5, 2013 John P. Brogan
/s/ John M. Dodds Director June 5, 2013 John M. Dodds
/s/ Michael L. Gallagher Director June 5, 2013 Michael L. Gallagher
/s/ Daniel R. Mullen Director June 5, 2013 Daniel R. Mullen
/s/ James P. Shoen Director June 5, 2013
James P. Shoen

EXHIBIT 21
AMERCO (Nevada) Consolidated Subsidiaries
Patriot Truck Leasing, LLC NV Picacho Peak Investments Co. NV ARCOA Risk Retention Group, Inc. NV Repwest Insurance Company AZ
Republic Claims Service Company AZ Ponderosa Insurance Agency, LLC AZ RWIC Investments, Inc. AZ
Oxford Life Insurance Company AZ
Oxford Life Insurance Agency, Inc. AZ North American Insurance Company WI Christian Fidelity Life Insurance Company TX
Amerco Real Estate Company NV
Amerco Real Estate Company of Alabama, Inc. AL Amerco Real Estate Company of Texas, Inc. TX Amerco Real Estate Services, Inc. NV AREC 905, LLC DE Rainbow-Queen Properties, LLC AZ One PAC Company NV Two PAC Company NV Three PAC Company NV Four PAC Company NV Five PAC Company NV Six PAC Company NV Seven PAC Company NV Eight PAC Company NV Nine PAC Company NV Ten PAC Company NV Eleven PAC Company NV Twelve PAC Company NV Sixteen PAC Company NV Seventeen PAC Company NV Nationwide Commercial Co. AZ
Yonkers Property Corporation NY PF&F Holdings Corporation DE
Fourteen PAC Company NV Fifteen PAC Company NV
AREC Holdings, LLC DE
AREC 1, LLC DE AREC 2, LLC DE AREC 3, LLC DE

AREC 4, LLC DE AREC 5, LLC DE AREC 6, LLC DE AREC 7, LLC DE AREC 8, LLC DE AREC 9, LLC DE AREC 10, LLC DE AREC 11, LLC DE AREC 12, LLC DE AREC 13, LLC DE AREC 14, LLC NV AREC 15, LLC NV AREC 17, LLC NV AREC 18, LLC NV AREC RW MS, LLC DE
U-Haul International, Inc. NV United States:
INW Company WA A & M Associates, Inc AZ
Web Team Associates, Inc. NV EMove, Inc. NV U-Haul Business Consultants, Inc AZ U-Haul Leasing & Sales Co. NV
RTAC, LLC NV U-Haul S Fleet, LLC NV
2007 DC-1, LLC NV 2007 EL-1, LLC NV 2007 TM-1, LLC NV
U-Haul R Fleet, LLC NV 2010 BE-BP-2, LLC NV
2010 U-Haul S. Fleet, LLC NV 2010 TM-1, LLC NV 2010 TT-1, LLC NV 2010 DC-1, LLC NV
U-Box, LLC NV U-Haul Moving Partners, Inc. NV U-Haul Self-Storage Corporation NV U-Haul Self-Storage Management (WPC), Inc. NV U-Haul Co. of Alaska AK U-Haul Co. of Alabama, Inc. AL U-Haul Co. of Arkansas AR U-Haul Co. of Arizona AZ
U-Haul Titling, LLC NV 2010 U-Haul Tilting 2, LLC NV 2010 U-Haul Tilting 3, LLC NV CGAF Holdings, LLC NV
Casa Grande Alternative Fuel Co., LLC NV U-Haul Co. of California CA U-Haul Co. of Colorado CO

U-Haul Co. of Connecticut CT U-Haul Co. of District of Columbia, Inc. DC U-Haul Co. of Florida FL
U-Haul Co. of Florida 905, LLC DE U-Haul Co. of Florida 14, LLC NV U-Haul Co. of Florida 15, LLC NV
U-Haul Co. of Georgia GA U-Haul of Hawaii, Inc. HI U-Haul Co. of Iowa, Inc. IA U-Haul Co. of Idaho, Inc. ID U-Haul Co. of Illinois, Inc. IL U-Haul Co. of Indiana, Inc. IN U-Haul Co. of Kansas, Inc. KS U-Haul Co. of Kentucky KY U-Haul Co. of Louisiana LA U-Haul Co. of Massachusetts and Ohio, Inc. MA
Collegeboxes, LLC MA U-Haul Co. of Maryland, Inc. MD U-Haul Co. of Maine, Inc. ME U-Haul Co. of Michigan MI U-Haul Co. of Minnesota MN U-Haul Company of Missouri MO U-Haul Co. of Mississippi MS U-Haul Co. of Montana, Inc. MT U-Haul Co. of North Carolina NC U-Haul Co. of North Dakota ND U-Haul Co. of Nebraska NE U-Haul Co. of New Hampshire, Inc. NH U-Haul Co. of New Jersey, Inc. NJ U-Haul Co. of New Mexico, Inc. NM U-Haul Co. of Nevada, Inc. NV U-Haul Co. of New York and Vermont, Inc. NY U-Haul Co. of Oklahoma, Inc. OK U-Haul Co. of Oregon OR U-Haul Co. of Pennsylvania PA U-Haul Co. of Rhode Island RI U-Haul Co. of South Carolina, Inc. SC U-Haul Co. of South Dakota, Inc. SD U-Haul Co. of Tennessee TN U-Haul Co. of Texas TX U-Haul Co. of Utah, Inc. UT U-Haul Co. of Virginia VA U-Haul Co. of Washington WA U-Haul Co. of Wisconsin, Inc. WI U-Haul Co. of West Virginia WV U-Haul Co. of Wyoming, Inc. WY UHIL Holdings, LLC DE
UHIL 1, LLC DE UHIL 2, LLC DE UHIL 3, LLC DE UHIL 4, LLC DE

UHIL 5, LLC DE UHIL 6, LLC DE UHIL 7, LLC DE UHIL 8, LLC DE UHIL 9, LLC DE UHIL 10, LLC DE UHIL 11, LLC DE UHIL 12, LLC DE UHIL 13, LLC DE UHIL 14, LLC NV UHIL 15, LLC NV UHIL 16, LLC NV
Canada:
U-Haul Co. (Canada) Ltd. U-Haul Co. (Canada) Ltee Ontario U-Haul Inspections, Ltd. B.C.

EXHIBIT 23.1
CONSENT OF INDEPENDENT REGISTERED PUBLIC ACCOUNTING FIRM
AMERCO Reno, Nevada
We hereby consent to the incorporation by reference in the Registration Statements on Form S-3 (No. 33-56571 and 333-169832) of AMERCO and consolidated subsidiaries (the “Company”) of our reports dated June 5, 2013, relating to the consolidated financial statements and financial statement schedules, and the effectiveness of the Company’s internal control over financial reporting, which appear in this Form 10-K.
/s/ BDO USA, LLP Phoenix, Arizona June 5, 2013
EXHIBIT 31.1
Rule 13a-14(a)/15d-14(a) Certification
I, Edward J. Shoen, certify that:
1. have reviewed this annual report on Form 10-K of AMERCO (the “Registrant”);;
2. Based on my knowledge, this report does not contain any untrue statement of a material fact or omit to state a material fact necessary to make the statements made, in light of the circumstances under which such statements were made, not misleading with respect to the period covered by this report;
3. Based on my knowledge, the financial statements, and other financial information included in this report, fairly present in all material respects the financial condition, results of operations and cash flows of the Registrant as of, and for, the periods presented in this report;
4. The Registrant’s other certifying officer(s) and I are responsible for establishing and maintaining disclosure controls and procedures (as defined in Exchange Act Rules 13a-15(e) and 15d-15(e)) and internal control over financial reporting (as defined in Exchange Act Rules 13a-15(f) and 15d-15(f)) for the Registrant and have:
(a) Designed such disclosure controls and procedures, or caused such disclosure controls and procedures to be designed under our supervision, to ensure that material information relating to the Registrant’s, including its consolidated subsidiaries, is made known to us by others within those entities, particularly during the period in which this report is being prepared;
(b) Designed such internal control over financial reporting, or caused such internal control over financial reporting to be designed under our supervision, to provide reasonable assurance regarding the reliability of financial reporting and the preparation of financial statements for external purposes in accordance with generally accepted accounting principles;
(c) Evaluated the effectiveness of the Registrant’s disclosure controls and procedures and presented in this report our conclusions about the effectiveness of the disclosure controls and procedures, as of the end of the period covered by this report based on such evaluation; and
(d) Disclosed in this report any change in the Registrant’s internal control over financial reporting that occurred during the Registrant’s most recent fiscal quarter (the Registrant’s fourth fiscal quarter in the case of an annual report) that has materially affected, or is reasonably likely to materially affect, the Registrant’s internal control over financial reporting;; and
5. The Registrant’s other certifying officer(s) and I have disclosed, based on our most recent evaluation of internal control over financial reporting, to the Registrant’s auditors and the audit committee of the Registrant’s board of directors (or persons performing the equivalent functions):
(a) All significant deficiencies and material weaknesses in the design or operation of internal control over financial reporting which are reasonably likely to adversely affect the Registrant’s ability to record, process, summarize and report financial information; and
(b) Any fraud, whether or not material, that involves management or other employees who have a significant role in the Registrant’s internal control over financial reporting.
/s/ Edward J. Shoen
Edward J. Shoen President and Chairman of the Date: June 5, 2013 Board of AMERCO

EXHIBIT 31.2
Rule 13a-14(a)/15d-14(a) Certification
I, Jason A. Berg, certify that:
1. I have reviewed this annual report on Form 10-K of AMERCO (the “Registrant”);;
2. Based on my knowledge, this report does not contain any untrue statement of a material fact or omit to state a material fact necessary to make the statements made, in light of the circumstances under which such statements were made, not misleading with respect to the period covered by this report;
3. Based on my knowledge, the financial statements, and other financial information included in this report, fairly present in all material respects the financial condition, results of operations and cash flows of the Registrant as of, and for, the periods presented in this report;
4. The Registrant’s other certifying officer(s) and I are responsible for establishing and maintaining disclosure controls and procedures (as defined in Exchange Act Rules 13a-15(e) and 15d-15(e)) and internal control over financial reporting (as defined in Exchange Act Rules 13a-15(f) and 15d-15(f)) for the Registrant and have:
(a) Designed such disclosure controls and procedures, or caused such disclosure controls and procedures to be designed under our supervision, to ensure that material information relating to the Registrant’s, including its consolidated subsidiaries, is made known to us by others within those entities, particularly during the period in which this report is being prepared;
(b) Designed such internal control over financial reporting, or caused such internal control over financial reporting to be designed under our supervision, to provide reasonable assurance regarding the reliability of financial reporting and the preparation of financial statements for external purposes in accordance with generally accepted accounting principles;
(c) Evaluated the effectiveness of the Registrant’s disclosure controls and procedures and presented in this report our conclusions about the effectiveness of the disclosure controls and procedures, as of the end of the period covered by this report based on such evaluation; and
(d) Disclosed in this report any change in the Registrant’s internal control over financial reporting that occurred during the Registrant’s most recent fiscal quarter (the Registrant’s fourth fiscal quarter in the case of an annual report) that has materially affected, or is reasonably likely to materially affect, the Registrant’s internal control over financial reporting;; and
5. The Registrant’s other certifying officer(s) and I have disclosed, based on our most recent evaluation of internal control over financial reporting, to the Registrant’s auditors and the audit committee of the Registrant’s board of directors (or persons performing the equivalent functions):
(a) All significant deficiencies and material weaknesses in the design or operation of internal control over financial reporting which are reasonably likely to adversely affect the Registrant’s ability to record, process, summarize and report financial information; and
(b) Any fraud, whether or not material, that involves management or other employees who have a significant role in the Registrant’s internal control over financial reporting.
/s/ Jason A. Berg
Jason A. Berg Principal Financial Officer and Date: June 5, 2013 Chief Accounting Officer of AMERCO

EXHIBIT 32.1
CERTIFICATION PURSUANT TO 18 U.S.C. SECTION 1350, AS ADOPTED PURSUANT TO SECTION 906 OF THE SARBANES-OXLEY ACT OF 2002 In connection with the Form 10-K for the year ended March 31, 2013 of AMERCO (the “Company”), as
filed with the Securities and Exchange Commission on June 5, 2013 (the “Report”), I, Edward J. Shoen, President and Chairman of the Board of the Company, certify, pursuant to Section 906 of the Sarbanes-Oxley Act of 2002, that:
1) The Report fully complies with the requirements of Section 13(a) or 15(d) of the Securities Exchange Act of 1934, and
2) The information contained in the Report fairly presents, in all material respects, the financial condition and results of operations of the Company.
AMERCO
a Nevada corporation /s/ Edward J. Shoen Edward J. Shoen President and Chairman of the Board Date: June 5, 2013
EXHIBIT 32.2
CERTIFICATION PURSUANT TO 18 U.S.C. SECTION 1350, AS ADOPTED PURSUANT TO SECTION 906 OF THE SARBANES-OXLEY ACT OF 2002 In connection with the Form 10-K for the year ended March 31, 2013 of AMERCO (the “Company”), as
filed with the Securities and Exchange Commission on June 5, 2013 (the “Report”), I, Jason A. Berg, Chief Accounting Officer of the Company, certify, pursuant to Section 906 of the Sarbanes-Oxley Act of 2002, that:
1) The Report fully complies with the requirements of Section 13(a) or 15(d) of the Securities Exchange Act of 1934, and
2) The information contained in the Report fairly presents, in all material respects, the financial condition and results of operations of the Company.
AMERCO
a Nevada corporation /s/ Jason A. Berg Jason A. Berg Principal Financial Officer and Chief Accounting Officer Date: June 5, 2013

Edward J. ShoenChairman
Charles J. Bayer
A M E R C O A N D C O N S O L I D AT E D S U B S I D I A R I E SS T O C K H O L D E R I N F O R M AT I O N
A M E R C O B O A R D O F D I R E C T O R S
C A U T I O N A R Y S TAT E M E N T S R E G A R D I N G F O R W A R D - L O O K I N G S TAT E M E N T SThis Annual Report contains “forward-looking statements” as that term is defi ned in Section 27A of the Securities Act and Section 21Eof the Securities Exchange Act. To review the full description of the Cautionary Statement Regarding Forward-Looking Statements,please refer to page 6 of this Annual Report.
C O M M I T T E E S O F T H E A M E R C OB O A R D O F D I R E C T O R S
A D V I S O R Y B O A R D**
Barbara S. Campbell*Richard J. Herrera*
*Non-Director members**This board will terminate in September 2013
Audit CommitteeCharles J. BayerJohn P. BroganJohn M. DoddsDaniel R. Mullen
Executive Finance CommitteeCharles J. BayerJohn P. BroganEdward J. ShoenJames P. Shoen
Compensation CommitteeJohn P. BroganJohn M. Dodds
IndependentGovernance CommitteePaul A. Bible*Michael L. GallagherThomas W. Hayes*
E X E C U T I V E O F F I C E R S O F T H E C O M PA N YEdward J. Shoen Chairman of AMERCO
Douglas M. Bell President of Repwest Insurance Company
Jason A. Berg Principal Accounting Offi cer of AMERCO
Laurence J. De Respino General Counsel of AMERCO
Mark A. Haydukovich President of Oxford Life Insurance Company
Gary B. Horton Treasurer of AMERCO
Robert T. Peterson Controller of U-Haul
James P. Shoen Vice President of U-Haul Business Consultants
John C. Taylor President of U-Haul
Carlos Vizcarra President of Amerco Real Estate Company
Rocky D. Wardrip Assistant Treasurer of AMERCO
John P. Brogan
John M. Dodds
Michael L. Gallagher
Daniel R. Mullen
James P. Shoen

AMERCO, a Nevada corporation, was incorporated in April 1969 and is the holding
company of the subsidiaries comprising the U-Haul System and other subsidiaries
(collectively, the “Company”). The Company had its origin in 1945 under the name
“U-Haul Trailer Rental Company.” The Company is primarily engaged in the short-
term rental of trucks, trailers and related equipment to the do-it-yourself mover. The
Company also sells related moving products and services, and rents self-storage
facilities and general rental items. In addition, the Company’s insurance subsidiaries
engage in the life and property/casualty insurance and reinsurance business.
C O R P O R AT E H E A D Q U A R T E R S1325 Airmotive Way, Suite 100
Reno, Nevada 89502-3239(775) 688-6300
I N D E P E N D E N T A U D I T O R SBDO USA, LLP
Phoenix, Arizona
F O R M 1 0 – KThe AMERCO Annual Report on Form 10-K and
additional information is available on the Internet at amerco.com
T R A N S F E R A G E N TComputershare
199 Water Street, 26th FloorNew York, NY 10038
(212) 805-7100computershare.com/investor
S T O C K H O L D E R I N F O R M AT I O N