Embed Size (px)
Citation preview

NORTH CAROLINA DEPARTMENT OF COMMERCE
Job Development Investment Grant
2013 Annual Report
Submitted on behalf of the Economic Investment Committee

Calendar Year 2013 Legislative Report 2
Table of Contents
I. Introduction ............................................................................................................................. 3
II. JDIG Program Summary......................................................................................................... 3
Program Process: From Application to Award ........................................................................... 4
III. JDIG Applicants and Grantees for CY 2013 ....................................................................... 6
Tier .............................................................................................................................................. 6
Performance Minimums.............................................................................................................. 7
Estimated Economic Impact ....................................................................................................... 8
IV. General Description of Calendar Year 2013 Grantees ........................................................ 9
V. JDIG Grantee Performance ................................................................................................... 11
Distribution of Grants ............................................................................................................... 12
Environmental Impact ............................................................................................................... 14
VI. Grantee Profiles for Calendar Year 2013 ........................................................................... 14
VII. Conclusion ......................................................................................................................... 23
Attachment A1 Maximum Annual State Liability under JDIG Awards Made in CY 2013
Attachment A2 Maximum Annual Grant Amount Payable to CY 2013 Grantees
Attachment A3 Maximum Annual Grant Amount Payable to Utility Account CY 2013
Attachment A1-A3 Summary of All Grant Caps CY 2013
Attachment B Estimated Lifetime Fiscal and Economic Impacts for Grants awarded in
CY 2003-2013
Attachment C Certified JDIG Grantee Report Findings on 2011 and 2012 Performance
Attachment D Annual Disbursements for Grants awarded in CY 2003-2012
Attachment E Withdrawn/Terminated Projects

Calendar Year 2013 Legislative Report 3
I. Introduction
This report describes CY 2012 performance by existing grantees and CY 2013 new grants under
the Job Development Investment Grant (“JDIG”) program, pursuant to North Carolina
General Statute (“G.S.”) §143B-437.55(c). Information presented includes the number of JDIG
applications submitted, a listing of grants awarded and accepted; the results of the Walden
cost/benefit analysis (in terms of net state revenue and impact on state gross domestic product); a
description of each project awarded a grant in 2013; the term of each grant; the percentage of
withholdings used to determine the amount of each grant; job creation, investment, and average
annual wage targets; the state’s maximum annual liability under the grants, amounts disbursed
to-date under outstanding grants (to companies and to the Utility Account), company
performance results under the grants, and eligible withholdings received from grantees.
II. JDIG Program Summary
The JDIG program, adopted by the General Assembly in the 2001-2002 session, became
effective January 2003 and is currently scheduled to sunset on January 1, 2016
(G.S.§143B-437.62). It is a performance-based economic development incentive program that
provides annual grant disbursements for a period of up to 12 years, to new and expanding
businesses based on a percentage of withholding taxes paid by new employees during each
calendar year of a grant. This percentage ranges from 10% to 75%. Grants are made to
qualifying companies by the North Carolina Economic Investment Committee (the “EIC”),
subject to caps set by the General Assembly on future grant year liability. The EIC consists of
five members: the Secretary of Commerce, the Secretary of Revenue, the State Budget Director,
and one appointee by each house of the legislature.
When deciding whether to award a grant and the appropriate amount and term of a grant, the EIC
considers both economic and fiscal impacts. It conducts an extensive review and analysis of
applications submitted by proposed grantees, considering factors enumerated in the JDIG statute
and the Criteria for Operation and Implementation of Job Development Investment Grant
Program (“Criteria”), adopted pursuant to G. S. §143B-437.52 and 54(d), which govern program
administration. The EIC determines how a proposed project benefits the state, and, in particular,
whether the fiscal benefits of the project, as measured by estimated tax revenues to the state,
outweigh the total General Fund incentive costs to the state. The analysis of state revenue
impacts is conducted using an economic model developed by Dr. Michael Walden of North
Carolina State University, which has been updated since the first version in 2002.1
Based on
industry data, accepted economic impact modeling techniques, and information in JDIG
applications, the model estimates income and employment effects (direct, indirect, and induced),
calculates expected effects on state expenditures and revenues, and the likely net effect on
revenue to the state’s General Fund. The Walden model includes all state incentives expected to
1 Walden, Michael. A Model to Estimate the Economic Impacts of Business Location in North Carolina: Version 3. Developed
for the NC Department of Commerce. September 2007 (with updates provided regularly).

Calendar Year 2013 Legislative Report 4
be provided from the General Fund, known at the time of application, in its calculation of net
state fiscal cost.
The statutory cap on the number of awards the EIC can make was eliminated for 2012 grants
(prior to that the number was capped at 25); however, the total future annual liability for all
grants awarded in any single calendar year has been capped at $15 million per year. For the
Fiscal Year biennium from July 2013 through June 2015, however, the cap on maximum state
liability for new awards was adjusted to $22.5 million, and from July 2015 until the program’s
scheduled sunset date at the end of 2015 the liability cap is $7.5 million. In most years, the cap
has not been reached. Also, regardless of the stated liabilities under grants awarded, many
companies’ performance does not result in eligibility for the full annual amount possible under
their respective agreements. The maximum payments for grants awarded during CY 2003-2013
will be less than the maximum theoretically possible. For example, for performance in CY 2012,
payments were made for 83% of total liability to active grantees (not counting terminated or
withdrawn grantees).2 Each grant agreement specifies the maximum amount for which a
company is eligible in each of its grant years. The state’s maximum annual liability for grants
made in 2012 is included in Attachment A1, with the maximum liability to the grantee in
Attachment A2, and the maximum liability to the Utility Account in Attachment A3. The Utility
Account receives 25% of the value of every grant payment earned by companies for projects
located in Tier 3 counties and 15% of the value of every grant payment earned by companies for
projects located in Tier 2 counties. Funds in the Utility Account are made available for
infrastructure projects in North Carolina’s more distressed counties.
Program Process: From Application to Award
All companies considered for a JDIG must first meet the minimum eligibility requirements
described in G.S. 143B-437.53. Department of Commerce (“Commerce”) Business and Industry
economic developers work with an eligible business that is a good candidate for a JDIG award
and recommend the project to senior staff for consideration. In the fall of 2013, the EIC adopted
a pricing model that sets the preliminary JDIG offer based on a prospective grantee’s location,
job count, average salary, investment, and industry. If a potential project’s parameters fall
outside of the guidelines specified by the pricing model, the EIC is polled to determine whether
members would support continuing the grant application process. Projects whose parameters fall
within the model’s guidelines do not require preliminary EIC approval before beginning the
application process. Business and Industry staff helps the company identify what North Carolina
can offer companies in comparison to other states the company is considering for the project.
Commerce Finance staff informs the company of program requirements and begins the data
collection process. The company then submits a draft application for review by Commerce staff,
which works with the company to complete an accurate final application. During the application
process, the company is required to submit the following:
• CPA-prepared financial statements
2 Note that this calculation considers both payments to companies and to the Utility Fund. Additionally, several
companies who participated in the program in 2012and filed reports have not yet been paid and/or have not yet
received the required certifications of their annual performance reports; neither liability based on their grants nor
possible payments to them are included in this calculation.

Calendar Year 2013 Legislative Report 5
• Employment profile & average annual wage for the proposed project
• Information on company’s existing North Carolina jobs and activity
• Worker benefits, including health insurance and training
• Investment schedule
• Project description
• Information on the competitive nature of the project
• Information on corporate governance
• Company organization and activity information
• Application fee of $10,000 (application fees were raised from $5,000 in 2013)
An applicant is also asked to describe any anticipated environmental issues, anticipated impact of
the project on public infrastructure, and information about compliance with laws and regulations.
This is in addition to the extensive OSHA, environmental, and tax compliance checks and the
cost-benefit analysis conducted by Commerce. An Economic Impact Analysis using the Walden
Model estimates the expected net state revenue of a project. As with any model, the results
depend on the model’s assumptions, many of which are subject to uncertainty. Best practice in
impact analysis dictates the adoption of the most conservative probable assumptions in order to
avoid over-estimation of any positive benefits attributable to a given project.
The JDIG statute requires the EIC to find, based on the modeled estimates, that a proposed JDIG
project's benefits to the state outweigh its costs to the state. The Walden Model measures this by
estimating tax revenues. The EIC seeks to identify and select projects that are the most
beneficial to the state after considering a number of different evaluation factors. Project
application materials and the results of staff analysis are provided to the EIC and considered in
one or more closed sessions. The EIC then chooses whether to propose terms it considers
appropriate for a given project, and a term sheet is provided to the company. The term sheet
outlines the structure and proposed terms of the grant and the conditions necessary to fulfill the
grant requirements. If the company accepts the terms in writing and commits to locate the project
in North Carolina, subject to the award of the grant, an open meeting is held by the EIC to award
the grant, and a Community Economic Development Agreement (“CEDA”) is executed.
Grantees are required to submit performance reports by March 1st of each year following the end
of a calendar year during the grant term, along with a reporting fee of the greater of $2,500 or
0.03% of an amount equal to the grant less the maximum amount to be transferred to the Utility
Fund.3 These reports allow Commerce and the EIC to assess grant performance and eligibility
for disbursement. The actual disbursement amount for which the company is eligible is
determined from Commerce’s analysis of the annual performance reports. The Department of
Revenue certifies the company’s reported withholdings and the absence of overdue tax debts. All
disbursements must be approved by the EIC before actual payment.
3 The fee was changed from $1,500 in 2013.

Calendar Year 2013 Legislative Report 6
III. JDIG Applicants and Grantees for CY 2013
During CY 2013, the EIC awarded 20 grants and received 18 applications.4 No grants were
awarded to projects that did not locate in North Carolina. Table 1 lists the county and tier in
which 2012 grantee projects have located or plan to locate, the first grant year, the length of the
grant term, the percent of withholdings that will be the basis for grant payments, the maximum
possible grant amount payable to the company, the maximum possible grant amount payable to
the Utility Account, and the total grant amount.
Tier
Of the CY 2013 grants, two were awarded to projects locating in a tier 1 county, two were
awarded to projects locating in a tier 2 county, and thirteen grants went to companies locating in
a tier 3 county. Three projects were spread across multiple counties. These companies could
contribute a maximum amount of approximately $52 million to the Utility Account over the life
of the grants.
Table 1. CY 2013 Grantee Terms and Award Amounts
4 It should be noted that Commerce developers interact with many more business prospects, but only those businesses that are
likely to be good candidates for a grant award are encouraged to apply, as the $10,000 application fee is non-refundable. If not a
good candidate, developers work with companies to find other assistance to support locating their project in the state. Note that
two of the 2013 awardees applied at the end of 2012. Twenty-one applications were received in 2013. Eighteen of these were
awarded in 2013, one did not complete the application process but paid an application fee, one paid a fee but withdrew before
consideration before the EIC (the fee was refunded), and the last is still seeking an award.
Company NameFirst Year of
EligibilityCounty Tier
Number of
Grant YearsWithholding
Amount to
Company
Amount to
Utility
Total Award
Liability
AIG PC Global Services, Inc. 2014 Mecklenburg 3 10 58% 4,994,250$ 1,664,750$ 6,659,000$
Allscripts Healthcare, LLC 2013 Wake 3 12 41% 5,353,500$ 1,784,500$ 7,138,000$
Areva NP, Inc. 2013 Mecklenburg 3 9 65% 2,554,500$ 851,500$ 3,406,000$
ASMO Greenville of North Carolina, Inc. 2013 Pitt 2 12 43% 1,255,450$ 221,550$ 1,477,000$
Castle Branch, Inc. 2013 New Hanover 3 8 45% 1,238,250$ 412,750$ 1,651,000$
DB Global Technology, Inc. II 2014 Wake 3 10 35% 5,559,750$ 1,853,250$ 7,413,000$
Electrolux Home Products, Inc. III 2015 Mecklenburg 3 12 75% 27,420,000$ 9,140,000$ 36,560,000$
Evalueserve, Inc. 2013 Wake 3 10 35% 2,925,750$ 975,250$ 3,901,000$
General Electric (Aviation Division) 2014 Ashe, Buncombe, Durham, New Hanover 2,3 12 75% 3,571,500$ 1,190,500$ 4,762,000$
Gildan Yarns, LLC 2016 Bladen, Davie, Rowan 1,2 12 50% 3,498,600$ 617,400$ 4,116,000$
InVue Security Products, Inc. 2013 Mecklenburg 3 9 35% 702,750$ 234,250$ 937,000$
Ipreo US, LLC 2014 Wake 3 9 65% 3,783,000$ 1,261,000$ 5,044,000$
KSM Castings NC, Inc. 2014 Cleveland 1 12 65% 2,876,000$ - 2,876,000$
MetLife Group, Inc. 2014 Mecklenburg, Wake 3 12 75% 87,271,500$ 29,090,500$ 116,362,000$
Owens Corning Composite Materials, LLC 2014 Gaston 2 10 75% 1,692,350$ 298,650$ 1,991,000$
Rack Room Shoes, Inc. 2013 Mecklenburg 3 7 40% 663,000$ 221,000$ 884,000$
RC Creations, LLC 2014 Pender 3 12 62% 975,000$ 325,000$ 1,300,000$
Sturm, Ruger & Company, Inc. 2014 Rockingham 1 12 75% 9,462,000$ - 9,462,000$
Syngenta Biotechnology, Inc. 2015 Durham, Guilford 3,2 12 51% 2,983,500$ 994,500$ 3,978,000$
XPO Logistics, Inc. II 2014 Mecklenburg 3 9 60% 3,597,750$ 1,199,250$ 4,797,000$
Total: 172,378,400$ 52,335,600$ 224,714,000$
Calendar Year 2013 Legislative Report 7
In CY 2013, 7 of the 20 JDIG grantees’ first grant year is 2013. Of the remaining grantees, 10
will seek their first payment for performance in calendar year 2014, two grantees in 2015, and
one grantee in 2016. Maximum state liability for grants awarded in 2013 is approximately $225
million (over the entire grant period for all grants), consisting of $172 million for companies, and
$52 million for the Utility Account.
Performance Minimums
Each grantee agrees to a set of performance requirements for job creation and average annual
wages to be paid during each year of the grant; many grantees also have investment
requirements. Grantees with existing employees in North Carolina are typically required to retain
these positions before being given credit for new positions. A grantee’s actual performance
determines the grant payment it receives each year. The payment can never be more than the
maximum annual state liability stated in each company’s grant agreement for that year.
CY 2013 grantees are expected to create 8,072 direct jobs and are required to retain 7,491 jobs
over their grant terms. Grantees are also anticipated to invest approximately $1.1 billion in land,
buildings and fixtures, infrastructure, or machinery and equipment and other tangible personal
property at the project site. Table 2 outlines the target number of jobs, jobs to be retained, target
average annual wage, and investment for each 2013 grantee.5 Anticipated job effects are reported
at full employment for each project. For companies that show no capital investment requirement,
this is generally due to the small size of expected investment (typically less than $5 million). A
company’s annual compliance is measured using a weighted average of a company’s compliance
with job creation, average wages, and investment minimums.
5 The target numbers are based on the company’s projections in its application. “Target average annual wage” is
typically based on the lowest cumulative average wage the company expects to pay during a project’s base period.
As noted later in the text, the EIC often provides a cushion, such as a 10% reduction of these numbers, as the
minimum performance requirement for a grantee to maintain compliance.

Calendar Year 2013 Legislative Report 8
Table 2: CY 2013 Grantee Jobs, Wages and Investment
Attachment B provides historical and CY 2013 direct job creation requirements (specifically, the
number of jobs to be created when the project has completed its job ramp up period, known as
the “base period”). Grantees that have withdrawn or terminated from the program are not
included in Attachment B. The minimum required job creation in order to avoid default is
typically 90% of the target number of direct jobs, allowing flexibility for fluctuations and
attrition, although sometimes the minimum is set at 95% or 100%, usually if projected job
numbers or wages are relatively low. Typically, there is a lag between the time an award is made
and the actual commencement of new project operations and hiring of permanent staff on which
the grant is based. Many projects invest substantial time and dollars on construction, plant
renovation, and equipment. As a result, many JDIG grantees do not create many positions in the
year in which they are awarded a grant, and sometimes not for several years.
Estimated Economic Impact
The 8,072 new direct jobs associated with CY 2013 projects affect other sectors by increasing
demand for goods and services by businesses and households. These indirect and induced
(multiplier) effects are estimated to add 9,248 jobs, for a total estimated employment impact of
17,320 jobs. State Gross Domestic Product is expected to increase by almost $14 billion over the
life of CY 2013 grants. The projects are expected to provide a net fiscal benefit to the state of
Company Name Target JobsJobs to be
Retained
Target Average
Annual Wage
Target
Investment
AIG PC Global Services, Inc. 230 - 100,776$ 5,502,657$
Allscripts Healthcare, LLC 350 1,264 75,800$ -$
Areva NP, Inc. 130 640 133,452$ -$
ASMO Greenville of North Carolina, Inc. 200 536 34,628$ 50,000,000$
Castle Branch, Inc. 420 180 33,108$ 10,250,000$
DB Global Technology, Inc. II 431 319 89,227$ 13,600,000$
Electrolux Home Products, Inc. III 810 760 101,485$ 85,000,000$
Evalueserve, Inc. 400 - 59,629$ -$
General Electric (Aviation Division) 242 1,382 47,831$ 195,130,000$
Gildan Yarns, LLC 501 564 32,279$ 258,000,000$
InVue Security Products, Inc. 70 88 83,333$ -$
Ipreo US, LLC 250 2 63,149$ -$
KSM Castings NC, Inc. 189 - 42,810$ 45,068,511$
MetLife Group, Inc. 2,622 143 81,891$ 125,500,000$
Owens Corning Composite Materials, LLC 110 75 51,919$ 121,000,000$
Rack Room Shoes, Inc. 87 160 71,716$ 16,039,100$
RC Creations, LLC 120 - 33,308$ 25,000,000$
Sturm, Ruger & Company, Inc. 473 - 47,364$ 26,750,000$
Syngenta Biotechnology, Inc. 150 1,133 81,624$ 94,000,000$
XPO Logistics, Inc. II 287 245 51,614$ -$
Total: 8,072 7,491 70,612$ 1,070,840,268$

Calendar Year 2013 Legislative Report 9
approximately $233 million during their grant terms. A complete listing of estimated economic
impacts for all active and “closed” JDIG projects is presented in Attachment B.6
Table 3. Comparison of CY 2012 Grantees to CY 2013 Grantees
IV. General Description of Calendar Year 2013 Grantees
A project’s strategic importance to the state, region and locality is considered in the EIC’s grant
decision-making process. Many companies offer employment, generous benefits, and long-term
competitive potential. Projects also provide new employment opportunities for unemployed
members of the labor force with project-relevant skills.
The industrial sectors of the projects are examined by the EIC to ensure that a project fits the
strategic plans of the state and its region. CY 2013 projects include sectors such as headquarters,
software development, textiles, biotechnology, manufacturing, and transportation logistics,
among others. These projects require labor at a variety of skill levels and types -- lower-skilled
assembly trades, high-skilled manufacturing production, and knowledge-intensive consumer and
business services.
For all projects awarded in CY 2013, the target average annual wage of all employees is
$70,612. The CY 2013 target average annual wage at full employment is above CY 2012
grantees’ target average annual wage of $57,341. Chart 1 compares the expected wage levels of
CY 2013 grantees and CY 2012 grantees, along with the number of employees within certain
wage ranges.
6 “Closed” refers to grantees that have completed their JDIG terms. It does not include “terminated” or “withdrawn”
grantees. The 2003 grant to General Electric Company is the only closed grant.
JDIG GranteesTotal Grant
Award LiabilityExpected Jobs
Jobs
Retained
Expected
Investment
Indirect +
Induced JobsTotal Jobs
Estimated NC GDP
Impact (million)
Cumulative Net State
Revenue (million)
Total CY 2012 134,699,000$ 7,076 9,116 1,000,796,839$ 10,008 17,084 10,734$ 145$
Total CY 2013 224,714,000$ 8,072 7,491 1,070,840,268$ 9,248 17,320 13,592$ 233$
Percent Change: 67% 14% -18% 7% -8% 1% 27% 60%

Calendar Year 2013 Legislative Report 10
Chart 1. Expected Jobs by Wage Increments: CY 2013 and CY 2012 Grantees
It is expected that 76% of CY 2013 project employees will earn over $50,000 dollars annually.
Wage information does not include some elements of employee compensation, such as health
insurance, stock options, and other benefits. For all grants made, the company is required to pay
at least 50% of employee health insurance premiums, although many pay more.
JDIG is the state’s flagship program for both retention and expansion of existing North Carolina
companies and recruitment of new companies to the state. For existing businesses, a JDIG award
not only supports new job creation, but can help protect existing jobs. Table 4 summarizes the
estimated job effects and economic effects of 2013 grantees according to three classifications:
“Expanding Operations,” “New Operations (Company New to NC),” and “New Operations
(Company Existing in NC).” “Expanding Operations” represents companies that were awarded a
JDIG for a project that is an expansion of an existing facility or a new facility in the same
industrial sector as its existing North Carolina facilities. “New Operations (Company New to
NC)” represents companies without a prior presence in North Carolina. “New Operations
(Company Existing in NC)” represents companies with a presence in North Carolina, but whose
JDIG was awarded for operations in an industrial sector that is different from that of its existing
North Carolina facilities. Of the 20 projects, 14 are “Expanding Operations,” 4 are “New
Operations (Company New to NC),” and 2 are “New Operations (Company Existing in NC).”7
It should be noted that with respect to the Grantee Profiles in Section VI, certain companies with
existing operations in North Carolina have requirements that they retain the number of positions
that exist at the time of their JDIG applications before counting any new jobs as eligible for grant
payments, and other companies with existing operations do not have this requirement. The JDIG
statute limits grant payments for jobs filled by employees that represent a net increase in the
number of the company’s employees statewide, except where the EIC makes an explicit finding
that the increase or maintenance of employment may be measured at the level of a division or
7 Industrial sectors are determined by research staff in consultation with applicants.

Calendar Year 2013 Legislative Report 11
other operating unit of a business (a “Division Level Finding”), rather than at the business level;
that this is necessary in order to secure the project to the state; and that the agreement includes
terms to ensure that the business does not transfer existing positions to the project. This might be
done where a company has distinct and separate operations and lines of business, under different
management structures. An example of a case where a division level finding may be
implemented would be a company with a large number of retail facilities that is seeking to locate
a new headquarters operation for its national operations, in which case the decision is unrelated
to decisions about retail site location.
Table 4. Comparison of New Operations to Existing Operations, CY 2013
V. JDIG Grantee Performance
This section examines actual results of active JDIG grantees since the program’s inception. As of
the end of 2013, there were 72 companies participating in the program whose 2012 performance
results have been certified.8 For analysis purposes, the companies are typically considered
‘reporting grantees’. This nomenclature describes the subset of companies that have been
awarded a grant, created new jobs, and have reported activity for calendar year 2012 to
Commerce that has been certified by the Department of Revenue, and are eligible for grant
payments. Companies are required to provide the EIC with detailed annual reports during each
calendar year in which they are eligible for grant payments. The reports document company
compliance with performance requirements of their respective CEDAs. The companies must
provide the EIC with information on the number of eligible jobs created, existing positions
retained, wages paid for eligible positions, investment made, certification of employee health
insurance, and fulfillment of environmental, tax, and OSHA requirements. Companies forgo a
year’s grant payments for failure to achieve 80% compliance with the minimum requirements,
based on a weighted average of performance factors, and may receive a pro-rated payment for
compliance between 80% and less than 100%. If a company fails to achieve 100% of the
minimum performance requirement for 3 years during its base period, the company is ineligible
for a payment. At certain points of non-compliance, a company may lose its grant entirely.
Attachment C displays the JDIG annual grant performance results that were reported in CY
2013. Most of these reports are based on CY 2012 performance, but some results for CY 2011
performance are included since they were certified in 2013. Companies must report by March 1
8 Actual participants in 2012 may exceed 72, but the exact performance and payments numbers cannot be
established until reported results have been certified. This section covers only those participants whose 2012 (and
some 2011) results have been certified and whose eligibility for payment was certified in 2013.
2013 GranteesTotal Grant Award
Liability
% of Total
Grants
Expected
Jobs
Expected
Investment
% of Total
Investment
Indirect +
Induced JobsTotal Jobs % of Total Jobs
Estimated NC GDP
Impact (million)
New Operations
(Company New to NC) 20,297,000$ 9.0% 1,012 102,321,168$ 9.6% 1,209 2,221 12.8% 1,718$
New Operations
(Company Existing in NC) 5,892,000$ 2.6% 510 121,000,000$ 11.3% 483 993 5.7% 653$
Expanding Operations 198,525,000$ 88.3% 6,550 847,519,100$ 79.1% 7,556 14,106 81.4% 11,221$

Calendar Year 2013 Legislative Report 12
of each year following the end of a calendar year during their grant terms, and at that point
Commerce staff analyzes and reviews grantee reports for eligibility. In 2013, Commerce and the
EIC reviewed, certified, and awarded 80 companies for CY 2011 and CY 2012 grantee
performance. Attachment D displays annual disbursements made for grants awarded in CY
2003-2012.
Chart 2 shows the actual certified average wage levels for the 72 companies who filed annual
reports in CY 2013 for performance in CY 2012.
Chart 2. Reported Jobs by Wage Increment: CY 2012 Reporting Grantees
Distribution of Grants
An important goal of JDIG and other state incentive programs is the geographic distribution of
benefits across the state. The JDIG program has two mechanisms to fulfill this goal. First, the
Committee takes into account the economic characteristics of counties when awarding grants and
setting grant terms. Second, for projects locating in tier 3 or tier 2 counties (relatively less
economically distressed counties), 25% (in tier 3) or 15% (in tier 2) of the amount of the grant
payment for which a company is eligible is deposited into the Utility Account.9 The annual
deposits to the Utility Account will increase significantly as more projects become eligible for
disbursements. Figure 1 summarizes the distribution of JDIG grants awarded in CY 2003-2013
by county.10
9 Utility Account funds may be used for construction or improvements to water, sewer, gas, telecommunications, high-speed
broadband, electrical utility distribution lines or equipment, or transportation infrastructure, for existing or proposed eligible
industrial buildings in economically distressed counties.
10 All JDIG awards including those terminated. In instances where a project received one grant for locating facilities in multiple
counties, each county is shown as receiving an equal share of the grant awarded.

Calendar Year 2013 Legislative Report 13
Figure 1. Location of JDIG Awards, CY 2003-2013

Calendar Year 2013 Legislative Report 14
Environmental Impact
All JDIG projects are screened for necessary environmental permits and reviewed for
potential environmental impacts. Commerce works closely with the Department of
Environment and Natural Resources (DENR) staff during the JDIG review process. Upon
receipt of an application, Commerce forwards a copy to the staff environmental
consultant, who prepares a memo and a due diligence report for consideration by the EIC.
To-date, there has been no indication that any existing grantee will experience difficulty
obtaining needed permits, nor have there been significant concerns regarding the
environmental impacts of existing projects. In addition, all grantees are required to
certify they have received all required environmental permits when filing their annual
report with the EIC.
VI. Grantee Profiles for Calendar Year 2013
AIG PC Global Services, Inc. (“PC Global Services”)
PC Global Services provides application technical support for its parent company, AIG
Property Casualty, Inc. (AIG). These activities include the design, development, testing
and deployment of software supporting various insurance functions.
This project creates a technology center that will provide application support for various
business units and functions of AIG, including North American underwriting, global
claims and other corporate functions.
AIG evaluated sites in Rock Hill, South Carolina in addition to North Carolina. The key
factors in site selection included a skilled labor market, the proximity to
universities/colleges, a competitive incentive package, the proximity to large financial
institutions, the quality of life, and the proximity to a major airport.
For information regarding the specific job creation, wages, investment and location of
this project please refer to Tables 1 and 2.
Allscripts Healthcare Solutions, Inc. (“Allscripts”)
Allscripts develops and markets clinical software. Allscripts recently created “Centers of
Excellence”, with the goal of providing a concentrated and focused work environment
while reducing complexity and cost. Raleigh was named one of these centers and
Chicago the other.
This project consolidates of five engineering centers into one site. In addition to the
Raleigh operation center, the company evaluated its Chicago headquarters as a potential
location for the project.
For information regarding the specific job creation, wages, investment and location of
this project please refer to Tables 1 and 2.

Calendar Year 2013 Legislative Report 15
Areva NP, Inc. (“Areva”)
Areva is in the global nuclear industry, providing an integrated menu of services to utilities
that cover all stages of the fuel cycle, nuclear reactor design and construction, and related
services. Charlotte is Areva’s engineering “Center of Excellence”, providing engineering
and project management for the nuclear fleet, new build activities, and services for the
Department of Energy.
The project leverages Areva’s existing workforce locations through headquarters
relocation and the expansion of operations. The company also considered a location in
Virginia, which offered state incentives with a value of almost $3 million.
For information regarding the specific job creation, wages, investment and location of
this project please refer to Tables 1 and 2.
ASMO Greenville of North Carolina, Inc. (“GNC”)
ASMO North America, LLC (ANAM) is a manufacturer of automotive systems and a
subsidiary of ASMO Co., Ltd., located in Kosai City, Japan. GNC produces radiator fan
motors and wiper systems from the initial processing of parts (die casting/press) to the
final assembly of the automated transfer lines. GNC is classified as a Tier 1 supplier,
manufacturing and shipping directly to Original Equipment Manufacturers (OEM) such
as Toyota, Chrysler, Honda, Ford, General Motors, Hyundai, and Kia.
This facility expansion will allow GNC to add more die cast machines, which in turn will
support the growth of the wiper systems. The projected growth will allow GNC to
increase its overall share in the wiper systems market to an estimated 34% (up from 30%)
in North America.
ANAM requested proposals for the project from economic development agencies in
Texas, Michigan, and North Carolina, where it has existing locations. The company
based its decision upon local and state offers of incentive assistance, inherent operating
benefits and disadvantages at each site, and other relevant factors, ultimately choosing the
Greenville site as the location for this expansion once the anticipated North Carolina
incentives were approved.
For information regarding the specific job creation, wages, investment and location of
this project, please refer to Tables 1 and 2.
Castle Branch, Inc. (“Castle Branch”)
Since 1997, Castle Branch has provided criminal and sex offender records, random and
on-site drug testing, credit and social security reports, employment and education
verifications, and professional licensure certification. In 2003, Castle Branch created
CertifiedBackground.com, which is a provider of background screening, drug testing, and
immunization record tracking solutions for colleges and universities nationwide.

Calendar Year 2013 Legislative Report 16
This project expands its current operations. The competition for this project was
California. Castle Branch acquired Apollo Services, located in Petaluma, CA in 2012,
and with the acquisition acquired a client base on the west coast.
For information regarding the specific job creation, wages, investment and location of
this project please refer to Tables 1 and 2.
DB Global Technology, Inc. (“DBGT”)
In 2009 in an effort to reduce its costs and increase its efficiency in development and
maintenance of its software applications, Deutsche Bank AG (DBAG) created a new
software company, DBGT. This brought the work that was performed in higher cost DB
locations and services provided by third party providers in-house and changed where and
how DBAG creates its software.
DBGT produces software applications for financial instrument trading, order
management and transaction processing, algorithmic trading, real-time and complex risk
calculations, and web-based front-end applications. It also produces software used for
client regulatory reporting, booking and operational data management (transactional data
warehousing), research systems (document management, web portals, research analytics),
and grid computing. The project established in North Carolina focuses on strategic
application development work transitioned from higher cost DBAG locations and
development of technology solutions.
The company considered locations in North Carolina and Jacksonville, Florida.
Company due diligence showed that both North Carolina and Florida have a deep labor
pool of IT professionals who could provide the labor force within the range of salaries
considered for this project. DBGT evaluated its return on investment and determined that
expanding in North Carolina was incrementally more expensive than expanding in
Florida; however, the company agreed that North Carolina’s offer of a JDIG for the
project substantially reduced the gap, making North Carolina the final choice for this
expansion.
For information regarding the specific job creation, wages, investment and location of
this project, please refer to Tables 1 and 2.
Electrolux Home Products, Inc. (“EHPI”)
Electrolux produces home appliances and appliances for professional use, selling more
than 40 million products to customers in more than 150 markets annually. Electrolux
products include refrigerators, freezers, washers and dryers, vacuum cleaners,
dishwashers, and cooking products sold primarily under the Electrolux, Frigidaire, and
Eureka brands in North America. The Electrolux entities that will participate in this
project are all owned directly or indirectly by Electrolux North America, Inc. (ENA).
The company is expanding its existing corporate headquarters in Charlotte. The positions
created are in the areas of research and development, accounting, marketing,
administration, and executive management. The addition of engineering positions

Calendar Year 2013 Legislative Report 17
represents the consolidation of engineering operations and employees into one
engineering center.
In addition to North Carolina, EHPI management considered two other potential
locations: South Carolina and Tennessee. South Carolina offered several desirable
locations in York and Lancaster Counties. South Carolina submitted a formal proposal
that included significant up-front cash incentives and cash grants valued at approximately
$54 million. EHPI recently established a large manufacturing facility in Memphis,
Tennessee. That facility was located there after extensive analysis of the incentives
offered in Tennessee, Alabama, and North Carolina. Tennessee was chosen in large part
due to its superb incentive package.
For information regarding the specific job creation, wages, investment and location of
this project, please refer to Tables 1 and 2.
Evalueserve, Inc. (“EVS”)
Evalueserve, LTD is a global provider of custom professional research and analytics
services, employing approximately 2,600 full-time professionals. It has research centers
located in, among other places, China, Chile, Romania, India, and the United Kingdom.
This project’s operations are focused on financial services research and analytics. The
company’s vision is to create a “Center of Excellence” in data analytics and big data
science at the U.S. center.
The competing locations included Cleveland, Pittsburgh, Austin, Charlotte, and the
Research Triangle Park (RTP) area. After reviewing each of these locations, Austin and
Cleveland emerged as the final competitors to the RTP area.
For information regarding the specific job creation, wages, investment and location of
this project please refer to Tables 1 and 2.
General Electric Company (“GE”)
GE consists of eight primary business divisions: Oil & Gas, Energy Management, Power
& Water, Healthcare, Transportation, Capital, Home & Business Solutions and Aviation.
GE Aviation is a leading provider of commercial and military jet engines and
components, as well as avionics, electric power, and mechanical systems for aircraft with
an extensive global service network to support these products.
This project brings new manufacturing to North Carolina, including a facility for the
production of advanced ceramic matrix composite (CMC) materials for aircraft and gas
turbine engines. CMC components are lighter weight than existing materials used in
engine production and allow for higher temperatures, increasing engine efficiency.
Nine states including North Carolina were considered for the project. South Carolina’s
incentive package was valued at $14.8 million while Virginia’s totaled $11 million.

Calendar Year 2013 Legislative Report 18
Additionally, South Carolina had several local incentive packages worth over $30 million
over a 10-year period.
For information regarding the specific job creation, wages, investment and location of
this project please refer to Tables 1 and 2.
Gildan Yarns, LLC (“Gildan”)
Gildan spins cotton and polyester into yarn for use in the textile industry. The company
sells its yarn production to its parent, Gildan Activewear, for its worldwide knitting
facilities. Gildan Activewear is a marketer and manufacturer of branded basic apparel.
Gildan operates two facilities located in Cedartown, Georgia, and Clarkton, North
Carolina and has approximately 230 employees. Gildan Activewear also owns Gold Toe
Moretz, a leading supplier of branded athletic, casual and dress socks, and Gildan
Activewear (Eden) Inc. (a related member to this grant), the distribution center serving
the U.S. screen print market.
Gildan is constructing a new facility behind its facility under renovation in Salisbury,
along with a second new facility in Mocksville, and an expansion/renovation of their
existing operation in Clarkton. The company anticipates developing a campus-like setting
for its new facilities and the adjoining land in Rowan and Davie Counties could enable
future expansions at either or both locations.
For the two new approximately 650,000 square foot facilities that will house new yarn
production in Davie and Rowan Counties, the company considered two sites in South
Carolina: Chester County Industrial Park in Chester, SC and York County Industrial Park
in York, SC. The Clarkton expansion was also in competition with an existing facility in
Cedartown, Georgia, which is also owned by Gildan. There was sufficient area on the
existing site of the Georgia facility to add new additional spinning frames. South
Carolina offered an incentive package valued at approximately $14 million.
For information regarding the specific job creation, wages, investment and location of
this project, please refer to Tables 1 and 2.
InVue Security Products, Inc. (“InVue”)
InVue was founded in 1972 as Alpha Enterprises, Inc. and since its inception the
company has focused on providing products that help prevent retail theft. Based on a
variety of factors, including the increased prevalence of smart phone and tablet products,
investment in products and investment in a global sales and distribution infrastructure,
the company expects to see sales grow at approximately 25% in each of the next five
years.
This project is an expansion of the Charlotte headquarters facility that also includes
engineering operations, quality lab, and a product showroom. The company plans to add
an additional 20,000 square feet of space to serve as its innovation and design center.

Calendar Year 2013 Legislative Report 19
The company considered several factors during the site selection process, including the
proximity of the existing work force, airport access, quality of the local workforce, and
quality of education, and healthcare. Based on these criteria, the search was narrowed to
Mecklenburg County and Lancaster County, SC. The company received an incentive
offer from the state of South Carolina valued at $4 million over ten years.
For information regarding the specific job creation, wages, investment and location of
this project please refer to Tables 1 and 2.
Ipreo US LLC (“Ipreo US”)
Ipreo Holdings LLC is a global provider of market intelligence, platforms that facilitate
the issuance of equity and debt securities, and investor communications tools to the
world’s leading investment banks, over 400 small and medium sized financial firms, and
over 1,000 corporate clients.
Ipreo US is establishing a business center that will both mirror its New York HQ
operations and serve as a base for future staff growth. Staffing includes product
development, marketing, and analytical functions. The company considered several
locations for this center, including existing domestic and international sites, as well as
potential new “green field” locations.
Baltimore, Maryland was the alternative location considered for this project due to the
company’s existing facilities in Bethesda Maryland, the depth of the labor pool, lower
labor costs, and easy accessibility to the New York Metropolitan Area. The company
was offered over $5.5 million in incentives from the State of Maryland and the City of
Baltimore. Additional forgivable loans and other tax credits were also offered.
For information regarding the specific job creation, wages, investment and location of
this project please refer to Tables 1 and 2.
KSM Castings NC Inc. (“KSM”)
The direct parent of KSM, KSM Castings Group GmbH, was founded in 1947 as a
private company. It produces light metal casting products (chassis, powertrain and body
applications) for use in the automobile industry. From 1995 to 2011, KSM Castings
Group experienced a compound annual growth rate of 9% per year, and constructed three
greenfield facilities in Germany, China, and the Czech Republic.
KSM provides casting components to existing and new customers with a presence in the
U.S. The company expects to establish a production facility of approximately 110,000
square feet and install 8-10 high pressure die-casting machines. KSM identified more
than 60 possible site locations in Kentucky, Virginia, North Carolina, South Carolina,
Alabama, and Tennessee. From that list, more than 20 sites were investigated. Three
final sites were identified: Elizabethtown, KY, Auburn, AL, and Shelby, NC.
For information regarding the specific job creation, wages, investment and location of
this project, please refer to Tables 1 and 2.

Calendar Year 2013 Legislative Report 20
MetLife Group, Inc. (“MLG”)
MetLife, Inc. is a leading global provider of insurance, annuities, and employee benefit
programs, serving 90 million customers. Through its subsidiaries and affiliates, MetLife
holds market positions in the U.S., Japan, Latin America, Asia, Europe, the Middle East,
and Africa. The company consists of six segments: Retail, Group, Voluntary & Worksite
Benefits, Corporate Benefit Funding, Latin America, and the Asia and Europe, Middle
East and Africa (EMEA) Segments.
This project involves a range of functional activities in support of MetLife’s business.
The positions generally fall into two general areas: Retail Business and Technology. The
Mecklenburg County positions focus on the company’s retail business and servicing
customers. New employees will include product experts in life insurance, property and
casualty insurance, as well as customer and sales support. The Triangle site will house
the company’s technology groups and includes functions such as enterprise infrastructure
and architecture engineering, project management, and application solution functions and
development.
St. Louis County in Missouri was the main competition for this project. The company
represented that St. Louis County, Missouri offered a significant package consisting of
the state’s Quality Jobs Program, state bonding initiatives, training funds and local sales
and property tax offsets, which exceeded the value of the North Carolina package.
For information regarding the specific job creation, wages, investment and location of
this project, please refer to Tables 1 and 2.
Owens Corning Composite Materials, LLC (“CSB”)
Owens Corning was founded in 1938. Its products range from glass fiber used to
reinforce composite materials for transportation, electronics, marine, infrastructure, wind-
energy and other high-performance markets to insulation and roofing for residential,
commercial, and industrial applications. Owens Corning operates within two segments:
composites and building materials. In response to growing market demand for its
products, the company is expanding with a new non-woven technology facility.
CSB undertook a competitive site selection process, with project analysis taking into
account all items affecting the project's profit and loss, including: site costs, utilities,
taxes, and labor. In addition to the chosen Gastonia, NC site, the company considered two
sites in Georgia.
For information regarding the specific job creation, wages, investment and location of
this project, please refer to Tables 1 and 2.
Rack Room Shoes, Inc. (“Rack Room”)
Rack Room and its wholly-owned subsidiary, Off Broadway, operate over 400 retail
stores in the U.S. selling branded and imported private label footwear and accessories. In

Calendar Year 2013 Legislative Report 21
1995, the corporate headquarters was relocated to Charlotte. At the time of its grant
application, Rack Room employed over 4,000 associates in over 350 stores in 29 states.
Rack Room and Off Broadway are consolidating their headquarters on a single North
Carolina campus, providing increased leverage with vendors, allowing better pricing, and
improving coordination. The companies looked at multiple South Carolina sites during
the site selection process. The final decision was based on business environment, tax
implications, and the availability of a qualified work force to support expansion plans.
For information regarding the specific job creation, wages, investment and location of
this project, please refer to Tables 1 and 2.
RC Creations, LLC (“RC Creations”)
Acme Smoked Fish Corporation (“Acme”), the parent company of RC Creations, was
incorporated in 1954, and is continuing to grow. It is adding more product lines and new
packaging. The company uses vacuum-pack technology to produce both traditional salty
lox and cold-smoked salmon packs. Since 2000 it has expanded to the west coast and into
south Florida.
This facility will import fresh-frozen whole salmon from South America, Europe, and
Canada. Once smoked, the salmon will be measured and packaged according to
customer specifications and then shipped for distribution.
Acme initially considered locations along the eastern seaboard from Massachusetts to
Georgia. More than 150 sites were evaluated, and the list was narrowed to five states:
Georgia, Maryland, North Carolina, South Carolina, and Virginia. After site visits by the
principals of the company were completed, North Carolina and Virginia remained in
contention for the project. The Virginia site would have allowed the company to receive
$7 million in equity on its capital investment within 7 years of completion of the New
Market Tax Credit process. Virginia’s offer also included a $2 million extension of the
natural gas line.
For information regarding the specific job creation, wages, investment and location of
this project, please refer to Tables 1 and 2.
Sturm, Ruger & Company, Inc. (“Ruger”)
Ruger is principally engaged in the design, manufacture, and sale of firearms to domestic
customers. Its design and manufacturing operations are located in the United States. It
offers products in three categories: rifles, pistols, and revolvers.
Ruger required a new manufacturing facility to accommodate increased growth and
planned new products. This facility will begin with multiple manufacturing lines
employing production workers, tool makers, manufacturing engineers, and product
design engineers.

Calendar Year 2013 Legislative Report 22
Ruger established an internal site selection team that considered the following factors for:
workforce quality and availability, gun industry regulations, operating cost structure,
availability of incentives, natural disaster risk, and real estate options. States or
municipalities not offering strong incentive packages were eliminated. The final states
considered were Texas, South Carolina, and North Carolina.
For information regarding the specific job creation, wages, investment and location of
this project please refer to Tables 1 and 2.
Syngenta Biotechnology, Inc. (“SBI”)
Syngenta Corporation (“Syngenta”) is one of the largest agribusiness companies in the
world, with global sales in 2012 of $14.2 billion. Syngenta operates in the crop protection
market and the commercial seed market, among others. Its seed portfolio offers over 200
product lines and over 6,800 varieties of Syngenta’s proprietary genetics. Syngenta was
founded in November 2000 as a result of a spin-off and merger between Novartis AG’s
crop protection and seeds business and AstraZeneca PLC’s agrochemicals and
biotechnology business. The company headquarters is in Basel, Switzerland.
The project consists of a new laboratory and office facilities for the company’s new
Syngenta RTP Innovation Center.
North Carolina, Iowa, and Minnesota were under consideration for this project.
International locations in China, Brazil, and France also factored into the decision-
making. The company stated that site consolidations, expansions, access to scientific
resources, community support, discretionary incentives, and economic conditions were
considered before the final choice of NC was made.
For information regarding the specific job creation, wages, investment and location of
this project, please refer to Tables 1 and 2.
XPO Logistics, Inc. (“XPO”)
XPO is a third-party shipping logistics provider. XPO provides three core services:
freight brokerage, expedited transportation, and freight forwarding. XPO serves
customers in the U.S., Canada, and Mexico with domestic and international freight
destinations.
As part of the next growth segment in its trucking brokerage operations, XPO is
expanding its truck brokerage workforce with this project. The company conducted an
extensive analysis to identify the optimal location. It evaluated its existing new facilities
to determine the capacity for growth at each. This analysis considered impacts of
operational costs and labor availability. XPO had two finalist locations: Charlotte, NC
and Gainesville, GA. The company stated that Georgia’s labor and real estate costs are
lower than North Carolina’s, while North Carolina scored high in labor availability and
quality. The sites had similar characteristics, and the company reported that financial
incentives were a key factor in the final decision.

Calendar Year 2013 Legislative Report 23
For information regarding the specific job creation, wages, investment and location of
this project please refer to Tables 1 and 2.
VII. Conclusion
The JDIG program has been a widely used tool in the competitive incentives market for
attracting investment in North Carolina. The jobs, investment, and spending of projects
supported by JDIG grants are believed to enhance the strategic economic development of
the state and the increase in revenues to the state’s general fund has been substantial.

Calendar Year 2013 Legislative Report 24
Attachment A1. Total Annual Grant Caps per Project
Projects Awarded in CY 2013
Company Name 2013 2014 2015 2016 2017 2018 2019 2020 2021 2022 2023 2024 2025 2026 2027 Total
AIG PC Global Services, Inc. -$ 266,000$ 585,000$ 663,000$ 735,000$ 735,000$ 735,000$ 735,000$ 735,000$ 735,000$ 735,000$ -$ -$ -$ -$ 6,659,000$
Allscripts Healthcare, LLC 293,000$ 489,000$ 570,000$ 570,000$ 652,000$ 652,000$ 652,000$ 652,000$ 652,000$ 652,000$ 652,000$ 652,000$ -$ -$ -$ 7,138,000$
Areva NP, Inc. 97,000$ 97,000$ 290,000$ 487,000$ 487,000$ 487,000$ 487,000$ 487,000$ 487,000$ -$ -$ -$ -$ -$ -$ 3,406,000$
ASMO Greenville of North Carolina, Inc. 32,000$ 71,000$ 114,000$ 140,000$ 140,000$ 140,000$ 140,000$ 140,000$ 140,000$ 140,000$ 140,000$ 140,000$ -$ -$ -$ 1,477,000$
Castle Branch, Inc. 33,000$ 67,000$ 140,000$ 211,000$ 300,000$ 300,000$ 300,000$ 300,000$ -$ -$ -$ -$ -$ -$ -$ 1,651,000$
DB Global Technology, Inc. II -$ 319,000$ 638,000$ 807,000$ 807,000$ 807,000$ 807,000$ 807,000$ 807,000$ 807,000$ 807,000$ -$ -$ -$ -$ 7,413,000$
Electrolux Home Products, Inc. III -$ -$ 2,026,000$ 2,674,000$ 3,186,000$ 3,186,000$ 3,186,000$ 3,186,000$ 3,186,000$ 3,186,000$ 3,186,000$ 3,186,000$ 3,186,000$ 3,186,000$ -$ 36,560,000$
Evalueserve, Inc. 56,000$ 169,000$ 282,000$ 388,000$ 501,000$ 501,000$ 501,000$ 501,000$ 501,000$ 501,000$ -$ -$ -$ -$ -$ 3,901,000$
General Electric (Aviation Division) -$ 97,000$ 155,000$ 316,000$ 466,000$ 466,000$ 466,000$ 466,000$ 466,000$ 466,000$ 466,000$ 466,000$ 466,000$ -$ -$ 4,762,000$
Gildan Yarns, LLC -$ -$ -$ 343,000$ 343,000$ 343,000$ 343,000$ 343,000$ 343,000$ 343,000$ 343,000$ 343,000$ 343,000$ 343,000$ 343,000$ 4,116,000$
InVue Security Products, Inc. 26,000$ 47,000$ 77,000$ 107,000$ 136,000$ 136,000$ 136,000$ 136,000$ 136,000$ -$ -$ -$ -$ -$ -$ 937,000$
Ipreo US, LLC -$ 407,000$ 473,000$ 540,000$ 604,000$ 604,000$ 604,000$ 604,000$ 604,000$ 604,000$ -$ -$ -$ -$ -$ 5,044,000$
KSM Castings NC, Inc. -$ 123,000$ 179,000$ 207,000$ 239,000$ 266,000$ 266,000$ 266,000$ 266,000$ 266,000$ 266,000$ 266,000$ 266,000$ -$ -$ 2,876,000$
MetLife Group, Inc. -$ 6,791,000$ 9,961,000$ 9,961,000$ 9,961,000$ 9,961,000$ 9,961,000$ 9,961,000$ 9,961,000$ 9,961,000$ 9,961,000$ 9,961,000$ 9,961,000$ -$ -$ 116,362,000$
Owens Corning Composite Materials, LLC -$ 33,000$ 174,000$ 223,000$ 223,000$ 223,000$ 223,000$ 223,000$ 223,000$ 223,000$ 223,000$ -$ -$ -$ -$ 1,991,000$
Rack Room Shoes, Inc. 91,000$ 106,000$ 124,000$ 134,000$ 143,000$ 143,000$ 143,000$ -$ -$ -$ -$ -$ -$ -$ -$ 884,000$
RC Creations, LLC -$ 89,000$ 94,000$ 100,000$ 113,000$ 113,000$ 113,000$ 113,000$ 113,000$ 113,000$ 113,000$ 113,000$ 113,000$ -$ -$ 1,300,000$
Sturm, Ruger & Company, Inc. -$ 270,000$ 514,000$ 758,000$ 880,000$ 880,000$ 880,000$ 880,000$ 880,000$ 880,000$ 880,000$ 880,000$ 880,000$ -$ -$ 9,462,000$
Syngenta Biotechnology, Inc. -$ -$ 62,000$ 114,000$ 166,000$ 404,000$ 404,000$ 404,000$ 404,000$ 404,000$ 404,000$ 404,000$ 404,000$ 404,000$ -$ 3,978,000$
XPO Logistics, Inc. II -$ 533,000$ 533,000$ 533,000$ 533,000$ 533,000$ 533,000$ 533,000$ 533,000$ 533,000$ -$ -$ -$ -$ -$ 4,797,000$
Total: 628,000$ 9,974,000$ 16,991,000$ 19,276,000$ 20,615,000$ 20,880,000$ 20,880,000$ 20,737,000$ 20,437,000$ 19,814,000$ 18,176,000$ 16,411,000$ 15,619,000$ 3,933,000$ 343,000$ 224,714,000$

Calendar Year 2013 Legislative Report 25
Attachment A2. Total Annual Grant Caps on Company Portion Only
Projects Awarded in CY 2013
Company Name 2013 2014 2015 2016 2017 2018 2019 2020 2021 2022 2023 2024 2025 2026 2027 Total
AIG PC Global Services, Inc. -$ 199,500$ 438,750$ 497,250$ 551,250$ 551,250$ 551,250$ 551,250$ 551,250$ 551,250$ 551,250$ -$ -$ -$ -$ 4,994,250$
Allscripts Healthcare, LLC 219,750$ 366,750$ 427,500$ 427,500$ 489,000$ 489,000$ 489,000$ 489,000$ 489,000$ 489,000$ 489,000$ 489,000$ -$ -$ -$ 5,353,500$
Areva NP, Inc. 72,750$ 72,750$ 217,500$ 365,250$ 365,250$ 365,250$ 365,250$ 365,250$ 365,250$ -$ -$ -$ -$ -$ -$ 2,554,500$
ASMO Greenville of North Carolina, Inc. 27,200$ 60,350$ 96,900$ 119,000$ 119,000$ 119,000$ 119,000$ 119,000$ 119,000$ 119,000$ 119,000$ 119,000$ -$ -$ -$ 1,255,450$
Castle Branch, Inc. 24,750$ 50,250$ 105,000$ 158,250$ 225,000$ 225,000$ 225,000$ 225,000$ -$ -$ -$ -$ -$ -$ -$ 1,238,250$
DB Global Technology, Inc. II -$ 239,250$ 478,500$ 605,250$ 605,250$ 605,250$ 605,250$ 605,250$ 605,250$ 605,250$ 605,250$ -$ -$ -$ -$ 5,559,750$
Electrolux Home Products, Inc. III -$ -$ 1,519,500$ 2,005,500$ 2,389,500$ 2,389,500$ 2,389,500$ 2,389,500$ 2,389,500$ 2,389,500$ 2,389,500$ 2,389,500$ 2,389,500$ 2,389,500$ -$ 27,420,000$
Evalueserve, Inc. 42,000$ 126,750$ 211,500$ 291,000$ 375,750$ 375,750$ 375,750$ 375,750$ 375,750$ 375,750$ -$ -$ -$ -$ -$ 2,925,750$
General Electric (Aviation Division) -$ 72,750$ 116,250$ 237,000$ 349,500$ 349,500$ 349,500$ 349,500$ 349,500$ 349,500$ 349,500$ 349,500$ 349,500$ -$ -$ 3,571,500$
Gildan Yarns, LLC -$ -$ -$ 291,550$ 291,550$ 291,550$ 291,550$ 291,550$ 291,550$ 291,550$ 291,550$ 291,550$ 291,550$ 291,550$ 291,550$ 3,498,600$
InVue Security Products, Inc. 19,500$ 35,250$ 57,750$ 80,250$ 102,000$ 102,000$ 102,000$ 102,000$ 102,000$ -$ -$ -$ -$ -$ -$ 702,750$
Ipreo US, LLC -$ 305,250$ 354,750$ 405,000$ 453,000$ 453,000$ 453,000$ 453,000$ 453,000$ 453,000$ -$ -$ -$ -$ -$ 3,783,000$
KSM Castings NC, Inc. -$ 123,000$ 179,000$ 207,000$ 239,000$ 266,000$ 266,000$ 266,000$ 266,000$ 266,000$ 266,000$ 266,000$ 266,000$ -$ -$ 2,876,000$
MetLife Group, Inc. -$ 5,093,250$ 7,470,750$ 7,470,750$ 7,470,750$ 7,470,750$ 7,470,750$ 7,470,750$ 7,470,750$ 7,470,750$ 7,470,750$ 7,470,750$ 7,470,750$ -$ -$ 87,271,500$
Owens Corning Composite Materials, LLC -$ 28,050$ 147,900$ 189,550$ 189,550$ 189,550$ 189,550$ 189,550$ 189,550$ 189,550$ 189,550$ -$ -$ -$ -$ 1,692,350$
Rack Room Shoes, Inc. 68,250$ 79,500$ 93,000$ 100,500$ 107,250$ 107,250$ 107,250$ -$ -$ -$ -$ -$ -$ -$ -$ 663,000$
RC Creations, LLC -$ 66,750$ 70,500$ 75,000$ 84,750$ 84,750$ 84,750$ 84,750$ 84,750$ 84,750$ 84,750$ 84,750$ 84,750$ -$ -$ 975,000$
Sturm, Ruger & Company, Inc. -$ 270,000$ 514,000$ 758,000$ 880,000$ 880,000$ 880,000$ 880,000$ 880,000$ 880,000$ 880,000$ 880,000$ 880,000$ -$ -$ 9,462,000$
Syngenta Biotechnology, Inc. -$ -$ 46,500$ 85,500$ 124,500$ 303,000$ 303,000$ 303,000$ 303,000$ 303,000$ 303,000$ 303,000$ 303,000$ 303,000$ -$ 2,983,500$
XPO Logistics, Inc. II -$ 399,750$ 399,750$ 399,750$ 399,750$ 399,750$ 399,750$ 399,750$ 399,750$ 399,750$ -$ -$ -$ -$ -$ 3,597,750$
Total: 474,200$ 7,589,150$ 12,945,300$ 14,768,850$ 15,811,600$ 16,017,100$ 16,017,100$ 15,909,850$ 15,684,850$ 15,217,600$ 13,989,100$ 12,643,050$ 12,035,050$ 2,984,050$ 291,550$ 172,378,400$

Calendar Year 2013 Legislative Report 26
Attachment A3. Total Annual Grant Caps on IDF Utility Account Portion
Projects Awarded in CY 2013
Company Name 2013 2014 2015 2016 2017 2018 2019 2020 2021 2022 2023 2024 2025 2026 2027 Total
AIG PC Global Services, Inc. -$ 66,500$ 146,250$ 165,750$ 183,750$ 183,750$ 183,750$ 183,750$ 183,750$ 183,750$ 183,750$ -$ -$ -$ -$ 1,664,750$
Allscripts Healthcare, LLC 73,250$ 122,250$ 142,500$ 142,500$ 163,000$ 163,000$ 163,000$ 163,000$ 163,000$ 163,000$ 163,000$ 163,000$ -$ -$ -$ 1,784,500$
Areva NP, Inc. 24,250$ 24,250$ 72,500$ 121,750$ 121,750$ 121,750$ 121,750$ 121,750$ 121,750$ -$ -$ -$ -$ -$ -$ 851,500$
ASMO Greenville of North Carolina, Inc. 4,800$ 10,650$ 17,100$ 21,000$ 21,000$ 21,000$ 21,000$ 21,000$ 21,000$ 21,000$ 21,000$ 21,000$ -$ -$ -$ 221,550$
Castle Branch, Inc. 8,250$ 16,750$ 35,000$ 52,750$ 75,000$ 75,000$ 75,000$ 75,000$ -$ -$ -$ -$ -$ -$ -$ 412,750$
DB Global Technology, Inc. II -$ 79,750$ 159,500$ 201,750$ 201,750$ 201,750$ 201,750$ 201,750$ 201,750$ 201,750$ 201,750$ -$ -$ -$ -$ 1,853,250$
Electrolux Home Products, Inc. III -$ -$ 506,500$ 668,500$ 796,500$ 796,500$ 796,500$ 796,500$ 796,500$ 796,500$ 796,500$ 796,500$ 796,500$ 796,500$ -$ 9,140,000$
Evalueserve, Inc. 14,000$ 42,250$ 70,500$ 97,000$ 125,250$ 125,250$ 125,250$ 125,250$ 125,250$ 125,250$ -$ -$ -$ -$ -$ 975,250$
General Electric (Aviation Division) -$ 24,250$ 38,750$ 79,000$ 116,500$ 116,500$ 116,500$ 116,500$ 116,500$ 116,500$ 116,500$ 116,500$ 116,500$ -$ -$ 1,190,500$
Gildan Yarns, LLC -$ -$ -$ 51,450$ 51,450$ 51,450$ 51,450$ 51,450$ 51,450$ 51,450$ 51,450$ 51,450$ 51,450$ 51,450$ 51,450$ 617,400$
InVue Security Products, Inc. 6,500$ 11,750$ 19,250$ 26,750$ 34,000$ 34,000$ 34,000$ 34,000$ 34,000$ -$ -$ -$ -$ -$ -$ 234,250$
Ipreo US, LLC -$ 101,750$ 118,250$ 135,000$ 151,000$ 151,000$ 151,000$ 151,000$ 151,000$ 151,000$ -$ -$ -$ -$ -$ 1,261,000$
KSM Castings NC, Inc. -$ -$ -$ -$ -$ -$ -$ -$ -$ -$ -$ -$ -$ -$ -$ -$
MetLife Group, Inc. -$ 1,697,750$ 2,490,250$ 2,490,250$ 2,490,250$ 2,490,250$ 2,490,250$ 2,490,250$ 2,490,250$ 2,490,250$ 2,490,250$ 2,490,250$ 2,490,250$ -$ -$ 29,090,500$
Owens Corning Composite Materials, LLC -$ 4,950$ 26,100$ 33,450$ 33,450$ 33,450$ 33,450$ 33,450$ 33,450$ 33,450$ 33,450$ -$ -$ -$ -$ 298,650$
Rack Room Shoes, Inc. 22,750$ 26,500$ 31,000$ 33,500$ 35,750$ 35,750$ 35,750$ -$ -$ -$ -$ -$ -$ -$ -$ 221,000$
RC Creations, LLC -$ 22,250$ 23,500$ 25,000$ 28,250$ 28,250$ 28,250$ 28,250$ 28,250$ 28,250$ 28,250$ 28,250$ 28,250$ -$ -$ 325,000$
Sturm, Ruger & Company, Inc. -$ -$ -$ -$ -$ -$ -$ -$ -$ -$ -$ -$ -$ -$ -$ -$
Syngenta Biotechnology, Inc. -$ -$ 15,500$ 28,500$ 41,500$ 101,000$ 101,000$ 101,000$ 101,000$ 101,000$ 101,000$ 101,000$ 101,000$ 101,000$ -$ 994,500$
XPO Logistics, Inc. II -$ 133,250$ 133,250$ 133,250$ 133,250$ 133,250$ 133,250$ 133,250$ 133,250$ 133,250$ -$ -$ -$ -$ -$ 1,199,250$
Total: 153,800$ 2,384,850$ 4,045,700$ 4,507,150$ 4,803,400$ 4,862,900$ 4,862,900$ 4,827,150$ 4,752,150$ 4,596,400$ 4,186,900$ 3,767,950$ 3,583,950$ 948,950$ 51,450$ 52,335,600$

Calendar Year 2013 Legislative Report 27
Attachment B. Estimated Lifetime Fiscal and Economic Impacts for Grants
Awarded in CY 2003-2013 (Excluding Grants Terminated or Withdrawn through December 31, 2013)
Grant Year
Project (Grantee) Grant Years
Expected Jobs
Indirect + Induced Jobs
Total Jobs
Estimated NC GDP impact (million)
Estimated Cumulative Net State Revenue
(million)
2003 Albaad USA, Inc. 10 200 416 616 $194 $1
2003 General Electric Company 9 200 174 374 $359 $5
2003 Total (Grant Term is average) 10 400 590 990 $554 $6
2004 Altec Industries, Inc. 11 350 302 652 $240 $3
2004 Cellco Partnership d/b/a Verizon Wireless 10 1,211 1,938 3,149 $1,207 $21
2004 Credit Suisse Securities (USA) LLC (I) 10 400 344 744 $2,470 $88
2004 Cree, Inc. I 11 275 731 1,006 $903 $17
2004 Hospira, Inc. 10 152 380 532 $317 $8
2004 Merck Sharp & Dohme Corp. 12 200 360 560 $1,430 $20
2004 NetApp, Inc. I 10 361 410 771 $2,520 $99
2004 Pactiv LLC (fka Prairie Packaging, Inc.) 10 242 140 382 $444 $14
2004 TWC Administration LLC (I) 10 350 305 655 $372 $7
2004 Total (Grant Term is average) 10 3,541 4,910 8,451 $9,902 $278
2005 American Institute of Certified Accountants, Inc.
12 360 179 539 $606 $11
2005 Target Corporation 10 580 270 850 $363 $6
2005 Total (Grant Term is average) 11 4,481 5,359 9,840 $10,871 $294
2006 Credit Suisse Securities (USA) LLC (II) 10 575 282 857 $1,022 $29
2006 Fidelity Global Brokerage Group, Inc. 12 2,000 772 2,772 $4,300 $94
2006 MOM Brands Company (f/k/a Malt-O-Meal) 10 164 247 411 $351 $10
2006 Novartis Vaccines and Diagnostics, Inc. I 12 350 1,038 1,388 $1,463 $41
2006 Quintiles Transnational Corp. 12 1,000 830 1,830 $963 $5
2006 Ralph Lauren Corporation I 9 200 43 243 $1,746 $78

Calendar Year 2013 Legislative Report 28
Grant Year
Project (Grantee) Grant Years
Expected Jobs
Indirect + Induced Jobs
Total Jobs
Estimated NC GDP impact (million)
Estimated Cumulative Net State Revenue
(million)
2006 Total (Grant Term is average) 11 8,770 8,571 17,341 $20,716 $550
2007 Honda Aero, Inc. 12 70 116 186 $339 $11
2007 Honda Aircraft Company, LLC 12 283 672 955 $754 $12
2007 NetApp, Inc. II 10 646 418 1,064 $1,080 $24
2007 Pharmaceutical Research Associates, Inc. 9 494 419 913 $422 $5
2007 Stone & Webster Services, LLC 10 556 496 1,052 $611 $7
2007 Total (Grant Term is average) 11 12,019 11,565 23,584 $26,630 $693
2008 HCL America Inc. 10 513 341 854 $407 $1
2008 Spirit AeroSystems North Carolina, Inc. 12 1,031 1,437 2,468 $2,944 $39
2008 Sypris Technologies, Inc. 10 203 171 374 $365 $6
2008 TWC Administration LLC (II) 9 200 136 336 $440 $13
2008 Total (Grant Term is average) 10 13,966 13,650 27,616 $30,786 $752
2009 AFI US LLC (f/k/a Ally US LLC and GMAC) 9 200 234 434 $272 $2
2009 ASCO Power Technologies, L.P. 9 328 425 753 $367 $4
2009 Bayer CropScience LP 9 128 124 252 $149 $1
2009 Continental Automotive Systems, Inc. 9 338 368 706 $346 $7
2009 DB Global Technology, Inc. I 11 319 584 903 $724 $14
2009 Electrolux Home Products, Inc. I 12 738 912 1,650 $1,274 $13
2009 EMC Corporation 9 397 850 1,247 $752 $13
2009 Innovative Emergency Management, Inc. 12 430 367 797 $619 $9
2009 Loparex LLC 9 128 166 294 $198 $2
2009 Premier Healthcare Solutions, Inc. 9 300 241 541 $292 $6
2009 Siemens Energy, Inc. I 9 226 147 373 $236 $2
2009 Zenta Mortgage Services, LLC 9 1,002 883 1,885 $555 $3
2009 Total (Grant Term is average) 10 4,534 5,301 9,835 $5,785 $77
2010 ABB Inc. 9 130 311 441 $295 $7
2010 BAE Systems Shared Services Inc. 9 176 157 333 $189 $4

Calendar Year 2013 Legislative Report 29
Grant Year
Project (Grantee) Grant Years
Expected Jobs
Indirect + Induced Jobs
Total Jobs
Estimated NC GDP impact (million)
Estimated Cumulative Net State Revenue
(million)
2010 Brunswick Corporation (Hatteras Yachts Division)
12 350 487 837 $290 $2
2010 Caterpillar Inc. (Butterfly) 11 325 1,320 1,645 $834 $23
2010 Caterpillar Inc. (Camo) 11 392 1,125 1,517 $758 $13
2010 Celgard, LLC I 11 289 291 580 $381 $5
2010 Citco Fund Services (USA) Inc. 9 258 336 594 $223 $3
2010 Clearwater Paper Corporation 12 250 813 1,063 $762 $12
2010 Cree, Inc. II 10 244 922 1,166 $762 $23
2010 Hewitt Associates LLC (d/b/a Aon Hewitt) 9 463 538 1,001 $517 $14
2010 Husqvarna Professional Products, Inc. 9 160 663 823 $224 $3
2010 Magna Composites LLC 9 327 424 751 $175 $3
2010 Novartis Vaccines and Diagnostics, Inc. II 9 100 125 225 $141 $1
2010 Novo Nordisk Pharmaceutical Industries, Inc. 10 85 145 230 $117 $1
2010 Plastek Industries, Inc. 9 250 197 447 $264 $3
2010 Siemens Energy, Inc. (Smart Grid) 9 139 173 312 $156 $3
2010 Siemens Energy, Inc. II 12 825 2,784 3,609 $2,149 $32
2010 SPX Corporation 11 180 161 341 $250 $4
2010 TIMCO Aerosystems, LLC 9 275 421 696 $211 $3
2010 Total (Grant Term is average) 10 9,752 16,694 26,446 $14,482 $236
2011 American Roller Bearing Company of North Carolina
9 231 283 514 $285 $4
2011 AptarGroup, Inc. 9 150 118 268 $138 $2
2011 Capgemini Financial Services USA Inc. 5 550 547 1,097 $222 $1
2011 Celgard, LLC II 11 250 255 505 $362 $6
2011 Chiquita Brands International, Inc. 11 417 607 1,024 $826 $2
2011 CTL Packaging USA, Inc. 10 131 134 265 $197 $4
2011 Eaton Corporation 10 120 184 304 $120 $1

Calendar Year 2013 Legislative Report 30
Grant Year
Project (Grantee) Grant Years
Expected Jobs
Indirect + Induced Jobs
Total Jobs
Estimated NC GDP impact (million)
Estimated Cumulative Net State Revenue
(million)
2011 HVM L.L.C. 12 170 267 437 $419 $9
2011 Infinisource, Inc. 8 162 90 252 $121 $2
2011 Linamar North Carolina, Inc. I 9 363 693 1,056 $530 $10
2011 LORD Corporation 8 117 184 301 $119 $2
2011 Mitsubishi Nuclear Energy Systems, Inc. 9 135 159 294 $156 $0
2011 Pittsburgh Glass Works LLC 10 260 286 546 $296 $6
2011 Red Hat, Inc. I 12 240 554 794 $749 $21
2011 Red Hat, Inc. II 12 300 694 994 $761 $20
2011 Semprius, Inc. 11 256 967 1,223 $421 $0
2011 Sequenom Center for Molecular Medicine, LLC 9 242 246 488 $2,110 $93
2011 Superior Essex Energy LLC 9 116 324 440 $210 $3
2011 TWC Administration LLC (III) 9 225 353 578 $363 $9
2011 Total (Grant Term is average) 10 14,642 24,221 38,863 $23,348 $436
2012 Ashley Furniture Industries, Inc. 10 550 444 994 $522 $4
2012 Caterpillar Inc. (Bee) 9 199 501 700 $486 $13
2012 Citrix Systems, Inc. 12 337 380 717 $505 $4
2012 Deere-Hitachi Construction Machinery Corporation
9 340 724 1,064 $703 $16
2012 Denver Global Products, Inc. 10 450 639 1,089 $560 $9
2012 Gildan Yarns, LLC (f/k/a CanAm Yarns, LLC) 10 170 138 308 $166 $1
2012 GKN Driveline North America, Inc. 10 131 223 354 $164 $2
2012 Hamilton Sundstrand Corporation 12 325 501 826 $1,579 $38
2012 Herbalife International of America, Inc. 11 493 900 1,393 $963 $20
2012 Inmar, Inc. 10 212 161 373 $236 $1
2012 JELD-WEN, Inc. 9 142 219 361 $229 $3
2012 Klausner Lumber Two, LLC 11 350 725 1,075 $557 $2
2012 Leviton Manufacturing Co., Inc. 8 152 181 333 $141 $1

Calendar Year 2013 Legislative Report 31
Grant Year
Project (Grantee) Grant Years
Expected Jobs
Indirect + Induced Jobs
Total Jobs
Estimated NC GDP impact (million)
Estimated Cumulative Net State Revenue
(million)
2012 Linamar North Carolina, Inc. II 9 250 439 689 $333 $4
2012 NetApp, Inc. III 10 460 518 978 $581 $2
2012 Ralph Lauren Corporation II 9 500 335 835 $285 $3
2012 Reed Elsevier Inc. 10 350 353 703 $508 $4
2012 S & D Coffee, Inc. 10 200 680 880 $371 $7
2012 Schletter, Inc. 9 305 411 716 $278 $1
2012 Sheetz Distribution Services, LLC 12 254 170 424 $273 $2
2012 Sid Tool Co, Inc. 12 400 617 1,017 $702 $1
2012 Valley Fine Foods Company, Inc. 10 305 557 862 $372 $3
2012 XPO Logistics, Inc. 10 201 191 392 $222 $2
2012 Total (Grant Term is average) 10 7,076 10,008 17,084 $10,734 $145
2013 AIG PC Global Services, Inc. 10 230 222 452 $312 $8
2013 Allscripts Healthcare, LLC 12 350 338 688 $534 $8
2013 Areva NP, Inc. 9 130 121 251 $268 $7
2013 ASMO Greenville of North Carolina, Inc. 12 200 357 557 $292 $5
2013 Castle Branch, Inc. 8 420 135 555 $181 $4
2013 DB Global Technology, Inc. II 10 431 416 847 $469 $4
2013 Electrolux Home Products, Inc. III 12 810 1,120 1,930 $1,513 $14
2013 Evalueserve, Inc. 10 400 330 730 $378 $8
2013 General Electric (Aviation Division) 12 242 579 821 $457 $3
2013 Gildan Yarns, LLC 12 501 376 877 $756 $28
2013 InVue Security Products, Inc. 9 70 108 178 $87 $2
2013 Ipreo US, LLC 9 250 229 479 $324 $5
2013 KSM Castings NC, Inc. 12 189 199 388 $231 $2
2013 MetLife Group, Inc. 12 2,622 3,242 5,864 $5,379 $50
2013 Owens Corning Composite Materials, LLC 10 110 153 263 $275 $12
2013 Rack Room Shoes, Inc. 7 87 134 221 $83 $2

Calendar Year 2013 Legislative Report 32
Grant Year
Project (Grantee) Grant Years
Expected Jobs
Indirect + Induced Jobs
Total Jobs
Estimated NC GDP impact (million)
Estimated Cumulative Net State Revenue
(million)
2013 RC Creations, LLC 12 120 242 362 $244 $9
2013 Sturm, Ruger & Company, Inc. 12 473 545 1,018 $931 $36
2013 Syngenta Biotechnology, Inc. 12 150 201 351 $342 $9
2013 XPO Logistics, Inc. II 9 287 198 485 $535 $16
2013 Total (Grant Term is average) 11 8,072 9,248 17,320 $13,592 $233
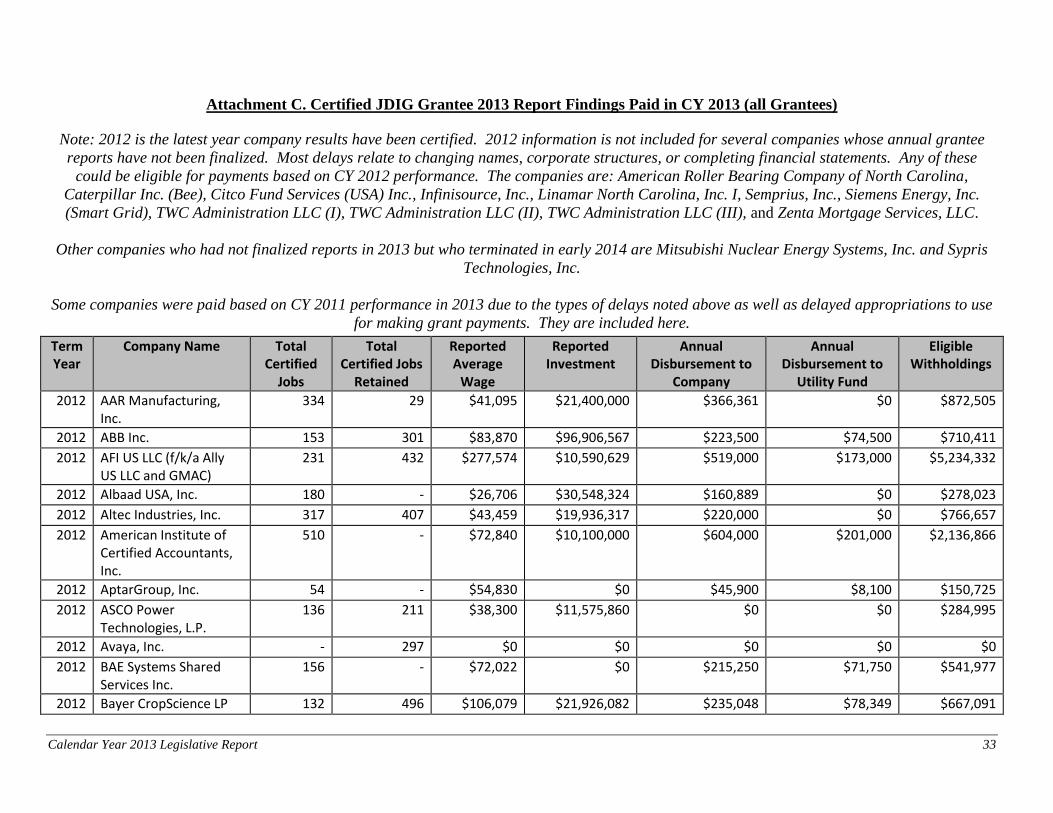
Calendar Year 2013 Legislative Report 33
Attachment C. Certified JDIG Grantee 2013 Report Findings Paid in CY 2013 (all Grantees)
Note: 2012 is the latest year company results have been certified. 2012 information is not included for several companies whose annual grantee
reports have not been finalized. Most delays relate to changing names, corporate structures, or completing financial statements. Any of these
could be eligible for payments based on CY 2012 performance. The companies are: American Roller Bearing Company of North Carolina,
Caterpillar Inc. (Bee), Citco Fund Services (USA) Inc., Infinisource, Inc., Linamar North Carolina, Inc. I, Semprius, Inc., Siemens Energy, Inc.
(Smart Grid), TWC Administration LLC (I), TWC Administration LLC (II), TWC Administration LLC (III), and Zenta Mortgage Services, LLC.
Other companies who had not finalized reports in 2013 but who terminated in early 2014 are Mitsubishi Nuclear Energy Systems, Inc. and Sypris
Technologies, Inc.
Some companies were paid based on CY 2011 performance in 2013 due to the types of delays noted above as well as delayed appropriations to use
for making grant payments. They are included here.
Term Year
Company Name Total Certified
Jobs
Total Certified Jobs
Retained
Reported Average
Wage
Reported Investment
Annual Disbursement to
Company
Annual Disbursement to
Utility Fund
Eligible Withholdings
2012 AAR Manufacturing, Inc.
334 29 $41,095 $21,400,000 $366,361 $0 $872,505
2012 ABB Inc. 153 301 $83,870 $96,906,567 $223,500 $74,500 $710,411
2012 AFI US LLC (f/k/a Ally US LLC and GMAC)
231 432 $277,574 $10,590,629 $519,000 $173,000 $5,234,332
2012 Albaad USA, Inc. 180 - $26,706 $30,548,324 $160,889 $0 $278,023
2012 Altec Industries, Inc. 317 407 $43,459 $19,936,317 $220,000 $0 $766,657
2012 American Institute of Certified Accountants, Inc.
510 - $72,840 $10,100,000 $604,000 $201,000 $2,136,866
2012 AptarGroup, Inc. 54 - $54,830 $0 $45,900 $8,100 $150,725
2012 ASCO Power Technologies, L.P.
136 211 $38,300 $11,575,860 $0 $0 $284,995
2012 Avaya, Inc. - 297 $0 $0 $0 $0 $0
2012 BAE Systems Shared Services Inc.
156 - $72,022 $0 $215,250 $71,750 $541,977
2012 Bayer CropScience LP 132 496 $106,079 $21,926,082 $235,048 $78,349 $667,091

Calendar Year 2013 Legislative Report 34
Term Year
Company Name Total Certified
Jobs
Total Certified Jobs
Retained
Reported Average
Wage
Reported Investment
Annual Disbursement to
Company
Annual Disbursement to
Utility Fund
Eligible Withholdings
2012 Brunswick Corporation (Hatteras Yachts Division)
221 279 $36,040 $4,671,767 $205,700 $36,300 $434,008
2012 Capgemini Financial Services USA Inc.
166 5 $63,781 $0 $0 $0 $663,294
2011 Caterpillar Inc. (Butterfly)
147 924 $36,793 $16,205,159 $127,500 $22,500 $229,501
2012 Caterpillar Inc. (Butterfly)
269 1,066 $46,916 $0 $221,000 $39,000 $606,712
2012 Caterpillar Inc. (Camo) 181 - $78,258 $0 $258,000 $86,000 $715,049
2012 Celgard, LLC I 319 390 $57,061 $87,749,699 $375,750 $125,250 $1,111,869
2012 Celgard, LLC II - 709 $0 $0 $0 $0 $0
2012 Cellco Partnership d/b/a Verizon Wireless
1,174 - $46,118 $39,868,088 $800,000 $266,666 $2,477,079
2012 Chiquita Brands International, Inc.
281 13 $113,115 $0 $543,368 $181,122 $1,218,583
2012 Clearwater Paper Corporation
192 2 $55,456 $267,382,432 $222,000 $0 $470,514
2012 Continental Automotive Systems, Inc.
250 291 $39,965 $32,043,237 $192,750 $64,250 $499,992
2012 Credit Suisse Securities (USA) LLC (I)
400 763 $84,025 $179,656,000 $933,707 $311,235 $1,904,956
2012 Credit Suisse Securities (USA) LLC (II)
720 443 $78,054 $69,808,731 $1,290,000 $430,000 $3,156,327
2012 Cree, Inc. I 512 1,511 $87,580 $332,000,259 $586,170 $195,390 $2,846,528
2012 Cree, Inc. II 277 1,746 $68,824 $208,424,991 $144,000 $48,000 $806,633
2012 CTL Packaging USA, Inc. 21 - $58,613 $0 $0 $0 $45,802
2012 DB Global Technology, Inc. I
242 - $114,263 $7,121,593 $0 $0 $1,598,622

Calendar Year 2013 Legislative Report 35
Term Year
Company Name Total Certified
Jobs
Total Certified Jobs
Retained
Reported Average
Wage
Reported Investment
Annual Disbursement to
Company
Annual Disbursement to
Utility Fund
Eligible Withholdings
2012 Eaton Corporation 51 201 $48,690 $0 $42,457 $7,492 $100,578
2012 Electrolux Home Products, Inc. I
686 39 $108,959 $13,767,567 $1,949,156 $649,718 $4,336,033
2012 EMC Corporation 333 953 $88,233 $0 $566,250 $188,750 $1,496,011
2012 Fidelity Global Brokerage Group, Inc.
1,898 1,007 $89,682 $74,191,163 $4,610,546 $1,536,849 $8,878,191
2012 General Electric Company
237 1,402 $132,737 $4,464,914 $650,000 $216,666 $1,986,575
2012 Hamilton Sundstrand Corporation
221 - $236,362 $0 $520,617 $173,539 $1,223,032
2012 HCL America Inc. 675 33 $58,540 $3,104,222 $654,000 $218,000 $1,412,072
2012 Hewitt Associates LLC (d/b/a Aon Hewitt)
503 545 $48,586 $0 $478,500 $159,500 $1,173,176
2012 Honda Aero, Inc. 40 - $105,388 $26,835,257 $0 $0 $253,897
2012 Honda Aircraft Company, LLC
454 53 $97,338 $114,303,338 $660,000 $220,000 $2,547,753
2012 Hospira, Inc. 192 2,569 $63,582 $17,075,434 $162,000 $54,000 $677,012
2012 Husqvarna Professional Products, Inc.
169 160 $100,098 $7,681,155 $294,750 $98,250 $1,075,120
2012 HVM L.L.C. 192 - $84,416 $0 $377,651 $125,883 $924,744
2012 Inmar, Inc. 99 740 $65,628 $0 $126,674 $42,224 $246,288
2012 Innovative Emergency Management, Inc.
56 7 $69,069 $0 $0 $0 $253,933
2012 Loparex LLC 97 92 $78,044 $12,014,582 $0 $0 $425,240
2012 LORD Corporation 16 329 $139,864 $0 $31,500 $10,500 $95,708
2012 Magna Composites LLC 148 360 $46,634 $10,320,485 $0 $0 $434,423
2012 Merck Sharp & Dohme Corp.
259 1,501 $113,908 $314,156,557 $381,000 $126,999 $1,896,058
2012 MOM Brands Company 249 - $50,832 $130,927,523 $124,500 $41,500 $562,637

Calendar Year 2013 Legislative Report 36
Term Year
Company Name Total Certified
Jobs
Total Certified Jobs
Retained
Reported Average
Wage
Reported Investment
Annual Disbursement to
Company
Annual Disbursement to
Utility Fund
Eligible Withholdings
(f/k/a Malt-O-Meal)
2012 NetApp, Inc. I 361 1,168 $134,225 $86,348,754 $1,113,750 $371,250 $2,839,593
2012 NetApp, Inc. II 859 670 $115,988 $64,066,448 $1,783,000 $594,000 $5,903,056
2011 Novartis Vaccines and Diagnostics, Inc. I
322 96 $80,297 $581,125,642 $472,000 $157,000 $1,442,193
2012 Novartis Vaccines and Diagnostics, Inc. I
359 119 $86,974 $581,125,642 $571,000 $190,000 $1,763,169
2011 Novartis Vaccines and Diagnostics, Inc. II
71 347 $129,670 $0 $186,146 $62,049 $438,699
2012 Novartis Vaccines and Diagnostics, Inc. II
104 374 $137,102 $34,032,647 $310,500 $103,500 $801,817
2012 Novo Nordisk Pharmaceutical Industries, Inc.
115 436 $67,096 $104,551,058 $72,750 $24,250 $444,390
2012 Pactiv LLC (fka Prairie Packaging, Inc.)
278 - $37,535 $56,343,505 $176,000 $58,666 $532,789
2012 Pharmaceutical Research Associates, Inc.
492 18 $75,948 $2,638,401 $980,000 $327,000 $2,479,955
2012 Pittsburgh Glass Works LLC
6 20 $100,145 $0 $0 $0 $12,438
2012 Plastek Industries, Inc. 233 77 $29,587 $22,783,678 $225,148 $0 $347,842
2011 Premier Healthcare Solutions, Inc.
109 748 $119,878 $77,939,264 $227,250 $75,750 $661,355
2012 Premier Healthcare Solutions, Inc.
231 748 $125,509 $77,939,264 $345,000 $115,000 $1,517,348
2011 Quintiles Transnational Corp.
802 1,159 $86,877 $55,779,067 $1,647,000 $549,000 $3,701,704
2012 Quintiles Transnational Corp.
1,000 1,159 $92,286 $55,779,067 $2,206,000 $735,000 $5,372,267

Calendar Year 2013 Legislative Report 37
Term Year
Company Name Total Certified
Jobs
Total Certified Jobs
Retained
Reported Average
Wage
Reported Investment
Annual Disbursement to
Company
Annual Disbursement to
Utility Fund
Eligible Withholdings
2011 Ralph Lauren Corporation I
253 1,168 $37,493 $34,161,024 $160,000 $54,000 $484,240
2012 Ralph Lauren Corporation I
253 1,238 $42,095 $34,161,024 $160,000 $54,000 $579,282
2012 Red Hat, Inc. I 241 696 $108,016 $0 $320,250 $106,750 $1,478,085
2012 Reed Elsevier Inc. 49 383 $113,748 $0 $0 $0 $168,901
2012 Schletter, Inc. 8 - $34,308 $0 $0 $0 $2,664
2012 Sequenom Center for Molecular Medicine, LLC
13 - $54,168 $0 $0 $0 $10,804
2012 Siemens Energy, Inc. I 226 1,250 $105,031 $45,307,807 $337,500 $112,500 $1,112,474
2012 Siemens Energy, Inc. II 475 1,001 $112,787 $0 $814,500 $271,500 $2,650,924
2012 Spirit AeroSystems North Carolina, Inc.
382 - $58,633 $0 $691,183 $0 $1,134,164
2012 SPX Corporation 84 252 $87,107 $81,172,507 $135,000 $45,000 $457,982
2012 Stone & Webster Services, LLC
53 780 $152,315 $14,218,888 $0 $0 $648,692
2012 Superior Essex Energy LLC
2 238 $176,756 $0 $0 $0 $18,960
2012 Target Corporation 494 - $36,147 $157,746,621 $435,856 $0 $950,070
2012 TIMCO Aerosystems, LLC
138 - $49,446 $0 $141,100 $24,900 $392,052
2012 Turbomeca Manufacturing, Inc.
128 - $58,267 $52,331,829 $0 $0 $403,778
2011 TWC Administration LLC (I)
462 748 $126,668 $31,300,000 $460,000 $153,333 $3,778,996
2011 TWC Administration LLC (II)
348 862 $81,596 $5,566,911 $380,000 $127,000 $1,691,380
Total: 23,101 36,061 $82,605 $4,453,176,980 $34,470,427 $10,593,730 $104,649,595

Calendar Year 2013 Legislative Report 38
Note: Some companies showing zero dollars of investment may not have been required to submit investment totals at the time of this report. Investment is only required to be reported to the Department of Commerce one time, and is typically done after the company has completed making initial investments in a project. Often this requirement comes at the end of a company’s base period/job creation period. Some companies are not required to submit investment figures if projected investment is low. Retention shown as zero may represent a company that was new to North Carolina and did not have current operations at the time the grant was awarded. Note also that the grant awarded to United Technologies Corporation changed its reporting name to Hamilton Sunstrand Corporation.

Calendar Year 2013 Legislative Report 39
Attachment D. Annual Disbursements for Grants Awarded in CY 2003-2011
Note that historical data were reviewed for errors in 2013 and may contain updated values when compared to previous JDIG annual reports.
Term Year
Company Name Amount to Company
Amount to Utility Fund
Total Disbursement
2003 General Dynamics Armament and Technical Products, Inc. $10,572 $3,524 $14,096
2003 Qimonda North America Corp. $109,470 $36,490 $145,960
2003 Total $120,042 $40,014 $160,056
2004 Cellco Partnership d/b/a Verizon Wireless $160,000 $53,333 $213,333
2004 Cree, Inc. I $29,592 $9,864 $39,456
2004 General Dynamics Armament and Technical Products, Inc. $450,000 $150,000 $600,000
2004 General Electric Company $229,518 $76,506 $306,024
2004 Goodrich Corporation $150,027 $50,009 $200,036
2004 Harris Stratex Networks Operating Corporation $68,462 $22,821 $91,283
2004 Qimonda North America Corp. $350,489 $116,830 $467,319
2004 R.H. Donnelley, Inc. (d/b/a Dex One Corp) $300,000 $100,000 $400,000
2004 TWC Administration LLC (I) $125,000 $41,666 $166,666
2004 Total $1,863,088 $621,029 $2,484,117
2005 Albaad USA, Inc. $53,781 $0 $53,781
2005 Cellco Partnership d/b/a Verizon Wireless $680,000 $226,666 $906,666
2005 Citicorp Credit Services, Inc. $227,827 $75,942 $303,769
2005 Cree, Inc. I $223,763 $74,587 $298,350
2005 General Dynamics Armament and Technical Products, Inc. $550,000 $183,000 $733,000
2005 General Electric Company $589,057 $196,353 $785,410
2005 General Electric Company II $23,572 $7,857 $31,429
2005 GETRAG Corporation $16,684 $5,561 $22,245
2005 Goodrich Corporation $213,616 $71,205 $284,821
2005 Harris Stratex Networks Operating Corporation $160,858 $53,619 $214,477

Calendar Year 2013 Legislative Report 40
Term Year
Company Name Amount to Company
Amount to Utility Fund
Total Disbursement
2005 Hospira, Inc. $23,250 $7,750 $31,000
2005 NetApp, Inc. I $236,250 $78,750 $315,000
2005 Novo Nordisk Pharmaceutical Industries, Inc. I $36,750 $12,250 $49,000
2005 Qimonda North America Corp. $489,326 $163,108 $652,434
2005 R.H. Donnelley, Inc. (d/b/a Dex One Corp) $375,000 $125,000 $500,000
2005 TWC Administration LLC (I) $360,000 $120,000 $480,000
2005 Unilin Flooring NC, LLC $53,000 $17,666 $70,666
2005 ZF Lemforder Corporation $3,685 $1,229 $4,914
2005 Total $4,316,419 $1,420,543 $5,736,962
2006 Albaad USA, Inc. $36,149 $0 $36,149
2006 Altec Industries, Inc. $48,000 $0 $48,000
2006 American Institute of Certified Accountants, Inc. $184,781 $61,593 $246,374
2006 Cellco Partnership d/b/a Verizon Wireless $800,000 $266,666 $1,066,666
2006 Citicorp Credit Services, Inc. $343,158 $114,386 $457,544
2006 Credit Suisse Securities (USA) LLC (I) $489,800 $163,266 $653,066
2006 Cree, Inc. I $340,616 $113,539 $454,155
2006 Dell Products LP $567,000 $189,000 $756,000
2006 General Dynamics Armament and Technical Products, Inc. $620,000 $207,000 $827,000
2006 General Electric Company $710,000 $236,666 $946,666
2006 General Electric Company II $167,000 $56,000 $223,000
2006 GETRAG Corporation $49,350 $16,450 $65,800
2006 Goodrich Corporation $219,743 $73,247 $292,990
2006 Harris Stratex Networks Operating Corporation $213,023 $71,008 $284,031
2006 Headway Corporate Resources, Inc. $50,175 $13,375 $63,550
2006 Hospira, Inc. $56,500 $18,834 $75,334
2006 Maersk Inc. $117,447 $39,149 $156,596
2006 Maverick Boat Company, Inc. $48,204 $0 $48,204
2006 NetApp, Inc. I $427,500 $142,500 $570,000

Calendar Year 2013 Legislative Report 41
Term Year
Company Name Amount to Company
Amount to Utility Fund
Total Disbursement
2006 Novo Nordisk Pharmaceutical Industries, Inc. I $93,000 $31,000 $124,000
2006 Pactiv LLC (fka Prairie Packaging, Inc.) $50,000 $16,666 $66,666
2006 PCB Piezotronics of North Carolina, Inc. $72,000 $0 $72,000
2006 PGT Industries, Inc. $35,689 $0 $35,689
2006 R.H. Donnelley, Inc. (d/b/a Dex One Corp) $450,000 $150,000 $600,000
2006 RF Micro Devices, Inc. $108,143 $36,047 $144,190
2006 Stiefel Research Institute, Inc. $47,000 $15,000 $62,000
2006 Sysco Food Services of Raleigh, LLC $141,463 $47,155 $188,618
2006 TWC Administration LLC (I) $414,000 $138,000 $552,000
2006 Unilin Flooring NC, LLC $97,000 $32,333 $129,333
2006 ZF Lemforder Corporation $91,149 $30,383 $121,532
2006 Total $7,087,890 $2,279,263 $9,367,153
2007 AAR Manufacturing, Inc. $110,000 $0 $110,000
2007 Albaad USA, Inc. $0 $0 $0
2007 Altec Industries, Inc. $77,000 $0 $77,000
2007 American Institute of Certified Accountants, Inc. $604,000 $201,000 $805,000
2007 Brunswick Corporation $83,524 $27,841 $111,365
2007 Carolina Classifieds.Com LLC $0 $0 $0
2007 Cellco Partnership d/b/a Verizon Wireless $800,000 $266,666 $1,066,666
2007 Chris-Craft Corporation $54,212 $0 $54,212
2007 Citicorp Credit Services, Inc. $400,630 $133,543 $534,173
2007 Credit Suisse Securities (USA) LLC (I) $855,000 $285,000 $1,140,000
2007 Cree, Inc. I $439,628 $146,542 $586,170
2007 Dell Products LP $945,000 $315,000 $1,260,000
2007 Fidelity Global Brokerage Group, Inc. $2,527,057 $842,352 $3,369,409
2007 Force Protection Industries, Inc. $0 $0 $0
2007 General Dynamics Armament and Technical Products, Inc. $685,755 $228,585 $914,340
2007 General Electric Company $650,000 $219,999 $869,999

Calendar Year 2013 Legislative Report 42
Term Year
Company Name Amount to Company
Amount to Utility Fund
Total Disbursement
2007 General Electric Company II $221,120 $77,040 $298,160
2007 GETRAG Corporation $153,813 $51,271 $205,084
2007 Goodrich Corporation $243,842 $81,281 $325,123
2007 Headway Corporate Resources, Inc. $0 $0 $0
2007 Hospira, Inc. $0 $0 $0
2007 Indian Motorcycle Company $62,870 $0 $62,870
2007 ITG Automotive Safety Textiles, LLC $13,890 $0 $13,890
2007 Maersk Inc. $280,000 $93,000 $373,000
2007 Maverick Boat Company, Inc. $82,512 $0 $82,512
2007 Merck Sharp & Dohme Corp. $140,999 $47,000 $187,999
2007 NetApp, Inc. I $648,750 $216,250 $865,000
2007 Newell Rubbermaid Inc. $299,908 $99,969 $399,877
2007 Novo Nordisk Pharmaceutical Industries, Inc. I $0 $0 $0
2007 Pactiv LLC (fka Prairie Packaging, Inc.) $86,999 $29,000 $115,999
2007 PCB Piezotronics of North Carolina, Inc. $97,621 $0 $97,621
2007 PGT Industries, Inc. $0 $0 $0
2007 R.H. Donnelley, Inc. (d/b/a Dex One Corp) $450,000 $150,000 $600,000
2007 RF Micro Devices, Inc. $319,000 $107,000 $426,000
2007 Stiefel Research Institute, Inc. $248,000 $82,000 $330,000
2007 Sysco Food Services of Raleigh, LLC $339,750 $113,250 $453,000
2007 TWC Administration LLC (I) $460,000 $153,333 $613,333
2007 Unilin Flooring NC, LLC $149,000 $49,666 $198,666
2007 Volvo Construction Equipment, NA $69,247 $23,082 $92,329
2007 ZF Lemforder Corporation $120,590 $40,197 $160,787
2007 Total $12,719,717 $4,079,867 $16,799,584
2008 AAR Manufacturing, Inc. $200,000 $0 $200,000
2008 Albaad USA, Inc. $0 $0 $0
2008 Altec Industries, Inc. $126,000 $0 $126,000

Calendar Year 2013 Legislative Report 43
Term Year
Company Name Amount to Company
Amount to Utility Fund
Total Disbursement
2008 American Institute of Certified Accountants, Inc. $604,000 $201,000 $805,000
2008 Arneg LLC $0 $0 $0
2008 Carolina Classifieds.Com LLC $0 $0 $0
2008 Cellco Partnership d/b/a Verizon Wireless $800,000 $266,666 $1,066,666
2008 Citicorp Credit Services, Inc. $322,876 $107,625 $430,501
2008 Credit Suisse Securities (USA) LLC (I) $855,000 $285,000 $1,140,000
2008 Credit Suisse Securities (USA) LLC (II) $798,797 $266,265 $1,065,062
2008 Cree, Inc. I $538,639 $179,546 $718,185
2008 Dell Products LP $0 $357,126 $357,126
2008 Fidelity Global Brokerage Group, Inc. $3,559,403 $1,186,467 $4,745,870
2008 GE-Hitachi Nuclear Energy Americas LLC $199,993 $66,664 $266,657
2008 General Electric Company $650,000 $216,666 $866,666
2008 GETRAG Corporation $177,826 $59,275 $237,101
2008 Goodrich Corporation $241,314 $80,438 $321,752
2008 Headway Corporate Resources, Inc. $0 $0 $0
2008 Honda Aero, Inc. $63,000 $11,000 $74,000
2008 Honda Aircraft Company, LLC $77,000 $25,000 $102,000
2008 Hospira, Inc. $162,000 $54,000 $216,000
2008 IBM Lender Business Process Services, Inc. $0 $0 $0
2008 INC Research, Inc. $0 $0 $0
2008 Indian Motorcycle Company $0 $0 $0
2008 ITG Automotive Safety Textiles, LLC $0 $0 $0
2008 Maersk Inc. $308,000 $103,000 $411,000
2008 Merck Sharp & Dohme Corp. $185,000 $61,666 $246,666
2008 NetApp, Inc. I $881,250 $293,750 $1,175,000
2008 NetApp, Inc. II $572,364 $190,788 $763,152
2008 Newell Rubbermaid Inc. $522,000 $174,000 $696,000
2008 Novartis Vaccines and Diagnostics, Inc. I $192,000 $64,000 $256,000

Calendar Year 2013 Legislative Report 44
Term Year
Company Name Amount to Company
Amount to Utility Fund
Total Disbursement
2008 Novo Nordisk Pharmaceutical Industries, Inc. I $0 $0 $0
2008 Pactiv LLC (fka Prairie Packaging, Inc.) $116,000 $38,666 $154,666
2008 PCB Piezotronics of North Carolina, Inc. $93,436 $0 $93,436
2008 Pharmaceutical Research Associates, Inc. $0 $0 $0
2008 Quintiles Transnational Corp. $299,000 $100,000 $399,000
2008 R.H. Donnelley, Inc. (d/b/a Dex One Corp) $450,000 $150,000 $600,000
2008 Ralph Lauren Corporation I $140,000 $46,000 $186,000
2008 RF Micro Devices, Inc. $0 $0 $0
2008 RF MICRO DEVICES, INC. II $0 $0 $0
2008 Stiefel Research Institute, Inc. $251,550 $83,850 $335,400
2008 Stone & Webster Services, LLC $208,500 $69,500 $278,000
2008 Sysco Food Services of Raleigh, LLC $363,156 $121,052 $484,208
2008 Tessera NA Inc $23,832 $7,944 $31,776
2008 TransTech Pharma, Inc. $41,796 $13,932 $55,728
2008 Turbomeca Manufacturing, Inc. $77,589 $25,863 $103,452
2008 TWC Administration LLC (I) $460,000 $153,333 $613,333
2008 Unilin Flooring NC, LLC $174,720 $58,240 $232,960
2008 Total $14,736,041 $5,118,322 $19,854,363
2009 AAR Manufacturing, Inc. $293,455 $0 $293,455
2009 AFI US LLC (f/k/a Ally US LLC and GMAC) $338,250 $112,750 $451,000
2009 Albaad USA, Inc. $109,673 $0 $109,673
2009 Altec Industries, Inc. $148,192 $0 $148,192
2009 American Institute of Certified Accountants, Inc. $604,000 $201,000 $805,000
2009 Arneg LLC $0 $0 $0
2009 ASCO Power Technologies, L.P. $13,061 $2,305 $15,366
2009 Bayer CropScience LP $0 $0 $0
2009 Becton Dickinson and Company $239,169 $65,770 $304,939
2009 Carolina Classifieds.Com LLC $0 $0 $0

Calendar Year 2013 Legislative Report 45
Term Year
Company Name Amount to Company
Amount to Utility Fund
Total Disbursement
2009 Cellco Partnership d/b/a Verizon Wireless $800,000 $266,666 $1,066,666
2009 Citicorp Credit Services, Inc. $0 $0 $0
2009 Credit Suisse Securities (USA) LLC (I) $867,209 $289,070 $1,156,279
2009 Credit Suisse Securities (USA) LLC (II) $790,074 $263,358 $1,053,432
2009 Cree, Inc. I $586,170 $195,390 $781,560
2009 DRS Technical Services, Inc. $0 $0 $0
2009 Fidelity Global Brokerage Group, Inc. $2,575,851 $858,617 $3,434,468
2009 GE-Hitachi Nuclear Energy Americas LLC $0 $0 $0
2009 General Electric Company $650,000 $216,666 $866,666
2009 GETRAG Corporation $0 $0 $0
2009 Goodrich Corporation $272,426 $90,809 $363,235
2009 HCL America Inc. $0 $0 $0
2009 Headway Corporate Resources, Inc. $0 $0 $0
2009 Honda Aero, Inc. $78,578 $13,867 $92,445
2009 Honda Aircraft Company, LLC $355,000 $118,000 $473,000
2009 Hospira, Inc. $141,426 $47,142 $188,568
2009 IBM Lender Business Process Services, Inc. $0 $0 $0
2009 INC Research, Inc. $0 $0 $0
2009 LS Tractor USA, LLC $14,511 $2,561 $17,072
2009 Mack Trucks, Inc. $0 $0 $0
2009 Maersk Inc. $186,539 $62,180 $248,719
2009 Merck Sharp & Dohme Corp. $381,000 $126,999 $507,999
2009 MOM Brands Company (f/k/a Malt-O-Meal) $42,000 $14,000 $56,000
2009 NetApp, Inc. I $1,113,750 $371,250 $1,485,000
2009 NetApp, Inc. II $0 $0 $0
2009 Newell Rubbermaid Inc. $0 $0 $0
2009 Novartis Vaccines and Diagnostics, Inc. I $362,000 $121,000 $483,000
2009 Novo Nordisk Pharmaceutical Industries, Inc. I $0 $0 $0

Calendar Year 2013 Legislative Report 46
Term Year
Company Name Amount to Company
Amount to Utility Fund
Total Disbursement
2009 Pactiv LLC (fka Prairie Packaging, Inc.) $144,000 $47,999 $191,999
2009 PCB Piezotronics of North Carolina, Inc. $0 $0 $0
2009 Pharmaceutical Research Associates, Inc. $0 $0 $0
2009 Quintiles Transnational Corp. $671,000 $224,000 $895,000
2009 R.H. Donnelley, Inc. (d/b/a Dex One Corp) $450,000 $150,000 $600,000
2009 Ralph Lauren Corporation I $154,000 $51,000 $205,000
2009 Siemens Energy, Inc. I $0 $0 $0
2009 Siemens Medical Solutions USA, Inc. $0 $0 $0
2009 Stiefel Research Institute, Inc. $312,254 $104,085 $416,339
2009 Stone & Webster Services, LLC $511,906 $170,636 $682,542
2009 Sutter Street Manufacturing, Inc. $0 $0 $0
2009 Sysco Food Services of Raleigh, LLC $0 $0 $0
2009 Target Corporation $397,000 $0 $397,000
2009 Tessera NA Inc $0 $0 $0
2009 Toshiba America Nuclear Energy Corporation $0 $0 $0
2009 TransTech Pharma, Inc. $0 $0 $0
2009 Turbomeca Manufacturing, Inc. $0 $0 $0
2009 TWC Administration LLC (I) $460,000 $153,333 $613,333
2009 TWC Administration LLC (II) $156,392 $52,130 $208,522
2009 Unilin Flooring NC, LLC $0 $0 $0
2009 Total $14,218,886 $4,392,583 $18,611,469
2010 AAR Manufacturing, Inc. $0 $0 $0
2010 AFI US LLC (f/k/a Ally US LLC and GMAC) $519,000 $173,000 $692,000
2010 Albaad USA, Inc. $143,223 $0 $143,223
2010 Altec Industries, Inc. $196,152 $0 $196,152
2010 American Institute of Certified Accountants, Inc. $604,000 $201,000 $805,000
2010 Arneg LLC $0 $0 $0
2010 ASCO Power Technologies, L.P. $50,784 $8,962 $59,746

Calendar Year 2013 Legislative Report 47
Term Year
Company Name Amount to Company
Amount to Utility Fund
Total Disbursement
2010 Bayer CropScience LP $0 $0 $0
2010 Becton Dickinson and Company $316,439 $54,485 $370,924
2010 Brunswick Corporation (Hatteras Yachts Division) $10,193 $1,799 $11,992
2010 Celgard, LLC I $55,676 $18,559 $74,235
2010 Cellco Partnership d/b/a Verizon Wireless $800,000 $266,666 $1,066,666
2010 Credit Suisse Securities (USA) LLC (I) $900,000 $300,000 $1,200,000
2010 Credit Suisse Securities (USA) LLC (II) $1,255,166 $418,388 $1,673,554
2010 Cree, Inc. I $586,170 $195,390 $781,560
2010 DB Global Technology, Inc. I $173,444 $57,815 $231,259
2010 Fidelity Global Brokerage Group, Inc. $2,162,599 $720,866 $2,883,465
2010 GE-Hitachi Nuclear Energy Americas LLC $0 $0 $0
2010 General Electric Company $650,000 $216,666 $866,666
2010 GETRAG Corporation $0 $0 $0
2010 HCL America Inc. $0 $0 $0
2010 Hewitt Associates LLC (d/b/a Aon Hewitt) $110,490 $36,830 $147,320
2010 Honda Aero, Inc. $0 $0 $0
2010 Honda Aircraft Company, LLC $459,000 $153,000 $612,000
2010 Hospira, Inc. $162,000 $54,000 $216,000
2010 Loparex LLC $107,026 $31,477 $138,503
2010 Mack Trucks, Inc. $0 $0 $0
2010 Maersk Inc. $0 $0 $0
2010 Magna Composites LLC $34,819 $6,145 $40,964
2010 Merck Sharp & Dohme Corp. $381,000 $126,999 $507,999
2010 MOM Brands Company (f/k/a Malt-O-Meal) $85,500 $28,500 $114,000
2010 NetApp, Inc. I $1,113,750 $371,250 $1,485,000
2010 NetApp, Inc. II $0 $0 $0
2010 Newell Rubbermaid Inc. $0 $0 $0
2010 Novartis Vaccines and Diagnostics, Inc. I $419,000 $140,000 $559,000

Calendar Year 2013 Legislative Report 48
Term Year
Company Name Amount to Company
Amount to Utility Fund
Total Disbursement
2010 Pactiv LLC (fka Prairie Packaging, Inc.) $176,000 $58,666 $234,666
2010 PCB Piezotronics of North Carolina, Inc. $0 $0 $0
2010 Pharmaceutical Research Associates, Inc. $0 $0 $0
2010 Plastek Industries, Inc. $11,582 $0 $11,582
2010 Premier Healthcare Solutions, Inc. $0 $0 $0
2010 Quintiles Transnational Corp. $1,152,000 $384,000 $1,536,000
2010 R.H. Donnelley, Inc. (d/b/a Dex One Corp) $418,500 $139,500 $558,000
2010 Ralph Lauren Corporation I $160,000 $54,000 $214,000
2010 Seterus, Inc.n (fka IBM LBPS) $0 $0 $0
2010 Siemens Energy, Inc. I $0 $0 $0
2010 Siemens Medical Solutions USA, Inc. $0 $0 $0
2010 Spirit AeroSystems North Carolina, Inc. $199,887 $0 $199,887
2010 Stiefel Research Institute, Inc. $340,589 $113,530 $454,119
2010 Stone & Webster Services, LLC $0 $0 $0
2010 Sutter Street Manufacturing, Inc. $0 $0 $0
2010 Sypris Technologies, Inc. $0 $0 $0
2010 Target Corporation $413,000 $0 $413,000
2010 Toshiba America Nuclear Energy Corporation $0 $0 $0
2010 TransTech Pharma, Inc. $0 $0 $0
2010 Turbomeca Manufacturing, Inc. $0 $0 $0
2010 TWC Administration LLC (I) $460,000 $153,333 $613,333
2010 TWC Administration LLC (II) $333,000 $111,000 $444,000
2010 Zenta Mortgage Services, LLC $297,000 $99,000 $396,000
2010 Total $15,256,989 $4,694,826 $19,951,815
2011 AAR Manufacturing, Inc. $447,000 $0 $447,000
2011 AFI US LLC (f/k/a Ally US LLC and GMAC) $519,000 $173,000 $692,000
2011 Albaad USA, Inc. $150,871 $0 $150,871
2011 Altec Industries, Inc. $0 $0 $0

Calendar Year 2013 Legislative Report 49
Term Year
Company Name Amount to Company
Amount to Utility Fund
Total Disbursement
2011 American Institute of Certified Accountants, Inc. $604,000 $201,000 $805,000
2011 Arneg LLC $0 $0 $0
2011 ASCO Power Technologies, L.P. $0 $0 $0
2011 BAE Systems Shared Services Inc. $70,295 $23,431 $93,726
2011 Bayer CropScience LP $0 $0 $0
2011 Becton Dickinson and Company $0 $0 $0
2011 Brunswick Corporation (Hatteras Yachts Division) $148,750 $26,250 $175,000
2011 Capgemini Financial Services USA Inc. $74,444 $24,814 $99,258
2011 Caterpillar Inc. (Butterfly) $127,500 $22,500 $150,000
2011 Caterpillar Inc. (Camo) $48,750 $16,250 $65,000
2011 Celgard, LLC I $281,250 $93,750 $375,000
2011 Cellco Partnership d/b/a Verizon Wireless $800,000 $266,666 $1,066,666
2011 Clearwater Paper Corporation $139,000 $0 $139,000
2011 Continental Automotive Systems, Inc. $110,250 $36,750 $147,000
2011 Credit Suisse Securities (USA) LLC (I) $953,095 $317,698 $1,270,793
2011 Credit Suisse Securities (USA) LLC (II) $1,290,000 $430,000 $1,720,000
2011 Cree, Inc. I $586,170 $195,390 $781,560
2011 DB Global Technology, Inc. I $396,234 $132,078 $528,312
2011 Electrolux Home Products, Inc. I $1,768,126 $589,375 $2,357,501
2011 EMC Corporation $364,500 $121,500 $486,000
2011 Fidelity Global Brokerage Group, Inc. $0 $0 $0
2011 General Electric Company $650,000 $216,666 $866,666
2011 HCL America Inc. $0 $0 $0
2011 Hewitt Associates LLC (d/b/a Aon Hewitt) $373,576 $124,525 $498,101
2011 Honda Aero, Inc. $0 $0 $0
2011 Honda Aircraft Company, LLC $513,000 $171,000 $684,000
2011 Hospira, Inc. $162,000 $54,000 $216,000
2011 Husqvarna Professional Products, Inc. $261,750 $87,250 $349,000

Calendar Year 2013 Legislative Report 50
Term Year
Company Name Amount to Company
Amount to Utility Fund
Total Disbursement
2011 HVM L.L.C. $96,371 $32,124 $128,495
2011 Innovative Emergency Management, Inc. $99,552 $33,184 $132,736
2011 Loparex LLC $0 $0 $0
2011 Magna Composites LLC $151,300 $26,700 $178,000
2011 Merck Sharp & Dohme Corp. $381,000 $126,999 $507,999
2011 Mitsubishi Nuclear Energy Systems, Inc. $0 $0 $0
2011 MOM Brands Company (f/k/a Malt-O-Meal) $85,500 $28,500 $114,000
2011 NetApp, Inc. I $1,113,750 $371,250 $1,485,000
2011 NetApp, Inc. II $1,783,000 $594,000 $2,377,000
2011 Novartis Vaccines and Diagnostics, Inc. I $472,000 $157,000 $629,000
2011 Novartis Vaccines and Diagnostics, Inc. II $186,146 $62,049 $248,195
2011 Novo Nordisk Pharmaceutical Industries, Inc. $61,500 $20,500 $82,000
2011 Pactiv LLC (fka Prairie Packaging, Inc.) $176,000 $58,666 $234,666
2011 PCB Piezotronics of North Carolina, Inc. $0 $0 $0
2011 Pharmaceutical Research Associates, Inc. $795,112 $265,037 $1,060,149
2011 Plastek Industries, Inc. $199,788 $0 $199,788
2011 Premier Healthcare Solutions, Inc. $227,250 $75,750 $303,000
2011 Quintiles Transnational Corp. $1,647,000 $549,000 $2,196,000
2011 Ralph Lauren Corporation I $160,000 $54,000 $214,000
2011 Red Hat, Inc. I $148,500 $49,500 $198,000
2011 Semprius, Inc. $0 $0 $0
2011 Siemens Energy, Inc. (Smart Grid) $108,000 $36,000 $144,000
2011 Siemens Energy, Inc. I $296,250 $98,750 $395,000
2011 Siemens Energy, Inc. II $270,750 $90,250 $361,000
2011 Spirit AeroSystems North Carolina, Inc. $554,000 $0 $554,000
2011 SPX Corporation $63,000 $21,000 $84,000
2011 Stone & Webster Services, LLC $0 $0 $0
2011 Sypris Technologies, Inc. $0 $0 $0

Calendar Year 2013 Legislative Report 51
Term Year
Company Name Amount to Company
Amount to Utility Fund
Total Disbursement
2011 Target Corporation $427,000 $0 $427,000
2011 TIMCO Aerosystems, LLC $88,400 $15,600 $104,000
2011 TransTech Pharma, Inc. $0 $0 $0
2011 Turbomeca Manufacturing, Inc. $0 $0 $0
2011 TWC Administration LLC (I) $460,000 $153,333 $613,333
2011 TWC Administration LLC (II) $380,000 $127,000 $507,000
2011 Total $21,270,730 $6,370,085 $27,640,815
2012 AAR Manufacturing, Inc. $366,361 $0 $366,361
2012 ABB Inc. $223,500 $74,500 $298,000
2012 AFI US LLC (f/k/a Ally US LLC and GMAC) $519,000 $173,000 $692,000
2012 Albaad USA, Inc. $160,889 $0 $160,889
2012 Altec Industries, Inc. $220,000 $0 $220,000
2012 American Institute of Certified Accountants, Inc. $604,000 $201,000 $805,000
2012 AptarGroup, Inc. $45,900 $8,100 $54,000
2012 ASCO Power Technologies, L.P. $0 $0 $0
2012 Avaya, Inc. $0 $0 $0
2012 BAE Systems Shared Services Inc. $215,250 $71,750 $287,000
2012 Bayer CropScience LP $235,048 $78,349 $313,397
2012 Brunswick Corporation (Hatteras Yachts Division) $205,700 $36,300 $242,000
2012 Capgemini Financial Services USA Inc. $0 $0 $0
2012 Caterpillar Inc. (Butterfly) $221,000 $39,000 $260,000
2012 Caterpillar Inc. (Camo) $258,000 $86,000 $344,000
2012 Celgard, LLC I $375,750 $125,250 $501,000
2012 Celgard, LLC II $0 $0 $0
2012 Cellco Partnership d/b/a Verizon Wireless $800,000 $266,666 $1,066,666
2012 Chiquita Brands International, Inc. $543,368 $181,122 $724,490
2012 Clearwater Paper Corporation $222,000 $0 $222,000
2012 Continental Automotive Systems, Inc. $192,750 $64,250 $257,000
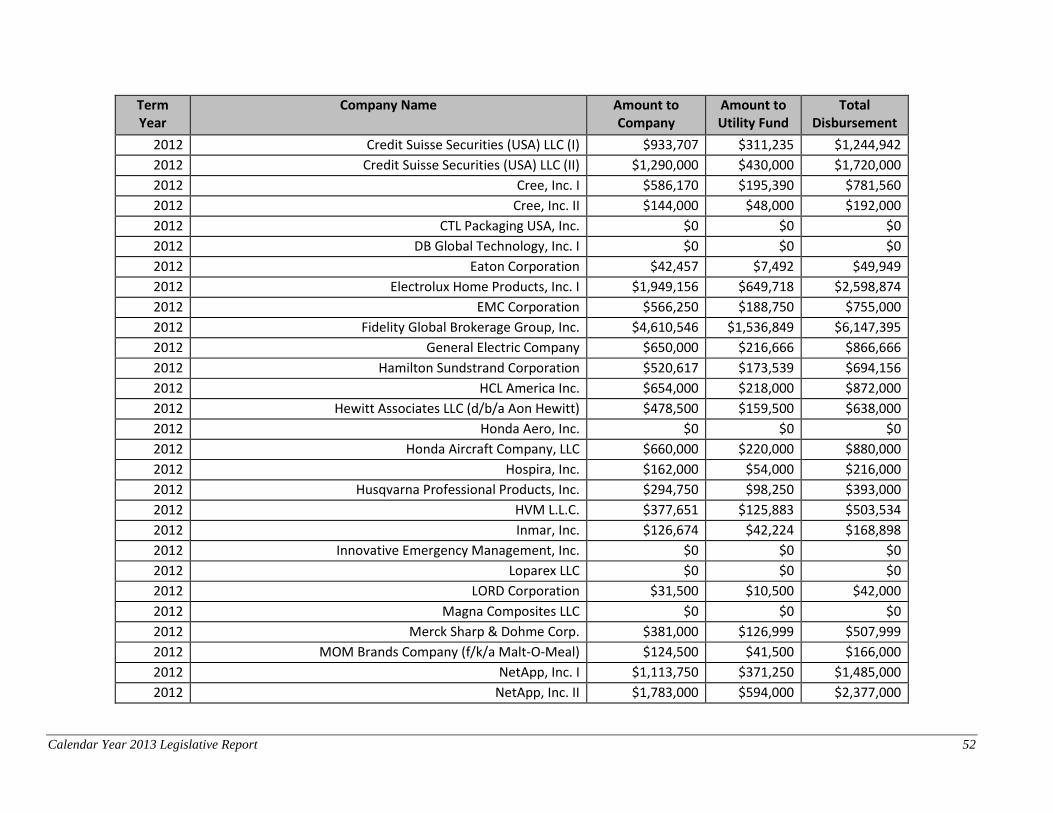
Calendar Year 2013 Legislative Report 52
Term Year
Company Name Amount to Company
Amount to Utility Fund
Total Disbursement
2012 Credit Suisse Securities (USA) LLC (I) $933,707 $311,235 $1,244,942
2012 Credit Suisse Securities (USA) LLC (II) $1,290,000 $430,000 $1,720,000
2012 Cree, Inc. I $586,170 $195,390 $781,560
2012 Cree, Inc. II $144,000 $48,000 $192,000
2012 CTL Packaging USA, Inc. $0 $0 $0
2012 DB Global Technology, Inc. I $0 $0 $0
2012 Eaton Corporation $42,457 $7,492 $49,949
2012 Electrolux Home Products, Inc. I $1,949,156 $649,718 $2,598,874
2012 EMC Corporation $566,250 $188,750 $755,000
2012 Fidelity Global Brokerage Group, Inc. $4,610,546 $1,536,849 $6,147,395
2012 General Electric Company $650,000 $216,666 $866,666
2012 Hamilton Sundstrand Corporation $520,617 $173,539 $694,156
2012 HCL America Inc. $654,000 $218,000 $872,000
2012 Hewitt Associates LLC (d/b/a Aon Hewitt) $478,500 $159,500 $638,000
2012 Honda Aero, Inc. $0 $0 $0
2012 Honda Aircraft Company, LLC $660,000 $220,000 $880,000
2012 Hospira, Inc. $162,000 $54,000 $216,000
2012 Husqvarna Professional Products, Inc. $294,750 $98,250 $393,000
2012 HVM L.L.C. $377,651 $125,883 $503,534
2012 Inmar, Inc. $126,674 $42,224 $168,898
2012 Innovative Emergency Management, Inc. $0 $0 $0
2012 Loparex LLC $0 $0 $0
2012 LORD Corporation $31,500 $10,500 $42,000
2012 Magna Composites LLC $0 $0 $0
2012 Merck Sharp & Dohme Corp. $381,000 $126,999 $507,999
2012 MOM Brands Company (f/k/a Malt-O-Meal) $124,500 $41,500 $166,000
2012 NetApp, Inc. I $1,113,750 $371,250 $1,485,000
2012 NetApp, Inc. II $1,783,000 $594,000 $2,377,000

Calendar Year 2013 Legislative Report 53
Term Year
Company Name Amount to Company
Amount to Utility Fund
Total Disbursement
2012 Novartis Vaccines and Diagnostics, Inc. I $571,000 $190,000 $761,000
2012 Novartis Vaccines and Diagnostics, Inc. II $310,500 $103,500 $414,000
2012 Novo Nordisk Pharmaceutical Industries, Inc. $72,750 $24,250 $97,000
2012 Pactiv LLC (fka Prairie Packaging, Inc.) $176,000 $58,666 $234,666
2012 Pharmaceutical Research Associates, Inc. $980,000 $327,000 $1,307,000
2012 Pittsburgh Glass Works LLC $0 $0 $0
2012 Plastek Industries, Inc. $225,148 $0 $225,148
2012 Premier Healthcare Solutions, Inc. $345,000 $115,000 $460,000
2012 Quintiles Transnational Corp. $2,206,000 $735,000 $2,941,000
2012 Ralph Lauren Corporation I $160,000 $54,000 $214,000
2012 Red Hat, Inc. I $320,250 $106,750 $427,000
2012 Reed Elsevier Inc. $0 $0 $0
2012 Schletter, Inc. $0 $0 $0
2012 Sequenom Center for Molecular Medicine, LLC $0 $0 $0
2012 Siemens Energy, Inc. I $337,500 $112,500 $450,000
2012 Siemens Energy, Inc. II $814,500 $271,500 $1,086,000
2012 Spirit AeroSystems North Carolina, Inc. $691,183 $0 $691,183
2012 SPX Corporation $135,000 $45,000 $180,000
2012 Stone & Webster Services, LLC $0 $0 $0
2012 Superior Essex Energy LLC $0 $0 $0
2012 Target Corporation $435,856 $0 $435,856
2012 TIMCO Aerosystems, LLC $141,100 $24,900 $166,000
2012 Turbomeca Manufacturing, Inc. $0 $0 $0
2012 Total $30,810,531 $9,393,098 $40,203,629
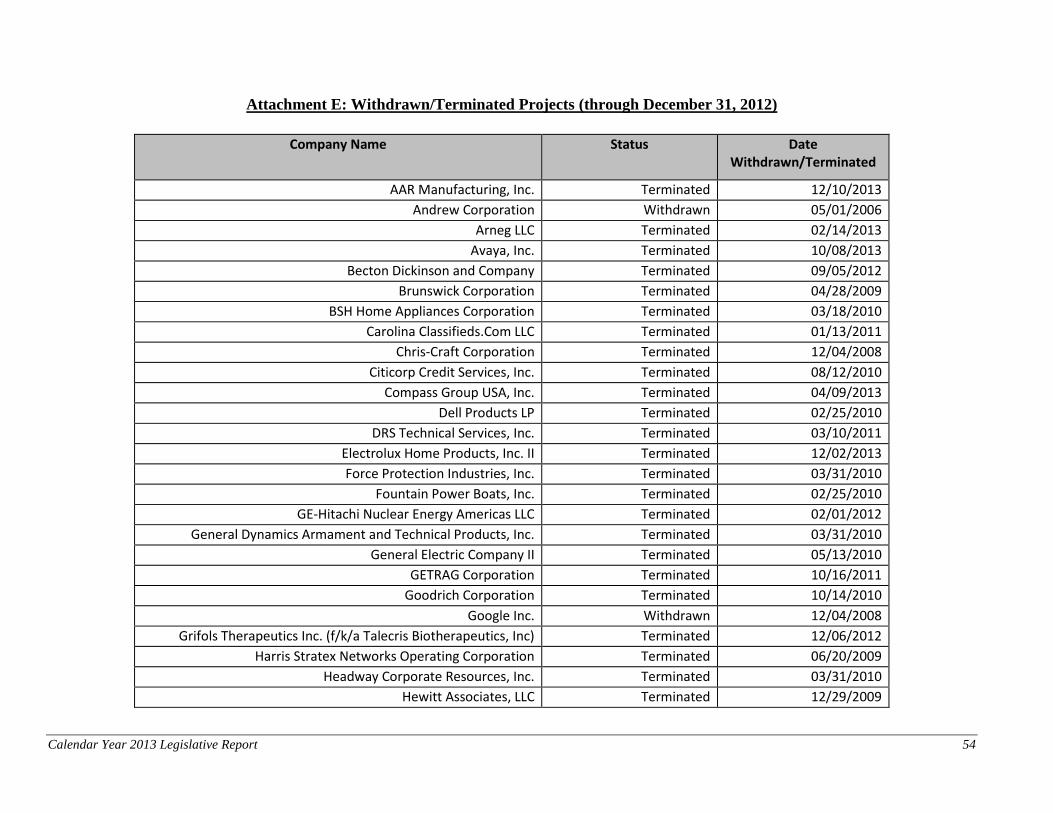
Calendar Year 2013 Legislative Report 54
Attachment E: Withdrawn/Terminated Projects (through December 31, 2012)
Company Name Status Date Withdrawn/Terminated
AAR Manufacturing, Inc. Terminated 12/10/2013
Andrew Corporation Withdrawn 05/01/2006
Arneg LLC Terminated 02/14/2013
Avaya, Inc. Terminated 10/08/2013
Becton Dickinson and Company Terminated 09/05/2012
Brunswick Corporation Terminated 04/28/2009
BSH Home Appliances Corporation Terminated 03/18/2010
Carolina Classifieds.Com LLC Terminated 01/13/2011
Chris-Craft Corporation Terminated 12/04/2008
Citicorp Credit Services, Inc. Terminated 08/12/2010
Compass Group USA, Inc. Terminated 04/09/2013
Dell Products LP Terminated 02/25/2010
DRS Technical Services, Inc. Terminated 03/10/2011
Electrolux Home Products, Inc. II Terminated 12/02/2013
Force Protection Industries, Inc. Terminated 03/31/2010
Fountain Power Boats, Inc. Terminated 02/25/2010
GE-Hitachi Nuclear Energy Americas LLC Terminated 02/01/2012
General Dynamics Armament and Technical Products, Inc. Terminated 03/31/2010
General Electric Company II Terminated 05/13/2010
GETRAG Corporation Terminated 10/16/2011
Goodrich Corporation Terminated 10/14/2010
Google Inc. Withdrawn 12/04/2008
Grifols Therapeutics Inc. (f/k/a Talecris Biotherapeutics, Inc) Terminated 12/06/2012
Harris Stratex Networks Operating Corporation Terminated 06/20/2009
Headway Corporate Resources, Inc. Terminated 03/31/2010
Hewitt Associates, LLC Terminated 12/29/2009

Calendar Year 2013 Legislative Report 55
Company Name Status Date Withdrawn/Terminated
IBM Lender Business Process Services, Inc. Terminated 04/08/2010
INC Research, Inc. Terminated 03/10/2011
Indian Motorcycle Company Terminated 10/14/2010
ITG Automotive Safety Textiles, LLC Terminated 02/25/2010
Lenovo (United States) Inc. Terminated 11/15/2007
Lotus Engineering Inc. Terminated 06/14/2010
LS Tractor USA, LLC Terminated 03/23/2011
Mack Trucks, Inc. Terminated 01/12/2012
Maersk Inc. Terminated 01/12/2012
Maverick Boat Company, Inc. Terminated 11/10/2010
MeadWestvaco Corporation Terminated 05/13/2010
Merchants Distributors, Inc Terminated 02/28/2012
Newell Rubbermaid Inc. Terminated 01/27/2012
Novo Nordisk Pharmaceutical Industries, Inc. I Terminated 08/12/2010
PCB Piezotronics of North Carolina, Inc. Terminated 09/05/2012
PGT Industries, Inc. Terminated 05/13/2010
PRC Industries, Inc. Terminated 05/13/2010
Qimonda North America Corp. Terminated 03/13/2008
R.H. Donnelley, Inc. (d/b/a Dex One Corp) Terminated 02/14/2013
Reliance Industries USA, Inc. Withdrawn 09/01/2008
RF Micro Devices, Inc. Terminated 12/09/2010
RF MICRO DEVICES, INC. II Terminated 03/31/2010
Seterus, Inc.n (fka IBM LBPS) Terminated 03/12/2013
Siemens Medical Solutions USA, Inc. Terminated 03/26/2013
Skybus Airlines, Inc. Terminated 04/10/2008
SmithKline Beecham Corporation D/B/A GlaxoSmithKline Terminated 01/23/2008
Smiths Aerospace Components, Inc. Withdrawn 01/01/2007
Stiefel Research Institute, Inc. Terminated 02/14/2013

Calendar Year 2013 Legislative Report 56
Company Name Status Date Withdrawn/Terminated
Superior Essex Communications, LP Withdrawn 08/01/2005
Sutter Street Manufacturing, Inc. Terminated 09/20/2012
Sysco Food Services of Raleigh, LLC Terminated 03/10/2011
Tessera NA Inc Terminated 03/10/2011
Toshiba America Nuclear Energy Corporation Terminated 03/23/2012
TransTech Pharma, Inc. Terminated 12/10/2013
Turbomeca Manufacturing, Inc. Terminated 10/08/2013
Unilin Flooring NC, LLC Terminated 06/09/2011
Volvo Construction Equipment, NA Terminated 02/25/2010
ZF Lemforder Corporation Terminated 06/10/2010