Embed Size (px)
Citation preview
2013 Evolution Team:
Ned DochtermannErin GillamTim Greives
Steve Travers(North Dakota State Univ.)
Kris HolderJen Weghorst (Univ. of Kansas)
Facilitators:Catherine Kirkpatrick (Univ. of Minnesota)
Steven Ralph (Univ. of North Dakota)
Understanding the mechanisms of evolution: genetic drift
Context: sophomore-level evolution course for biological science majors
Previous unit: mutation and natural selection
Goal: understand the evolutionary mechanism of random genetic drift

Learning outcomesStudents will be able to:
1. recognize an example of random genetic drift2. explain how drift differs from natural selection3. use drift to explain why it is incorrect to state that
evolution leads to perfection4. explain how population size influences the relative ability
of drift to affect allele frequencies5. graph data and formulate hypotheses to explain their
observations6. understand that multiple biological scenarios can result
in drift (e.g. bottleneck, founder effect)7. use a simulation program to evaluate the mechanisms of
natural selection, mutation, and drift
Learning outcomes for the tidbitStudents will be able to:
1. recognize an example of random genetic drift2. explain how drift differs from natural selection3. use drift to explain why it is incorrect to state that
evolution leads to perfection4. explain how population size influences the relative ability
of drift to affect allele frequencies5. graph data and formulate hypotheses to explain their
observations6. understand that multiple biological scenarios can result
in drift (e.g. bottleneck, founder effect)7. use a simulation program to evaluate the mechanisms of
natural selection, mutation, and drift
Pre-tidbit assessment
• Pre-tidbit assessment: clicker questions on natural selection (from previous unit)

• Which one of the following is an example of a situation where natural selection could be acting?
• Which of the following is a situation that is
NOT likely to be affected by genetic drift?
Sample clicker questions
Omitted from original presentation

Huntington’s Disease
http://en.wikipedia.org/wiki/File:Neuron_with_mHtt_inclusion.jpg
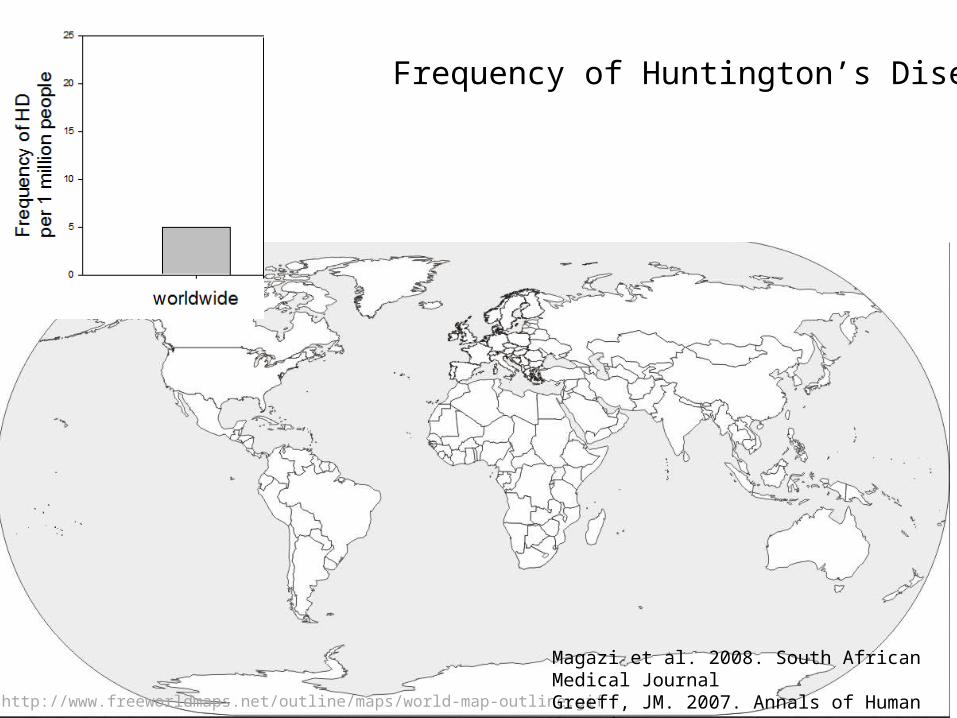
Frequency of Huntington’s Disease
http://www.freeworldmaps.net/outline/maps/world-map-outline.gif
Magazi et al. 2008. South African Medical Journal Greeff, JM. 2007. Annals of Human GeneticsHayden et al. 1980. South African Medical Journal
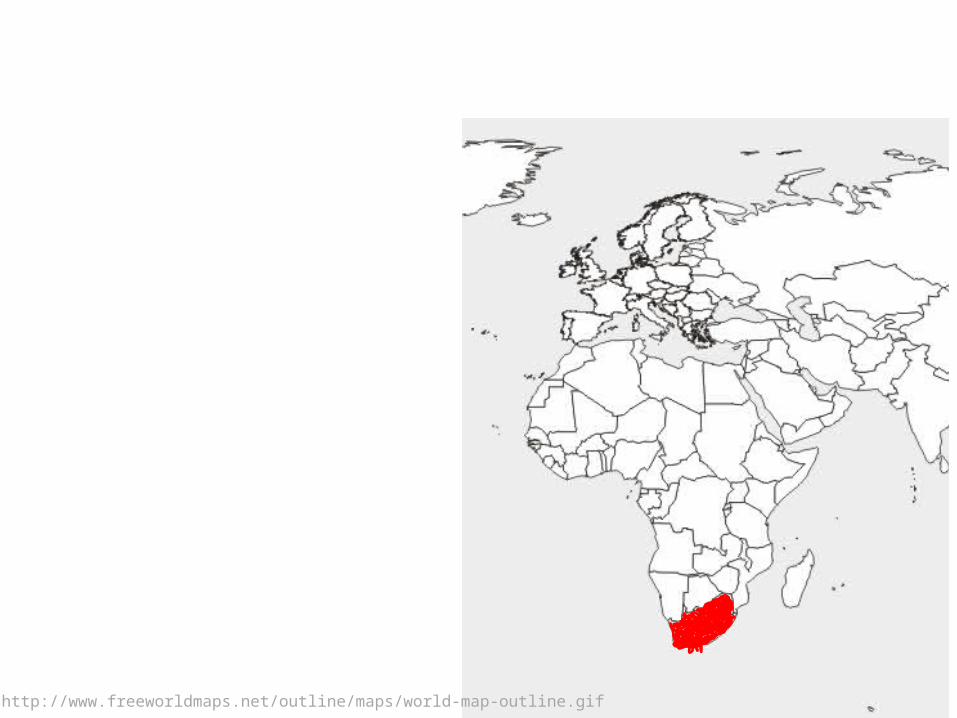
http://www.freeworldmaps.net/outline/maps/world-map-outline.gif

https://commons.wikimedia.org/wiki/File:IJsselmeerTraditionalBoat.JPGhttp://www.freeworldmaps.net/outline/maps/world-map-outline.gif

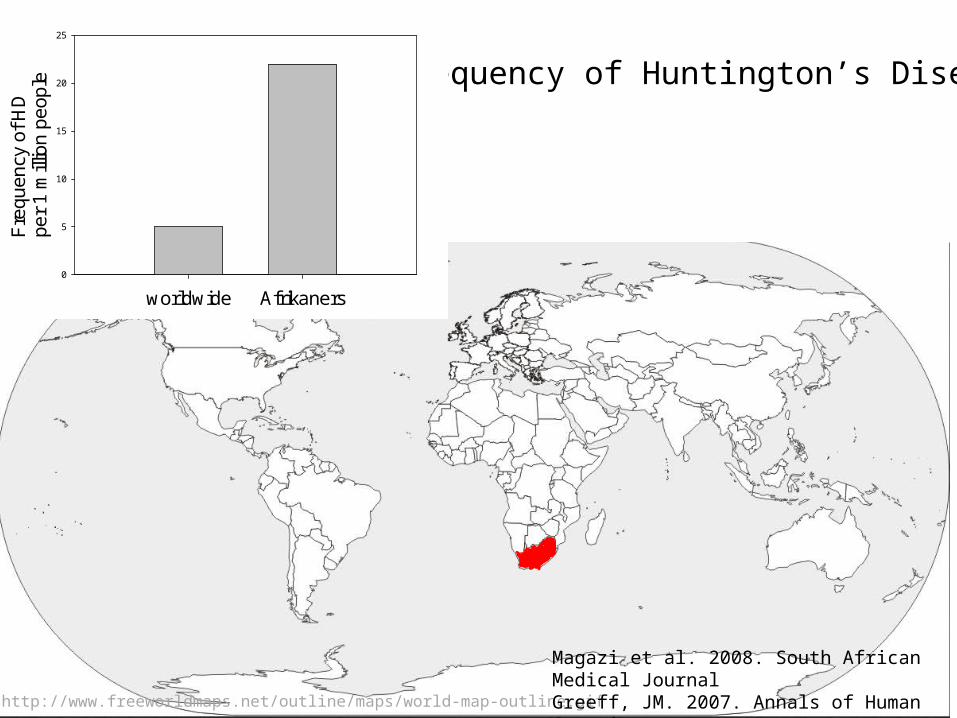
Frequency of Huntington’s Disease
worldwide Afrikaners
Fre
que
ncy
of H
D
per
1 m
illio
n p
eop
le
0
5
10
15
20
25
http://www.freeworldmaps.net/outline/maps/world-map-outline.gif
Magazi et al. 2008. South African Medical Journal Greeff, JM. 2007. Annals of Human GeneticsHayden et al. 1980. South African Medical Journal
Skip
• Huntington’s disease discussion–Form hypotheses–Discuss hypotheses

Experimental study system
• Simple model organisms
• Controlled environments

The elusive POISONOUS M&M
• Haploid• Two color phenotypes of M&M’s• Reproduces asexually by fission
http://www.mms.com/#character

M&M fission
http://www.mms.com/#character

M&M fission
http://www.mms.com/#character

• Please read through the activity instruction sheet silently.
http://www.mms.com/#character
• Questions?
http://www.mms.com/#character

Please proceed through steps 1-4
http://www.mms.com/#character

Please complete activity
http://www.mms.com/#character

http://www.mms.com/#character
Frequency of Huntington’s Disease
worldwide Afrikaners
Fre
que
ncy
of H
D
per
1 m
illio
n p
eop
le
0
5
10
15
20
25
http://www.freeworldmaps.net/outline/maps/world-map-outline.gif
Magazi et al. 2008. South African Medical Journal Greeff, JM. 2007. Annals of Human GeneticsHayden et al. 1980. South African Medical Journal
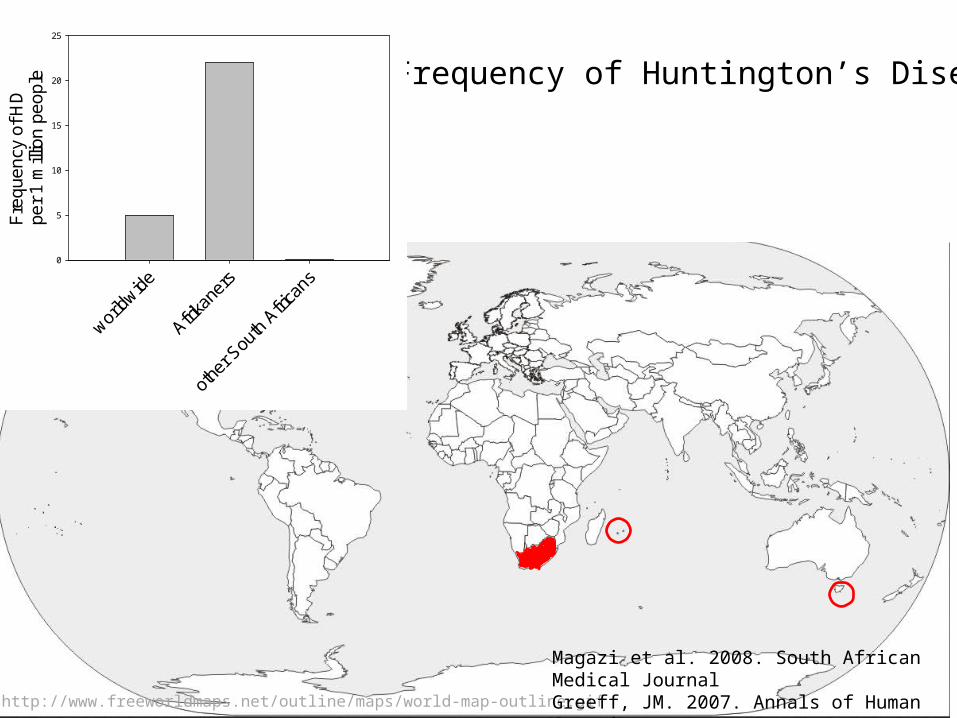
Frequency of Huntington’s Disease
worldw
ide
Afrika
ners
othe
r Sou
th A
frica
ns
Fre
qu
ency
of H
D
per
1 m
illio
n p
eop
le
0
5
10
15
20
25
http://www.freeworldmaps.net/outline/maps/world-map-outline.gif
Magazi et al. 2008. South African Medical Journal Greeff, JM. 2007. Annals of Human GeneticsHayden et al. 1980. South African Medical Journal

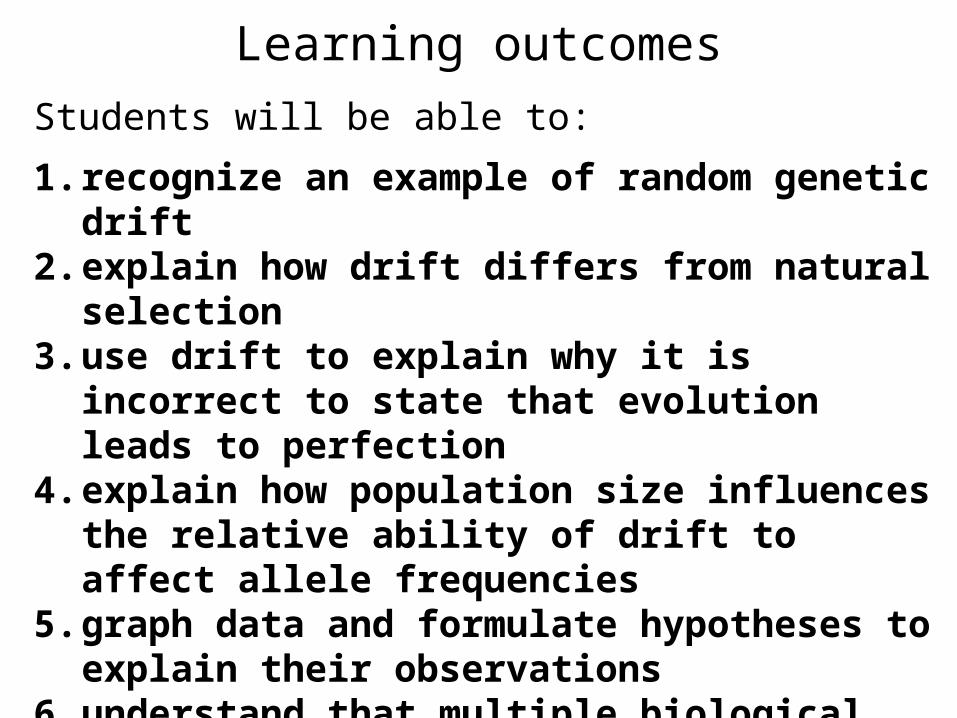
Learning outcomesStudents will be able to:
1. recognize an example of random genetic drift2. explain how drift differs from natural selection3. use drift to explain why it is incorrect to state that
evolution leads to perfection4. explain how population size influences the relative ability
of drift to affect allele frequencies5. graph data and formulate hypotheses to explain their
observations6. understand that multiple biological scenarios can result
in drift (e.g. bottleneck, founder effect)7. use a simulation program to evaluate the mechanisms of
natural selection, mutation, and drift
Learning outcomesStudents will be able to:
1. recognize an example of random genetic drift2. explain how drift differs from natural selection3. use drift to explain why it is incorrect to state that
evolution leads to perfection4. explain how population size influences the relative
ability of drift to affect allele frequencies5. graph data and formulate hypotheses to explain their
observations6. understand that multiple biological scenarios can result
in drift (e.g. bottleneck, founder effect)7. use a simulation program to evaluate the mechanisms of
natural selection, mutation, and drift
Post-tidbit

Learning outcomesStudents will be able to:
1. recognize an example of random genetic drift2. explain how drift differs from natural selection3. use drift to explain why it is incorrect to state that
evolution leads to perfection4. explain how population size influences the relative
ability of drift to affect allele frequencies5. graph data and formulate hypotheses to explain their
observations6. understand that multiple biological scenarios can result
in drift (e.g. bottleneck, founder effect)7. use a simulation program to evaluate the mechanisms
of natural selection, mutation, and drift
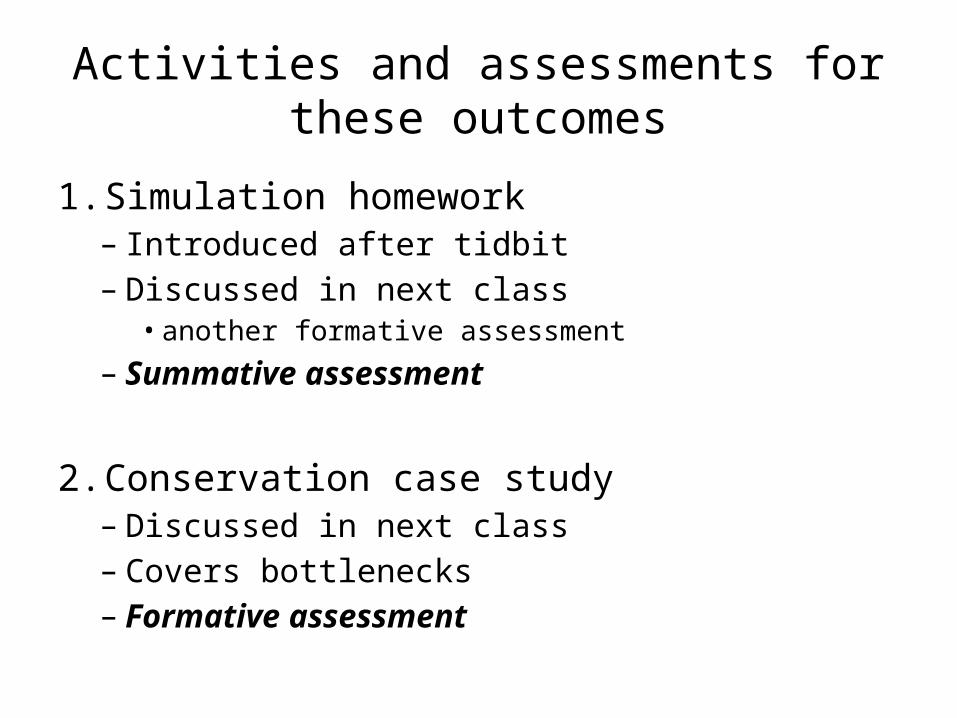
Activities and assessments for these outcomes
1. Simulation homework– Introduced after tidbit– Discussed in next class
• another formative assessment
– Summative assessment
2. Conservation case study– Discussed in next class– Covers bottlenecks– Formative assessment

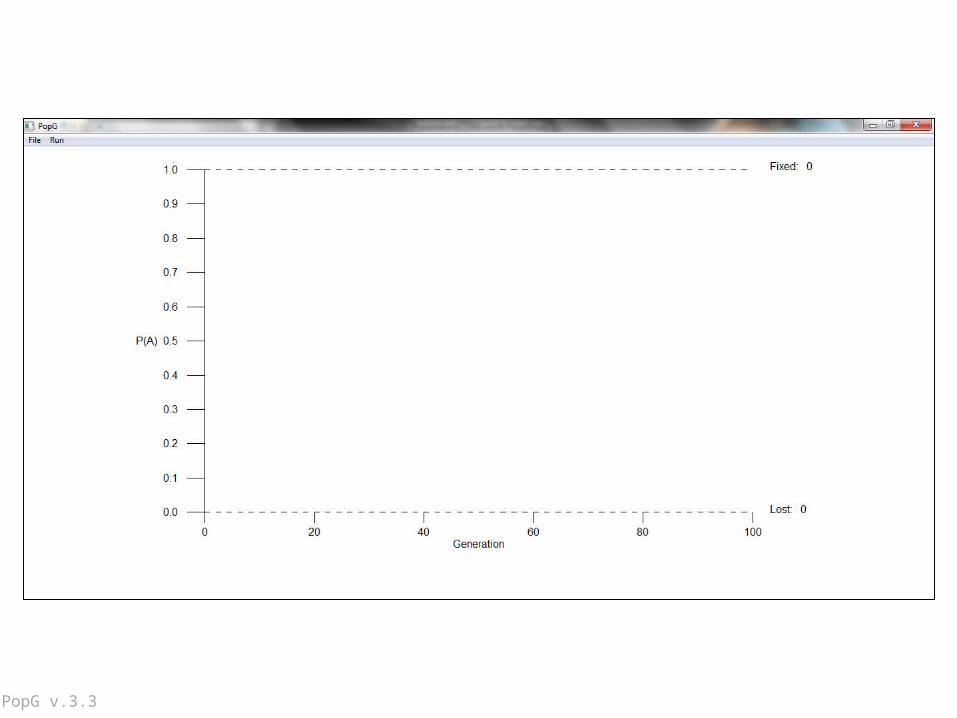
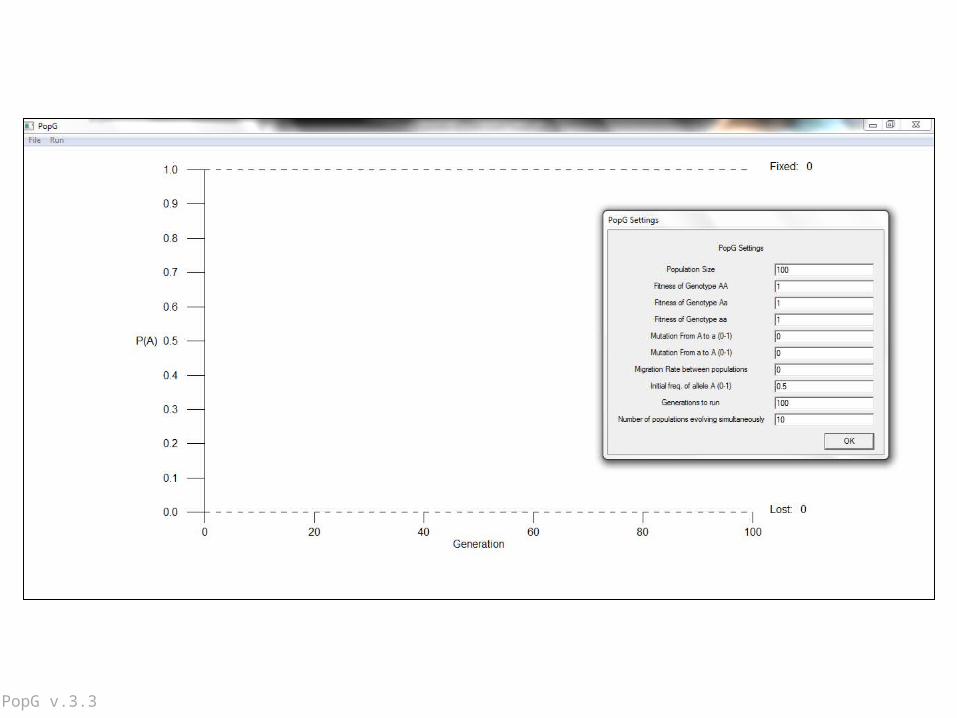
Simulation
• PopG (alternative programs available)
– Allows alteration of numerous parameters • Population size (drift)• Fitness• Migration, mutation
PopG v.3.3
PopG v.3.3

PopG v.3.3

Example homework questions
• How would you predict allele frequencies might fluctuate as population sizes are decreased? And when increased?
• Introduce selection into your simulations. What should happen if the AA genotype has a fitness of 0.9, and Aa and aa fitnesses of 1? Set these fitnesses and set population sizes to 25. Were your predictions supported?

Activities and assessments for these outcomes
1. Simulation homework– Introduced after tidbit– Discussed in next class
• another formative assessment
– Summative assessment
2. Conservation case study– Discussed in next class– Covers bottlenecks– Formative assessment
Assessments & Related Activities
1. Simulation homework– Introduced after tidbit– Discussed in next class
• another formative assessment
– Summative assessment
2. Conservation case study– Discussed in next class– Covers bottlenecks– Formative assessment
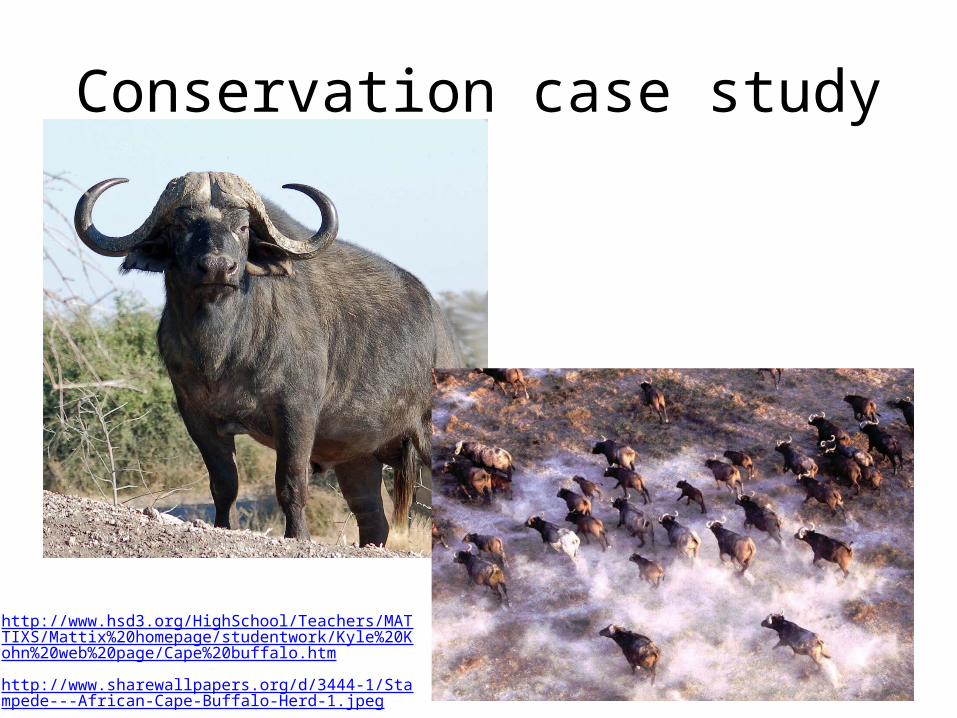
Conservation case study
http://www.hsd3.org/HighSchool/Teachers/MATTIXS/Mattix%20homepage/studentwork/Kyle%20Kohn%20web%20page/Cape%20buffalo.htm
http://www.sharewallpapers.org/d/3444-1/Stampede---African-Cape-Buffalo-Herd-1.jpeg
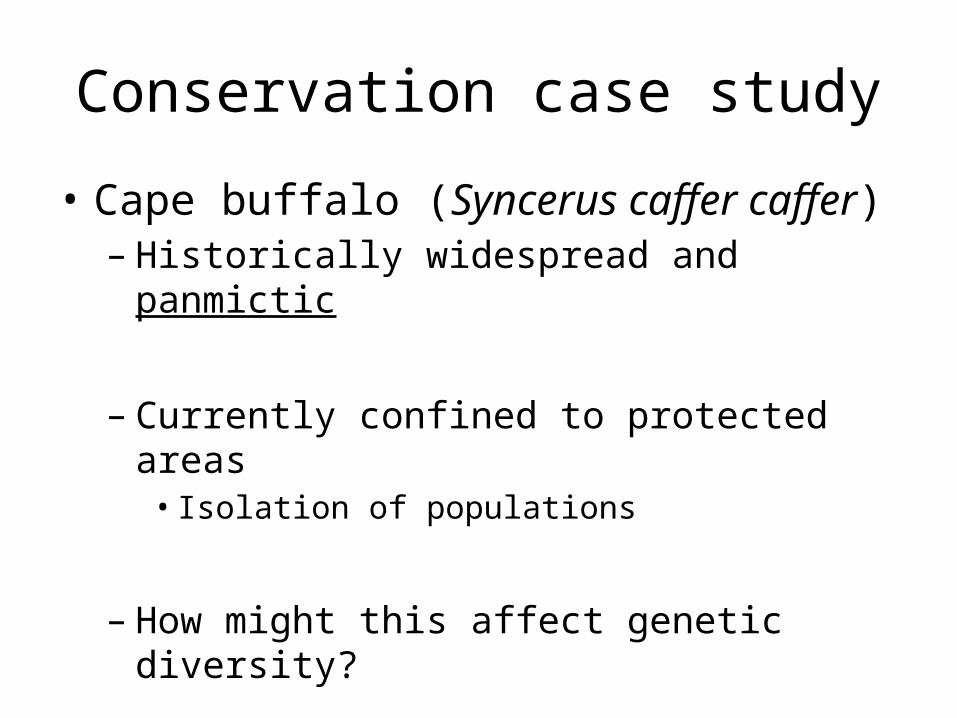
Conservation case study
• Cape buffalo (Syncerus caffer caffer)– Historically widespread and panmictic
– Currently confined to protected areas• Isolation of populations
– How might this affect genetic diversity?
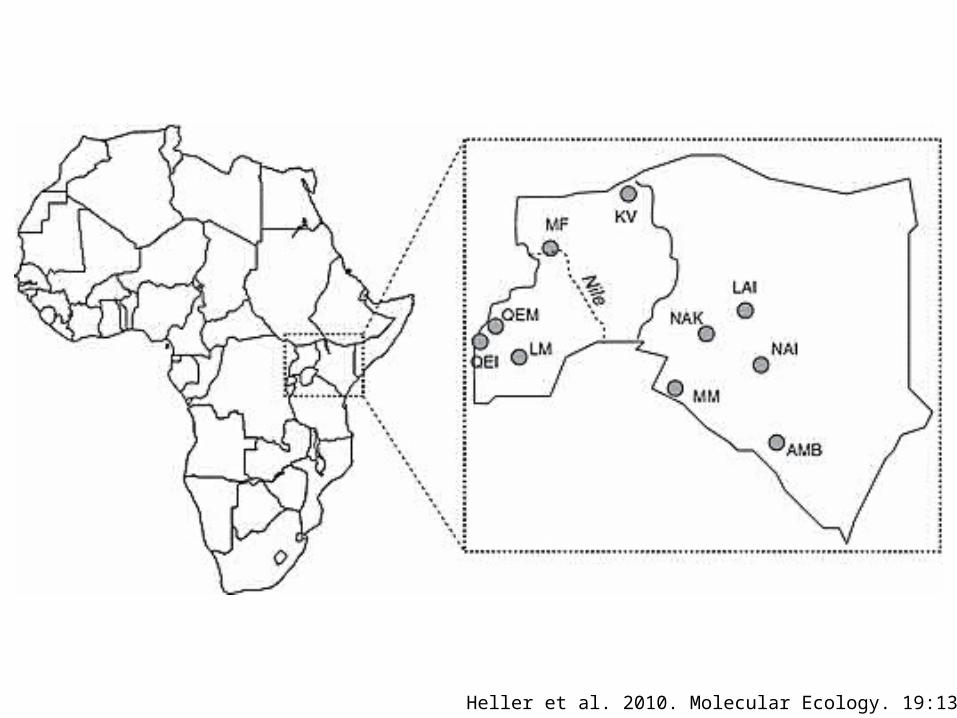
Heller et al. 2010. Molecular Ecology. 19:1324-1334

Discuss in groups Propose hypotheses

Heller et al. 2010. Molecular Ecology

Instructor notesBackground information• Reserves are of different sizes
(area)
• Reserves support different size populations
• Researchers quantified allelic diversity (amongst other things)
• Go back to group discussions. Formulate hypotheses. Draw a figure with your expectations
Possible activities• Group discussions formulating
hypotheses
• Have groups draw hypothetical results
• Have class discuss drawings of multiple groups
• After data is presented, have students discuss what they would expect if selection were at play (e.g. bovine tuberculosis is a big problem for many wild ungulates)


![Welcome [hubilo-o4mlunccwnbtnhr.stackpathdns.com]hubilo-o4mlunccwnbtnhr.stackpathdns.com/zak_presentation/Roy-WeghOrst... · WELCOME PRESENTING TODAY ROY WEGHORST Head of Regulatory](https://img.pdfslide.net/doc/110x75/5e182e208407cc647d667d67/welcome-hubilo-hubilo-welcome-presenting-today-roy-weghorst-head-of-regulatory.jpg)