Embed Size (px)
Citation preview

JANUARY 28, 2014
(PRELIMINARY RESULTS)
2013 FOURTH QUARTER AND FULL YEAR
FIXED INCOME PRESENTATION AND
2014 OUTLOOK
SLIDE 1
FORD CREDIT
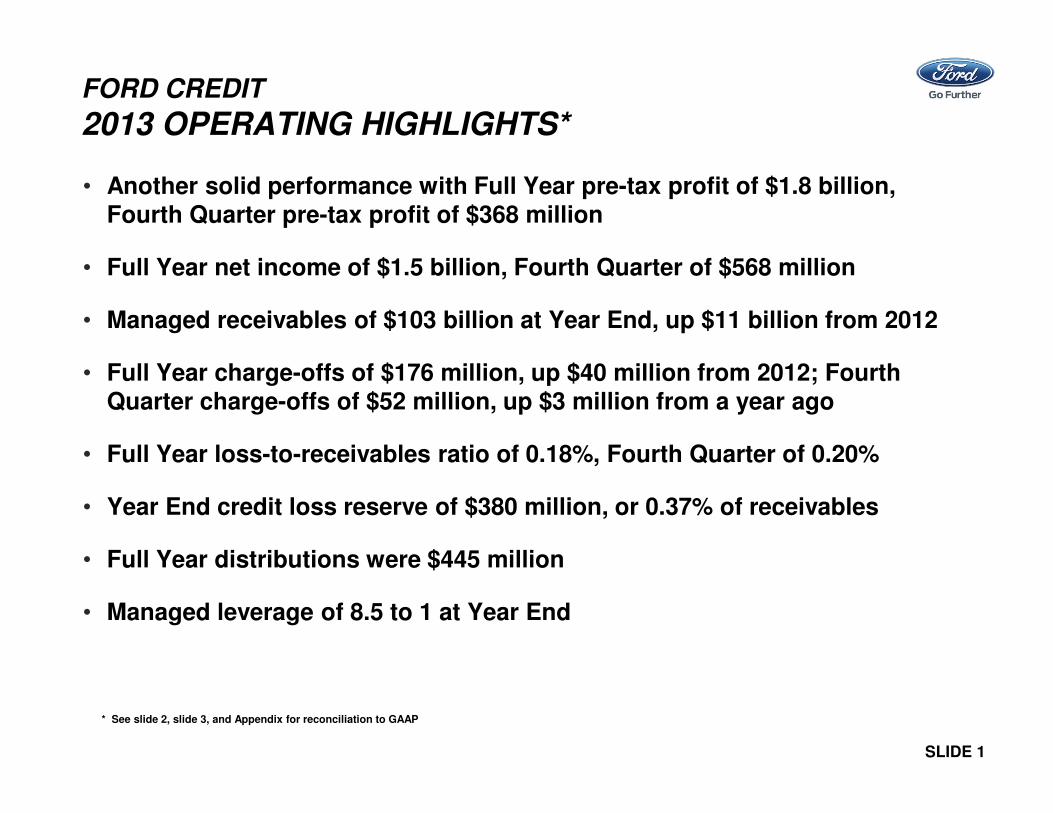
2013 OPERATING HIGHLIGHTS*
• Another solid performance with Full Year pre-tax profit of $1.8 billion, Fourth Quarter pre-tax profit of $368 million
• Full Year net income of $1.5 billion, Fourth Quarter of $568 million
• Managed receivables of $103 billion at Year End, up $11 billion from 2012
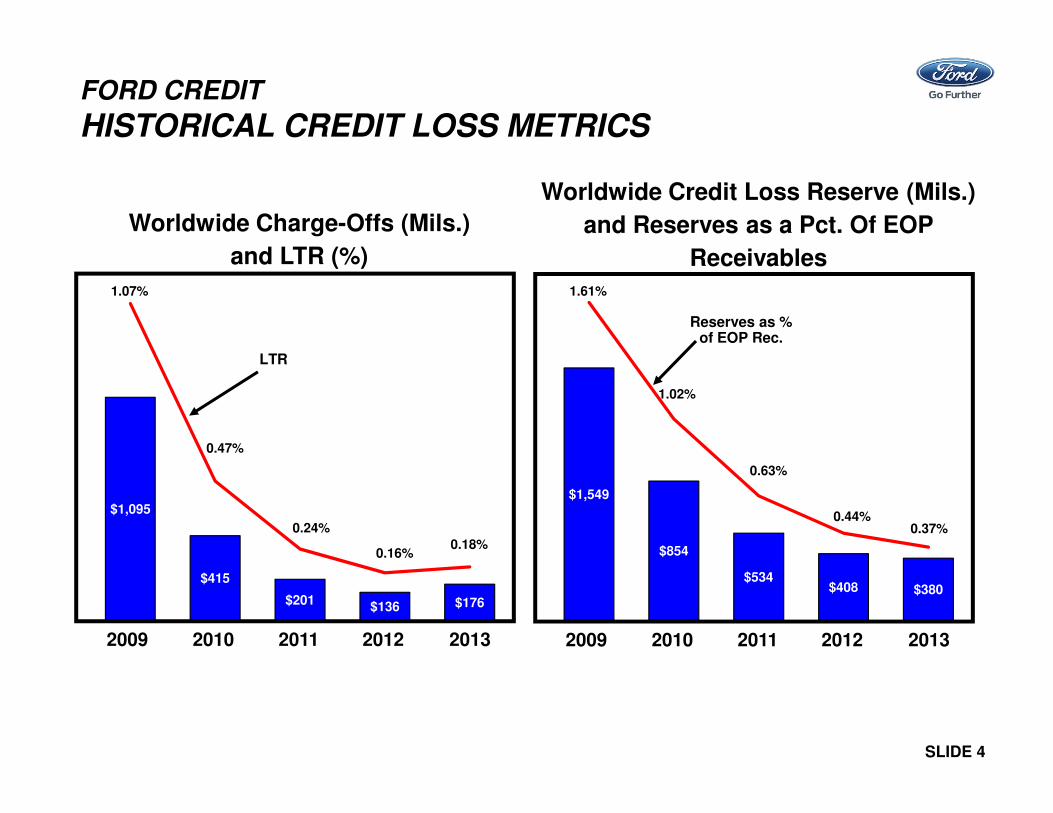
• Full Year charge-offs of $176 million, up $40 million from 2012; Fourth Quarter charge-offs of $52 million, up $3 million from a year ago
• Full Year loss-to-receivables ratio of 0.18%, Fourth Quarter of 0.20%
• Year End credit loss reserve of $380 million, or 0.37% of receivables
• Full Year distributions were $445 million
• Managed leverage of 8.5 to 1 at Year End
* See slide 2, slide 3, and Appendix for reconciliation to GAAP

SLIDE 2
FORD CREDIT
2013 FOURTH QUARTER PRE-TAX RESULTS
COMPARED WITH 2012
Memo:
B / (W) 2013 3Q $(59) $40 $19 $(33) $(67) $(18)
Receivables (Bils.)Net * $89 $100Managed ** 92 103* Net receivables reflect net finance receivables and net investment in operating leases reported on Ford Credit’s balance sheet. Net investment in operating leases
now includes unearned interest supplements and residual support. The prior period was revised to conform to current year presentation.
** Managed receivables equal net receivables, excluding unearned interest supplements and residual support, allowance for credit losses, and other (primarily
accumulated supplemental depreciation). The prior period was revised to conform to current year presentation.
Millions
$414 $368
$100
$(22) $(25)
$(80)
$(19)
LeaseResidual
Volume20134Q
20124Q
CreditLoss
OtherFinancingMargin
$(46)

SLIDE 3
FORD CREDIT
2013 FULL YEAR PRE-TAX RESULTS
COMPARED WITH 2012Millions
$1,697 $1,756
$304
$6
$(139) $(62) $(50)
LeaseResidual
Volume20132012 CreditLoss
OtherFinancingMargin
$59
Memo:
Receivables (Bils.)
Net * $89 $100
Managed ** 92 103* Net receivables reflect net finance receivables and net investment in operating leases reported on Ford Credit’s balance sheet. Net investment in operating leases
now includes unearned interest supplements and residual support. The prior period was revised to conform to current year presentation.
** Managed receivables equal net receivables, excluding unearned interest supplements and residual support, allowance for credit losses, and other (primarily
accumulated supplemental depreciation). The prior period was revised to conform to current year presentation.
SLIDE 4
$1,549
$854
$534$408 $380
1.61%
1.02%
0.63%
0.44%0.37%
$1,095
$415
$201$136 $176
1.07%
0.47%
0.24%
0.16%0.18%
FORD CREDIT
HISTORICAL CREDIT LOSS METRICS
Worldwide Charge-Offs (Mils.)
and LTR (%)
LTR
2012 20132009 2010 2011
Worldwide Credit Loss Reserve (Mils.)
and Reserves as a Pct. Of EOP
Receivables
Reserves as % of EOP Rec.
2012 20132009 2010 2011

SLIDE 5
FORD CREDIT
HISTORICAL U.S. RETAIL AND LEASE CREDIT LOSS
DRIVERS
0.24%
0.15% 0.14% 0.15% 0.15%
Over-60-Day Delinquencies *
Memo: New Bankruptcy Filings (000)
47 42 31 23 17
$635
$280
$144 $100 $127
1.32%
0.68%
0.36%0.23% 0.26%
Charge-Offs (Mils.) and LTR (%)
LTR
2009 2010 2011 2012 2013
2009 2010 2011 2012 2013
Repossessions (000)
94
64
45
3229
3.01%
2.41%
1.86%
1.35%1.18%
2009 2010 2011 2012 2013
Repo. Ratio
Memo: Severity
$8,300 $6,900 $6,500 $6,900 $7,600
Average Placement FICO Score
2009 2010 2011 2012 2013
726 730 738 737 738
* Excluding bankruptcies

SLIDE 6
Memo: Ford and Lincoln U.S. Return Rates
78% 65% 56% 62% 71%
3449
38
12 17
65
71
44
1726
60
39
4
33
71
FORD CREDIT
HISTORICAL U.S. LEASE RESIDUAL PERFORMANCE
Lease Return Volume (000)
Memo: Worldwide Net Investment in Operating Leases (Bils.) *
$13.5 $9.1 $10.1 $13.6 $18.3
2012
24-Month
36-Month
39-Month / Other
159
86
159
20132009 2010 20112012 20132009 2010 2011
114
62
$19,000
$19,875$19,740
$18,170
$18,905
$17,385$17,535
$16,540$15,800
$13,730
Auction Values (At Incurred Mix)
24-Month
36-Month
* During the fourth quarter of 2013, Ford Credit changed its accounting method to include unearned operating lease interest supplements and
residual support in Net investment in Operating leases. The prior periods were revised to conform to current year presentation.
SLIDE 7
FORD CREDIT
FUNDING HIGHLIGHTS
• Completed our Full Year funding plan, highlights include:
– Upgraded to investment grade by S&P; now rated investment grade by four of the major agencies
– Issued $25 billion of public term funding, including $7 billion in the fourth quarter
– Established a new two-year syndicated asset-backed liquidity facility
• Ended the year with about $35 billion of committed capacity and net liquidity of $21 billion
• Key elements of our funding strategy remain unchanged and our liquidity remains strong
SLIDE 8
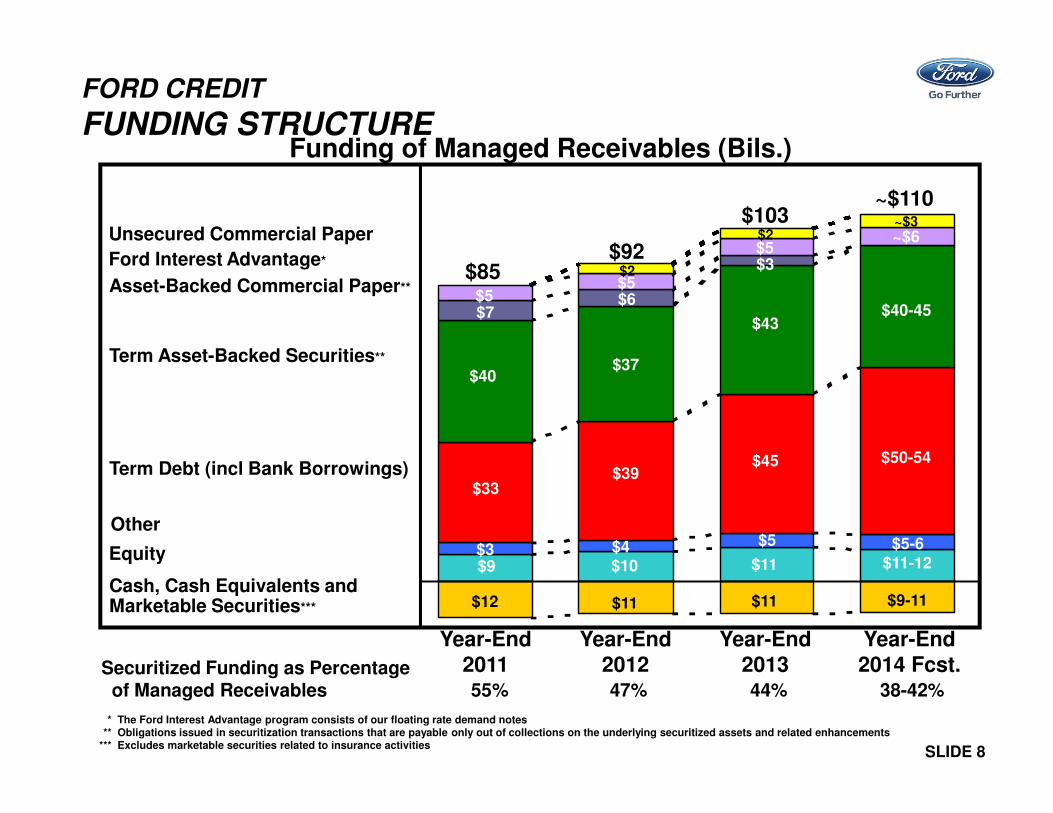
Securitized Funding as Percentageof Managed Receivables 55% 47% 44% 38-42%
Funding of Managed Receivables (Bils.)
FORD CREDIT
FUNDING STRUCTURE
Equity
Asset-Backed Commercial Paper**
Term Asset-Backed Securities**
Term Debt (incl Bank Borrowings)
Cash, Cash Equivalents and Marketable Securities***
Ford Interest Advantage*
~$110
$40-45
$50-54
$11-12
$9-11
~$6
$85
$40
$9
$12
$33
$7$5
$92
$37
$10
$11
$39
$6$5
Unsecured Commercial Paper~$3
$2
* The Ford Interest Advantage program consists of our floating rate demand notes ** Obligations issued in securitization transactions that are payable only out of collections on the underlying securitized assets and related enhancements
*** Excludes marketable securities related to insurance activities
$103
$43
$11
$11
$45
$3$5$2
Year-End2011
Year-End2012
Year-End2014 Fcst.
Year-End2013
Other$4$3
$5 $5-6

SLIDE 9
FORD CREDIT
PUBLIC TERM FUNDING PLAN
* Includes Rule 144A offerings
Unsecured $ 8 $ 9 $ 11 $ 9 – 12
Securitizations* 11 14 14 12 – 15
Total $ 19 $ 23 $ 25 $21 – 27
2011
Actual
(Bils.)
2012
Actual
(Bils.)
2014
Forecast
(Bils.)
2013
Actual
(Bils.)

SLIDE 10
FORD CREDIT
2013 LIQUIDITY PROGRAMS
* FCAR and Conduits are subject to availability of sufficient assets and ability to obtain derivatives to manage interest rate risk; FCAR commercial paper must be supported
by bank lines equal to at least 100% of the principal amount; conduits include committed securitization programs
** Cash, cash equivalents, and marketable securities (excludes marketable securities related to insurance activities)
*** Securitization cash is to be used only to support on-balance sheet securitization transactions
Committed Capacity
$34.5 billion
Dec. 31,
2012 Sep. 30 Dec. 31
(Bils.) (Bils.) (Bils.)
Liquidity Sources*
Cash** 10.9$ 11.0$ [ 10.8$ ]
Unsecured Credit Facilities 0.9 1.5 [ 1.6 ]
FCAR Bank Lines 6.3 5.0 [ 3.5 ]
Conduit / Bank ABS 24.3 26.1 [ 29.4 ]
Total Liquidity Sources 42.4$ 43.6$ [ 45.3$ ]
Utilization of Liquidity
Securitization Cash*** (3.0)$ (2.9)$ [ (4.4)$ ]
Unsecured Credit Facilities (0.1) (0.4) [ (0.4) ]
FCAR Bank Lines (5.8) (4.0) [ (3.3) ]
Conduit / Bank ABS (12.3) (12.6) [ (14.7) ]
Total Utilization of Liquidity (21.2)$ (19.9)$ [ (22.8)$ ]
Gross Liquidity 21.2$ 23.7$ [ 22.5$ ]
Capacity in Excess of Eligible Receivables (1.5) (1.1) [ (1.1) ]
Liquidity Available For Use 19.7$ 22.6$ [ 21.4$ ]
2013
SLIDE 11
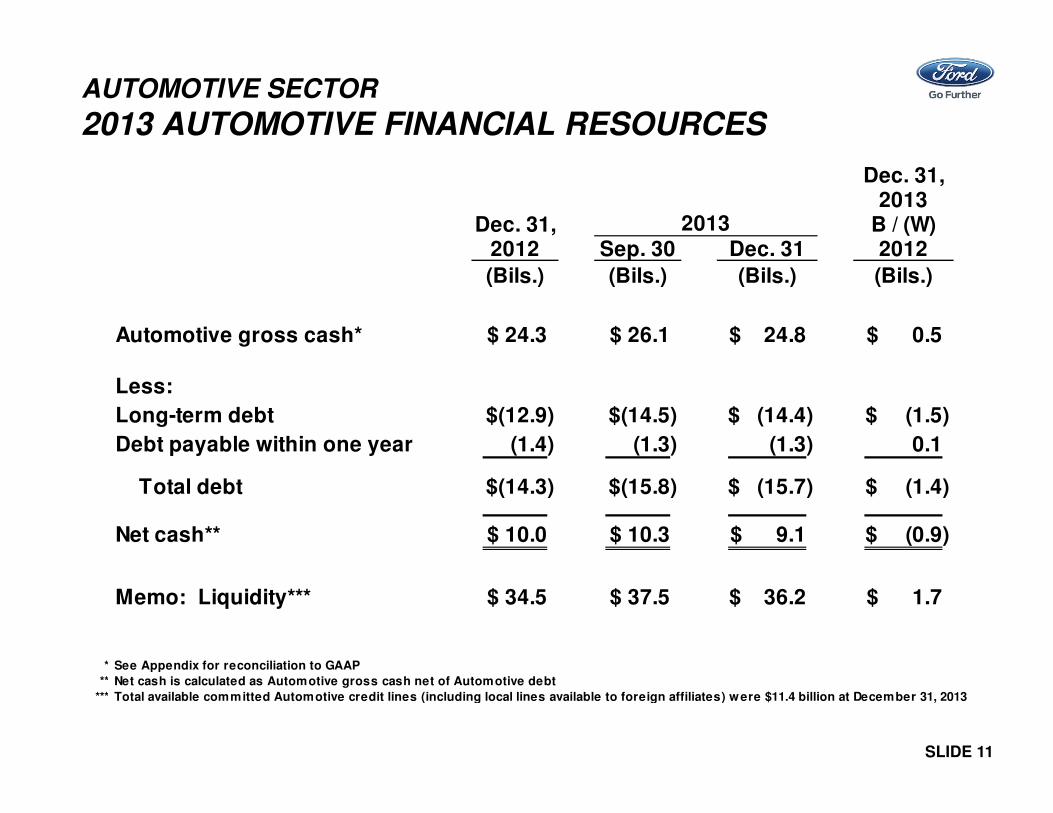
AUTOMOTIVE SECTOR
2013 AUTOMOTIVE FINANCIAL RESOURCES
Dec. 31,2013
Dec. 31, B / (W)2012 Sep. 30 Dec. 31 2012
(Bils.) (Bils.) (Bils.) (Bils.)
Automotive gross cash* 24.3$ 26.1$ 24.8$ 0.5$
Less:
Long-term debt (12.9)$ (14.5)$ (14.4)$ (1.5)$
Debt payable within one year (1.4) (1.3) (1.3) 0.1
Total debt (14.3)$ (15.8)$ (15.7)$ (1.4)$
Net cash** 10.0$ 10.3$ 9.1$ (0.9)$
Memo: Liquidity*** 34.5$ 37.5$ 36.2$ 1.7$
* See Appendix for reconciliation to GAAP
** Net cash is calculated as Automotive gross cash net of Automotive debt
*** Total available committed Automotive credit lines (including local lines available to foreign affiliates) were $11.4 billion at December 31, 2013
2013

SLIDE 12
TOTAL COMPANY
2013 PENSION UPDATE

SLIDE 13
Ford*
• In Fourth Quarter, Total Company profitable for 18th consecutive quarter; Automotive operating-related cash flow positive; liquidity strong
• Strong Fourth Quarter pre-tax profit in North America and record Fourth Quarter profit in Asia Pacific Africa
• For Full Year, Total Company pre-tax profit among the best in our history with record Automotive operating-related cash flow; Automotive operating profit the highest in more than a decade with record profits in North America and Asia Pacific Africa and lower loss in Europe
• Ended the year with Automotive gross cash of $24.8 billion and liquidity of $36.2 billion
Ford Credit
• A solid Full Year performance once again – $1.8 billion pre-tax profit
• Growth continues, with managed receivables of $103 billion at year end
• Near-record low loss-to-receivables ratio of 0.18%
• Completed our Full Year funding plan
• Ended the year with strong liquidity of $21 billion
2013 SUMMARY
* Excluding special items; see appendix for reconciliation to GAAP
SLIDE 14
Statements included or incorporated by reference herein may constitute “forward-looking statements” within the meaning of the Private Securities Litigation Reform Act of 1995.
Forward-looking statements are based on expectations, forecasts, and assumptions by our management and involve a number of risks, uncertainties, and other factors that could
cause actual results to differ materially from those stated, including, without limitation:
• Decline in industry sales volume, particularly in the United States or Europe, due to financial crisis, recession, geopolitical events, or other factors;
• Decline in Ford’s market share or failure to achieve growth;
• Lower-than-anticipated market acceptance of Ford’s new or existing products;
• Market shift away from sales of larger, more profitable vehicles beyond Ford’s current planning assumption, particularly in the United States;
• An increase in or continued volatility of fuel prices, or reduced availability of fuel;
• Continued or increased price competition resulting from industry excess capacity, currency fluctuations, or other factors;
• Fluctuations in foreign currency exchange rates, commodity prices, and interest rates;
• Adverse effects resulting from economic, geopolitical, or other events;
• Economic distress of suppliers that may require Ford to provide substantial financial support or take other measures to ensure supplies of components or materials and could
increase costs, affect liquidity, or cause production constraints or disruptions;
• Work stoppages at Ford or supplier facilities or other limitations on production (whether as a result of labor disputes, natural or man-made disasters, tight credit markets or other
financial distress, production constraints or difficulties, or other factors);
• Single-source supply of components or materials;
• Labor or other constraints on Ford’s ability to maintain competitive cost structure;
• Substantial pension and postretirement health care and life insurance liabilities impairing our liquidity or financial condition;
• Worse-than-assumed economic and demographic experience for postretirement benefit plans (e.g., discount rates or investment returns);
• Restriction on use of tax attributes from tax law “ownership change;”
• The discovery of defects in vehicles resulting in delays in new model launches, recall campaigns, or increased warranty costs;
• Increased safety, emissions, fuel economy, or other regulations resulting in higher costs, cash expenditures, and / or sales restrictions;
• Unusual or significant litigation, governmental investigations, or adverse publicity arising out of alleged defects in products, perceived environmental impacts, or otherwise;
• A change in requirements under long-term supply arrangements committing Ford to purchase minimum or fixed quantities of certain parts, or to pay a minimum amount to the
seller (“take-or-pay” contracts);
• Adverse effects on results from a decrease in or cessation or clawback of government incentives related to investments;
• Inherent limitations of internal controls impacting financial statements and safeguarding of assets;
• Cybersecurity risks to operational systems, security systems, or infrastructure owned by Ford, Ford Credit, or a third-party vendor or supplier;
• Failure of financial institutions to fulfill commitments under committed credit and liquidity facilities;
• Inability of Ford Credit to access debt, securitization, or derivative markets around the world at competitive rates or in sufficient amounts, due to credit rating downgrades, market
volatility, market disruption, regulatory requirements, or other factors;
• Higher-than-expected credit losses, lower-than-anticipated residual values, or higher-than-expected return volumes for leased vehicles;
• Increased competition from banks or other financial institutions seeking to increase their share of financing Ford vehicles; and
• New or increased credit, consumer, or data protection or other regulations resulting in higher costs and / or additional financing restrictions.
We cannot be certain that any expectation, forecast, or assumption made in preparing forward-looking statements will prove accurate, or that any projection will be realized. It is to
be expected that there may be differences between projected and actual results. Our forward-looking statements speak only as of the date of their initial issuance, and we do not
undertake any obligation to update or revise publicly any forward-looking statement, whether as a result of new information, future events or otherwise. For additional discussion,
see “Item 1A. Risk Factors” in our Annual Report on Form 10-K for the year ended December 31, 2012, as updated by our subsequent Quarterly Reports on Form 10-Q and
Current Reports on Form 8-K.
RISK FACTORS

APPENDIX

Total Company
• Income from Continuing Operations 1
• Debt Ratings 2
Automotive Sector
• Gross Cash Reconciliation to GAAP 3
• Automotive Debt 4
Ford Credit
• Operating Highlights 5
• Net Finance Receivables and Operating Leases 6
• Reconciliation of Managed Leverage to Financial Statement Leverage 7
• Worldwide Credit Loss Metrics 8
• U.S. Retail and Lease Credit Loss Drivers 9
• U.S. Lease Residual Performance 10
• Liquidity Profile Balance Sheet 11
FCE Bank PLC
• Percent of Net Loans and Advances to Customers by Market 12
• Credit Loss Ratio (Loss-to-Receivables Ratio) 13
• Public Term Funding Plan 14
Slide
2013 FOURTH QUARTER FIXED INCOME --
APPENDIX INDEX

TOTAL COMPANY
2013 INCOME FROM CONTINUING OPERATIONS
APPENDIX 1 of 14

TOTAL COMPANY
DEBT RATINGS
APPENDIX 2 of 14
S&P Moody's Fitch DBRS
Issuer Ratings
Ford Motor BBB- N/A BBB- BBB (low)
Ford Credit BBB- N/A BBB- BBB (low)
FCE Bank plc * BBB N/A BBB- NR
Senior Long-Term Unsecured
Ford Motor BBB- Baa3 BBB- BBB (low)
Ford Credit BBB- Baa3 BBB- BBB (low)
FCE Bank plc * BBB Baa3 BBB- NR
Short-Term Unsecured
Ford Credit NR P-3 F3 R-3
Outlook Stable Stable Stable Stable
* S&P assigns FCE a long-term senior unsecured credit rating one notch higher than Ford Credit with a negative outlook. The negative outlook
reflects the negative trend S&P has assigned to UK banking industry risk.

APPENDIX 3 of 14
AUTOMOTIVE SECTOR
GROSS CASH RECONCILIATION TO GAAP

AUTOMOTIVE SECTOR
AUTOMOTIVE DEBT
APPENDIX 4 of 14
Dec. 31,
2012 Sep. 30 Dec. 31
(Bils.) (Bils.) (Bils.)
Public unsecured debt 5.3$ 6.7$ 6.7$
Convertible notes 0.8 0.8 0.8
U.S. Dept. of Energy / Ex-Im loans 5.9 5.5 5.3
Other debt (including International) 2.3 2.8 2.9
Total Automotive debt 14.3$ 15.8$ 15.7$
Memo:
Automotive debt payable within one year 1.4$ 1.3$ 1.3$
2013

FORD CREDIT
OPERATING HIGHLIGHTS
Financing Shares 2012 2013 2012 2013
United States
Financing share
Retail installment and lease 38 % 44 % 38 % 40 %
Wholesale 78 77 78 77
Europe
Financing share
Retail installment and lease 37 % 36 % 32 % 34 %
Wholesale 99 97 98 98
Contract Placement Volume -- New and used retail / lease (000)
North America Segment
United States 238 288 978 1,122
Canada 27 33 114 140
Total North America Segment 265 321 1,092 1,262
International Segment
Europe 97 94 392 404
Other international 18 35 58 96
Total International Segment 115 129 450 500
Total Contract Placement Volume 380 450 1,542 1,762
Fourth Quarter Full Year
APPENDIX 5 of 14

FORD CREDIT
NET FINANCE RECEIVABLES AND OPERATING LEASES
APPENDIX 6 of 14
* Includes finance receivables (retail and wholesale) sold for legal purposes and net investment in operating leases included in securitization transactions that do not satisfy the requirements for accounting sale
treatment. These receivables and operating leases are reported on Ford Credit’s balance sheet and are available only for payment of the debt issued by, and other obligations of, the securitization entities
that are parties to those securitization transactions; they are not available to pay the other obligations of Ford Credit or the claims of Ford Credit’s other creditors.
** Dealer financing primarily includes wholesale loans to dealers to finance the purchase of vehicle inventory.
*** Beginning in the fourth quarter, Ford Credit changed its accounting method to include unearned interest supplements and residual support in Net investment in operating leases. These amounts are
amortized to Depreciation on vehicles subject to operating leases. The prior period was revised to conform to current year presentation. There is no change to profit before income tax or net income.
**** Prior period was revised to conform to current year presentation.
Dec. 31 2012 Dec. 31 2013
(Bils.) (Bils.)
Receivables *Net Receivables
Finance Receivables
Finance Receivables – North America Segment
Consumer -- Retail financing 39.5$ 40.9$
Non-Consumer
Dealer financing ** 19.5 22.1
Other 1.1 1.0
Total Finance Receivables – North America Segment 60.1$ 64.0$
Finance Receivables – International Segment
Consumer -- Retail financing 9.0$ 10.8$
Non-Consumer
Dealer financing ** 7.5 8.3
Other 0.4 0.4
Total Finance Receivables – International Segment 16.9$ 19.5$
Unearned interest supplements (1.5) (1.5)
Allowance for credit losses (0.4) (0.4)
Finance receivables, net 75.1$ 81.6$
Net investment in operating leases *** 13.6 18.3
Total Net Receivables 88.7$ 99.9$
Managed Receivables
Total Net Receivables 88.7$ 99.9$
Unearned interest supplements and residual support 2.6 3.1
Allowance for credit losses 0.4 0.4
Other, primarily accumulated supplemental depreciation 0.0 0.0
Total Managed Receivables **** 91.7$ 103.4$

FORD CREDIT
RECONCILIATION OF MANAGED
LEVERAGE TO FINANCIAL STATEMENT LEVERAGE
* Includes debt reported on Ford Credit’s balance sheet that is issued in securitization transactions and payable only out of collections on the underlying securitized
assets and related enhancements. Ford Credit holds the right to receive the excess cash flows not needed to pay the debt issued by, and other obligations of, the
securitization entities that are parties to those securitization transactions.
** Excludes marketable securities related to insurance activities.
*** Primarily related to market valuation adjustments to derivatives due to movements in interest rates. Adjustments to debt are related to designated fair value hedges
and adjustments to equity are related to retained earnings.
**** Shareholder’s interest reported on Ford Credit’s balance sheet.
***** Equals total adjusted debt over total adjusted equity.
Dec. 31 Dec. 31
2012 2013
(Bils.) (Bils.)
Leverage Calculation
Total Debt * $ 89.3 $ 98.7
Adjustments for Cash, Cash Equivalents, and Marketable Securities** (10.9) (10.8)
Adjustments for Derivative Accounting*** (0.8) (0.2)
Total Adjusted Debt $ 77.6 $ 87.7
Equity**** $ 9.7 $ 10.6
Adjustments for Derivative Accounting*** (0.3) (0.3)
Total Adjusted Equity $ 9.4 $ 10.3
Financial Statement Leverage (to 1) 9.2 9.3
Managed Leverage (to 1)***** 8.3 8.5
APPENDIX 7 of 14
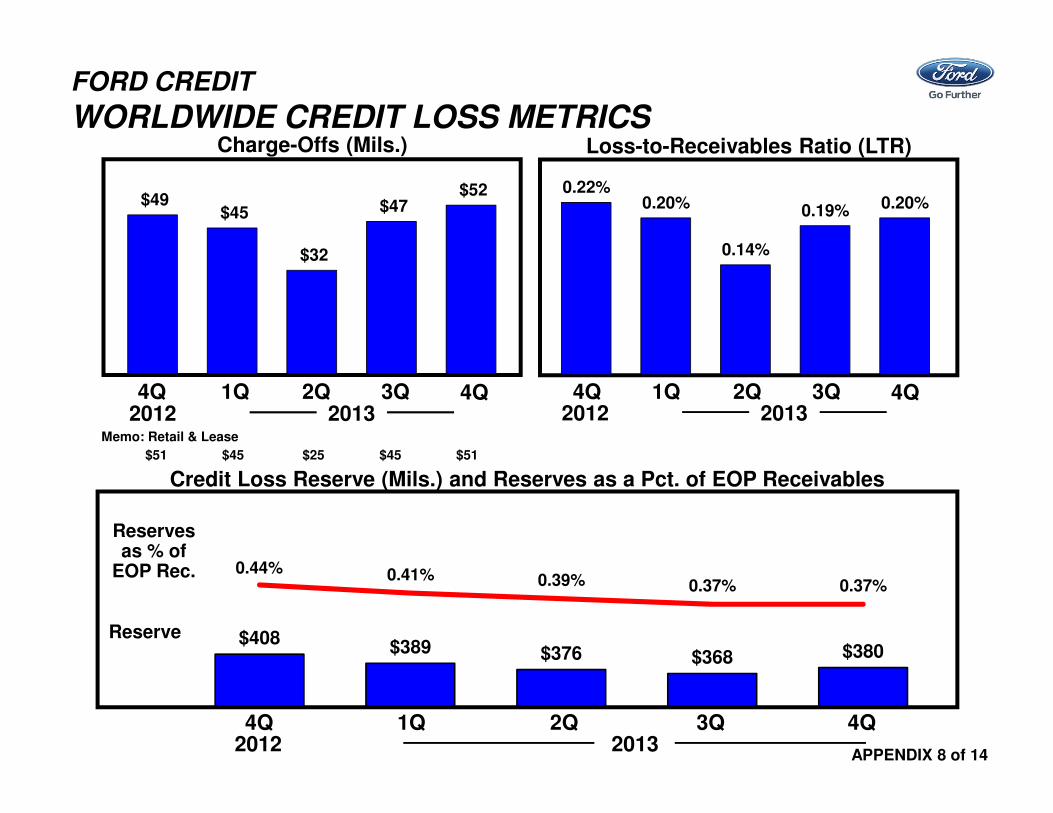
$49 $45
$32
$47 $52
Memo: Retail & Lease
$51 $45 $25 $45 $51
FORD CREDIT
WORLDWIDE CREDIT LOSS METRICSLoss-to-Receivables Ratio (LTR)Charge-Offs (Mils.)
Credit Loss Reserve (Mils.) and Reserves as a Pct. of EOP Receivables
Reserve
Reserves as % of
EOP Rec.
4Q 1Q 2Q 3Q2012
4Q2013
4Q 1Q 2Q 3Q 4Q
0.22%0.20%
0.14%
0.19% 0.20%
4Q 1Q 2Q 3Q2012
4Q2013
$408 $389 $376 $368 $380
0.44% 0.41% 0.39% 0.37% 0.37%
2012 2013
APPENDIX 8 of 14

8 8
6
8
7
1.31% 1.29%
1.06%
1.24%1.14%
$38 $34
$16
$35
$42
0.33%0.30%
0.14%
0.28%
0.33%
FORD CREDIT
U.S. RETAIL AND LEASE CREDIT LOSS DRIVERS
Memo:
New Bankruptcy
Filings (000) 6 5 4 4 4
Repossessions (000)
Repo. Ratio
Severity Charge-Offs (Mils.) and LTR (%)
LTR
4Q 1Q 2Q 3Q 4Q 4Q 1Q 2Q 3Q 4Q
0.18%0.17%
0.13%
0.16% 0.16%
$7,300 $7,200 $7,600 $7,500
$8,100
Over-60-Day Delinquencies *
* Excluding bankruptcies
4Q 1Q 2Q 3Q 4Q 4Q 1Q 2Q 3Q 4Q2012 2013 2012 2013
2012 2013 2012 2013
APPENDIX 9 of 14

$18,305
$19,410$18,950
$19,355 $19,520
$16,870
$17,565
$17,110
$17,635$17,560
FORD CREDIT
U.S. LEASE RESIDUAL PERFORMANCE
Lease Return Volume (000) Auction Values (At Q4 2013 Mix)
1Q 4Q4Q 2Q 3Q
20132012
24-Month
36-Month
39-Month / Other
1Q 4Q4Q 2Q 3Q
36-Month
24-Month
3 3 4 5 5
5 67 5
86
1716 17
21
Memo: U.S. Return Rates
62% 69% 68% 69% 77%
26
34
14
27 27
20132012
Memo: Worldwide Net Investment in Operating Leases (Bils.) *
$13.6 $14.7 $16.2 $17.3 $18.3
APPENDIX 10 of 14
* During the fourth quarter of 2013, Ford Credit changed its accounting method to include unearned operating lease interest supplements and
residual support in Net investment in Operating leases. The prior periods were revised to conform to current year presentation.

FORD CREDIT
LIQUIDITY PROFILE BALANCE SHEET
APPENDIX 11 of 14
(a) Includes finance receivables net of unearned income, investment in operating leases net of accumulated depreciation, cash and
cash equivalents, and marketable securities (excludes marketable securities related to insurance activities).
(b) Retail and lease ABS are treated as amortizing immediately to match the underlying assets.
(c) Includes all of the wholesale ABS term and conduit maturities of $8.7 billion that otherwise contractually extend to 2015 and beyond.
Cumulative Maturities -- As of December 31, 2013 (Bils.)
$69
$90
$104
$114
$37
$58
$75
$99
Assets (a)
Debt (b)
(c)
Memo: Unsecured long-term debt maturities (Bils.)
2014 2015 2016 2017 & Beyond
$4.5 $9.3 $9.0 $20.3

32%
30%
11%
8%
4%
15%
36%
29%
8%7%
3%
17%
Switzerland 4.4%WWTF** 3.8%Belgium 2.2%Eastern Europe 2.1%Netherlands 1.9%Austria 1.3%Ireland 0.7%Portugal 0.5%Greece 0.1%
FCE BANK PLC
PERCENT OF NET LOANS & ADVANCES TO CUSTOMERS
BY MARKET*
OtherItaly France SpainGermanyU.K.
20132012 20132012 20132012 20132012 20132012 20132012
* As percent of Net loans and advances to customers which were £8.7 billion and £9.4 billion at December 31, 2012 and December 31, 2013, respectively.
** Worldwide Trade Finance (WWTF) provides offshore trade finance support to importers/dealers in about 60 countries.
APPENDIX 12 of 14

0.21% 0.17%0.01%
0.91%
(0.02)%
0.37%0.15% 0.08% 0.08%
0.57%0.40%
(0.30)%
Total
FCE Italy France SpainGermanyU.K.
20132012
Net Credit Losses As Percentage Of Average Net Loans And Advances To Customers
20132012 20132012 20132012 20132012 20132012
APPENDIX 13 of 14
FCE BANK PLC
2013 FOURTH QUARTER CREDIT LOSS RATIO
COMPARED WITH 2012

FCE BANK PLC
PUBLIC TERM FUNDING PLAN
Unsecured £ 0.5 £ 0.7 £ 1.6 £ 1.1 – 1.7
Securitizations 0.4 0.4 0.4 0.7 – 1.1
Total £ 0.9 £ 1.1 £ 2.0 £ 1.8 – 2.8
Actual
(Bils.)
2011
Actual
(Bils.)
2012
Actual
(Bils.)
2014
Forecast
(Bils.)
2013
APPENDIX 14 of 14