Embed Size (px)
Citation preview
2013
2013
SPANISH NATIONAL YOUTH GUARANTEE
IMPLEMENTATION PLAN
ANNEX. CONTEXT
2 Annex. Context
Contents
I. Introduction 3
II. The labour context for young people 4
III. Main causes of the labour situation for young people 12
High rate of early school leaving 12 Low percentage of young people with medium levels of training 13 Poor language skills 14 Low level of entrepreneurship 14
IV. Young people not in employment, education or training 15
V. Indicators to monitor the Plan 22
Global indicator 23 General indicators 24
VI. Methodological note 25
3 Spanish National Youth Guarantee Plan
I. Introduction
This Annex to the Spanish National Youth Guarantee Plan analyses the context for the
young people who are not in employment, education or training in Spain.
This analysis complements and, to some extent, expands the analysis performed as
the basis for the Strategy for Entrepreneurship and Youth Employment approved in
February 2013, and focuses its attention on young people aged below 25 who are
neither working nor studying.
This is the target group for the Council Recommendation of 22 April 2013 on
establishing a Youth Guarantee (2013/C 120/01) and is defined following a statistical
methodology drawn up by Eurostat for the European Union as a whole. A distinction
must be made between this statistical concept which is now covered by this European
and national political initiative and the sociological concept that identifies the so-called
“ninis” as young people without skills or work experience. The young people to which
this analysis refers may have, and in many cases do have, both educational and
vocational qualifications and work experience but, at a given time, they are neither
studying nor working. Most of them, as shown in this analysis, are actively seeking
employment, so they are not inactive according to the terms of the Labour Force
Survey (LFS, EPA in Spanish).
The group of young people aged under 25 who are neither working nor studying
amounted to 858,200 persons in 2012. This is a very mixed population group covering
both young people at the end of adolescence who have dropped out of school early or
did not continue their training after finishing their compulsory education and therefore
have no skills or work experience, as well as those who have high-level qualifications,
extensive skills and even work experience, but have been unsuccessful in finding an
employment.
The purpose of the Youth Guarantee is to guarantee that all young people aged under
25 receive a good quality offer of employment, on-going education, an apprenticeship
or work experience within four months after finishing formal education or becoming
unemployed.
This analysis explains the approach adopted by the National Youth Guarantee
Implementation Plan and also identifies the situation for the main indicators for
monitoring the Plan. There is also a brief methodological note on the data relating to
this group.
4 Annex. Context
II. The labour context for young people
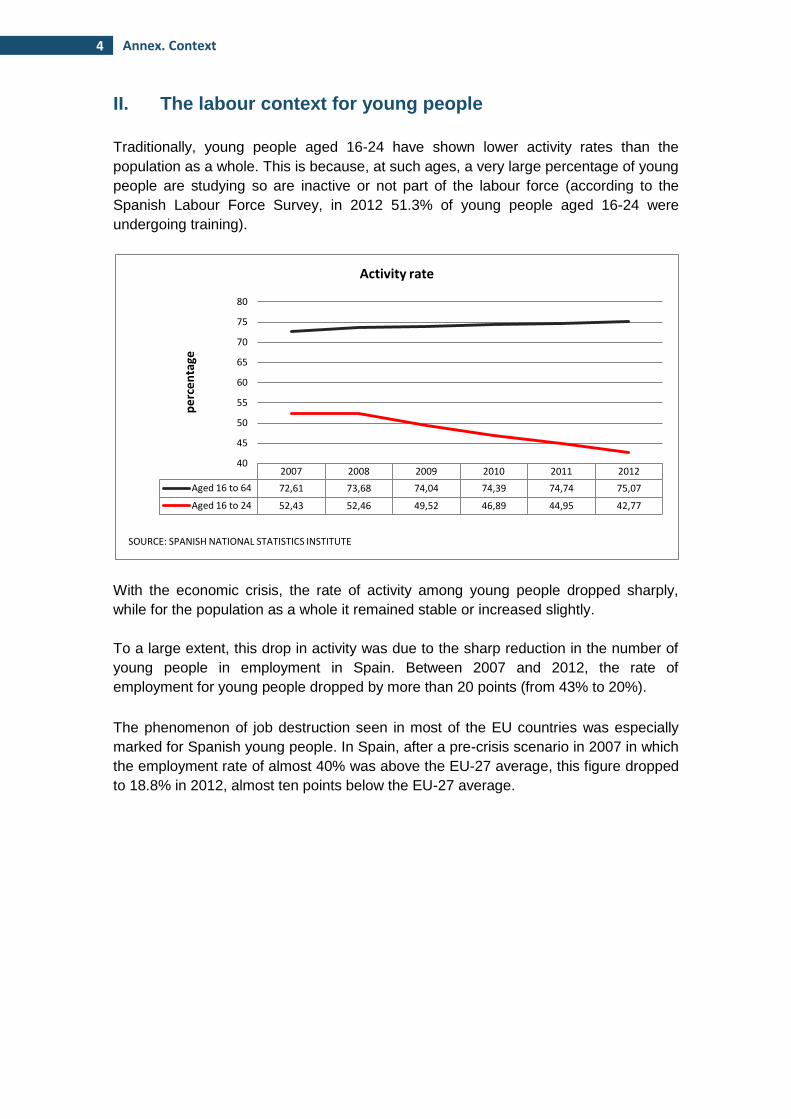
Traditionally, young people aged 16-24 have shown lower activity rates than the
population as a whole. This is because, at such ages, a very large percentage of young
people are studying so are inactive or not part of the labour force (according to the
Spanish Labour Force Survey, in 2012 51.3% of young people aged 16-24 were
undergoing training).
With the economic crisis, the rate of activity among young people dropped sharply,
while for the population as a whole it remained stable or increased slightly.
To a large extent, this drop in activity was due to the sharp reduction in the number of
young people in employment in Spain. Between 2007 and 2012, the rate of
employment for young people dropped by more than 20 points (from 43% to 20%).
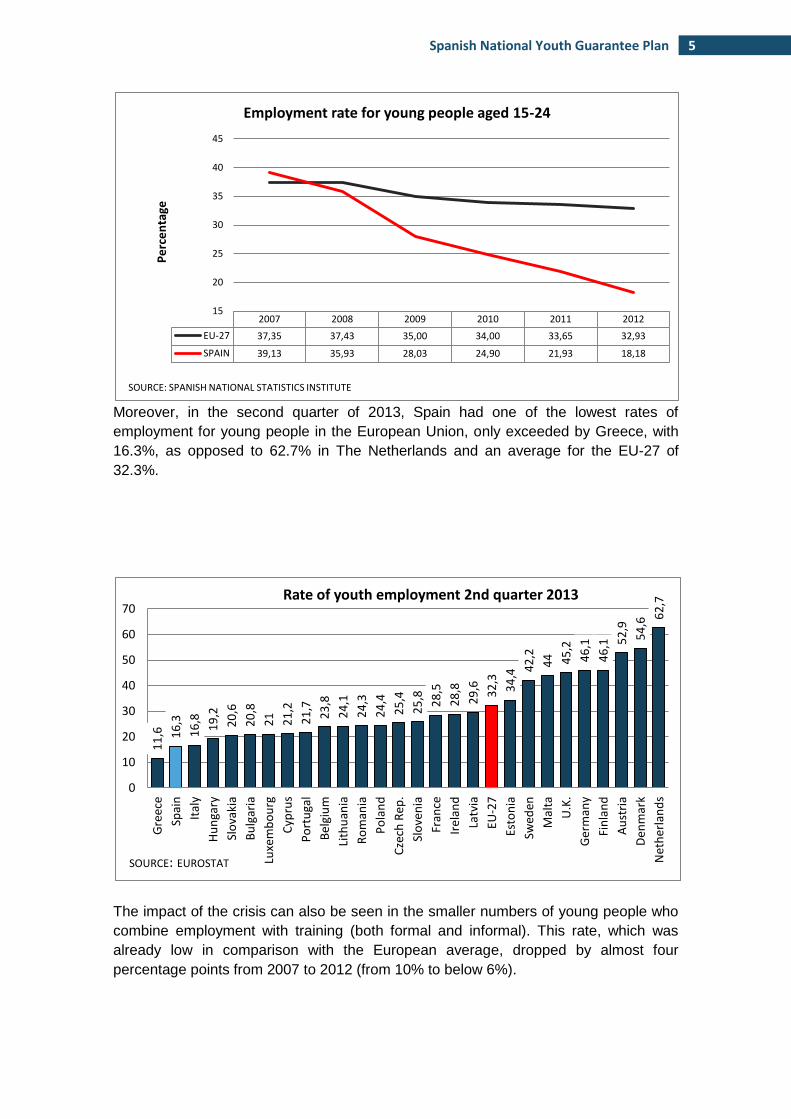
The phenomenon of job destruction seen in most of the EU countries was especially
marked for Spanish young people. In Spain, after a pre-crisis scenario in 2007 in which
the employment rate of almost 40% was above the EU-27 average, this figure dropped
to 18.8% in 2012, almost ten points below the EU-27 average.
2007 2008 2009 2010 2011 2012
Aged 16 to 64 72,61 73,68 74,04 74,39 74,74 75,07
Aged 16 to 24 52,43 52,46 49,52 46,89 44,95 42,77
40
45
50
55
60
65
70
75
80
pe
rce
nta
ge
SOURCE: SPANISH NATIONAL STATISTICS INSTITUTE
Activity rate
5 Spanish National Youth Guarantee Plan
Moreover, in the second quarter of 2013, Spain had one of the lowest rates of
employment for young people in the European Union, only exceeded by Greece, with
16.3%, as opposed to 62.7% in The Netherlands and an average for the EU-27 of
32.3%.
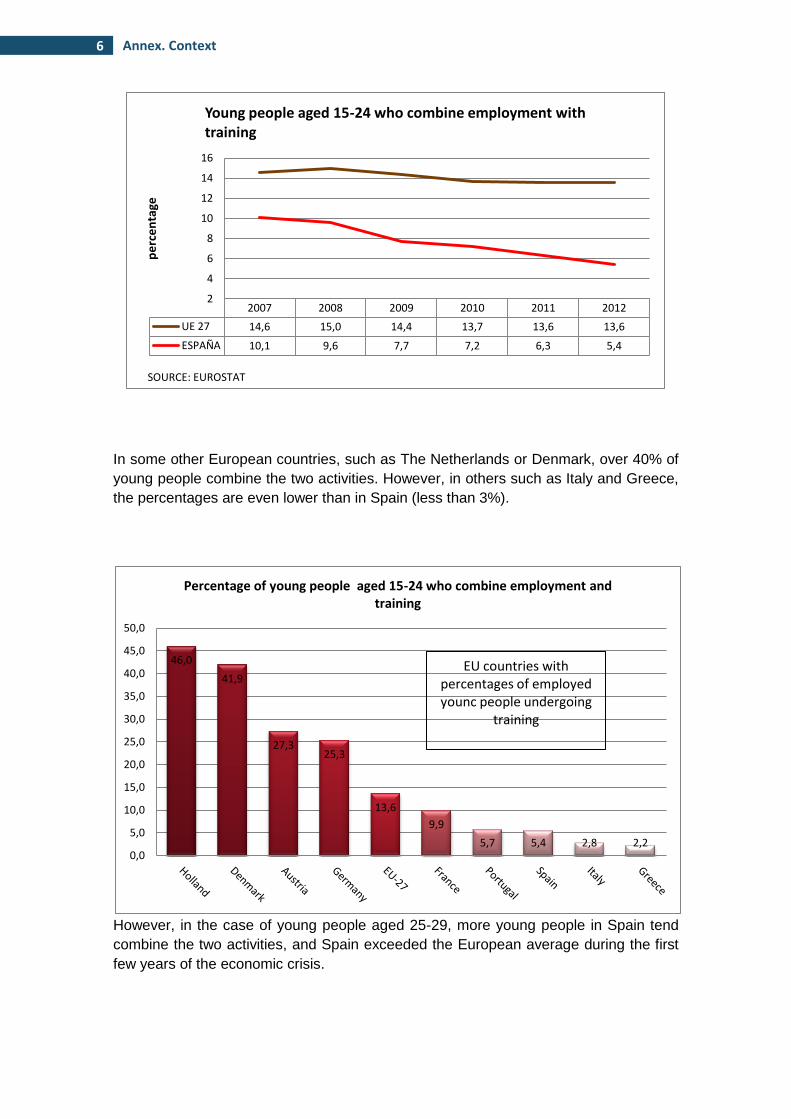
The impact of the crisis can also be seen in the smaller numbers of young people who
combine employment with training (both formal and informal). This rate, which was
already low in comparison with the European average, dropped by almost four
percentage points from 2007 to 2012 (from 10% to below 6%).
2007 2008 2009 2010 2011 2012
EU-27 37,35 37,43 35,00 34,00 33,65 32,93
SPAIN 39,13 35,93 28,03 24,90 21,93 18,18
15
20
25
30
35
40
45
Pe
rce
nta
ge
SOURCE: SPANISH NATIONAL STATISTICS INSTITUTE
Employment rate for young people aged 15-24
11
,6
16
,3
16
,8
19
,2
20
,6
20
,8
21
21
,2
21
,7
23
,8
24
,1
24
,3
24
,4
25
,4
25
,8
28
,5
28
,8
29
,6
32
,3
34
,4 42
,2
44
45
,2
46
,1
46
,1 52
,9
54
,6 62
,7
0
10
20
30
40
50
60
70
Gre
ece
Spai
n
Ital
y
Hu
nga
ry
Slo
vaki
a
Bu
lgar
ia
Luxe
mb
ou
rg
Cyp
rus
Po
rtu
gal
Bel
giu
m
Lith
uan
ia
Ro
man
ia
Po
lan
d
Cze
ch R
ep.
Slo
ven
ia
Fran
ce
Irel
and
Latv
ia
EU-2
7
Esto
nia
Swed
en
Mal
ta
U.K
.
Ger
man
y
Fin
lan
d
Au
stri
a
Den
mar
k
Net
her
lan
ds
Rate of youth employment 2nd quarter 2013
SOURCE: EUROSTAT
6 Annex. Context
In some other European countries, such as The Netherlands or Denmark, over 40% of
young people combine the two activities. However, in others such as Italy and Greece,
the percentages are even lower than in Spain (less than 3%).
However, in the case of young people aged 25-29, more young people in Spain tend
combine the two activities, and Spain exceeded the European average during the first
few years of the economic crisis.
2007 2008 2009 2010 2011 2012
UE 27 14,6 15,0 14,4 13,7 13,6 13,6
ESPAÑA 10,1 9,6 7,7 7,2 6,3 5,4
2
4
6
8
10
12
14
16 p
erc
en
tage
SOURCE: EUROSTAT
Young people aged 15-24 who combine employment with training
46,0
41,9
27,3 25,3
13,6
9,9
5,7 5,4 2,8 2,2 0,0
5,0
10,0
15,0
20,0
25,0
30,0
35,0
40,0
45,0
50,0
Percentage of young people aged 15-24 who combine employment and training
EU countries with percentages of employed younc people undergoing
training
7 Spanish National Youth Guarantee Plan
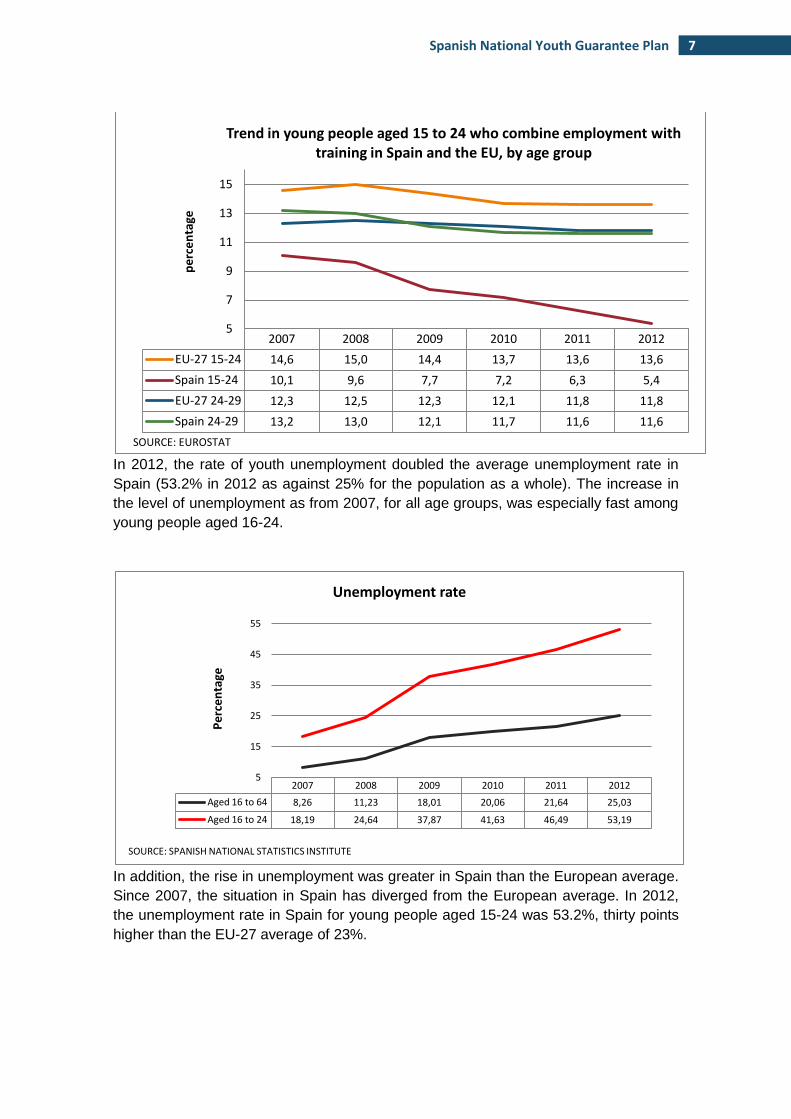
In 2012, the rate of youth unemployment doubled the average unemployment rate in
Spain (53.2% in 2012 as against 25% for the population as a whole). The increase in
the level of unemployment as from 2007, for all age groups, was especially fast among
young people aged 16-24.
In addition, the rise in unemployment was greater in Spain than the European average.
Since 2007, the situation in Spain has diverged from the European average. In 2012,
the unemployment rate in Spain for young people aged 15-24 was 53.2%, thirty points
higher than the EU-27 average of 23%.
2007 2008 2009 2010 2011 2012
EU-27 15-24 14,6 15,0 14,4 13,7 13,6 13,6
Spain 15-24 10,1 9,6 7,7 7,2 6,3 5,4
EU-27 24-29 12,3 12,5 12,3 12,1 11,8 11,8
Spain 24-29 13,2 13,0 12,1 11,7 11,6 11,6
5
7
9
11
13
15 p
erc
en
tage
SOURCE: EUROSTAT
Trend in young people aged 15 to 24 who combine employment with training in Spain and the EU, by age group
2007 2008 2009 2010 2011 2012
Aged 16 to 64 8,26 11,23 18,01 20,06 21,64 25,03
Aged 16 to 24 18,19 24,64 37,87 41,63 46,49 53,19
5
15
25
35
45
55
Pe
rce
nta
ge
SOURCE: SPANISH NATIONAL STATISTICS INSTITUTE
Unemployment rate
8 Annex. Context
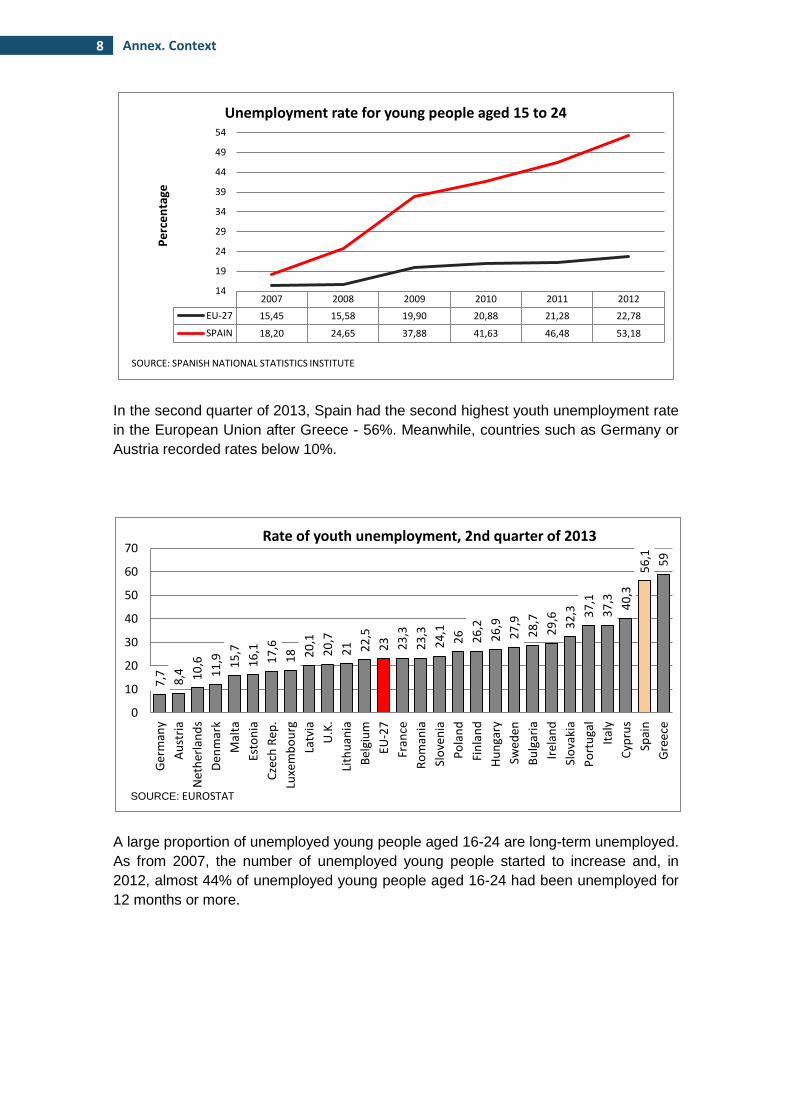
In the second quarter of 2013, Spain had the second highest youth unemployment rate
in the European Union after Greece - 56%. Meanwhile, countries such as Germany or
Austria recorded rates below 10%.
A large proportion of unemployed young people aged 16-24 are long-term unemployed.
As from 2007, the number of unemployed young people started to increase and, in
2012, almost 44% of unemployed young people aged 16-24 had been unemployed for
12 months or more.
2007 2008 2009 2010 2011 2012
EU-27 15,45 15,58 19,90 20,88 21,28 22,78
SPAIN 18,20 24,65 37,88 41,63 46,48 53,18
14
19
24
29
34
39
44
49
54
Pe
rce
nta
ge
SOURCE: SPANISH NATIONAL STATISTICS INSTITUTE
Unemployment rate for young people aged 15 to 24
7,7
8,4
10
,6
11
,9
15
,7
16
,1
17
,6
18
20
,1
20
,7
21
22
,5
23
23
,3
23
,3
24
,1
26
26
,2
26
,9
27
,9
28
,7
29
,6
32
,3
37
,1
37
,3
40
,3
56
,1
59
0
10
20
30
40
50
60
70
Ger
man
y
Au
stri
a
Net
her
lan
ds
Den
mar
k
Mal
ta
Esto
nia
Cze
ch R
ep.
Luxe
mb
ou
rg
Latv
ia
U.K
.
Lith
uan
ia
Bel
giu
m
EU-2
7
Fran
ce
Ro
man
ia
Slo
ven
ia
Po
lan
d
Fin
lan
d
Hu
nga
ry
Swed
en
Bu
lgar
ia
Irel
and
Slo
vaki
a
Po
rtu
gal
Ital
y
Cyp
rus
Spai
n
Gre
ece
Rate of youth unemployment, 2nd quarter of 2013
SOURCE: EUROSTAT
9 Spanish National Youth Guarantee Plan
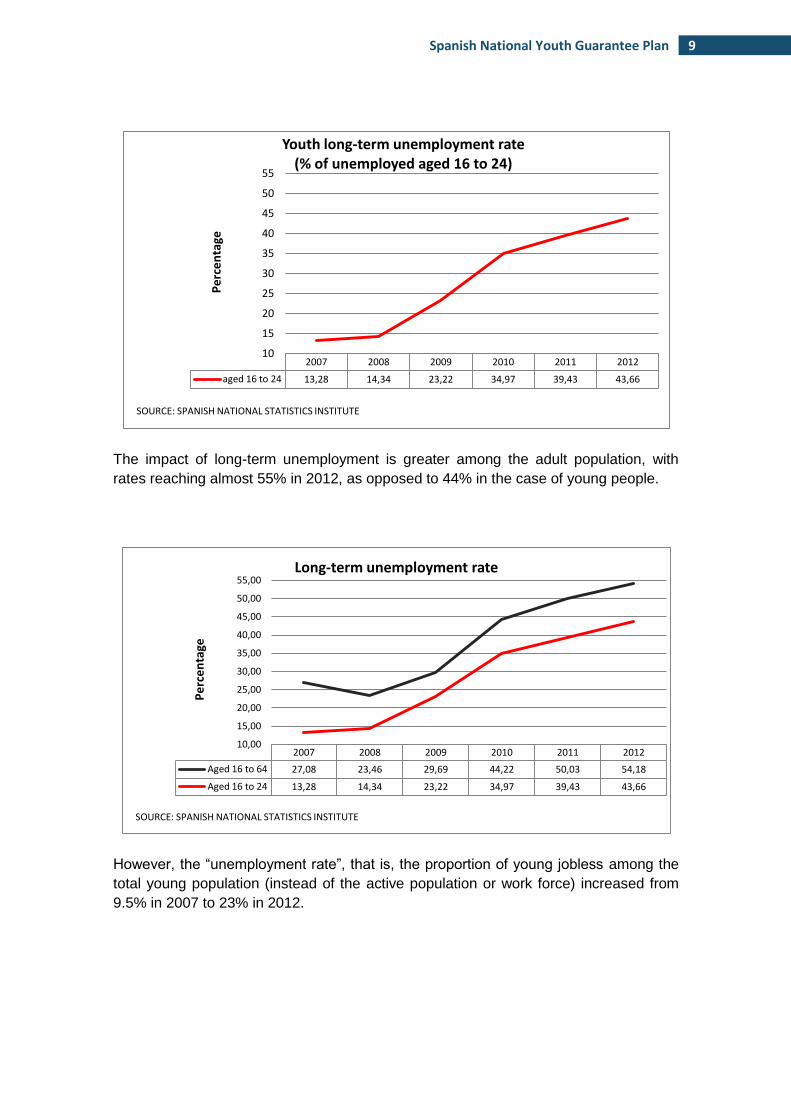
The impact of long-term unemployment is greater among the adult population, with
rates reaching almost 55% in 2012, as opposed to 44% in the case of young people.
However, the “unemployment rate”, that is, the proportion of young jobless among the
total young population (instead of the active population or work force) increased from
9.5% in 2007 to 23% in 2012.
2007 2008 2009 2010 2011 2012
aged 16 to 24 13,28 14,34 23,22 34,97 39,43 43,66
10
15
20
25
30
35
40
45
50
55
Pe
rce
nta
ge
SOURCE: SPANISH NATIONAL STATISTICS INSTITUTE
Youth long-term unemployment rate (% of unemployed aged 16 to 24)
2007 2008 2009 2010 2011 2012
Aged 16 to 64 27,08 23,46 29,69 44,22 50,03 54,18
Aged 16 to 24 13,28 14,34 23,22 34,97 39,43 43,66
10,00
15,00
20,00
25,00
30,00
35,00
40,00
45,00
50,00
55,00
Pe
rce
nta
ge
SOURCE: SPANISH NATIONAL STATISTICS INSTITUTE
Long-term unemployment rate
10 Annex. Context
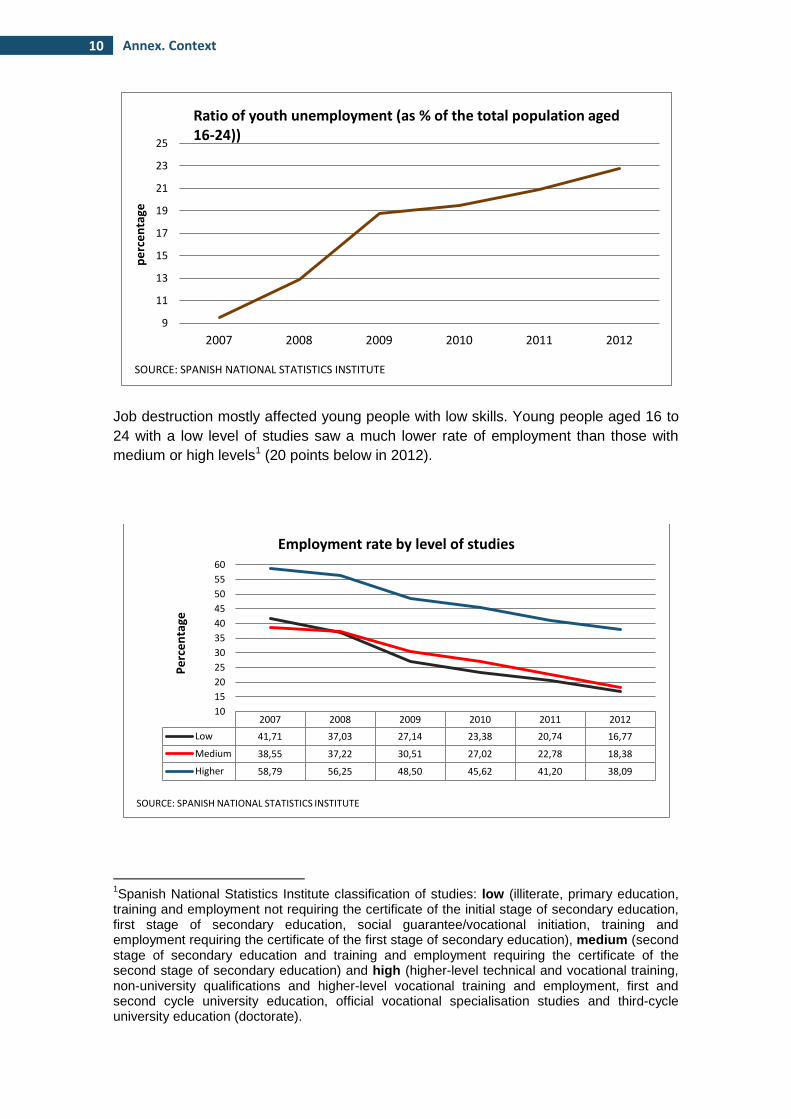
Job destruction mostly affected young people with low skills. Young people aged 16 to
24 with a low level of studies saw a much lower rate of employment than those with
medium or high levels1 (20 points below in 2012).
1Spanish National Statistics Institute classification of studies: low (illiterate, primary education,
training and employment not requiring the certificate of the initial stage of secondary education, first stage of secondary education, social guarantee/vocational initiation, training and employment requiring the certificate of the first stage of secondary education), medium (second stage of secondary education and training and employment requiring the certificate of the second stage of secondary education) and high (higher-level technical and vocational training, non-university qualifications and higher-level vocational training and employment, first and second cycle university education, official vocational specialisation studies and third-cycle university education (doctorate).
9
11
13
15
17
19
21
23
25
2007 2008 2009 2010 2011 2012
pe
rce
nta
ge
SOURCE: SPANISH NATIONAL STATISTICS INSTITUTE
Ratio of youth unemployment (as % of the total population aged 16-24))
2007 2008 2009 2010 2011 2012
Low 41,71 37,03 27,14 23,38 20,74 16,77
Medium 38,55 37,22 30,51 27,02 22,78 18,38
Higher 58,79 56,25 48,50 45,62 41,20 38,09
10
15
20
25
30
35
40
45
50
55
60
Pe
rce
nta
ge
SOURCE: SPANISH NATIONAL STATISTICS INSTITUTE
Employment rate by level of studies
11 Spanish National Youth Guarantee Plan
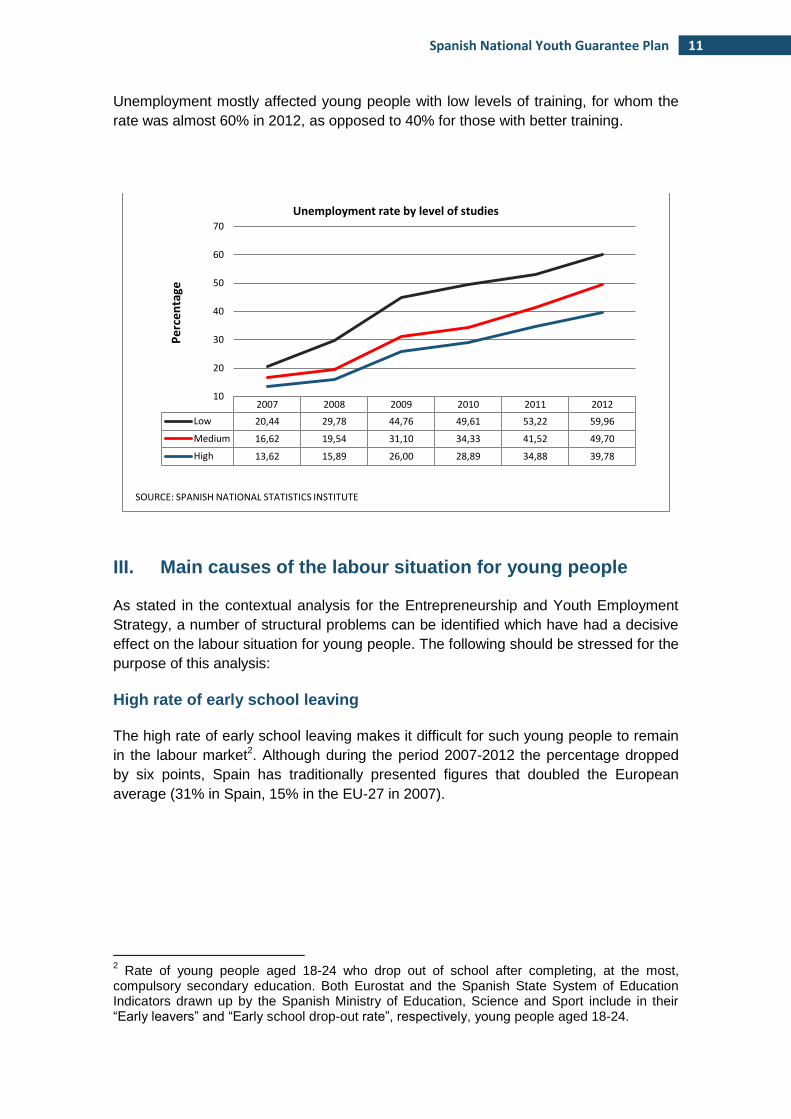
Unemployment mostly affected young people with low levels of training, for whom the
rate was almost 60% in 2012, as opposed to 40% for those with better training.
III. Main causes of the labour situation for young people
As stated in the contextual analysis for the Entrepreneurship and Youth Employment
Strategy, a number of structural problems can be identified which have had a decisive
effect on the labour situation for young people. The following should be stressed for the
purpose of this analysis:
High rate of early school leaving
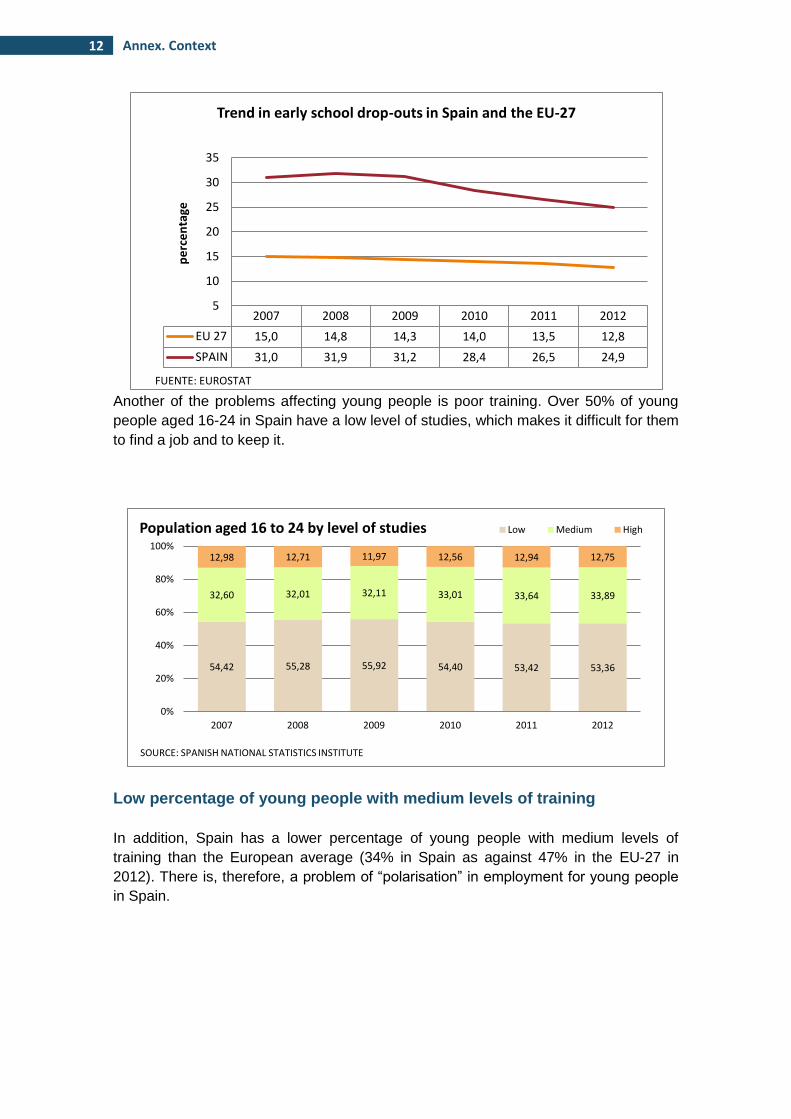
The high rate of early school leaving makes it difficult for such young people to remain
in the labour market2. Although during the period 2007-2012 the percentage dropped
by six points, Spain has traditionally presented figures that doubled the European
average (31% in Spain, 15% in the EU-27 in 2007).
2 Rate of young people aged 18-24 who drop out of school after completing, at the most,
compulsory secondary education. Both Eurostat and the Spanish State System of Education Indicators drawn up by the Spanish Ministry of Education, Science and Sport include in their “Early leavers” and “Early school drop-out rate”, respectively, young people aged 18-24.
2007 2008 2009 2010 2011 2012
Low 20,44 29,78 44,76 49,61 53,22 59,96
Medium 16,62 19,54 31,10 34,33 41,52 49,70
High 13,62 15,89 26,00 28,89 34,88 39,78
10
20
30
40
50
60
70
Pe
rce
nta
ge
SOURCE: SPANISH NATIONAL STATISTICS INSTITUTE
Unemployment rate by level of studies
12 Annex. Context
Another of the problems affecting young people is poor training. Over 50% of young
people aged 16-24 in Spain have a low level of studies, which makes it difficult for them
to find a job and to keep it.
Low percentage of young people with medium levels of training
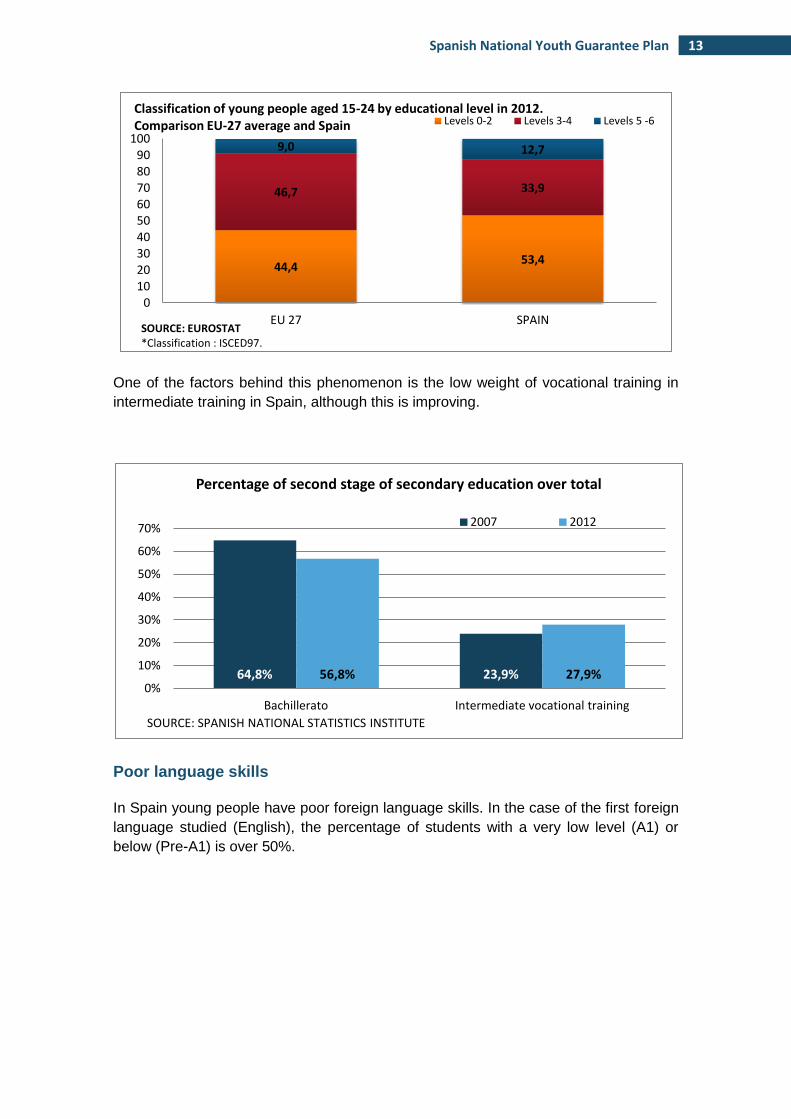
In addition, Spain has a lower percentage of young people with medium levels of
training than the European average (34% in Spain as against 47% in the EU-27 in
2012). There is, therefore, a problem of “polarisation” in employment for young people
in Spain.
2007 2008 2009 2010 2011 2012
EU 27 15,0 14,8 14,3 14,0 13,5 12,8
SPAIN 31,0 31,9 31,2 28,4 26,5 24,9
5
10
15
20
25
30
35
pe
rce
nta
ge
FUENTE: EUROSTAT
Trend in early school drop-outs in Spain and the EU-27
54,42 55,28 55,92 54,40 53,42 53,36
32,60 32,01 32,11 33,01 33,64 33,89
12,98 12,71 11,97 12,56 12,94 12,75
0%
20%
40%
60%
80%
100%
2007 2008 2009 2010 2011 2012
SOURCE: SPANISH NATIONAL STATISTICS INSTITUTE
Population aged 16 to 24 by level of studies Low Medium High
13 Spanish National Youth Guarantee Plan
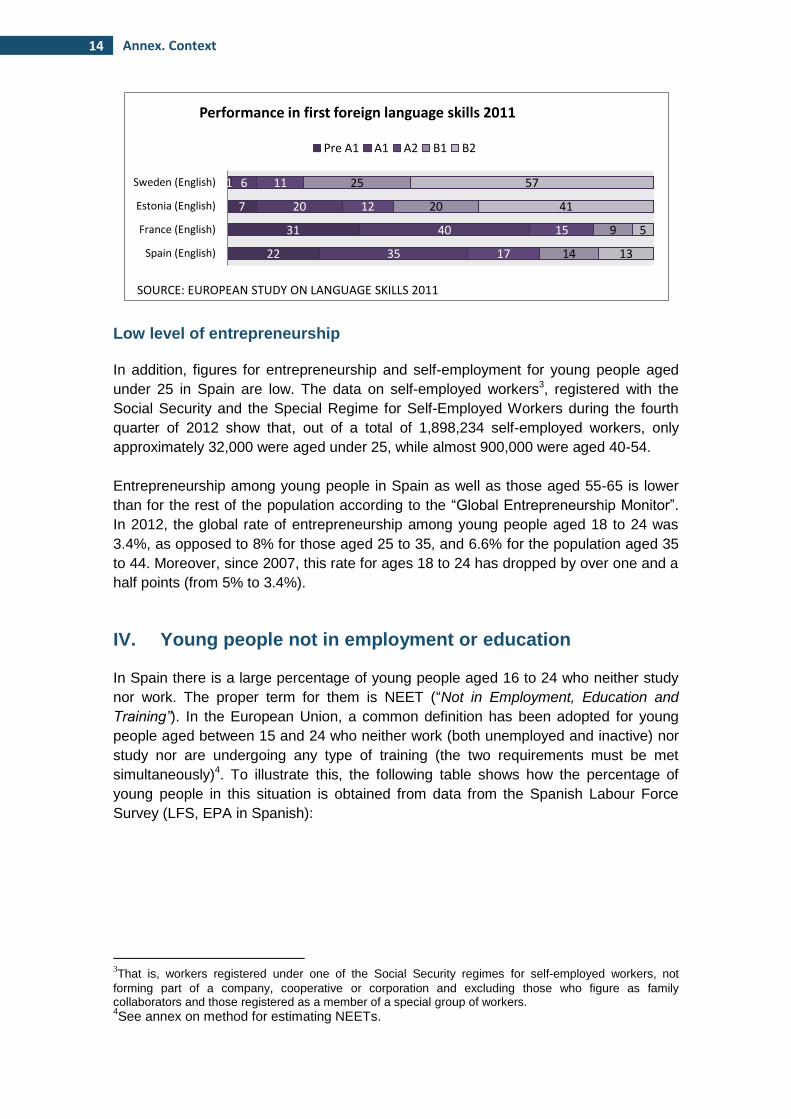
One of the factors behind this phenomenon is the low weight of vocational training in
intermediate training in Spain, although this is improving.
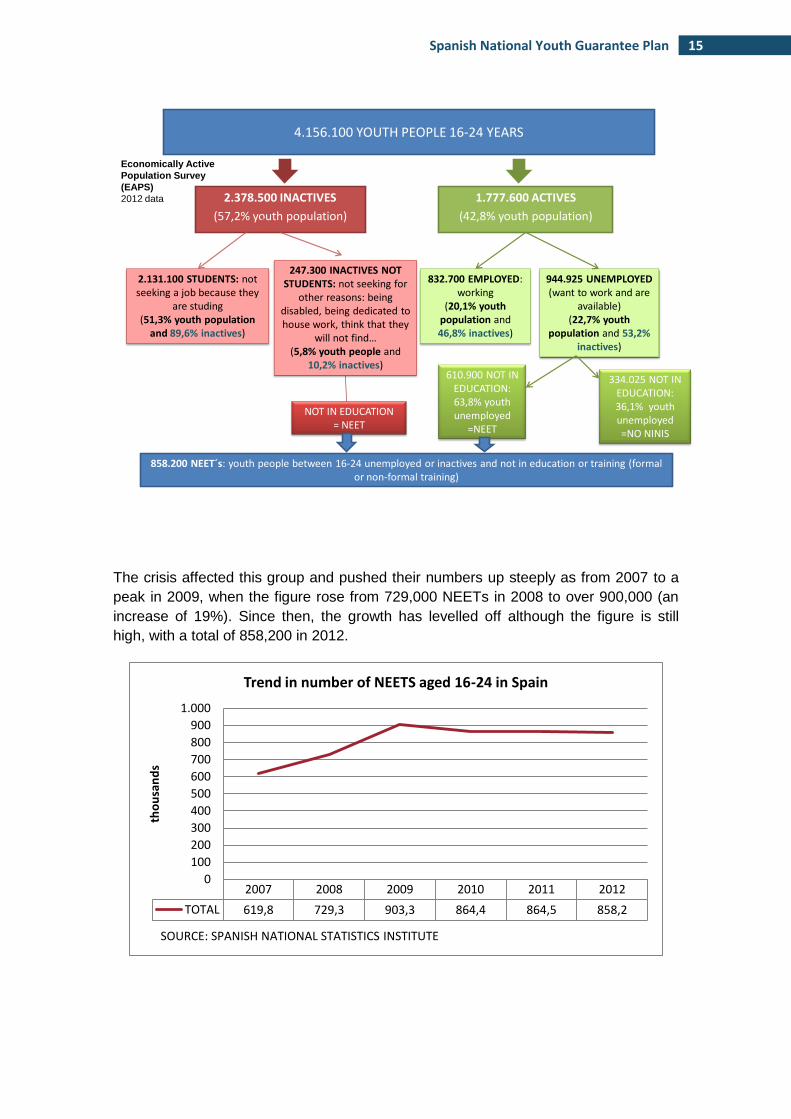
Poor language skills
In Spain young people have poor foreign language skills. In the case of the first foreign
language studied (English), the percentage of students with a very low level (A1) or
below (Pre-A1) is over 50%.
44,4 53,4
46,7 33,9
9,0 12,7
0 10 20 30 40 50 60 70 80 90
100
EU 27 SPAIN SOURCE: EUROSTAT *Classification : ISCED97.
Classification of young people aged 15-24 by educational level in 2012. Comparison EU-27 average and Spain Levels 0-2 Levels 3-4 Levels 5 -6
64,8% 23,9% 56,8% 27,9% 0%
10%
20%
30%
40%
50%
60%
70%
Bachillerato Intermediate vocational training
SOURCE: SPANISH NATIONAL STATISTICS INSTITUTE
Percentage of second stage of secondary education over total
2007 2012
14 Annex. Context
Low level of entrepreneurship
In addition, figures for entrepreneurship and self-employment for young people aged
under 25 in Spain are low. The data on self-employed workers3, registered with the
Social Security and the Special Regime for Self-Employed Workers during the fourth
quarter of 2012 show that, out of a total of 1,898,234 self-employed workers, only
approximately 32,000 were aged under 25, while almost 900,000 were aged 40-54.
Entrepreneurship among young people in Spain as well as those aged 55-65 is lower
than for the rest of the population according to the “Global Entrepreneurship Monitor”.
In 2012, the global rate of entrepreneurship among young people aged 18 to 24 was
3.4%, as opposed to 8% for those aged 25 to 35, and 6.6% for the population aged 35
to 44. Moreover, since 2007, this rate for ages 18 to 24 has dropped by over one and a
half points (from 5% to 3.4%).
IV. Young people not in employment or education
In Spain there is a large percentage of young people aged 16 to 24 who neither study
nor work. The proper term for them is NEET (“Not in Employment, Education and
Training”). In the European Union, a common definition has been adopted for young
people aged between 15 and 24 who neither work (both unemployed and inactive) nor
study nor are undergoing any type of training (the two requirements must be met
simultaneously)4. To illustrate this, the following table shows how the percentage of
young people in this situation is obtained from data from the Spanish Labour Force
Survey (LFS, EPA in Spanish):
3That is, workers registered under one of the Social Security regimes for self-employed workers, not
forming part of a company, cooperative or corporation and excluding those who figure as family collaborators and those registered as a member of a special group of workers. 4See annex on method for estimating NEETs.
22
31
7
1
35
40
20
6
17
15
12
11
14
9
20
25
13
5
41
57
Spain (English)
France (English)
Estonia (English)
Sweden (English)
SOURCE: EUROPEAN STUDY ON LANGUAGE SKILLS 2011
Performance in first foreign language skills 2011
Pre A1 A1 A2 B1 B2
15 Spanish National Youth Guarantee Plan
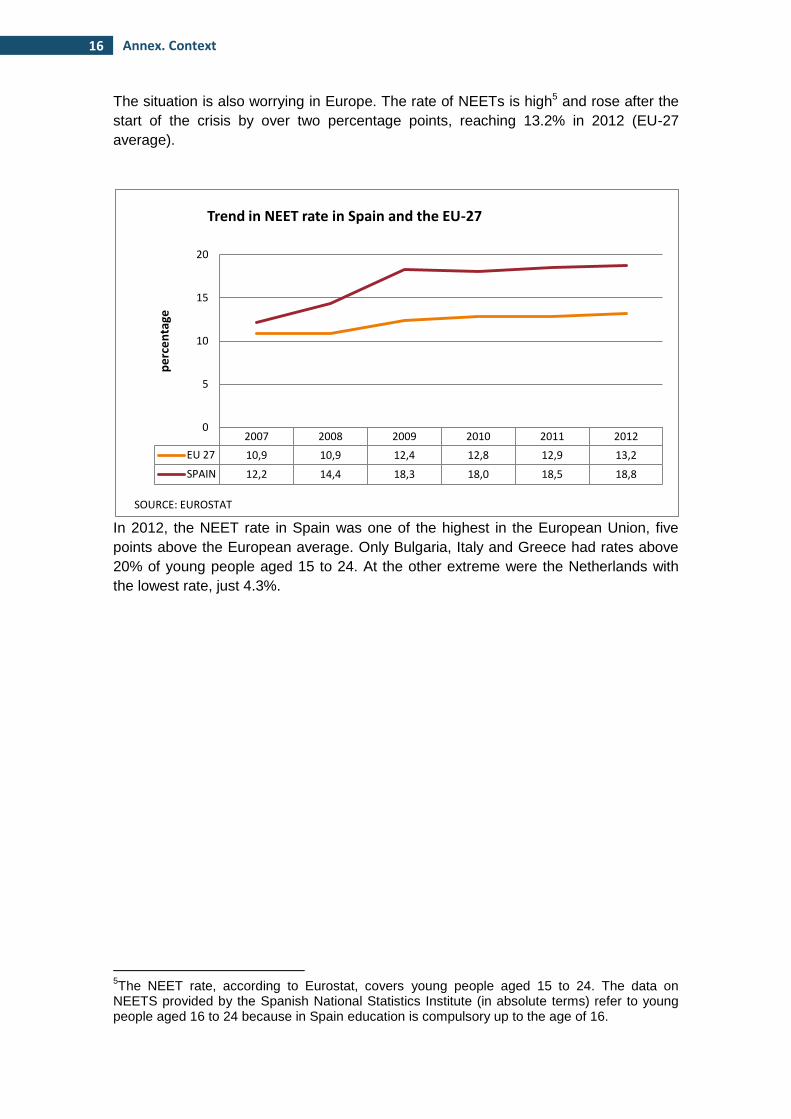
The crisis affected this group and pushed their numbers up steeply as from 2007 to a
peak in 2009, when the figure rose from 729,000 NEETs in 2008 to over 900,000 (an
increase of 19%). Since then, the growth has levelled off although the figure is still
high, with a total of 858,200 in 2012.
4.156.100 YOUTH PEOPLE 16-24 YEARS
2.378.500 INACTIVES
(57,2% youth population)
1.777.600 ACTIVES
(42,8% youth population)
2.131.100 STUDENTS: not seeking a job because they
are studing(51,3% youth population
and 89,6% inactives)
832.700 EMPLOYED: working
(20,1% youthpopulation and 46,8% inactives)
944.925 UNEMPLOYED(want to work and are
available)(22,7% youth
population and 53,2% inactives)
NOT IN EDUCATION= NEET
334.025 NOT IN EDUCATION:36,1% youthunemployed=NO NINIS
610.900 NOT IN EDUCATION:63,8% youthunemployed
=NEET
858.200 NEET´s: youth people between 16-24 unemployed or inactives and not in education or training (formal or non-formal training)
Economically Active
Population Survey
(EAPS)
2012 data
247.300 INACTIVES NOT STUDENTS: not seeking for
other reasons: being disabled, being dedicated to house work, think that they
will not find…(5,8% youth people and
10,2% inactives)
2007 2008 2009 2010 2011 2012
TOTAL 619,8 729,3 903,3 864,4 864,5 858,2
0
100
200
300
400
500
600
700
800
900
1.000
tho
usa
nd
s
SOURCE: SPANISH NATIONAL STATISTICS INSTITUTE
Trend in number of NEETS aged 16-24 in Spain
16 Annex. Context
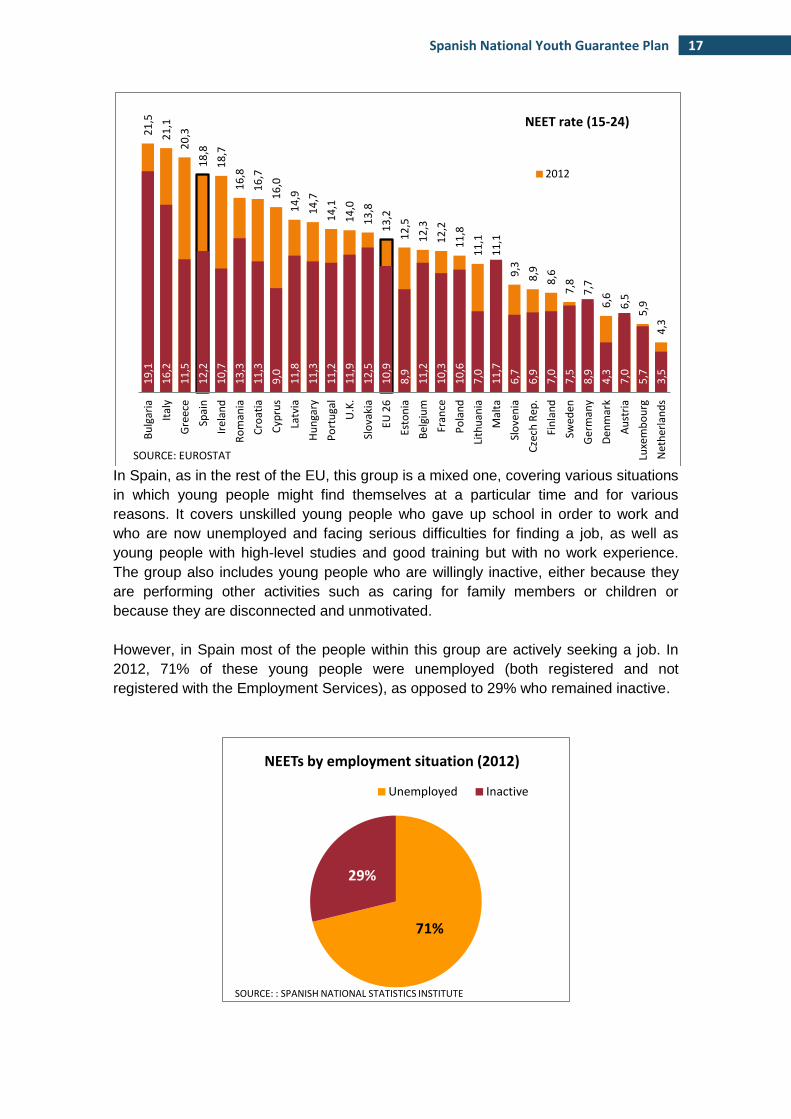
The situation is also worrying in Europe. The rate of NEETs is high5 and rose after the
start of the crisis by over two percentage points, reaching 13.2% in 2012 (EU-27
average).
In 2012, the NEET rate in Spain was one of the highest in the European Union, five
points above the European average. Only Bulgaria, Italy and Greece had rates above
20% of young people aged 15 to 24. At the other extreme were the Netherlands with
the lowest rate, just 4.3%.
5The NEET rate, according to Eurostat, covers young people aged 15 to 24. The data on
NEETS provided by the Spanish National Statistics Institute (in absolute terms) refer to young people aged 16 to 24 because in Spain education is compulsory up to the age of 16.
2007 2008 2009 2010 2011 2012
EU 27 10,9 10,9 12,4 12,8 12,9 13,2
SPAIN 12,2 14,4 18,3 18,0 18,5 18,8
0
5
10
15
20
pe
rce
nta
ge
SOURCE: EUROSTAT
Trend in NEET rate in Spain and the EU-27
17 Spanish National Youth Guarantee Plan
In Spain, as in the rest of the EU, this group is a mixed one, covering various situations
in which young people might find themselves at a particular time and for various
reasons. It covers unskilled young people who gave up school in order to work and
who are now unemployed and facing serious difficulties for finding a job, as well as
young people with high-level studies and good training but with no work experience.
The group also includes young people who are willingly inactive, either because they
are performing other activities such as caring for family members or children or
because they are disconnected and unmotivated.
However, in Spain most of the people within this group are actively seeking a job. In
2012, 71% of these young people were unemployed (both registered and not
registered with the Employment Services), as opposed to 29% who remained inactive.
21
,5
21
,1
20
,3
18
,8
18
,7
16
,8
16
,7
16
,0
14
,9
14
,7
14
,1
14
,0
13
,8
13
,2
12
,5
12
,3
12
,2
11
,8
11
,1
11
,1
9,3
8,9
8,6
7,8
7,7
6,6
6,5
5,9
4,3
19
,1
16
,2
11
,5
12
,2
10
,7
13
,3
11
,3
9,0
11
,8
11
,3
11
,2
11
,9
12
,5
10
,9
8,9
11
,2
10
,3
10
,6
7,0
11
,7
6,7
6,9
7,0
7,5
8,9
4,3
7,0
5,7
3,5
Bu
lgar
ia
Ital
y
Gre
ece
Spai
n
Irel
and
Ro
man
ia
Cro
atia
Cyp
rus
Latv
ia
Hu
nga
ry
Po
rtu
gal
U.K
.
Slo
vaki
a
EU 2
6
Esto
nia
Bel
giu
m
Fran
ce
Po
lan
d
Lith
uan
ia
Mal
ta
Slo
ven
ia
Cze
ch R
ep.
Fin
lan
d
Swed
en
Ger
man
y
Den
mar
k
Au
stri
a
Luxe
mb
ou
rg
Net
her
lan
ds
SOURCE: EUROSTAT
NEET rate (15-24)
2012
71%
29%
NEETs by employment situation (2012)
Unemployed Inactive
SOURCE: : SPANISH NATIONAL STATISTICS INSTITUTE
18 Annex. Context
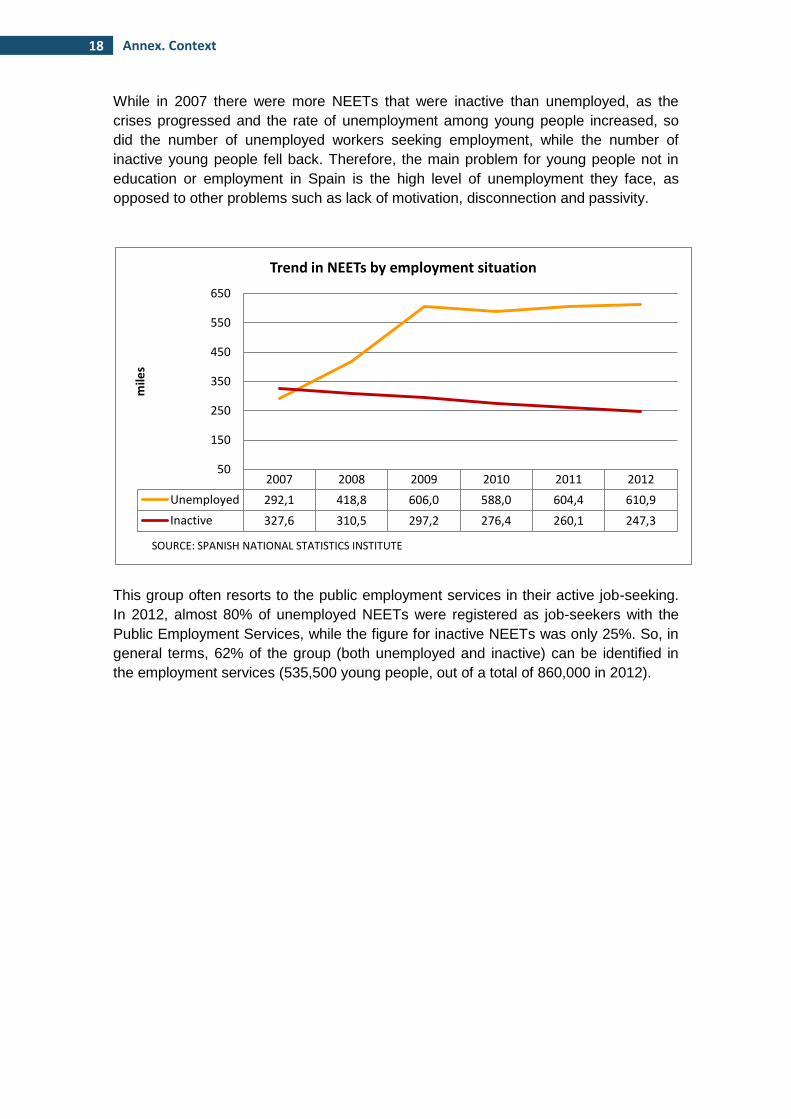
While in 2007 there were more NEETs that were inactive than unemployed, as the
crises progressed and the rate of unemployment among young people increased, so
did the number of unemployed workers seeking employment, while the number of
inactive young people fell back. Therefore, the main problem for young people not in
education or employment in Spain is the high level of unemployment they face, as
opposed to other problems such as lack of motivation, disconnection and passivity.
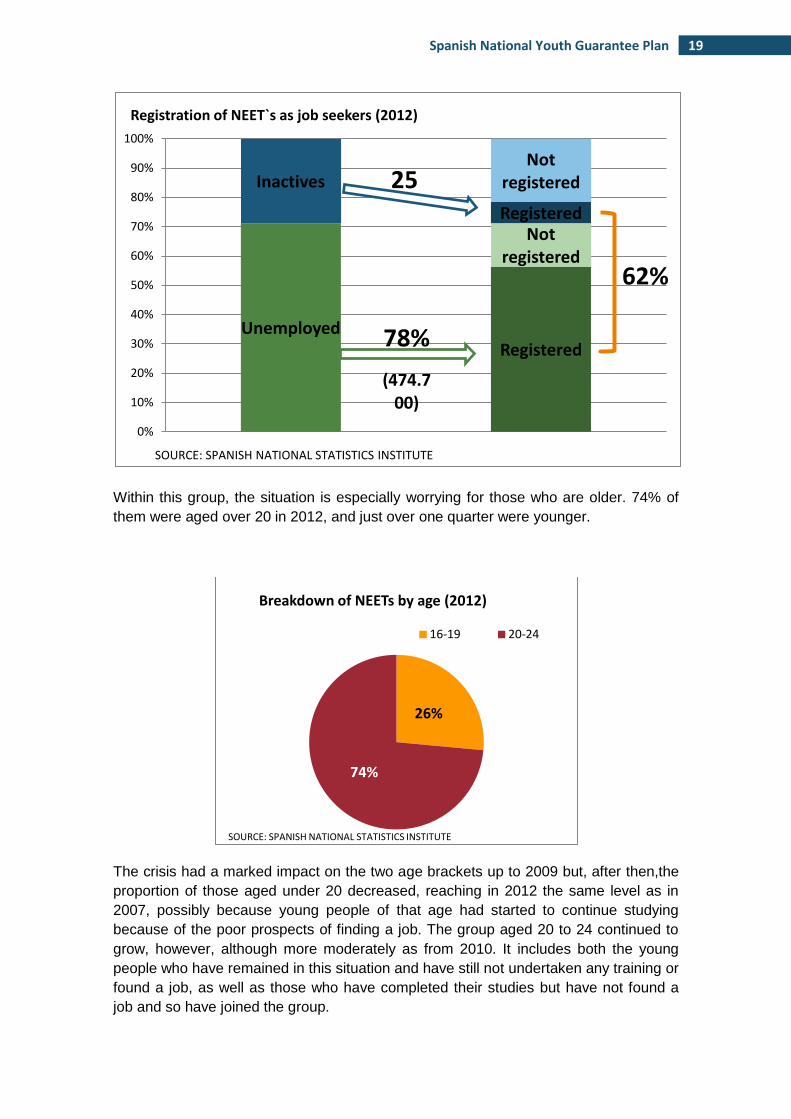
This group often resorts to the public employment services in their active job-seeking.
In 2012, almost 80% of unemployed NEETs were registered as job-seekers with the
Public Employment Services, while the figure for inactive NEETs was only 25%. So, in
general terms, 62% of the group (both unemployed and inactive) can be identified in
the employment services (535,500 young people, out of a total of 860,000 in 2012).
2007 2008 2009 2010 2011 2012
Unemployed 292,1 418,8 606,0 588,0 604,4 610,9
Inactive 327,6 310,5 297,2 276,4 260,1 247,3
50
150
250
350
450
550
650
mile
s
SOURCE: SPANISH NATIONAL STATISTICS INSTITUTE
Trend in NEETs by employment situation
19 Spanish National Youth Guarantee Plan
Within this group, the situation is especially worrying for those who are older. 74% of
them were aged over 20 in 2012, and just over one quarter were younger.
The crisis had a marked impact on the two age brackets up to 2009 but, after then,the
proportion of those aged under 20 decreased, reaching in 2012 the same level as in
2007, possibly because young people of that age had started to continue studying
because of the poor prospects of finding a job. The group aged 20 to 24 continued to
grow, however, although more moderately as from 2010. It includes both the young
people who have remained in this situation and have still not undertaken any training or
found a job, as well as those who have completed their studies but have not found a
job and so have joined the group.
Unemployed Registered
Not registered
Inactives
Registered
Not registered
0%
10%
20%
30%
40%
50%
60%
70%
80%
90%
100%
SOURCE: SPANISH NATIONAL STATISTICS INSTITUTE
Registration of NEET`s as job seekers (2012)
25
78%
(474.700)
62%
26%
74%
Breakdown of NEETs by age (2012)
16-19 20-24
SOURCE: SPANISH NATIONAL STATISTICS INSTITUTE
20 Annex. Context
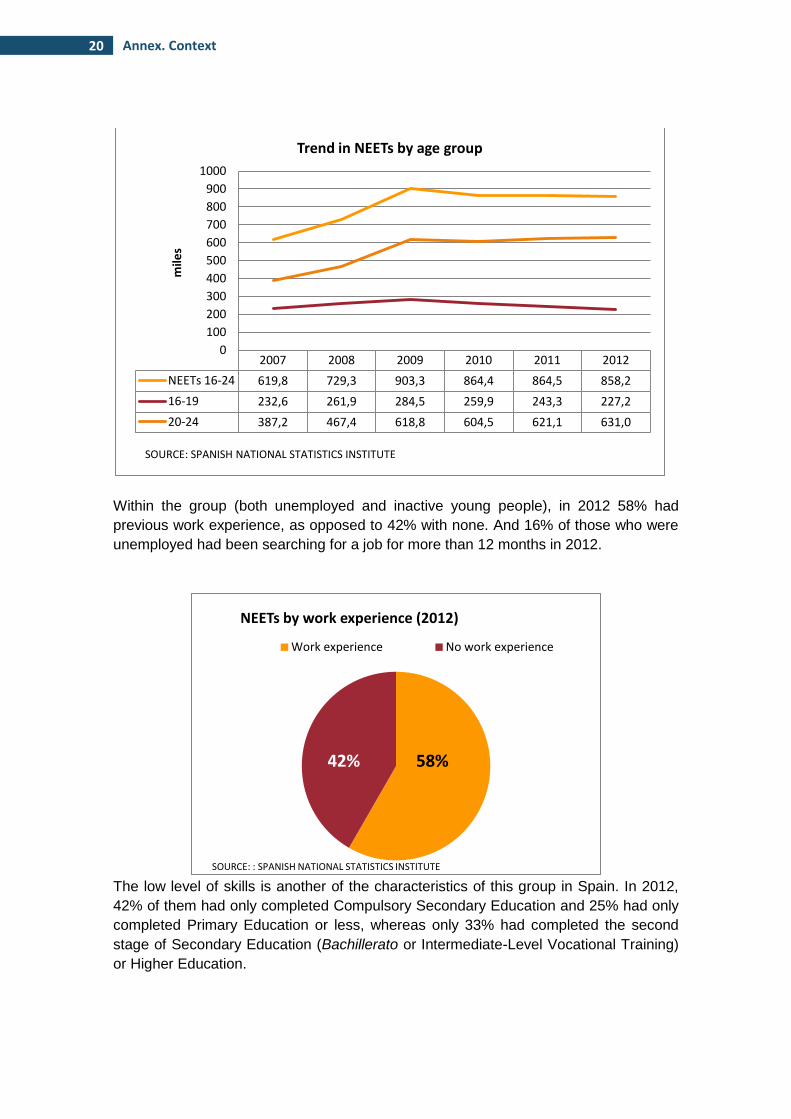
Within the group (both unemployed and inactive young people), in 2012 58% had
previous work experience, as opposed to 42% with none. And 16% of those who were
unemployed had been searching for a job for more than 12 months in 2012.
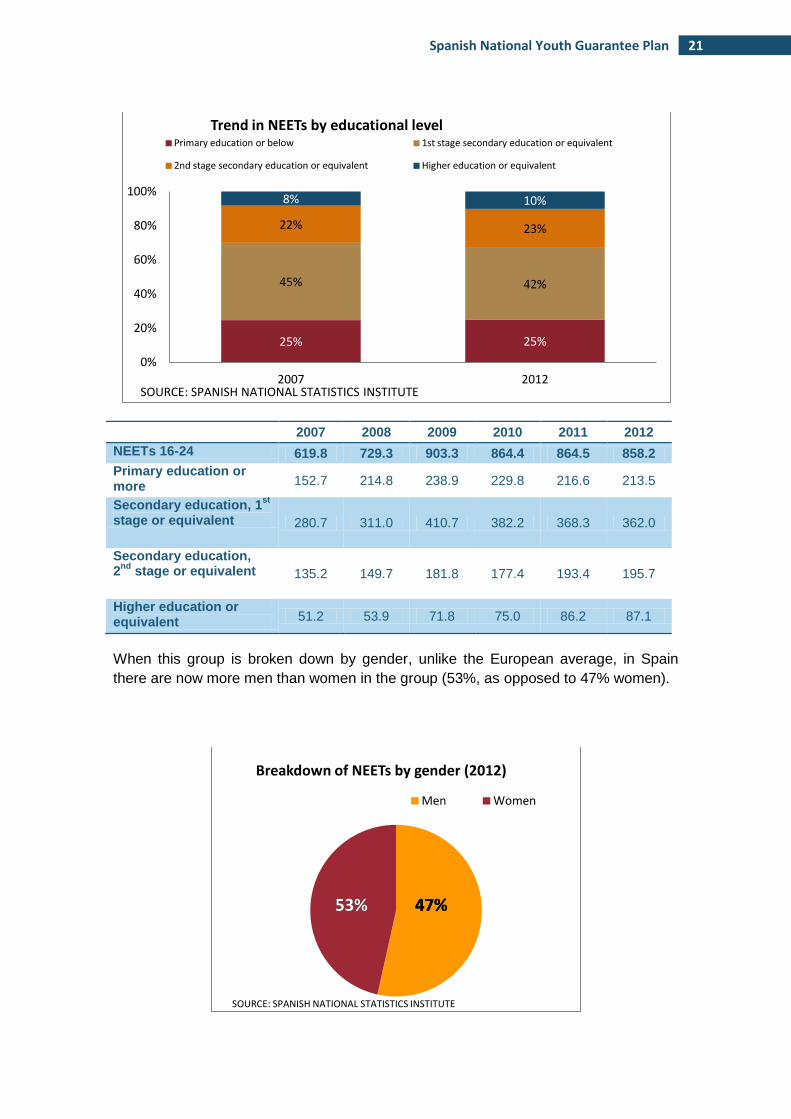
The low level of skills is another of the characteristics of this group in Spain. In 2012,
42% of them had only completed Compulsory Secondary Education and 25% had only
completed Primary Education or less, whereas only 33% had completed the second
stage of Secondary Education (Bachillerato or Intermediate-Level Vocational Training)
or Higher Education.
2007 2008 2009 2010 2011 2012
NEETs 16-24 619,8 729,3 903,3 864,4 864,5 858,2
16-19 232,6 261,9 284,5 259,9 243,3 227,2
20-24 387,2 467,4 618,8 604,5 621,1 631,0
0
100
200
300
400
500
600
700
800
900
1000 m
iles
SOURCE: SPANISH NATIONAL STATISTICS INSTITUTE
Trend in NEETs by age group
NEETs by work experience (2012)
Work experience No work experience
SOURCE: : SPANISH NATIONAL STATISTICS INSTITUTE
42% 58%
21 Spanish National Youth Guarantee Plan
2007 2008 2009 2010 2011 2012
NEETs 16-24 619.8 729.3 903.3 864.4 864.5 858.2
Primary education or more 152.7 214.8 238.9 229.8 216.6 213.5
Secondary education, 1st
stage or equivalent 280.7 311.0 410.7 382.2 368.3 362.0
Secondary education, 2
nd stage or equivalent 135.2 149.7 181.8 177.4 193.4 195.7
Higher education or equivalent 51.2 53.9 71.8 75.0 86.2 87.1
When this group is broken down by gender, unlike the European average, in Spain
there are now more men than women in the group (53%, as opposed to 47% women).
25% 25%
45% 42%
22% 23%
8% 10%
0%
20%
40%
60%
80%
100%
2007 2012 SOURCE: SPANISH NATIONAL STATISTICS INSTITUTE
Trend in NEETs by educational level Primary education or below 1st stage secondary education or equivalent
2nd stage secondary education or equivalent Higher education or equivalent
Breakdown of NEETs by gender (2012)
Men Women
53% 47%
SOURCE: SPANISH NATIONAL STATISTICS INSTITUTE
53% 47%
22 Annex. Context
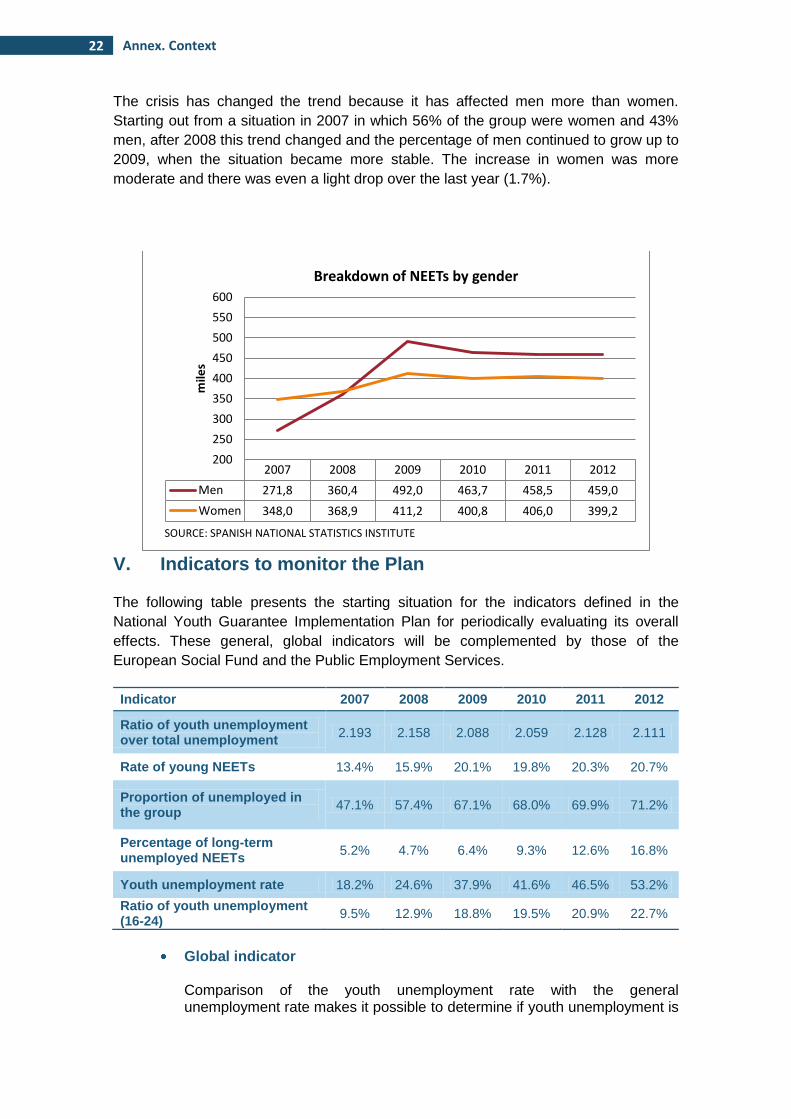
The crisis has changed the trend because it has affected men more than women.
Starting out from a situation in 2007 in which 56% of the group were women and 43%
men, after 2008 this trend changed and the percentage of men continued to grow up to
2009, when the situation became more stable. The increase in women was more
moderate and there was even a light drop over the last year (1.7%).
V. Indicators to monitor the Plan
The following table presents the starting situation for the indicators defined in the
National Youth Guarantee Implementation Plan for periodically evaluating its overall
effects. These general, global indicators will be complemented by those of the
European Social Fund and the Public Employment Services.
Indicator 2007 2008 2009 2010 2011 2012
Ratio of youth unemployment over total unemployment
2.193 2.158 2.088 2.059 2.128 2.111
Rate of young NEETs 13.4% 15.9% 20.1% 19.8% 20.3% 20.7%
Proportion of unemployed in the group
47.1% 57.4% 67.1% 68.0% 69.9% 71.2%
Percentage of long-term unemployed NEETs
5.2% 4.7% 6.4% 9.3% 12.6% 16.8%
Youth unemployment rate 18.2% 24.6% 37.9% 41.6% 46.5% 53.2%
Ratio of youth unemployment (16-24)
9.5% 12.9% 18.8% 19.5% 20.9% 22.7%
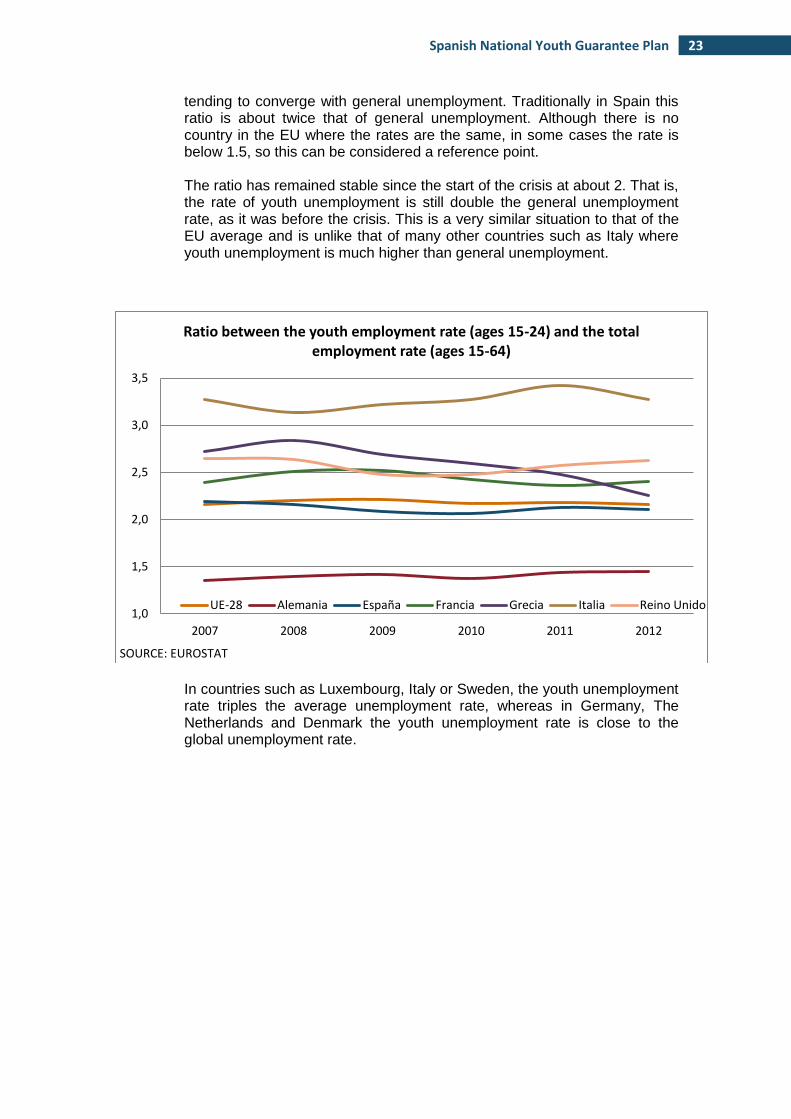
Global indicator Comparison of the youth unemployment rate with the general unemployment rate makes it possible to determine if youth unemployment is
2007 2008 2009 2010 2011 2012
Men 271,8 360,4 492,0 463,7 458,5 459,0
Women 348,0 368,9 411,2 400,8 406,0 399,2
200
250
300
350
400
450
500
550
600
mile
s
SOURCE: SPANISH NATIONAL STATISTICS INSTITUTE
Breakdown of NEETs by gender
23 Spanish National Youth Guarantee Plan
tending to converge with general unemployment. Traditionally in Spain this ratio is about twice that of general unemployment. Although there is no country in the EU where the rates are the same, in some cases the rate is below 1.5, so this can be considered a reference point. The ratio has remained stable since the start of the crisis at about 2. That is, the rate of youth unemployment is still double the general unemployment rate, as it was before the crisis. This is a very similar situation to that of the EU average and is unlike that of many other countries such as Italy where youth unemployment is much higher than general unemployment.
In countries such as Luxembourg, Italy or Sweden, the youth unemployment rate triples the average unemployment rate, whereas in Germany, The Netherlands and Denmark the youth unemployment rate is close to the global unemployment rate.
1,0
1,5
2,0
2,5
3,0
3,5
2007 2008 2009 2010 2011 2012
SOURCE: EUROSTAT
Ratio between the youth employment rate (ages 15-24) and the total employment rate (ages 15-64)
UE-28 Alemania España Francia Grecia Italia Reino Unido
24 Annex. Context
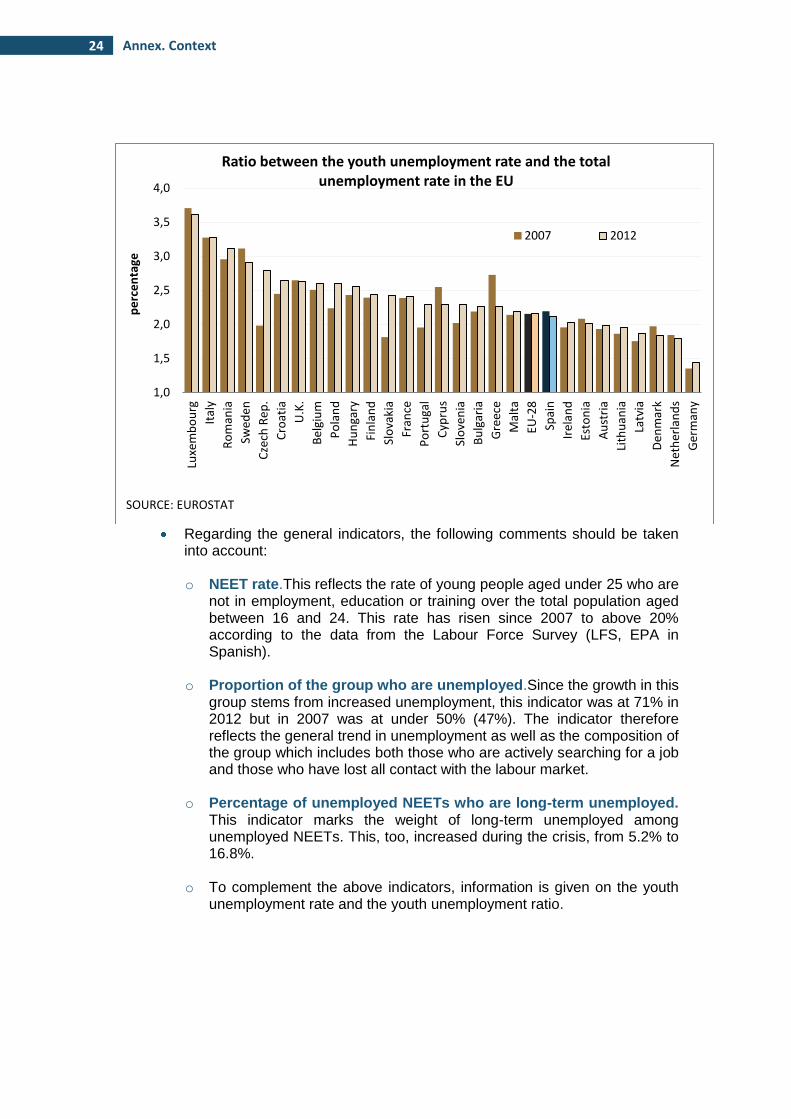
Regarding the general indicators, the following comments should be taken
into account:
o NEET rate.This reflects the rate of young people aged under 25 who are not in employment, education or training over the total population aged between 16 and 24. This rate has risen since 2007 to above 20% according to the data from the Labour Force Survey (LFS, EPA in Spanish).
o Proportion of the group who are unemployed.Since the growth in this
group stems from increased unemployment, this indicator was at 71% in 2012 but in 2007 was at under 50% (47%). The indicator therefore reflects the general trend in unemployment as well as the composition of the group which includes both those who are actively searching for a job and those who have lost all contact with the labour market.
o Percentage of unemployed NEETs who are long-term unemployed.
This indicator marks the weight of long-term unemployed among unemployed NEETs. This, too, increased during the crisis, from 5.2% to 16.8%.
o To complement the above indicators, information is given on the youth
unemployment rate and the youth unemployment ratio.
1,0
1,5
2,0
2,5
3,0
3,5
4,0 Lu
xem
bo
urg
Ital
y
Ro
man
ia
Swed
en
Cze
ch R
ep.
Cro
atia
U.K
.
Bel
giu
m
Po
lan
d
Hu
nga
ry
Fin
lan
d
Slo
vaki
a
Fran
ce
Po
rtu
gal
Cyp
rus
Slo
ven
ia
Bu
lgar
ia
Gre
ece
Mal
ta
EU-2
8
Spai
n
Irel
and
Esto
nia
Au
stri
a
Lith
uan
ia
Latv
ia
Den
mar
k
Net
her
lan
ds
Ger
man
y
pe
rce
nta
ge
SOURCE: EUROSTAT
Ratio between the youth unemployment rate and the total unemployment rate in the EU
2007 2012
25 Spanish National Youth Guarantee Plan
VI. Methodological note on data on young people not in
education, employment or training
For the purpose of the analyses used in this report, the „NEET‟ concept is defined
according to the Eurostat methodology.
In April 2010, the European Union Employment Committee established, in line with
Eurostat, a common definition for young NEETs (“neither in employment, nor in any
education and training”) in order to be able to analyse the situation of this group in the
different Member States, to make comparisons and follow trends as well as to use it in
the context of the Europe 2020 Strategy.
This concept of young NEET (known in Spain, as „ninis’) covers:
Young unemployed persons, in line with the ILO definition of unemployed, who
neither study nor are undergoing any type of training.
Young inactive persons, in line with the ILO definition, who neither study nor are
undergoing any type of training.
Based on this definition, Eurostat has drawn up the NEET rate which gives the
percentage of young people aged 15 to 24 who do not work (being either unemployed
or inactive) and who are not undergoing any type of training out of the total population
of that age. It must be remembered that the NEET rate takes into account all young
people aged 15 to 24 and not only those who are currently active, which is the case for
calculating the rate of youth unemployment.
These parameters were followed for determining, on the basis of the information
provided by the Spanish National Statistics Institute from its Labour Force Survey (EPA
in Spanish), the number of people within this group who are neither in employment nor
in any type of education or training.
So, the number of young people aged 16-24 who are not in employment (that is, they
are unemployed or inactive) nor in any type of education or training, either official or
unofficial, was calculated on the basis of data from the Labour Force Survey.
That is, the group was delimited according to the following criteria:
Employment criterion
The following were considered to be not in employment:
a) The unemployed, that is, young people meeting both of the following conditions:
Not working in the week referred to (the calendar week immediately before
that of the interview, from Monday to Sunday), that is, neither employed nor
self-employed.
26 Annex. Context
Seeking a job during the four weeks prior to the date of the interview, either
through specific measures to seek employment or arrangements to set up
self-employment.
Available to work within a period of two weeks as from the Sunday of the
week referred to.
b) Inactive young persons, that is those not classified as unemployed or employed
during the week referred to.
Training criterion
Apart from not being in employment, the young person must not be undergoing any
type of training during the four weeks prior to the interview, whether official (any type of
study or training forming part of official studies) or unofficial (studies or training not
forming part of official plans, including courses given by private academies, courses
given in the workplace, courses for the unemployed, seminars, lectures, private tuition,
etc.).
The age of the interviewee is that on the last day (Sunday) of the week referred to. In
addition, they are not required to be registered as job-seekers and their level of studies
is not taken into account.