Embed Size (px)
Citation preview
2013 Rankings Michigan

County Health Rankings 2013: Michigan
www.countyhealthrankings.org/michigan 1
Introduction Where we live matters to our health. The health of a community depends on many different factors, including the environment, education and jobs, access to and quality of healthcare, and individual behaviors. We can improve a community’s health by implementing effective policies and programs. For example, people who live in communities with smoke‐free laws are less likely to smoke or to be exposed to second‐hand smoke, which reduces lung cancer risk. In addition, people who live in communities with safe and accessible park and recreation space are more likely to exercise, which reduces heart disease risk. However, health varies greatly across communities, with some places being much healthier than others. And, until now, there has been no standard method to illustrate what we know about what makes people sick or healthy or a central resource to identify what we can do to create healthier places to live, learn, work and play. We know that much of what influences our health happens outside of the doctor’s office – in our schools, workplaces and neighborhoods. The County Health Rankings & Roadmaps program provides information on the overall health of your community and provides the tools necessary to create community‐based, evidence‐informed solutions. Ranking the health of nearly every county across the nation, the County Health Rankings illustrate what we know when it comes to what is making communities sick or healthy. The County Health Roadmaps show what we can do to create healthier places to live, learn, work and play. The Robert Wood Johnson Foundation collaborates with the University of Wisconsin
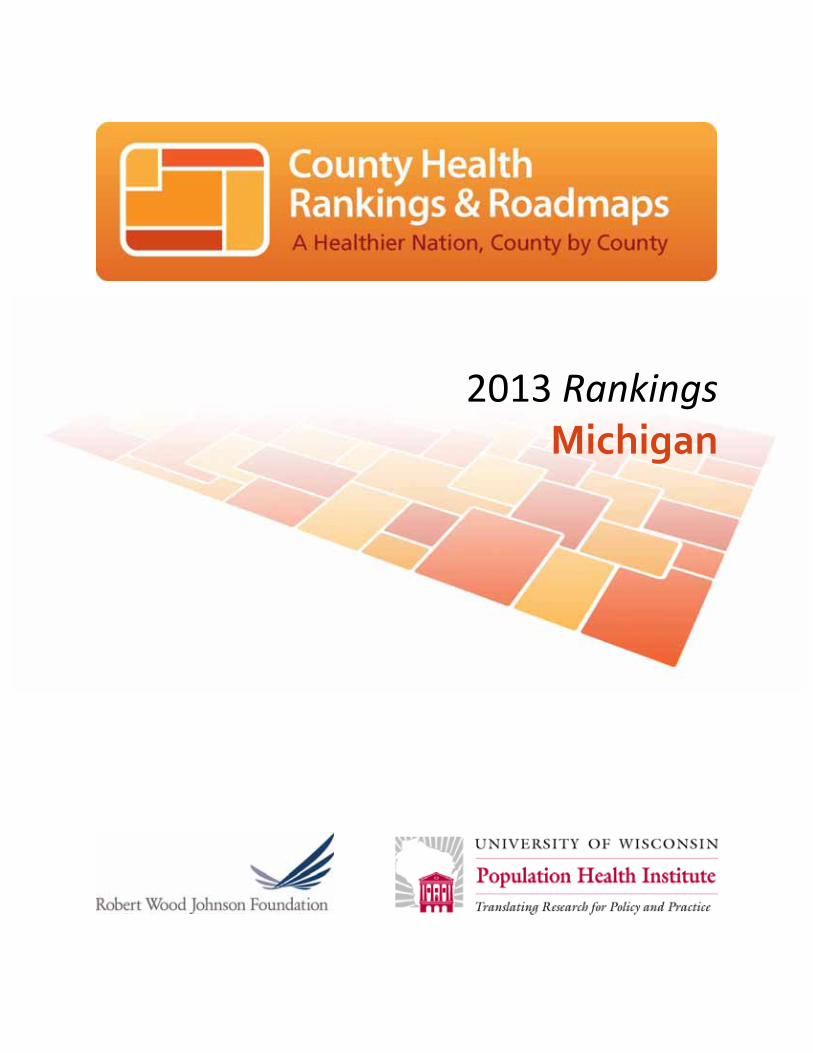
Population Health Institute to bring this groundbreaking program to counties and states across the nation. The County Health Rankings & Roadmaps program includes the County Health Rankings project, launched in 2010, and the newer Roadmaps project that mobilizes local communities, national partners and leaders across all sectors to improve health. The program is based on this model of population health improvement:
In this model, health outcomes are measures that describe the current health status of a county. These health outcomes are influenced by a set of health factors. Counties can improve health outcomes by addressing all health factors with effective, evidence‐informed policies and programs. Everyone has a stake in community health. We all need to work together to find solutions. The County Health Rankings & Roadmaps serve as both a call to action and a needed tool in this effort.
Guide to Our Web Site To compile the Rankings, we selected measures that reflect important aspects of population health that can be improved and are available at the county level across the nation. Visit www.countyhealthrankings.org to learn more. To get started and see data, enter your county or state name in the search box. Click on the name of a county or measure to see more details. You can: Compare Counties; Download data for your state; Print one or more county
snapshots; or Share information with others via Facebook, Twitter, or Google+. To understand our methods, click on Learn about the Data and Methods. You can also take advantage of the Using the Rankings Data guide to help you explore the data and figure out more about what is driving your community’s health. To learn about what you can do to improve health in your community, visit the Roadmaps to Health Action Center. Finally, you can learn what others are doing by reading Communities Stories and visiting the Project Showcase.

County Health Rankings 2013: Michigan
2 www.countyhealthrankings.org/michigan
County Health Roadmaps The Rankings illustrate what we know when it comes to making people sick or healthy. The County Health Rankings confirm the critical role that factors such as education, jobs, income and the environment play in how healthy people are and how long we live. The County Health Roadmaps mobilizes local communities, national partners and leaders across all sectors to improve health. The County Health Roadmaps show what we can do to create healthier places to live, learn, work and play. The Robert Wood Johnson Foundation (RWJF) collaborates with the University of Wisconsin Population Health Institute (UWPHI) to bring this groundbreaking project to cities, counties and states across the nation. The Roadmaps project includes grants to local coalitions and partnerships among policymakers, business, education, public health, health care, and community organizations; grants to national organizations working to improve health; recognition of communities whose promising efforts have led to better health; and customized guidance on strategies to improve health. Roadmaps to Health Community Grants The Roadmaps to Health Community Grants provide funding for 2 years to thirty state and local efforts among policymakers, business, education, healthcare, public health and community organizations working to create positive policy or systems changes that address the social and economic factors that influence the health of people in their community. Roadmaps to Health Partner Grants RWJF is awarding Roadmaps to Health Partner Grants to national organizations that are experienced at engaging local partners and leaders and are able to deliver high‐quality training and technical assistance, and committed to making communities healthier places to live, learn, work and play. Partner grantees increase awareness about the County Health Rankings & Roadmaps to their members, affiliates and allies. As of February 2013, RWJF has awarded partner grants to United Way Worldwide, National Business Coalition on Health, and National Association of Counties.
RWJF Roadmaps to Health Prize In February 2013, RWJF awarded the first RWJF Roadmaps to Health Prizes of $25,000 to six communities that are working to become healthier places to live, learn, work and play. The RWJF Roadmaps to Health Prize is intended not only to honor successful efforts, but also to inspire and stimulate similar activities in other U.S. communities.
Roadmaps to Health Action Center The Roadmaps to Health Action Center, based at UWPHI, provides tools and guidance to help groups working to make their communities healthier places. The Action Center website provides guidance on developing strategies and advocacy efforts to advance pro‐health policies, opportunities for ongoing learning, and a searchable database of evidence‐informed policies and programs focused on health improvement: What Works for Health. Action Center staff provide customized consultation via email and telephone to those seeking more information about how to improve health. Coaching, including possible on‐site visits, is also available for communities who have demonstrated the willingness and capacity to address factors that we know influence how healthy a person is, such as education, income and family connectedness.
County Health Rankings 2013: Michigan
www.countyhealthrankings.org/michigan 3
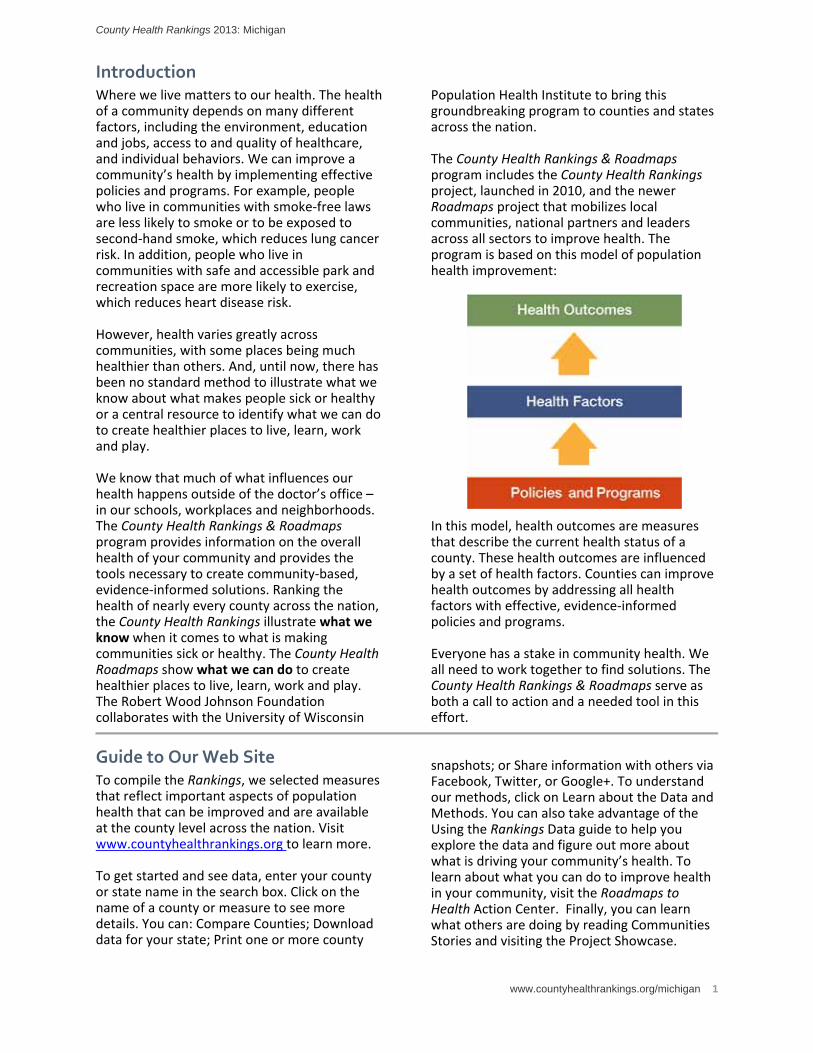
County Health Rankings The 2013 County Health Rankings report ranks Michigan counties according to their summary measures of health outcomes and health factors. Counties also receive a rank for mortality, morbidity, health behaviors, clinical care, social and economic factors, and the physical environment. The figure below depicts the structure of the Rankings model; those having high ranks (e.g., 1 or 2) are estimated to be the “healthiest.”
Our summary health outcomes rankings are based on an equal weighting of mortality and morbidity measures. The summary health factors rankings are based on weighted scores of four types of factors: behavioral, clinical, social and economic, and environmental. The weights for the factors (shown in parentheses in the figure) are based upon a review of the literature and expert input, but represent just one way of combining these factors.

County Health Rankings 2013: Michigan
4 www.countyhealthrankings.org/michigan
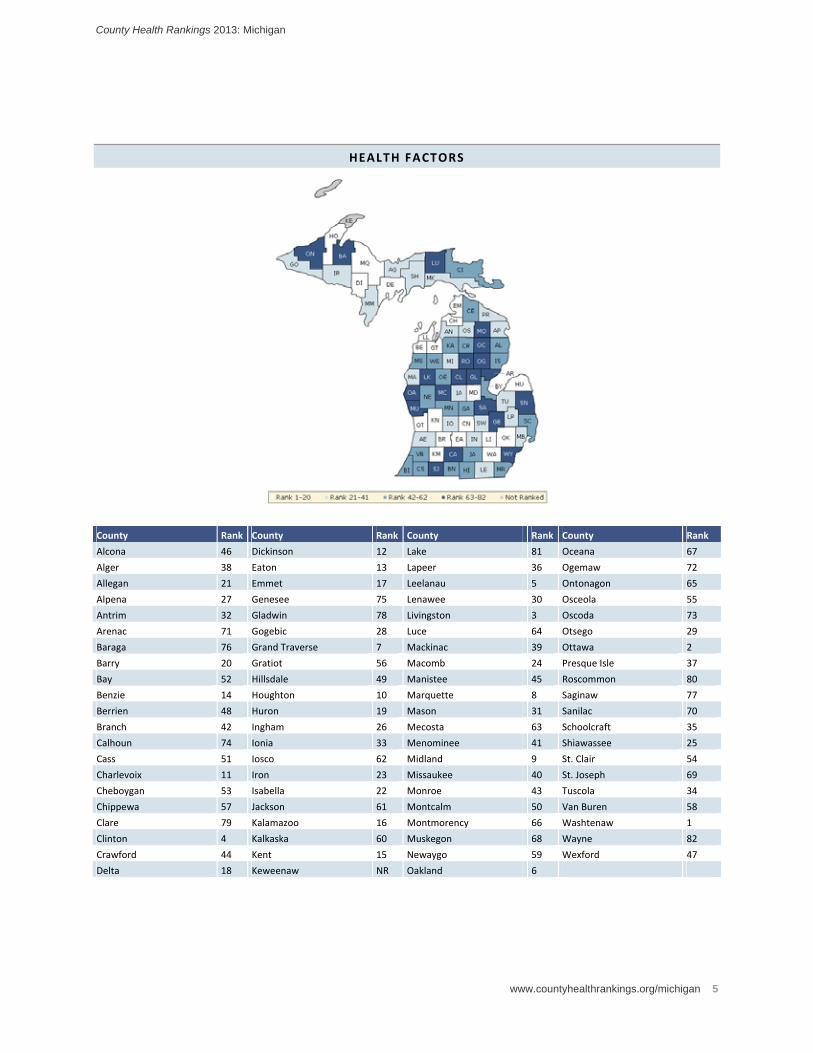
The maps on this page and the next display Michigan’s counties divided into groups by health rank. Maps help locate the healthiest and least healthy counties in the state. The lighter colors indicate better performance in the respective
summary rankings. The green map shows the distribution of summary health outcomes. The blue displays the distribution of the summary rank for health factors.
HEALTH OUTCOMES
County Rank County Rank County Rank County Rank
Alcona 81 Dickinson 29 Lake 59 Oceana 64
Alger 6 Eaton 13 Lapeer 31 Ogemaw 51
Allegan 11 Emmet 15 Leelanau 1 Ontonagon 65
Alpena 77 Genesee 80 Lenawee 19 Osceola 34
Antrim 45 Gladwin 73 Livingston 4 Oscoda 72
Arenac 79 Gogebic 35 Luce 66 Otsego 28
Baraga 30 Grand Traverse 7 Mackinac 40 Ottawa 2
Barry 20 Gratiot 49 Macomb 43 Presque Isle 70
Bay 53 Hillsdale 38 Manistee 58 Roscommon 71
Benzie 9 Houghton 10 Marquette 17 Saginaw 74
Berrien 60 Huron 42 Mason 55 Sanilac 32
Branch 47 Ingham 36 Mecosta 21 Schoolcraft 57
Calhoun 78 Ionia 26 Menominee 23 Shiawassee 41
Cass 44 Iosco 61 Midland 12 St. Clair 67
Charlevoix 8 Iron 50 Missaukee 33 St. Joseph 63
Cheboygan 18 Isabella 14 Monroe 37 Tuscola 39
Chippewa 25 Jackson 48 Montcalm 27 Van Buren 52
Clare 75 Kalamazoo 46 Montmorency 68 Washtenaw 5
Clinton 3 Kalkaska 76 Muskegon 69 Wayne 82
Crawford 62 Kent 16 Newaygo 54 Wexford 56
Delta 24 Keweenaw NR Oakland 22
County Health Rankings 2013: Michigan
www.countyhealthrankings.org/michigan 5
HEALTH FACTORS
County Rank County Rank County Rank County Rank
Alcona 46 Dickinson 12 Lake 81 Oceana 67
Alger 38 Eaton 13 Lapeer 36 Ogemaw 72
Allegan 21 Emmet 17 Leelanau 5 Ontonagon 65
Alpena 27 Genesee 75 Lenawee 30 Osceola 55
Antrim 32 Gladwin 78 Livingston 3 Oscoda 73
Arenac 71 Gogebic 28 Luce 64 Otsego 29
Baraga 76 Grand Traverse 7 Mackinac 39 Ottawa 2
Barry 20 Gratiot 56 Macomb 24 Presque Isle 37
Bay 52 Hillsdale 49 Manistee 45 Roscommon 80
Benzie 14 Houghton 10 Marquette 8 Saginaw 77
Berrien 48 Huron 19 Mason 31 Sanilac 70
Branch 42 Ingham 26 Mecosta 63 Schoolcraft 35
Calhoun 74 Ionia 33 Menominee 41 Shiawassee 25
Cass 51 Iosco 62 Midland 9 St. Clair 54
Charlevoix 11 Iron 23 Missaukee 40 St. Joseph 69
Cheboygan 53 Isabella 22 Monroe 43 Tuscola 34
Chippewa 57 Jackson 61 Montcalm 50 Van Buren 58
Clare 79 Kalamazoo 16 Montmorency 66 Washtenaw 1
Clinton 4 Kalkaska 60 Muskegon 68 Wayne 82
Crawford 44 Kent 15 Newaygo 59 Wexford 47
Delta 18 Keweenaw NR Oakland 6

County Health Rankings 2013: Michigan
6 www.countyhealthrankings.org/michigan
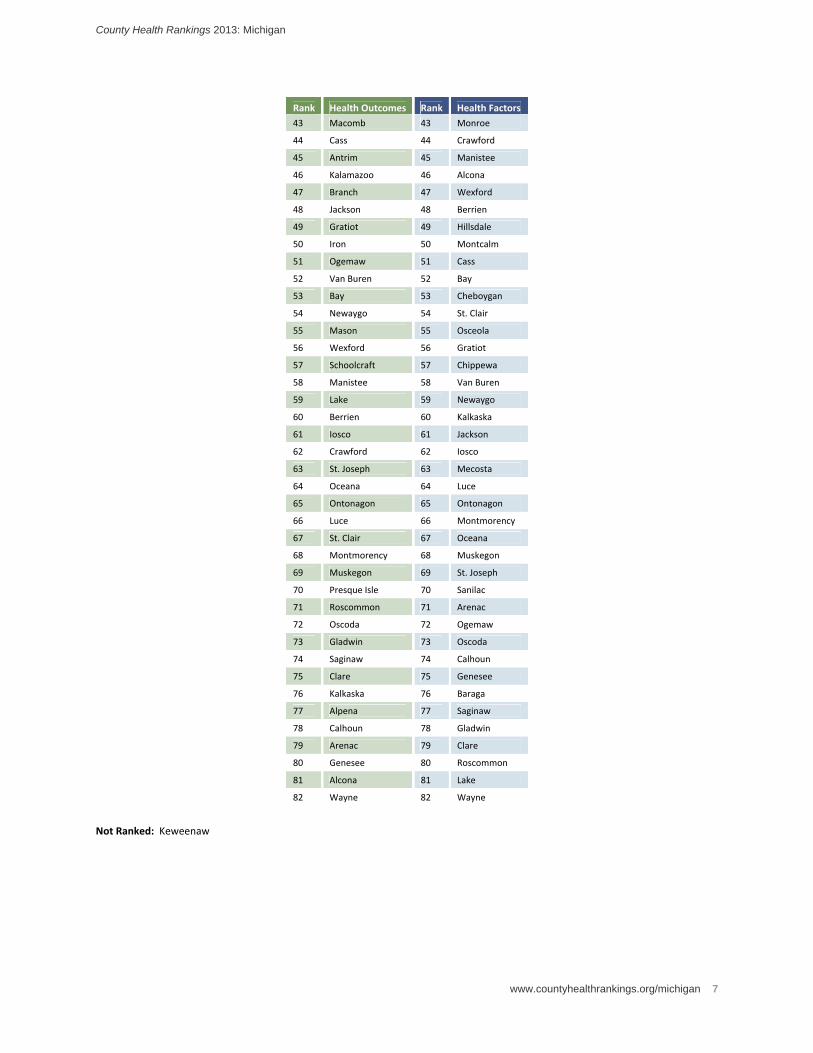
Summary Health Outcomes & Health Factors Rankings Counties receive two summary ranks: Health Outcomes Health Factors
Each of these ranks represents a weighted summary of a number of measures.
Health outcomes represent how healthy a county is while health factors represent what influences the health of the county.
Rank Health Outcomes Rank Health Factors
1 Leelanau 1 Washtenaw
2 Ottawa 2 Ottawa
3 Clinton 3 Livingston
4 Livingston 4 Clinton
5 Washtenaw 5 Leelanau
6 Alger 6 Oakland
7 Grand Traverse 7 Grand Traverse
8 Charlevoix 8 Marquette
9 Benzie 9 Midland
10 Houghton 10 Houghton
11 Allegan 11 Charlevoix
12 Midland 12 Dickinson
13 Eaton 13 Eaton
14 Isabella 14 Benzie
15 Emmet 15 Kent
16 Kent 16 Kalamazoo
17 Marquette 17 Emmet
18 Cheboygan 18 Delta
19 Lenawee 19 Huron
20 Barry 20 Barry
21 Mecosta 21 Allegan
22 Oakland 22 Isabella
23 Menominee 23 Iron
24 Delta 24 Macomb
25 Chippewa 25 Shiawassee
26 Ionia 26 Ingham
27 Montcalm 27 Alpena
28 Otsego 28 Gogebic
29 Dickinson 29 Otsego
30 Baraga 30 Lenawee
31 Lapeer 31 Mason
32 Sanilac 32 Antrim
33 Missaukee 33 Ionia
34 Osceola 34 Tuscola
35 Gogebic 35 Schoolcraft
36 Ingham 36 Lapeer
37 Monroe 37 Presque Isle
38 Hillsdale 38 Alger
39 Tuscola 39 Mackinac
40 Mackinac 40 Missaukee
41 Shiawassee 41 Menominee
42 Huron 42 Branch
County Health Rankings 2013: Michigan
www.countyhealthrankings.org/michigan 7
Rank Health Outcomes Rank Health Factors
43 Macomb 43 Monroe
44 Cass 44 Crawford
45 Antrim 45 Manistee
46 Kalamazoo 46 Alcona
47 Branch 47 Wexford
48 Jackson 48 Berrien
49 Gratiot 49 Hillsdale
50 Iron 50 Montcalm
51 Ogemaw 51 Cass
52 Van Buren 52 Bay
53 Bay 53 Cheboygan
54 Newaygo 54 St. Clair
55 Mason 55 Osceola
56 Wexford 56 Gratiot
57 Schoolcraft 57 Chippewa
58 Manistee 58 Van Buren
59 Lake 59 Newaygo
60 Berrien 60 Kalkaska
61 Iosco 61 Jackson
62 Crawford 62 Iosco
63 St. Joseph 63 Mecosta
64 Oceana 64 Luce
65 Ontonagon 65 Ontonagon
66 Luce 66 Montmorency
67 St. Clair 67 Oceana
68 Montmorency 68 Muskegon
69 Muskegon 69 St. Joseph
70 Presque Isle 70 Sanilac
71 Roscommon 71 Arenac
72 Oscoda 72 Ogemaw
73 Gladwin 73 Oscoda
74 Saginaw 74 Calhoun
75 Clare 75 Genesee
76 Kalkaska 76 Baraga
77 Alpena 77 Saginaw
78 Calhoun 78 Gladwin
79 Arenac 79 Clare
80 Genesee 80 Roscommon
81 Alcona 81 Lake
82 Wayne 82 Wayne
Not Ranked: Keweenaw

County Health Rankings 2013: Michigan
8 www.countyhealthrankings.org/michigan
2013 County Health Rankings: Measures, Data Sources, and Years of Data
Measure Data Source Years of Data
HEALTH OUTCOMES
Mortality Premature death National Center for Health Statistics 2008‐2010
Morbidity Poor or fair health Behavioral Risk Factor Surveillance System 2005‐2011
Poor physical health days Behavioral Risk Factor Surveillance System 2005‐2011
Poor mental health days Behavioral Risk Factor Surveillance System 2005‐2011
Low birthweight National Center for Health Statistics 2004‐2010
HEALTH FACTORS
HEALTH BEHAVIORS
Tobacco Use Adult smoking Behavioral Risk Factor Surveillance System 2005‐2011
Diet and Exercise Adult obesity
Physical inactivity
National Center for Chronic Disease Prevention and Health Promotion
National Center for Chronic Disease Prevention and Health Promotion
2009
2009
Alcohol Use Excessive drinking Behavioral Risk Factor Surveillance System 2005‐2011
Motor vehicle crash death rate National Center for Health Statistics 2004‐2010
Sexual Activity Sexually transmitted infections National Center for HIV/AIDS, Viral Hepatitis, STD, and TB prevention
2010
Teen birth rate National Center for Health Statistics 2004‐2010
CLINICAL CARE
Access to Care Uninsured Small Area Health Insurance Estimates 2010
Primary care physicians HRSA Area Resource File 2011‐2012
Dentists HRSA Area Resource File 2011‐2012
Quality of Care Preventable hospital stays Medicare/Dartmouth Institute 2010
Diabetic screening Medicare/Dartmouth Institute 2010
Mammography screening Medicare/Dartmouth Institute 2010
SOCIAL AND ECONOMIC FACTORS
Education High school graduation Primarily state‐specific sources, supplemented with National Center for Education Statistics
State‐specific
Some college American Community Survey 2007‐2011
Employment Unemployment Bureau of Labor Statistics 2011
Income Children in poverty Small Area Income and Poverty Estimates 2011
Family and Social Support
Inadequate social support Behavioral Risk Factor Surveillance System 2005‐2010
Children in single‐parent households American Community Survey 2007‐2011
Community Safety Violent crime rate Federal Bureau of Investigation 2008‐2010
PHYSICAL ENVIRONMENT
Environmental Quality Daily fine particulate matter 1 CDC WONDER Environmental data 2008
Drinking water safety Safe Drinking Water Information System FY 2012
Built Environment Access to recreational facilities Census County Business Patterns 2010
Limited access to healthy foods USDA Food Environment Atlas 2012
Fast food restaurants Census County Business Patterns 2010
1 Not available for AK and HI.
County Health Rankings 2013: Michigan
www.countyhealthrankings.org/michigan 9
CREDITS
Report Authors University of Wisconsin‐Madison School of Medicine and Public Health Department of Population Health Sciences Population Health Institute Bridget Booske Catlin, PhD, MHSA Amanda Jovaag, MS Patrick Remington, MD, MPH This publication would not have been possible without the following contributions: Data Centers for Disease Control and Prevention: National Center for Health Statistics and Division of Behavioral Surveillance Dartmouth Institute for Health Policy & Clinical Practice Research Assistance Jennifer Buechner Hyojun Park, MA Elizabeth Pollock Jennifer Robinson Matthew Rodock, MPH Anne Roubal, MS Communications and Outreach Burness Communications Anna Graupner, MPH Kate Konkle, MPH Karen Odegaard, MPH Jan O’Neill, MPA Angela Russell, MS Julie Willems Van Dijk, PhD, RN Design Forum One, Alexandria, VA Robert Wood Johnson Foundation Abbey Cofsky, MPH –Senior Program Officer Michelle Larkin, JD, MS, RN – Assistant Vice‐President and Deputy Director, Health Group James S. Marks, MD, MPH – Senior Vice‐President and Group Director, Health Group Joe Marx – Senior Communications Officer Suggested citation: University of Wisconsin Population Health Institute. County Health Rankings 2013.
University of Wisconsin Population Health Institute 610 Walnut St, #524, Madison, WI 53726 (608) 265‐6370 / [email protected]