Embed Size (px)
Citation preview

2013 Mortgage Barometer ReportAn annual study of the mortgage market in AustraliaPrepared by Gfk Australia for QBE LMI

Note: DISCLAIMER: The information contained in this publication has been obtained from GfK Australia and does not necessarily represent the views or opinions of QBE Lenders’ Mortgage Insurance Limited (QBE LMI). This publication is provided for informational purposes only and is not intended to constitute legal, financial or other professional advice and has not been provided with regard to the investment objectives or circumstances of any particular reader. While based on information believed to be reliable, no guarantee is given that it is accurate or complete and no warranties are made by QBE LMI as to the accuracy, completeness or usefulness of any of the information in this publication. The opinions, forecasts, assumptions, estimates, derived valuations and target price(s) (if any) contained in this material are as of the date indicated and are subject to change at any time without prior notice. The information referred to may not be suitable for specific investment objectives, financial situation or individual needs of recipients and should not be relied upon in substitution for the exercise of independent judgment. Recipients should obtain their own appropriate professional advice. Neither QBE LMI nor other persons shall be liable for any direct, indirect, special, incidental, consequential, punitive or exemplary damages, including lost profits arising in any way from the information contained in this material. This material may not be reproduced, redistributed, or copied in whole or in part for any purpose without QBE LMI’s prior expressed consent. QBE Lenders’ Mortgage Insurance Limited ABN 70 000 511 071.

Table of Contents
Introduction 5Executive Summary 6Property market sentiment 7 Chart 1: Housing economic indicators 7
Chart 2: Perceptions of buying residential property 8
Chart 3: Perceptions of property pricing and affordability 9
Chart 4: Perceptions of property market value in 2013 10
Chart 5: Impact of increasing unaffordability of property on intentions to buy 10
Chart 6: Impact of an interest rate rise on you and your finances 11
Chart 7: Impact of an interest rate rise mortgage type 11
Topical influences on the property market 12 Chart 8: Reaction of banks to changes in official cash rate 12
Chart 9: Impact of the Election/extended campaign period on intention to buy 13
Chart 10: Influences on financial strain in the last 12 months 14
Chart 11: Impact of First Home Buyer grant changes on intention to buy 15
Chart 12: Impact of superannuation legislation changes on intention to buy 16
What’s happening in the mortgage market? 17 Chart 13: Actual and intended LVR by when bought/intend to purchase property 17
Chart 14: Current and intended LVR and loan size 18
Chart 15: Changes in minimum monthly mortgage repayments, ABS statistics 19
Chart 16: Reasons for applying for mortgages through a broker versus direct through the lender 20
Chart 17: Reasons for choosing a Big 4 bank over other lenders 21
What does the future mortgage market look like? 22 Chart 18: Type of property looking to buy - New developments 22
Chart 19: Type of property looking to but - Existing dwellings 23
Chart 20: Key sub-group differences 24
Methodology 25Sample profiles 26Appendix 41


5An annual study of the mortgage market in Australia
Introduction
Welcome to the third annual QBE LMI report into mortgage and property market sentiment and behaviour, Mortgage Barometer.
This report has been prepared exclusively for QBE LMI by GfK Australia, based upon a survey of 1,017 Australian target market respondents:
• current mortgage holders (Mortgagors); and
• those intending to buy residential property, either as an investment or home in the next five years (Intenders).
The survey was developed by GfK Australia in consultation with QBE LMI, and fieldwork was conducted via an online panel from May 1 to May 13, 2013. For more information on the survey sample, please see the methodology section at the end of this report.
This year the report focuses on some of the topical influences on market sentiment, but where relevant, year-on-year changes are reported. Summary statistics for key subgroups are available at the end of the report.
The information, views and opinions in this report are based on research carried out by GfK Australia and the results of the survey.

6 2013 Mortgage Barometer Report
• Propertyappetiteisincreasing– near-record-low interest rates are starting to stimulate the property market, with house prices and loan growth increasing, and more Australian adults looking to buy property in the next 12 months (26% in 2013 compared to 20% in 2012).
• Next12monthsseenastherighttimetobuy – more than a third of respondents believe prices will be higher in 2013.
• Near-recordlowsininterestratesarehavingapositiveimpact – half of current mortgage holders surveyed say cuts are a welcome relief and more than one in three Intenders are encouraged to buy sooner.
• Generalexpectationisforrobustgrowth – 47% think that property prices will increase strongly in the next three years and interest rates will stay stable (28% believe they will rise, 28% believe they will fall)
• Butaffordabilityremainsatopofmindconcern – almost half of respondents think property is overvalued despite improvements in housing affordability for the last eight quarters.
– Only one in three respondents report experiencing no financial strain.
– 69% of First Home Buyer respondents worry they’ll never be able to afford their own home.
– Mortgage strain exists for one in five Mortgagors, and may be on the rise according to the Fitch Dinkum Index1.
– Loan-to-Value Ratios (LVRs) are increasing, even though loan repayments are decreasing.
• Investmentinpropertyisincreasing – economic uncertainty in the share market and low interest rates are pushing investors back to bricks and mortar.
– Changes to superannuation legislation are likely to lead to a small increase in property ownership, particularly for those with an SMSF.
• Anumberoffactorsaredelayingmarketentry:
– The Election – an expected change of government and the lengthy campaign in 2013 are causing Intenders to hold off on buying until after the Election.
– Changes to First Home Buyer grants – the number of First Home Buyers is decreasing and two in three First Home Buyers in NSW and QLD say the changes are having an impact on their purchasing intentions.
• Whatrespondentsarelookingtobuyischanging:
– Stronger interest in new developments (new houses 35% in 2013 compared to 29% in 2012).
– Slight push in interest to city fringes.
– One in three state they would look in a different location if affordability declines.
• FinancialstabilityisstillabigsellingpointfortheBig4banks – existing relationships help retain customers, and the majority of Mortgagors are still applying for mortgages directly with the bank rather than through a broker.
1 Fitch Ratings, Sydney (April 9 2013). http://www.fitchratings.com/creditdesk/press_releases/detail.cfm?pr_id=787983
Executive Summary

7An annual study of the mortgage market in Australia
Property remains a desirable investment, with appetite for property increasing
Poor economic news from Europe and the US in recent years has cast uncertainty over the property market in Australia, with low homebuyer confidence in 2012 and ample deliberation over whether the property market would soften. Confidence appears to have turned around in 2013, with first quarter economic indicators showing about a 10% increase in consumer sentiment and time to buy dwelling indices, as well as increases in average house prices and mortgage sizes (Chart 1). This supports claims from the Reserve Bank of Australia (RBA) in April 2013 that near-record-lowinterestratesarestartingtoboosttheeconomy,withhousepricesandloangrowthincreasing2.
Chart 1: Housing economic indicators
Q1 2011 Q1 2012 Q1 2013
O�icial cash ratea 4.75% 4.25% 3.00%
HIA housing affordabilityb 55.7 64.8 68.9#
Consumer Sentiment Indexc 105.3* 94.5* 104.9*
Time to buy dwelling Indexc 108.6* 120.5* 128.4*
Average house price Index – established housesd 147.8 146.3 148.8
Average house price Index – project homesd 131.3 132.1 136.2
Average loan sized $285,500 $284,500 $301,000
# December 2012 �igure, * Figures from April
a RBA Interest Rate Decisions 20011�2013.
b HIA�Commonwealth Bank Affordability Report, December Quarter 2012
c Westpac-Melbourne Institute Survey of Consumer Sentiment, April 2013
d ABS House Price Indexes: Eight Capital Cities, Mar 2013. http://www.abs.gov.au/ausstats/[email protected]/mf/6416.0
Low interest rates and property price dips from 2010 to 2012 have had a positive effect on the appetite for property. 13.2% of Australian adults (26% of total sample) are looking to buy residential property in the next 12 months compared to 5.2% who bought in the previous 12 months, and 69% of respondents intend to purchase property in the next five years (up from 61% in 2012).
2 Kent C. Recent Developments in the Australian Housing Market (March 14 2013). http://www.rba.gov.au/speeches/2013/sp-ag-140313.html
Property market sentiment

8 2013 Mortgage Barometer Report
Property increasingly seen as a sound investment
‘’With share market volatility and low interest rates, there’s a lack of options so it’s left investors to go back to what they know best – property3’ Leith van Onselen, MacroBusiness Economist.
In 2013, significantly more respondents rated property as an effective way to quickly build wealth or as a means of funding retirement - making it the number one perceived function of property, particularly for those aged 55 and over (37% vs. 22% for all respondents). In addition, significantly fewer respondents now believe property should only be one part of a diversified portfolio (Chart 2). The slow recovery of the share market post-Global Financial Crisis (GFC) has likely had a large part to play in these perceptions, with dwelling values outperforming the ASX 200 Index on capital appreciation over the last decade to 2012, and proving to be far more stable (largest 12-month fall of 5% vs. 40%+ for shares)4.
Chart 2: Perceptions of buying residential property (2012 vs. 2013)
7% 9%
29% 17%
19%
19%
17% 22%
8% 14%
16% 17%
2012 2013
Reliable blue-chip investment
An effective way to build wealth relatively quickly
An investment to fund retirement
A home for retirement
Should only be one part of a diversi�ied asset allocation strategy
Can be risky
Base: Total sample: 2012 n=1,162, 2013 n=1,017
Now is the right time to buy; low interest rates paying off
A drop in the official cash rate to near-record lows (down 125 basis points in the year to April 2013), combined with Q1 2013 indications that property prices are on the rise, has triggered perceptions that now is the best time to buy. Oneinthree(32%)currentMortgagorsandIntendersthinkyoushouldbuyinthenextsixmonths, with half (52%) believing within the next 12 months is best (compared to 26% and 40% respectively in 2012).
For those who believe that the next year is not the best time to buy, open-ended explanations as to why often touched on the belief that house prices will drop further and/or personal financial limitations.
Ratecutshavehadapositiveimpactonthemarket, with half (53%) of current Mortgagors surveyed declaring the cuts were a welcome relief and more than one in eight (13%) saying it has made things considerably easier. This is particularly true for singles (23%), families with primary school aged children (18%) and for current Mortgagors intending to buy again (18%).
Recentratecutsarealsoencouragingfasterentryintothepropertymarket for one in three of those intending to buy in the next five years. Rate cuts are particularly motivating for those looking to invest (42%) and singles (47%). Only one in 10 potential purchasers (12%) are holding off on buying in the hope of more rate cuts. The further rate cut in May 2013 (post-survey) is likely to have further encouraged property purchase based on this data.
3 Johanson S & Vedelago C. Investors help lift property market out of the slump (May 4 2013). http://www.smh.com.au/business/investors-help-lift-property-market-out-of-the-slump-20130503-2iygh.html
4 Lawless T. Shares or Property – what’s the better performer? (November 2 1012). http://blog.rpdata.com/2012/11/shares-or-property-whats-the-better-performer/

9An annual study of the mortgage market in Australia
Despite an appetite for property, affordability is a growing concern
The Economist magazine’s 2013 global housing index5 reports that Australia has moved from the fifth to the fourth most overvalued global property market and those intending to buy property in the next five years are well aware of this. Themajorityofsurveyrespondents(59%)ratepropertyasunaffordable, with one in four stating that prices are so high they can’t afford what they want, despite measures of affordability having improved for the past eight quarters since the house price peak in mid-2010 (Chart 1).
AffordabilityisaparticularissueforFirstHomeBuyers, of whom 84% believe property prices are close to reaching or are above what they can afford, and 69% worry they’ll never be able to afford their own home (compared to 24% of all respondents).
This is a sentiment felt by the majority of survey respondents, with 82%agreeingthatfuturegenerationswillfindithardertopurchasetheirfirsthome and 70% worried about the level of debt people are getting into to buy property. Other factors contributing to concerns about affordability include foreign investment and the impact of the financial situation in Europe and the US on interest rates in Australia (Chart 3).
Chart 3: Respondents’ perception of property pricing and affordability
8%
13%
20%
24%
22%
22%
56%
38%
47%
11%
82%
70%
56%
48%
51%
47%
24%
28%
27%
72%
Future generations will �ind it harder to purchase their �irst home
I'm worried about the debt people are getting into to buy property
I'm worried foreign investment will make property unaffordable
It’s more important to get into the market now than to save a bigger deposit
I'm worried about the impact of the Europe/US �inancial situation on interest rates
I think property prices will increase strongly in the next three years
I'm worried I’ll never be able to afford my own home
I think the housing price 'bubble' will burst and prices will fall
I'd consider an interest only loan to purchase a more expensive property
I am better off owning a home than renting
Disagree Agree
Despite this sentiment, the Australian dream of home ownership is still strong with almostthreequartersofrespondentsbelievingtheyarebetteroffowningahomethanrenting, a belief supported by the current inflated rental market in Australia (Australia ranks third on The Economist rent affordability measure).
Australians are “paying double what they were 10 years ago to get into the (property) market”, despite wages rising “by half that.” Steve Mickenbecker, Canstar6.
Although there is general agreement that now is a good time to buy property, the generalsentimentisthatpropertypricesareexpensiveandsettorise. More than a third of respondents believe prices will be higher in 2013, while one in ten respondents believe there will be an expected increase of at least 10% (Chart 4).
ThisviewisparticularlystrongamongstFirstHomeBuyers with more than three quarters believing housing is overvalued. Owner-Occupiers, however, are less likely to see the market as inflated (possibly due to the benefit of hindsight or post-purchase rationalisation).
5 The Economist house-price indicators (May 2013). http://www.economist.com/news/finance-and-economics/21578043-our-latest-round-up-house-prices-reveals-some-sharp-contrasts-boom-and-gloom
6 Mickenbecker S. Housing Affordability interview, Seven media Group (April 2013). http://au.finance.yahoo.com/video/reducing-private-health-premiums-023055241.html

10 2013 Mortgage Barometer Report
Perceptionsofpropertyvaluedifferbystate: those residing in NSW/ACT and WA are most likely to rate the market as overvalued (54% and 53% respectively) whilst almost half (44%) of Queenslanders rate property as undervalued. Compared to other Australians, Queenslanders are also significantly less likely to believe that property prices will increase in 2013 (32% compared to 50% across other states), potentially as a result of the property slump on the Gold Coast.
Home buyers are confronting perceptions of decreased property affordability by considering their options in terms of style, size and location of properties sought (Chart 5).
Chart 4: Perceptions of property market value in 2013
Base: Total sample: 2013 n=1017, First Home Buyers n=115, Owner-Occupiers n=558
-18% -11% -22%
-9% -2% -10%
28% 28% 26%
20%
48%
15%
Total First Home Buyer
Owner- Occupier
Property value in 2013
Overvalued (more than 10%)
Somewhat overvalued (up to 10%)
Undervalued (more than 10%)
Somewhat undervalued (up to 10%)
16%
8%
38%
9%
Total
Prices in 2013 vs. 2012
Higher (more than 10%)
Somewhat higher (up to 10%)
Lower (more than 10%)
Somewhat lower (up to 10%)
Chart 5: Impact of increasing unaffordability of property on intentions to buy
May have to give up on buying property
Will probably end up buying something smaller
Will probably end up buying something in another location
May end up buying something different to what and 'trade up‘ in the future
Considering a larger loan than what I had considered previously
Considering buying an investment property instead of a property to live in
22%
39%
35%
24%
18%
17%
Base: Intending to buy property in the next �ive years and believe affordability will decrease, n=389
As we saw in 2012, opinionsaresplitaboutwhetherinterestrateswillchangeinthesecondhalfof2013. While 28% of all respondents say they will rise, 28% believe they will fall.
11An annual study of the mortgage market in Australia
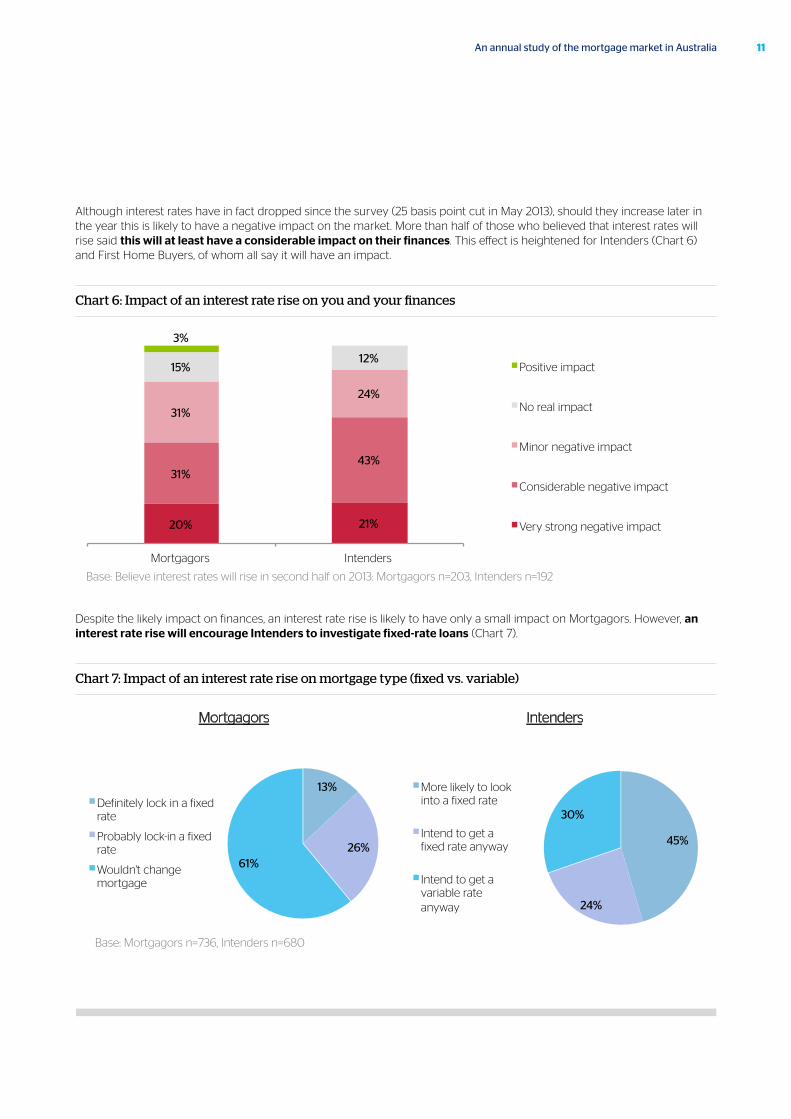
Although interest rates have in fact dropped since the survey (25 basis point cut in May 2013), should they increase later in the year this is likely to have a negative impact on the market. More than half of those who believed that interest rates will rise said thiswillatleasthaveaconsiderableimpactontheirfinances. This effect is heightened for Intenders (Chart 6) and First Home Buyers, of whom all say it will have an impact.
Chart 6: Impact of an interest rate rise on you and your finances
20% 21%
31% 43%
31%
24%
15% 12%
3%
Mortgagors Intenders
Positive impact
No real impact
Minor negative impact
Considerable negative impact
Very strong negative impact
Base: Believe interest rates will rise in second half on 2013: Mortgagors n=203, Intenders n=192
Despite the likely impact on finances, an interest rate rise is likely to have only a small impact on Mortgagors. However, aninterestraterisewillencourageIntenderstoinvestigatefixed-rateloans (Chart 7).
Chart 7: Impact of an interest rate rise on mortgage type (fixed vs. variable)
13%
26% 61%
Mortgagors
Definitely lock in a fixed rate
Probably lock-in a fixed rate
Wouldn't change mortgage
45%
24%
30%
Intenders
More likely to look into a fixed rate
Intend to get a fixed rate anyway
Intend to get a variable rate anyway
Base: Mortgagors n=736, Intenders n=680

Topical influences on the property market
In 2012, a failure by banks and other lenders to pass on interest rate cuts in full blew out the gap between the RBA rate and mortgage rates to an 18-year high, with households paying on average 3% above the official cash rate for home loans7. Despite the banks’ cost of lending increasing about 150 basis points relative to the cash rate since the onset of the GFC8, the market appears to generally criticise banks as being more focused on shareholder profits than customer wellbeing (Chart 8).
Chart 8: Reaction of banks to changes in official cash rate
Base: Those who think rates will rise in the second half of 2013 n=277; Those who think rates will fall n=292
14%
41%
44%
If interest rates rise banks will...
Increase rates beyond the full rise
Pass on the full rise
Pass on only some of the rise
6%
38%
52%
4%
If interest rates drop banks will...
Pass on none of the cut
Pass on only some of the cut
Pass on most of the cut
Pass on the full cut
Interestingly, the banks have picked up on the negative consumer sentiment and in May 2013 swiftly passed on the RBA rate cut of 25 basis points in full, and ANZ actually bettered its rivals with a 27 basis point cut to its standard variable rate off the back of reported easing of cost of funds9.
An expected change of government and lengthy election campaign is deterring the purchase of property
In January this year the Prime Minister, Julia Gillard, announced that the Federal Election would be held on September 14, unofficially prompting an abnormally long election campaign. An expected change in government (only 14% believe that the ALP will win) and/or the lengthy campaign period is causing a delay for the majority of those respondents intending to buy property (Chart 9).
7 HIA economics group Monetary Policy and Mortgage Interest rates, February 2013 http://economics.hia.com.au/media/Interest%20rates%20and%20monetary%20policy%20-%20Fact%20Sheet%20Feb%202013.pdf
8 Roberston B & Rush A, Developments in Banks' Funding Costs and Lending Rate. RBA bulletin, March 2013 http://www.rba.gov.au/publications/bulletin/2013/mar/7.html
9 ANZ May 2013 Interest Rate Review (May 10 2013).
12 2013 Mortgage Barometer Report

Chart 9: Impact of the Election/extended campaign period on intention to buy
25% 30%
18% 15%
9%
Long campaign Want to see what economy is like post-
election
Want to see who wins Long campaign will effect economy
Campaign will put rate changes on hold
56% will delay purchasing until after the election
Base: Those intending to buy residential property in the next �ive years, n=680
Threeinfourrespondents(72%)believetheelectionwillhavenoimpactontheofficialcashrate but, interestingly, the political party that respondents expect to win impacts on whether they think rates will rise or fall:
• For the majority who think the Liberal National Party (LNP) will win, 21% say rates will rise after the election, 8% say they’ll drop.
• For those who think the Australian Labor Party (ALP) will win, 8% say rates will rise after the election, 20% say they’ll drop.
13An annual study of the mortgage market in Australia

14 2013 Mortgage Barometer Report
Mortgage strain is low, despite increased cost of living and high financial strain
Onlyoneinthreesurveyrespondentsreportedexperiencingnofinancialstrain, with an increase in the cost of living proving to be the largest financial stressor (Chart 10). Mortgage strain ranked fourth as a financial stressor, affecting less than one in five.
Chart 10: Influences on financial strain in the last 12 months
No financial strain
Cost of living has increased
I've recently had increased expenses (e.g. kids started school)
I/my partner recently experienced a reduction in the amount of work available
My mortgage repayments
I /my family has recently had unexpected medical bills
I /my partner have recently lost our job
Changes to the private health rebate have placed extra strain on my budget
I've recently made another large purchase (e.g. new car, holiday)
I /my partner have recently taken a pay cut
31%
41%
18%
15%
12%
12%
14%
12%
11%
8%
Base: Total sample, n=1,017, multiple responses accepted
Further changes to the First Home Buyer incentives hits hard
New housing statistics from the Australian Bureau of Statistics (ABS) (2013) reveal that changestotheFirstHomeBuyerincentiveinNSWandQLD(Table1)havehadasignificantimpact.As of February 2013, the number of First Home Buyers as a percentage of total owner-occupied housing commitments has fallen by more than 5% since September 2012 and now sits at 14% nationally, an eight year low10 . This is due to record low First Home Buyer commitments in NSW and QLD (both less than 10%) – a plunge of more than 10% since the grants were replaced, while other states saw First Home Buyer commitments rise. There are concerns that VIC will follow suit as it replaces its First Home Owner Grant with a $10,000 new home owner grant as of 30 June 2013.
Table 1In October 2012, the state governments in NSW and QLD changed the concessions offered to First Home Buyers. The $7,000 First Home Owner Grant was replaced by a $15,000 grant only available to first home owners who purchase or build a new eligible home (including off-the-plan) up to the value of:
• $650,000 in NSW
• $750,000 in QLD
In NSW, the grant will reduce to $10,000 as of 1 January 2014.
10 ABS Housing Finance Australia 5609, March 2013 http://www.abs.gov.au/ausstats/[email protected]/mf/5609.0

15An annual study of the mortgage market in Australia
Survey respondents report less utilisation of the First Home Buyers grant for deposits, dropping from 17% in 2012 to 14% in 2013, with onlyoneinthreesayingthegrantchangeshavehadnoimpact on their decision to buy. Over one quarter of First Home Buyer respondents say it will considerably reduce their likelihood of entering the property market in the next year, while others indicate it will change the type of properties they can purchase (Chart 11).
Chart 11: Impact of First Home Buyer grant changes on intention to buy
28% 27%
20% 19%
13%
Considering a different location
Considering a smaller property
Considering buying something else and
upgrading
Will need to borrow (more) money from
family/friends
Considering a larger loan
Base: First Home Buyers in NSW and QLD, n=59
Changes to superannuation legislation likely to increase property investment, though outside of superannuation
Self-managed superannuation funds (SMSFs) have increased in popularity during their 18-year history by over 700%11, and thevalueofpropertyheldinSMSFsisgrowingbymorethan10%perannumaccordingtotheAustralianTaxationOffice(ATO), with trustees moving away from cash and instead looking to house their money in direct property12.
One in six (15%) current Mortgagors and Intenders currently have an SMSF and, of these, 22%alreadyownpropertyintheirSMSF, with another 22% planning to own property within their SMSF.
Table 2In 2013, the Federal Government proposed changes to superannuation legislation. From 1 July 2014, earnings of more than $100,000 on superannuation pensions and annuities will be taxed at 15 per cent instead of being tax-free.
At a rate of return of 5 per cent per annum, the Government expects the change will only affect people with more than $2 million in superannuation assets.
However this will have implications for the treatment of capital gains, which does not currently attract any taxation. Under the proposed changes, capital gains in excess of $100,000 on assets purchased after 1 July 2014 will be taxed at 15 per cent.
11 Self-managed super fund statistical report - March 2013, Population and Asset Allocation Tables. http://www.ato.gov.au/superfunds/content.aspx?menuid=49150&doc=/content/00353227.htm&page=8&H8
12 Multiport SMSF Investment Patterns Survey , March 2013 http://www.multiport.com.au/market-news/smsf-investment-patterns-survey.aspx

Changes to superannuation legislation proposed to commence in July 2014 (Table 2) are likely to have a small net positive effect on investment in the property market, though at a total level the impact is likely to encourage people to purchase outside of superannuation. Noticeably, the legislationchangesarelikelytohaveaverypositiveimpactonpropertypurchasesforthosewhoalreadyhaveanSMSF; particularly those who already hold property in their SMSF, as well as those in high income households (household income above $150,000) (Chart 12).
Chart 12: Impact of superannuation legislation changes on intention to buy
6% 7% 9%
22% 9%
18%
Total Have SMSF
More likely to buy property outside of super fund
More likely to buy property within super fund
Less likely to buy property within super fund
Base: Total sample, n=1,017; have SMSF, n=153; have property in SMSF, n=33
16 2013 Mortgage Barometer Report

17An annual study of the mortgage market in Australia
Loan-to-Value Ratio (LVR) is on the increase
Those about to enter the property market have high aspirations, so despite lessons that perhaps should have been learnt post-GFC (namely, over indebtedness), intendedLVRsareslowlyincreasing (Chart 13) from around 62% for purchases in 2012/13 to 65% for purchases more than one year from now (note, these are slight underestimates compared to actual ABS LVR figures which range in the low 70%13).
Chart 13: Actual and intended LVR by when bought/intend to purchase property
48% 50% 58%
62% 61% 65% 65%
5+ years ago n=295
4-5 years ago n=119
2-3 years ago n=176
last 12 months n=108
next 12 months n=208
1-2 years from now
n=129
3-5 years from now
n=224
This is likely to reflect the growing average loan size. ABSstatisticsconfirmthataveragemortgagerepaymentshaveleaptby105%overthepastdecade14 and survey respondents suggest that loan sizes are continuing to grow. The upper range of what Intenders are willing to borrow is well into the $400,000s whilst the average loan size at the start of 2013 was close to $300,000 (Chart 14).
13 AFG Mortgage Index May 2013 http://www.afgonline.com.au/afgretail_server/get-pdf?id=01_00311414 HIA-Commonwealth Bank Affordability Report, December Quarter 2012
What’s happening in the mortgage market?

18 2013 Mortgage Barometer Report
Chart 14: Current and intended LVR and loan size
Base: Mortgagors, n=698; First Home Owners, n=122; Current Investors, n=170; Owner Occupiers, n=519 Intenders, n=567; First Home Buyers, n=111; Potential Investors, n=263
Mortgagors
Intenders
Avg. Current LVR 53% 62% 55% 51%
Avg. Current Loan $295,000 $290,000 $382,000 $283,000
All current Mortgagors First Home Owners Current Investors Owner-Occupiers
Avg. Desired LVR 43-64% 44-62% 45-67%
Avg. Desired Loan $264,000- $411,000
$238,000- $373,000
$266,000- $429,000
All purchase intenders First Home Buyers Potential Investors
Housingloansarethereforebecomingalongertermcommitment; with the average life of a loan now 15 years (for Owner-Occupiers and Investors). According to the survey, one in three Owner-Occupiers and Investors (34%) say it will take more than 20 years to pay off their loan, while more than one in two (56%) First Home Buyers expect to take more than 20 years to pay off their home loan.
The proportion of buyers who have a deposit of less than 20% is stable (19% in 2012). The majority of people will source their deposit from savings (63%).
Low interest rates are helping Mortgagors get ahead
“It’s almost as if there was an obsession with taking on debt prior to the Global Financial Crisis, now we’ve got a bit of an obsession with paying down debt.” Dr Oliver, AMP Chief Economist15.
The RBA noted this year that Australians have been taking advantage of the near-record low interest rates, and hence lower minimum repayments, to get ahead on their mortgages.
15 Elsworth S. Aussies are $160bn ahead on mortgages (March 2013). http://www.news.com.au/realestate/aussies-are-160bn-ahead-on-mortgages/story-fncq3era-1226609151657

19An annual study of the mortgage market in Australia
Chart 15: Changes in minimum monthly mortgage repayments16
Total Sydney Melbourne Brisbane Perth Adelaide
Dec-11 $2,972 $3,728 $3,260 $3,078 $3,288 $2,651
Mar-12 $2,840 $3,794 $3,078 $2,965 $3,331 $2,555
Jun-12 $2,812 $3,703 $3,090 $3,008 $3,184 $2,428
Sep-12 $2,686 $3,543 $2,983 $2,842 $3,105 $2,391
Dec-12 $2,633 $3,471 $2,937 $2,770 $3,064 $2,315
Australian families are now a record 14% ($160 billion) ahead on their mortgages, squirrelingawayanextra$30billionsincethestartoftheGFC15.Almosthalf(46%)ofMortgagorssurveyedsaytheypaidoffmorethantheirminimumloanrepaymentsinthelast12months.
But mortgage strain is still a concern
Oneinfive(21%)Mortgagorssurveyedsaytheyhavestruggledat least a few times in the last 12 months to make minimum mortgage repayments, with a similar number (19%) agreeing that their mortgage repayments have placed them under financial strain. 4% say they frequently struggled to make their minimum repayments. The results of the survey would suggest that experience of mortgage strain is not explicitly linked to household income.
According to the latest Fitch Dinkum Index therehasbeenaslightdeteriorationinmortgageperformance in Australia in Q4 2012, with a 10 basis point increase in the number of borrowers falling behind on their mortgage repayments by one month or more (now 1.45%)17.
Costoflivingisthestrongesteconomicdriverofaffordability amongst survey respondents; job losses and reduction in work hours are the most common correlations with those experiencing difficulty in making minimum repayments.
Rate of mortgage refinancing has dropped, perhaps due to lower rate pressure
In 2013, only 13% of surveyed Mortgagors had refinanced their loan in the last 12 months, down from 17% in 2012. Slightly more (21%) think they will refinance in the next 12 months.
Refinancing seems bound to rate chasing rather than dissatisfaction with lenders, with 74% of refinancers staying with the same lender and only 37% of potential refinancers looking for a new lender.
Going direct to lenders is still the norm
Overathird(38%)ofmortgageseekersconsultedamortgagebroker during the loan application process, with 61% applying directly through a lender and 22% going with their current bank. Interestingly, First Home Buyers are no likelier to consult brokers, though they are more likely to consult family and friends (32% vs. 12% of all mortgage seekers) and do their own research (57% vs. 37% of all mortgage seekers).
Therespondents’primarymotivationforapplyingthroughamortgagebrokerisconvenience, rather than the belief they will get a better deal, with the key benefit being that brokers take on the responsibility of conducting the research and are better at explaining different mortgage options (Chart 16). One in five of those respondents who apply for a mortgage directly through a bank actually prefer not to enlist the help of a broker.
16 HIA-Commonwealth Bank Affordability Report, December Quarter 201217 Fitch Ratings, Sydney (April 9 2013). http://www.fitchratings.com/creditdesk/press_releases/detail.cfm?pr_id=787983

20 2013 Mortgage Barometer Report
Chart 16: Reasons for applying for mortgages through a broker versus direct through the lender
58%
51%
40%
20%
37%
31%
6%
48%
32%
16%
19%
24%
22%
More convenient
Do the research for me
I think I will get a better deal
Less paperwork involved
Helps me understand the different mortgage options
Helps me to get a mortgage tailored to my needs
I prefer not to deal with banks/brokers Broker Direct
Base: Applied/will apply for a mortgage through a broker, n=347; Applied/will apply direct through the lender, n=570
Big 4 lenders hold market share because of their size
Just under two thirds (62%) of all current and potential Mortgagors chose/will choose one of the Big 4 banks (The Commonwealth Bank, NAB, Westpac and ANZ) for their mortgage. Investors are slightly more likely (67%) to go with a Big 4 bank.
Many current Mortgagors have a mortgage with a smaller bank or lender (27%) whereas those intending to get a mortgage are less likely to report wanting to go with one of these lenders (19%).
The primary motivation for taking out a mortgage with a Big 4 bank is an existing relationship (44% vs. 32% for other lenders), but thekeydifferentiatorbetweentheBig4banksandotherlendersistheperceivedfinancialsecurityoftheBig4 (32% vs. 6%). Financial security is particularly important for Investors (28%) and First Home Buyers (57%). First Home Buyers also particularly value the reputation of the Big 4 banks (39%).
Meanwhile, other lenders are chosen for offering better rates, having more suitable products and for caring for their customers (Chart 17).

21An annual study of the mortgage market in Australia
Chart 17: Reasons for choosing a Big 4 bank over other lenders
Base: Have/intend to have mortgage with Big 4 bank, n=552; Have/intend to have mortgage with another lender, n=305
44%
34%
32%
24%
23%
31%
44%
6%
48%
15%
37%
17%
I have other banking products with them
Have the mortgage which best suits my needs
Better financial security
Better rates
Better reputation
Care more about their customers
Not all about shareholders/profits Big 4
Other FS
Chart 16: Reasons for applying for mortgages through a broker versus direct through the lender
58%
51%
40%
20%
37%
31%
6%
48%
32%
16%
19%
24%
22%
More convenient
Do the research for me
I think I will get a better deal
Less paperwork involved
Helps me understand the different mortgage options
Helps me to get a mortgage tailored to my needs
I prefer not to deal with banks/brokers Broker Direct
Base: Applied/will apply for a mortgage through a broker, n=347; Applied/will apply direct through the lender, n=570
Big 4 lenders hold market share because of their size
Just under two thirds (62%) of all current and potential Mortgagors chose/will choose one of the Big 4 banks (The Commonwealth Bank, NAB, Westpac and ANZ) for their mortgage. Investors are slightly more likely (67%) to go with a Big 4 bank.
Many current Mortgagors have a mortgage with a smaller bank or lender (27%) whereas those intending to get a mortgage are less likely to report wanting to go with one of these lenders (19%).
The primary motivation for taking out a mortgage with a Big 4 bank is an existing relationship (44% vs. 32% for other lenders), but thekeydifferentiatorbetweentheBig4banksandotherlendersistheperceivedfinancialsecurityoftheBig4 (32% vs. 6%). Financial security is particularly important for Investors (28%) and First Home Buyers (57%). First Home Buyers also particularly value the reputation of the Big 4 banks (39%).
Meanwhile, other lenders are chosen for offering better rates, having more suitable products and for caring for their customers (Chart 17).

22 2013 Mortgage Barometer Report
What does the future mortgage market look like?Property preferences are changing
Whilstexistinghousesarestillthepreferredpropertytypeofrespondents,interestinthismarketisdeclininginfavourofgrowinginterestinnewdevelopments (Chart 18 and 19). Changes to First Home Buyer grants appear to be having an effect, with First Home Buyers more likely to consider new houses (up to one in two in this group) and units (one in three). The effect, however, is not limited to this group with Investors and Owner-Occupiers also more interested in buying new developments in 2013 than in 2012 (8% and 5% increase, respectively).
Chart 18: Type of property looking to buy - New developments
29% 13% 15%
5% 4%
35% 19% 16%
6% 7%
2012 2013
34% 21% 19%
10% 6%
49% 30% 22%
8% 8%
26% 8% 14%
3% 4%
34% 18% 13% 6% 6%
27% 10% 6% 0% 2%
32% 22% 17%
8% 8%
Base: Intend to buy in the next five years. Total, 2012 n=488, 2013 n=680 First Home Buyers 2013 n=115, Owner-Occupiers 2013 n=285, Investors 2013 n=316
New developments
Majority still want to purchase in capital cities
Compared to 2012, thereislittlechangeinwherepeoplewanttobuy. Less than 10% want to buy in another state and just under three in four (73%) want to buy in capital cities. There is a slight shift in city location preferences, with 48% saying they’re looking to buy in the outer suburbs (compared to 42% in 2012).
For those looking to buy in Sydney, the most popular areas are the Inner West (42%), followed by Parramatta (29%) and the Lower North Shore (27%). The Lower North Shore is a particular hot spot for First Home Buyers in Sydney, with almost one in two (47%) ranking this area as a place they’re looking to buy.

23An annual study of the mortgage market in Australia
Within Melbourne, the most popular areas to buy are in the East: Both the South East (40%) and Eastern Melbourne (31%), as well as the CBD (25%). First Home Buyers in Melbourne are particularly interested in the city and fringe: 42% say they’re looking to buy in the CBD, 40% in the Inner West and 39% in the Inner North.
Chart 19: Type of property looking to buy - Existing dwellings
Total
First Home Buyers
Owner-occupiers
Investors
House Unit Town- house
Terrace Semi Land Holiday house
69%
21% 24% 9% 9% 7% 0%
56%
24% 20% 7% 8% 6% 2%
2012 2013
69%
31% 34%
11% 12% 7% 0%
61%
32% 27% 10% 12% 7% 1%
68%
14% 17% 8% 7% 6% 0%
59%
24% 18% 5% 7% 5% 3%
69%
15% 23% 6% 8% 13%
0%
55%
30% 24% 9% 10% 5% 4%
Base: Intend to buy in the next five years Total, 2012 n=488, 2013 n=680 First Home Buyers 2013 n=115, Owner-Occupiers 2013 n=285, Investors 2013 n=316
Existing Dwellings
First Home Buyer profile hasn’t changed
Although ABS data shows that First Home Buyers are shrinking as a proportion of the total property market18, who they are is not changing. As we saw in 2012, First Home Buyers tend to be under 35 years old, have a household income of under $100,000, and are SINKs (Single Income, No Kids) or DINKs (Double Income, No Kids).
Apartfromdemographics,FirstHomeBuyersalsodifferintermsofhousingpreferences from the rest of those intending to buy residential property in the next five years (Chart 20). First Home Buyers are not only more eager to enter the market (44% want to buy in the next 12 months vs. 26% of all respondents), but they’re also more likely to be interested in new developments, particularly new houses (67% and 49% respectively vs. 53% and 35% for all respondents). This difference has been heightened with the roll out of new changes to First Home Buyer incentives.
18 ABS Housing Finance Australia 5609, March 2013 http://www.abs.gov.au/ausstats/[email protected]/mf/5609.0

24 2013 Mortgage Barometer Report
Chart 20: Key sub-group differences
Total sample n=1,017 Owner-Occupiers n=558 First Home Buyers n=115 Current Investors n=176
33% under 35 22% under 35 67% under 35 64% under 45
51% Families 59% Families 26% SINKs, 24% DINKs 38% Young Families
63% HH income <$100k 18% investments >$550k
58% HH income <$100k 19% investments >$550k
67% HH income <$100k 8% investments >$550k
43% HH income <$100k
47% investments >$550k
26% will buy in the next 12 months
21% will buy in the next 12 months
44% will buy in the next 12 months
39% will buy in the next 12 months
Looking to buy… Looking to buy… Looking to buy… Looking to buy…
New developments 53% New developments 51% New developments 67% New developments 49%
Existing dwellings 74% Existing dwellings 73% Existing dwellings 81% Existing dwellings 73%
Current mortgage: $295,000 Current mortgage: $283,000 Intended mortgage: Current mortgage:
$381,000 $373,000
The investment market is recovering
ABS statistics reveal thatloanstoinvestorshavesoared16%inthelastyear, compared to only 6.6% growth for the traditional property heartland Owner-Occupiers19.
Survey data also confirms an increased interest in investing; of those looking to buy residential property in the next five years, 42% said they were doing so for an investment (up from 26% in 2012). Currently 7.9% of Australians aged 18 plus classify themselves as Investors, while a further 13.8% intend to become investors in 2013.
PotentialInvestorsarethemostlikelyofanyIntenderstothinkthenextsixmonths is the best time to buy (31% vs. 24% of all intenders), and 18% will buy in the next six months (on average).
Whilst property investments are taking off, so is an interest in new developments (Chart 18), though Investors are still likely to stick to investing in their local area (84%). Like all people entering the property market, the greatest interest lies in the inner city/city fringe (24%and 35% of investors respectively).
Investors tend to be slightly younger than other property owners and Intenders (First Home Buyers aside) and are more economically advantaged (only 43% have household income under $100,000 and 47% have assets over $550,000 compared to 18% for all respondents).
19 ABS Housing Finance Australia 5609, March 2013 http://www.abs.gov.au/ausstats/[email protected]/mf/5609.0

25An annual study of the mortgage market in Australia
MethodologyThe survey upon which this report is based was an online survey targeting Australian adults (aged 18+) who either have a current residential mortgage or who intend to buy residential property (as an investment or a home) in the next 5 years.
The survey was developed by GfK Australia in consultation with QBE, and fieldwork was conducted via an online panel from 1 May to 13 May 2013.
Data was weighted to the Australian population according to 2011 census data.
Minimum samples of n=500 were set for the two core target sample groups: Mortgagors and Intenders, which were met through natural fall out of the sample. Of the 1,107 responses collected, 763 were Mortgagors and 680 were Intenders, with 399 qualifying for both. Throughout the report the following subgroups are referred to as follows:
• Mortgagors (have a current residential mortgage)
– 34.1% of the population, 68% of the sample, n=763
• Intenders (intend to buy a residential property in the next five years)
– 34.9% of the population, 69% of the sample, n=680
• First Home Buyers (house hunters looking for their first home)
– 6.3% of the population, 11% of the sample, n=115
• Owner-Occupiers (have a mortgage for the home they live in)
– 26.0% of the population, 55% of the sample, n=558
• Current Investors (currently have a mortgage for an investment property)
– 7.9% of the population, 17% of the sample, n=176
• Potential Investors (intend to buy an investment property in the next 5 years)
– 13.8% of the population, 28% of the sample, n=286
• First Home Owners (currently have a mortgage on their first home)
– 5.8% of the population, 12% of the sample, n=127
The total target sample is 50.2% of the Australian adult population.

26 2013 Mortgage Barometer Report
Sample profiles

27An annual study of the mortgage market in Australia
Total market profile
Property Ownership % Mortgagor type^ % Mortgage recency^ %
Mortgagor, no intention 30.4 First home owner 16.8 In last 12 months 15.2
Mortgagor and intend to buy 37.5 Owner-occupier only 58.8 2-3 years ago 24.7
No mortgage, intend to buy 32.1 Investor only 6.6 4-5 years ago 16.6
Nett mortgagor 67.9 Investor & owner-occupier 17.2 More than 5 years ago 43.5
Nett intend to buy 69.5 Holiday house 1.0 When intend to buy* % Intender status* % Intended property type* %
Within next 3 months 6.6 First Home Buyer 17.1 Existing house 56.4
In next 4-6 months 11.5 Subsequent home buyer 64.2 Existing unit 24.5
In next 7-12 months 18.8 Investor 41.7 Other existing property 23.0
In next 13-24 months 23.2 New house 35.2
In next 3-5 years 39.8 New unit 19.1
Other new development 19.1
Land 5.6
Sentiment % Interest Rates# %
Future generations will find it harder to buy their first home 82.1 In the 2nd half of 2013…
I am better off owning a home than renting 71.8 Will rise by more than 0.5% 5.0
Property prices will increase strongly in the next three years 47.2 Will rise by up to 0.5% 22.8
The housing price 'bubble' will burst and prices will fall 27.9 Will stay the same 43.0
Worry I’ll never be able to afford my own home 24.3 Will drop by up to 0.5% 26.8
Property is undervalued 25.4 Will drop by more than 0.5% 2.4
Property is overvalued 45.2
Amongst intenders… % Best t ime to buy# %
Prices are high and I cannot afford what I want 27.0 Next 6 months 31.9
Property will become increasingly unaffordable in the next year 47.9 In 7-12 months’ time 23.8
13-18 months’ time 15.5
Avg. Mortgage Avg. LVR Had/have <20% deposit
Loan with Big 4 bank
Use mortgage
broker Current mortgagors $295,000 52.8 11.1% 61.7% 38.8% Intend to buy in next 5 years $411,111 63.6 19.6% 62.3% 37.3%
Gender % Age % Life Stage %
Male 50.8 18-24 years 9.5 SINKs 13.4
Female 49.2 25-34 years 23.2 DINKs 15.5
35-44 years 24.2 Family, primary aged kids 29.3
45-54 years 20.9 Family, high school aged kids 11.0
55-65 years 13.9 Adult family 10.4
Over 65 years 8.3 Older (55+) singles/couples 9.4
Retirees 10.7 State/Terr itory % Location % Marital Status %
NSW & ACT 33.0 Capital city 63.9 Single 18.3
VIC & TAS 27.5 Regional centre 27.4 Live with partner/married 71.7
QLD 19.4 Rural area 8.8 Separated/Divorced/Widowed 9.5
WA 11.3
SA & NT 8.8 Education % Household Income# % Investments# %
Primary 0.2 Sole income earner 32.0 No investments 20.4
Part of high school 8.5 Main income earner 22.8 $50,000 or less 17.2
Completed high school 16.8 $50,000 or less 21.8 $50,001 - $150,000 16.3
Diploma or certificate 31.8 $50,001 - $75,000 18.6 $150,001 - $250,000 16.7
Degree qualification 29.7 $75,001 - $100,000 22.1 $250,001 - $350,000 11.3
Postgraduate qualification 13.1 $100,001 - $150,000 24.3 $350,001 - $550,000 5.8
$150,001 - $200,000 8.8 $550,001 - $1 million 6.1
More than $200,000 4.3 More than $1 million 6.1
Base: Total sample, n=1,017* Percentage of all current Mortgagors n=736 ^ Percentage of all those intending to purchase residential property in the next 5 years n=680 # Percentage excluding don’t know /prefer not to say responses

28 2013 Mortgage Barometer Report
Current Mortgagors profile
Property Ownership % Mortgagor type^ % Mortgage recency^ %
Mortgagor, no intention 46.2 First home owner 16.8 In last 12 months 15.2
Mortgagor and intend to buy 53.8 Owner-occupier only 58.8 2-3 years ago 24.7
No mortgage, intend to buy 0 Investor only 6.6 4-5 years ago 16.6
Nett mortgagor 100 Investor & owner-occupier 17.2 More than 5 years ago 43.5
Nett intend to buy 53.8 Holiday house 1.0 When intend to buy* % Intender status* % Intended property type* %
Within next 3 months 7.5 First Home Buyer 0.0 Existing house 54.9
In next 4-6 months 11.2 Subsequent home buyer 100 Existing unit 25.0
In next 7-12 months 19.9 Investor 57.6 Other existing property 21.7
In next 13-24 months 19.4 New house 36.2
In next 3-5 years 41.9 New unit 19.5
Other new development 19.4
Land 5.6
Sentiment % Interest Rates# %
Future generations will find it harder to buy their first home 83.4 In the 2nd half of 2013…
I am better off owning a home than renting 73.4 Will rise by more than 0.5% 4.7
Property prices will increase strongly in the next three years 48.8 Will rise by up to 0.5% 23.1
The housing price 'bubble' will burst and prices will fall 26.5 Will stay the same 42.0
Worry I’ll never be able to afford my own home 17.8 Will drop by up to 0.5% 28.3
Property is undervalued 30.3 Will drop by more than 0.5% 2.0
Property is overvalued 41.9
Amongst intenders… % Best t ime to buy# %
Prices are high and I cannot afford what I want 17.9 Next 6 months 34.7
Property will become increasingly unaffordable in the next year 39.4 In 7-12 months’ time 24.7
13-18 months’ time 14.2
Avg. Mortgage
Avg. Loan-to-value rat io
Had/have <20% deposit
Loan with Big 4 bank
Use mortgage broker
Current mortgagors $295,000 52.8 11.1% 61.7% 38.8%
Intend to buy in next 5 years $428,000 64.3 19.3% 68.2% 41.4% Gender % Age % Life Stage %
Male 51.0 18-24 years 6.3 SINKs 11.6
Female 49.0 25-34 years 24.5 DINKs 16.2
35-44 years 26.2 Family, primary aged kids 33.0
45-54 years 22.8 Family, high school aged kids 12.1
55-65 years 13.6 Adult family 8.8
Over 65 years 6.7 Older (55+) singles/couples 9.3
Retirees 8.8 State/Terr itory % Location % Marital Status %
NSW & ACT 32.2 Capital city 66.0 Single 13.3
VIC & TAS 28.7 Regional centre 25.0 Live with partner/married 76.7
QLD 19.0 Rural area 9.0 Separated/Divorced/Widowed 9.4
WA 10.8
SA & NT 9.3 Education % Household Income# % Investments# %
Primary 0.1 Sole income earner 31.7 No investments 18.6
Part of high school 9.2 Main income earner 22.1 $50,000 or less 16.3
Completed high school 16.2 $50,000 or less 17.9 $50,001 - $150,000 17.4
Diploma or certificate 31.1 $50,001 - $75,000 16.2 $150,001 - $250,000 16.8
Degree qualification 29.8 $75,001 - $100,000 25.1 $250,001 - $350,000 12.2
Postgraduate qualification 13.5 $100,001 - $150,000 26.5 $350,001 - $550,000 6.1
$150,001 - $200,000 9.5 $550,001 - $1 million 6.7
More than $200,000 4.8 More than $1 million 5.9
Base: Current Mortgagors, n=736 * Percentage of all current Mortgagors n=680 ^ Percentage of all those intending to purchase n=399 # Percentage excluding don’t know /prefer not to say responses xx Significantly higher than Intenders xx Significantly lower than Intenders

29An annual study of the mortgage market in Australia
Property Intenders (will purchase residential property in the next 5 years) profile
Property Ownership % Mortgagor type^ % Mortgage recency^ %
Mortgagor, no intention 0 First home owner 19.3 In last 12 months 16.8
Mortgagor and intend to buy 57.7 Owner-occupier 47.2 2-3 years ago 31.0
No mortgage, intend to buy 42.3 Investor 9.4 4-5 years ago 16.7
Nett mortgagor 42.3 Investor & owner-occupier 23.4 More than 5 years ago 35.5
Nett intend to buy 100 Holiday house 0.8 When intend to buy* % Intender status* % Intended property type* %
Within next 3 months 6.6 First Home Buyer 17.1 Existing house 56.4
In next 4-6 months 11.5 Subsequent home buyer 64.2 Existing unit 24.5
In next 7-12 months 18.8 Investor 41.7 Other existing property 23.0
In next 13-24 months 23.2 New house 35.2
In next 3-5 years 39.8 New unit 19.1
Other new development 19.1
Land 5.6
Sentiment % Interest Rates# %
Future generations will find it harder to buy their first home 81.4 In the 2nd half of 2013…
I am better off owning a home than renting 69.8 Will rise by more than 0.5% 5.5
Property prices will increase strongly in the next three years 46.7 Will rise by up to 0.5% 23.5
The housing price 'bubble' will burst and prices will fall 31.4 Will stay the same 41.1
Worry I’ll never be able to afford my own home 30.9 Will drop by up to 0.5% 27.1
Property is undervalued 25.6 Will drop by more than 0.5% 2.8
Property is overvalued 51.9
Amongst intenders… % Best t ime to buy# %
Prices are high and I cannot afford what I want 24.7 Next 6 months 27.2
Property will become increasingly unaffordable in the next year 41.0 In 7-12 months’ time 26.1
13-18 months’ time 16.1
Avg. Mortgage
Avg. Loan-to-value rat io
Had/have <20% deposit
Loan with Big 4 bank
Use mortgage broker
Current mortgagors $310,000 53.8 11.3% 68.2% 41.4%
Intend to buy in next 5 years $412,000 63.6 19.6% 62.3% 37.3% Gender % Age % Life Stage %
Male 52.6 18-24 years 12.1 SINKs 15.8
Female 47.4 25-34 years 26.7 DINKs 16.4
35-44 years 24.3 Family, primary aged kids 30.3
45-54 years 19.6 Family, high school aged kids 10.7
55-65 years 11.1 Adult family 10.7
Over 65 years 6.2 Older (55+) singles/couples 7.1
Retirees 8.6 State/Terr itory % Location % Marital Status %
NSW & ACT 34.0 Capital city 66.0 Single 22.5
VIC & TAS 28.6 Regional centre 27.0 Live with partner/married 70.0
QLD 19.4 Rural area 7.0 Separated/Divorced/Widowed 7.1
WA 9.6
SA & NT 8.4 Education % Household Income# % Investments# %
Primary 0.3 Sole income earner 32.6 No investments 17.5
Part of high school 5.7 Main income earner 26.1 $50,000 or less 17.0
Completed high school 16.0 $50,000 or less 20.4 $50,001 - $150,000 14.4
Diploma or certificate 30.5 $50,001 - $75,000 17.8 $150,001 - $250,000 18.8
Degree qualification 33.9 $75,001 - $100,000 21.9 $250,001 - $350,000 11.3
Postgraduate qualification 13.7 $100,001 - $150,000 24.8 $350,001 - $550,000 6.5
$150,001 - $200,000 10.1 $550,001 - $1 million 6.5
More than $200,000 5.0 More than $1 million 8.0
Base: Intenders, n=680 * Percentage of all current Mortgagors n=399 ^ Percentage of all those intending to purchase n=380 # Percentage excluding don’t know /prefer not to say responses xx Significantly higher than Mortgagors xx Significantly lower than Mortgagors
Current Mortgagors profile
Property Ownership % Mortgagor type^ % Mortgage recency^ %
Mortgagor, no intention 46.2 First home owner 16.8 In last 12 months 15.2
Mortgagor and intend to buy 53.8 Owner-occupier only 58.8 2-3 years ago 24.7
No mortgage, intend to buy 0 Investor only 6.6 4-5 years ago 16.6
Nett mortgagor 100 Investor & owner-occupier 17.2 More than 5 years ago 43.5
Nett intend to buy 53.8 Holiday house 1.0 When intend to buy* % Intender status* % Intended property type* %
Within next 3 months 7.5 First Home Buyer 0.0 Existing house 54.9
In next 4-6 months 11.2 Subsequent home buyer 100 Existing unit 25.0
In next 7-12 months 19.9 Investor 57.6 Other existing property 21.7
In next 13-24 months 19.4 New house 36.2
In next 3-5 years 41.9 New unit 19.5
Other new development 19.4
Land 5.6
Sentiment % Interest Rates# %
Future generations will find it harder to buy their first home 83.4 In the 2nd half of 2013…
I am better off owning a home than renting 73.4 Will rise by more than 0.5% 4.7
Property prices will increase strongly in the next three years 48.8 Will rise by up to 0.5% 23.1
The housing price 'bubble' will burst and prices will fall 26.5 Will stay the same 42.0
Worry I’ll never be able to afford my own home 17.8 Will drop by up to 0.5% 28.3
Property is undervalued 30.3 Will drop by more than 0.5% 2.0
Property is overvalued 41.9
Amongst intenders… % Best t ime to buy# %
Prices are high and I cannot afford what I want 17.9 Next 6 months 34.7
Property will become increasingly unaffordable in the next year 39.4 In 7-12 months’ time 24.7
13-18 months’ time 14.2
Avg. Mortgage
Avg. Loan-to-value rat io
Had/have <20% deposit
Loan with Big 4 bank
Use mortgage broker
Current mortgagors $295,000 52.8 11.1% 61.7% 38.8%
Intend to buy in next 5 years $428,000 64.3 19.3% 68.2% 41.4% Gender % Age % Life Stage %
Male 51.0 18-24 years 6.3 SINKs 11.6
Female 49.0 25-34 years 24.5 DINKs 16.2
35-44 years 26.2 Family, primary aged kids 33.0
45-54 years 22.8 Family, high school aged kids 12.1
55-65 years 13.6 Adult family 8.8
Over 65 years 6.7 Older (55+) singles/couples 9.3
Retirees 8.8 State/Terr itory % Location % Marital Status %
NSW & ACT 32.2 Capital city 66.0 Single 13.3
VIC & TAS 28.7 Regional centre 25.0 Live with partner/married 76.7
QLD 19.0 Rural area 9.0 Separated/Divorced/Widowed 9.4
WA 10.8
SA & NT 9.3 Education % Household Income# % Investments# %
Primary 0.1 Sole income earner 31.7 No investments 18.6
Part of high school 9.2 Main income earner 22.1 $50,000 or less 16.3
Completed high school 16.2 $50,000 or less 17.9 $50,001 - $150,000 17.4
Diploma or certificate 31.1 $50,001 - $75,000 16.2 $150,001 - $250,000 16.8
Degree qualification 29.8 $75,001 - $100,000 25.1 $250,001 - $350,000 12.2
Postgraduate qualification 13.5 $100,001 - $150,000 26.5 $350,001 - $550,000 6.1
$150,001 - $200,000 9.5 $550,001 - $1 million 6.7
More than $200,000 4.8 More than $1 million 5.9
Base: Current Mortgagors, n=736 * Percentage of all current Mortgagors n=680 ^ Percentage of all those intending to purchase n=399 # Percentage excluding don’t know /prefer not to say responses xx Significantly higher than Intenders xx Significantly lower than Intenders

30 2013 Mortgage Barometer Report
First Home Buyers profile
Property Ownership % Mortgagor type^ % Mortgage recency^ %
Mortgagor, no intention 0.0 First home owner N/A In last 12 months N/A
Mortgagor and intend to buy 0.0 Owner-occupier N/A 2-3 years ago N/A
No mortgage, intend to buy 100 Investor N/A 4-5 years ago N/A
Nett mortgagor 0.0 Investor & owner-occupier N/A More than 5 years ago N/A
Nett intend to buy 100 Holiday house N/A When intend to buy* % Intender status* % Intended property type* %
Within next 3 months 5.9 First Home Buyer 100 Existing house 61.2
In next 4-6 months 12.2 Subsequent home buyer 0.0 Existing unit 32.4
In next 7-12 months 26.0 Investor 3.5 Other existing property 31.1
In next 13-24 months 24.6 New house 48.7
In next 3-5 years 31.3 New unit 29.8
Other new development 23.0
Land 7.0
Sentiment % Interest Rates# %
Future generations will find it harder to buy their first home 84.2 In the 2nd half of 2013…
I am better off owning a home than renting 64.0 Will rise by more than 0.5% 7.5
Property prices will increase strongly in the next three years 42.3 Will rise by up to 0.5% 25.0
The housing price 'bubble' will burst and prices will fall 37.7 Will stay the same 46.2
Worry I’ll never be able to afford my own home 69.2 Will drop by up to 0.5% 19.3
Property is undervalued 12.5 Will drop by more than 0.5% 1.9
Property is overvalued 76.4
Amongst intenders… % Best t ime to buy# %
Prices are high and I cannot afford what I want 51.3 Next 6 months 28.6
Property will become increasingly unaffordable in the next year 50.1 In 7-12 months’ time 24.6
13-18 months’ time 14.5
Avg. Mortgage
Avg. Loan-to-value rat io
Had/have <20% deposit
Loan with Big 4 bank
Use mortgage broker
Current mortgagors N/A N/A N/A N/A N/A
Intend to buy in next 5 years $373,000 61.9 21.2% 46.2% 30.9% Gender % Age % Life Stage %
Male 52.4 18-24 years 29.5 SINKs 25.9
Female 47.6 25-34 years 37.5 DINKs 24.0
35-44 years 25.1 Family, primary aged kids 31.0
45-54 years 7.2 Family, high school aged kids 0.9
55-65 years 0.7 Adult family 16.6
Over 65 years 0.0 Older (55+) singles/couples 1.6
Retirees 0.0 State/Terr itory % Location % Marital Status %
NSW & ACT 35.5 Capital city 69.3 Single 43.1
VIC & TAS 30.6 Regional centre 25.1 Live with partner/married 53.3
QLD 18.4 Rural area 5.7 Separated/Divorced/Widowed 2.5
WA 8.1
SA & NT 7.4 Education % Household Income# % Investments# %
Primary 0.0 Sole income earner 34.6 No investments 34.8
Part of high school 4.8 Main income earner 24.7 $50,000 or less 26.9
Completed high school 19.9 $50,000 or less 22.2 $50,001 - $150,000 12.8
Diploma or certificate 30.5 $50,001 - $75,000 29.5 $150,001 - $250,000 14.3
Degree qualification 33.0 $75,001 - $100,000 15.3 $250,001 - $350,000 2.8
Postgraduate qualification 11.8 $100,001 - $150,000 23.7 $350,001 - $550,000 3.2
$150,001 - $200,000 7.1 $550,001 - $1 million 1.5
More than $200,000 2.2 More than $1 million 3.7
Base: First Home Buyers n=115, * Percentage of all current Mortgagors n=0 ^ Percentage of all those intending to purchase n=115 # Percentage excluding don’t know /prefer not to say responses xx Significantly higher than other groups xx Significantly lower than other groups

31An annual study of the mortgage market in Australia
Owner-Occupier profile
Property Ownership % Mortgagor type^ % Mortgage recency^ %
Mortgagor, no intention 49.4 First home owner 0.0 In last 12 months 13.2
Mortgagor and intend to buy 49.9 Owner-occupier 77.5 2-3 years ago 20.5
No mortgage, intend to buy 0.7 Investor 0.0 4-5 years ago 16.4
Nett mortgagor 99.3 Investor & owner-occupier 22.5 More than 5 years ago 49.9
Nett intend to buy 50.6 Holiday house 0.4 When intend to buy* % Intender status* % Intended property type* %
Within next 3 months 4.9 First Home Buyer N/A Existing house 58.8
In next 4-6 months 4.3 Subsequent home buyer N/A Existing unit 23.5
In next 7-12 months 11.1 Investor N/A Other existing property 20.0
In next 13-24 months 9.4 New house 33.5
In next 3-5 years 21.0 New unit 17.7
Other new development 15.8
Land 5.1
Sentiment % Interest Rates# %
Future generations will find it harder to buy their first home 83.5 In the 2nd half of 2013…
I am better off owning a home than renting 77.7 Will rise by more than 0.5% 4.1
Property prices will increase strongly in the next three years 47.0 Will rise by up to 0.5% 22.5
The housing price 'bubble' will burst and prices will fall 26.6 Will stay the same 40.2
Worry I’ll never be able to afford my own home 13.8 Will drop by up to 0.5% 31.0
Property is undervalued 31.6 Will drop by more than 0.5% 2.2
Property is overvalued 41.8
Amongst intenders… % Best t ime to buy# %
Prices are high and I cannot afford what I want 16.4 Next 6 months 34.6
Property will become increasingly unaffordable in the next year 37.8 In 7-12 months’ time 23.6
13-18 months’ time 13.3
Avg. Mortgage
Avg. Loan-to-value rat io
Had/have <20% deposit
Loan with Big 4 bank
Use mortgage broker
Current mortgagors $283,000 51.04 10.1% 59.6% 36.3% Intend to buy in next 5 years $378,000 63.4 17.7% 67.6% 38.8% Gender % Age % Life Stage %
Male 49.6 18-24 years 3.9 SINKs 11.1
Female 50.4 25-34 years 18.0 DINKs 13.5
35-44 years 27.0 Family, primary aged kids 30.1
45-54 years 26.1 Family, high school aged kids 12.4
55-65 years 16.5 Adult family 10.4
Over 65 years 8.5 Older (55+) singles/couples 11.3
Retirees 10.7 State/Terr itory % Location % Marital Status %
NSW & ACT 30.0 Capital city 62.5 Single 12.4
VIC & TAS 28.1 Regional centre 27.5 Live with partner/married 76.6
QLD 20.3 Rural area 10.0 Separated/Divorced/Widowed 10.6
WA 11.9
SA & NT 9.7 Education % Household Income# % Investments# %
Primary 0.0 Sole income earner 31.3 No investments 20.4
Part of high school 10.6 Main income earner 22.4 $50,000 or less 16.1
Completed high school 18.1 $50,000 or less 19.7 $50,001 - $150,000 16.5
Diploma or certificate 30.8 $50,001 - $75,000 16.4 $150,001 - $250,000 16.2
Degree qualification 27.5 $75,001 - $100,000 21.7 $250,001 - $350,000 12.0
Postgraduate qualification 13.0 $100,001 - $150,000 27.5 $350,001 - $550,000 5.5
$150,001 - $200,000 9.3 $550,001 - $1 million 7.7
More than $200,000 5.5 More than $1 million 5.6
Base: Owner-occupiers n=558 * Percentage of all current mortgagors n=558 ^ Percentage of all those intending to purchase n=285 # Percentage excluding don’t know /prefer not to say responses xx Significantly higher than other groups xx Significantly lower than other groups
First Home Buyers profile
Property Ownership % Mortgagor type^ % Mortgage recency^ %
Mortgagor, no intention 0.0 First home owner N/A In last 12 months N/A
Mortgagor and intend to buy 0.0 Owner-occupier N/A 2-3 years ago N/A
No mortgage, intend to buy 100 Investor N/A 4-5 years ago N/A
Nett mortgagor 0.0 Investor & owner-occupier N/A More than 5 years ago N/A
Nett intend to buy 100 Holiday house N/A When intend to buy* % Intender status* % Intended property type* %
Within next 3 months 5.9 First Home Buyer 100 Existing house 61.2
In next 4-6 months 12.2 Subsequent home buyer 0.0 Existing unit 32.4
In next 7-12 months 26.0 Investor 3.5 Other existing property 31.1
In next 13-24 months 24.6 New house 48.7
In next 3-5 years 31.3 New unit 29.8
Other new development 23.0
Land 7.0
Sentiment % Interest Rates# %
Future generations will find it harder to buy their first home 84.2 In the 2nd half of 2013…
I am better off owning a home than renting 64.0 Will rise by more than 0.5% 7.5
Property prices will increase strongly in the next three years 42.3 Will rise by up to 0.5% 25.0
The housing price 'bubble' will burst and prices will fall 37.7 Will stay the same 46.2
Worry I’ll never be able to afford my own home 69.2 Will drop by up to 0.5% 19.3
Property is undervalued 12.5 Will drop by more than 0.5% 1.9
Property is overvalued 76.4
Amongst intenders… % Best t ime to buy# %
Prices are high and I cannot afford what I want 51.3 Next 6 months 28.6
Property will become increasingly unaffordable in the next year 50.1 In 7-12 months’ time 24.6
13-18 months’ time 14.5
Avg. Mortgage
Avg. Loan-to-value rat io
Had/have <20% deposit
Loan with Big 4 bank
Use mortgage broker
Current mortgagors N/A N/A N/A N/A N/A
Intend to buy in next 5 years $373,000 61.9 21.2% 46.2% 30.9% Gender % Age % Life Stage %
Male 52.4 18-24 years 29.5 SINKs 25.9
Female 47.6 25-34 years 37.5 DINKs 24.0
35-44 years 25.1 Family, primary aged kids 31.0
45-54 years 7.2 Family, high school aged kids 0.9
55-65 years 0.7 Adult family 16.6
Over 65 years 0.0 Older (55+) singles/couples 1.6
Retirees 0.0 State/Terr itory % Location % Marital Status %
NSW & ACT 35.5 Capital city 69.3 Single 43.1
VIC & TAS 30.6 Regional centre 25.1 Live with partner/married 53.3
QLD 18.4 Rural area 5.7 Separated/Divorced/Widowed 2.5
WA 8.1
SA & NT 7.4 Education % Household Income# % Investments# %
Primary 0.0 Sole income earner 34.6 No investments 34.8
Part of high school 4.8 Main income earner 24.7 $50,000 or less 26.9
Completed high school 19.9 $50,000 or less 22.2 $50,001 - $150,000 12.8
Diploma or certificate 30.5 $50,001 - $75,000 29.5 $150,001 - $250,000 14.3
Degree qualification 33.0 $75,001 - $100,000 15.3 $250,001 - $350,000 2.8
Postgraduate qualification 11.8 $100,001 - $150,000 23.7 $350,001 - $550,000 3.2
$150,001 - $200,000 7.1 $550,001 - $1 million 1.5
More than $200,000 2.2 More than $1 million 3.7
Base: First Home Buyers n=115, * Percentage of all current Mortgagors n=0 ^ Percentage of all those intending to purchase n=115 # Percentage excluding don’t know /prefer not to say responses xx Significantly higher than other groups xx Significantly lower than other groups

32 2013 Mortgage Barometer Report
Current Investors profile
Property Ownership % Mortgagor type^ % Mortgage recency^ %
Mortgagor, no intention 25.6 First home owner 0.0 In last 12 months 20.7
Mortgagor and intend to buy 73.5 Owner-occupier 0.0 2-3 years ago 37.4
No mortgage, intend to buy 1.9 Investor 28.3 4-5 years ago 14.7
Nett mortgagor 100 Investor & owner-occupier 71.7 More than 5 years ago 27.2
Nett intend to buy 74.4 Holiday house 0.6 When intend to buy* % Intender status* % Intended property type* %
Within next 3 months 8.5 First Home Buyer N/A Existing house 57.1
In next 4-6 months 8.8 Subsequent home buyer N/A Existing unit 27.6
In next 7-12 months 20.1 Investor N/A Other existing property 23.3
In next 13-24 months 10.3 New house 29.9
In next 3-5 years 26.4 New unit 19.4
Other new development 18.6
Land 7.3
Sentiment % Interest Rates# %
Future generations will find it harder to buy their first home 84.6 In the 2nd half of 2013…
I am better off owning a home than renting 69.4 Will rise by more than 0.5% 3.4
Property prices will increase strongly in the next three years 52.6 Will rise by up to 0.5% 28.0
The housing price 'bubble' will burst and prices will fall 29.4 Will stay the same 35.1
Worry I’ll never be able to afford my own home 18.9 Will drop by up to 0.5% 30.2
Property is undervalued 34.6 Will drop by more than 0.5% 3.4
Property is overvalued 37.7
Amongst intenders… % Best t ime to buy# %
Prices are high and I cannot afford what I want 10.9 Next 6 months 37.4
Property will become increasingly unaffordable in the next year 39.7 In 7-12 months’ time 31.5
13-18 months’ time 13.0
Avg. Mortgage
Avg. Loan-to-value rat io
Had/have <20% deposit
Loan with Big 4 bank
Use mortgage broker
Current mortgagors $382,000 54.9 12.9% 62.3% 45.8% Intend to buy in next 5 years $516,000 64.1 19.1% 62.2% 47.0% Gender % Age % Life Stage %
Male 55.0 18-24 years 4.2 SINKs 10.0
Female 45.0 25-34 years 28.0 DINKs 19.0
35-44 years 31.4 Family, primary aged kids 37.9
45-54 years 23.0 Family, high school aged kids 11.4
55-65 years 12.4 Adult family 9.6
Over 65 years 1.0 Older (55+) singles/couples 7.0
Retirees 3.8 State/Terr itory % Location % Marital Status %
NSW & ACT 34.1 Capital city 74.7 Single 12.8
VIC & TAS 27.8 Regional centre 20.6 Live with partner/married 80.8
QLD 17.4 Rural area 4.7 Separated/Divorced/Widowed 5.8
WA 11.5
SA & NT 9.2 Education % Household Income# % Investments# %
Primary 0.0 Sole income earner 23.7 No investments 2.2
Part of high school 6.2 Main income earner 29.2 $50,000 or less 6.8
Completed high school 16.0 $50,000 or less 7.2 $50,001 - $150,000 9.9
Diploma or certificate 29.5 $50,001 - $75,000 8.5 $150,001 - $250,000 19.4
Degree qualification 33.5 $75,001 - $100,000 27.7 $250,001 - $350,000 15.0
Postgraduate qualification 14.7 $100,001 - $150,000 35.3 $350,001 - $550,000 15.5
$150,001 - $200,000 14.6 $550,001 - $1 million 15.2
More than $200,000 6.8 More than $1 million 16.0
Base: Current Investors n=176 * Percentage of all current mortgagors n=176 ^ Percentage of all those intending to purchase n=131 # Percentage excluding don’t know /prefer not to say responses xx Significantly higher than other groups xx Significantly lower than other groups

33An annual study of the mortgage market in Australia
Potential Investors profile
Property Ownership % Mortgagor type^ % Mortgage recency^ %
Mortgagor, no intention 0.0 First home owner 19.1 In last 12 months 19.0
Mortgagor and intend to buy 79.7 Owner-occupier 37.2 2-3 years ago 33.7
No mortgage, intend to buy 20.3 Investor 12.9 4-5 years ago 18.4
Nett mortgagor 79.7 Investor & owner-occupier 30.8 More than 5 years ago 28.9
Nett intend to buy 100 Holiday house 0.8 When intend to buy* % Intender status* % Intended property type* %
Within next 3 months 8.5 First Home Buyer 7.8 Existing house 54.6
In next 4-6 months 9.8 Subsequent home buyer 8.9 Existing unit 31.3
In next 7-12 months 21.2 Investor 25.7 Other existing property 27.6
In next 13-24 months 19.9 New house 30.6
In next 3-5 years 40.6 New unit 23.7
Other new development 21.1
Land 4.3
Sentiment % Interest Rates# %
Future generations will find it harder to buy their first home 7.3 In the 2nd half of 2013…
I am better off owning a home than renting 12.6 Will rise by more than 0.5% 5.4
Property prices will increase strongly in the next three years 23.9 Will rise by up to 0.5% 25.5
The housing price 'bubble' will burst and prices will fall 38.6 Will stay the same 37.1
Worry I’ll never be able to afford my own home 59.2 Will drop by up to 0.5% 28.0
Property is undervalued 28.4 Will drop by more than 0.5% 4.0
Property is overvalued 45.2
Amongst intenders… % Best t ime to buy# %
Prices are high and I cannot afford what I want 17.4 Next 6 months 27.1
Property will become increasingly unaffordable in the next year 41.1 In 7-12 months’ time 27.0
13-18 months’ time 16.6
Avg. Mortgage
Avg. Loan-to-value rat io
Had/have <20% deposit
Loan with Big 4 bank
Use mortgage broker
Current mortgagors $337,000 55.61 12.3% 66.9% 41.6% Intend to buy in next 5 years $425,000 66.78 19.9% 69.7% 45.1% Gender % Age % Life Stage %
Male 55.9 18-24 years 8.1 SINKs 14.7
Female 44.1 25-34 years 28.2 DINKs 17.1
35-44 years 28.3 Family, primary aged kids 33.3
45-54 years 25.2 Family, high school aged kids 15.7
55-65 years 7.8 Adult family 11.2
Over 65 years 2.3 Older (55+) singles/couples 4.2
Retirees 3.4 State/Terr itory % Location % Marital Status %
NSW & ACT 35.0 Capital city 70.8 Single 19.1
VIC & TAS 29.8 Regional centre 25.4 Live with partner/married 76.1
QLD 19.1 Rural area 3.8 Separated/Divorced/Widowed 4.5
WA 8.4
SA & NT 7.6 Education % Household Income# % Investments# %
Primary 0.7 Sole income earner 33.3 No investments 6.7
Part of high school 3.9 Main income earner 26.0 $50,000 or less 10.4
Completed high school 15.4 $50,000 or less 11.0 $50,001 - $150,000 17.5
Diploma or certificate 27.6 $50,001 - $75,000 11.1 $150,001 - $250,000 19.2
Degree qualification 38.3 $75,001 - $100,000 27.0 $250,001 - $350,000 12.4
Postgraduate qualification 14.1 $100,001 - $150,000 30.6 $350,001 - $550,000 11.6
$150,001 - $200,000 13.2 $550,001 - $1 million 10.8
More than $200,000 7.2 More than $1 million 11.4
Base: Potential Investors n=277 * Percentage of all current mortgagors n=229 ^ Percentage of all those intending to purchase n=277 # Percentage excluding don’t know /prefer not to say responses xx Significantly higher than other groups xx Significantly lower than other groups
Current Investors profile
Property Ownership % Mortgagor type^ % Mortgage recency^ %
Mortgagor, no intention 25.6 First home owner 0.0 In last 12 months 20.7
Mortgagor and intend to buy 73.5 Owner-occupier 0.0 2-3 years ago 37.4
No mortgage, intend to buy 1.9 Investor 28.3 4-5 years ago 14.7
Nett mortgagor 100 Investor & owner-occupier 71.7 More than 5 years ago 27.2
Nett intend to buy 74.4 Holiday house 0.6 When intend to buy* % Intender status* % Intended property type* %
Within next 3 months 8.5 First Home Buyer N/A Existing house 57.1
In next 4-6 months 8.8 Subsequent home buyer N/A Existing unit 27.6
In next 7-12 months 20.1 Investor N/A Other existing property 23.3
In next 13-24 months 10.3 New house 29.9
In next 3-5 years 26.4 New unit 19.4
Other new development 18.6
Land 7.3
Sentiment % Interest Rates# %
Future generations will find it harder to buy their first home 84.6 In the 2nd half of 2013…
I am better off owning a home than renting 69.4 Will rise by more than 0.5% 3.4
Property prices will increase strongly in the next three years 52.6 Will rise by up to 0.5% 28.0
The housing price 'bubble' will burst and prices will fall 29.4 Will stay the same 35.1
Worry I’ll never be able to afford my own home 18.9 Will drop by up to 0.5% 30.2
Property is undervalued 34.6 Will drop by more than 0.5% 3.4
Property is overvalued 37.7
Amongst intenders… % Best t ime to buy# %
Prices are high and I cannot afford what I want 10.9 Next 6 months 37.4
Property will become increasingly unaffordable in the next year 39.7 In 7-12 months’ time 31.5
13-18 months’ time 13.0
Avg. Mortgage
Avg. Loan-to-value rat io
Had/have <20% deposit
Loan with Big 4 bank
Use mortgage broker
Current mortgagors $382,000 54.9 12.9% 62.3% 45.8% Intend to buy in next 5 years $516,000 64.1 19.1% 62.2% 47.0% Gender % Age % Life Stage %
Male 55.0 18-24 years 4.2 SINKs 10.0
Female 45.0 25-34 years 28.0 DINKs 19.0
35-44 years 31.4 Family, primary aged kids 37.9
45-54 years 23.0 Family, high school aged kids 11.4
55-65 years 12.4 Adult family 9.6
Over 65 years 1.0 Older (55+) singles/couples 7.0
Retirees 3.8 State/Terr itory % Location % Marital Status %
NSW & ACT 34.1 Capital city 74.7 Single 12.8
VIC & TAS 27.8 Regional centre 20.6 Live with partner/married 80.8
QLD 17.4 Rural area 4.7 Separated/Divorced/Widowed 5.8
WA 11.5
SA & NT 9.2 Education % Household Income# % Investments# %
Primary 0.0 Sole income earner 23.7 No investments 2.2
Part of high school 6.2 Main income earner 29.2 $50,000 or less 6.8
Completed high school 16.0 $50,000 or less 7.2 $50,001 - $150,000 9.9
Diploma or certificate 29.5 $50,001 - $75,000 8.5 $150,001 - $250,000 19.4
Degree qualification 33.5 $75,001 - $100,000 27.7 $250,001 - $350,000 15.0
Postgraduate qualification 14.7 $100,001 - $150,000 35.3 $350,001 - $550,000 15.5
$150,001 - $200,000 14.6 $550,001 - $1 million 15.2
More than $200,000 6.8 More than $1 million 16.0
Base: Current Investors n=176 * Percentage of all current mortgagors n=176 ^ Percentage of all those intending to purchase n=131 # Percentage excluding don’t know /prefer not to say responses xx Significantly higher than other groups xx Significantly lower than other groups

34 2013 Mortgage Barometer Report
NSW & ACT profile
Property Ownership % Mortgagor type^ % Mortgage recency^ %
Mortgagor, no intention 31.2 First home owner 19.9 In last 12 months 14.7
Mortgagor and intend to buy 38.8 Owner-occupier 54.1 2-3 years ago 27.1
No mortgage, intend to buy 30.0 Investor 9.7 4-5 years ago 17.2
Nett mortgagor 70.0 Investor & owner-occupier 15.4 More than 5 years ago 41.0
Nett intend to buy 68.8 Holiday house 0.8 When intend to buy* % Intender status* % Intended property type* %
Within next 3 months 3.2 First Home Buyer 43.3 Existing house 51.8
In next 4-6 months 10.0 Subsequent home buyer 10.6 Existing unit 31.9
In next 7-12 months 12.5 Investor 9.0 Other existing property 29.5
In next 13-24 months 15.4 New house 29.4
In next 3-5 years 27.8 New unit 22.8
Other new development 19.8
Land 4.4
Sentiment % Interest Rates# %
Future generations will find it harder to buy their first home 78.8 In the 2nd half of 2013…
I am better off owning a home than renting 69.9 Will rise by more than 0.5% 4.1
Property prices will increase strongly in the next three years 47.2 Will rise by up to 0.5% 26.0
The housing price 'bubble' will burst and prices will fall 27.4 Will stay the same 38.4
Worry I’ll never be able to afford my own home 26.4 Will drop by up to 0.5% 30.0
Property is undervalued 20.1 Will drop by more than 0.5% 1.5
Property is overvalued 54.3
Amongst intenders… % Best t ime to buy# %
Prices are high and I cannot afford what I want 23.6 Next 6 months 28.2
Property will become increasingly unaffordable in the next year 44.6 In 7-12 months’ time 23.1
13-18 months’ time 14.8
Avg. Mortgage
Avg. Loan-to-value rat io
Had/have <20% deposit
Loan with Big 4 bank
Use mortgage broker
Current mortgagors $320,000 51.1 9.2% 60.9% 34.1% Intend to buy in next 5 years $439,000 62.1 18.6% 59.2% 37.3% Gender % Age % Life Stage %
Male 54.2 18-24 years 12.4 SINKs 13.8
Female 45.8 25-34 years 25.2 DINKs 13.7
35-44 years 19.1 Family, primary aged kids 30.9
45-54 years 22.2 Family, high school aged kids 9.9
55-65 years 13.2 Adult family 12.6
Over 65 years 7.8 Older (55+) singles/couples 9.4
Retirees 9.4 State/Terr itory % Location % Marital Status %
NSW & ACT 100 Capital city 62.3 Single 19.0
VIC & TAS - Regional centre 30.0 Live with partner/married 71.4
QLD - Rural area 7.7 Separated/Divorced/Widowed 9.2
WA -
SA & NT - Education % Household Income# % Investments# %
Primary 0.3 Sole income earner 33.2 No investments 19.3
Part of high school 8.7 Main income earner 22.2 $50,000 or less 14.6
Completed high school 12.5 $50,000 or less 17.3 $50,001 - $150,000 13.7
Diploma or certificate 30.5 $50,001 - $75,000 18.0 $150,001 - $250,000 19.4
Degree qualification 31.0 $75,001 - $100,000 19.9 $250,001 - $350,000 11.8
Postgraduate qualification 17.0 $100,001 - $150,000 29.0 $350,001 - $550,000 6.3
$150,001 - $200,000 10.9 $550,001 - $1 million 9.3
More than $200,000 4.8 More than $1 million 5.6
Base: Live in NSW/ACT n=330 * Percentage of all current mortgagors n=233 ^ Percentage of all those intending n=227 # Percentage excluding don’t know /prefer not to say responses xx Significantly higher than other states xx Significantly lower than other states

35An annual study of the mortgage market in Australia
VIC & TAS profile
Property Ownership % Mortgagor type^ % Mortgage recency^ %
Mortgagor, no intention 30.4 First home owner 19.5 In last 12 months 17.3
Mortgagor and intend to buy 44.4 Owner-occupier 56.2 2-3 years ago 22.6
No mortgage, intend to buy 25.2 Investor 5.0 4-5 years ago 18.4
Nett mortgagor 74.8 Investor & owner-occupier 18.8 More than 5 years ago 41.8
Nett intend to buy 69.6 Holiday house 1.3 When intend to buy* % Intender status* % Intended property type* %
Within next 3 months 5.4 First Home Buyer 51.1 Existing house 56.7
In next 4-6 months 6.7 Subsequent home buyer 12.7 Existing unit 24.7
In next 7-12 months 13.0 Investor 8.5 Other existing property 26.1
In next 13-24 months 18.0 New house 29.9
In next 3-5 years 26.6 New unit 22.4
Other new development 19.6
Land 7.9
Sentiment % Interest Rates# %
Future generations will find it harder to buy their first home 86.2 In the 2nd half of 2013…
I am better off owning a home than renting 72.1 Will rise by more than 0.5% 5.7
Property prices will increase strongly in the next three years 46.1 Will rise by up to 0.5% 17.2
The housing price 'bubble' will burst and prices will fall 29.1 Will stay the same 47.4
Worry I’ll never be able to afford my own home 25.6 Will drop by up to 0.5% 25.0
Property is undervalued 25.4 Will drop by more than 0.5% 4.7
Property is overvalued 48.1
Amongst intenders… % Best t ime to buy# %
Prices are high and I cannot afford what I want 24.2 Next 6 months 28.6
Property will become increasingly unaffordable in the next year 34.6 In 7-12 months’ time 26.3
13-18 months’ time 17.2
Avg. Mortgage
Avg. Loan-to-value rat io
Had/have <20% deposit
Loan with Big 4 bank
Use mortgage broker
Current mortgagors $297,000 51.8 9.8% 68.0% 40.7% Intend to buy in next 5 years $406,000 62.0 18.8% 69.2% 35.5% Gender % Age % Life Stage %
Male 50.5 18-24 years 7.6 SINKs 15.0
Female 49.5 25-34 years 27.4 DINKs 20.5
35-44 years 31.6 Family, primary aged kids 30.7
45-54 years 16.0 Family, high school aged kids 10.9
55-65 years 12.5 Adult family 8.1
Over 65 years 5.0 Older (55+) singles/couples 6.7
Retirees 7.9 State/Terr itory % Location % Marital Status %
NSW & ACT - Capital city 69.0 Single 18.5
VIC & TAS 100 Regional centre 20.8 Live with partner/married 71.2
QLD - Rural area 10.2 Separated/Divorced/Widowed 9.6
WA -
SA & NT - Education % Household Income# % Investments# %
Primary 0.3 Sole income earner 30.0 No investments 18.2
Part of high school 5.8 Main income earner 24.1 $50,000 or less 18.5
Completed high school 17.4 $50,000 or less 20.9 $50,001 - $150,000 20.8
Diploma or certificate 29.1 $50,001 - $75,000 18.4 $150,001 - $250,000 13.0
Degree qualification 34.4 $75,001 - $100,000 28.8 $250,001 - $350,000 13.1
Postgraduate qualification 13.0 $100,001 - $150,000 20.4 $350,001 - $550,000 5.4
$150,001 - $200,000 7.3 $550,001 - $1 million 5.4
More than $200,000 4.3 More than $1 million 5.6
Base: Live in VIC/TAS n=304 * Percentage of all current mortgagors n=229 ^ Percentage of all those intending n=210 # Percentage excluding don’t know /prefer not to say responses xx Significantly higher than other states xx Significantly lower than other states
NSW & ACT profile
Property Ownership % Mortgagor type^ % Mortgage recency^ %
Mortgagor, no intention 31.2 First home owner 19.9 In last 12 months 14.7
Mortgagor and intend to buy 38.8 Owner-occupier 54.1 2-3 years ago 27.1
No mortgage, intend to buy 30.0 Investor 9.7 4-5 years ago 17.2
Nett mortgagor 70.0 Investor & owner-occupier 15.4 More than 5 years ago 41.0
Nett intend to buy 68.8 Holiday house 0.8 When intend to buy* % Intender status* % Intended property type* %
Within next 3 months 3.2 First Home Buyer 43.3 Existing house 51.8
In next 4-6 months 10.0 Subsequent home buyer 10.6 Existing unit 31.9
In next 7-12 months 12.5 Investor 9.0 Other existing property 29.5
In next 13-24 months 15.4 New house 29.4
In next 3-5 years 27.8 New unit 22.8
Other new development 19.8
Land 4.4
Sentiment % Interest Rates# %
Future generations will find it harder to buy their first home 78.8 In the 2nd half of 2013…
I am better off owning a home than renting 69.9 Will rise by more than 0.5% 4.1
Property prices will increase strongly in the next three years 47.2 Will rise by up to 0.5% 26.0
The housing price 'bubble' will burst and prices will fall 27.4 Will stay the same 38.4
Worry I’ll never be able to afford my own home 26.4 Will drop by up to 0.5% 30.0
Property is undervalued 20.1 Will drop by more than 0.5% 1.5
Property is overvalued 54.3
Amongst intenders… % Best t ime to buy# %
Prices are high and I cannot afford what I want 23.6 Next 6 months 28.2
Property will become increasingly unaffordable in the next year 44.6 In 7-12 months’ time 23.1
13-18 months’ time 14.8
Avg. Mortgage
Avg. Loan-to-value rat io
Had/have <20% deposit
Loan with Big 4 bank
Use mortgage broker
Current mortgagors $320,000 51.1 9.2% 60.9% 34.1% Intend to buy in next 5 years $439,000 62.1 18.6% 59.2% 37.3% Gender % Age % Life Stage %
Male 54.2 18-24 years 12.4 SINKs 13.8
Female 45.8 25-34 years 25.2 DINKs 13.7
35-44 years 19.1 Family, primary aged kids 30.9
45-54 years 22.2 Family, high school aged kids 9.9
55-65 years 13.2 Adult family 12.6
Over 65 years 7.8 Older (55+) singles/couples 9.4
Retirees 9.4 State/Terr itory % Location % Marital Status %
NSW & ACT 100 Capital city 62.3 Single 19.0
VIC & TAS - Regional centre 30.0 Live with partner/married 71.4
QLD - Rural area 7.7 Separated/Divorced/Widowed 9.2
WA -
SA & NT - Education % Household Income# % Investments# %
Primary 0.3 Sole income earner 33.2 No investments 19.3
Part of high school 8.7 Main income earner 22.2 $50,000 or less 14.6
Completed high school 12.5 $50,000 or less 17.3 $50,001 - $150,000 13.7
Diploma or certificate 30.5 $50,001 - $75,000 18.0 $150,001 - $250,000 19.4
Degree qualification 31.0 $75,001 - $100,000 19.9 $250,001 - $350,000 11.8
Postgraduate qualification 17.0 $100,001 - $150,000 29.0 $350,001 - $550,000 6.3
$150,001 - $200,000 10.9 $550,001 - $1 million 9.3
More than $200,000 4.8 More than $1 million 5.6
Base: Live in NSW/ACT n=330 * Percentage of all current mortgagors n=233 ^ Percentage of all those intending n=227 # Percentage excluding don’t know /prefer not to say responses xx Significantly higher than other states xx Significantly lower than other states
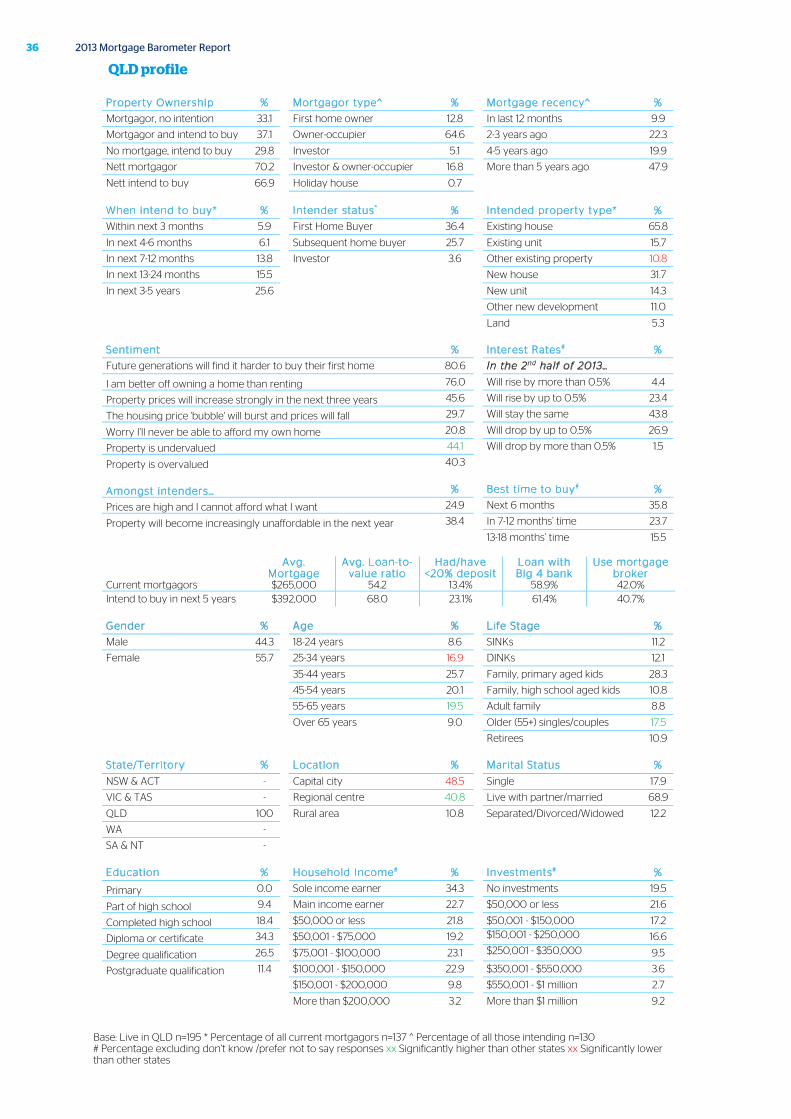
36 2013 Mortgage Barometer Report
QLD profile
Property Ownership % Mortgagor type^ % Mortgage recency^ %
Mortgagor, no intention 33.1 First home owner 12.8 In last 12 months 9.9
Mortgagor and intend to buy 37.1 Owner-occupier 64.6 2-3 years ago 22.3
No mortgage, intend to buy 29.8 Investor 5.1 4-5 years ago 19.9
Nett mortgagor 70.2 Investor & owner-occupier 16.8 More than 5 years ago 47.9
Nett intend to buy 66.9 Holiday house 0.7 When intend to buy* % Intender status* % Intended property type* %
Within next 3 months 5.9 First Home Buyer 36.4 Existing house 65.8
In next 4-6 months 6.1 Subsequent home buyer 25.7 Existing unit 15.7
In next 7-12 months 13.8 Investor 3.6 Other existing property 10.8
In next 13-24 months 15.5 New house 31.7
In next 3-5 years 25.6 New unit 14.3
Other new development 11.0
Land 5.3
Sentiment % Interest Rates# %
Future generations will find it harder to buy their first home 80.6 In the 2nd half of 2013…
I am better off owning a home than renting 76.0 Will rise by more than 0.5% 4.4
Property prices will increase strongly in the next three years 45.6 Will rise by up to 0.5% 23.4
The housing price 'bubble' will burst and prices will fall 29.7 Will stay the same 43.8
Worry I’ll never be able to afford my own home 20.8 Will drop by up to 0.5% 26.9
Property is undervalued 44.1 Will drop by more than 0.5% 1.5
Property is overvalued 40.3
Amongst intenders… % Best t ime to buy# %
Prices are high and I cannot afford what I want 24.9 Next 6 months 35.8
Property will become increasingly unaffordable in the next year 38.4 In 7-12 months’ time 23.7
13-18 months’ time 15.5
Avg. Mortgage
Avg. Loan-to-value rat io
Had/have <20% deposit
Loan with Big 4 bank
Use mortgage broker
Current mortgagors $265,000 54.2 13.4% 58.9% 42.0% Intend to buy in next 5 years $392,000 68.0 23.1% 61.4% 40.7% Gender % Age % Life Stage %
Male 44.3 18-24 years 8.6 SINKs 11.2
Female 55.7 25-34 years 16.9 DINKs 12.1
35-44 years 25.7 Family, primary aged kids 28.3
45-54 years 20.1 Family, high school aged kids 10.8
55-65 years 19.5 Adult family 8.8
Over 65 years 9.0 Older (55+) singles/couples 17.5
Retirees 10.9 State/Terr itory % Location % Marital Status %
NSW & ACT - Capital city 48.5 Single 17.9
VIC & TAS - Regional centre 40.8 Live with partner/married 68.9
QLD 100 Rural area 10.8 Separated/Divorced/Widowed 12.2
WA -
SA & NT - Education % Household Income# % Investments# %
Primary 0.0 Sole income earner 34.3 No investments 19.5
Part of high school 9.4 Main income earner 22.7 $50,000 or less 21.6
Completed high school 18.4 $50,000 or less 21.8 $50,001 - $150,000 17.2
Diploma or certificate 34.3 $50,001 - $75,000 19.2 $150,001 - $250,000 16.6
Degree qualification 26.5 $75,001 - $100,000 23.1 $250,001 - $350,000 9.5
Postgraduate qualification 11.4 $100,001 - $150,000 22.9 $350,001 - $550,000 3.6
$150,001 - $200,000 9.8 $550,001 - $1 million 2.7
More than $200,000 3.2 More than $1 million 9.2
Base: Live in QLD n=195 * Percentage of all current mortgagors n=137 ^ Percentage of all those intending n=130 # Percentage excluding don’t know /prefer not to say responses xx Significantly higher than other states xx Significantly lower than other states

37An annual study of the mortgage market in Australia
WA profile
Property Ownership % Mortgagor type^ % Mortgage recency^ %
Mortgagor, no intention 42.9 First home owner 10.7 In last 12 months 16.8
Mortgagor and intend to buy 25.8 Owner-occupier 64.1 2-3 years ago 29.8
No mortgage, intend to buy 31.3 Investor 4.4 4-5 years ago 9.1
Nett mortgagor 68.7 Investor & owner-occupier 20.8 More than 5 years ago 44.3
Nett intend to buy 57.1 Holiday house 1.3 When intend to buy* % Intender status* % Intended property type* %
Within next 3 months 9.2 First Home Buyer 14.3 Existing house 56.1
In next 4-6 months 16.7 Subsequent home buyer 60.0 Existing unit 18.4
In next 7-12 months 21.7 Investor 36.2 Other existing property 13.0
In next 13-24 months 18.2 New house 51.9
In next 3-5 years 34.2 New unit 12..8
Other new development 23.1
Land 8.6
Sentiment % Interest Rates# % Future generations will find it harder to buy their first home 79.5 In the 2nd half of 2013…
I am better off owning a home than renting 73.3 Will rise by more than 0.5% 3.4
Property prices will increase strongly in the next three years 51.1 Will rise by up to 0.5% 20.2
The housing price 'bubble' will burst and prices will fall 23.5 Will stay the same 46.0
Worry I’ll never be able to afford my own home 18.1 Will drop by up to 0.5% 27.8
Property is undervalued 20.4 Will drop by more than 0.5% 2.6
Property is overvalued 52.9
Amongst intenders… % Best t ime to buy# %
Prices are high and I cannot afford what I want 31.9 Next 6 months 41.5
Property will become increasingly unaffordable in the next year 48.2 In 7-12 months’ time 19.1
13-18 months’ time 11.5
Avg. Mortgage
Avg. Loan-to-value rat io
Had/have <20% deposit
Loan with Big 4 bank
Use mortgage broker
Current mortgagors $331,000 60.7 17.7% 67.2% 38.2% Intend to buy in next 5 years $467,000 67.2 29.1% 65.5% 33.1% Gender % Age % Life Stage %
Male 50.8 18-24 years 9.9 SINKs 12.4
Female 49.2 25-34 years 20.8 DINKs 11.6
35-44 years 19.8 Family, primary aged kids 25.5
45-54 years 25.5 Family, high school aged kids 15.2
55-65 years 8.0 Adult family 11.8
Over 65 years 16.0 Older (55+) singles/couples 4.0
Retirees 18.5 State/Terr itory % Location % Marital Status %
NSW & ACT - Capital city 78.2 Single 20.9
VIC & TAS - Regional centre 15.6 Live with partner/married 71.6
QLD - Rural area 6.2 Separated/Divorced/Widowed 7.5
WA 100
SA & NT - Education % Household Income# % Investments# %
Primary 0.0 Sole income earner 33.6 No investments 26.8
Part of high school 17.1 Main income earner 16.3 $50,000 or less 10.8
Completed high school 20.7 $50,000 or less 32.3 $50,001 - $150,000 9.0
Diploma or certificate 30.1 $50,001 - $75,000 15.4 $150,001 - $250,000 18.0
Degree qualification 22.1 $75,001 - $100,000 11.9 $250,001 - $350,000 15.8
Postgraduate qualification 10.1 $100,001 - $150,000 26.6 $350,001 - $550,000 6.7
$150,001 - $200,000 8.7 $550,001 - $1 million 6.9
More than $200,000 5.1 More than $1 million 6.0
Base: Live in WA n=95 * Percentage of all current mortgagors n=66 ^ Percentage of all those intending n=54 # Percentage excluding don’t know /prefer not to say responses xx Significantly higher than other states xx Significantly lower than other states
QLD profile
Property Ownership % Mortgagor type^ % Mortgage recency^ %
Mortgagor, no intention 33.1 First home owner 12.8 In last 12 months 9.9
Mortgagor and intend to buy 37.1 Owner-occupier 64.6 2-3 years ago 22.3
No mortgage, intend to buy 29.8 Investor 5.1 4-5 years ago 19.9
Nett mortgagor 70.2 Investor & owner-occupier 16.8 More than 5 years ago 47.9
Nett intend to buy 66.9 Holiday house 0.7 When intend to buy* % Intender status* % Intended property type* %
Within next 3 months 5.9 First Home Buyer 36.4 Existing house 65.8
In next 4-6 months 6.1 Subsequent home buyer 25.7 Existing unit 15.7
In next 7-12 months 13.8 Investor 3.6 Other existing property 10.8
In next 13-24 months 15.5 New house 31.7
In next 3-5 years 25.6 New unit 14.3
Other new development 11.0
Land 5.3
Sentiment % Interest Rates# %
Future generations will find it harder to buy their first home 80.6 In the 2nd half of 2013…
I am better off owning a home than renting 76.0 Will rise by more than 0.5% 4.4
Property prices will increase strongly in the next three years 45.6 Will rise by up to 0.5% 23.4
The housing price 'bubble' will burst and prices will fall 29.7 Will stay the same 43.8
Worry I’ll never be able to afford my own home 20.8 Will drop by up to 0.5% 26.9
Property is undervalued 44.1 Will drop by more than 0.5% 1.5
Property is overvalued 40.3
Amongst intenders… % Best t ime to buy# %
Prices are high and I cannot afford what I want 24.9 Next 6 months 35.8
Property will become increasingly unaffordable in the next year 38.4 In 7-12 months’ time 23.7
13-18 months’ time 15.5
Avg. Mortgage
Avg. Loan-to-value rat io
Had/have <20% deposit
Loan with Big 4 bank
Use mortgage broker
Current mortgagors $265,000 54.2 13.4% 58.9% 42.0% Intend to buy in next 5 years $392,000 68.0 23.1% 61.4% 40.7% Gender % Age % Life Stage %
Male 44.3 18-24 years 8.6 SINKs 11.2
Female 55.7 25-34 years 16.9 DINKs 12.1
35-44 years 25.7 Family, primary aged kids 28.3
45-54 years 20.1 Family, high school aged kids 10.8
55-65 years 19.5 Adult family 8.8
Over 65 years 9.0 Older (55+) singles/couples 17.5
Retirees 10.9 State/Terr itory % Location % Marital Status %
NSW & ACT - Capital city 48.5 Single 17.9
VIC & TAS - Regional centre 40.8 Live with partner/married 68.9
QLD 100 Rural area 10.8 Separated/Divorced/Widowed 12.2
WA -
SA & NT - Education % Household Income# % Investments# %
Primary 0.0 Sole income earner 34.3 No investments 19.5
Part of high school 9.4 Main income earner 22.7 $50,000 or less 21.6
Completed high school 18.4 $50,000 or less 21.8 $50,001 - $150,000 17.2
Diploma or certificate 34.3 $50,001 - $75,000 19.2 $150,001 - $250,000 16.6
Degree qualification 26.5 $75,001 - $100,000 23.1 $250,001 - $350,000 9.5
Postgraduate qualification 11.4 $100,001 - $150,000 22.9 $350,001 - $550,000 3.6
$150,001 - $200,000 9.8 $550,001 - $1 million 2.7
More than $200,000 3.2 More than $1 million 9.2
Base: Live in QLD n=195 * Percentage of all current mortgagors n=137 ^ Percentage of all those intending n=130 # Percentage excluding don’t know /prefer not to say responses xx Significantly higher than other states xx Significantly lower than other states

38 2013 Mortgage Barometer Report
SA & NT profile
Property Ownership % Mortgagor type^ % Mortgage recency^ %
Mortgagor, no intention 36.5 First home owner 13.7 In last 12 months 19.9
Mortgagor and intend to buy 39.3 Owner-occupier 61.8 2-3 years ago 21.6
No mortgage, intend to buy 24.2 Investor 7.2 4-5 years ago 11.2
Nett mortgagor 75.8 Investor & owner-occupier 16.1 More than 5 years ago 47.2
Nett intend to buy 63.5 Holiday house 1.1 When intend to buy* % Intender status* % Intended property type* %
Within next 3 months 7.1 First Home Buyer 15.2 Existing house 52.2
In next 4-6 months 4.7 Subsequent home buyer 63.9 Existing unit 20.5
In next 7-12 months 18.7 Investor 38.2 Other existing property 25.8
In next 13-24 months 20.8 New house 31.8
In next 3-5 years 48.7 New unit 11.2
Other new development 28.5
Land 0.0
Sentiment % Interest Rates# %
Future generations will find it harder to buy their first home 88.5 In the 2nd half of 2013…
I am better off owning a home than renting 66.7 Will rise by more than 0.5% 9.8
Property prices will increase strongly in the next three years 48.7 Will rise by up to 0.5% 30.4
The housing price 'bubble' will burst and prices will fall 27.9 Will stay the same 40.7
Worry I’ll never be able to afford my own home 27.7 Will drop by up to 0.5% 19.2
Property is undervalued 27.1 Will drop by more than 0.5% 0.0
Property is overvalued 33.7
Amongst intenders… % Best t ime to buy# %
Prices are high and I cannot afford what I want 21.6 Next 6 months 34.0
Property will become increasingly unaffordable in the next year 45.8 In 7-12 months’ time 24.2
13-18 months’ time 17.6
Avg. Mortgage
Avg. Loan-to-value rat io
Had/have <20% deposit
Loan with Big 4 bank
Use mortgage broker
Current mortgagors $223,000 50.6 10.3% 44.7% 43.8% Intend to buy in next 5 years $303,000 62.0 9.7% 49.4% 40.4% Gender % Age % Life Stage %
Male 53.4 18-24 years 6.1 SINKs 13.3
Female 46.6 25-34 years 19.0 DINKs 19.6
35-44 years 22.8 Family, primary aged kids 25.1
45-54 years 27.6 Family, high school aged kids 10.5
55-65 years 15.2 Adult family 11.2
Over 65 years 9.4 Older (55+) singles/couples 6.6
Retirees 13.9 State/Terr itory % Location % Marital Status %
NSW & ACT - Capital city 69.2 Single 12.4
VIC & TAS - Regional centre 23.5 Live with partner/married 80.4
QLD - Rural area 7.2 Separated/Divorced/Widowed 7.2
WA -
SA & NT 100 Education % Household Income# % Investments# %
Primary 0.0 Sole income earner 26.9 No investments 25.2
Part of high school 2.9 Main income earner 29.4 $50,000 or less 20.4
Completed high school 22.2 $50,000 or less 27.9 $50,001 - $150,000 18.4
Diploma or certificate 41.9 $50,001 - $75,000 24.5 $150,001 - $250,000 17.4
Degree qualification 26.7 $75,001 - $100,000 20.9 $250,001 - $350,000 2.5
Postgraduate qualification 6.3 $100,001 - $150,000 19.4 $350,001 - $550,000 9.2
$150,001 - $200,000 3.8 $550,001 - $1 million 4.2
More than $200,000 3.5 More than $1 million 2.6
Base: Live in SA/NT n=93 * Percentage of all current mortgagors n=71 ^ Percentage of all those intending n=59 # Percentage excluding don’t know /prefer not to say responses xx Significantly higher than other states xx Significantly lower than other states

39An annual study of the mortgage market in Australia
SA & NT profile
Property Ownership % Mortgagor type^ % Mortgage recency^ %
Mortgagor, no intention 36.5 First home owner 13.7 In last 12 months 19.9
Mortgagor and intend to buy 39.3 Owner-occupier 61.8 2-3 years ago 21.6
No mortgage, intend to buy 24.2 Investor 7.2 4-5 years ago 11.2
Nett mortgagor 75.8 Investor & owner-occupier 16.1 More than 5 years ago 47.2
Nett intend to buy 63.5 Holiday house 1.1 When intend to buy* % Intender status* % Intended property type* %
Within next 3 months 7.1 First Home Buyer 15.2 Existing house 52.2
In next 4-6 months 4.7 Subsequent home buyer 63.9 Existing unit 20.5
In next 7-12 months 18.7 Investor 38.2 Other existing property 25.8
In next 13-24 months 20.8 New house 31.8
In next 3-5 years 48.7 New unit 11.2
Other new development 28.5
Land 0.0
Sentiment % Interest Rates# %
Future generations will find it harder to buy their first home 88.5 In the 2nd half of 2013…
I am better off owning a home than renting 66.7 Will rise by more than 0.5% 9.8
Property prices will increase strongly in the next three years 48.7 Will rise by up to 0.5% 30.4
The housing price 'bubble' will burst and prices will fall 27.9 Will stay the same 40.7
Worry I’ll never be able to afford my own home 27.7 Will drop by up to 0.5% 19.2
Property is undervalued 27.1 Will drop by more than 0.5% 0.0
Property is overvalued 33.7
Amongst intenders… % Best t ime to buy# %
Prices are high and I cannot afford what I want 21.6 Next 6 months 34.0
Property will become increasingly unaffordable in the next year 45.8 In 7-12 months’ time 24.2
13-18 months’ time 17.6
Avg. Mortgage
Avg. Loan-to-value rat io
Had/have <20% deposit
Loan with Big 4 bank
Use mortgage broker
Current mortgagors $223,000 50.6 10.3% 44.7% 43.8% Intend to buy in next 5 years $303,000 62.0 9.7% 49.4% 40.4% Gender % Age % Life Stage %
Male 53.4 18-24 years 6.1 SINKs 13.3
Female 46.6 25-34 years 19.0 DINKs 19.6
35-44 years 22.8 Family, primary aged kids 25.1
45-54 years 27.6 Family, high school aged kids 10.5
55-65 years 15.2 Adult family 11.2
Over 65 years 9.4 Older (55+) singles/couples 6.6
Retirees 13.9 State/Terr itory % Location % Marital Status %
NSW & ACT - Capital city 69.2 Single 12.4
VIC & TAS - Regional centre 23.5 Live with partner/married 80.4
QLD - Rural area 7.2 Separated/Divorced/Widowed 7.2
WA -
SA & NT 100 Education % Household Income# % Investments# %
Primary 0.0 Sole income earner 26.9 No investments 25.2
Part of high school 2.9 Main income earner 29.4 $50,000 or less 20.4
Completed high school 22.2 $50,000 or less 27.9 $50,001 - $150,000 18.4
Diploma or certificate 41.9 $50,001 - $75,000 24.5 $150,001 - $250,000 17.4
Degree qualification 26.7 $75,001 - $100,000 20.9 $250,001 - $350,000 2.5
Postgraduate qualification 6.3 $100,001 - $150,000 19.4 $350,001 - $550,000 9.2
$150,001 - $200,000 3.8 $550,001 - $1 million 4.2
More than $200,000 3.5 More than $1 million 2.6
Base: Live in SA/NT n=93 * Percentage of all current mortgagors n=71 ^ Percentage of all those intending n=59 # Percentage excluding don’t know /prefer not to say responses xx Significantly higher than other states xx Significantly lower than other states

40 2013 Mortgage Barometer Report

41An annual study of the mortgage market in Australia
AppendixUSING THIS RESEARCHIt is important that clients should be aware of the limitations of survey research.
Qualitative Research
Qualitative research deals with relatively small numbers of respondents and attempts to explore in–depth motivations, attitudes and feelings. This places a considerable interpretative burden on the researcher. For example, often what respondents do not say is as important as what they do. Similarly, body language and tone of voice can be important contributors to understanding respondents’ deeper feelings.
Readers should therefore recognise:
• that despite the efforts made in recruitment, respondents may not always be totally representative of the target audience concerned
• that findings are interpretative in nature, based on the experience and expertise of the researchers concerned
Quantitative Research
Even though quantitative research typically deals with larger numbers of respondents, readers of survey results should be conscious of the limitations of all sample survey techniques.
Sampling techniques, the level of refusals, and problems with non-contacts all impact on the statistical reliability that can be attached to results.
Similarly quantitative research is often limited in the number of variables it covers, with important variables beyond the scope of the survey.
Hence the results of sample surveys are usually best treated as a means of looking at the relative merits of different approaches as opposed to absolute measures of expected outcomes.
The Role of Researcher and Client
GfK Australia believes that the researchers’ task is not only to present the findings of the research but also to utilise our experience and expertise to interpret these findings for readers and to make our recommendations (based on that interpretation and our knowledge of the market) as to what we believe to be the optimum actions to be taken in the circumstances: indeed this is what we believe clients’ seek when they hire our services. Such interpretations and recommendations are presented in good faith, but we make no claim to be infallible.
Readers should, therefore, review the findings and recommendations in the light of their own experience and knowledge of the market and base their actions accordingly.
Quality Control and Data Retention
GfK Australia is a member of the Australian Market and Social Research Organisations (AMSRO) and complies in full with the Market Research Privacy Principles. In addition all researchers at GfK Australia are AMSRS members and are bound by the market research Code of Professional Behaviour.
GfK Australia is an ISO 20252 accredited company and undertakes all research activities in compliance with the ISO 20252 quality assurance standard.
Raw data relating to this project shall be kept as per the requirements outlined in the market research Code of Professional Behaviour.

This page left blank intentionally


J4006
QBE Insurance Group Limited
82 Pitt St, Sydney NSW 2000 Australia
t +61 2 9375 4444www.qbe.com


![Barometer [2006]](https://img.pdfslide.net/doc/110x75/577d35011a28ab3a6b8f584c/barometer-2006.jpg)