Embed Size (px)
Citation preview

2013 Report Cardfor North Carolina’s Infrastructure
Aviation
Beaches & Inlets
Bridges
Dams
Drinking Water
Energy
Rail
Roads
Public Schools
Storm Water
Wastewater

2013 Report Card for North Carolina’s Infrastructure Table of Contents
P a g e | 2
Introduction……………………………………………………………………………………………… 3
Grades Summary………………………………………………………………………………………. 4
Aviation…………………………………………………………………………………………………….. 5
Beaches and Inlets……………………………………………………………………………………. 18
Bridges…………………………………………………………………………………………………….. 29
Dams………………………………………………………………………………………………………... 36
Drinking Water………………………………………………………………………………………… 44
Energy……………………………………………………………………………………………………… 55
Rail…………………………………………………………………………………………………………. 64
Roads……………………………………………………………………………………………………….80
Public Schools………………………………………………………………………………………… 90
Stormwater……………………………………………………………………………………………… 95
Wastewater…………………………………………………………………………………………… 101

2013 Report Card for North Carolina’s Infrastructure Introduction
P a g e | 3
ASCE’s 2013 Report Card for North Carolina’s Infrastructure
As North Carolinians, we owe our economic prosperity, public safety, and quality of life to the infrastructure that serves us every day. As stewards of that infrastructure, civil engineers are obliged to inform the public and policy makers about its condition and how best to make improvements. ASCE’s key solutions may be ambitious and will not be achieved overnight, but Americans are capable of such real and positive change.
What Can Raise North Carolina’s Infrastructure Grades?
PROMOTE SUSTAINABILITY-BASED PHILOSOPHIES FOR ASSET MANAGEMENT.
PROMOTE ALTERNATIVE FINANCING AND CONSTRUCTION DELIVERY
METHODOLOGIES.
DEVELOP/INCREASE DEDICATED FUNDING PLANS.
DEVELOP AND MAINTAIN INFRASTRUCTURE RATINGS AT STATE AND LOCAL
LEVELS.
INCREASE PUBLIC AWARENESS FOR INFRASTUCTURE.
About the North Carolina Section ASCE Founded: 1852 North Carolina Section Chartered: 1923 Non-profit Organization [501(c)(3)] Membership: 3,076 Website: www.ascenc.org
Subdivisions (Branches):
Costal (Wilmington)
Eastern (Raleigh)
Northern (Greensboro/Winston-Salem)
Southern (Charlotte)
Western (Asheville)


2013 Report Card for North Carolina’s Infrastructure
Aviation D+
P a g e | 5
Overview
Aviation remains a crucial industry in the state of
North Carolina, adding an estimated $26B to the
state’s economy every year from the state’s 72
publically owned airports. The state’s commercial
airports handled approximately 52 million
passengers in 2011. The NC Department of
Transportation Division of Aviation has developed a
very comprehensive plan for General Aviation
Airports, but the plan has not been funded by the
legislature. Unfortunately, a significant funding
shortfall has resulted in a deterioration of the existing
system of airports in the state. More funding is
needed to insure that the system can be maintained
and necessary improvements are made to
accommodate increasing demand at North Carolina Airports.
An overall assessment of the condition of the North Carolina aviation infrastructure was conducted taking
into account pavement conditions for runways, taxiways and aprons, current and future funding, safety,
and passenger cost/satisfaction. As a result, North Carolina’s Aviation Infrastructure has been given a
grade of D+.
Background
North Carolina’s state motto “First In Flight” comes from its history as the birthplace of the aviation industry with Orville and Wilbur Wright’s first flight in Kitty Hawk, North Carolina, in 1903. Since then, aviation has become a very vital part of America’s economy by opening up the state to both national and international access and adding an estimated $26B per year to the North Carolina economy. This is an increase of $16.5B dollars in additional impacts to the state over the past 6 years a growth of 274 percent. In the state, there are 91 publicly owned airports and heliports, of which 9 are classified as Air Carrier (AC) Airports that have regularly scheduled flights provided by the airlines. Since 2006, North Carolina has lost

2013 Report Card for North Carolina’s Infrastructure
Aviation D+
P a g e | 6
2 passenger service airports. These losses were of regularly scheduled air carrier service to small rural markets in the state. These reductions were a result of changes in demand during the recession and to a loss of subsidies air carriers received to provide service in rural markets. North Carolina is one of the original 3 states that chose to participate in the State Block Grant Program. In this program the state assumed responsibility to administer Airport Improvement Program (AIP) grants to airports classified as nonprimary commercial service, relieve and general aviation airports. The FAA retained all primary or Air Carrier Airports and dispenses the grants directly from the FAA Airport District Office. The Air Carrier Airports also receive funding from the North Carolina Department of Transportation (NCDOT) Division of Aviation There are 63 airports classified as General Aviation (GA) airports which receive federal and state funds that are administered by the Division of Aviation. The remaining 16 GA airports are listed as Private Use and do not receive government funding. Together, these airports handled approximately 52 million passengers in 2011. This represents an increase of 33 percent passenger traffic in 6 years. Charlotte Douglas International has moved up in its ranking to the 11th busiest airport in the nation handling over 39 million passengers in 2011 and was at 38 million passengers through November 2012 or a 6% year to year growth rate. It was also ranked 25th in the world for passenger traffic and 8th busiest in the world for operations in 2010 and 2011 respectively. In 2010, their third parallel runway opened allowing for more traffic, and now the airport is working to construct a 4th parallel runway. Raleigh-Durham International ranked 42 in the nation by passengers. The FAA lists 7,704 GA aircraft registered in NC utilizing the public airports this is an increase of over 30 percent since 2006. With an increasing use of these facilities, more maintenance and expansion may be necessary. The past five years have not been without major challenges for the aviation industry in North Carolina and the nation. Many of the major U.S. airlines have gone through structured re-organizations, bankruptcies,
mergers or a combination of these events. Charlotte Douglas international (CLT), the state’s busiest airport, is getting ready for possible changes with a U.S. Airways and American Airlines merger approaches a deal that would create the largest airline in the world. This is not something that is totally new or unexpected for CLT, since it was only a few years ago that US Airways and America West merged. Charlotte is ranked 25th in the world for passenger traffic and 8th busiest in the world for operations in 2010 and 2011 respectively. This increase in traffic and operations are directly related to the opening of their third parallel runway in 2010. The airport is working to construct a 4th parallel runway to allow for continued growth. The housing collapse had a domino effect that
was felt throughout the nation and in every industry, and most industries experienced job losses and cut backs after the recession started. The airline industry was no different, but they adjusted quickly by reducing the number of flights and increasing the load factor on the flights that they kept so they were
Year Origin Destination Total
2006 21,541,870 21,553,834 43,095,704
2007 23,808,488 23,828,316 47,636,804
2008 24,321,946 24,328,621 48,650,567
2009 23,699,947 23,708,332 47,408,279
2010 25,349,733 25,361,321 50,711,054
2011 25,764,667 25,807,374 51,572,041
2012* 15,524,880 15,543,593 31,068,473
*2012 only thru July RITA Air Carriers: T-100 Market

2013 Report Card for North Carolina’s Infrastructure
Aviation D+
P a g e | 7
more efficient with less empty seats. In North Carolina only 2009 passenger volume was less than the previous year’s volume. North Carolina Air Carrier Passengers
Raleigh Durham International Airport (RDU) is North Carolina’s second busiest airport, classified as a medium hub airport, and showed a greater impact to the passenger volume as shown in the table below. This demonstrates the difference in airports when you compare an originating and destination airport verse a larger hub that also has a large number of connecting flights for people that not calling CLT their final destination. The Table below shows that 2009 was the only year that CLT and RDU had less passenger traffic than the previous year. The larger hub airport was not affected by the state’s economy as much as the medium and small airports were having experience only a two hundred thousand drop in passengers. The general aviation airports were hit very hard at the beginning of the recession due primarily to the increase in fuel cost. The Avgas and Jet A prices for General Aviation rose faster than the prices for automobiles. Fuel costs at most NC General Aviation airports climbed to the $6 to $7 range for Avgas and just slightly cheaper for Jet A $5.50 to
$6.50. GA pilots either stopped flying altogether or greatly reduced their operations. This down turn has allowed some GA airports an opportunity to complete projects and put themselves on a path to greater success as the economy recovers. The projects were completed with less traffic to impact and at a time when some projects were coming in at better bid prices since so many contractors were desperate for infrastructure work. The NC Aviation industry must be ready to maintain this growth by providing funding levels from the legislature that will allow for needed capital improvements to keep up with the reinvigorated demand. The assessment of NC aviation infrastructure includes: pavement condition; funding vs. needs; safety; and passenger costs and satisfaction. The individual assessments are summarized in the following sections.
Pavement Condition Index (PCI)
Public Law 103-305, section 107, amended Title 49, Section 47105, of the United States Code mandates airport sponsors provide assurances on preventative maintenance for project applications involving airfield pavements. For any pavement rehabilitation reconstruction project, each airport sponsor must provide assurances to the FAA that they have implemented an effective pavement maintenance
Year Charlotte
Total Raleigh-Durham
Total
2006
29,693,949
9,432,925
2007
33,165,688
10,037,424
2008
34,739,020
9,715,828
2009
34,536,666
8,973,398
2010
38,254,207
9,101,920
2011
39,043,708
9,161,279
2012
41,228,372
9,220,391
*2012 only thru July RITA Air Carriers: T-100 Market

2013 Report Card for North Carolina’s Infrastructure
Aviation D+
P a g e | 8
management program. The amendment also provides for the submittal of reports addressing the pavement condition and the management program. The requirement to establish a pavement maintenance management program applies to any pavement at the airport which has been constructed, reconstructed, or repaired, with federal assistance. All grants involving pavement rehabilitation or reconstruction contain a grant assurance that addresses the pavement maintenance obligation. FAA Advisory Circular 150/5380-6, Guidelines and Procedures for Maintenance of Airport Pavements, is used for specific guidelines and procedures for maintaining airport pavements and establishing an effective maintenance program. Specific types of distress, their probable causes, inspection guidelines, and recommended methods of repair are presented. The NCDOT Division of Aviation undertook a comprehensive initiative in 2004, referred to as the “North Carolina General Aviation Airport Development Plan” which focused on the airports under its jurisdiction. This plan evaluated the needs at the general aviation airports and set minimum state standards for their development. In this plan the airport needs in the system were identified and prioritized. One of the requirements for capital improvements and maintenance established was to institute the FAA mandated maintenance management program. As part of this program a Pavement Condition Index (PCI index) of all pavements was established to monitor and assess the aging of pavement over time. The initial PCI survey was conducted in 2002 and updated in 2004. The New PCI data from 2006 and 2010 is shown below and one of the most dominating items is the fact that the NC Division of Aviation has added 23 million square feet of pavement area to their pavement condition index since the 2004. This number incorporates the addition of some new pavements and inclusion of airfield pavements that were not originally part of the survey. Findings of the PCI survey were as follows:
NC Pavement Management System Database
(2004 data in black and 2002 data in red)
59 Publicly Owned/Operated General: Aviation Airports: Primary Pavement Only
Section Number % Area Wt. Avg. PCI PCI
Rating Pavement Area (sf)
Runway 112 54 75 (74) Fair 26,693,376
Taxiway 174 24 75 (79) Fair 11,705,127
Apron 153 23 76 (76) Good 11,305,229
439 49,703,732
48,341,646
North Carolina Airport pavements equate to the following: 2,070,989 ft. of 24 ft. wide pavement or 392 miles of 2 lane roads. If the average general aviation runway is 75 ft. wide, North Carolina would have a 662,716 ft. runway or 133 runways 5,000 ft. long. There is 5,522,637 sq. yd. of pavement. At a cost of $46 per sq. yd. each the pavement value alone is over $254 million dollars. This assumed an average pavement of 4” Asphalt on 8” of Crushed aggregate stone base but this does not include any of the other needed infrastructures such as

2013 Report Card for North Carolina’s Infrastructure
Aviation D+
P a g e | 9
drainage, airfield lighting, etc. 2004 2002
Color PCI Range PCI Rating No. of Sections % Area No. of Sections % Area
Excellent 89-100 154 30 125 29
Good 76-88 50 15 89 24
Fair 55-75 167 41 138 32
Poor 40-54 48 10 40 10
Failing 0-39 20 4 27 4
NC Pavement Management System Database (2010 data in black and 2006 data in red)
63 Publicly Owned/Operated General Aviation Airports
Section Number % Area Wt. Avg. PCI PCI Rating Pavement Area (sf)
Runway 153 (141) 53.2 (54.7) 75 (73) Fair 38,484,543
Taxiway 243 (223) 24.5 (22.8) 78 (78) Good 17,667,159
Apron 222 (188) 22.3 (22.5) 70 (72) Fair 16,137,069
439 (552) 72,288,771
(64,306,465)
In 2010 the North Carolina Airport pavements equated to the following: 3,012,032 ft. of 24 ft. wide pavement or 570 miles of 2 lane roads. This is a 145% increase in pavement included in the study. If the average general aviation runway is 75 ft. wide, North Carolina would have a 963,850 ft. runway or 193 runways 5,000 ft. long. This is 8,032,086 sq. yd. of pavement. At a cost of $46 per sq. yd., the pavement value is over $373 million dollars. This assumed an average pavement of 4” Asphalt on 8” of Crushed aggregate stone base but does not

2013 Report Card for North Carolina’s Infrastructure
Aviation D+
P a g e | 10
include any of the other needed infrastructures items such as drainage or air field lighting, etc.
2010 2006
Color PCI Range PCI Rating No. of Sections % Area No. of Sections % Area
Excellent 89-100 286 41 245 34.5
Good 76-88 98 17 81 19.3
Fair 55-75 152 29 147 25.9
Poor 40-54 38 0.3 38 9.5
Failing 0-39 46 13 42 10.9
This data indicates that the pavement conditions have improved slightly over the test periods. The pavements considered good to excellent increased from 53% to 58%, the pavement in the Fair category increased from 26% to 29% and the pavement in the poor to failing category decreased from 20% to 14%. This trend is currently in a positive direction for the airports pavement condition but the
individual PCI category failing pavements have increased from 11% to 13% illustrating that more can still be done. The PCI rating shows that the emphasis made by the state to fund pavement projects is making a difference on the overall pavement condition of the North Carolina general aviation airports pavement. The states goal is to have all pavements maintained above a PCI of 55 at North Carolina GA airports. This is an improvement that is evident above since the PCI program was commenced in 2002 by the division of aviation to monitor the pavement conditions at North Carolina GA airports. The Air Carrier airports individually perform their own pavement management programs as a requirement for funding eligibility from the FAA. Their pavements are considered to be in better condition due to recent construction activity.
0% 20% 40% 60% 80% 100%
2010
2006
Percent Area
Year
PCI Ratings Per % Area of Pavement
Excellent
Good
Fair
Poor
Failing

2013 Report Card for North Carolina’s Infrastructure
Aviation D+
P a g e | 11
Funding
In 1987, the NC General Assembly revised its aviation funding approach to credit the aviation users with the general taxes paid into the state treasury. While North Carolina does not have any aviation-specific taxes like some other states (i.e. fuel tax, registration fee, etc.), each purchaser of aviation products and services is subject to payment of the statewide 4% sales tax. Owners of aircraft registered in NC pay personal property or ad volorem taxes based on the assessed value of the aircraft. These vary by county and may also include city property taxes as well. In addition, if one purchases an aircraft registered in NC; they are subject to a 3% sales tax capped currently at $1500. The Continuing Aviation Appropriations statute passed by the legislature in 1987 provides that the Department of Revenue will, each year, develop an estimate of the total amount of sales taxes paid on aviation products and services and that figure will then be used by the General Assembly in setting the biennial amount of the State Aid to Airports Program. Although this statute was modified in recent years to reflect growth rates associated with North Carolina’s General Fund, the program has grown to in excess of $10 million and has allowed the development of a more reliable multi-year aviation funding program for use in the DOT’s Transportation Improvement Program. In addition, each NC County collects personal property taxes from aircraft owners annually. These taxes go into the county’s general fund and are generally not earmarked for investment into the local airport. NCDOT Division of Aviation administers the State Aid to Airports Program. North Carolina participates in the FAA “Block Grant Program”, meaning the state has assumed responsibility for administration and distribution of FAA grants to general aviation airports. Airport Improvement Program (AIP) funding for Passenger Service airports are directly administered by the FAA. The NC General Aviation Transportation Improvement Plan (TIP) for 2013-2017 has identified a need for $763M over the period to bring all airports in the program to the state recommended standards. The current focus of aviation in the state has been to increase safety and overall condition of the infrastructure. The state after setting priorities on the projects listed in TIP has begun awarding design and construction grants to projects. This method of funding projects to allow construction to occur after designs are complete and bidding has occurred has sped up some projects. This is an improvement to the system and projects are awarded on merit and need. At the present funding levels only critical issues are being addressed where additional maintenance could extend the life of many other needed infrastructure items. FAA has granted funding through the AIP program which helps in narrowing the gap, but levels are inadequate. In 2007 the funding levels by the FAA were $ 6.4 M in discretionary funds and $9.4M in non-primary entitlement funds. By 2012 the discretionary funds have been increased to $17.3M and while the entitlement funds remained $9.4 M from the FAA to GA airports in NC. Over the same period the state aid to airports has also increased from $12.9 M in 2007 to $18.4 M in 2012. Though this is an increase in annual funding of approximately 7% per year for projects at NC airports at these rates it does not reduce the funding requirements as the needs and project cost continue to rise.

2013 Report Card for North Carolina’s Infrastructure
Aviation D+
P a g e | 12
Safety
Looking at the incidents/accidents that occurred in North Carolina in 2007 and 2012 only 28 and 31 were reported during each year respectively. These are both a reduction from the total reported for 2005 which was 42 incidents. In both years examined there were no fatalities and only 7 injuries reported. The continued low number of accidents and fatalities indicate that safety programs and their implementation are having a positive effect and continue to make air travel the safest form of transportation. Local and state authorities are to be commended for their efforts to improve safety through obstruction clearing, installation of NAVAIDS and maintenance of
infrastructure.
Passenger Costs/Satisfaction
Statistics and assessment in this area are based only on the air carrier airports in the state. The airports included are Charlotte Douglas, Greensboro/High Point, Raleigh-Durham, Asheville, Fayetteville and Wilmington. Average Air Fares per flight is monitored by the US Bureau of Transportation statistics and normalized on a regular basis. In the chart on the next page pricing is compared to a national average (see blue line) for the three major airports in the state. The Raleigh Durham International Airport consistently provided better fares than the national average. Both the Charlotte Douglas International Airport and the Piedmont Triad International Airport (Greensboro) are consistently above national averages, although in the past 5 years show these prices fluctuation with the national average and vary between Charlotte and Greensboro having better prices. One thing to remember is that Charlotte offers direct service to many more destinations than any other airport in the state and is the only Large Hub. Airports are classified as large, medium or small hubs by the number of flights and passengers they serve yearly.
Figure 1. Obstruction Removal Project

2013 Report Card for North Carolina’s Infrastructure
Aviation D+
P a g e | 13
Average Air Fares Per Flight in North Carolina Verse the National Average When normalized for traffic, overall prices come close to the national average across the 3 airports. Statistics for the last twelve months ending in October of 2012 show that on-time arrival and departures percentage for 2012 at NC airports have improved substantially in comparison to 2007 as seen below:
2012 2007 Airport Arrival Departure Arrival Departure
Asheville 80 82 70 73 Charlotte 86 87 71 72 Fayetteville 81 84 61 70 Greensboro 76 81 70 75 Raleigh/Durham 81 84 73 78 Wilmington 85 88 66 76
$200.00
$250.00
$300.00
$350.00
$400.00
$450.00
Q1 Q2 Q3 Q4 Q1 Q2 Q3 Q4 Q1 Q2 Q3 Q4 Q1 Q2 Q3 Q4 Q1 Q2 Q3 Q4 Q1 Q2 Q3
2007 2008 2009 2010 2011 2012
(Average Air Fares: 2007 Q1 to 2012 Q3) U.S Dom Avg Fare
(Average Air Fares: 2007 Q1 to 2012 Q3) Charlotte, NC
(Average Air Fares: 2007 Q1 to 2012 Q3) Greensboro/High Point, NC
(Average Air Fares: 2007 Q1 to 2012 Q3) Raleigh/Durham, NC

2013 Report Card for North Carolina’s Infrastructure
Aviation D+
P a g e | 14
On a more detailed analysis for 2012 through October of the 3 major airports fared as follows: ARRIVALS
Airport Arrivals %On-Time Avg. Delay (min) US Ranking Charlotte 242,163 86 49.1 2 Greensboro 21,088 76 62.6 N/A Raleigh 62,033 81 53.8 N/A
DEPARTURES Airport Departures %On-Time Avg. Delay (min) US Ranking Charlotte 241,809 87 53.8 10 Greensboro 21,208 81 77.9 N/A Raleigh 62,332 84 63.8 N/A
In general the 3 major airports were close to the national average in terms of on time arrivals and departures. And all have shown great improvements as the industry as a whole has improved its on time performance and reduced delays. Charlotte Douglas addition of a third parallel runway has been a key to its improved performance though added capacity in all weather conditions. This data was from RITA – Bureau of Transportation Statistics, the airlines are required to report their performance on a regular basis. In a 2010 North America Airport Satisfaction study conducted by JD Power and Associates whereby they developed an Airport Satisfaction Index based on a 1,000 point scale, in the Large Airport Rankings (30 M passengers or more per year) Charlotte scored 697 points vs. a median of 665 (range 609-705). This is an improvement over the 2006 study for Charlotte that also included a change in airport category from medium to Large. Raleigh scored 715 in the Small Airport Ranking (< 10 M passengers per year) against an average score of 721 (Range 645-777). Raleigh has also shown an increase since the last study and is only a few hundred thousand passengers away from becoming a medium airport.
Grading
The overall grade was derived by weighing ratings for each category. Pavement Condition rating and Funding accounted for 30% each, Safety and Passenger Cost/Satisfaction accounted for 20% each. For Pavement Condition rating using a grading system based on 58% of pavements rated Good or Excellent the grade for this section was a D. The grade was upgraded to a D+ overall based on better pavement conditions at the Air Carrier airports and the continued progress observed through the state PCI. The plan developed to address the GA airport’s pavement remains very good and deserved a grade of B or better, however until the PCI results earn a higher grade by themselves, it remains a plan for the future at general aviation airports and action is still required. Due to the significant shortfall in funding both for the short and long terms, grade for this section is F. The current TIP list $763mil in needs and would take 17 years at $45mil per year in funding to complete. This level of funding does not account for any new projects added or inflation cost over the time period. It will

2013 Report Card for North Carolina’s Infrastructure
Aviation D+
P a g e | 15
be crucial for this situation to be resolved in order to maintain a safe and reliable General Aviation system in the state. A grade of B+ has been assigned for safety because no fatalities occurred during the years observed and the number of accidents has stayed lower than during the previous study. Aviation has always focused on safety improvements and with improvements to individual airports each year this trend should continue In terms of passenger cost/satisfaction, North Carolina ranked average or slightly above average in all categories reviewed. A trend that has improved consistently over the past 5 years has been On-Time performances; this improvement needed to be factored in to the overall score and was thus given a C+ grade in this category. The expansion projects at NC air carrier airports in the past few years has improved on time performance and reduced delays. These improvements to the infrastructure have allowed the system to perform better. The overall grade using the above allocation was D +.
Categories Weighting Factor Grade
Pavement Condition Index 0.30 D Funding 0.30 F Safety 0.20 B+ Passenger Cost/Satisfaction 0.20 C+
North Carolina Aviation Grade D+
Policy Options
North Carolina has shown that it continues to be one of the fastest growing states in terms of population and it is also evident by looking at the growth at Charlotte-Douglas Airport that trend is also reflective in the aviation system. While the NCDOT Division of Aviation has been making strides to enact improvements throughout the General Aviation airports they are going to continue to have to make choices due to insufficient funding. The short term needs will always be overshadowed by the growing long term funding short falls. The current funding level of $21M per year needs to be increased by over 5 times
that amount to begin to make true and lasting progress on an estimated short fall over $500M in the 5 year plan. Funding for the Air Carrier airports is mainly derived from the FAA through the Airport Improvement Program (AIP). This program funding relies partially on revenues generated by federal airline ticket taxes and fees. While still short of needs, it has been adequate to address immediate needs, while the shortfall in
Figure 2. Macon County Airport Ramp Reconstruction

2013 Report Card for North Carolina’s Infrastructure
Aviation D+
P a g e | 16
General Aviation is reaching a crucial stage. While FAA funds have helped in implementing some of the most crucial needs, significant additional funds need to be derived from state and local sources. The 2010 Pavement Condition Survey indicates that pavement ratings are getting better over the last 5 years pointing to more investment of funding on the pavements at the federal, state and local levels. Though with this improvement in pavements there are still those that were rated better a few years ago than they are now falling into lower rated categories. A significant part of the reason for these lower ratings is that many of the pavements have now surpassed their design life. Funding is not able to keep pace with the need to enact repairs or increase capacity. Both commercial service and general aviation airports should also take advantage of the latest advances in research regarding pavements developed under the Innovative Pavement Research Program (IPRF) and implement new design and maintenance practices. The state has taken steps in the past few years emphasizing the needs to maintain airports as safe as possible. This has been to include certain aspects within their funding requirements for the airports. Statistics indicate that safety is still improving and the Division is keeping safety as a high priority. This is even being looked at through ways to improve safety of airports by reducing airfield attractants with innovative ways of stormwater control supported by NC Department of Environment and Natural Resources. Every step possible should be taken to insure that quality is improved. A number of innovative approaches that have been successful in other states could be more widely implemented such as including innovative Design options, life cycle cost analysis and value engineering. Contracting practices should be reviewed, e.g. lowest initial cost is not necessarily the lowest cost for the consumer when taking into account delays, change orders, credit and bonding issues. Hold industry more responsible for the pavements they place under contracts can help extend the life of the new pavement. Use less prescriptive requirements and move toward performance based specifications. The Division of Aviation’s 2012 Economic Contribution of Airports in North Carolina highlights the impacts that General Aviation and Commercial airports have in the state. This information along with educating elected officials and the public should be used in highlighting the importance of the aviation industry. A thriving aviation economy shows where new industry, jobs and mobility exist within the state of North Carolina.
Recommendations
Encourage development of realistic, fact based Life-Cycle costs analysis methods and implement them through alternative bids as primary decision tools as opposed to “lowest price”
Encourage practices for lowering overall costs of construction by implementing value engineering principles as mandated by the FAA.
Consider alternatives for increasing funds available for general aviation airports through alternative funding sources such as state and local fuel taxes and user fees, additional bond issues, and increase of Passenger Facility Charges at air carrier airports, etc.
Require aircraft property taxes are used for airport improvements projects.

2013 Report Card for North Carolina’s Infrastructure
Aviation D+
P a g e | 17
Encourage local politicians to work diligently in the legislature to secure significant additional funds to support the General Aviation plan.
Encourage a shift from prescriptive specifications to performance based specifications. Increase design life for pavements by increasing utilization of new technologies such as
those developed under the IPRF program.
Sources
US Bureau of Transportation Statistics, FHWA, State Transportation Statistics, online data on Aviation
Statistics at http://www.bts.gov
US Bureau of Transportation Statistics, Research and Innovative Technology Administration, Air Carriers T-
100 Market http://www.transtats.bts.gov
NC Department of Transportation, Division of Aviation, published data.
NC Department of Transportation 2012 Annual Performance Report
US Federal Aviation Administration, Pavement Maintenance Program and statistics available at
http://www.faa.gov
US Federal Aviation Administration, Aviation Accident Database & Synopses http://www.faa.gov
North Carolina Airports Association, http://ncairports.org
NC ASCE 2006 Report Card
US National Transportation safety Board statistics at http://www.ntsb.gov
NC DOT, Division of Aviation, 2012 Economic Contribution of Airports in North Carolina
Raleigh-Durham International Airport, Passenger Statistics and Activity Reports
Charlotte Douglas International Airport, Aviation Activity
JD Power and Associates, 2010 North America Airport Satisfaction Study http://www.jdpower.com

2013 Report Card for North Carolina’s Infrastructure
Beaches and Inlets C-
P a g e | 18
Overview
North Carolina is renowned for its 326 miles of ocean shoreline, barrier islands and 19 active inlet
complexes. North Carolina beaches and inlets have tremendous economic value and serve as important
habitat for fish and wildlife resources. Beaches and inlets support millions of recreational visitors every
year, provide billions of dollars in economic value through business and tourism, provide ocean access for
commercial and recreational fishermen, and are an integral part of the state’s history, culture, identity and
way of life.
However, without effective planning, management and reliable funding sources, the future of the state’s
coastal communities and a significant part of the state’s economic base could be adversely affected by
storms, shifting shorelines, channel shoaling
and shoreline erosion. North Carolina has
encouraged reasonable development
guidelines with construction setbacks based
on localized erosion rates, building height
restrictions and freeboard incentives.
However, many of these areas have reached
the point where maintenance of the sand
dunes and berms are now needed to provide
coastal storm damage reduction. Increased
utilization of dredged materials for
shoreline protection offers opportunities to
provide needed commercial and
recreational navigation improvements and
reduce coastal storm damage .
This review considered the current conditions of the state’s beaches and inlets as well as recent reductions
in federal and state funding. As a result, North Carolina’s Beaches and Inlets Infrastructure has been given a
grade of C-.
Background
Sustainable management of the state’s beaches and inlets requires regional approaches considering related
coastal features rather than merely a singular project-focused methodology. By adopting a regional beach
and inlet management approach, functioning coastal systems are taken into account, including natural
processes as well as anthropogenic actions. In addition, planning projects on a regional scale balances
environmental and economic needs while facilitating collaboration and pooling of local resources. To this
end, the North Carolina coast has been divided into four main beach and inlet management regions with

2013 Report Card for North Carolina’s Infrastructure
Beaches and Inlets C-
P a g e | 19
multiple sub-regions as well. The regions were developed based on: common elements in geology, physical
coastal processes, shoreline development, erosion patterns and rates, sediment transport pathways,
potential beach-compatible sand resource locations, dredging considerations, shoreline development
trends, and sociopolitical boundaries.
NC Beach and Inlet Management Regions and Sub-regions
Currently allowed strategies consist of beach nourishment, inlet dredging/bypassing, inlet channel
realignment/relocation/management, temporary sandbags and structure relocation. The use of terminal
groins in four (4) locations as pilot projects has also recently been approved by the N.C. General Assembly.
Beach and inlet management strategies are often interrelated and interconnected. For example, sediment
being dredged from inlets might be a possible sand source for coastal storm damage reduction (CSDR)
projects.
Over the last few decades, the State of North Carolina has had an average of 1.5 - 2.0 million cubic yards
(cy) of CSDR projects completed annually at a combined cost (federal, state and local) of approximately $19
million per year. The State of North Carolina has had 5.0 - 7.5 million cy of dredging completed annually

2013 Report Card for North Carolina’s Infrastructure
Beaches and Inlets C-
P a g e | 20
during recent history at a combined cost of $24 - $33 million per year. While the historic data provide a
valuable background, the data does not include all coastal areas where related activities may be required.
An estimated annual cost was developed using shoreline erosion data, historical beach nourishment and
dredging data (since these data were the only statewide information suitable to develop a plan cost) and
approximated unit costs. Ultimately, these funds could support a full suite of strategies including CSDR,
inlet relocation/management, estuarine shoreline and wetland restoration, relocation of structures and
improved beach access.
Accounting for storm impacts and other coastal areas that may require future management, the State of
North Carolina should plan on having 4.0 – 5.5 million cubic yards of CSDR completed annually (long term
average – may fluctuate due to storms) at a combined cost of $45 - $55 million per year. Adding the
existing inlet dredging costs (14 inlets) would bring the overall total to $75 - $85 million per year.
Including the Atlantic Intracoastal Waterway (AIWW) dredging would increase this total to $80 – $95
million per year. This cost includes federal, state, and local participation. The federal interest may
continue to cover a significant portion of the funding required ($15 - $30 million per year for dredging and
CSDR). Overall, the state and local share for these projects would need to start at $30 – $40 million dollars
per year and may ultimately reach $70 - $80 million per year if all developed shorelines in the state require
a CSDR project.
Conditions
Beaches
North Carolina’s need for CSDR projects has become critically important in protecting coastal
infrastructure, local tourism, and small businesses. Local governments are investigating self-engineered
projects while those communities with federal projects struggle for continued Congressional
authorizations and appropriations.
A 2008 coastal erosion analysis developed a vulnerability estimate of existing coastal infrastructure.
Location of infrastructure relative to the shoreline or setback distance is an important parameter in
considering vulnerability. Seaward limits of existing infrastructure were delineated based on 2004 aerial
photographs and use of exiting geographic information system (GIS) data. The seaward edge of structures
was digitized from aerial photography and a straight line interpolation performed between adjacent
structures. GIS data was used to establish the seaward edge of roadways. The distance between the
infrastructure and 2004 mean high water line was measured at 50 m (164 ft) increments. The table below
shows the results. Given that a single storm event can cause anywhere from 25 – 100 ft of shoreline
erosion, one can see that a significant portion of the developed coastline is only one or two storms away
from incurring significant damage.

2013 Report Card for North Carolina’s Infrastructure
Beaches and Inlets C-
P a g e | 21
Preliminary Vulnerability Assessment
Shallow Draft Inlets and Waterways
Maintaining a safe and navigable condition in NC’s shallow draft inlets and waterways has become an
annual/quarterly/monthly challenge. As federal funding for dredging these inlets (especially the five (5)
shallow drafts) has waned in Presidential budgets, Congressional actions have been necessary to keep the
inlets and waterways navigable. The N.C. Division of Water Resources (DWR), the Wilmington District and
participating shallow draft sponsors are working toward a five (5) year Memorandum of Agreement (MOA)
providing the United States Army Corps of Engineers (USACE) with the funding to maintain these inlets’
function. The tables below outline authorized depths as well as survey date conditions within shoaled
portions of these channels. An example inlet (Lockwoods Folly) is also shown to illustrate the inlet
conditions at the ocean bar which is often where the limiting conditions are found as well as an
encroaching shoal within the AIWW crossing. As can be seen, many of the state’s shallow draft inlets and
waterways have significant shoaled areas limiting use of the authorized depths. Note that these depths are
very dynamic and reflect only the time when they were surveyed.
Inlet Conditions
Inlet Authorized Depth
(ft.)
Limiting Shoal Depth Range
(ft.)
USACE Survey Date
Oregon -14.0 -3.9 to -12.8 12 February 2013
Hatteras -10.0 -4.4 to -5.8 15 March 2012
Ocracoke -18.0 -6.6 to -8.2 4 November 2012
Barden -7.0 -2.8 to -4.8 3 October 2011
Bogue -8.0 -4.1 to -5.8 3 November 2012
New River -6.0 -3.5 to -5.0 4 November 2012
Topsail -8.0 -4.2 to -5.5 10 January 2013
Masonboro -14.0 -5.2 to -7.6 19 March 2012
Carolina Beach -8.0 -2.8 to -5.4 15 January 2013
Lockwoods Folly -8.0 -2.7 to -4.5 6 November 2012
Shallotte -4.0 -1.2 to -2.5 30 April 2010
Distance between MHW and
Structure (ft)
Portion of Shoreline in
State (%)
<60 0%
61-100 2%
101-150 8%
151-200 16%
201-250 12%
>250 42%
No Structure 49%

2013 Report Card for North Carolina’s Infrastructure
Beaches and Inlets C-
P a g e | 22
AIWW Inlet Crossing Conditions
Inlet Authorized
Depth
(ft.)
Limiting Shoal Depth Range
(ft.)
USACE Survey Date
Bogue -12.0 -2.1 to -4.0 22 January 2013
Cedar Bush Cut -12.0 -7.8 to -9.7 9 January 2013
Topsail -12.0 -1.1 to -4.5 11 January 2013
Mason -12.0 -3.3 to -5.0 30 July 2012
Shinn -12.0 -5.3 to -6.6 5 November 2012
Carolina Beach -12.0 -5.0 to -6.9 15 January 2013
Lockwoods Folly -12.0 -1.6 to -5.1 14 November 2012
Shallotte -12.0 -0.5 to -1.9 14 November 2012
Example Inlet/AIWW Crossing Conditions

2013 Report Card for North Carolina’s Infrastructure
Beaches and Inlets C-
P a g e | 23
Funding
North Carolina funds coastal protection projects as part of a cost-sharing grant program that supports
seven types of capital intensive, large-scale water resource projects through the DWR. The DWR
administers the program and provides the grants to units of local government for the non-federal cost of
federally-authorized water resources development projects, such as those administered by the USACE, and
for water resources development projects undertaken by local governments. The state funds projects by a
capital (one-time) appropriation that is normally taken from surplus funds of the preceding fiscal year (FY)
and not tied to a specific funding source like a dedicated fee.
Based on a summary review of past DWR project funding levels, several observations can be made about
both overall programmatic, navigation and coastal storm damage reduction funds:
DWR project funding is significant in magnitude and scope. From FY 01/02 to FY 11/12, DWR funded 36
federal projects and approximately 350 non-federal projects at a total cost of $196 million.
Project funding has been relatively stable but appears to be decreasing due to the recent national economic
downturn. Funding totaled $37.1 million in FY 01/02, decreased over the next three fiscal years, and
leveled off at around $20 million in FY 05/06 through FY 07/08. Funding fell to less than $5 million in FY
08/09 due to the significant national economic downturn. Funding has remained relatively low (<$10
million mark) since that time. (See figure below.)
The variety, cost and scale of the projects supported by the fund vary greatly. Many projects receive a
single appropriation, while dredging and waterway maintenance efforts may receive funding periodically
over the life of the project. Projects range in cumulative costs from $25,000 for a small one-time drainage
project to $69.1 million for the Wilmington Harbor Deepening, which was funded over multiple years.
Finally, CSDR project funding has fluctuated from year to year ranging from less than $100,000 in FY 10/11
to $8 million in FY 01/02. In total from FY 01/02 to FY 11/12, DWR’s Water Resources Development
Project Grant Program has provided $24.9 million in cost-sharing grants for CSDR projects. Given the
recent trend in state funding levels, it is apparent that North Carolina’s investment in its own beaches and
inlets is falling well short of the need to maintain historical levels.

2013 Report Card for North Carolina’s Infrastructure
Beaches and Inlets C-
P a g e | 24
DWR Project Funds
As for federal funding, funding for dredging has been fairly consistent as of late with $25.6 M to $34.3M
being provided from FY 09 to FY 12. Federal funding for CDSR projects has been much more varied ranging
from $2.5M to $26.8M over the same time period. Future federal funding levels for CDSR projects are
expected to be less than $10M annually.
Socio-Economic Value of Beaches and Inlets to North Carolina
North Carolina beaches and inlets have tremendous economic importance to the state providing billions of dollars in economic value through business and tourism, residential and commercial property value, water access for commercial and recreational fishermen, and the marina and boat building industries. Beaches and inlets generate $3 billion annually in revenue and directly support 39,000 jobs in coastal communities. When multipliers (total business sales supported and total jobs supported) are added, these numbers rise to $4.9 billion and 62,100 jobs. The developed portions of the ocean shoreline also represent a considerable investment. The value of coastal property at risk for three of the most developed oceanfront counties (New Hanover, Carteret and Dare) is $2.8 billion. The recreational consumer surplus resulting from beaches and inlets is over $400 million annually.
$-
$5,000,000
$10,000,000
$15,000,000
$20,000,000
$25,000,000
$30,000,000
$35,000,000
$40,000,000
FY 01/02 FY 02/03 FY 03/04 FY 04/05 FY 05/06 FY 06/07 FY 07/08 FY 08/09 FY 09/10 FY 10/11 FY 11/12
Water Resources Development Projects
Funding Expenditures

2013 Report Card for North Carolina’s Infrastructure
Beaches and Inlets C-
P a g e | 25
The value of maintaining North Carolina’s coastal infrastructure was further illustrated through the economic impact modeling performed. A 50 percent loss in statewide beach widths was estimated to result in a total economic impact loss of $428 million and 5,600 jobs, with consumer surplus beach recreational value declining more than $19 million and shore/bank fishing consumer surplus by over $1 million. The second modeling scenario of six inlets (Ocracoke, Barden, Bogue, New Topsail, Carolina Beach and Lockwoods Folly) shoaling to 50 percent of the current depth resulted in estimated annual economic loss of over $40 million and 780 associated jobs.
With an annual return of investment of $60 / $1 spent ($4.9B / $80M-ultimate need), the state must
protect and maintain these coastal infrastructure features.
Grade Summary
Grades were assigned to the beach and inlet infrastructure category in three areas. A grade of B was given
to the beaches given their current condition. However, this grade could be changed drastically if required
maintenance plans are not put into place soon in the event of significant coastal storms. A grade of D was
given to the inlets and waterways due to continued issues with shoaling and the inlets essentially
functioning at significantly less than the authorized depths. A grade of D- was given to funding due to the
continued erosion of federal and state funding for beaches and inlets. One recent positive is action by the
state to explore the development of a long term MOA with the USACE for shallow draft inlet maintenance
dredging. Those three categories combined for an overall grade of C- for North Carolina’s beaches and
inlets.
2008
Total Impacts 2008
2008 2008 2008 Business Total Impacts 2008
Assessed Direct Direct Activity/Sales/Output Employment Recreation Value
Property Value Expenditures Employment (incl. multiplier effects) (incl. multiplier effects) (Consumer Surplus) (2)
(millions) (millions) (thousands of jobs) (millions) (thousands of jobs) (millions)
Residential Coastal Property at Risk (1) $1,180 N/A N/A N/A N/A N/A
Commercial Coastal Property at Risk (1) $1,644 N/A N/A N/A N/A N/A
Beach RecreationN/A $1,468 23.5 $2,554 35.2 192
Charter/Headboat FishingN/A $221 1.5 $446 6.3 202
Private BoatingN/A $74 1.7 $140 2.5 22
MarinasN/A $90 2.3 $170 3.5 N/A
Boat BuildingN/A $885 3.8 $1,190 7.1 N/A
Commercial Fishing & Seafood ProcessingN/A $258 4.7 $337 5.8 N/A
Marine Recreation ServicesN/A $10 1.6 $21 1.7 No Data
NC TOTALS$2,824 $3,006 39.0 $4,858 62.1 416

2013 Report Card for North Carolina’s Infrastructure
Beaches and Inlets C-
P a g e | 26
Categories Grade
Beaches B Inlets and Waterways D Funding D-
North Carolina Beaches and Inlets Grade
C-
Policy Options
Beach and inlet projects can be expensive, technically challenging, and full of complex legal and regulatory issues. Planning, funding and implementing a CSDR project is difficult for an individual local government. Policy changes have been identified that would support more cost-effective and environmentally sound management of the state’s beaches and inlets including: 1) expanded use of regional planning; 2) a dedicated state fund supporting regional projects; 3) allowing local governments to raise funds by use of increased sales taxes; and 4) development of engineered beach plans by local governments maximizing potential FEMA restoration efforts following federally declared disaster events.
These changes would place North Carolina at the forefront of coastal states seeking to improve the comprehensive management, restoration and preservation of their beaches and inlets. The regional planning model could provide coordinated project planning and management within a region, maximizing efficiency and cost-saving opportunities such as area-wide sand search investigations, comprehensive shoreline monitoring for all regional projects, and coordinated environmental investigations and studies. Planning projects regionally allows for an “efficiency of scale,” which can reduce the costs associated with individual projects. In addition to reducing costs, a regional approach avoids individual local governments competing for the same resource and allows for better management of potential cumulative and secondary impacts facilitating comprehensive environmental protection.
Regional project planning could also simplify coordination between state and local governments. Rather than coordinating activities with multiple municipalities, the state would work with a regional planning entity, authority or project coordinator. In the form of a regional beach and inlet management authority, local partners could develop a project financing structure that uses funding options that are most appropriate for the cooperating local governments. Creation of a state dedicated fund for beach and inlet management projects would make state project contributions more predictable and give local governments a better foundation for local financing plans. Carteret County (Region 2C) is currently implementing this model fully and other regions are following suit in varying levels.
A dedicated state fund would create a more manageable and predictable level of state expenditures, allowing for better planning for coastal needs with less stress on the limited general revenues. The fund would also reduce financial uncertainties at the local level that often contribute to project delays, increase costs and disrupt local planning efforts. A reliable and predictable state funding source would allow coastal communities to make informed decisions about allocation of new or existing sales or property tax revenues, knowing the state was committed to sharing the costs. With project uncertainties reduced, the dredging industry could better anticipate upcoming work; increasing competition and potentially reducing project costs. A dedicated source of state funding could also lead to the development of innovative

2013 Report Card for North Carolina’s Infrastructure
Beaches and Inlets C-
P a g e | 27
technologies by the dredging industry which could also result in cost savings. With greater financial predictability, uncertainty can be reduced at all phases of implementation. Economic studies have shown that there is a willingness to pay by the users if they know that the additional taxes/fees will be used for a dedicated purpose.
Local governments should also have the option to raise beach and inlet management funds with local option sales taxes. During these times of reduced federal and state participation, local governments need additional tools to raise additional funds to help maintain these projects.
According to FEMA guidelines, if a hurricane or storm impacts a beach and a federal disaster declaration is
issued; local governments may be eligible for either “emergency” or “permanent” post-storm assistance to
repair or restore damaged beaches. In effect, this FEMA “insurance policy” pays 75% of the cost to restore
the beach while the state also contributes with the remaining 25%.
Federally funded emergency sand placement projects can be done on both “natural” and “engineered”
beaches when necessary to protect improved property from an immediate threat. Emergency projects are
modest in scale and are intended to provide only limited, short-term protection in the immediate aftermath
of a hurricane or storm. Typically, FEMA will pay to establish a berm or dune that can withstand a five-year
storm.
In contrast, a restored or engineered beach is eligible for what is termed “permanent repair” if it has been “routinely maintained” prior to the disaster. A beach is considered to be an "improved beach" if: (1) the beach was constructed by the placement of sand to a designed elevation, width, grain size and slope; and (2) the beach has been maintained in accordance with a maintenance program involving the periodic re-nourishment of sand at least every 5 years. Therefore, local governments should develop engineered project designs and maintenance plans to maximize potential federal participation in restoration projects after federally declared disaster events.
Recommendations
Within the next two years, the General Assembly should pass legislation allowing local
governments to develop local dedicated beach/inlet funding streams by increasing local
sales taxes and by any other methodology that the General Assembly might deem
appropriate.
Within the next five years, the General Assembly should pass legislation to develop a state
beach and inlet management fund using dedicated funding streams such as increased boat
registration fees, increased coastal fishing license fees, reallocation of existing marine fuel
taxes, and increased sales taxes on coastal rentals.
After the state beach and inlet management fund has begun, develop incentives (prioritized
funding, streamlined permitting, etc.) encouraging regional planning and investigations to
leverage sand resources as cost-effectively and efficiently as possible.

2013 Report Card for North Carolina’s Infrastructure
Beaches and Inlets C-
P a g e | 28
The General Assembly should strengthen legislation requiring that all beach quality
sediment that is dredged from navigation channels must be returned to the beach system.
Other non-beach compatible sediments should be used to create/restore habitat or reduce
sound-side flooding effects if possible.
The state should investigate current regulatory practices to remove duplicative efforts
required by federal and state regulations as well as encourage the development of
programmatic permitting vehicles.
Local project sponsors should design and monitor their projects so that the criterion for
FEMA reimbursement is maximized. In this way, sediment lost during a federally-declared
disaster could be replaced at no cost to the local sponsor.
Sources
NCDENR, NC Beach and Inlet Management Plan. 2011.
USACE and NCDWR. Funding level spreadsheets. 2012.
http://www.saw.usace.army.mil/Missions/Navigation/HydrographicSurveys/InletsCrossings.aspx
http://www.saw.usace.army.mil/Missions/Navigation/HydrographicSurveys/AIWW/CFRLR.aspx

2013 Report Card for North Carolina’s Infrastructure
Bridges C-
P a g e | 29
Overview
North Carolina’s natural beauty and varied geography of mountains,
rivers, lakes, streams and beaches presents citizens of the state with
a wealth of opportunity for recreation and travel. This also presents
a significant challenge to transportation officials, legislators, and
engineers to provide safe passage on a heavily traveled and aging
infrastructure. Bridges and culverts are a critical component of the
highway system as they cross roadways, streams, and major bodies
of water to keep the system connected and motorists and commerce
moving. North Carolina is ranked fourteenth in the United States for
bridge surface area with more than 28 million square feet of bridge
deck to maintain1. The North Carolina Department of Transportation
(NCDOT) is tasked with maintaining the majority of these structures
and currently provides the state with a Bridge Health Index of 64.2
percent2. In accordance with the Federal Highway Administration’s
(FHWA) National Bridge Inspection Standards (NBIS), state bridge
inspectors have provided bridge ratings for all bridges and culverts
spanning at least 20 feet. Currently there are 13,558 state maintained bridges, including 5,462 bridges that
are structurally deficient and/or functionally obsolete3. While
NCDOT currently funds a $200 million bridge improvement
program, a significant investment in bridge repair and
replacements will be required as bridges reach the end of their
service life. Nearly two thousand bridge projects will have been
awarded for rehabilitation, replacement and preservation between
July 2011 and December 2013. North Carolina’s bridge needs will
require an increase in funding not only for new highway bridges,
but simply to maintain the aging system. As a result, North
Carolina’s Bridge Infrastructure receives a grade of C-.
Background
This chapter focuses on highway bridges on the National Bridge Inventory (NBI) and state maintained
structures less than 20 feet in length. The NBI program requires inspections to be performed on highway
bridges and culverts spanning at least 20 feet at least once every 24 months. NCDOT further inspects state
maintained structures less than 20 feet on the same 24 month cycle. The data collected from these
inspections are recorded and reported in the FHWA National Bridge Inventory database. The NBIS
provides a standard for all bridges to determine the overall structural and functional condition. Individual
Figure 4. NCDOT Bridge Health Index (January 22, 2013)
Figure 3. I-85 Yadkin River Bridge, Photo Courtesy of NCDOT

2013 Report Card for North Carolina’s Infrastructure
Bridges C-
P a g e | 30
category ratings are combined to provide a sufficiency rating for the structure. The sufficiency rating is
used by FHWA and NCDOT in order to determine funding eligibility.
The NBIS sufficiency rating is a compilation of
individual component and conditions ratings that
essentially grade the health of the structure.
Technically, the sufficiency rating is used to establish
eligibility and help determine the priority for federal
rehabilitation or replacement funding. Individual
components specified in the NBIS include structural
condition, serviceability, bridge function, public
utility, and special FHWA considerations.
Components are rated from 0, indicating failed
condition, to 9, indicating excellent condition. The
total scale for the bridge sufficiency rating is 0 to
100. Bridges with sufficiency ratings over 80 are
ineligible for federal funding except as provided
under Moving Ahead for Progress in the 21st Century Act (MAP-21)4. Bridges with ratings between 50 and
80 meet the standard for rehabilitation funding. Bridges with ratings below 50 qualify for federal bridge
replacement funds5.
Structurally Deficient and Functionally Obsolete
The terms structurally deficient and functionally obsolete refer to specific condition ratings within the
NBIS6. Structurally deficient and functionally obsolete bridges may remain in service without any
indication to the traveling public of substandard conditions. The two terms are used as indicators for
FHWA and NCDOT to develop rehabilitation and replacement program funding. Bridges are categorized as
structurally deficient when load carrying components are rated by a bridge inspector as unable to carry the
originally designed load. The functionally obsolete designation refers to structures that may have outdated
barriers, less than full width travel lanes, or require a reduction in travel speed to safely cross.. Factors
contributing to functional obsolescence include narrow shoulder and lane widths, waterway adequacy,
traffic volume increase, and vehicle weight increase. A designation of functionally obsolete provides the
bridge owner the opportunity and time frame to upgrade the structure in an effort to meet current design
standards. Bridges may be both structurally deficient and functionally obsolete; however these structures
are categorized as structurally deficient for prioritization purposes.
Figure 5. Bonner Bridge Repairs, Photo Courtesy of NCDOT

2013 Report Card for North Carolina’s Infrastructure
Bridges C-
P a g e | 31
Facts and Issues
Currently NCDOT has 18,169 bridges and culverts that
are reported to the NBI, with an average age of 39 years
old. Within this group, 33 percent of the bridges are 50
years or older. There will be 168 bridges in the system
that will turn 50 years old in 2013. Bridges were
traditionally designed for a 50 year design life, and the
lack of funding is extending the service of the structure
beyond the intended bridge life. Today bridges are
designed with a more sustainable 75 year lifespan and in
some instances 100 years. While new structures are
considering a longer service life, the facts above illustrate an aging infrastructure that is in need of
investment.
Structure age does not tell the entire story. Older bridges do not necessarily indicate a failing system.
Older bridges, if properly maintained, can support current and future transportation needs without system
interruptions.
Capacity
Bridge capacity is the ability of the structure to carry
existing and future goods and population without causing
delay in the highway system. Capacity deficiencies for
bridges include geometric constraints that limit roadway
expansion, safety restrictions resulting in lower design
speeds, and structural deficiencies where bridges are posted
for restricted weight limits. Deficiencies in any of these
categories results in reduced vehicular traffic and the overall
capacity of the highway system.
Presently NCDOT is reporting approximately 4,000 weight
restricted bridges. This represents 29 percent of all bridges being reported to the NCDOT system. An
additional 14 percent of bridges are not posted, but are functionally obsolete. Finally, an additional 3
percent of bridges are structurally deficient, however they are neither posted nor functionally obsolete. A
2012 NCDOT Report7 indicated that the current bridge system operates at a Level of Service (LOS) of “C” on
a scale from A to F, with an associated Transportation Needs cost of $6.1 billion. The model used for
determining the overall bridge system LOS considers current and projected traffic counts, bridge condition
and performance ratings, preservation and rehabilitation programs. The target Level of Service is “B” for
Figure 6. Smithfield Bridge Plate, Photo Courtesy of NCDOT
Figure 7. I-85 Bridge over Railroad, Photo Courtesy of NCDOT

2013 Report Card for North Carolina’s Infrastructure
Bridges C-
P a g e | 32
NCDOT bridges. Based on the current LOS for state bridges and the number of posted structures within the
system, the Capacity category receives a grade of C-.
Condition
Bridge condition is explicitly based on bridge
inspection ratings provided by NCDOT. Bridge
condition is a function of the structural elements
to carry standard highway loads. Structurally
deficient bridges and weight restricted bridges
are the primary considerations for assessing the
overall condition of bridges in the state of North
Carolina. Accordingly, 2,526 bridges are currently
considered structurally deficient, and 3,978
bridges are posted for weight restrictions. The
number of weight restricted bridges represents
29 percent of all North Carolina bridges.
NCDOT currently provides a Bridge Health Index
of 64.2 percent for the entire bridge system. Based on these facts and figures, the Condition category
receives a grade of D.
Funding
NCDOT has in place a strategic planning process to
aid in the prioritization of transportation projects.
It is a data driven approach that serves as the main
input for the State Transportation Improvement
Program (STIP). Funding is outlined in NCDOT’s
five year work program. From 2013-2017, NCDOT
anticipates $25 billion to be spent on
transportation projects. In 2011, NCDOT required
$460 million in state funds for bridge work to be
completed within two years. This funding is in
addition to the $200 million for STIP preservation,
rehabilitation, and replacement of 165 bridges
across the state, and $70 million for bridge
maintenance and preservation.
Figure 8. Location Map of NCDOT Maintained Structures
Figure 9. I-540 Toll Road, Photo Courtesy of NCDOT
2013 Report Card for North Carolina’s Infrastructure
Bridges C-
P a g e | 33
According to a 2010 NCDOT report7, $44.6 million dollars is required annually to maintain bridges at an
acceptable performance level of service. Compared to the total $25 billion funding budget proposed in the 5
year work plan, the bridge and structures program has identified $1.6 billion in funding needs for an aging
bridge infrastructure over the same time period. This total is spread over a phased approach adopted by
NCDOT and will provide for a $10.1 billion investment through 2040. The efforts of NCDOT in
prioritization of projects have an exponential effect on providing funds for projects that improve mobility
for the greatest need. Based on the current level of funding, the funding needed to bring the entire system
up to standard, and the strategic planning process to prioritize transportation funding, the grade for the
Funding category is a C.
Future Need
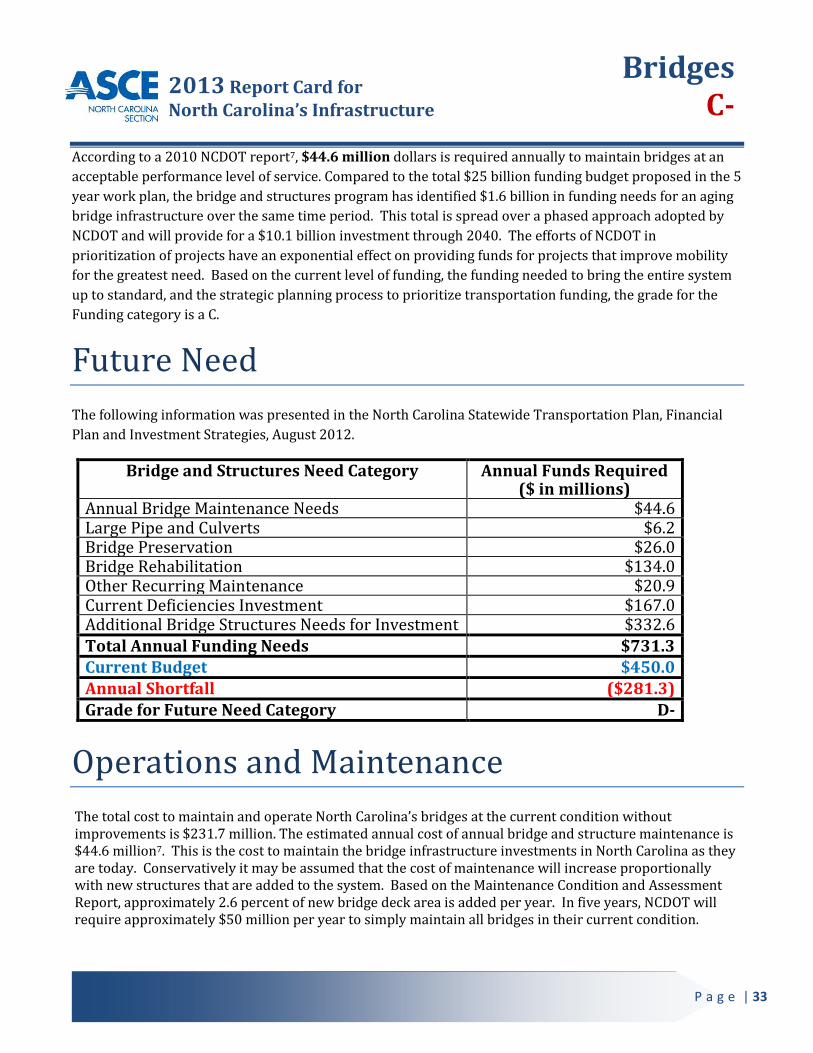
The following information was presented in the North Carolina Statewide Transportation Plan, Financial
Plan and Investment Strategies, August 2012.
Bridge and Structures Need Category Annual Funds Required ($ in millions)
Annual Bridge Maintenance Needs $44.6 Large Pipe and Culverts $6.2 Bridge Preservation $26.0 Bridge Rehabilitation $134.0 Other Recurring Maintenance $20.9 Current Deficiencies Investment $167.0 Additional Bridge Structures Needs for Investment $332.6 Total Annual Funding Needs $731.3 Current Budget $450.0 Annual Shortfall ($281.3) Grade for Future Need Category D-
Operations and Maintenance
The total cost to maintain and operate North Carolina’s bridges at the current condition without improvements is $231.7 million. The estimated annual cost of annual bridge and structure maintenance is $44.6 million7. This is the cost to maintain the bridge infrastructure investments in North Carolina as they are today. Conservatively it may be assumed that the cost of maintenance will increase proportionally with new structures that are added to the system. Based on the Maintenance Condition and Assessment Report, approximately 2.6 percent of new bridge deck area is added per year. In five years, NCDOT will require approximately $50 million per year to simply maintain all bridges in their current condition.

2013 Report Card for North Carolina’s Infrastructure
Bridges C-
P a g e | 34
The current NCDOT Bridge System totals 13,558 bridges and 4,610 culverts to be inspected on a bi-annual basis. This results in 35 bridges and culverts requiring inspection every day of the year. This does not include non NBI culverts and pipes that NCDOT also maintains and inspects on a regular basis. The current NCDOT Bridge Inspection program utilizes both NCDOT and private engineering firms for these inspections. Overall, NCDOT has a long history of prioritizing funding to maximize operational and maintenance costs. NCDOT planning policy is featured as a model for other Departments of Transportation by FHWA, and should be commended on this front. Currently NCDOT allocates approximately 5 percent of the state budget to bridge maintenance (approximately $55 million) and 1 percent for bridge preservation (approximately $15 million), totaling $70 million. Accordingly, the current budget provides for $71 million to be applied towards deficiencies while maintaining the current level of service, meeting 76 percent of the total operations and maintenance needs. The figures above do not include the $460 million designated in 2011 for bridge replacements throughout the state. Based on this, the Operations and Maintenance category receives a grade of C+.
Public Safety
According to FHWA, spending $100 million in highway safety improvements prevents 145 fatalities over a 10 year period. Studies have also indicated that every dollar invested in the national highway system produces $5.40 in economic benefits in improved safety, lower vehicle costs and reduced delays.8 The current NCDOT inventory has 2,936 bridges that are functionally obsolete. By definition these structures create unsafe driving conditions based on today’s highway safety standards. Overall this represents approximately 22 percent of state bridges. In the category of Public Safety, North Carolina bridges receive a grade of C+.
Resilience
Resilience is an appraisal of the state’s bridge system ability to withstand extreme events and be quickly repaired with minimal impact to the public safety, economy, and security. NCDOT has an extensive emergency preparedness program which provides dedicated evacuation routes for extreme events. Most water crossings have alternate routes that provide the traveling public with available transportation, including the State ferry system. Through hurricanes, storm surges, and rock slides, NCDOT has performed exceptionally well in maintaining the transportation system and in returning damaged infrastructure to service in a timely manner. The resulting grade for the Resilience category is an A.
Figure 10. US 52 Bridge Replacement, Photo Courtesy of NCDOT

2013 Report Card for North Carolina’s Infrastructure
Bridges C-
P a g e | 35
Grade Summary
Categories Weighting Factor Grade
Capacity 0.15 C- Condition 0.20 D Funding 0.20 C Future Need 0.20 D- Operations and Maintenance 0.10 C+ Public Safety 0.10 C+ Resilience 0.05 A
North Carolina Bridge Grade C-
Recommendations
Maintain the existing North Carolina gasoline user fee and promote the use of tax dollars in
bridge construction projects.
Evaluate and expand the Express Design Build program to identify cost effective bridge
replacements throughout the state.
Expand the utility of bridge rating software to identify funds invested in bridge
maintenance versus bridge replacement.
Continue to engage policy makers to allocate appropriate funding levels to minimize future
bridge closures.
Sources
1 FHWA, Office of Bridge Technology, Highway Bridge by Owner, 2012 2 NCDOT, Bridge Improvement Program, http://www.ncdot.gov/projects/ncbridges/improvement.html 3 NCDOT, Structures Management Unit, February 2013 4 FHWA, Moving Ahead for Progress in the 21st Century Act (MAP-21), July 2012 5 FHWA, Office of Bridge Technology, Specifications for the National Bridge Inventory 6 FHWA, National Bridge Inspection Standards 7 North Carolina Statewide Transportation Plan, Financial Plan and Strategies, August 2012 8 FHWA, Status of the Nation’s Highway Bridges and Transit: Conditions and Performance Report

2013 Report Card for North Carolina’s Infrastructure
Dams D
P a g e | 36
Overview
Dams in North Carolina provide a number of vital benefits such as flood control, water supply, hydropower, irrigation and recreation. Regulated dams are classified by the North Carolina Dam Safety Office as high hazard, intermediate hazard, or low hazard based on their downstream damage potential.
A total of 3,862 dams are regulated by the Dam Safety Office based on information from the North Carolina Dam Inventory. Twenty-nine percent of North Carolina’s dams are classified as high hazard. A high hazard dam is any dam whose failure would cause loss of life or serious damage to homes, industrial and commercial buildings, important public utilities, primary highways, or major railroads.
One-third of North Carolina’s dams are greater than 50 years old. Ten percent of North Carolina’s high hazard dams are deficient. The estimated future cost is $1.9 billion to rehabilitate North Carolina’s non-federal publicly and privately owned dams. There is no consistent federal or state funding for public or private dam repairs. Only 28 percent of high hazard dams in North Carolina currently have Emergency Action Plans that meet FEMA guidelines; however, this number shows progress since this numbers has doubled since the 2006 North Carolina Infrastructure Report Card was issued. As a result, North Carolina’s dam infrastructure has been given a Grade of D.
North Carolina Section Historic Civil Engineering Landmark - Tennessee Valley Authority Fontana Dam, Fontana, NC

2013 Report Card for North Carolina’s Infrastructure
Dams D
P a g e | 37
Background North Carolina dams are regulated under the authority of the North Carolina Dams Program which is part of the Land Quality Section under the Division of Energy, Mineral, and Land Resources of the North Carolina Department of Natural Resources (NCDENR). The Dam Safety Program’s statutory authority is based on North Carolina General Statute 143-215.23 titled “Dam Safety Law of 1967” and associated regulations Title 15A, Subchapter 2K of the North Carolina Administrative Code titled “Dam Safety”.
Legislative Changes
Several changes in the North Carolina laws pertaining to dam safety occurred between 2009 and 2011. In January 2010, as a result of the December 2008 Tennessee Valley Authority (TVA) Kingston ash pond failure, North Carolina Senate Bill 1004 (SB 1004) was signed into law. SB 1004 eliminated North Carolina exemptions for regulated dams associated with electric generating facilities under the jurisdiction of the North Carolina Utilities Commission (NCUC).
The main effect of SB 1004 was to put dams for power generation cooling lakes, processing ponds, hydropower reservoirs, and ash impoundments under the jurisdiction of the North Carolina Dam Safety Office. This resulted in the addition of 57 dams and approximately 35 miles of cumulative dam length under North Carolina Dam Safety jurisdiction.
In July 2011, House Bill 119 (HB 119) raised the jurisdictional threshold height for a dam in North Carolina to 25 feet and the threshold for impoundment capacity to 50 acre-feet, with the exception that all dams with a high hazard classification remained jurisdictional. HB 119 also added an agricultural use exemption for dams designed and constructed with engineering oversight, unless the dams are determined to be high hazard.
The effect of HB 119 was to significantly reduce the number of existing dams that meet the jurisdictional height and impoundment volume requirements for classification as intermediate or low hazard dams. Dams that fall under the new jurisdictional criteria are generally given an “exempt” status in the state dam inventory, and will no longer be inspected by the Dam Safety Office. For example, in 2012 the number of intermediate hazard dams was reduced by approximately 120 and low hazard dams were reduced by 740, respectively. The number of high hazard dams remained unchanged except for new dams or dams that were re-classified.
Dam Inspections
All high hazard dams in North Carolina are inspected by the Dams Program at least once every 2 years. All intermediate and low hazard dams are to be inspected at least once every 5 years. Inspectors attend inspection training to help ensure conditions are properly noted and recorded. Each dam is visually inspected by the North Carolina Dams Program and is given a rating of satisfactory, fair, poor, or unsatisfactory per FEMA dam inspection guidelines. If problems are discovered during an inspection, a Notice of Deficiency (NOD) is sent to the dam owner.

2013 Report Card for North Carolina’s Infrastructure
Dams D
P a g e | 38
Dams by Classification and Ownership
A total of 3,862 jurisdictional dams are regulated by the Dam Safety Office based on information from the North Carolina Dam Inventory). In addition, approximately 85 additional federally regulated jurisdictional dams are “exempt” from North Carolina Dam Safety Program jurisdiction. These include 8 dams owned by the Tennessee Valley Authority (TVA), 42 dams regulated by the Federal Energy Regulatory Commission (FERC), 5 dams own by the National Parks Service, and 30 dams owned by the Department of Defense.
High Hazard (1130), 29%
Intermediate Hazard (518),
14%
Low Hazard (2214), 57%
NC Dams by Classification
High
Intermediate
Low

2013 Report Card for North Carolina’s Infrastructure
Dams D
P a g e | 39
The breakdown of non-exempt jurisdictional North Carolina dam ownership is as follows:
Type of Owner Number of Dams Percentage
Federal Government 10 0.3 State of North Carolina 56 1.4 Local Governments 277 7.2 Utilities 53 1.4 Private Owners 3,315 85.8 Unknown Owners 151 3.9
Conditions Age of Structures
Like all man-made structures, dams deteriorate with age. Deferred maintenance accelerates deterioration and causes dams to be more susceptible to failure. As with other critical infrastructure, significant investment is essential for maintaining benefits and ensuring safety. Approximately one-third of North Carolina’s dams are greater than 50 years old.
Murrays Mill Dam, Murrays Mill, NC
The number of North Carolina’s dams by year constructed is as follows:
Year Constructed Number of Dams Before 1901 36

2013 Report Card for North Carolina’s Infrastructure
Dams D
P a g e | 40
1901 to 1920 40 1921 to 1940 103 1941 to 1960 405 1961 to 1980 494 1981 to 2000 425 2001 to 2012 116
Unknown 2,243
Dam Deficiencies
As of November 30, 2012, there are 150 outstanding NODs for North Carolina dams listed in the North Carolina Dam Inventory including 119 high hazard (10 percent of 1130), 13 intermediate hazard, and 18 low hazard dams. A total of 40 NODs were issued for high hazard dams in 2012.
Safety and Funding Emergency Action Plans
Emergency Action Plans (EAPs) are developed to provide dam owners with a set of procedures to follow in the event of a dam related emergency depending on the severity of the emergency. Copies of the plans are filed with the North Carolina Dam Safety Program and state and local emergency management agencies so that downstream property owners and businesses can be contacted and evacuated in the event of an impending dam failure or emergency.
Only 387 (34 percent) of the 1,148 jurisdictional high hazard dams in North Carolina have an Emergency Action Plan (EAP) on record. A total of approximately 320 (28 percent) meet the requirements of the Federal Guidelines for Dam Safety: Emergency Action Planning for Dam Owners (FEMA 64 October 1998, reprinted April 2004, pages 5-8). The North Carolina Dam Safety Office currently does not have statutory authority to require dam owners to maintain an up to date EAP. However, submission of an EAP is commonly required by the Dam Safety Office for approval to modify a dam.

2013 Report Card for North Carolina’s Infrastructure
Dams D
P a g e | 41
2003 Hope Mills Dam Failure in Hope Mills, NC Required Evacuation of 1,600 Downstream Residents
The total number of EAPs for high hazard dams has more than doubled since the American Society of Civil Engineers (ASCE) 2006 North Carolina Infrastructure Report Card was issued. Therefore, progress has been made in this area. In addition, the Dam Safety and Floodplain Mapping Offices are developing web-based interactive EAP software to allow individual dam owners to develop EAPs with state support. This has the potential to increase the total number of EAPs for high hazard dams.
Dam Safety Program
In 2011, the North Carolina Dam Safety Program funding included 70 percent state appropriations, 16 percent FEMA grant funds, 8 percent application processing fees, and 6 percent one-time dam evaluation fees. The state appropriated annual budget for North Carolina’s Dams Program was $1.47 million based on the 2009-2010 year.
There are currently 18 full-time equivalent employees (FTEs) in the Raleigh Central Office and Regional Offices dedicated to dam safety. Approximately 9 of the full-time equivalent employees are available for dam safety inspections. These individuals are also responsible for erosion and sediment control, mining, and other inspection duties.
In 2012, a total of 1,005 jurisdictional dams were inspected including 475 high hazard, 87 intermediate hazard, and 443 low hazard dams. A total of 62 exempt dams were also inspected for an average of approximately 120 total dam inspections per FTE. The North Carolina ratio of the total number of dams per FTE is 215 (based on November 2012 North Carolina Dam Inventory data) which is slightly higher than the national dam safety program average of 208 reported in the July 2012 ASDSO Statistics on State Dam Safety Regulation.

2013 Report Card for North Carolina’s Infrastructure
Dams D
P a g e | 42
In 2010, the Association of State Dam Safety Officials (ASDSO) rated North Carolina Dam Safety Program as being below the National Average for State Budgeting and State Staffing for Dam Safety. When North Carolina’s Dam Safety Program was compared with the “Model” Dam Safety Program, North Carolina’s score was 69 percent compared to a national average of 77 percent compliance. In particular, North Carolina scored below the national average in the Inspections, EAPs and Response, and Public Relations categories.
With the recent legislative changes, the total number of jurisdictional dams in North Carolina has decreased, thereby reducing the number of jurisdictional dams requiring inspections; therefore, the ratio of jurisdictional dams to FTEs continues to be lower.
Dam Repair Funding
Currently, there is no consistent federal or state level funding available for the repair or removal of existing public and privately owned dams. Based on repair cost data compiled by the Association of State Dam Safety Officials outlined in the 2009 Cost of Rehabilitating Our Nation’s Dams, it is estimated that the future cost to rehabilitate North Carolina’s non-federal public and private dams is $1.9 billion.
The ASCE 2013 Report Card for America’s Infrastructure estimates a total cost of $57 billion for future rehabilitation of the nation’s federal and non-federal public and private dams.
Policy Options
The lack of public support and understanding of the need for proper maintenance and repair of dams is unacceptable. Generally, there is inadequate attention to dam safety until a failure occurs—although dam infrastructure is an issue that affects the safety of millions of people who live and work in the path a sudden, catastrophic and deadly dam failure might take. Approximately one-third of all of North Carolina’s jurisdictional dams are greater than 50 years old. ASCE supports the Dam Safety Coalition and its proposal to create a federal funding program to repair the nation’s unsafe dams. ASCE also supports the Water Resources Development Act (WRDA) of 2013.
Grade Summary Categories Weighting
Factor Grade
Condition 0.25 B
Emergency Action Plans (EAPs) 0.25 D
Dam Safety Program 0.25 C
Dam Repair Funding 0.25 F
North Carolina Dams Grade D

2013 Report Card for North Carolina’s Infrastructure
Dams D
P a g e | 43
Recommendations for Action Support the passage of the national Water Resources Development Act (WRDA) of 2013 that
would create a National Levee Safety Program, re-authorize the National Dam Safety Program, support the Harbor Maintenance Trust Fund, and develop a Water Infrastructure Finance ad Innovation Act (WIFIA) program
Provide full support of the National Dam Rehabilitation and Repair Act Require federal agencies that own, operate or regulate dams to meet the standards of FEMA
Federal Guidelines for Dam Safety Enact legislation providing the North Carolina Dam Safety Office with statutory authority to
require Emergency Action Plans (EAPs) for all jurisdictional high hazard dams and develop EAPs for all high hazard dams by 2017
Increase the NC Dam Safety Program budget and staff levels to accommodate for current and future inspection needs and permitting reviews, and work toward achieving goals of the ASDSO “Model Dam Safety Program”.
Establish state and federal dam rehabilitation loan and grant programs for publicly and privately owned dams
Include dam failure inundation mapping as part of the National Flood Insurance Program Increase state and federal public relations efforts to educate the public on dam safety issues
Sources American Society of Civil Engineers (ASCE), 2013 Report Card for America’s Infrastructure, 2013
American Society of Civil Engineers (ASCE), 2009 Report Card for America’s Infrastructure, 2009
American Society of Civil Engineers (ASCE), Report Card for North Carolina’s Infrastructure- 2009 Update, 2009
American Society of Civil Engineers (ASCE), 2006 North Carolina Infrastructure Report Card, 2006
Association of State Dam Safety Officials (ASDSO), Statistics on State Dam Safety Regulation, 2012
Association of State Dam Safety Officials (ASDSO), Dam Safety Performance Report for North Carolina, 2010
Association of State Dam Safety Officials (ASDSO), The Cost of Rehabilitating our Nation’s Dams, 2009
Association of State Dam Safety Officials (ASDSO), Dam Safety in North Carolina, 2005
North Carolina Division of Land Resources, Dam Safety Program, “Insight into the North Carolina State Dam Safety Program”, ASCE North Carolina Section Spring Technical Conference, April 2012
North Carolina Division of Land Resources, Dam Safety Office
United States Army Corps of Engineers (USACE), National Inventory of Dams (NID) Update Data Collection Results, 2013

2013 Report Card for North Carolina’s Infrastructure
Drinking Water C+
P a g e | 44
Overview
North Carolina has over 530 public water systems which serve approximately 7.3 million North Carolinians
or about 75 percent of the state’s population. The majority of these systems are owned and operated by
incorporated municipalities. The 2007 Environmental Protection Agency (EPA) Drinking Water
Infrastructure Needs Survey and Assessment documented a 20-year
infrastructure need of $10.06 billion for North Carolina. This need
represents a decrease of $920 million from the $10.98 billion need
identified in the 2003 EPA Survey. These funds are needed to
replace aging facilities, comply with mandated Safe Drinking Water
Act (SDWA) regulations and boost economic development. Although
the outbreaks of waterborne caused sickness is at or near zero, the
number of drinking water systems with regulatory violations is on
the rise due to factors such as water supply challenges water quality
degradation as well as tightened regulations. If funding needs are
not met, the state risks losing the improved public health and
economic gains that have been made over the past years. As a result,
North Carolina’s Drinking Water Infrastructure is assigned a grade of
C+.
Background
By 2030, North Carolina’s public water systems are projected to serve 9.8 million people, 70 percent more
than current service customers. Most of the larger systems are owned and operated by municipalities and
counties. The 2007 Environmental Protection Agency (EPA) Drinking Water Infrastructure Needs Survey and
Assessment documented a 20-year infrastructure need of $10.06 billion for North Carolina. This 20-year
need represents a decrease of $920 million from the $10.98 billion need identified in the 2003 EPA Survey
(Table 1). The categories of transmission/distribution and other needs were reduced, while the categories
of treatment, storage and source increased.

2013 Report Card for North Carolina’s Infrastructure
Drinking Water C+
P a g e | 45
Table 1 - Comparison of 2007 to 2003 EPA Drinking Water Infrastructure Needs Survey
Category
Estimated
Need
Identified in
2003
2003
Percent of
the Total
Cost
Estimated
Need
Identified in
2007
2007
Percent of
the Total
Cost
Difference
between
2007 and
2003
Transmission
& Distribution
$7.502 billion 69% $6.037 billion 60% -$1.47
billion
Treatment $1.889 billion 17% $2.237 billion 22% $0.35 billion
Storage $0.950 billion 9% $1.032 billion 10% $0.08 billion
Source $0.449 billion 4% $0.670 billion 7% $0.22 billion
Other $0.158 billion 1% $0.077 billion 1% -$0.08
billion
TOTAL $10.980
billion
$10.055
billion
-$0.93
billion
Water supply (reservoirs, rivers, wells and interconnections) is the life blood of our state. This represents a
critical link along with conservation to our sustained drinking water infrastructure. The Water Use Act of
1967 remains North Carolina's principal way of allocating water (other than the common law). It provides
for the designation by the Environmental Management Commission (EMC) of capacity use areas. A
Capacity Use Area is an area in which the supply of water (surface and/or groundwater) is insufficient to
meet demand. Water withdrawals in capacity use areas require coordination and regulation, in order to
protect the interests and rights of residents and property
owners and of the general public. The EMC designated
15 counties in North Carolina as part of the Central
Coastal Plain Capacity Use Area: Beaufort, Carteret,
Craven, Duplin, Edgecombe, Greene, Jones, Lenoir,
Martin, Onslow, Pamlico, Pitt, Washington, Wayne,
and Wilson. Due to the overuse of aquifers in this
capacity use area, groundwater usage is regulated by the
Division of Water Resources (DWR) with the goal of
decreasing withdrawals from the aquifers to a
sustainable rate of use. This approach is due to the
dangers of the groundwater underlying the eastern part
of the state potentially becoming contaminated from
saltwater intrusion due to the over pumping of fresh water.

2013 Report Card for North Carolina’s Infrastructure
Drinking Water C+
P a g e | 46
North Carolina General Statute GS 143-354(a)(11) gives the EMC the authority to allocate any water supply
storage held by the State in federal reservoirs to local governments. The EMC has adopted an
administrative rule requiring applicants for a water supply allocation from Jordan Lake to provide detailed
information describing their current water supply sources, projected water needs and alternative water
sources. On an ongoing basis, DWR is responsible for analyzing the information and recommending the
allocation amounts to the EMC.
In response to the droughts of recent years, the Governor signed the 2008 Drought Bill into law. This
included provisions to improve water use data; reduce drought vulnerability; and allow for quicker
response to water shortage emergencies. It also requires local water shortage response plans to have the
North Carolina Department of Environment and Natural Resources (DENR) approval and sets the criteria
for an approved plan. Overall, North Carolina saw minimal impacts from the 2012 drought. The North
Carolina Water Efficiency Best Management Practices (BMP) Manual development was mandated under a
2011 law. The complete manual can be found at www.ncwater.org. The manual includes information on
14 different water efficiency BMPs. Local governments are incorporating these long‐term water reduction
plans into Local Water Supply Plans in 2013 that are submitted to the State for review.
The Act has the potential to significantly alter the way local governments pursue new water supply sources
to support economic expansion and expected population growth. Local governments will now have the
opportunity to form a partnership with DENR. Under this partnership arrangement, DENR will be capable
of providing the following assistance to local governments. The Department will:
Cooperate in the identification of water supply needs and appropriate water supply sources and water storage projects.
Assist in the assessment of alternatives for meeting the water supply needs of a local government. Develop estimates of the costs of the proposed new water supply. Apply for state and federal permits for the development of regional water supplies. Act as the principal state agency to cooperate with other state agencies, the U.S. Army Corps of
Engineers and all other federal agencies involved in the planning and development of water supply and water storage projects.

2013 Report Card for North Carolina’s Infrastructure
Drinking Water C+
P a g e | 47
Conditions
In 2006, the North Carolina Rural Economic Development Center completed an initiative to collect detailed
information about water systems statewide and document the current and the future capital improvement
needs of over 530 of the larger water systems (Water 2030 Initiative). This survey identified
approximately $7.64 billion in required funding over a 25-year period. Most of these systems have aging
water distribution systems and treatment plants, which are also being driven to utilize new water sources
that may require more advanced treatment.
For example, if a water system was developed during the textile mill
boom days that preceded World War II, (WWII) it was most likely
constructed of unlined cast iron pipe. Cast iron is a durable and
structurally strong material that holds up well to external corrosion and
soil settlement. However, over time the corrosive nature of water can
pit and break down the cast iron material from the inside causing a
reduction in main capacity and increased leaks. If the industry average
service life for this type of pipe is 50 years, then when pipes installed
prior to the 1950’s have exceeded their average service life they should
be examined if they are in need of replacement.
Additionally, during WWII and the years immediately following, a
majority of water pipes being installed were constructed of Asbestos
Cement (AC) material. These pipes traditionally provide good internal
resistance to corrosion and deterioration, but become brittle and readily subject to failure from physical
forces. Water system staff and third party construction crews must take extreme precautions when
tapping new services or working on or around these type of mains. Airborne asbestos has been
documented to be a carcinogen and poses a health risk outside of water system integrity.
All systems, regardless of the water main material, experience leaks. Typically, the older, more brittle
materials will experience more leaks due to wearing at fittings, inconsistency with years of service tapping
and construction related issues. Some small systems lose as much as 20 percent of their total treated
water. Systems statewide lose an average of 11 percent of treated water annually to leaks and other means
and the amount lost is labeled “unaccounted for.” This unaccounted for water is an amount loss that
generates no revenue and results in wasted time, money and treated water. The statewide average of 11
percent annually represents approximately 35 billion gallons of treated water that is lost, which is enough
to supply the entire Charlotte-Mecklenburg region for a full year.
Funding

2013 Report Card for North Carolina’s Infrastructure
Drinking Water C+
P a g e | 48
Rates
According to the 2013 Water and Wastewater Rates and Rate Structures in North Carolina compiled by the
Environmental Finance Center and the North Carolina League of Municipalities, rates that provide enough
revenue to balance an annual budget do not necessarily provide enough revenue to cover long term capital
and maintenance needs and many utilities charge much less than the full cost of service. Many utilities are
not covering their operating expenses, making it extraordinarily difficult to rehabilitate aging
infrastructure, save for operating emergencies, finance system improvements and expansion, and engage in
proactive asset management. It is interesting to note that the utilities that did not recover their operating
expenses (operating at a financial loss) are not always charging low rates – even some utilities with high
rates can be operating at a financial loss. The performance of each utility on several financial indicators and
benchmarks can be viewed in the NC Water and Wastewater Rates Dashboard at
www.efc.unc.edu/RatesDashboards/
According to the 2013 Water and Wastewater Rates and Rate Structures in North Carolina compiled by the
Environmental Finance Center and the North Carolina League of Municipalities, comparing rates across the
State or among specific utilities is further complicated by the variation in the extent to which utilities
charge the full cost of providing service. Rates that provide enough revenue to balance an annual budget do
not necessarily provide enough revenue to cover long term capital and maintenance needs and many
utilities charge much less than the full cost of service provision. Figure 1 shows rates from FY 2011-12 in
terms of combined water and wastewater charges for customers using 5,000 gallons/month plotted against
the ratio of operating revenue over operating expenses (including depreciation) from the same fiscal year.
This measure, often referred to as an operating ratio, helps identify if an entity is operating at a financial
loss, financial gain, or is breaking even. Financial data were provided by the Local Government Commission
(LGC) in the Department of the State Treasurer. The figure shows that many utilities are not covering their
operating expenses, making it difficult or impossible to rehabilitate aging infrastructure, save for operating
emergencies, finance system improvements and expansion, and engage in proactive asset management. It
is interesting to note that the utilities that did not recover their operating expenses (operating at a financial
loss) are not always charging low rates – even some utilities with high rates can be operating at a financial
loss. Nevertheless, there are several utilities that charged low rates in FY 2011-12 (to the left of the graph),
which resulted in operating at a financial loss (below the horizontal line on the graph) in that fiscal year.
There are a significant number of utilities that are operating at a financial gain (above the line).

2013 Report Card for North Carolina’s Infrastructure
Drinking Water C+
P a g e | 49
Figure 1- Combined Residential Bill in FY2011-12 for 5,000 gallons/month for Utilities with
Reported LGC Data on Total Operating Revenues and Total Operating Expenses in FY2011-12
(n=320) from Water and Wastewater Rates and Rate Structures in North Carolina; February 2013
Programs
Historically, numerous federal and state programs have provided funding assistance to help offset the
rising cost of water infrastructure. These programs are aimed at addressing an array of differing needs
from improving public health and water quality to furthering economic development. The level of funding
available through these programs has been decreasing in recent years. Even with the influx of funding
from the American Recovery and Reinvestment Act of 2009, the documented needs for drinking water
funding are much greater than the funds available. Additionally, due to increased and ever-changing
regulations imposed on public water supply systems, these
unfunded regulatory requirements can and sometimes do
unexpectedly deplete a system’s budget. The EPA has
primary regulatory authority over drinking water systems
and was once a primary source of funding, but since about
1990 these grant/loan funds have been limited and reduced.
The decline in these funding sources coupled with the
increased demand for safe, efficient drinking water
infrastructure calls into question the role of the state. State
contributions to infrastructure financing are becoming more important.
Funding for water and wastewater infrastructure in North Carolina is provided by six main funding
entities; each operates independently with its own mission, goals, and objectives. The General Assembly
created the State Water Infrastructure Commission in 2005 to identify the state’s water infrastructure

2013 Report Card for North Carolina’s Infrastructure
Drinking Water C+
P a g e | 50
needs, develop a plan to meet those needs, and monitor the implementation of the plan, but it does not
have the necessary authority or resources needed to execute this mission. The agencies for water and
wastewater that use state appropriations and are charged with administering federal funds include:
• DENR DWQ Infrastructure Finance Section
DENR Public Water Supply Section
• North Carolina Department of Commerce- Division of Community Assistance
• North Carolina Department of Commerce- Commerce Finance Center
• North Carolina Rural Economic Development Center; and
• North Carolina Clean Water Management Trust Fund.
The Clean Water Management Trust Fund (CWMTF) received over $122 million in requests for funding in
2012. With only $10.75 million appropriated to CWMTF by the General Assembly for fiscal year 2012-2013,
caps were placed on grant awards limiting the fund’s ability to maximize water quality benefits. This means
that 88 percent of 2012 critical local needs were unmet ($63 million). These unfunded critical local
requests would have protected drinking water supplies, created an estimated 700 local jobs, repaired 30
failing wastewater treatment plants and collection systems, supported local tourism economies, and kept
30,000 tons of sediment and other pollutants from further impairing North Carolina’s streams and rivers.
Private loans from banks and other private lending institutions have become the largest single source of
capital investments for public water construction projects. These loans take several forms, including
general obligation bonds, revenue bonds, special obligation bonds, tax increment bonds, and installment or
lease-purchase debt. Based upon financial data from 1995 to2005, private loans accounted for 70 percent
of total financing of water and wastewater projects. Conversely, because of poor bond ratings,
approximately 60 percent of NC local governments cannot qualify for most private infrastructure lending
programs.
On July 1, 2009, Section 9 of Session Law 2008-143 (the 2008 Drought Bill) went into effect. Among other
things, this Section requires that in order to be eligible for state water infrastructure funds from the
Drinking Water Revolving Fund or the Drinking Water Reserve Fund as well as any other grant or loan of
funds allocated by the General Assembly for the purpose of extending waterlines or expanding water
treatment capacity, a local government or large community water system must demonstrate that the
system meets a number of new requirements that encourage water efficiency. These requirements include
that a system:
1. Has established a water rate structure that is adequate to pay the cost of maintaining, repairing, and
operating the system, including reserves for payment of principal and interest on indebtedness incurred for maintenance or improvement of the water system during periods of normal use and periods of reduced water use due to implementation of water conservation measures. The funding agency shall apply guidelines developed by the State Water Infrastructure Commission in determining the adequacy of the water rate structure to support operation and maintenance of the system.

2013 Report Card for North Carolina’s Infrastructure
Drinking Water C+
P a g e | 51
2. Has implemented a leak detection and repair program. 3. Has an approved water supply plan 4. Meters all water use except for water use that is impractical to meter, including, but not limited to,
use of water for firefighting and to flush waterlines. 5. Does not use a rate structure that gives residential water customers a lower per unit water rate as
water use increases. 6. Has evaluated the extent to which the future water needs of the water system can be met by
reclaimed water. 7. Has implemented a consumer education program that emphasizes the importance of water
conservation and that includes information on measures that residential customers may implement to reduce water consumption.
Considerations for Path Forward
A process to create a statewide infrastructure plan is critical. An “infrastructure database” that is regularly
updated with information on infrastructure needs related to economic development and population
growth is needed. Develop an annual process for reporting on all state and federal grant and loan
resources utilized for water, wastewater and stormwater projects. The database should catalog the types of
projects funded, show the geographic distribution of funds and be used as an assessment tool in the
gauging of need for State-level infrastructure investment. The creation of centralized state database similar
to that in other states, including Georgia and Kentucky, would be ideal. Currently, there is no one source of
information to track and locate all of the current water and wastewater infrastructure project needs and
funding patterns in this state. Funding groups and nonprofits spend a lot of money and resources trying to
determine what the water infrastructure needs are in North Carolina. For example, current information on
drinking water needs does not include the cost of proposed reservoir construction (EPA specifically
excludes those costs). Additional infrastructure is needed to address failing water/wastewater systems
and costs need to be accounted for them. An “infrastructure database” could contain: current and proposed
infrastructure projects; system information (interconnections, fiscal status, management practices);
amount of renewal and replacement occurring (including drivers) and information on funding
sources/requirements for funding.
Engage the state’s utility managers in developing sound and equitable rates that are based upon the need
for repairs and replacement of capital infrastructure, while at the same time, implementing a public
education campaign to help our state’s citizens recognize and accept rates that can support life cycle asset
management funding. This should include a provision in legislation to build reserves and ensure that
money intended for drinking water is spent on drinking water. Competition for the states existing water
supplies will dictate use of new technology and larger, more, regional systems. Treatment is becoming
more advanced and will require more highly trained staff and additional operation and maintenance funds.
The ultimate goal for each water system must be to become self-sufficient and achieve a “sustainable
utility” rate structure.
Significant strides have been made in the overall reduction of “unaccounted for water”. It should be the
focus of each utility through its customer base to reduce the drain on water and financial resources.

2013 Report Card for North Carolina’s Infrastructure
Drinking Water C+
P a g e | 52
Incentives and/or recognition to those systems that successfully execute a leak detection program and
consistently document the reduction of leaks and the eradication of un-metered services should be
provided.
Grade Summary
Grades were assigned to the drinking water infrastructure category in three areas. A grade of B-was given
to the capacity category. Capacity is defined as the infrastructure’s capacity to meet current and future
demands. Planning and construction project are required to maintain and or/improve the current levels of
service and provide the additional capacity needed for future economic growth in the state of North
Carolina. A grade of C+ was given to the condition category. Condition is defined as the infrastructure’s
existing or near future physical conditions. Most of systems within the state have aging water distribution
systems and treatment plants, which require investment to maintain and operate. A grade of C was given
to the funding category. The funding category examines current level of funding (from all levels of
government) and compares it to the estimated funding need. Historically, numerous federal and state
programs have provided funding assistance to help offset the rising cost of water infrastructure. The
document needs for drinking water funding are much greater than the funds available. As a result, North
Carolina’s Drinking Water Infrastructure is assigned a grade of C+.
Categories Weighting Factor
Grade
Capacity 0.33 B- Physical Condition 0.33 C+ Funding 0.33 C
North Carolina Drinking Water Grade C+

2013 Report Card for North Carolina’s Infrastructure
Drinking Water C+
P a g e | 53
Recommendations
Support the increased use of state funding – through grants and loans - for drinking water infrastructure;
Develop a statewide infrastructure plan;
Develop a statewide database to document funding needs and expenditures;
Engage the state’s utility managers in developing sound and equitable rates that are based upon the need for repairs and replacement of capital infrastructure, and build reserves to minimum level across State;
Implement a public education campaign to help our state’s citizens recognize and accept rates that can support life cycle asset management funding;
Encourage the use of life-cycle cost analysis principals to evaluate the total costs of projects;
Ensure that money earmarked for the drinking water infrastructure is used for its intended purpose and pass legislation for consequences if allocated or used for other purposes;
Provide incentives for asset management and detailed rehabilitation and replacement planning for utilities to prioritize needs.
Sources
Environmental Protection Agency, 2007 Drinking Water Infrastructure Needs Survey and Assessment, Fourth
Report to Congress, EPA 816-R-09-001, March 2009.
Environmental Protection Agency, 2003 Drinking Water Infrastructure Needs Survey and Assessment, Third
Report to Congress, EPA 816-R-05-001, June 2005.
North Carolina’s Water and Wastewater Infrastructure Funding Lacks Strategic Focus and Coordination Final
Report to the Joint Legislative Program Evaluation Oversight Committee; Report Number 2008-12-07;
January 27, 2009.
North Carolina Rural Economic Development Center, Water 2030 Initiative, February 2006.
Shadi Eskaf, David Tucker, Dayne Batten and Amy Patel: Environmental Finance Center and Chris Nida:
North Carolina League of Municipalities, Water and Wastewater Rates and Rate Structures in North
Carolina; February 2013.
2013 Report Card for North Carolina’s Infrastructure
Drinking Water C+
P a g e | 54
North Carolina Clean Water Management Trust Fund, 2012 Summary
http://www.cwmtf.net/Docs/cwmtffactsheet.pdf
The North Carolina State Water Infrastructure Commission, 2010 Annual Report To The Governor and
Members of the North Carolina General Assembly, December 7, 2009.
Note: All images are sourced from Microsoft.
2013 Report Card for North Carolina’s Infrastructure
Energy B+
P a g e | 55
Overview
According to the North Carolina Energy Office, the state’s traditional reliance on the major fuel sources –
coal, petroleum, natural gas, and nuclear – remains intact, but in recent years there has been a meaningful
shift to energy efficiency and the use of renewable energy sources. The driving forces for this change
include unpredictable energy prices, forecasts questioning future availability of certain fuels, most notably
petroleum, and concerns about the environmental impact of fossil fuel combustion.
North Carolina has affordable, diverse, and reliable energy resources. While there is still work to do in
terms of energy efficiency, assuring a full range of energy diversity products to all regions of the state, and
to remaining of the leading edge of anticipated changes in the energy sector, North Carolina has a solid
foundation of energy and energy infrastructure to meet its current and 20-year planning horizon needs. As
a result, North Carolina’s Energy Infrastructure receives a grade of B+.
Background
The primary sources of energy remain petroleum, coal, nuclear fuel, and natural gas. Due to the lack of
natural reserves of coal and petroleum, combined with insufficient presence of alternative fuels to meet the
current and future demands of one of the 10 largest states in the nation, North Carolina imports virtually all
of its fuel resources. North Carolina is, however, one of the nation’s top producers of nuclear power.
North Carolina’s natural energy resources primarily includes several rivers that provide meaningful
hydropower, potential offshore wind power, and a moderate amount of natural gas in the central portion of
the state. Both offshore wind power and natural gas are undeveloped natural resources at the present
time.
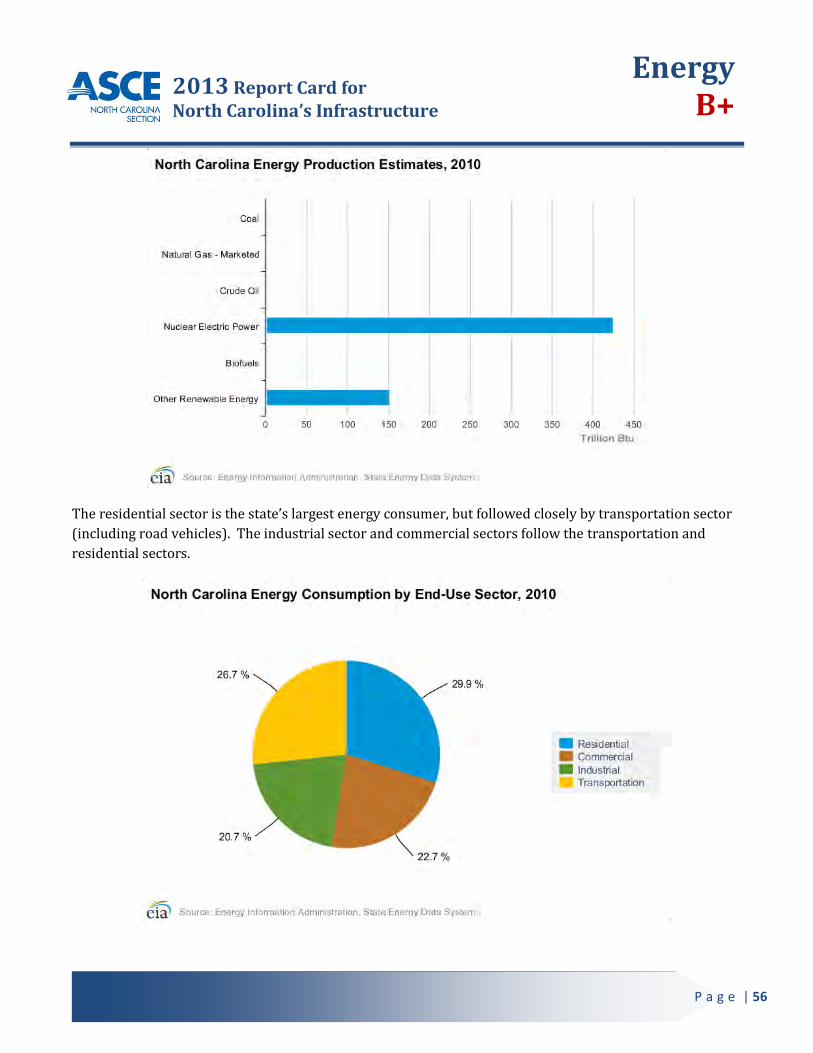
2013 Report Card for North Carolina’s Infrastructure
Energy B+
P a g e | 56
The residential sector is the state’s largest energy consumer, but followed closely by transportation sector
(including road vehicles). The industrial sector and commercial sectors follow the transportation and
residential sectors.

2013 Report Card for North Carolina’s Infrastructure
Energy B+
P a g e | 57
According to the US Department of Energy, North Carolina’s energy resources can be summarized as
follows:
Petroleum
North Carolina acquires all of its petroleum products from other States and from abroad. The Colonial and
Plantation pipelines from the Gulf Coast supply the State with petroleum products. The Dixie Pipeline, a
major supplier of propane to the Southeast, terminates in Apex, North Carolina, where a terminal and
above-ground storage tanks are located. Tankers from other States and other countries deliver petroleum
products to the ports of Wilmington and Morehead City.
Natural Gas
The majority of North Carolina’s natural gas is supplied by the Transcontinental Gas Pipeline Co. as the
pipeline traverses the State en route from the Gulf Coast to major population centers in the Northeast. The
industrial sector is the leading natural gas-consuming sector, although consumption by residential and
commercial users is also substantial. Approximately one-fourth of North Carolina households use natural
gas as their main source of energy for home heating.
Coal, Electricity, and Renewables
North Carolina’s electricity production is high. Coal-fired power plants typically account for about three-
fifths of the State’s electricity generation, and nuclear power typically accounts for about one-third.
Hydroelectric and natural gas-fired power plants produce most of the remainder. North Carolina’s coal-
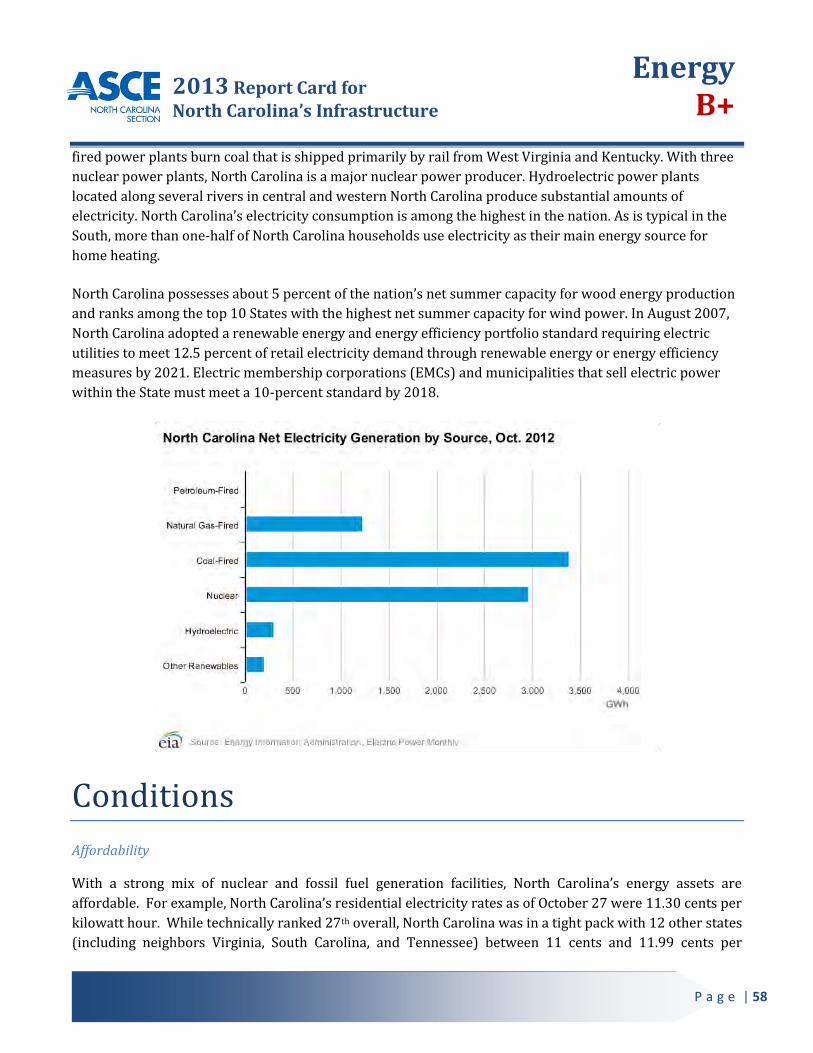
2013 Report Card for North Carolina’s Infrastructure
Energy B+
P a g e | 58
fired power plants burn coal that is shipped primarily by rail from West Virginia and Kentucky. With three
nuclear power plants, North Carolina is a major nuclear power producer. Hydroelectric power plants
located along several rivers in central and western North Carolina produce substantial amounts of
electricity. North Carolina’s electricity consumption is among the highest in the nation. As is typical in the
South, more than one-half of North Carolina households use electricity as their main energy source for
home heating.
North Carolina possesses about 5 percent of the nation’s net summer capacity for wood energy production
and ranks among the top 10 States with the highest net summer capacity for wind power. In August 2007,
North Carolina adopted a renewable energy and energy efficiency portfolio standard requiring electric
utilities to meet 12.5 percent of retail electricity demand through renewable energy or energy efficiency
measures by 2021. Electric membership corporations (EMCs) and municipalities that sell electric power
within the State must meet a 10-percent standard by 2018.
Conditions
Affordability
With a strong mix of nuclear and fossil fuel generation facilities, North Carolina’s energy assets are
affordable. For example, North Carolina’s residential electricity rates as of October 27 were 11.30 cents per
kilowatt hour. While technically ranked 27th overall, North Carolina was in a tight pack with 12 other states
(including neighbors Virginia, South Carolina, and Tennessee) between 11 cents and 11.99 cents per

2013 Report Card for North Carolina’s Infrastructure
Energy B+
P a g e | 59
kilowatt hour. Hawaii and New York at 36.87 cents per kilowatt hour and 18.35 cents per kilowatt hour,
respectively, led the nation and a pack of 18 states with rates in excess of 12 cents per kilowatt hour.
North Carolina traditionally has not had a strong natural gas residential market and it is not surprising that
that sector is the state’s most expensive. However, North Carolina still ranks only as 15th most expensive in
the nation at $14.18 dollars per thousand cubic feet. North Carolina is only slightly more expensive than
Pennsylvania and more affordable than the other southern states.
Overall, North Carolina ranks as the 42nd most expensive state in terms of dollars per person spent for
energy ($3,451 per year per person; Oct 2012).
Reliability
Current reliability assessments by the North American Electric Reliability Corporation (NERC) continue to
project that the Southeastern region will have adequate generation reserve margins over the next ten
years. The Investor Owned Utilities (IOUs) that serve North Carolina and provide the majority of the state’s
electric power generation capabilities are projecting reserve margins that are typical for electric utilities
serving the Southeastern states and similar to the reserve margins that they have maintained in the recent
past.
North Carolina utility forecasts of future peak demand growth rates are somewhat higher than forecasts for
the nation as a whole. The 2010-2019 Long-Term Reliability Assessment by NERC indicates that the
national forecast of average annual growth in summer peak demand for the period is 1.3%. This number is
lower than that shown in NERC’s prior year report of 1.5% to 1.6%.

2013 Report Card for North Carolina’s Infrastructure
Energy B+
P a g e | 60
The reserve margin is the ratio of reserve capacity to actual needed capacity (i.e., peak load). It provides an
indicator of the ability of an electric utility system to continue to operate despite the loss of a large block of
capacity (generating unit outage and/or loss of a transmission line), deratings of generating units in
operation, or actual load exceeding forecast load. A similar indicator is capacity margin, which is the ratio
of reserve capacity to total overall capacity (i.e., reserve capacity plus actual needed capacity). Although
reserve margin was the exclusive industry standard term for many years, capacity margin has also been
widely used in recent years.
It is difficult, if not impossible, to plan for major generating capacity additions in such a manner that
constant reserve margins are maintained. Reserve margins will generally be lower just prior to placing new
generating units into service and greater just after new generating units come online.
In earlier years, a 20% reserve margin was considered appropriate for long-range planning purposes. In
recent years, the North Carolina Utilities Commission has approved integrated resource plans (IRPs)
containing reserve margins lower than 20%. Adequate reliability can be preserved despite these lower
reserve margins because of the increased availability of emergency power supplies from the
interconnection of electric power systems across the country, the increasing efficiency with which existing
generating units have been operated, and the relative size of utility generating units compared to overall
load. The summer reserve margins currently projected by each IOU are on the order of 15 to 25%, and have
been evaluated to be within industry best practice norms.
The North Carolina Transmission Planning Collaborative (NCTPC) was established in 2005. Participants
(transmission-owning utilities, such as Duke and Progress, and transmission-dependent utilities, such as
municipal electric systems and EMCs, identify the electric transmission projects that are needed to be built
for reliability and estimate the costs of those upgrades.
The NCTPC’s January 2011 report states that 14 major transmission projects are needed in North Carolina
by the end of 2020 at an estimated cost of $473 million. This report also studied two “climate change”
scenarios and estimated their transmission impacts and costs. The first hypothetical scenario studied was
one in which 3,500 MW of un-scrubbed coal generation had to be retired. The study found that such a
hypothetical future would not drive the need for any incremental large transmission projects. The other
scenario that was studied was whether additional transmission would be needed if 3,000 MW of wind
generation were built off the coast of North Carolina. The study concluded that it would cost at least $1.2
billion to build the high-voltage transmission lines that would be needed to move that power from North
Carolina’s coast inland to the large population centers.
While coal and nuclear remain the most widely used fuels in our area, many of the generation facilities
constructed in recent years use natural gas as their primary fuel, particularly for generators designed to
provide intermediate and peaking capability. Often favored for their relatively short construction lead
times, natural gas generating units are efficient and produce relatively low emissions. Fuel deliverability,
however, is a concern because of the nature of the infrastructure that delivers natural gas to the generating

2013 Report Card for North Carolina’s Infrastructure
Energy B+
P a g e | 61
stations. Some regions of North America are served only by a few, or even a single, pipeline system. North
Carolina, in fact, is almost entirely dependent on Transco Gas Pipeline for its natural gas requirements.
Diversity
On August 20, 2007, with the signing of Session Law 2007-397 (Senate Bill 3), North Carolina became the
first state in the Southeast to adopt a Renewable Energy and Energy Efficiency Portfolio Standard (REPS).
Under this law, investor-owned utilities in North Carolina will be required to meet up to 12.5% of their
energy needs through new renewable energy resources or energy efficiency measures by 2021. Rural
electric cooperatives and municipal electric suppliers are subject to a 10% REPS requirement. In general,
electric power suppliers may comply with the REPS requirement in a number of ways, including the use of
renewable fuels in existing electric generating facilities, the generation of power at new renewable energy
facilities, the purchase of power from renewable energy facilities, the purchase of renewable energy
certificates (RECs), or the implementation of energy efficiency measures.
Electric power suppliers can implement energy efficiency (EE) and demand-side management (DSM)
measures to fulfill portions of their REPS obligations. Senate Bill 3 specifies that electric power suppliers
shall use DSM and EE measures and supply-side resources to establish the least cost mix of demand
reduction and generation measures that meet the electricity needs of their customers. Each electric power
supplier that is required to file an integrated resource plan (IRP) must include in that plan and assessment
of DSM and EE and is required to submit cost-effective options that require participant incentives to the
Commission for approval. Upon petition by an electric public utility, the Commission shall approve an
annual rider to the utility’s rates to allow it to recover all reasonable and prudent costs incurred for new
DSM and EE measures, which includes only those programs instituted after January 1, 2007.
The Commission recognizes the need for a mix of baseload, intermediate, and peaking facilities and
believes that conservation, energy efficiency, peak-load management, and renewable energy resources
must all play a significant role in meeting the capacity and energy needs of each utility.
In 2011, 5.3 percent of North Carolina’s net electricity generation came from renewable energy resources,
almost all from conventional hydroelectric power and biomass. This trend is upward in terms of overall
renewable energy portfolio diversity and is anticipated to make North Carolina a leader in the nation by
2017.
Of the 347 private-access biodiesel fueling stations nationwide, nearly one-third are in North Carolina.
North Carolina ranked fifth in the Nation in net electricity generation from nuclear power in 2011,
producing 5.1 percent of the Nation's total.

2013 Report Card for North Carolina’s Infrastructure
Energy B+
P a g e | 62
Policy/Funding
In recent years, North Carolina has set forth policies and programs that show the importance of energy
issues in our state’s future. Some noteworthy policies and programs include:
Establishment of a “renewable energy and energy efficiency portfolio standard” (Session
Law 2007-397) that requires electric utilities in the state to meet a certain percentage of
their customers’ needs with renewable sources or reduced electricity consumption by
implementing energy efficiency programs.
Requirements that new and existing state buildings meet higher efficiency standards. The
General Assembly required that existing state buildings reduce energy consumption by 20%
from baseline energy use in 2002-2003 by 2010 (Senate Bill 668). New state buildings must
exceed national standards by 30%.
Limits on municipalities and homeowner associations to ban the installation of solar
collectors.
Creation of the Biofuels Center of North Carolina. Goal: by 2017, 10% of liquid fuels
consumed in North Carolina come from biofuels grown and produced within the state.
Allow the distribution of gasoline-ethanol mixed fuels, providing a motor fuel tax exemption
for biodiesel, mandating that state fleets only purchase diesel vehicles that honor
warranties if a 20% biodiesel mix (B-20) is used, and requiring that all diesel public school
buses be capable of running on B-20.
Approval of a new energy code for residential and commercial buildings, which was made
effective in January of 2009 by the North Carolina Building Codes Council and the North
Carolina Department of Insurance. Work is progressing on the next revision of the state’s
energy code, which has the goal of increasing the efficiency of new buildings beyond that
required by national energy codes.
New efficiency programs by electric and gas utilities in the state.
A variety of funding programs for implementation of renewable energy and energy
efficiency measures throughout the state’s economic sectors via the American Renewal and
Recovery Act.
North Carolina’s major municipalities have also taken a proactive role in energy efficiency, energy portfolio
diversity, and energy-based economic development programs that enhance both the human and natural
environment. One example includes the efforts of the state’s largest city, Charlotte, in developing a “smart
city” program that balances energy, water, air, and waste use in order to create a more efficient and vibrant
city. This program, developed through a public-private partnership that includes both the City and national
private sector firms, is one of the most unique in the nation. Another innovative program is that led by the
City of Raleigh’s Office of Sustainability, which has made Raleigh a national leader in many renewable
energy areas and had a meaningful impact on the energy awareness culture in the state’s capital city.
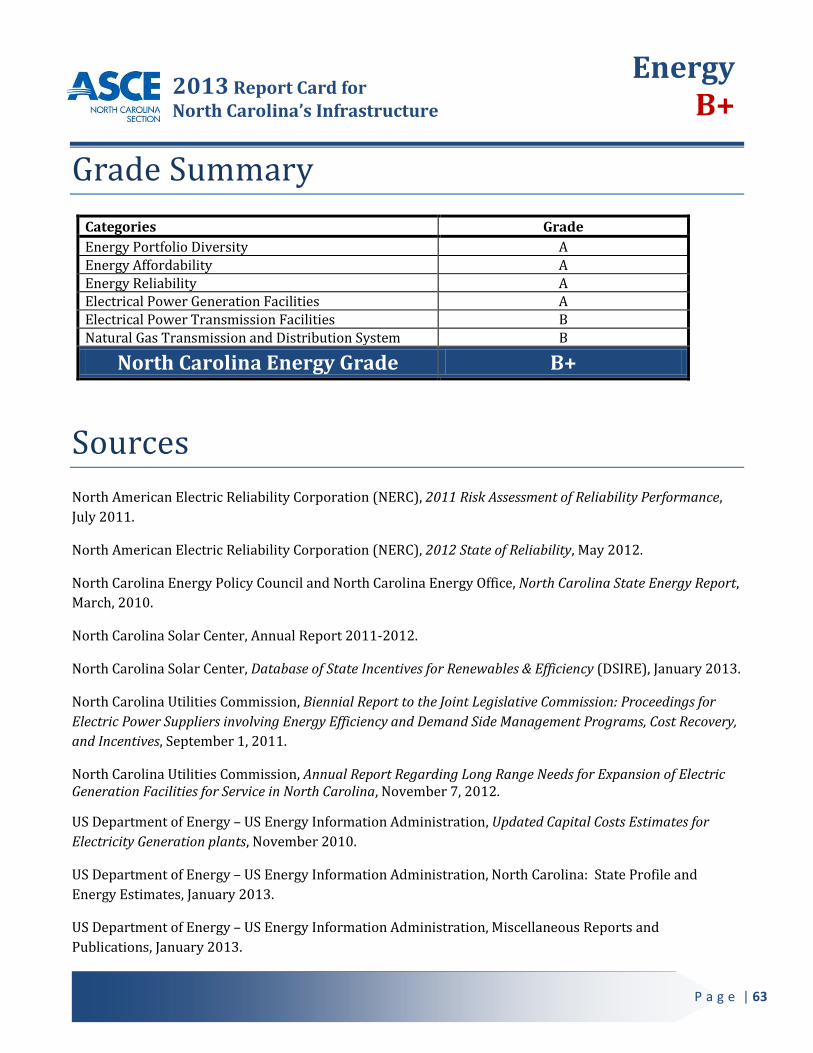
2013 Report Card for North Carolina’s Infrastructure
Energy B+
P a g e | 63
Grade Summary
Categories Grade
Energy Portfolio Diversity A Energy Affordability A Energy Reliability A Electrical Power Generation Facilities A Electrical Power Transmission Facilities B Natural Gas Transmission and Distribution System B
North Carolina Energy Grade B+
Sources
North American Electric Reliability Corporation (NERC), 2011 Risk Assessment of Reliability Performance,
July 2011.
North American Electric Reliability Corporation (NERC), 2012 State of Reliability, May 2012.
North Carolina Energy Policy Council and North Carolina Energy Office, North Carolina State Energy Report,
March, 2010.
North Carolina Solar Center, Annual Report 2011-2012.
North Carolina Solar Center, Database of State Incentives for Renewables & Efficiency (DSIRE), January 2013.
North Carolina Utilities Commission, Biennial Report to the Joint Legislative Commission: Proceedings for
Electric Power Suppliers involving Energy Efficiency and Demand Side Management Programs, Cost Recovery,
and Incentives, September 1, 2011.
North Carolina Utilities Commission, Annual Report Regarding Long Range Needs for Expansion of Electric Generation Facilities for Service in North Carolina, November 7, 2012.
US Department of Energy – US Energy Information Administration, Updated Capital Costs Estimates for
Electricity Generation plants, November 2010.
US Department of Energy – US Energy Information Administration, North Carolina: State Profile and
Energy Estimates, January 2013.
US Department of Energy – US Energy Information Administration, Miscellaneous Reports and
Publications, January 2013.
2013 Report Card for North Carolina’s Infrastructure
Rail C+
P a g e | 64
Overview
North Carolina (State Government and Rail Industry) has been a leader among states for their proactive
passenger and freight rail programs; however significant upgrades and improvements are needed to
sustain and improve existing conditions. The condition of North Carolina’s rail infrastructure has a direct
impact on the state’s economy, with more than 10.1 million tons of goods originated in, and more than 53.1
million tons of goods terminated in the state in 2010. Currently, only 30 percent of the state’s short lines
can accommodate the new, heavier rail cars being used, and it is estimated that freight rail investment
needs over the next 25 years will total $545 million.
In addition to the state’s freight rail needs, passenger rail modernization needs currently top $2.9 billion
over the next twenty-five years - 83 percent of the total passenger rail investment needed. In 2012, there
were more than 938,000 Amtrak passenger boardings in the state. Despite being named one of five future
high-speed rail corridors in 1992, many of the state’s fastest growing areas have no passenger rail service.
Consequently, rail travel is less competitive than the automobile, and therefore is currently a less viable
alternative transportation mode. As a result, North Carolina’s rail infrastructure has been given a Grade of
C+.
Background
In 2010, North Carolina ranked eighteenth in the nation for total rail miles, with approximately 3,245
passenger and freight miles. There are two Class I freight railroads, thirteen local railroads and seven
switching and terminal railroads in the state, as well as 3,898 public and 2,904 private at-grade crossings.
There are also three regional transit systems, Charlotte Area Transit System (CATS), Piedmont Authority
for Regional Transportation (PART) and Triangle Transit Authority (TTA) with proposed passenger rail
transit programs. The US Military owns rail rights of way that provide rail connections to the Military
Ocean Terminal Sunny Point (MOTSU) and to Camp Lejeune.
Amtrak operates intrastate and interstate passenger trains, including the Piedmont Service between
Charlotte and Raleigh, and the Washington-Charlotte segment of the Carolinian, both under contract with
the North Carolina Department of Transportation. The trains provide three daily roundtrips, with the
Piedmont Service (two daily round trips) serving the cities of Raleigh, Cary, Durham, Burlington,
Greensboro, High Point, Salisbury, Kannapolis and Charlotte, and the Carolinian (one daily round trip)
serves the cities of Rocky Mount, Wilson and Selma in addition to those served by the Piedmont Service.
Amtrak also operates four long-distance trains with stops in North Carolina: the Crescent, providing daily
service to Gastonia, Charlotte, Salisbury, High Point and Greensboro; the Palmetto, making stops in
Fayetteville, Selma, Wilson and Rocky Mount; the Silver Meteor, operating daily between New York and
Miami, with stops in Rocky Mount and Fayetteville; and the Silver Star (New York to Miami), providing

2013 Report Card for North Carolina’s Infrastructure
Rail C+
P a g e | 65
daily service to Hamlet, Southern Pines, Cary, Raleigh and Rocky Mount. In fiscal year 2012, Amtrak served
sixteen North Carolina municipalities with approximately 938,181 boardings and alightings.
Representing the “spine” of state rail traffic, the North Carolina Railroad Company (NCRR), is a 317-mile
rail corridor linking Charlotte, Greensboro, Raleigh and the state's seaport at Morehead City. More than 100
industries and several major military installations are served by the NCRR. The State of North Carolina is
the sole shareholder of the NCRR.
Norfolk Southern operates trains along the entire NCRR corridor under an operating and maintenance
agreement, with the segment between Charlotte and Greensboro being a key part of Norfolk Southern’s
(NSR) mainline between Atlanta and northeastern Unites States. CSX Transportation (CSXT) also shares
operation on a nine (9) mile portion of the NCRR corridor between Raleigh and Cary.
Norfolk Southern and CSXT also operate freight rail lines in North Carolina providing both local freight
service and through freight. NSR and CSXT are responsible for the maintenance and operation of their rail
lines, and these private corporations must make significant investments to improve their facilities, such as
the replacement of ties and rail.

2013 Report Card for North Carolina’s Infrastructure
Rail C+
P a g e | 66
Conditions
Intermodal Facilities
Intermodal freight facilities allow the efficient movement of goods between the modes of rail and truck,
helping to decrease overall energy use while maintaining reliable delivery schedules resulting in better
prices for consumer products throughout a state and region.
CSX Intermodal Terminal Improvements, Charlotte ($9.5M)
CSX operates an existing intermodal terminal west of Uptown Charlotte. The existing facility has an annual
capacity of 80,000 lifts. As part of the National Gateway program and in cooperation with NCDOT, an
expansion project was completed that enabled CSX to construct significant infrastructure improvements to
its Charlotte Intermodal Yard. Project was partially funded with a $4.5M grant from NCDOT.
Norfolk Southern (NS) Intermodal Facility, Charlotte ($90M)
The existing NS intermodal facility in Mecklenburg County has reached capacity with no possibility to
expand in its current location. The Charlotte area’s regional leadership supported a new intermodal facility
on approximately 300 acres of land owned by the City of Charlotte at the Charlotte-Douglas International
Airport. The new Charlotte facility will increase capacity by over 100% and is designed to accommodate
250,000 lifts annually. The site will allow additional future expansion capable of handled over 400,000 lifts
annually.
According to an analysis conducted by Insight Research Corporation the new intermodal facility will result
in keeping the existing jobs in NC as well as creating an additional 157 permanent jobs directly, with
indirect positive effects on over 6,800 jobs, resulting in economic impacts approaching $8-10 billion over a
twenty year period. Construction will take place over a two year period creating a significant number of
construction related jobs. Completion is scheduled for 2nd Quarter 2014.
NCDOT worked with NS and City of Charlotte to construct significant additional highway capacity for the
new terminal. The new facility is a strategic investment by Norfolk Southern in their Crescent Corridor,
designed to serve a growing population in the post-Panamax era.
NS received $16 million in federal grants to assist in construction of this new “Intermodal Freight Facility.”
These grant monies are made available through SAFETEA-LU, Section 1306, Freight Intermodal Distribution
Program ($5mil); and Section 1702 High Priority Projects ($16.5mil). The goal of these programs is to
facilitate and support intermodal freight transportation initiatives, while helping relieve congestion and
improve safety. The funding is being administered by the NCDOT Rail Division.
The total investment by Norfolk Southern Railroad will be in excess of $90 million. NS will be eligible for
State tax credits of 50% of capital investments plus sales tax relief for operations.

2013 Report Card for North Carolina’s Infrastructure
Rail C+
P a g e | 67
Multi-Modal Stations
Raleigh Union Station ($60.5M)
The City of Raleigh and NC Department of Transportation (NCDOT) are proposing to construct a new
passenger train station in downtown Raleigh at 510 West Martin Street. The station would replace the
existing Amtrak Station on Cabarrus Street, which routinely experiences overcrowding and lacks adequate
platform size to serve the longer trains that serve the station.
The project calls for reusing a Triangle Transit Authority (TTA)-owned industrial building, which has been
vacant since 2005. The 26,000 square foot building will provide 7,950 square feet of passenger waiting
area, thereby quadrupling the waiting area of the existing Amtrak Station. An underground passenger
concourse will connect the station building to the high level ADA compliant passenger platform. The 800-
foot long passenger platform will include a 600 foot long canopy to protect patrons from the elements. The
center-island platform will allow passengers to board from either side, thereby providing more flexibility
for train operations.
Currently, when passenger trains are at the existing station, the mainline railroad track is blocked. This
forces freight and other passenger trains to wait until the passenger loading and unloading is complete
2013 Report Card for North Carolina’s Infrastructure
Rail C+
P a g e | 68
before they can proceed. The new facility will have two dedicated station tracks that will remove passenger
trains from the mainline tracks, thus improving railroad operations.
Lexington, NC Multi-Modal Transportation Station Area Plan ($775,482)
This project will use TIGER II Planning Grant funds leveraged with local and state in-kind services to
prepare a Multi-Modal Transportation Station Area Plan within the City of Lexington’s Depot District. In
preparation for passenger rail service anticipated to begin in 2016, this project provides the City with the
necessary technical assistance, structural and railroad engineering, street engineering, architectural
expertise, policy guidance, community input and agency coordination to produce a Multi-Modal
Transportation Station Area Plan suitable for funding. Construction and operation of this station, along
with transit-oriented redevelopment of the surrounding Depot District, will advance Lexington’s livability
and sustainability goals. The design project funding is provided by a TIGER II Discretionary Grant
($700,000) and City in-kind services ($75,482).
Charlotte Gateway Station (Public Private Partnership)
The North Carolina Department of Transportation, in partnership with the City of Charlotte and
Mecklenburg County, has hired a Master Developer for the Charlotte Gateway Station (CGS) project in the
heart of Charlotte’s Uptown District. The Master Developer was selected through a competitive proposal
and selection process. The project objectives are as follows:
Establish a state-of-the-art iconic multi-modal transit center; Increase rail and bus transit ridership; Develop a financially viable mixed-use project using public and private-sector funding sources; Create new revenue sources for the public sector to support operational maintenance of CGS; Expand State and local property, sales and income tax base; and Implement urban design and Transit Oriented Development (TOD) best practice principles.
This specific development project is envisioned by NCDOT and the City as an important step to introduce major multi-modal transit facilities, TOD and urban revitalization to this area of the City. The opportunity includes the redevelopment of all NCDOT owned property in the CGS area as a means of facilitating the establishment of intercity passenger rail service, additional CATS transit hub and a signature regional train station complex. The Gateway Station area encompasses the largest assemblage of developable land in Uptown Charlotte, and is comprised of approximately twenty acres adjoining the Norfolk Southern Mainline.
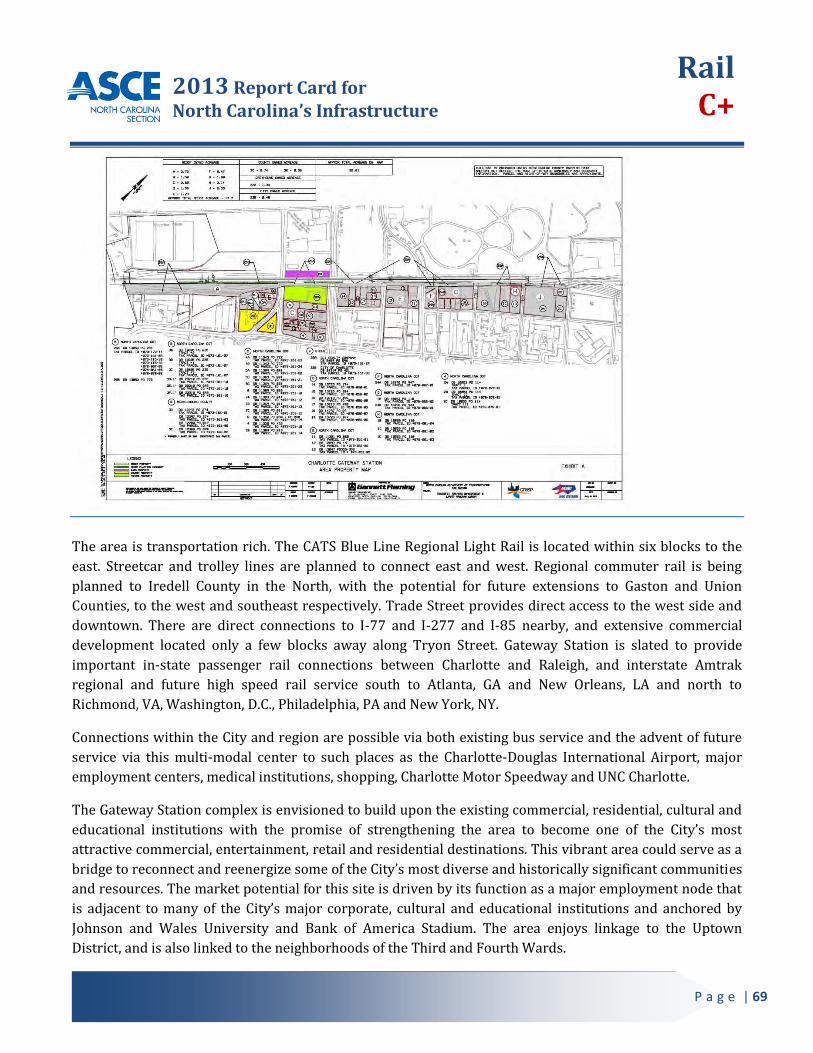
2013 Report Card for North Carolina’s Infrastructure
Rail C+
P a g e | 69
The area is transportation rich. The CATS Blue Line Regional Light Rail is located within six blocks to the
east. Streetcar and trolley lines are planned to connect east and west. Regional commuter rail is being
planned to Iredell County in the North, with the potential for future extensions to Gaston and Union
Counties, to the west and southeast respectively. Trade Street provides direct access to the west side and
downtown. There are direct connections to I-77 and I-277 and I-85 nearby, and extensive commercial
development located only a few blocks away along Tryon Street. Gateway Station is slated to provide
important in-state passenger rail connections between Charlotte and Raleigh, and interstate Amtrak
regional and future high speed rail service south to Atlanta, GA and New Orleans, LA and north to
Richmond, VA, Washington, D.C., Philadelphia, PA and New York, NY.
Connections within the City and region are possible via both existing bus service and the advent of future
service via this multi-modal center to such places as the Charlotte-Douglas International Airport, major
employment centers, medical institutions, shopping, Charlotte Motor Speedway and UNC Charlotte.
The Gateway Station complex is envisioned to build upon the existing commercial, residential, cultural and
educational institutions with the promise of strengthening the area to become one of the City’s most
attractive commercial, entertainment, retail and residential destinations. This vibrant area could serve as a
bridge to reconnect and reenergize some of the City’s most diverse and historically significant communities
and resources. The market potential for this site is driven by its function as a major employment node that
is adjacent to many of the City’s major corporate, cultural and educational institutions and anchored by
Johnson and Wales University and Bank of America Stadium. The area enjoys linkage to the Uptown
District, and is also linked to the neighborhoods of the Third and Fourth Wards.

2013 Report Card for North Carolina’s Infrastructure
Rail C+
P a g e | 70
Regional Transit Systems
Charlotte Area Transit System LYNX Blue Line Extension ($1.16 Billion)
This project is a 9.3-mile extension of the existing light rail system from Ninth Street in Center City to the
UNC Charlotte campus. Eleven stations and four park-and-ride facilities are planned. The service will also
include approximately 3,100 parking spaces. Daily ridership is projected at 25,000 plus patrons with a
revenue service beginning in March 2017.
A Federal Full Funding Grant Agreement will provide 50 percent of the project costs; with state and local
funds comprising the balance of project cost.
Triangle Transit in the Durham-Chapel Hill-Raleigh region has plans to construct both light rail and
commuter rail systems. Both Orange and Durham Counties have passed sales taxes to fund transit. Wake
County has not yet scheduled a vote.
Southeast High Speed Rail Corridor Update
The NCDOT Rail Division continues to advance a plan to develop new and improved existing passenger rail
service on the Southeast High Speed Rail (SEHSR) corridor between Charlotte, NC and Washington DC. At
full build-out SEHSR will include eight (8) roundtrips between Charlotte and Raleigh with four (4)
roundtrips extending north to Washington along a corridor through Henderson, Petersburg, VA and
Richmond, VA. This route was federally designated as a High Speed Rail Corridor in 1992 and the Raleigh to
Richmond (R2R) portion is an initiative to provide a higher speed rail linkage between these two
capitals. The SEHSR-R2R project is currently nearing the end of the extensive environmental compliance
and preliminary design phase. The next steps (once funding is established) are final design, right-of-way
purchase and construction. The Commonwealth of Virginia is working with the Federal Railroad
Administration to complete the necessary planning and design to upgrade the Richmond, VA to
Washington, DC corridor.
The SEHSR-R2R is a massive project, over 160 miles in length, with a proposed top speed of 110 mph. The
route generally follows the former CSX “S Line” tracks north of Raleigh. This will significantly reduce the
mileage to Richmond, VA versus the current Amtrak route east through Selma, NC and Rocky Mount, NC. To
manage the project, it was broken into twenty-six (26) distinct sections, with one to four alternative
alignments per section. Approximately 60 percent of the existing rail route is utilized, with deviations from
this track being in the interest of improvements to efficiency, safety and speed. The project proposes to
increase vehicular and rail traveler safety by consolidating at-grade crossings and replacing them with
bridges throughout. This results in an associated 90 miles of highway road work.
Due to the magnitude of the Washington, DC to Charlotte, NC corridor, the environmental clearances were
broken into phases called “tiers”. The Tier I was an overarching programmatic document phase that
established the purpose & need, modal choice, and selected a preferred corridor choice. The selected
routing was Washington DC; Richmond, VA; Petersburg, VA; Raleigh, NC; Greensboro, NC; and Charlotte, NC
2013 Report Card for North Carolina’s Infrastructure
Rail C+
P a g e | 71
utilizing existing railroad corridors. No actual projects can be constructed under this first phase. However,
under the Tier I’s “umbrella”, more detailed follow-up documents called “Tier II” documents are completed
to allow for individual projects to be cleared and constructed. SEHSR-R2R is currently nearing the end of its
Tier II planning work and will soon be cleared for final design, right-of-way purchase and construction.
In the Tier II R2R, there are three environmental documents: a Draft Environmental Impact Statement
(DEIS), a Final EIS and a Record of Decision (ROD). There is associated preliminary design necessary to
complete the environmental work. The DEIS was completed in May of 2010. Public Hearings were held in
the summer of 2010. A Recommendation Report was issued as an advisory update on the preferred
railroad alignment in May of 2012. The FEIS is ongoing, and will be completed in late 2013. The follow-up
ROD is anticipated by the spring of 2014.
The result of all of this work will be a high-performing, commercially viable passenger rail service that
connects North Carolina with Washington, DC and the Northeast United States.
Future Needs
Passenger Rail
The ability to reduce travel times and increase reliability of passenger trains is essential to making
passenger rail travel competitive with the automobile; and therefore a more viable alternative
transportation mode. However, operation of passenger trains on private freight rail corridors must not be
at the expense of existing or future freight capacity needs because the ability of freight rail to transport
goods in a safe and efficient manner has a direct impact on the state’s economy.
It is estimated that over the next 25 years passenger rail needs, both capital costs (e.g., acquisition of train
sets) and operating costs (e.g., recurring costs such as labor and utility bills), will total $3.5 billion. This
need is focused primarily—83 percent of the total investment needed—on modernization projects such as,
track upgrades in the Raleigh to Charlotte corridor to accommodate higher speed service. The remaining
17 percent of needed investment would go to expansion of the existing system through projects such as,
creation of passenger rail service between Salisbury and Asheville and between Wilmington and Raleigh.
Freight Rail
Also impacting the future of rail is the freight industry’s transition to 286,000-pound capacity cars—in lieu
of the older cars with a 263,000-pound capacity - to more efficiently transports commodities.
Unfortunately, many light density branch lines cannot handle these larger cars, as they have light weight
rail in sections, shallow or poor ballast and/or deferred tie maintenance, thus decreasing their capacity and
operating speed. Currently, only 30 percent of the state’s short lines can accommodate the new, heavier
rail cars.

2013 Report Card for North Carolina’s Infrastructure
Rail C+
P a g e | 72
Freight rail service to and from North Carolina’s ports are limited and each port is served by a single rail
carrier: CSXT provides daily service to the Port of Wilmington, while Norfolk Southern operates into the
Port of Morehead City. Low historical rail freight volumes to Wilmington and Morehead City have resulted
in high per-unit rail costs, making rail transport less competitive as compared to truck transport in the
state.
Two freight railroad projects are currently under construction in Fayetteville and Greenville. Both projects
work to streamline freight switching operations and serve to reduce highway/railroad conflicts within
downtown districts. The projects in Fayetteville have $8 million earmarked in federal funds to date for
these improvements, which has a 20% municipal contribution. Greenville is estimated at approximately
$9.6 million, with funding partnership between FRA, NCDOT and CSXT to deliver the projects.
A new location bypass track is currently in the early final design phase north of the Town of Pembroke.
This project will provide a railroad track connection between the CSXT north–south “A” Line and the CSXT
east-west Wilmington Subdivision in Pembroke, NC in order to permit a direct east to north rail route. This
connection will allow freight trains to operate from Wilmington to Fayetteville and points north. Key
locations directly served by this connection include the North Carolina State Port facilities at Wilmington
and the US military facilities located at Fort Bragg, near Fayetteville. The connection will have the ability to
provide enhanced rail service between Fort Bragg and the NC State Port. Funding of this $13.9 million
project is provided by FRA and State Funding via the Mobility Fund with construction scheduled to begin in
early 2015.
Funding
American Recovery & Reinvestment Act of 2009 (ARRA)
In January 2010, the State of North Carolina was awarded $545 million for railroad improvements in the
Raleigh to Charlotte rail corridor. These funds will be used to construct two passing sidings, twenty-six (26)
mile of double track, thirteen (13) highway bridges (over or underpasses of the railroad), twelve (12) miles
of roadway to route traffic from approximately twenty-eight (28) closed at-grade public and private
crossings to said new bridges; station and facility improvements; state-owned locomotive rebuilds; state-
owned railcar refurbishments and elimination of a primary NS/CSXT at-grade railroad crossing in Uptown
Charlotte. Said projects are all encompassed under the Piedmont Improvement Program. By congressional
mandate, these projects must be completed and all invoices paid by September 30, 2017.

2013 Report Card for North Carolina’s Infrastructure
Rail C+
P a g e | 73
The following chart provides a list of specific projects included in the Piedmont Improvement
Program:
Category Project
Equipment Procurement and Rehabilitation
$30M
Rebuild two FP59PHI locomotives
Rebuild three F59PH locomotives
Refurbish three railcars
Purchase four used coaches and parts and refurbish nine
railcars.
Stations and Facilities
$50M
Cary Depot Expansion

2013 Report Card for North Carolina’s Infrastructure
Rail C+
P a g e | 74
Station Security
Backup Generators
Charlotte Maintenance Facility
Kannapolis Station Platform Canopy
High Point Station Parking Expansion
Burlington Station Platform Extension
Capital Yard Phase I Improvements
Passenger Information Display Systems (PIDS)
Raleigh Union Station (Platforms & Tracks)
Track and Structures
$336M
‘H’-Line Projects: Raleigh-
Greensboro
Graham (CP Merrill) to CP Haw River Passing Siding and
curve realignment
McLeansville/Carmon Road crossing closure
CP Nelson to CP Clegg passing siding
Hopson Road grade separation
Morrisville Parkway grade separation
Mainline Projects: Greensboro -
Charlotte
Double Track CP Haydock to CP Junker
Caldwell Road grade separation
Grier Road grade separation
Pharr Mill Road grade separation
Roberta Road grade separation
Double Track CP Reid to CP North Kannapolis
Peeler Road grade separation

2013 Report Card for North Carolina’s Infrastructure
Rail C+
P a g e | 75
Double Track CP Bowers to CP Lake
Upper Lake Road grade separation
Turner Road grade separation
Klumac Road grade separation
Curve Realignment at CP Duke
Private Crossing Safety Initiative (PCSI)
CRISP-NS/CSXT Mainline Grade Separation
$129M
North Church Street Improvements
NC Music Factory Blvd. and Maxwell Court Extension
Roadway Work
NCDOT Trench and Track (CSXT “SF” Line)
Norfolk Southern roll-in bridges and signals
CSXT signals
In addition to the above identified ARRA projects, the North Carolina Railroad Company (NCRR)
has invested over $68 million in improvement projects along its corridor since 2000 with $83
million committed in the near future, including:
Project Total Cost Completion
Neuse River bridge replacement $4,900,281 2004
EC Line Rail Replacement $10,381,969 2004/2008
NC 54 Bridge grade separation $5,460,726 2006
Cox to Hoskins double track Total cost - $27,963,685; NCRR-
$4,000,000
2009
Elon University Pedestrian Underpass $2.5M (NCRR $1M; Elon
University $1.5M)
2010
Rail Welding - New Bern to Morehead City $300,510 2010

2013 Report Card for North Carolina’s Infrastructure
Rail C+
P a g e | 76
Kinston Team/Transload Track $891,937 2010
Kinston Track Realignments and Corridor
Improvement
$2,759,628 (NCRR) 2010
EC Line Bridge Replacement- Replaced eight single
track trestles to address settling piers and weight
requirements.
$3M; (NCRR $1,503,808, NS
$1,496,192)
2011
Replacement of Neuse River Bridge Approaches $8M - (50/50 NCRR/NS cost
sharing)
2012
Eastern Grade Crossing Improvements - Improve
grade crossing protection at 32 crossings between
Selma and Morehead City.
$3,692,423 ($901,681;
NCDOT/NS)
2013
Improvements to five bridges and culverts on the
NCRR. Includes culverts in Durham, Kinston and
Cove City.
$4,677,700 (50% NCRR; 50% NS) 2013
Trent River Bridge - Improve corroding steel piles
over Trent River in New Bern by encasing them in
concrete.
$1,890,000 (50/50 NCRR/NS) 2013
Installation of a passing siding at LaGrange $4,070,000 (NCRR) 2013
Construction of a pedestrian underpass at UNC-
Greensboro.
$8M (NCRR $1M; UNCG $7M) 2013
Improve railroad alignment and provide room for
future additional track construction near Yadkin
River in Rowan and Davidson Counties.
$4,444,659 (NCRR $3M,
NCDOT/FRA $1.44M)
2013/2014
Policy Options
The primary purpose of the Congestion Mitigation and Air Quality (CMAQ) program is to fund
transportation projects that reduce air pollution emissions in areas designated by the Environmental
Protection Agency as non-attainment or maintenance with respect to a National Ambient Air Quality
Standard.

2013 Report Card for North Carolina’s Infrastructure
Rail C+
P a g e | 77
Current policy restricts use of CMAQ funding to offset operating costs for a period of three years; however,
the beneficial impacts of intercity passenger rail services are proven and eligible tool in improving air
quality. These projects not only meet initial program eligibility criteria, but the emissions benefits sustain
and increase over time as ridership grows.
State-sponsored intercity passenger trains continue to have the highest rate of ridership growth of any
trains operated by Amtrak and in 2011 comprised 48 percent of all intercity passenger trips. As Congress
shifts more responsibility to the states to plan, design, finance, construct, maintain, procure equipment,
contract for operation, and manage these services, states need to have the flexibility to use CMAQ funds for
this ongoing purpose.
The Highway Safety Improvement Program (HSIP) has contained a set-aside for highway-rail grade
crossing safety improvements, known as Section 130, since Congress passed the 1973 Highway Bill. The
27-month reauthorization of this bill, known as MAP-21, extended Section 130 at the level of the previous
reauthorization for the 27-month duration of MAP-21. States have thereby been able to continue
programming and funding of grade crossing safety improvement projects to the benefit of public safety.
During discussion and debate on the MAP-21 reauthorization, Congress expended considerable effort
towards consolidating various set-asides into larger programs. Section 130 was among the set-asides
targeted for merging into the HSIP; however, as few states provided emphasis on grade crossing safety
under HSIP, instead applying those funds exclusively for highway safety, Congress delayed consolidation of
Section 130 into HSIP. The practical impact is that the number of grade crossings have been closed and
consolidated, and a substantial number of those remaining have received upgraded warning systems.
Without an earmark for safety and infrastructure improvements at-grade intermodal intersections,
evidence indicates there may be little attention towards funding grade crossing projects at the state level. It
seems incumbent on Congress to continue a directed grade crossing program. This is especially true as
crossing warning systems become obsolete and in need of replacement; many automatic crossing warning
devices and systems are more than 25 years old and would benefit from replacement with devices and
systems of current design. There also remains a continuing need to evaluate and fund projects at passive
and signals-only grade crossings. The source within the federal transportation bill of a directed grade
crossing safety and infrastructure program is far less important than its continuation.

2013 Report Card for North Carolina’s Infrastructure
Rail C+
P a g e | 78
Grade Summary
Categories Weighting Factor Grade
Funding 0.33 C
Future Passenger Rail Needs 0.33 C+
Future Freight Rail Needs 0.33 C+
North Carolina Rail Grade C+
Recommendations
Encourage the Congress to support amendments to the surface transportation legislation that would provide additional flexibility to states by eliminating the three-year restrictions on the use of Congestion Mitigation and Air Quality (CMAQ) funding for operating intercity passenger rail service.
Integrate rail into a national multimodal transportation policy that recognizes and takes advantage of efficiencies in the movement of people and goods.
Provide a continuous long-term funding source for highway-rail crossing safety, rail infrastructure maintenance and capital improvements;
Increase federal funds to address safety at private crossings statewide; and Support national legislation to increase funding for rail capacity, multi-modal stations and
freight inter-modal traffic. Support a regulatory and financial environment that encourages continued private investment
in North Carolina’s railroad system.
Sources
American Association of State Highway and Transportation Officials (AASHTO) letter to Congressional
Representatives, March 14, 2012.
Amtrak, State of North Carolina Fact Sheet, Fiscal Year 2012.
Association of American Railroads (www.aar.org)
Charlotte Area Transit System (www.Charmeck.org)

2013 Report Card for North Carolina’s Infrastructure
Rail C+
P a g e | 79
North Carolina Department of Transportation, CSX Intermodal Terminal Expansion Categorical Exclusion,
December 2010.
North Carolina Department of Transportation, Norfolk Southern Intermodal Facility at Charlotte Douglas
International Airport Categorical Exclusion, March 2009.
North Carolina Department of Transportation, Investing in the Future, North Carolina’s Passenger Rail
Development Programs, January 2002.
North Carolina Department of Transportation, Charting a New Direction for NCDOT, North Carolina’s Long-
Range Statewide Multimodal Transportation Plan, September 2004.
North Carolina Department of Transportation, Rail Division (www.bytrain.org)
North Carolina Department of Transportation, Rail Division, Private Crossing Safety Initiative Report,
October 2003.
North Carolina Department of Transportation, Rail Division, Southeastern North Carolina Passenger Rail
Study, August 2004.
North Carolina Department of Transportation, North Carolina Rail Plan, 2000.
North Carolina Department of Transportation, North Carolina Maritime Strategy Final Report, June 26,
2012.
North Carolina Railroad Company, Annual Report, 2011.
North Dakota State University, Upper Great Plains Transportation Institute, North Dakota’s Freight Analysis
– Heavier Loading Rail Cars, 2001.
North Dakota State University, Upper Great Plains Transportation Institute, Small Railroads – Investment
Needs, Financial Options, Public Benefits, 2001.
TIGER II Discretionary Grants, Planning Cooperative Agreement (FR-TII-0005-11-01-00), City of Lexington
and Federal Railroad Administration, September 2011.
United States Department of Transportation, Federal Railroad Administration (http://safetydata.fra.dot.gov/officeofsafety/)
The Woodside Consulting Group, Study of Passenger Train Service between Salisbury and Asheville, February
2002.
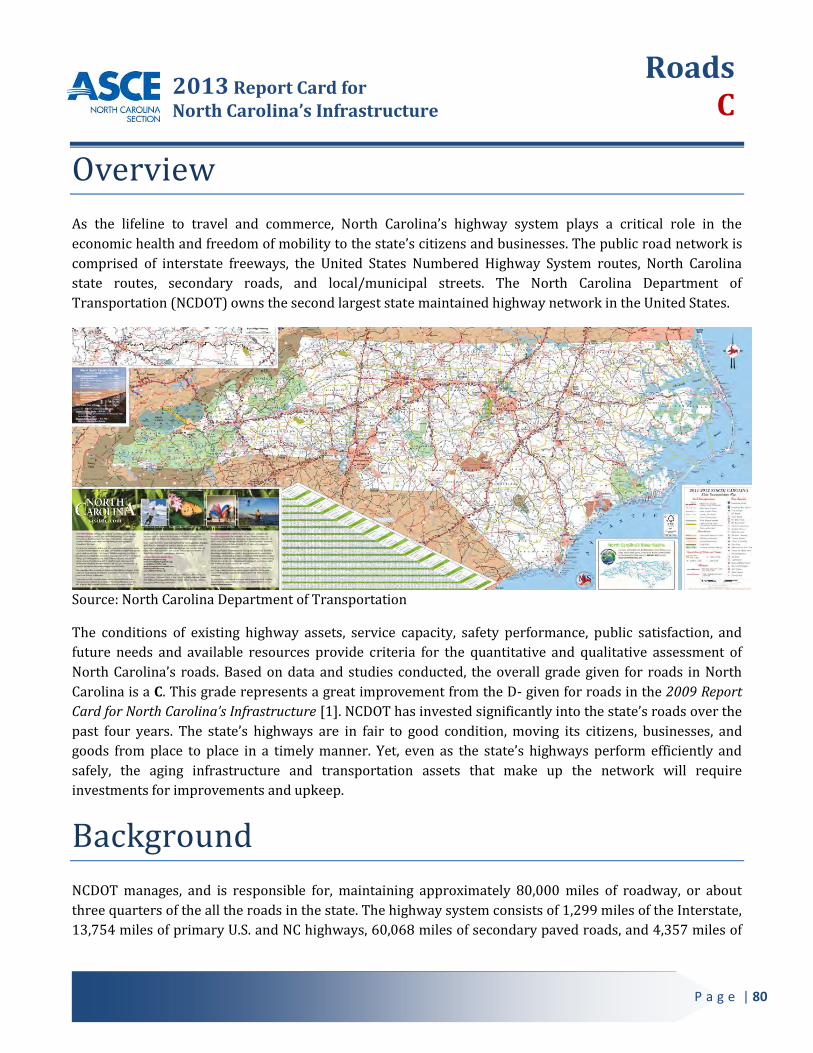
2013 Report Card for North Carolina’s Infrastructure
Roads C
P a g e | 80
Overview
As the lifeline to travel and commerce, North Carolina’s highway system plays a critical role in the
economic health and freedom of mobility to the state’s citizens and businesses. The public road network is
comprised of interstate freeways, the United States Numbered Highway System routes, North Carolina
state routes, secondary roads, and local/municipal streets. The North Carolina Department of
Transportation (NCDOT) owns the second largest state maintained highway network in the United States.
Source: North Carolina Department of Transportation
The conditions of existing highway assets, service capacity, safety performance, public satisfaction, and
future needs and available resources provide criteria for the quantitative and qualitative assessment of
North Carolina’s roads. Based on data and studies conducted, the overall grade given for roads in North
Carolina is a C. This grade represents a great improvement from the D- given for roads in the 2009 Report
Card for North Carolina’s Infrastructure [1]. NCDOT has invested significantly into the state’s roads over the
past four years. The state’s highways are in fair to good condition, moving its citizens, businesses, and
goods from place to place in a timely manner. Yet, even as the state’s highways perform efficiently and
safely, the aging infrastructure and transportation assets that make up the network will require
investments for improvements and upkeep.
Background
NCDOT manages, and is responsible for, maintaining approximately 80,000 miles of roadway, or about
three quarters of the all the roads in the state. The highway system consists of 1,299 miles of the Interstate,
13,754 miles of primary U.S. and NC highways, 60,068 miles of secondary paved roads, and 4,357 miles of

2013 Report Card for North Carolina’s Infrastructure
Roads C
P a g e | 81
secondary unpaved roads [2]. At the central office in Raleigh, NCDOT uses a performance-based
prioritization process to reach investment goals, plan improvement programs, and allocate funds across
the state to fourteen division offices that manage construction, maintenance, and operations within each
one’s geographic regions.
The state’s roads have been assessed for the following aspects: Conditions of Assets, Mobility and Safety, and
Funding. North Carolina’s highway system has been rated based on its ability to move travelers and goods
safely and efficiently for the enhancement of the economy, health, and well-being of the state. The grade
results from an in-depth review of various NCDOT assessments that were undertaken to evaluate how well
the statewide network meets public need.
Conditions of Assets
Condition is the physical health and service longevity of the assets that comprise the highway network.
These assets include asphalt/concrete pavements, travel way features and markings, right-of-way
appurtenances, geotechnical/hydraulic structures, as well as bridges. NCDOT’s Infrastructure Health Index
(IHI) combines statewide assessments from the Pavement Condition Survey (PCS), Bridge Condition
Survey, and Maintenance Condition Survey (MCS) to calculate an overall system score and determine the
agency’s success in maintaining and improving the highway network [2]. For the purpose of this report
card, the primary road assets to be considered are pavements, drainage features, roadside appurtenances,
and traffic delineation and signs.
NCDOT’s Pavement Management Unit conducts the statewide PCS for the collection of Pavement Condition
Ratings (PCR) and International Roughness Index (IRI) values along highway segments to evaluate the
conditions and structural health of existing roads [3]. The Pavement Condition Index (PCI) quantifies
conditions on a numerical scale between 0 and 100. Pavements are qualitatively defined as good, fair, or
poor depending on PCI values observed for roadways segments; pavements with values greater than or
equal to 80 are defined as being in good condition, greater than 60 and less than 80 are considered fair, and
less than 60 are considered poor. The ratings derived from collected data use weighted averages to account
for the varying lengths of road segments being assessed. Based on the 2012 statewide pavement condition
assessment, over 68 percent of total lane miles on state maintained interstate, primary, and secondary
highways received good condition ratings. A summary of results is provided in the following table.
Furthermore, in 2010, target values for “Good” ratings of 85, 80, and 75 percent by 2012 were set for
interstate, primary, and secondary highways, respectively. Although the majority of pavements were in
good condition, the results found that all highway types were short of reaching 2012 goals.

2013 Report Card for North Carolina’s Infrastructure
Roads C
P a g e | 82
Source: 2012 NCDOT Pavement Management System
The Management Systems and Assessments Unit oversees the Maintenance Condition Assessment Program
(MCAP) as a basis for biennial assessment of transportation infrastructure and the subsequent resource’s
needs. In the most recent 2012 Report on the Condition of the State Highway System, NCDOT evaluated
roadway drainage, roadside features, traffic delineation and signs, and other assets in the right-of-way.
Drainage was assessed for unpaved shoulders, ditches, crossline pipes, curb/gutter, and inlet/outlet boxes.
Vegetation, stormwater devices, landscape plant beds, and rest areas/welcome centers along the roadside
were addressed. The traffic elements included pavement markings, markers, and signs. Various
performance measures were used to score all elements on a scale of 0 to 100.
Source: 2012 NCDOT Maintenance Condition Assessment Program
System
Total
Lane
Miles
Good
Lane
Miles
Fair
Lane
Miles
Poor
Lane
Miles
%
Good
%
Fair
%
Poor
Weighted
IRI
Averages
Interstates 6,330 4,942 998 390 78.1 15.8 6.2 87.9
Primaries 35,973 24,593 8,565 2,815 68.4 23.8 7.8 85.1
Secondaries 121,183 83,830 24,642 12,711 69.2 20.3 10.5 83.8
2012 Pavement Structural Condition Ratings by Highway Types
Interstate Primary Secondary
Unpaved ShouldersNo dropoffs greater than 3 inches and no shoulders higher than 2
inches
Ditches (Lateral) No blocked, eroded, or nonfunctioning ditches
Crossline Pipe (Blocked) Greater than 50% diameter open
Crossline Pipe (Damaged) No damage or structural deficiency effecting functionality
Curb & Gutter (Blocked) No obstruction greater than 2 inches for 2 feet
Boxes (Blocked or Damaged)Grates and outlet pipes of boxes blocked <50%. Inlets and outlets
of boxes are not damaged, and grates are present and not broken.
Vegetation (Brush & Tree)
Freeways: 45' from travelway, 5' behind guardrail, not blocking
signs; Non-Freeways: Vertical clearance of 15' over roadway and
10' back of ditch centerline or shoulder point
90 85 80
Vegetation (Turf Condition) Areas free of erosion 95 85
Stormwater Devices (NPDES) Functioning as designed 90
Landscape Plant Beds Achieving a score of 2 or higher on the inspection form 80 N/A
Rest Areas & Welcome Centers Condition Rating of 90 90 N/A
Long Line Pavement Markings Present, visible 90
Words and Symbols Present, visible N/A
Pavement Markers Present and reflective N/A
Ground Mounted Signs Visible and legible 85
Overhead Signs Visible and legible 92 N/A
NCDOT Maintenance Condition Performance Measures and 2012 Targets
Element Performance Measure
Tra
ffic
85
80
90
2012 Targets
Dra
ina
ge
95 90 85
Ro
ad
sid
e
90
90

2013 Report Card for North Carolina’s Infrastructure
Roads C
P a g e | 83
The majority of the state roads’ drainage, roadside, and traffic elements met or exceeded 2012 targets, with
overall improvements of 92.8, 91.8, and 91.0 from 2010 averages of 89.9, 86.9, and 86.2 for interstate,
primary, and secondary highways, respectively [4]. Vegetation (Turf Condition), a roadside element, saw
significant improvements on all highway types in increased areas free of erosion from 2010 conditions.
Traffic navigation assets greatly improved on interstate and primary highways. Along primary routes,
Pavement Markers and Overhead Signs added 22 and 17 points to 2010 values of 59 and 80, respectively.
Although, the conditions of roadway assets mostly improved, many of drainage features along interstate
highways did not meet target values.
Source: 2010 and 2012 NCDOT Maintenance Condition Assessment Program
In addition to quantifying the physical health of North Carolina’s highway infrastructure, NCDOT
implements a unique assessment on the public opinion of the state’s highways. Public satisfaction is a
performance measure that is not easily measured as it pertains to the subjective opinion and perspective of
traveling motorists. In 2011, NCDOT commissioned a study that recruited a random sample of North
Carolina residents and invited community leaders to participate in facilitated reviews as passengers of
various roadway segments [5]. The study was an interactive survey in which the participants rode along
various segments of interstate, primary, and secondary highways and rated the conditions of roadway and
roadside features. Subsequently, NCDOT used the results to validate the performance measures set forth
2010 Score 2012 Score 2010 Score 2012 Score 2010 Score 2012 Score
Unpaved Shoulders 91 92 89 92 91 93
Ditches (Lateral) 98 99 94 97 94 96
Crossline Pipe (Blocked) 87 87 78 81 74 82
Crossline Pipe (Damaged) 93 91 95 97 91 96
Curb & Gutter (Blocked) 97 96 96 97 96 97
Boxes (Blocked or Damaged) 82 84 87 90 85 92
Vegetation (Brush & Tree) 90 92 85 90 80 86
Vegetation (Turf Condition) 84 91 83 94 86 94
Stormwater Devices (NPDES) 94 94 94 94 94 94
Landscape Plant Beds 90 90 90 90 N/A N/A
Rest Areas & Welcome Centers 96 96 95 93 N/A N/A
Long Line Pavement Markings 93 96 90 94 81 88
Words and Symbols 73 N/A 85 87 77 85
Pavement Markers 84 91 59 81 N/A N/A
Ground Mounted Signs 94 94 91 94 85 89
Overhead Signs 93 99 80 97 N/A N/A
89.9 92.8 86.9 91.8 86.2 91.0
Comparison of 2010 and 2012 NCDOT Maintenance Condition Results
ElementInterstate Primary Secondary
Tra
ffic
* Red - 2012 elements that received lower scores; Green - 2012 elements that added 5 or more points to
previous scores; Grey - 2010 elements that had significant changes in score
Averages
Dra
ina
ge
Ro
ad
sid
e

2013 Report Card for North Carolina’s Infrastructure
Roads C
P a g e | 84
for the assets that make up the highway infrastructure. Over 300 participants from 61 different
communities took part in Roadway Reviews. The surveys were conducted in Asheville, Burlington,
Charlotte, Jonesville, Rocky Mount, and Wilmington during daytime and nighttime hours to obtain the
public satisfaction and expectation levels across North Carolina.
Source: NCDOT Roadway Reviews
The survey identified 15 elements related to pavement, physical features and geometries, roadside
vegetation and cleanliness, traffic flow, and travel way lighting to be rated by participants. The participants
rated the functional and physical conditions of each feature and provided input on which features were
perceived to be most influential to the overall condition, safety, and appearance of interstate, primary, and
secondary highways in the state. In general, residents were satisfied with the condition of interstate and
primary highways, but were less satisfied with the secondary roads. Results found that the public identified
interstate highways as meeting expectations with no areas of concern; primary routes as meeting
expectations but having shoulders as an area of concern; and paved secondary roads as falling slightly
below expectation with attention needed on pavement condition, smoothness, lane width, and roadway
markings and markers.
Overall, based on the Pavement Condition Survey, the Maintenance Condition Survey, and an assessment
on public approval, the physical health of the state’s highway network sufficiently meets the needs of the
traveling public. Although, some assets evaluated had shortfalls in achieving improvement targets, the
general trend is that the conditions of the existing highway infrastructure are improving.

2013 Report Card for North Carolina’s Infrastructure
Roads C
P a g e | 85
Mobility and Safety
The operation and safety of North Carolina’s highway network is managed by the Office of Transportation
Mobility and Safety in NCDOT’s Division of Highways. The Traffic Management Unit and the Traffic Systems
Operations Unit oversee congestion management, work zone traffic control, signal system timing, incident
management, intelligent transportation systems, and public information strategies to facilitate the
operational functionality and manage the capacity of the roadway network. The Traffic Safety Unit
implements and evaluates the safety and operational strategies for the reduction of collisions resulting in
fatalities, injuries, and property damage.
In NCDOT’s North Carolina Statewide Transportation Plan, prepared in August 2012, an assessment of
highway mobility and safety was based on the following performance measures: percentage of congested
miles and average fatal crash rates [6]. The two aspects were examined for three tiers of highway defined
by the North Carolina Multimodal Investment Network (NCMIN). The Statewide tier is a key subset of state
maintained highways that have been labeled as Strategic Highway Corridors. The remaining primary U.S.
and NC routes and secondary highways are categorizes as Regional and Sub-regional tiers, respectively.
The performance measure for mobility is quantified by comparing the travel time in peak hours with the
travel time in off-peak hours to calculate Travel Time Index (TTI) values for the various tiers of highway.
TTI greater than 1.00 represents delay. An index of 1.05 corresponds to a peak hour travel time that is 5
percent longer than the observed off-peak travel time for a given highway segment. The performance
measure is standardized into qualitative levels of service (LOS). Based on the criteria, the Statewide,
Regional, and Sub-regional tiers received levels of service B, A, and A, respectively.
Mobility LOS as a percentage of congested miles:
LOS A – 80 percent or more of highway miles with TTI values less than 1.05
LOS B – 60 percent or more of highway miles with TTI values less than 1.05
LOS C – 40 percent or more of highway miles with TTI values less than 1.05
LOS D – 20 percent or more of highway miles with TTI values less than 1.05
LOS F – under 20 percent of highway miles with TTI values less than 1.05
Safety is quantified by fatal crash rate, which is calculated by dividing the number of fatalities by 100
million vehicle miles traveled. With more than 1 billion vehicle miles traveled annually in North Carolina,
the fatal crash rate was 1.28 for all highway tiers, which corresponds with level of service C. Like mobility,
the safety performance for the state’s highways is standardized in LOS.
Safety LOS as a fatal crash rate (fatal crashes per 100 million vehicle miles traveled):
LOS A – 0.0 to 0.3
LOS B – 0.31 to 0.90
LOS C – 0.91 to 1.48

2013 Report Card for North Carolina’s Infrastructure
Roads C
P a g e | 86
LOS D – 1.49 to 2.00
LOS F – over 2.00
Additionally, in NCDOT’s 2012 Annual Performance Report, performance measures for mobility and safety
also included the average statewide accident clearance time and network crash rate from state fiscal years
(SFY) 2011 and 2012 as well as the target 2012 values [7]. The average statewide accident clearance time
of 66 minutes in 2011 decreased to 61 minutes in 2012, and met the 2012 target of 70 minutes or less. The
statewide network crash rate of 233 incidents per 100 million vehicles miles traveled was reduced to 230
in 2012, and met the 2012 target of 235 or less.
From an operational standpoint, North Carolina is meeting the needs of the traveling public and exceeding
the performance goals in making the state’s transportation network safer and more efficient.
Funding
In North Carolina, transportation revenues are allocated
from major sources that include federal grants, the
Highway Fund, the Highway Trust Fund, and North
Carolina Turnpike Authority (NCTA) funding; the
sources make up approximately 23 percent, 40 percent,
20 percent, and 17 percent, respectively. The Highway
Fund provides resources to maintain the statewide
roadway network, cover administrative expenses, and
support multi-modal programs. The Highway Trust
Fund is a resource used for the design and construction
of legislatively designated primary U.S. and NC routes
and loop highways. Federal funds are received from
national administrations and grant programs to be used
for eligible projects. The funding from the North
Carolina Turnpike Authority is derived from toll
revenues and usage fees, and is leveraged through the
issuance of debt to finance major highway projects.
Source: North Carolina Statewide Transportation Plan
In the North Carolina Statewide Transportation Plan, also known as the 2040 Plan, NCDOT set investment
and policy priorities for the state’s dynamic transportation system. As a long-range planning process, the
blueprint draws technical analysis, partner and stakeholder collaboration, and public involvement to
identify and prioritize NCDOT’s investments over the next 30 years. The guiding principles are to maximize
economic opportunity, maintain transparency, improve modal systems, promote long-term viability of
environmental systems, recognize the growing diversity and mobility needs, and provide the security of

2013 Report Card for North Carolina’s Infrastructure
Roads C
P a g e | 87
North Carolina’s citizens and its economy. The 2040 Plan is a performance based evaluation for funding
needs. NCDOT’s Business Units conduct analyses to develop target levels of service for various investment
needs pertaining to aviation, rail, bicycle/pedestrian, public transportation, ferries, ports, and highways.
In 2012, NCDOT used performance measures as part of the Project Prioritization process to determine the
investment goals for safety, mobility, and health. Safety received a LOS C (based on average fatal crash
rates); mobility a LOS B for Statewide tier highways and a LOS A for Regional and Sub-regional tiers (based
on percentage of congested miles); health a LOS B through F for pavements, bridges, and modernization
categories (based on various standards and conditions). The total highway needs of $93.03 billion were
identified, with roadways representing 90 percent, or $84.09 billion, of the needs. Of the total highway
needs, mobility requires an estimated $49.70 billion (53 percent); infrastructure health - $41.33 billion (44
percent); safety - $2.00 billion (2 percent).
Source: North Carolina Statewide Transportation Plan
Need Category Current Deficiencies Accruing 30-Year Total
Roadway $23.04 $61.05 $84.09
Bridges $0.13 $7.79 $7.92
ITS - $1.02 $1.02
Totals $23.17 $69.86 $93.03
Investment Goal Current Deficiencies Accruing 30-Year Total
Mobility $19.24 $30.46 $49.70
Safety $0.76 $1.24 $2.00
Health $3.17 $38.16 $41.33
Totals $23.17 $69.86 $93.03
Highway Needs (Target LOS) by Category (billions of 2011 dollars)
Highway Needs (Target LOS) by Investment Goal (billions of 2011 dollars)

2013 Report Card for North Carolina’s Infrastructure
Roads C
P a g e | 88
Grading Summary
The scale of the state maintained highway network, the current economic circumstances, and the trend of
reducing the state transportation agency’s resources and personnel have been challenges to providing and
maintaining a sustainable quality of service. Yet, North Carolina’s highways functions at a high level of
efficiency and safety. The grade determined for the state’s road was based upon the four aspects of
Conditions of Assets, Mobility and Safety, Public Opinion, and Funding.
The majority of assets that make up the highway infrastructure, with the exclusion of bridges, were
in good condition and met state goals for the most recent assessment in 2012.
The available capacity on the Statewide, Regional, and Sub-regional tiers of highway are sufficiently
serving the traveling public with minimal traffic delays.
Crash rates and fatality rates have remained somewhat constant over the past decade with minor
fluctuations. The safety performance of highways has not had any significant improvements in
recent years.
From the public perspective, citizens across the state are generally satisfied with the highway
network and expressed that it meets their expectations.
Overall, the highway system is steadily improving but will continue to accrue capital needs as the
infrastructure ages. Roads require a $23.04 billion investment in order to meet all performance targets for
the existing infrastructure; an additional $61.05 billion is estimated to be accrued over the next 30 years
to meet target levels of service. A thorough review of research findings and quantitative data has found
North Carolina’s highway system to be in fair to good condition but will require sufficient funding to
sustain an operational level of quality.
Categories Weighting Factor Grade
Condition of Assets 0.33 B
Mobility and Safety 0.33 C
Funding 0.33 D
North Carolina Roads Grade C

2013 Report Card for North Carolina’s Infrastructure
Roads C
P a g e | 89
Recommendations
Encourage asset management practices, and change the predominant mindset from building new roadway infrastructure to maintaining the existing infrastructure.
In designing new highway projects, place more emphasis on incorporating the principles of operation and maintenance to ensure quality assurance throughout the entire service life of an asset.
Invest and support the use of new technologies to advance the overall design, build, maintain, and operate processes of the transportation network.
o Use remote sensing technologies and automated systems to accurately and efficiently obtain data for as-built modeling and asset inventories.
o Implement roadway and roadside technologies that aid engineers, planners, policy makers, law enforcement, and traveling public in the highway network.
Develop a diverse funding strategy that will sustain high levels of quality and service for users without burdening taxpayers.
o Promote sustainable public-private partnerships and optimize third-party contracts through transparency.
o Employ mileage-based user fees and other road pricing method when applicable. Take a holistic approach in managing the transportation network.
o Look at highway design and urban planning as a seamless, integrated effort. o Utilize the principles of unconventional interchange and intersection designs,
roundabout corridors, and complete streets. o Encourage and support the protection of the environment and public space. o Involve the public and community organizations. o Integrate all other modes of transportations when feasible.
Sources
1. American Society of Civil Engineers. 2009 Report Card on North Carolina’s Infrastructure. Reston,
VA.
2. North Carolina Department of Transportation. 2012 Report on the Condition of the State Highway
System. Raleigh, NC.
3. Pavement Management Unit, Asset Management, North Carolina Department of Transportation.
Pavement Management System. www.NCDOT.gov.
4. North Carolina Department of Transportation. 2010 Report on the Condition of the State Highway
System. Raleigh, NC.
5. North Carolina Department of Transportation. Roadway Reviews. Raleigh, NC.
6. North Carolina Department of Transportation. North Carolina Statewide Transportation Plan.
Raleigh, NC.
7. North Carolina Department of Transportation. 2012 Annual Performance Report. Raleigh, NC.

2013 Report Card for North Carolina’s Infrastructure
Public Schools C
P a g e | 90
Overview
The physical condition of public school buildings is critical to the success of North Carolina’s students. Poor facilities have been shown to negatively affect student performance. Additionally, schools are also used as emergency shelter during natural or man-made disasters. The state and localities are responsible for the upkeep and condition of the state’s 2,425 existing school facilities and to plan for future schools that are needed. However, over 58 percent of North Carolina schools will require renovations in the next five years. Additionally, approximately 10 percent of students are in mobile classrooms. The projected cost to meet facility needs for the next five years is approximately $8.2 billion. As a result, North Carolina’s public schools infrastructure has been
given a grade of C.
Conditions and Future Needs
Every five years, local school boards are required to submit their long-range plans to the State Board of Education, where the Department of Public Instruction (DPI) compiles the information into a Facility Needs Survey report. Software developed by the School Planning Section of the DPI is provided to each school district to ensure a standard reporting format and cost estimate for facility needs. Facility needs are assessed by each county based on the North Carolina Public Schools Facilities Guidelines which “defines and describes minimum facilities to ensure educational program appropriateness and long-term cost efficiency” (Public Schools of North Carolina, State Board of Education, DPI, 2010).
The North Carolina Public Schools Facility Needs Survey 2010-11 was released in March 2011, which outlines the condition of existing facilities and needs for the next five years (Public Schools of North Carolina, State Board of Education, DPI, March 2011). Of the 115 school districts, 113 participated in the survey in 2011. The total estimated cost for five-year projected needs is $8.2 billion. Five-year facility needs were presented for five categories:
Category Number of Facilities
Estimated Five-Year Cost
Percent of the Total Cost
Change from 2006
New schools 143 $2.8 billion 34% -34.96% Additions 624 $1.7 billion 20.6% -25.33% Renovations 1,412 $3.0 billion 37.1% 32.88% Furnishings and equipment NA $526 million 6.4% -30.84% Land NA $113 million 1.4% -42.09%
The majority of the facility needs were for new schools as well as additions and renovations to existing schools. With the exception of renovations, the five-year demand for facility needs in the 2011 Facility

2013 Report Card for North Carolina’s Infrastructure
Public Schools C
P a g e | 91
Needs Survey is between 25 and 40 percent lower than the 2006 Facility Needs Survey. This decline may be attributed to the lower than expected growth rate from 2006 to the present. Another potential factor discussed in the Facility Needs Survey was that, due to the poor economy in recent years, school districts have only been submitting requests they expect to realistically receive funding for rather than submitting requests for all of the facility needs. The only increase in funding needs was in the five-year demand for renovations, which has increased by approximately 33 percent since 2006.
New Schools
A total of 143 new schools are required in the next five years to replace obsolete facilities, ease crowding, and accommodate changes in grade organization. These include 69 elementary schools, 32 middle schools, 32 high schools, eight K-8 schools, and two other schools with non-traditional grade structures. The majority of the estimated cost was split between high schools ($1.1 billion) and elementary schools ($946 million). Of the new schools required in the next five years, 61 are a high priority, needed in the next one to two years, and 82 are needed within the next three to five years. The greatest needs for new schools were identified in Charlotte-Mecklenburg, then Wake County followed by Forsyth and Harnett Counties.
Additions
A total of 624 schools reported needs for new additions, which is approximately 25 percent of existing schools (Public Schools of North Carolina, State Board of Education, DPI, January 2011). The greatest need was for additional classrooms at 409 schools. Other needs included auxiliary facilities such as cafeterias, gymnasiums, auditoriums, as well as administration and media spaces. Elementary schools reported the greatest need for additions.
Renovations
Although new schools and renovations contribute a little over one third of the total estimated cost each, more than 58 percent of existing schools (1,412 out of 2,425) reported renovation needs. Both the estimated cost and number of schools reporting renovation needs increased significantly from 2006 when approximately 46 percent of existing schools (1,034) reported five-year renovation needs. Plumbing, air conditioning and electrical needs account for approximately one fourth of the total renovations needs. Roof and window replacements are also significant. The most cited reason for renovation projects was depreciation and deferred maintenance (50 percent); addressing building codes, life safety, as well as air conditioning and energy conservation were also cited. Progress since 2006
The number of mobile and modular classroom units has decreased 18 percent since the last Facility Needs Survey; however, approximately 10 percent of students are still in these facilities, down from 13 percent in 2006.

2013 Report Card for North Carolina’s Infrastructure
Public Schools C
P a g e | 92
Renovation costs for handicapped access, ramps, and toilet renovations were lower than the 2006 Facility Needs Survey, indicating progress in this area.
Charter Schools
Approximately three percent of students in North Carolina attend charter schools, and there are currently 100 charter school facilities throughout the State. Per North Carolina General Statute 115C-238.29H, charter schools are not allowed to use State funds to purchase real property or mobile classroom units. However, they are allowed to own land and buildings that were obtained through non-State sourced funding. Since facilities owned by charter schools are not funded through the State, they are not included in the Facility Needs Survey. Associated facility needs and funding appears to be handled by the individual schools.
Funding
Individual counties and chartered school districts within them are responsible for providing and maintaining public school facilities. Counties provide funding for school construction with revenue from property tax, local half-cent sales tax, and other sources such as general obligation bonds. Of the $9.8 billion estimated facility needs from 2006-2010, approximately 55 percent ($5.4 billion) was allocated by individual counties. From 2006 to 2008 fifteen bond issues were approved by voters ($3.1 billion). Other funding from 2006 to 2010, in the form of Certificates of Participation, Qualified Zone Academy Bonds, Qualified School Construction Bonds, and other special indebtedness amounted to $2.3 billion.
Historically, state support has been provided in the form of bond issues when local resources could not keep up with growing facility needs. In 1987, the North Carolina General Assembly enacted legislation to fund public school construction costs to assist county governments in meeting their capital building needs. State support is currently provided through the Public School Building Capital Fund (PSBCF). Originally the PSBCF was funded through part of the revenue from corporate income tax; however, this funding has been curtailed by legislative action since 2009. When the North Carolina Education Lottery was created in 2005, 14 percent of the gross proceeds were devoted to capital facilities. From 2006 to 2009, almost $871 million (3.3 percent of the total five-year need) was allocated for capital projects; however, 58 percent was used for debt services (projects that were already constructed). The fiscal year 2011-12 PSBCF reported over 78 percent of funds ($85.9 million out of a total $109.8 million) were used for debt services (Public Schools of North Carolina, State Board of Education, DPI, July 2012).

2013 Report Card for North Carolina’s Infrastructure
Public Schools C
P a g e | 93
Grade Summary
Grades were assigned for the Public Schools category in four areas. A grade of D- was assigned for renovations because of the more than 58 percent of North Carolina’s public schools requiring renovation in the next five years. Due to the importance of maintaining existing facilities to meet current and future needs, this grade was weighted more heavily than the other two assigned grades.
A grade of C+ was assigned in the area of capacity, given that 10 percent of all public school students in the State are taught in mobile classrooms.
Data collection and reporting infrastructure needs is an essential part of obtaining funding for school facilities. The 2013 Report Card for America’s Infrastructure pointed out a lack of adequate and similar state-by-state reporting on infrastructure needs for the nation’s schools (American Society of Civil Engineers, 2013). A grade of A- was assigned in the area of reporting based on the high participation (100 percent in 2006 and over 98 percent in 2010) and the standardized reporting method that is used to project facility needs throughout the State.
Categories Weighting Factor Grade Renovation 0.50 D- Capacity 0.25 C+ Reporting 0.25 A-
North Carolina Public Schools Grade C
Recommendations for Action
Support the increased use of school construction bonds;
Encourage local school boards to explore alternative financing to facilitate construction, including lease financing and financing/ownership/use arrangements;
Encourage local school boards to adopt and follow regular, comprehensive construction and preventative maintenance programs;
Encourage the use of life-cycle cost analysis principals to evaluate the total costs of projects;
Ensure that money earmarked for the public school system is used for its intended purpose.

2013 Report Card for North Carolina’s Infrastructure
Public Schools C
P a g e | 94
Sources
Public Schools of North Carolina, State Board of Education, Department of Public Instruction (DPI), North Carolina Public Schools Facilities Guidelines, 2010.
Public Schools of North Carolina, State Board of Education, DPI, Facts and Figures, 2010-2011. January 2011.
Public Schools of North Carolina, State Board of Education, DPI, North Carolina Public Schools Facility Needs Survey 2010-2011. March 2011.
Public Schools of North Carolina, State Board of Education, DPI, FY 2011-12 Report Public School Building Capital Fund. July 2012.
American Society of Civil Engineers, Report Card for America’s Infrastructure, 2013.

2013 Report Card for North Carolina’s Infrastructure
Stormwater C-
P a g e | 95
Overview
While the overall awareness of stormwater quality and how it affects our environment has
improved, challenges associated with implementing actions to meet current and future
stormwater regulations remain prevalent throughout North Carolina. Most of largest cities in the
State have a System Inventory Mapping program; however, more than half of the State’s
population lives in areas that do not. While use of Floodplain Development Regulations have
improved slightly over the last 5 years, almost 40% of the State still lacks this basic tools to
manage growth within floodplains. Funding remains the largest issue impeding the progress of
improving both stormwater quality and quantity. More than 60% of the State does not have a
steady source of funding for stormwater infrastructure projects. Most of the State’s larger towns
and municipalities collect stormwater fees to fund projects that improve water quality and control
water quantity. Most of this money goes toward smaller projects that address issues that include
localized flooding, small pipe and structure repairs, and inspection and maintenance. However,
this funding does not, in most cases, fund large-scale, needed projects that can address watershed
issues. Watershed issues can impact the health of receiving streams and cause community
flooding if they are not resolved. Currently, most large-scale stormwater projects are funded by
locally passed stormwater bonds or from grant sources like the N.C. Clean Water Management
Trust Fund. These large projects will be necessary in order for North Carolina’s largest towns and
municipalities to meet current and future stormwater regulations and thus improve the water
quality of our streams, rivers, lakes and sounds throughout the State. As a result, North Carolina’s
Stormwater Infrastructure grade remains a C-.
Background
Since 2000, the population of North Carolina has increased over 20%, from approximately 7.9
million people to 9.7 million (U.S. Census Bureau). The majority of this growth has been in and
around the state’s largest cities. This urbanization is altering land uses from forest and
agricultural to suburban and urban. The newly created impervious surfaces from this
urbanization vastly affect how water moves both below and above ground during storm events,
the quality of that stormwater, and the ultimate health of nearby streams, lakes and estuaries. The
runoff from these surfaces is swiftly carried to receiving waters and can cause flooding and
erosion, washing away important habitats for plant and animal species that live in and near the
stream. Stormwater runoff also picks up and carries with it many different pollutants that are
found on paved surfaces such as sediment, nitrogen, phosphorus, bacteria, oil and grease, trash,
pesticides and metals. According the 2011 State of the Environment Report published by North

2013 Report Card for North Carolina’s Infrastructure
Stormwater C-
P a g e | 96
Carolina Department of Environment and Natural Resources (NCDENR), almost 40% of the state’s
surface waters are impaired at various levels (Table 1.1). These impairments may result in a total
maximum daily load (TMDL) requirement for the waterway. A TMDL is a calculation of the
maximum amount of a pollutant that a waterway can receive and still comply with water quality
standards.
Table 1.1
Use Support Categories for Biological Ratings
Many of the impairments noted above are the result of excessive nutrients entering into the state’s
waterways. Two of the most prevalent pollutants – nitrogen and phosphorus – have been targeted
in specific watersheds throughout the state.
Biological Ratings 2010 Level of Assessment Percent of Surface Water
Impairment Category
Excellent/
Natural
Good Supporting 54%
Good-Fair/ (Catagories 1-2)
Moderate
Not Impaired
Not Rated Not Rated 7%
(Category 3)
Fair 3%
Impaired
(Categories 4-5
Poor/Severe 36%
Source: 2011 State of the Environment, NCDENR, 2011
Category 1 - all uses are monitored and supporting
Category 2- all monitored uses are supporting or not rated and no
Category 3-monitored uses are not rated and there are no impairments. Waters are not rated due to inconclusive or insufficient data.
Category 4 - at least one impairment but TMDLs are not required to address impairment
Category 5 - at least one impairment that requires develoopment of TMDL
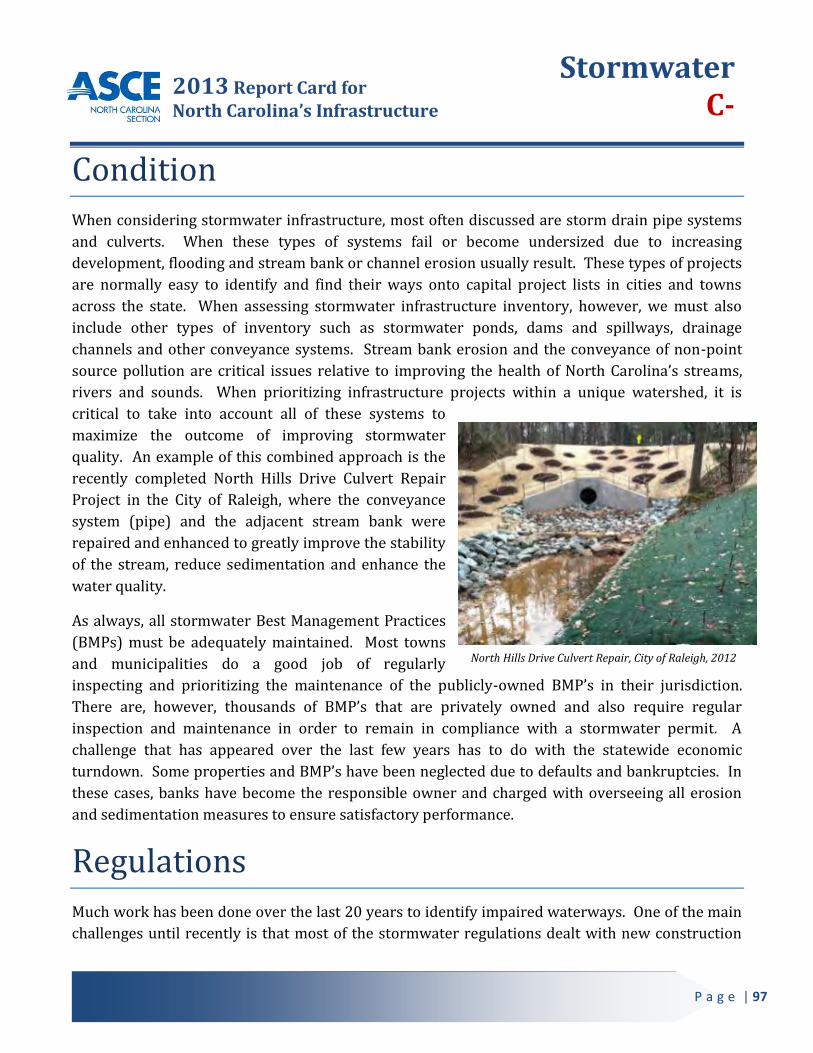
2013 Report Card for North Carolina’s Infrastructure
Stormwater C-
P a g e | 97
Condition
When considering stormwater infrastructure, most often discussed are storm drain pipe systems
and culverts. When these types of systems fail or become undersized due to increasing
development, flooding and stream bank or channel erosion usually result. These types of projects
are normally easy to identify and find their ways onto capital project lists in cities and towns
across the state. When assessing stormwater infrastructure inventory, however, we must also
include other types of inventory such as stormwater ponds, dams and spillways, drainage
channels and other conveyance systems. Stream bank erosion and the conveyance of non-point
source pollution are critical issues relative to improving the health of North Carolina’s streams,
rivers and sounds. When prioritizing infrastructure projects within a unique watershed, it is
critical to take into account all of these systems to
maximize the outcome of improving stormwater
quality. An example of this combined approach is the
recently completed North Hills Drive Culvert Repair
Project in the City of Raleigh, where the conveyance
system (pipe) and the adjacent stream bank were
repaired and enhanced to greatly improve the stability
of the stream, reduce sedimentation and enhance the
water quality.
As always, all stormwater Best Management Practices
(BMPs) must be adequately maintained. Most towns
and municipalities do a good job of regularly
inspecting and prioritizing the maintenance of the publicly-owned BMP’s in their jurisdiction.
There are, however, thousands of BMP’s that are privately owned and also require regular
inspection and maintenance in order to remain in compliance with a stormwater permit. A
challenge that has appeared over the last few years has to do with the statewide economic
turndown. Some properties and BMP’s have been neglected due to defaults and bankruptcies. In
these cases, banks have become the responsible owner and charged with overseeing all erosion
and sedimentation measures to ensure satisfactory performance.
Regulations
Much work has been done over the last 20 years to identify impaired waterways. One of the main
challenges until recently is that most of the stormwater regulations dealt with new construction
North Hills Drive Culvert Repair, City of Raleigh, 2012

2013 Report Card for North Carolina’s Infrastructure
Stormwater C-
P a g e | 98
only, as it is easy to understand how uncontrolled land disturbing activities can adversely affect
nearby waterways. Recent nutrient focused regulations such as the Jordan Lake Nutrient
Management Strategy (target pollutants – nitrogen and phosphorus), and the Neuse River
Stormwater Rules (target pollutant – nitrogen) focus on removing specific pollutants from
stormwater runoff – from both areas of new construction and existing stormwater infrastructure.
As these regulations become fully phased in, challenges will arise in both funding and
implementation. In many fully developed, urban landscapes, retrofitting a BMP or series of BMP’s
into a drainage area can be quite difficult. Existing utilities, dwellings and the overall lack of
available space make it hard to site and install an effective BMP. In some cases, a “best effort” can
be attempted, but due to site restrictions, the measure will not be able to attain the required level
of treatment.
Funding
Most of the State’s larger towns and municipalities collect stormwater fees to fund projects that
improve water quality and control water quantity. This money goes toward smaller projects such
as small pipe system repairs, localized flooding issues, stream bank repairs, BMP inspection and
maintenance, etc., and administrative costs. According the 2011 Southeast Stormwater Utility
Survey, North Carolina cities and towns charge a monthly average of $3.28 per Equivalent
Residential Unit (ERU). In North Carolina the average ERU is 2,460 square feet. This effective
average rate is slightly higher than our neighboring states in the southeast. However, this level of
funding typically does not cover large projects – projects which are needed and would
significantly and positively affect water quality in the state. Limited sources of funding exist to
help North Carolina’s cities and towns to bridge this funding gap. Sources, like the N.C. Clean
Water Management Trust Fund, have seen its funding dramatically reduced over the last 4-5 years
- from a high of $100 million (2005-2008) to its current funding level of approximately $10.75
million. In the past, stormwater bonds have been an effective funding vehicle for towns and cities.
However, an economy that continues to struggle yields a difficult environment for cities and towns
to pass bonds and take on more debt. Large projects will be necessary to meet current and future
regulations. Funding sources must be increased to achieve the state’s water quality goals.

2013 Report Card for North Carolina’s Infrastructure
Stormwater C-
P a g e | 99
Grade Summary
The overall grade was calculated by equally-weighted ratings for the following four categories –
Floodplain Development Regulations, System Inventory Mapping, NPDES Phase II Communities
and Funding.
A grade of C- was given to the Floodplain Development Regulations. While this number has
improved slightly over the last 5 years, almost 40% of the State still lacks these regulations.
Most of largest cities in the State have a System Inventory Mapping program. However, more than
half of the State’s population lives in areas that do not. A grade of D+ was assigned to this
category.
The number of NPDES Phase II communities in North Carolina has grown by about 17% over the
last 5 years, and this number continues to increase. This will help to improve the water quality in
these more densely populated areas. A grade of B was assigned to this category.
Lastly, funding remains the largest issue impeding the progress of improving both stormwater
quality and quantity. More than 60% of the State does not have a steady source of funding for
stormwater infrastructure projects. Thus, a grade of D was given for this category.
The overall grade using the above allocation was C-.
Categories Weighting Factor Grade
Floodplain Development
Regulations
0.25 C-
System Inventory Mapping 0.25 D+
NPDES Phase II Communities 0.25 B
Communities with dedicated
funding
0.25 D
North Carolina Stormwater Grade C-

2013 Report Card for North Carolina’s Infrastructure
Stormwater C-
P a g e | 100
Recommendations
Expand and develop permanent funding sources for stormwater improvements. Two-
thirds of the State’s population lives in areas where dedicated stormwater funding does not
exist. State-funded sources of money such as the N.C. Clean Water Management Trust Fund
typically can only make grants to 10% of the needs expressed in its grant applications.
Continue to develop an infrastructure databases for efficient maintenance and
improvement planning. Most larger cities are making notable progress toward this goal,
but more work needs to be done on a statewide basis.
Continue National Pollutant Discharge and Elimination System (NPDES) Phase II
implementation of current and future communities.
Continue to develop standards for inspection and maintenance of Best Management
Practices (BMPs). North Carolina Department of Environment and Natural Resources
(NCDENR) continues to regularly update the State’s BMP Manual, which has expanded
treatment options, and includes design and maintenance guidelines for pollutant removal
devices.
Sources
N.C. DENR, Division of Water Quality. http://www.ncstormwater.org
Urban Stormwater Management in the United States, The National Academies Press, 2008.
Water, Sewer & Stormwater Capital Needs, Report 3, Water 2030, The N.C. Rural Economic Development
Center, 20XX
Center for Watershed Protection. www.cwp.org
2011 State of the Environment Report, NCDENR, 2011.
City of Raleigh, http://www.raleighnc.gov
Jordan Lake Nutrient Management Strategy, NCDENR, Division of Water Quality.
2011 Southeast Stormwater Utility Survey, Southeast Stormwater Association, 2011.

2013 Report Card for North Carolina’s Infrastructure
Wastewater C
P a g e | 101
Overview
North Carolina has documented a need of over $4 billion of additional
wastewater infrastructure investment needs through the year 2030. These
funds are needed to replace aging facilities, comply with mandated Clean
Water Act (CWA) regulations, and provide as well as keep pace with
economic development. Additionally, specific water quality degradation
within certain river basins warrants promulgation of specific regulations
aimed at further reduction of nutrients being discharged into receiving
waters. These specific basin rules are a direct result of fish kills and algae
blooms that brought unfavorable national press coverage to North
Carolina. Although the documented wastewater related fish kills and algae
blooms are decreasing, the tightened discharge limits and ongoing
population growth, coupled with aging infrastructure, is stressing public
utilities’ ability to remain compliant with regulations. If continued funding
needs are not met, the state risks reversing the improved public health and
economic gains that have been realized over the past 30 years. As a result,
North Carolina’s Wastewater Infrastructure is assigned a grade of C.
Background
From fiscal years 1998-99 to 2006-07, over $2.5 billion was provided to North Carolina communities to
fund water and wastewater infrastructure projects. This money came from numerous federal, state, and
non-profit funding entities. Funds were used to repair existing water and wastewater infrastructure,
replace pipes, build new systems, create interconnections between systems, extend lines to create and/or
retain jobs, and implement other improvements and upgrades at local water and wastewater systems. This
amount of money, however, is small compared to significant needs identified by Water 2030, a report
completed by the Rural Center in 2005. This multi-year study identified $16.6 billion in infrastructure
needs between 2005 and 2030, and the report recommended more state funding to help address these
needs. The wastewater needs represented $7.52 billion of the $16.6 billion need over a 25-year period.
The water quality of our streams, creeks, rivers and estuaries is critical for public health, ecological health,
and maintaining a sustainable economy. As a coastal state, North Carolina has a number of strong and
growing businesses that depend on clean water. The state’s seafood industry alone is valued at over $100
million annually. Water-based recreation, ecotourism, trout and catfish farming and boatbuilding
industries continue to attract people and dollars to the state and clean water is integral to these industries.
North Carolina is fortunate that we have a diverse water landscape, including fresh water trout streams in
the mountains to one of the largest and most complex estuary systems in the world. By design, most

2013 Report Card for North Carolina’s Infrastructure
Wastewater C
P a g e | 102
larger/interceptor sewer systems follow creek beds, and the larger pump stations are generally located in
flood plains. Our wastewater plants discharge directly to the aforementioned diverse water landscape.
Therefore it is our public duty to ensure these facilities are properly funded, maintained, and capable of
providing a level of service that is dedicated to improving water quality.
According to a study by the NC Rural Economic Development Center, Inc., North Carolina has over 409
public wastewater systems statewide that provide approximately 51% of the state’s population with
wastewater service. The majority of these systems (81%) are owned and operated by incorporated
municipalities. Based upon reports from the state’s public wastewater system managers, the actual
number of people served by public wastewater service statewide is estimated to be over 4.4 million. With
North Carolina’s expected population growth, demand for adequate wastewater treatment and disposal
will continue to drive costs for these systems.
Conditions
In 2006, the Water 2030 initiative collected detailed information about North Carolina’s 409 wastewater
systems to document their current capital improvement budgets and determine future capital
improvement needs. This survey concluded that wastewater system owners have identified approximately
$7.52 billion in funding needs over a 25-year period.
Several of the systems have aging wastewater collection systems and treatment plants that are unable to
contain peak flows or provide adequate treatment. Additionally, biosolids (the residual solid part of the
wastewater treatment process) disposal is becoming more difficult and challenging in the face of tighter
application requirements, land use regulations and due to pressure associated with increased
development.
Several of our older sewer systems were constructed using mostly vitrified clay pipe (VCP) that was
installed over 40 to 50 years ago. VCP standard pipe lengths ranged from 3 to 5 feet long with joint gasket
material made of oakum or cotton fiber material. This means that a 400-feet long section of sewer installed
with VCP may have over 130 pipe joints, almost, if not all, with deteriorated gaskets and cracking at the
joints. Such sewer failures can allow root intrusion that can cause blockages or infiltration that can lead to
over-capacity issues which are very problematic.
That same 400-foot reach as installed today with a plastic or iron pipe material would typically have about
21 pipe joints (1/5th as many), including the connection with the manholes. Similarly, the older concrete
pipe material commonly used for larger/interceptor sewer reaches (12-inch and above) and the brick with
mortar used to build the older manholes are deteriorating due to the presence of the hydrogen sulfide that
is inherent to domestic sewer systems.
The weakening in the integrity of the sewer system can easily lead to significant problems in the collection
system and at the wastewater treatment plant. A root intrusion will catch debris and clog easier, leading to

2013 Report Card for North Carolina’s Infrastructure
Wastewater C
P a g e | 103
basement flooding or overflow condition. In addition, an excessively cracked pipe or manhole will allow
inflow or infiltration of groundwater or storm water directly into the sewer system causing an overflow
condition. In the case of failed pipe material, the wastewater may actually leak directly from the sewer into
the groundwater or surface water without the presence of an overflow condition and thereby, will go
unnoticed.
All sewer systems, regardless of material of construction, experience some level of infiltration and inflow
(I&I). Typically, the older systems installed in areas with a high groundwater table will experience the
most infiltration. It is reported that on some of the highest flow days (large rain events), wastewater flows
exceed treatment capacity at 40% of the state’s 351 wastewater treatment plants. The amount of rain and
groundwater entering the sewer lines on these high-flow days (estimated at 158 million gallons) is more
than double the average daily flow of North Carolina’s largest wastewater system (Charlotte-Mecklenburg
Utility Department). This results in a high percentage of wastewater systems under moratoria and Special
Orders of Consent for either exceeding the permitted discharge flow limit or raw sewage overflows from
the wastewater collection system. In addition, rural systems report more than twice the volume of
infiltration and inflow as urban systems.
Funding
Rates
According to the 2013 Water and Wastewater Rates and Rate Structures in North Carolina compiled by the
Environmental Finance Center and the North Carolina League of Municipalities, rates that provide enough
revenue to balance an annual budget do not necessarily provide enough revenue to cover long term capital
and maintenance needs and many utilities charge much less than the full cost of service. Many utilities are
not covering their operating expenses, making it difficult, or impossible to rehabilitate aging infrastructure,
save for operating emergencies, finance system improvements and expansion, and engage in proactive
asset management. It is interesting to note that the utilities that did not recover their operating expenses
(operating at a financial loss) are not always charging low rates – even some utilities with high rates can be
operating at a financial loss. The performance of each utility on several financial indicators and
benchmarks can be viewed in the NC Water and Wastewater Rates Dashboard at
http://www.efc.unc.edu/RatesDashboards/
According to the 2013 Water and Wastewater Rates and Rate Structures in North Carolina compiled by the
Environmental Finance Center and the North Carolina League of Municipalities, comparing rates across the
State or among specific utilities is further complicated by the variation in the extent to which utilities
charge the full cost of providing service. Rates that provide enough revenue to balance an annual budget do
not necessarily provide enough revenue to cover long term capital and maintenance needs and many
utilities charge much less than the full cost of service provision. Figure 1 shows rates from FY 2011-12 in
terms of combined water and wastewater charges for customers using 5,000 gallons/month plotted against

2013 Report Card for North Carolina’s Infrastructure
Wastewater C
P a g e | 104
the ratio of operating revenue over operating expenses (including depreciation) from the same fiscal year.
This measure, often referred to as an operating ratio, helps identify if an entity is operating at a financial
loss, financial gain, or is breaking even. Financial data were provided by the Local Government Commission
(LGC) in the Department of the State Treasurer. The figure shows that many utilities are not covering their
operating expenses, making it difficult or impossible to rehabilitate aging infrastructure, save for operating
emergencies, finance system improvements and expansion, and engage in proactive asset management. It
is interesting to note that the utilities that did not recover their operating expenses (operating at a financial
loss) are not always charging low rates – even some utilities with high rates can be operating at a financial
loss. Nevertheless, there are several utilities that charged low rates in FY 2011-12 (to the left of the graph),
which resulted in operating at a financial loss (below the horizontal line on the graph) in that fiscal year.
There are a significant number of utilities that are operating at a financial gain (above the line).
Figure 1- Combined Residential Bill in FY2011-12 for 5,000 gallons/month for Utilities with
Reported LGC Data on Total Operating Revenues and Total Operating Expenses in FY2011-12
(n=320) from Water and Wastewater Rates and Rate Structures in North Carolina; February 2013
Our state contains a diverse range of local government economies that vary in their ability to fund and
maintain the public’s wastewater systems. For example, smaller rural systems must charge significantly
higher rates than larger systems to offset the absence of large economies of scale. The monthly bills for
some households on smaller systems often exceed twice that of similar customers of larger systems.
Without proper planning, needed improvements to these aging wastewater systems in the coming years
will only magnify these disparities. Based upon information from the NC Rural Economic Development
Center as part of their Water 2030 initiative, if the cost for near term needed improvements were spread
across all the state’s wastewater systems customer base, the smallest wastewater system’s monthly bill,
based upon 6,000 gallons usage, would grow by an additional $75 per customer. The larger system’s
monthly charge would increase by over $50 per customer.

2013 Report Card for North Carolina’s Infrastructure
Wastewater C
P a g e | 105
Programs
Historically, several federal and state programs have provided funding to offset the rising and on-going cost
of constructing, maintaining and upgrading public wastewater systems. These programs are aimed at
addressing differing needs, from improving compliance limits at the treatment plant discharge to
maintaining and upgrading the collection system to prevent overflows.
These programs are administered in the form of grants, low interest and market rate loans. The level of
funding available through these programs has been decreasing in recent years. Even with the influx of
stimulus funding, the document needs for drinking water funding are much greater than the funds
available. Additionally, the increasing and ever changing regulations imposed on public wastewater
systems can easily, and sometimes unexpectedly, deplete a system’s budget in the absence of governmental
assistance. The U.S. EPA is the primary regulating authority over wastewater systems and was once a
primary source of funding. However since approximately 1990, these grant/loan funds are being
significantly reduced. The decline in these funding sources coupled with the increased demand for safe,
efficient wastewater infrastructure calls into question the role of the State. Funding for water and
wastewater infrastructure in North Carolina is provided by six funding entities; each operates
independently with its own mission, goals, and objectives. The General Assembly created the State Water
Infrastructure Commission in 2005 to identify the state’s water infrastructure needs, develop a plan to
meet those needs, and monitor the implementation of the plan, but it does not have the necessary authority
or resources needed to execute this mission. The agencies for water and wastewater that use state
appropriations and are charged with administering federal funds include:
• DENR DWQ Infrastructure Finance Section DENR Public Water Supply Section • North Carolina Department of Commerce- Division of Community Assistance • North Carolina Department of Commerce- Commerce Finance Center • North Carolina Rural Economic Development Center ; and • North Carolina Clean Water Management Trust Fund.
The Clean Water Management Trust Fund (CWMTF) received over $122 million in requests for funding in
2012. With only $10.75 million appropriated to CWMTF, by the General Assembly for fiscal year 2012-
2013, caps were placed on grant awards limiting the fund’s ability to maximize water quality benefits. This
means that 88 percent of 2012 critical local needs were unmet ($63 million). These unfunded critical local
requests would have protected drinking water supplies, created an estimated 700 local jobs, repaired 30
failing wastewater treatment plants and collection systems, supported local tourism economies, and kept
30,000 tons of sediment and other pollutants from further impairing North Carolina’s streams and rivers.
Private loans from banks and other private lending institutions have become the largest single source of
capital investments for public wastewater construction projects. These loans take several forms, including
general obligation bonds, revenue bonds, special obligation bonds, tax increment bonds, and installment or
lease-purchase debt. Based upon financial data charted for years 1995 through 2005, private loans

2013 Report Card for North Carolina’s Infrastructure
Wastewater C
P a g e | 106
accounted for 70 percent of total financing of water and sewer projects in North Carolina. Conversely,
because of poor bond ratings, approximately 60 percent of N.C. local governments cannot qualify for most
private infrastructure lending programs.
Considerations for Path Forward
The North Carolina Section of the American Society of Civil Engineers (ASCE) encourage the Governor, the State Legislature and public to support long-term funding of wastewater infrastructure projects that would enable the state to reduce the individual system’s funding gap and assist the state’s wastewater systems in continuing to serve the public health and economic development of its customers. This funding should support and enable projects to be planned and constructed in a regional manner that will maintain and/or improve the current levels of service and provide the capacity needed to support a growing economy. The overall reduction of infiltration and inflow should be the focus of each utility and its corresponding customer base to reduce the likelihood of wastewater system issues and decrease the possibility of degradation of surface water quality. A statewide initiative should be implemented to educate and assist utilities with ways to reduce infiltration and inflow and to provide incentives and/or recognition to systems that expedite and maintain an active infiltration and inflow reduction program and consistently document the reduction of infiltration and inflow into the system. Engage the state’s utility managers in developing sound and equitable rates that are based upon the need for repairs and replacement of capital infrastructure, while at the same time implement a public education campaign to help our state’s citizens recognize and, over time, accept rates that can support life cycle asset management funding. . This should include a provision in legislation to build reserves and ensure that money intended for drinking water is spent on wastewater. Typically, utilities charge at or below the actual cost to collect the wastewater, pump the wastewater, treat at or above discharge limits, dispose of the biosolids, train and competitively pay staff, and have available funds to maintain and upgrade their system. The competition for the state’s limited nutrient discharge and biosolid disposal allocation will dictate new technology and larger more regional systems. The treatment is becoming more advanced and will require more highly trained staff and additional operating and maintenance funds. The goal for each public wastewater system must be to become self-sufficient and versed in adequate rate making and to strive to achieve a “sustainable utility” rate structure. Each water and wastewater funding entity was established independently from other entities, each with its own enabling legislation. These entities address water supply, water quality and public health, and economic development; however, the state has yet to collectively identify or prioritize North Carolina’s overarching wastewater infrastructure needs. Without a detailed statewide plan, infrastructure projects are funded to meet specific legislative and agency requirements and criteria for a given time period and to address a specific situation, rather than meeting and addressing long-term, statewide goals. In conclusion, a statewide plan is needed to:
Identify and prioritize needs; Develop a capital budget for infrastructure based upon identified needs; Determine funding solutions (i.e.., dedicated funding sources, appropriate mix of grants and
loans, and prioritized allocation of funding) to better address the state’s current and future financial needs;
Establish policy goals that are linked to performance measures;

2013 Report Card for North Carolina’s Infrastructure
Wastewater C
P a g e | 107
Provide implementation strategies for funding entities.
Grade Summary
Grades were assigned to the wastewater infrastructure category in three areas. A grade of C+-was given to
the capacity category. Capacity is defined as the infrastructure’s capacity to meet current and future
demands. Planning and construction project are required to maintain and or/improve the current levels of
service and provide the additional capacity needed for future economic growth in the state of North
Carolina. A grade of C was given to the condition category. Condition is defined as the infrastructure’s
existing or near future physical conditions. Most of systems within the state have aging wastewater
collection systems and treatment plants, which require investment to maintain and operate. A grade of C-
was given to the funding category. The funding category examines current level of funding (from all levels
of government) and compares it to the estimated funding need. Historically, numerous federal and state
programs have provided funding assistance to help offset the rising cost of wastewater infrastructure. The
documented needs for wastewater funding are much greater than the funds available. As a result, North
Carolina’s Wastewater Infrastructure is assigned a grade of C.
Recommendations for Action
Support the increased use of State funding – through grants and loans - for wastewater infrastructure;
Develop a statewide infrastructure plan; Develop an statewide infrastructure database to document funding needs and expenditures; Engage the state’s utility managers in developing sound and equitable rates that are based
upon the need for repairs and replacement of capital infrastructure, and build reserves to minimum level across State;
Implement a public education campaign to help our state’s citizens recognize and accept rates that can support life cycle asset management funding;
Encourage the use of life-cycle cost analysis principals to evaluate the total costs of projects; Ensure that money earmarked for the wastewater infrastructure is used for its intended
purpose and pass legislation for consequences if allocated or used for other purposes; Provide incentives for asset management and detailed rehabilitation and replacement
planning for utilities to prioritize needs.
Categories Weighting Factor
Grade
Capacity 0.33 C+ Physical Condition 0.33 C Funding 0.33 C-
North Carolina Wastewater Grade C

2013 Report Card for North Carolina’s Infrastructure
Wastewater C
P a g e | 108
Sources
North Carolina Rural Economic Development Center, Water 2030 Initiative, February 2006.
North Carolina’s Water and Wastewater Infrastructure Funding Lacks Strategic Focus and Coordination Final
Report to the Joint Legislative Program Evaluation Oversight Committee; Report Number 2008-12-07;
January 27, 2009.
Shadi Eskaf, David Tucker, Dayne Batten and Amy Patel: Environmental Finance Center and Chris Nida:
North Carolina League of Municipalities, Water and Wastewater Rates and Rate Structures in North
Carolina; February 2013.
North Carolina Clean Water Management Trust Fund, 2012 Summary
http://www.cwmtf.net/Docs/cwmtffactsheet.pdf.
The North Carolina State Water Infrastructure Commission, 2010 Annual Report To The Governor and
Members of the North Carolina General Assembly, December 7, 2009.