Embed Size (px)
Citation preview

2013 Shift Index metrics: The burdens of the pastReport 4 of the 2013 Shift Index series
From the Deloitte Center for the Edge

About the Shift IndexWe developed the Shift Index to help executives understand and take advantage of the long-term forces of change shaping the US economy. The Shift Index tracks 25 metrics across more than 40 years. These metrics fall into three areas: 1) the developments in the technological and political foundations underlying market changes, 2) the flows of capi-tal, information, and talent changing the business landscape, and 3) the impacts of these changes on competition, volatility, and performance across industries. Combined, these factors reflect what we call the Big Shift in the global business environment.
For more information, please go to www.deloitte.com/us/shiftindex.

John Hagel (co-chairman, Deloitte Center for the Edge) has nearly 30 years of experience as a management consultant, author, speaker, and entrepreneur, and has helped companies improve per-formance by applying IT to reshape business strategies. In addition to holding significant positions at leading consulting firms and companies throughout his career, Hagel is the author of bestselling business books such as Net Gain, Net Worth, Out of the Box, The Only Sustainable Edge, and The Power of Pull.
John Seely Brown (JSB) (independent co-chairman, Deloitte Center for the Edge) is a prolific writer, speaker, and educator. In addition to his work with the Center for the Edge, JSB is adviser to the provost and a visiting scholar at the University of Southern California. This position followed a lengthy tenure at Xerox Corporation, where JSB was chief scientist and director of the Xerox Palo Alto Research Center. JSB has published more than 100 papers in scientific journals and authored or co-authored seven books, including The Social Life of Information, The Only Sustainable Edge, The Power of Pull, and A New Culture of Learning.
Tamara Samoylova (head of research, Deloitte Center for the Edge) leads the Center’s research agenda and manages rotating teams of Edge fellows. Prior to joining the Center, Samoylova served as a senior manager in Deloitte Consulting LLP’s Growth and Innovation practice, helping mature companies find new areas of growth by better understanding unmet customer needs, industry dynamics, and competitive moves.
Matt Frost (research fellow, Deloitte Center for the Edge) works with clients to align talent strate-gies and initiatives with overall business priorities. Frost is a consultant in Deloitte Consulting LLP’s Human Capital practice and works with leaders within the HR, Talent, and Recruiting functions. At the Center for the Edge, Frost’s research focuses on how institutions can accelerate performance improvement in the 21st century by redesigning work environments to amplify worker passion.
About the authors

Ankur Damani (Research Fellow, Deloitte Center for the Edge) is interested in the dynamics of new business models and growth strategies enabled by technology in both mature and emerging sectors. As a consultant in Deloitte Consulting LLP’s Strategy and Operations practice, he has helped clients across a range of industries, including health care, technology, and consumer products. At the Center, Damani has focused on conducting analytics and primary and secondary financial research to model the changing dynamics of firm performance.
Jonathan Salzberg (research fellow, Deloitte Center for the Edge) is a consultant in Deloitte Consulting LLP’s Strategy & Operations practice. He has spent his three years with Deloitte Consulting working on organizational transformation projects for technology clients in Silicon Valley. Understanding the technology landscape and organizational structures at each of those com-panies proved invaluable when he conducted his research during his time at the Center.
About the research team

The burdens of the past | 4
2013 Shift Index metrics | 9
Endnotes | 31
Contents
A report in the 2013 Shift Index series
3

The burdens of the past
Long-term trends help to tell a story. In the case of the 2013 Shift Index, the
story centers on the puzzling discrepancy in technology adoption between individu-als and organizations. In their personal lives, individuals are enthusiastically harnessing the power of rapid technological advances and the information flows they unleash to create more value. Why then do so many corporations and institutions seem unable to effectively embrace technological advances that speed up the flow of knowledge?
That’s the critical question raised by the 2013 Shift Index (see sidebar “The Shift Index”), a set of measurements designed to complement the numerous indices tracking the short-term facts and figures of a rolling busi-ness cycle. Collectively, these metrics clearly show that we are in the early stages of an enormous transformation that we call the Big Shift. The business environment is changing in a more fundamental way than short-term, boom-and-gloom market and employment numbers show.
Driving these changes is the continuing exponential improvement in the cost per-formance of three core digital technologies: computing power, storage, and bandwidth. As a result, new products and services hit the market faster than ever. Individuals who adopt these products and use them in unexpected
ways then generate more products and ser-vices, creating a virtuous cycle of innovation. Coupled with public policies driving economic liberalization, the advances in and adoption of new technologies have resulted in fierce competition and a shift of power from institu-tions to individuals. The 2013 Shift Index finds executive turnover at an all-time high, brand disloyalty and consumer power continuing to rise, and the compensation gap between “creative talent”1 and other workers widening (figures 25–28).
In this fluid, competitive environment, a few institutions and ecosystems are creating new sources of value and discovering new ways to thrive. The data analytics company Palantir has built, from the ground up, the abil-ity to help organizations answer their tough-est questions through previously impossible data manipulations and visualizations.2 DPR Construction, recognizing that innovation requires employees to learn faster together, has built a customized online meeting space—an “idea marketplace” where employees share, debate, and develop ideas across organizational boundaries.3 Google combined rapidly advanc-ing technologies to create self-driving cars that see the world with greater accuracy than human drivers do and can respond to changes more quickly and precisely.4
While individuals are eagerly embracing new technologies and practices in their personal
lives, our research suggests that outdated institutional structures and practices continue to
inhibit organizational knowledge flows, limiting learning and performance improvement.
2013 Shift Index metrics: The burdens of the past
4

thE ShIFt InDEx We developed the Shift Index to help executives understand and take advantage of the long-term forces of change shaping the US economy. First released in 2009 and updated annually, the Shift Index tracks 25 metrics across more than 40 years, providing a comprehensive view of underlying trends not captured by short-term economic indicators. These metrics and the relative rates of change between them highlight the evolution and impact of important long-term developments in technology and public policy.
The 25 metrics are divided into three indices that measure the three waves of change in what we call the Big Shift in the global business environment:
1) The Foundation index involves changes to the fundamentals of the business landscape catalyzed by advances in the digital technology infrastructure and reinforced by liberalizing public policy. Changes in the Foundation metrics have systematically reduced barriers to entry and movement.
2) The Flow index looks at the flows of knowledge, capital, and talent—the key drivers of performance enabled by the foundational advances—as well as the amplifiers of these flows. Flow metrics tend to lag Foundation metrics because of the time required to understand and develop new practices consistent with foundational changes.
3) The Impact index captures the consequences of long-term trends on competition, volatility, and performance across industries. Impact metrics will change as firms begin to figure out how to participate in the knowledge, capital, and talent flows across institutional and geographic boundaries.
For more information about the Shift Index methodology, please refer to www.deloitte.com/us/shiftindex.
Competitive intensity: Herfindahl-Hirschman indexLabor productivity: Index of labor productivity as defined by the Bureau of Labor StatisticsStock price volatility: Average standard deviation of daily stock price returns over one year
Economic freedom: Index of 10 freedom components as defined by the Heritage Foundation
i TRS—Total return to shareholdersii Creative occupations and cities defined by Richard Florida’s—The Rise of the Creative Class—2004iii Measured by the Bureau of Transportation Statistics Transportation Services Index
Source: Deloitte analysis
Infrastructurepenetration
Public policy
Amplifiers
Physical flows
Virtual flows
People
Firms
Markets
Technologyperformance
Internet users: Number of people actively using the Internet as compared to the US populationWireless subscriptions: Percentage of active wireless subscriptions as compared to the US population
Computing: Computing power per unit of costDigital storage: Digital storage capacity per unit of costBandwidth: Bandwidth capacity per unit of cost
Worker passion: Percentage of employees most passionate about their jobsSocial media activity: Time spent on social media as a percentage of total Internet time
Migration of people to creative cities: Population gap between top and bottom creative citiesii
Travel volume: Total volume of local commuter transit and passenger air transportationiii
Movement of capital: Value of US foreign direct investment inflows and outflows
Inter-firm knowledge flows: Extent of employee participation in knowledge flows across firmsWireless activity: Total annual volume of mobile minutes and SMS messagesInternet activity: Internet traffic between top 20 US cities with the most domestic bandwidth
Consumer power: Index of six consumer power measuresBrand disloyalty: Index of six consumer disloyalty measuresReturns to talent: Compensation gap between more or less creative occupational groupingsii
Executive turnover: Number of top management terminated, retired or otherwise leaving companies
Asset profitability: Total ROA for all US firmsROA performance gap: Gap in ROA between firms in the top and the bottom quartilesFirm topple rate: Annual rank shuffling among US firmsShareholder value gap: Gap in the TRSi between firm in the top and the bottom quartiles
Imp
act
Ind
exFl
ow
Ind
exFo
und
atio
n Ind
ex
A report in the 2013 Shift Index series
5

Such stories, unfortunately, are not com-mon. Companies like these are on the edge. Traditional rank-and-file firms, where the bulk of the world’s human and material resources still reside, lag behind in many areas. The continued downward trend in return on assets (ROA) among US public companies—which has declined to one-quarter of its level in 19655 (a few years before the invention of the microprocessor)—is one indication of this lag. Companies are working harder than in the past, only to generate lower returns from their assets. Still pursuing goals of greater efficiency and predictability, the value they create dimin-ishes as they strive to squeeze every last bit of variance out of operations.
This focus on efficiency and predictability, however appropriate it may be in a relatively stable business environment, is no longer a virtue. Rapid technological advances and new competition from unexpected quarters make forecasts less accurate—and less valuable. Thus, the world of the Big Shift demands resilience and learning over routine and the status quo. Scalable learning trumps scalable efficiency, and participating effectively in knowledge flows within and across organizational bound-aries becomes a critical skill.
Fortunately, thanks to the unprecedented cost-performance improvement in computing power, storage, and bandwidth, the commu-nications tools that can enable rapid learning and effective knowledge sharing are widely available and improving every day. And on an individual level, it hasn’t taken long for us to adjust our habits and adopt a myriad of tools that make communication easier, faster, and cheaper. At home and in transit, we use the Internet to find information, entertain our-selves, and create new content. Mobile phones and social tools give us always-on access to our contacts. Constant connectivity drives ever-higher mobile data traffic.
By and large, people are proving to be highly proactive in adopting newer and better communication tools, willing to change as soon as a lower-cost, higher-value solution
appears. Consider the communications metrics in the 2013 Shift Index (figures 10–11): The emergence of over-the-top (OTT) messag-ing service applications like WhatsApp and MessageMe means that wireless minutes and SMS messaging have likely peaked in absolute terms, while the other means of communica-tion are growing more rapidly.6
Yet our data also indicate that the ways we connect and share in our personal lives have not carried over to how we connect, innovate, and learn from each other professionally. This is in spite of the fact that the Internet and Web 2.0 tools are driving a convergence of the personal and the professional. More and more people are using technology to work anytime, anywhere; the traditional boundary between “work” and “life” is rapidly dissolving. One might expect social media and other knowl-edge-sharing tools to be as widely used within as well as outside the workplace. But rather than increasing, the integration of such tools into the work environment is actually declin-ing. In 2012, participation in work-related online forums, professional and community organizations, and social media networks decreased from their 2011 levels. Corporate social media usage, in fact, is lower in 2012 than it was in 2009, with participation rates in social media below 20 percent across most levels of the organization (figure 9)—including middle management (18 percent), lower-level management (13 percent), and non-manage-ment (9 percent).
Given the increased availability of knowl-edge-sharing tools and many companies’ expressed intent to deploy them, these results seem surprising. After all, in a July 2013 Deloitte and MIT Sloan Management Review report, executives across all industries indi-cated that they considered social business to be important.7 Numerous organizations have demonstrated how social media can help workers resolve exceptions, share practices, crowdsource solutions, and discover expertise wherever it resides. So why has its adoption been so slow at many companies? Executives
2013 Shift Index metrics: The burdens of the past
6

To better understand this year’s Shift Index and its component Foundation, Flow, and Impact indices, as well as to learn about ways to begin to create and capture value in this environment, we invite you to take a deeper look at our 2013 Shift Index research reports:
Unlocking the passion of the Explorer
From exponential technologies to exponential innovation
Success or struggle: ROA as a true measure of business performance
A world of contradictions (to be published December 2013)
Prescriptions for businesses (to be published January 2014)
in the Deloitte-MIT Sloan Management study cited barriers such as the absence of an overall strategy and the lack of a proven business case.8 But we suspect that a more fundamen-tal force may be at work: the historical value accorded to efficiency and controllability by businesses accustomed to a less changeable, less transparent world.
In a world where change was relatively slow and steady, leaders felt confident that they could predict the future with a fair degree of accuracy. Goals were framed well in advance, and their achievement was viewed as virtually certain—as long as everyone did his or her job. Jobs, in turn, were well defined and organized to support processes engineered to deliver precise outcomes. In such a world, efficiency and repeatability are virtues, and flexibility can be seen as wasteful and irrelevant. For institutions designed to maximize efficiency and execute tightly scripted processes at scale, cultivating flows of knowledge may seem like a distraction.
Nor, in the era before the technologically driven, widespread cross-pollination of ideas, was sharing information necessarily an advan-tage. Guarding knowledge, rather than sharing it to pursue potential mutual gain, was seen as
central to creating value. Workers were trained to protect company information, and any collaboration with those outside of the organi-zation was closely monitored or even discour-aged, as such connections could be deemed risky. Most innovation was driven from within the company’s four walls, often without cus-tomer feedback or interaction.
What happens when companies continue to try to fit new technologies and practices into old business models and rationales? The 2013 Shift Index’s metrics paint a sobering picture of the results. Economy-wide ROA has fallen to a quarter of its 1965 level, stock prices are increasingly volatile, and firms continue to lose their leadership positions at an increasing rate (figures 20–23).
Our worker passion analysis shows that the widespread belief that passion pertains only to the select few in our workforce can become a self-fulfilling prophecy. Passion, as the Shift Index measures it, remains low: Only 11 per-cent of the US workforce is passionate about their work (figure 15). This is not a promising sign, as worker passion is one of the major factors that lead to accelerated learning and performance improvement.
A report in the 2013 Shift Index series
7

It is true that one group of workers—the segment sometimes known as “creative tal-ent”—continues to reap a disproportionate share of the value created by the Big Shift. The skills of these individuals, who include scien-tists, designers, and management executives, are in high demand, and companies are fight-ing to acquire and retain them. Their scarcity and importance are reflected in the increasing relative compensation of this group (figure 27). But this phenomenon comes at an obvious cost to employers, who are paying more and more to retain skills that are getting harder and harder to find.
The increasing turnover rate among executives (figure 28) also hurts businesses by undermining the ability of a given leader-ship team to develop long-term, trust-based relationships on behalf of the organization. Whether executives are using their increased bargaining power to find better opportunities elsewhere or simply buckling under mounting performance pressure, the shortening of their average tenure at any particular organization compromises the organization’s ability to make a lasting impact on its chosen industrial or functional domain.
Simply put, there is a growing mismatch between the old frameworks and practices that many companies use and the structures and capabilities required to be successful in a rapidly changing environment. Legacy cor-porate practices are holding businesses back from fully participating in new opportunities. Perhaps even more importantly, companies are becoming significant bottlenecks to the
efforts of all of us to harness more of the power of pull—the ability to get better faster as more and more people participate in pull platforms that help us to draw out people and resources when we need them and where we need them.
As long as our institutions continue to resist the Big Shift, the journey ahead will remain stressful and pressure-packed. As workers and as leaders, our lives will not get easier unless we decide to shape, rather than simply adapt to, the future. By working together to reengi-neer our institutions, we have an opportunity to unleash more of our potential and tap into the increasing returns made possible by ever-expanding flows of knowledge. We can choose to participate in flows of knowledge rather than hold tightly to static stocks of information whose value is rapidly diminish-ing. Certain institutions are already starting: by scaling edges (a very different and much more promising approach to large-scale organiza-tional transformation); redesigning their work environments; cultivating worker passion; and bringing smaller, proven successes back to the core of their business.
In the context of the Big Shift, what is the rationale for the corporation, and how will the future corporation operate? What would an institution redefined from the bottom up, with the goal of scalable learning, look like? Our future institutions may look very differ-ent from today’s, with faster learning and a renewed focus on our customers and ecosys-tems, all interacting to seize the opportunities created by the Big Shift.
2013 Shift Index metrics: The burdens of the past
8

2013 Shift Index metrics
the Shift Index consists of three sub-indices that measure the rate of change in today’s busi-ness environment: the Foundation index, the Flow index, and the Impact index. The Big Shift
consists of three waves. We are currently in the first wave of the shift (measured by the Foundation Index) and are struggling to fully embrace the second wave (captured in the Flow Index).
Foundation index
The Foundation index measures changes that are fundamental to the business landscape and are catalyzed by the emergence and spread of digital technology infrastructure and reinforced by long-term public policy shifts toward economic liberalization. The metrics in the Foundation index provide leading indicators for potential change in other areas.
Figure 1. Foundation index trends (1993–2012)
Graphic: Deloitte University Press | DUPress.com Source: Deloitte analysis.
0
50
100
150
200
250
1993
Inde
x va
lue
1994
1995
1996
1997
1998
1999
2000
2001
2002
2003
2004
2005
2006
2007
2008
2009
2010
2011
2012
413846 50 54 59
6474
8392
100110
121132
143153
168
190
207
226
Figure 1. Foundation index trends (1993–2012)
A report in the 2013 Shift Index series
9

technology performance
Computing
Figure 2. Computing cost performance (1992–2012)
Graphic: Deloitte University Press | DUPress.com Source: Leading technology research vendor.
$1.00
$1,000.00
$100.00
$10.00
$0.10
$0.01
1993
$ pe
r 1
mill
ion
tran
sist
ors
1994
1992
1995
1996
1997
1998
1999
2000
2001
2002
2003
2004
2005
2006
2007
2008
2009
2010
2011
2012
$222
$0.06
Figure 2. Computing cost performance (1992–2012)
Figure 3. Storage cost performance (1992–2012)Figure 3. Storage cost performance (1992-2012)
Graphic: Deloitte University Press | DUPress.com Source: Leading technology research vendor.
$1.00
$1,000.00
$100.00
$10.00
$0.10
$0.01
1993
$ pe
r gi
gaby
te (G
B)
1994
1992
1995
1996
1997
1998
1999
2000
2001
2002
2003
2004
2005
2006
2007
2008
2009
2010
2011
2012
$569
$0.03
The cost of computing power has decreased from $222 per million transistors in 1992 to $0.06 per million transistors in 2012. The decreasing cost/performance curve enables the computational power at the core of the digital infrastructure.
Digital storage
The cost of data storage has decreased from $569 per gigabyte of storage in 1992 to $0.03 per gigabyte in 2012. The decreasing cost/performance of digital storage enables the creation of more and richer digital information.
2013 Shift Index metrics: The burdens of the past
10

Bandwidth
Figure 4. Bandwidth cost performance (1999–2012)
1999
2000
2001
2002
2003
2004
2005
2006
2007
2008
2009
2010
2011
2012
Figure 4. Bandwidth cost performance (1999–2012)
Graphic: Deloitte University Press | DUPress.com
1
10
100
1,000
10,000
$1,245
$23$ pe
r 1,
000
Mbp
s
Source: Leading technology research vendor.
Figure 5. Internet users (1990–2012)Figure 5. Internet users (1990–2012)
Graphic: Deloitte University Press | DUPress.com
0%
10%
20%
30%
40%
50%
60%
70%
80%
% o
f US
popu
latio
n
Internet users
Source: comScore; Deloitte analysis.
1990
1991
1992
1993
1994
1995
1996
1997
1998
1999
2000
2001
2002
2003
2004
2005
2006
2007
2008
2009
2010
2011
2012
71%
The cost of Internet bandwidth has decreased from $1,197 per 1,000 Mbps in 1999 to $23 per 1000 Mbps in 2012. Declining cost/performance of bandwidth enables faster collection and transfer of data to facilitate richer connections and interactions.
Infrastructure penetration
Internet users
More people are using the Internet. From 1990 to 2012, the percentage of the US population accessing the Internet at least once a month grew from near 0 percent to 71 percent. Widespread use of the Internet enables greater sharing of information and resources.
A report in the 2013 Shift Index series
11

Wireless subscriptions
Figure 6. Wireless subscriptions (1989–2012)Figure 6. Wireless subscriptions (1989-2012)
Graphic: Deloitte University Press | DUPress.com
0%
120%
100%
80%
60%
40%
20%
% o
f US
popu
latio
n
Wireless subscriptions
Source: CITA, "Wireless subscriber usage report: Year-end 2012 results," May 2013, http://store.ctia.org/wirelesssubscriberusagereport.aspx.
100%
1989
1991
1993
1995
1997
1999
2001
2003
2005
2007
2009
2011
More people are connected to digital infrastructure via mobile devices. From 1989 to 2012, the percentage of active wireless subscriptions compared to the US population grew from 1 percent to 100 percent, meaning there are now as many wireless subscriptions as there are people (although this does not mean each individual has a subscription). Smartphones made up 41 percent of the subscriptions in 2012.9 Widespread connectivity enables the sharing of data, information, and knowledge from nearly any geographic location.
2013 Shift Index metrics: The burdens of the past
12

Public policy
economic freedom
Figure 7. Index of economic freedom (US) (1995–2012)
1995 1997 1999 2001 2003 2005 2007 2009 2011
72
73
74
75
76
77
78
79
80
81
82
79.9
76.4
Index of economic freedom (overall score) Linear [Index of economic freedom (overall score)]
Graphic: Deloitte University Press | DUPress.com
Figure 7: Index of Economic Freedom (US) (1995–2012)
Source: Heritage Foundation, 2012 Index of Economic Freedom.
Inde
x (0
-100
)
The Index of Economic Freedom, a compilation of 10 indicators measured by the Heritage Foundation, is a proxy for public policies that promote open markets and the movement of capital, labor, product, and resources. Since 1995, the upward trend for the United States has been driven primarily by gains in investment freedom, financial freedom, trade freedom, and business freedom (4 of the index’s 10 components). Greater economic freedom increases competition and collabora-tion. In recent years, economic freedom has dropped significantly, in part due to increases in the size of the government.
A report in the 2013 Shift Index series
13

Flow indexThe Flow index measures the key performance drivers—flows of knowledge, capital, and talent—
unleashed by the forces measured in the Foundation index. These flows are enabled by the rapidly advancing digital infrastructure and the general trend toward policy liberalization. Worker passion and social media activities amplify the flows. In the Big Shift, stocks of knowledge are less valu-able and knowledge flows more important. While individuals take advantage of flows, institutions lag behind.
Figure 8. Flow index (1993–2012)
Graphic: Deloitte University Press | DUPress.com Source: Deloitte analysis.
0
20
40
60
80
100
120
140
160
180
1993
1994
1995
1996
1997
1998
1999
2000
2001
2002
2003
2004
2005
2006
2007
2008
2009
2010
2011
2012
494751
54 57 6165
7277
8389
97104
117128
139145
155 158152
Figure 8. Flow index (1993–2012)
Inde
x va
lue
2013 Shift Index metrics: The burdens of the past
14
Virtual flows
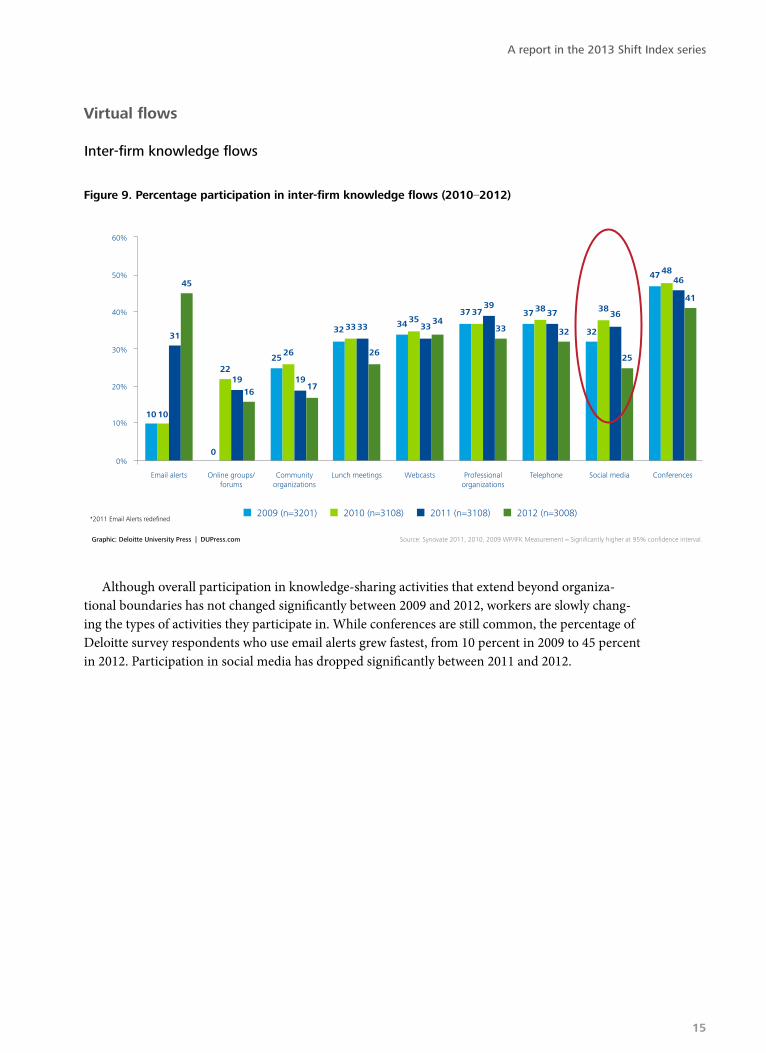
Inter-firm knowledge flows
Figure 9. Percentage participation in inter-firm knowledge flows (2010–2012)
Graphic: Deloitte University Press | DUPress.com Source: Synovate 2011, 2010, 2009 WP/IFK Measurement = Significantly higher at 95% confidence interval.
Figure 9. Percentage participation in inter-firm knowledge flows (2010–2012)
Email alerts Communityorganizations
Online groups/forums
Lunch meetings Webcasts Professionalorganizations
Telephone Social media Conferences
45
2219
0
16
26
19
25
17
33 3332
26
353334 34
3739
37
33
38 3737
32
3836
32
25
4846
47
41
31
1010
0%
40%
30%
20%
10%
50%
60%
2009 (n=3201) 2010 (n=3108) 2011 (n=3108) 2012 (n=3008)*2011 Email Alerts redefined
Although overall participation in knowledge-sharing activities that extend beyond organiza-tional boundaries has not changed significantly between 2009 and 2012, workers are slowly chang-ing the types of activities they participate in. While conferences are still common, the percentage of Deloitte survey respondents who use email alerts grew fastest, from 10 percent in 2009 to 45 percent in 2012. Participation in social media has dropped significantly between 2011 and 2012.
A report in the 2013 Shift Index series
15

Figure 10. Wireless minutes (1991–2012) versus SMS volume (2000–2012)
0
500
1,000
1,500
2,000
2,500
0
50
100
150
200
250
1991 1993 1995 1997 1999 2001 2003 2005 2007 2009 2011
Figure 10. Wireless minutes (1991–2012) versus SMS volume (2000–2012)
Wire
less
min
utes
(bill
ions
)
SMS
mes
sage
s (b
illio
ns)
SMS volumeWireless minutes
Graphic: Deloitte University Press | DUPress.com Source: CTIA; Deloitte analysis.
2,321
184
Wireless activity
Mobile devices are increasingly important for connectivity and access. Growth in SMS volume (158 percent compound annual growth rate [CAGR]) far exceeds that of wireless minutes (32 percent CAGR). In recent years, however, SMS volume has declined as a result of cheaper over-the-top (OTT) messaging applications (WhatsApp, MessageMe, Google Talk, Viber) and social media-based chat.
Internet activity
Internet traffic for the top 20 highest-capacity US routes has grown exponentially since 1993. In 2012, the average traffic rose to 6,237 gigabytes/second.
Figure 11. Internet activity for the 20 highest-capacity US routes (1993–2012)
Figure 11. Internet activity for the 20 highest-capacity US routes (1993–2012)
Graphic: Deloitte University Press | DUPress.com
0
1,000
2,000
3,000
4,000
5,000
6,000
7,000
Ave
rage
tra
ffic
in g
igab
ytes
/sec
ond
Internet activity
Source: TeleGeography.
1993
1994
1995
1996
1997
1998
1999
2000
2001
2002
2003
2004
2005
2006
2007
2008
2009
2010
2011
2012
6,237
2013 Shift Index metrics: The burdens of the past
16

Physical flows
migration of people to creative cities
Migration to the 10 cities ranked as most creative (based on the methodology developed by Richard Florida in his book The Rise of the Creative Class – Revisited) has increased faster than to the least creative cities. The gap between migration rates for these cities is increasing as people seek productive and enriching interactions in the physical world.
travel volume
Figure 12. Migration to creative cities growth and gap (2000–2012)
1990 2000 2001 2002 2003 2004 2005 2006 2007 2008 2009 2010 2011 2012
0%
5%
10%
15%
20%
25%
30%
35%
40%
45%
50%
Top 10 creative cities growth from 1990 Bottom 10 creative cities growth from 1990
Graphic: Deloitte University Press | DUPress.com
Figure 12: Migration to creative cities growth and gap (2000–2012)
Source: US Census Bureau; Richard Florida's, The Rise of the Creative Class—Revisited; Deloitte analysis.
Gro
wth
from
199
0 (%
)
14%
The shift in the trend line is dueto the redefinition of creativecities by Richard Florida in hislatest edition of the book
24%
Figure 13. transportation services index—passenger (1990–2012)
1990 1992 1994 1996 1998 2000 2002 2004 2006 2008 2010 2012
60
70
80
90
100
110
120
130
120
70
Transportation services index—passenger Linear (transportation services index—passenger)
Graphic: Deloitte University Press | DUPress.com
Figure 13: Transportation services index—passenger (1990–2012)
Source: Bureau of Transportation Statistics (BTS), the statistical agency of the US Department of Transportation (DOT); Deloitte analysis.
Cha
in-t
ype
inde
x (2
000=
100)
A report in the 2013 Shift Index series
17

Despite better tools to connect digitally, people continue to seek face-to-face interactions. Over the past two decades, passenger travel volume has increased 63 percent and continues to rise. Physical interactions facilitate the transfer of tacit knowledge more readily than other means.
movement of capital
Figure 14. Movement of capital (1970–2012)
1970 1973 1976 1979 1982 1985 1988 1991 1994 1997 2000 2003 2006 2009 2012
$0
$100
$200
$300
$400
$500
$600
$700
$467
Total FDI inflows and outflows, current dollars Linear (total FDI inflows and outflows, current dollars)
Graphic: Deloitte University Press | DUPress.com
Figure 14: Movement of capital (1970–2012)
Source: UNCTAD; Deloitte analysis.
$ bi
llion
The absolute amount of capital moving between countries has trended upward for the past 30 years. However, foreign direct investment (FDI) is impacted by many factors, including relative tax rates, interest rates, inflation, and protectionist policies—all of which can be quite volatile year to year.
2013 Shift Index metrics: The burdens of the past
18

Flow amplifiers
Worker passion
In a 2012 survey of 3,008 full-time US workers, only 11 percent of respondents exhibited all three attributes of worker passion—commitment to domain, questing, and connecting dispositions. Forty-five percent displayed one or two attributes. The results are not surprising; many institutions were designed for predictability, with inflexible, tightly integrated processes to minimize variances to plan.10
Figure 15. Worker passion in a survey of 3,000 full-time US workers
Graphic: Deloitte University Press | DUPress.com
Worker passion
Figure 15. Worker passion in a survey of 3,000 full-time US workers
Source: Deloitte analysis.
11%
45%
44%All three attributes of worker passion
One or two attributes of worker passion
No attributes of worker passion
A report in the 2013 Shift Index series
19

Figure 16. Percentage of Internet time spent on social media on PCs (2007–2012)
2007 2008 2009 2010 2011 2012
0%
2%
4%
6%
8%
10%
12%
14%
16%
18%
13.9%
7.4%
Graphic: Deloitte University Press | DUPress.com
Figure 16: Percentage of Internet time spent on social media on PCs (2007–2012)
Source: comScore; Deloitte analysis.
Social media activity
Social media has gained importance quickly. From 2007 to 2012, the time users spend on social media relative to the total amount of time they spend on the Internet grew from 7.4 percent to 13.9 percent, although it decreased slightly from 2011 to 2012. This decrease might reflect the use of mobile devices, rather than personal computers (PCs), for social media; non-PC use is not captured in the metric. This type of multi-way communication opens up opportunities to share knowledge and collaborate.
2013 Shift Index metrics: The burdens of the past
20

Impact indexThe Impact index demonstrates the consequences of the Big Shift; thus, it is a lagging indica-
tor. Individuals, able to quickly adopt new technologies and knowledge flows, are benefiting from the forces of the Big Shift as both consumers and creative talent. Companies, on the other hand, are struggling to evolve their efficiency-based legacy processes and practices to turn the challenges into opportunities.
Figure 17. Impact index (1993–2012)
Graphic: Deloitte University Press | DUPress.com Source: Deloitte analysis.
0
20
40
60
80
100
120
1993
Inde
x va
lue
1994
1995
1996
1997
1998
1999
2000
2001
2002
2003
2004
2005
2006
2007
2008
2009
2010
2011
2012
787881 84
8893 95
99106
101 10098 98 100
104
111105
101106 107
Figure 17. Impact index (1993–2012)
A report in the 2013 Shift Index series
21
Markets
Competitive intensity
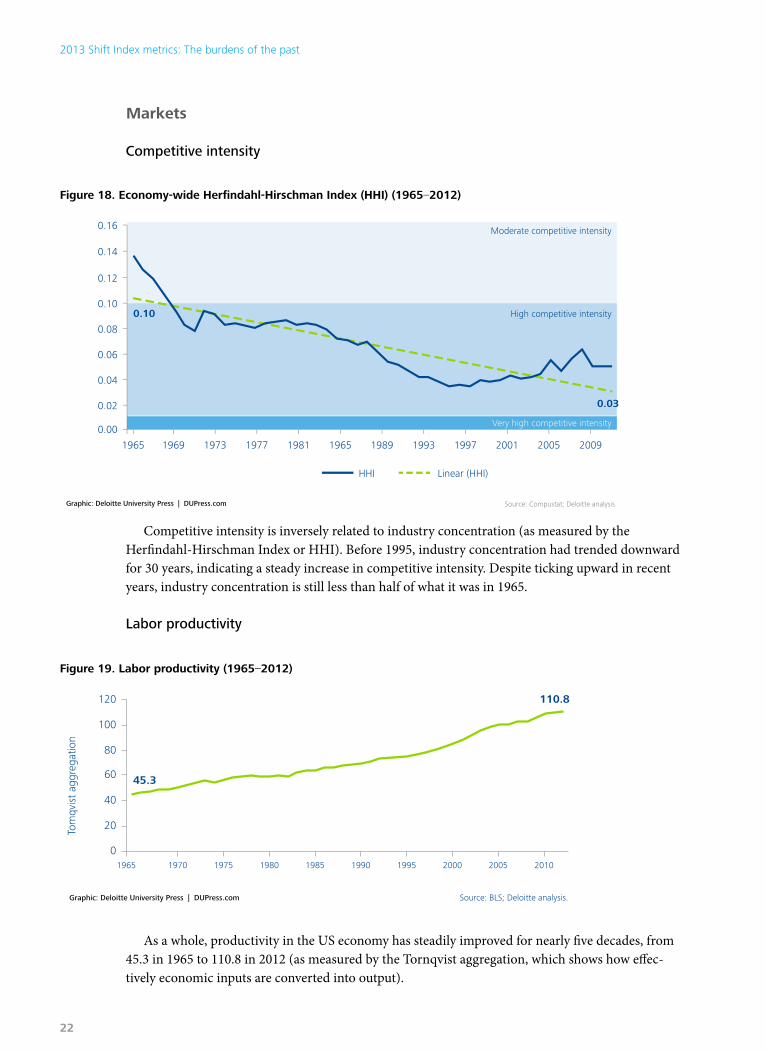
Figure 18. Economy-wide herfindahl-hirschman Index (hhI) (1965–2012)
1965 1969 1973 1977 1981 1965 1989 1993 1997 2001 2005 2009
0.00
0.02
0.04
0.06
0.08
0.10
0.12
0.14
0.16
0.03
0.10
HHI
Very high competitive intensity
High competitive intensity
Moderate competitive intensity
Linear (HHI)
Graphic: Deloitte University Press | DUPress.com
Figure 18: Economy-wide Herfindahl-Hirschman Index (HHI) (1965–2012)
Source: Compustat; Deloitte analysis.
Figure 19. Labor productivity (1965–2012)
Figure 19. Labor productivity (1965–2012)
Graphic: Deloitte University Press | DUPress.com
0
20
40
60
80
100
120
Tom
qvis
t ag
greg
atio
n
Source: BLS; Deloitte analysis.
1965 1970 1975 1980 1985 1990 1995 2000 2005 2010
110.8
45.3
Competitive intensity is inversely related to industry concentration (as measured by the Herfindahl-Hirschman Index or HHI). Before 1995, industry concentration had trended downward for 30 years, indicating a steady increase in competitive intensity. Despite ticking upward in recent years, industry concentration is still less than half of what it was in 1965.
Labor productivity
As a whole, productivity in the US economy has steadily improved for nearly five decades, from 45.3 in 1965 to 110.8 in 2012 (as measured by the Tornqvist aggregation, which shows how effec-tively economic inputs are converted into output).
2013 Shift Index metrics: The burdens of the past
22

Figure 20. Economy-wide stock price volatility (1972–2012)
1972 1976 1980 1984 1988 1992 1996 2000 2004 2008 2012
0.000
0.005
0.010
0.015
0.020
0.025
0.030
0.011
0.007
Stock price volatility Linear (stock price volatility)
Graphic: Deloitte University Press | DUPress.com
Figure 20: Economy-wide stock price volatility (1972–2012)
Source: CRSP US Stock Database ©200903 Center for Research in Security Prices (CRSP®); The University of Chicago Booth School of Business; Deloitte analysis.
Stan
dard
dev
iatio
ns
Stock price volatility
Firms
Asset profitability
Figure 21. Return on assets for the US economy (1965–2012)Figure 21. Return on assets for the US economy (1965–2012)
Graphic: Deloitte University Press | DUPress.com
0%
1%
2%
3%
4%
5%
6%
Source: Compustat; Deloitte analysis.
1965 1970 1975 1980 1985 1990 1995 2000 2005 2010
0.9%
4.1%
Economy ROA Linear (economy ROA)
The aggregate ROA of US firms fell to a quarter of its 1965 levels in 2012. To increase—or even maintain—asset profitability, firms must find new ways to generate value from their assets.
Over the last 40 years, stock prices have become more volatile. This volatility can be seen as a reflection of investors’ reactions to increasingly volatile global events and greater uncertainty about the future.
A report in the 2013 Shift Index series
23

roA performance gap
Figure 22. Economy-wide return on assets (ROA) by quartile (1965–2012)Figure 22. Economy-wide return on assets (ROA) by quartile (1965–2012)
Graphic: Deloitte University Press | DUPress.com
0%
5%
10%
15%
20%
Source: Compustat; Deloitte analysis.
1965 1970 1975 1980 1985 1990 1995 2000 2005 2010
9.4%10.8%
Top quartile Linear (top quartile)
-100%
-80%
-60%
-40%
-20%
0%
20%
1965 1970 1975 1980 1985 1990 1995 2000 2005 2010
-22.5%
2.8%
Bottom quartile Linear (bottom quartile)
The continuing ROA gap between top performers and bottom performers is not unexpected. It is significant, however, that even for the top quartile, ROA has declined from 12.9 percent in 1965 to 9.7 percent in 2012. The bottom quartile has declined more—from 1.2 percent in 1965 to -11.5 percent in 2012.
2013 Shift Index metrics: The burdens of the past
24

Firm topple rate
Figure 23. Economy-wide firm topple rate (1965–2012)Figure 23. Economy-wide firm topple rate (1965–2012)
Graphic: Deloitte University Press | DUPress.com
0.0
0.1
0.2
0.3
0.4
0.5
0.6
0.7
0.8
Source: Thomas C. Powell and Ingo Reinhardt,Rank friction: An ordinal approachto persistent profitability; Compustat; Deloitte analysis.
1965 1970 1975 1980 1985 1990 1995 2000 2005 2010
0.53
0.38
Topple rate Linear (topple rate)
Legend0: Ranks perfectly stable = Perfectly sustainable competitive advantage1: Ranks change randomly = Complete absence of sustained competitive advantage
It is increasingly difficult for companies to sustain performance. Between 1965 and 2012, the topple rate (the rate at which companies change ranks) for all companies with more than $100 mil-lion in net sales increased as competition exposed low performers and ate away at returns. Recently, the topple rate has fallen after spiking in 2008. The increase in government support after the Great Recession may explain this reduction.
A report in the 2013 Shift Index series
25

Shareholder value gap
Figure 24. Weighted average returns to shareholders by quartile (1965–2012)Figure 24. Weighted average total returns to shareholders by quartile (1965–2012)
Graphic: Deloitte University Press | DUPress.com
0%
50%
100%
150%
200%
250%
-80%
-60%
-40%
-20%
0%
Source: Compustat; Deloitte analysis.
1965 1970 1975 1980 1985 1990 1995 2000 2005 2010
72%
Wei
ghte
d av
erag
e to
tal r
etur
ns t
o sh
areh
olde
rs (%
)
Linear (top quartile)Top quartile
-100%1965 1970 1975 1980 1985 1990 1995 2000 2005 2010
-44%
-20%
Bottom quartile Linear (bottom quartile)
71%
Over the long term, the upper quartile of firms—the “winners”—have only slightly increased the rate of return to shareholders. Meanwhile, in the lower quartile, firms are destroying shareholder value at a faster rate.
2013 Shift Index metrics: The burdens of the past
26

Figure 25. Consumer power by category (2009–2012)
People
Consumer category 2009 2010 2011 2012
Search engine 70.9 68.7 71.6 69.6
Computer 68.0 68.6 71.7 67.6
Home entertainment 69.1 68.1 70.1 67.2
Restaurant 69.7 68.0 71.4 67.9
Insurance (Home/auto) 68.4 67.3 70.4 68.1
Athletic shoe 66.8 67.2 69.4 66.5
Hotel 68.8 67.1 72.4 68.9
Broadcast TV News 70.2 66.8 69.4 67.8
Banking 70.1 66.6 69.4 68.4
Snack chip 70.7 66.6 68.4 67.6
Gaming system 62.5 65.6 67.1 65.5
Wireless carrier 65.6 65.6 69.4 66.4
Household cleaner 65.9 65.3 66.8 64.2
Pain reliever 69.0 65.1 69.3 65.5
Investment 65.8 64.8 67.3 68.8
Department store 66.3 64.7 65.9 64.7
Magazine 68.8 64.5 70.9 65.7
Soft drink 69.5 64.4 66.2 64.9
Automobile manufacturer 67.3 64.4 68.4 65.5
Airline 65.4 63.2 65.0 62.7
Grocery store 65.5 62.8 66.1 62.8
Mass retailer 65.9 62.0 65.4 62.6
Gas station 61.6 61.3 61.7 60.2
Shipping 61.3 59.1 62.1 65.0
Cable/satellite TV 63.1 59.1 60.9 60.6
Newspaper 54.0 54.0 56.3 54.6
Higher scores indicate more consumer power. Across most consumer categories, consumers’ perception of their power is increasing. Even at the low end —newspapers and cable/satellite TV—the balance still favors the consumer.
Source: Ipsos; Synovate; Deloitte analysis.
A report in the 2013 Shift Index series
27

Figure 26. Brand disloyalty by category (2009–2012)
Brand disloyalty
Consumer category 2009 2010 2011 2012
Airline 69.9 75.3 75.9 74.8
Hotel 70.1 68.3 72.6 69.2
Home entertainment 69.0 67.2 70.2 67.3
Shipping 60.0 63.6 66.1 64.9
Gas station 59.5 64.0 63.9 64.8
Department store 65.9 67.4 68.7 63.7
Mass retailer 68.0 65.0 69.4 62.6
Grocery store 63.6 65.3 68.4 62.4
Automobile manufacturer 62.7 59.5 65.3 61.4
Athletic shoe 57.2 62.3 61.9 61.1
Investment 53.3 49.0 60.6 60.4
Wireless carrier 56.5 59.0 62.2 60.3
Computer 61.7 62.0 67.8 60.2
Gaming system 55.3 59.5 58.3 58.8
Restaurant 58.5 61.0 63.4 58.7
Cable/satellite TV 61.4 61.4 63.9 57.5
Household cleaner 54.5 55.2 59.7 57.5
Insurance (Home/auto) 57.8 54.1 60.4 56.5
Pain reliever 51.4 53.9 56.0 54.5
Banking 54.6 50.9 52.2 54.3
Broadcast TV News 49.4 52.1 50.6 53.4
Search engine 53.4 54.2 52.8 52.9
Snack chip 51.5 52.8 56.8 52.5
Magazine 45.2 49.7 53.6 49.0
Soft drink 40.9 44.1 45.0 42.3
Newspaper 42.3 41.0 45.2 42.1
Higher scores indicate higher brand disloyalty. Consumers continue to become less loyal to brands. Among the categories surveyed, brand disloyalty was highest in airlines, hotels, and home entertainment. Brand loyalty was higher in the soft drink, newspaper, and magazine categories.
Source: Ipsos; Synovate; Deloitte analysis.
2013 Shift Index metrics: The burdens of the past
28
Source: Ipsos; Synovate; Deloitte analysis.
returns to talent
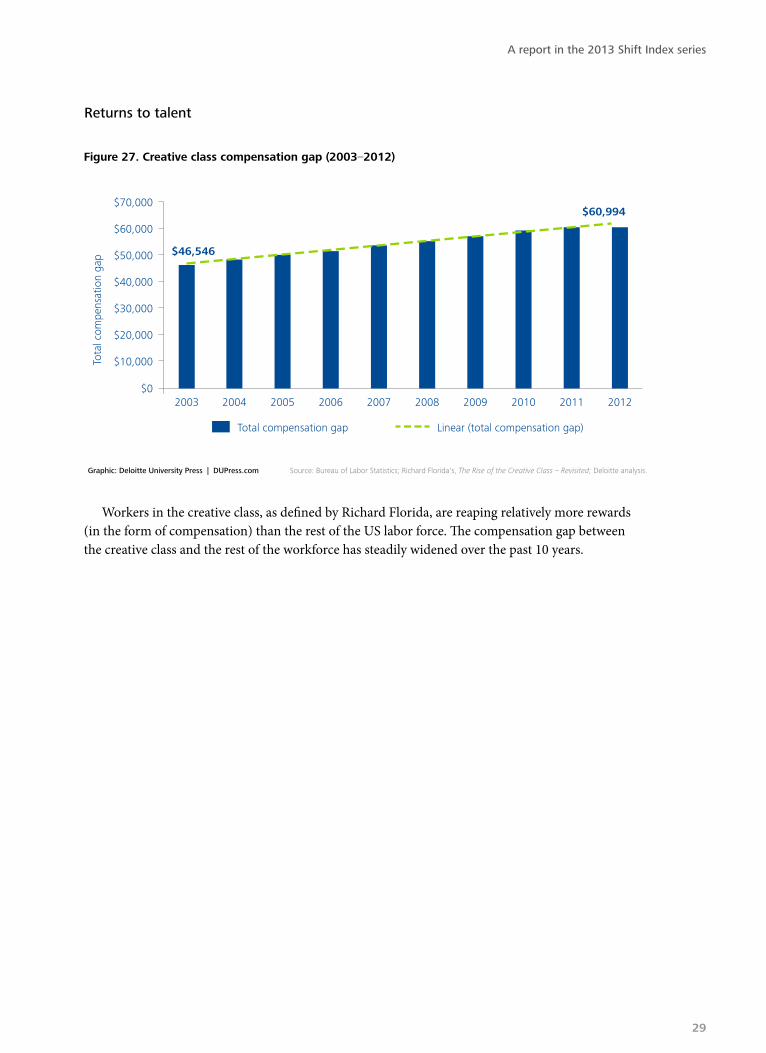
Figure 27. Creative class compensation gap (2003–2012)
2003$0
$10,000
$20,000
$30,000
$40,000
$50,000
$60,000
$70,000
$46,546
$60,994
Tota
l com
pens
atio
n ga
p
Graphic: Deloitte University Press | DUPress.com
Figure 27. Creative class compensation gap (2003–2012)
Source: Bureau of Labor Statistics; Richard Florida's, The Rise of the Creative Class – Revisited; Deloitte analysis.
Total compensation gap Linear (total compensation gap)
2004 2005 2006 2007 2008 2009 2010 2011 2012
Workers in the creative class, as defined by Richard Florida, are reaping relatively more rewards (in the form of compensation) than the rest of the US labor force. The compensation gap between the creative class and the rest of the workforce has steadily widened over the past 10 years.
A report in the 2013 Shift Index series
29

executive turnover
Figure 28. Executive turnover index (1993–2012)Figure 28. Executive turnover index (1993–2012)
Graphic: Deloitte University Press | DUPress.com
0
20
40
60
80
100
120
140
160
180
Source: Leading technology research vendor.
1993
1994
1995
1996
1997
1998
1999
2000
2001
2002
2003
2004
2005
2006
2007
2008
2009
2010
2011
2012
108.8
43.3
Linear (executive turnover index)Executive turnover index
Over the long term, executives are leaving their positions (resigning, retiring, or joining differ-ent companies) at an increasing rate. Since 2010, however, the executive turnover rate has acceler-ated, especially for banking and financial institutions. This acceleration may be caused by increasing performance pressures as the financial industry recovers from the recession. The increased turnover may also reflect the effects of pent-up demand as executives changed companies in a recovering job market. In addition, increased visibility into job opportunities via LinkedIn and other sites may also contribute to greater turnover.
2013 Shift Index metrics: The burdens of the past
30

Endnotes
1. Creative talent is defined by Richard Florida in The Rise of the Creative Class—Revisited, as super-creative workers (computer science and mathematics; architecture and engineer-ing; life, physical, and emotional science; education, training, and library management; and arts, design, entertainment, sports, and media studies) and creative workers (management; business and financial opera-tions; law; health care and technical fields; high-end sales and sales management).
2. Ari Gesher (senior software engineer, Palantir), interview with Deloitte Cen-ter for the Edge, September 2013.
3. Peter Lockett (senior engineer, DPR Construction), interview with Deloitte Center for the Edge, January 2013.
4. “How does a self-driving car work?” The Economist, April 29, 2013, http://www.econo-mist.com/blogs/economist-explains/2013/04/economist-explains-how-self-driving-car-works-driverless, accessed October 28, 2013.
5. Deloitte analysis using data provided by Standard & Poor’s Compustat on over 20,000 publicly traded US firms (and foreign companies trading in American Depository Receipts). It is available annu-ally and by industry sector through 1965.
6. Tony Danova, “Chart of the day: The unstop-pable rise of over-the-top mobile messaging,” Business Insider, May 7, 2013, http://www.businessinsider.com/chart-of-the-day-mobile-messaging-2013-5/, accessed October 7, 2013.
7. David Kiron, Doug Palmer, Anh Nguyen Phillips, and Robert Berkman, Social business: Shifting out of first gear, Deloitte University Press, August 2013, http://cdn.dupress.com/wp-content/uploads/2013/07/DUP446_SB_Report_Final.pdf?7cef76.
8. Ibid.
9. comScore, comScore reports January 2013 U.S. smartphone subscriber market share, March 6, 2013, http://www.comscore.com/Insights/Press_Releases/2013/3/comScore_Reports_January_2013_U.S._Smartphone_Subscrib-er_Market_Share, accessed August 21, 2013.
10. John Hagel III, John Seely Brown, and Tamara Samoylova, Unlocking the passion of the Ex-plorer, Deloitte University Press, September 17, 2013, http://dupress.com/articles/unlocking-the-passion-of-the-explorer/?icid=hp:ft:01.
A report in the 2013 Shift Index series
31

Acknowledgements
The authors would like to thank the following individuals for their contributions to this article:
Additionally, we would like to thank Duleesha Kulasooriya, head of impact strategy at the Center for the Edge, and Maggie Wooll, the Center’s senior editor.
Contacts
Blythe AronowitzChief of Staff, Center for the EdgeDeloitte Services LP+1 408 704 [email protected]
Wassili BertoenManaging Director, Center for the Edge EuropeDeloitte Netherlands+31 6 [email protected]
Chris Arkenberg
Blythe Aronowitz
Sallie Doerfler
Dan Elbert
Jodi Gray
Christian Grames
Carrie Howell
Michael Lui
Ashley Sung
Andrew Trabulsi
2013 Shift Index metrics: The burdens of the past
32

About the Center for the Edge
The Deloitte Center for the Edge conducts original research and develops substantive points of view for new corporate growth. The center, anchored in the Silicon Valley with teams in Europe and Australia, helps senior executives make sense of and profit from emerging opportunities on the edge of business and technology. Center leaders believe that what is created on the edge of the competi-tive landscape—in terms of technology, geography, demographics, markets—inevitably strikes at the very heart of a business. The Center for the Edge’s mission is to identify and explore emerging opportunities related to big shifts that are not yet on the senior management agenda, but ought to be. While Center leaders are focused on long-term trends and opportunities, they are equally focused on implications for near-term action, the day-to-day environment of executives.
Below the surface of current events, buried amid the latest headlines and competitive moves, executives are beginning to see the outlines of a new business landscape. Performance pressures are mounting. The old ways of doing things are generating diminishing returns. Companies are having harder time making money—and increasingly, their very survival is challenged. Executives must learn ways not only to do their jobs differently, but also to do them better. That, in part, requires understanding the broader changes to the operating environment:
• What is really driving intensifying competitive pressures?
• What long-term opportunities are available?
• What needs to be done today to change course?
Decoding the deep structure of this economic shift will allow executives to thrive in the face of intensifying competition and growing economic pressure. The good news is that the actions needed to address short-term economic conditions are also the best long-term measures to take advantage of the opportunities these challenges create.
For more information about the center’s unique perspective on these challenges, visit www.deloitte.com/centerforedge.
A report in the 2013 Shift Index series
33

About Deloitte University Press Deloitte University Press publishes original articles, reports and periodicals that provide insights for businesses, the public sector and NGOs. Our goal is to draw upon research and experience from throughout our professional services organization, and that of coauthors in academia and business, to advance the conversation on a broad spectrum of topics of interest to executives and government leaders.
Deloitte University Press is an imprint of Deloitte Development LLC.
This publication contains general information only, and none of Deloitte Touche Tohmatsu Limited, its member firms, or its and their affiliates are, by means of this publication, rendering accounting, business, financial, investment, legal, tax, or other professional advice or services. This publication is not a substitute for such professional advice or services, nor should it be used as a basis for any decision or action that may affect your finances or your business. Before making any decision or taking any action that may affect your finances or your business, you should consult a qualified professional adviser.
None of Deloitte Touche Tohmatsu Limited, its member firms, or its and their respective affiliates shall be responsible for any loss whatsoever sustained by any person who relies on this publication.
About Deloitte Deloitte refers to one or more of Deloitte Touche Tohmatsu Limited, a UK private company limited by guarantee, and its network of member firms, each of which is a legally separate and independent entity. Please see www.deloitte.com/about for a detailed description of the legal structure of Deloitte Touche Tohmatsu Limited and its member firms. Please see www.deloitte.com/us/about for a detailed description of the legal structure of Deloitte LLP and its subsidiaries. Certain services may not be available to attest clients under the rules and regulations of public accounting.
Copyright © 2013 Deloitte Development LLC. All rights reserved. Member of Deloitte Touche Tohmatsu Limited
Follow @DU_Press
Sign up for Deloitte University Press updates at www.dupress.com.


![BURDENS OF PROOF AND QUALIFIED IMMUNITY€¦ · 2012] Burdens of Proof and Qualified Immunity 137 A. Burdens of Proof The first observation that must be made when discussing burdens](https://img.pdfslide.net/doc/110x75/5b408ec47f8b9a2f138d5242/burdens-of-proof-and-qualified-2012-burdens-of-proof-and-qualified-immunity.jpg)