Embed Size (px)
Citation preview

2013 Sports, Fitness and Leisure Activities Topline Participation Report
The Sports and Fitness Industry Association

TABLE OF CONTENTS
2
Methodology 3
Brief Summary of Findings 4
Participation Trends 5
Inactivity Rates 6
Inactivity by Age 7
Active Participants 8
Participation by Generations 9
Geography of Physical Activity 10
Spending Trends 11
Projected Spending 12
Pay-to-Play 13
Aspirational Interest 14
Sports Participation Data 15
2013 SFIA Participation Topline Report
Your Guide Through the Topline Report

METHODOLOGY
3
This Overview Report from the Physical Activity Council (PAC) is produced by a partnership of six of the major trade associations in US sports, fitness and leisure industries. Each partner produces more detailed reports on their specific areas of interest but this Overview Report summarizes “topline” data about levels of activity in the US. The overall aim of this report is to establish levels of activity and identify key trends in sports, fitness and recreation participation in the US. For more detailed results, please contact the relevant partner listed below.
During January and February of 2013 ,a total of 42,356 online interviews were carried out with a nationwide sample of individuals and households from the US Online Panel of over one million people operated by Synovate/IPSOS. A total of 15,770 individual and 26,593 household surveys were completed. The total panel is maintained to be representative of the US population for people ages 6 and older. Over sampling of ethnic groups took place to boost response from typically under responding groups.
The 2012 participation survey sample size of 42,356 completed interviews provides a high degree of statistical accuracy. All surveys are subject to some level of standard error — that is, the degree to which the results might differ from those obtained by a complete census of every person in the US. A sport with a participation rate of five percent has a confidence interval of plus or minus 0.21 percentage points at the 95 percent confidence level. This translates to plus or minus four percent of participants.
A weighting technique was used to balance the data to reflect the total US population ages six and above. The following variables were used: gender, age, income, household size, region, population density and panel join date. The total population figure used was 287,138,000 people ages six and older.
In this year’s report we have changed the definition of “inactivity.” In the past, we had included only those participants who report no activity in any of the 126 activities listed for the data year. This year we included 19 sports/fitness activities that require minimal to no physical exertion. We also added a “calorie burning” component.
If you have specific questions, pleased get in touch with Sports Marketing Surveys USA at [email protected] or (561) 427-0647.
For more information on the following activities please contact:
CLUB/INSTITUTIONAL FITNESS: International Health, Racquet and Sportsclub Association (IHRSA) www.ihrsa.org P: (617) 951-0055
GOLF: The National Golf Foundation (NGF) www.ngf.org P: (561) 744-6006
OUTDOOR: The Outdoor Foundation (OF) www.outdoorfoundation.org P: (202) 271-3252
SNOWSPORTS: The Snowsports Industries America (SIA) www.snowsports.org P: (703) 556-9020
TEAM SPORTS / INDIVIDUAL SPORTS / GENERAL FITNESS / WATERSPORTS: The Sports and Fitness Industry Association (SFIA) www.sfia.org P: (301) 495:6321
TENNIS: The Tennis Industry Association (TIA) and United States Tennis Association (USTA) www.tennisinductry.org P: (843) 686-3036
2013 SFIA Participation Topline Report
Method for the Participation Topline Report

BRIEF SUMMARY OF FINDINGS
4
The Physical Activity Council’s annual study continues to track participation in over 120 sports. This report gives a broad overview to the study. For more details on specific sports please contact the relevant PAC Partner (see Methodology).
Our new definition of inactivity has broadened to mean “inactives” are those who don’t take part in any “active” sport. Using this new definition, there are 80.4 million “inactives.” This has increased slightly from 78.9 million in 2011. However, there is an indication that the rate of increase in inactivity is slowing down.
While much is written about inactivity, the flip side is that there are 206.7 million “active” Americans age 6 and older. Of course there are various levels of activity and we have classified this by grouping the activities into low, medium and high calorie burning activities. We combined this with participation frequency to see how many Americans take part in a high calorie activity three or more times a week – or to what we have called “Active to a Healthy Level.” Using this definition, we estimate 33% of Americans age 6 and older are active to a healthy level (or 94.8 million individuals).
Generation Z, or those born in 2000 or after, can now be analyzed in significant numbers so we have included them in the generation analysis for the first time. Participation levels are high for this age group (6 to 12 year olds) having over 50% take part in team sports and outdoor activities.
The PAC study also tracks overall spending by category. Spend levels in 2012 were generally higher than in 2011. Of particular interest is the increasing spending on team sports at school. Over half the parents of middle school/high school sports participants pay an extra fee for school sports and over half of these say fees have increased in the last year. Almost 70% of these parents pay more than $100 for school sports. We will track this going forward to monitor the impact on team sports participation.
In terms of aspirational sports, swimming, fitness and outdoor activities feature high on the list for most adult age groups. Team sports are also important for the younger age groups.
2013 SFIA Participation Topline Report
Inactivity Increases but 33% of Americans are Active to a Healthy Level

2008 – 2012 PARTICIPATION TRENDS
52013 SFIA Participation Topline Report
Total Participation Rate by Sport
Overall participation in sports, fitness and related physical activities remained relativity steady from 2011 to 2012. Fitness Sports had the largest increase of two percent, regaining the previous year 1% loss. Racquet Sports followed with a 1% increase but still remains below the 2008 peak rate of 14%. Both team and water sports slightly increased where individual and winter sports slightly decreased.
Note: This measure of winter sports does not include motorized winter sports.
36.7%
12.8%
21.6%
49.4%
6.6%
12.5%
61.1%
0%
10%
20%
30%
40%
50%
60%
70%
IndividualSports
RacquetSports
Team Sports OutdoorSports
WinterSports
WaterSports
FitnessSports
Participation Rates: % of Individuals Ages 6+
2008 2009 2010 2011 2012
US Participants, Ages 6+

INACTIVITY RATES
62013 SFIA Participation Topline Report
Inactivity Levels in the US
25.5%26.3% 26.6% 26.9%
27.6% 28.0%
70.5 M73.5 M 74.9 M 76.2 M
78.9 M 80.4 M
0.0 M
10.0 M
20.0 M
30.0 M
40.0 M
50.0 M
60.0 M
70.0 M
80.0 M
90.0 M
0%
5%
10%
15%
20%
25%
30%
2007 2008 2009 2010 2011 2012
Nu
mb
er o
f P
arti
cip
an
ts A
ges 6
+
% o
f P
arti
cip
an
ts A
ges 6
+
Inactivity Rate Number of Inactives
As efforts to increase awareness about the benefits of being active are put into play, inactivity continues to be a dominating force. Twenty-eight percent of all Americans are inactive, this is less than 1% increase from last year. However, this increase is still less than the average rate increase over the past 5 years. Even though the levels of inactivity continue to rise, the rate is slowing down.
To better understand inactivity rates, we changed the definition to include 19 sports/activities that are categories as needing minimal to no physical exertion. These include darts, billiards/pool, etc.
US Participants, Ages 6+

INACTIVITY BY AGE
72013 SFIA Participation Topline Report
Inactivity Levels in the US
Inactivity rates have increased in almost all age groups particularly in the younger age groups and the “time-crunched” middle ages 45 to 64. Both of the younger age groups show the highest level of inactivity in the 6 years covered.
College age individuals and those age 65 plus both showed decreases in inactivity. The over 65s are likely to have more time than those heavily involved in work activity.
19.5%
19.2%
26.4%
25.1%
24.7%
29.3%
33.9%
39.0%
0% 5% 10% 15% 20% 25% 30% 35% 40% 45%
6~12
13~17
18~24
25~34
35~44
45~54
55~64
65+
Ag
e
2007 2008 2009 2010 2011 2012
US Participants, Ages 6+

ACTIVE PARTICIPANTS
82013 SFIA Participation Topline Report
Participation to a Healthy Level
This year, for the first time, a “calorie” component was added to the analysis. The chart below incorporates the frequency of activities with the calorie level from each activity.
A healthy level of participation includes those participants who reported engaging in a high calorie level sport and fitness activities on a frequent basis (151+ times per year). There was a slight decrease of highly active participation from 2011 where rates had remained flat since 2009.
Using this definition we have identified 33% of Americans that are active to a healthy level. This is 94.8 million individuals age 6 and older.
25.5% 26.3% 26.6% 26.9% 27.6% 28.0%
20.3% 19.8% 19.6% 18.8% 18.4% 18.6%
7.9% 8.2% 7.7% 8.4% 8.2% 9.3%
11.3% 11.6% 11.3% 11.5% 11.3%11.2%
35.1% 34.1% 34.8% 34.5% 34.5% 32.9%
0%
10%
20%
30%
40%
50%
60%
70%
80%
90%
100%
2007 2008 2009 2010 2011 2012
% o
f P
arti
cip
an
ts A
ges 6
+
Active to a Healthy Leveland Beyond (151+ times)
Active (51~150 times) HighCalorie Activity
Casual (1~50 times) HighCalorie Activity
Low to Med CalorieActivites
None (Inactive)
US Participants, Ages 6+

PARTICIPATION BY GENERATION
92013 SFIA Participation Topline Report
A Breakdown of Participation Rates by Generation
US Participants, Ages 6+
Note: This measure of winter sports does not include motorized winter sports.
For the first time this year, we have included Generation Z in the generation analysis. These are individuals who were born in 2000 or later, so they are currently age 6-12. They are an important group as a marker to future levels of activity and an indication of the establishment of future habits. Although Gen Z is still a relatively small group numerically, participation rates for Gen Z are generally good and are highest for outdoor, team and individual sport.
27.6%
7.3% 8.2%
40.8%
2.5%
8.7%
62.1%
42.3%
15.2%
19.2%
54.3%
8.5%
14.3%
66.2%
45.4%
19.1%
32.5%
58.6%
11.1%
17.6%
63.8%
49.8%
15.3%
53.1%
63.1%
7.7%
13.4%
42.5%
0%
10%
20%
30%
40%
50%
60%
70%
IndividualSports
RacquetSports
Team Sports OutdoorSports
WinterSports
Water Sports FitnessSports
Boomers (1945-1964) Gen X (1965-1979) Gen Y / Millenials (1980-1999) Gen Z (2000+)

GEOGRAPHY OF PHYSICAL ACTIVITY
102013 SFIA Participation Topline Report
Participation Across the U.S.
In line with the previous studies the most active states include Colorado and Utah. The states with relatively low levels of healthy include a group of states in the south, Oklahoma, Arkansas and Mississippi.
Note: Top 39 States only with base of 1000+
Not Measured
Active to a Healthy Level: Participation in a high calorie sport/activity at least 151+ times a year, which include all cardio group based activities, cardio machine, running, swimming fitness, cycling, team sports, track, racquet sports, climbing, trail running, boxing, martial arts, boot camp.
US Participants, Ages 6+

SPENDING TRENDS
11
2011 2012
More Same Less Net More Same Less Net
Team Sports at School 5.2% 14.1% 4.1% 4.7% 6.3% 15.9% 3.8% 9.6%
Team Sports Outside School 5.9% 17.6% 5.0% 3.1% 6.6% 18.9% 5.2% 4.6%
Travel To Take Part In Sports & Recreation 6.3% 20.6% 6.5% -0.6% 5.9% 20.6% 6.5% -1.8%Lessons/Instruction/Sports Camps 5.0% 11.6% 3.8% 5.9% 5.0% 13.3% 4.2% 3.5%
On Gym Membership/Fees 6.1% 17.8% 5.3% 2.7% 6.4% 18.1% 6.0% 1.3%
Individual Sports Events 3.3% 11.0% 3.6% -1.7% 4.4% 12.7% 4.3% 0.5%
Tennis Membership/Fees 0.8% 5.4% 1.4% -7.9% 1.8% 7.7% 2.0% -1.7%
Winter Sports 2.0% 9.9% 4.4% -14.7% 2.7% 11.5% 4.0% -7.2%
Outdoor Recreation Activities 6.7% 32.3% 7.3% -1.3% 7.3% 32.1% 7.1% 0.4%
Sports/Recreation Clothing 9.0% 34.2% 8.5% 1.0% 9.4% 33.8% 9.0% 0.8%
Sports/Recreation Footwear 9.5% 36.8% 8.2% 2.4% 9.7% 36.1% 8.9% 1.5%
Sports/Recreation Equipment 7.7% 27.9% 8.4% -1.6% 7.6% 27.1% 9.0% -3.2%
2013 SFIA Participation Topline Report
Spending in 2012 Compared to 2011
As the net average spending increased in 2012 from 2011, most Americans spent about the same on sports and recreation in 2012. Winter sports spending decreased, which is expected due to a poor winter season. However, spending on school team sports increased reflecting the trend towards Pay-to-Play programs in school.
* Net is calculated by taking the % spending more less those spending less but re-based for just those spending.
US Participants, Ages 6+

PROJECTED SPENDING
122013 SFIA Participation Topline Report
Projected Spending for 2012
Projected Spending for 2013
More Same Less Net More Same Less Net
Team Sports at School 5.6% 15.9% 3.1% 10.2% 6.6% 17.3% 3.1% 13.0%
Team Sports Outside School 6.3% 19.3% 3.6% 9.3% 7.5% 20.2% 3.7% 12.1%Travel To Take Part In Sports & Recreation 7.6% 21.7% 4.5% 9.2% 8.1% 22.0% 4.5% 10.4%Lessons/Instruction/Sports Camps 5.6% 14.4% 2.8% 12.2% 6.6% 15.9% 3.4% 12.4%
On Gym Membership/Fees 6.4% 20.9% 3.6% 9.1% 7.7% 20.8% 3.9% 11.7%
Individual Sports Events 4.9% 13.8% 2.4% 11.8% 6.6% 15.3% 3.2% 13.5%
Tennis Membership/Fees 1.0% 7.7% 1.3% -3.0% 2.2% 10.0% 2.1% 0.7%
Winter Sports 3.4% 12.9% 3.0% 2.1% 4.3% 14.0% 3.4% 4.1%
Outdoor Recreation Activities 9.5% 32.1% 4.2% 11.6% 11.9% 31.2% 4.6% 15.3%
Sports/Recreation Clothing 9.0% 37.7% 7.7% 2.4% 10.9% 37.1% 7.4% 6.3%
Sports/Recreation Footwear 9.3% 39.9% 7.5% 3.2% 11.8% 38.3% 7.2% 8.0%
Sports/Recreation Equipment 7.6% 31.6% 8.2% -1.3% 9.0% 30.5% 7.4% 3.4%
Spending Plans for 2013 Compared to 2012
Spending plans don’t always materialize but it is useful to look at intentions and compare with previous studies. Overall, Americans plan to spend more in 2013 than they had predicted to spend in 2012. Spending on team sports at school and lessons/instructions/sports camp is set to increase as it has for the past two years.
* Net is calculated by taking the % spending more less those spending less but re-based for just those spending.
US Participants, Ages 6+

PAY-TO-PLAY
132013 SFIA Participation Topline Report
57.1%
27.0%
2.3%
13.6%
0% 50% 100%
Increased
Stayed the same
Decreased
Not sure
Has your child’s sports fee
change this school year
compared to last school year?
12.0%
18.8%
25.1%
17.1%
27.0%
0% 5% 10% 15% 20% 25% 30%
Less than $50
$50 to $99
$100 to $149
$150 to $199
$200 or more
Approximately how much do you spend for your child(ren) to
play sports at school?
2012 Pay-to-Play School Program
Pay-to-Play programs are increasing among middle/high school programs. These programs charge parents a flat rate fee for their child to participate in school sports. Of the 9% who responded having children playing a sport in middle/high school, over half contribute to a Pay-to-Play program. Most parents reported that these fees increased this year, while only 2% reported a decrease. Almost 70% pay more than $100.00 extra fee for their child’s school sports.
54.1%
40.1%
5.7%
0%
10%
20%
30%
40%
50%
60%
Yes No Not sure
% o
f P
are
nts
of
Mid
dle
/H
igh
S
ch
oo
l S
po
rt P
art
icip
an
ts
Do you pay an extra fee for
you child’s school sports?

ASPIRATIONAL INTEREST
14
Ages 6-12 Ages 13-17 Ages 18-24 Ages 25-34
Swimming For Fitness Working Out With Weights Swimming For Fitness Swimming For Fitness
Camping Swimming For Fitness Running/Jogging Bicycling
Martial Arts Bicycling Trail Running Trail Running
Bicycling Working Out Using Machines Bicycling Running/Jogging
Running/Jogging Camping Hiking Hiking
Soccer Running/Jogging Working Out With Weights Working Out Using Machines
Fishing Hiking Camping Camping
Hiking Trail Running Working Out Using Machines Working Out With Weights
Basketball Martial Arts Backpacking Fitness Classes
Canoeing Shooting Rafting Basketball
2013 SFIA Participation Topline Report
Which Sports Interest Non-Participants
Ages 35-44 Ages 45-54 Ages 55-64 Ages 65+
Swimming For Fitness Bicycling Swimming For Fitness Swimming For Fitness
Bicycling Swimming For Fitness Bicycling Working Out Using Machines
Hiking Hiking Working Out Using Machines Bicycling
Working Out With Weights Working Out With Weights Hiking Fishing
Camping Camping Working Out With Weights Birdwatching/Wildlife Viewing
Running/Jogging Working Out Using Machines Camping Hiking
Working Out Using Machines Running/Jogging Fitness Classes Fitness Classes
Fitness Classes Fishing Fishing Camping
Trail Running Fitness Classes Birdwatching/Wildlife Viewing Working Out With Weights
Backpacking Birdwatching/Wildlife Viewing Running/Jogging Shooting
Swimming for Fitness is the most popular “aspirational” sport amongst almost all age groups. Besides swimming, most interest lies in outdoor activities. Children ages 6 to 12 have an increased interest in camping, where young adults ages 18-24 are becoming more interested in running/jogging. Bicycling is also becoming more attractive to adults ages 25-54.
Ranked by top ten most popular interested sport and activity.
US Participants, Ages 6+

SPORTS PARTICIPATION DATA
152013 SFIA Participation Topline Report
A Breakdown of Participation in All Measured Sports
Aerobic Activities
Definition 2007 2008 2009 2010 2011 2012Change2011/ 2012
2 year AAG
5 year AAG
Aerobics (High impact)
Total participation 1+ times 11,287 11,780 12,771 14,567 15,755 16,178 2.7% 5.4% 7.5%
Casual 1-49 times 5,004 5,385 5,850 6,699 7,282 7,819 7.4% 8.0% 9.4%
CORE 50+ times 6,283 6,395 6,921 7,868 8,473 8,359 -1.3% 3.2% 6.0%
Aerobics (Low impact)
Total participation 1+ times 22,397 23,283 24,927 26,431 25,950 25,707 -0.9% -1.4% 2.9%
Casual 1-49 times 9,341 10,181 11,028 11,725 11,826 11,937 0.9% 0.9% 5.1%
CORE 50+ times 13,056 13,102 13,899 14,706 14,124 13,770 -2.5% -3.2% 1.2%
Aerobics (Step)
Total participation 1+ times 8,528 9,423 10,551 11,034 10,273 9,577 -6.8% -6.8% 2.7%
Casual 1-49 times 4,454 5,238 5,748 5,839 5,642 5,518 -2.2% -2.8% 4.7%
CORE 50+ times 4,074 4,186 4,803 5,195 4,632 4,059 -12.4% -11.6% 0.5%
Aquatic Exercise
Total participation 1+ times 9,757 9,512 8,965 8,947 9,042 9,177 1.5% 1.3% -1.2%
Casual 1-49 times 5,993 5,894 5,411 5,345 5,598 5,785 3.4% 4.0% -0.6%
CORE 50+ times 3,764 3,619 3,554 3,602 3,444 3,392 -1.5% -2.9% -2.0%
Boot Camp Style Cross-Training
Total participation 1+ times 7,706 7,496 -2.7%
Casual 1-49 times 4,818 4,787 -0.6%
CORE 50+ times 2,888 2,709 -6.2%
Cardio Kickboxing
Total participation 1+ times 4,812 4,905 5,500 6,287 6,488 6,725 3.7% 3.4% 7.0%
Casual 1-49 times 2,987 3,130 3,422 4,020 4,411 4,455 1.0% 5.4% 8.5%
CORE 50+ times 1,825 1,775 2,078 2,267 2,077 2,271 9.3% 0.5% 4.9%
Cross-Country Ski Machine
Total participation 1+ times 3,696 3,593 3,294 3,091 2,913 2,741 -5.9% -5.8% -5.8%
Casual 1-49 times 1,857 1,919 1,747 1,633 1,706 1,690 -0.9% 1.8% -1.7%
CORE 50+ times 1,839 1,674 1,547 1,458 1,208 1,051 -12.9% -15.1% -10.5%
Elliptical Motion Trainer
Total participation 1+ times 23,586 24,435 25,903 27,319 29,734 28,560 -3.9% 2.4% 4.0%
Casual 1-49 times 10,972 11,350 11,907 12,724 13,999 13,638 -2.6% 3.7% 4.5%
CORE 50+ times 12,614 13,085 13,996 14,595 15,736 14,922 -5.2% 1.3% 3.5%
Other Exercise to Music
Total participation 1+ times 22,294 22,094 21,969 22,503 23,610 25,034 6.0% 5.5% 2.4%
Casual 1-49 times 9,661 9,583 9,622 10,428 11,447 12,182 6.4% 8.1% 4.8%
CORE 50+ times 12,633 12,511 12,347 12,075 12,163 12,852 5.7% 3.2% 0.4%
Running/Jogging
Total participation 1+ times 41,064 41,097 42,511 46,650 50,061 51,450 2.8% 5.0% 4.7%
Casual 1-49 times 16,824 17,276 18,031 20,039 21,409 21,973 2.6% 4.7% 5.5%
CORE 50+ times 24,240 23,821 24,481 26,612 28,651 29,478 2.9% 5.3% 4.1%
All participation figures are in 000s
US Participants, Ages 6+
*AAG- Average Annual Growth

SPORTS PARTICIPATION DATA
162013 SFIA Participation Topline Report
Aerobic Activities cont.
Definition 2007 2008 2009 2010 2011 2012Change2011/ 2012
2 year AAG
5 year AAG
Stair Climbing Machine
Total participation 1+ times 13,521 13,863 13,653 13,269 13,409 12,979 -3.2% -1.1% -0.8%
Casual 1-49 times 7,107 7,562 7,511 7,233 7,559 7,303 -3.4% 0.6% 0.6%
CORE 50+ times 6,414 6,301 6,143 6,035 5,850 5,676 -3.0% -3.0% -2.4%
Stationary Cycling (Recumbent)
Total participation 1+ times 10,818 11,104 11,299 11,459 11,933 11,649 -2.4% 0.9% 1.5%
Casual 1-49 times 5,261 5,641 5,785 5,848 6,176 6,087 -1.4% 2.1% 3.0%
CORE 50+ times 5,557 5,463 5,514 5,611 5,757 5,562 -3.4% -0.4% 0.0%
Stationary Cycling (Group)
Total participation 1+ times 6,314 6,504 6,762 7,854 8,738 8,477 -3.0% 4.1% 6.3%
Casual 1-49 times 3,371 3,620 3,844 4,536 5,088 5,053 -0.7% 5.7% 8.6%
CORE 50+ times 2,943 2,884 2,918 3,318 3,650 3,424 -6.2% 1.9% 3.3%
Stationary Cycling (Upright)
Total participation 1+ times 24,531 24,918 24,916 24,578 24,409 24,338 -0.3% -0.5% -0.2%
Casual 1-49 times 11,581 12,117 12,224 12,183 12,187 12,178 -0.1% 0.0% 1.0%
CORE 50+ times 12,950 12,801 12,692 12,395 12,222 12,160 -0.5% -0.9% -1.2%
Swimming (Fitness)
Total participation 1+ times 21,517 23,216 7.9%
Casual 1-49 times 14,065 15,139 7.6%
CORE 50+ times 7,453 8,077 8.4%
Treadmill
Total participation 1+ times 50,073 49,722 50,395 52,275 53,260 50,839 -4.5% -1.3% 0.3%
Casual 1-49 times 20,891 21,077 21,161 21,896 22,642 22,248 -1.7% 0.8% 1.3%
CORE 50+ times 29,182 28,646 29,234 30,378 30,617 28,591 -6.6% -2.9% -0.3%
Walking for Fitness
Total participation 1+ times 108,740 110,204 110,882 112,082 112,715 114,029 1.2% 0.9% 1.0%
Casual 1-49 times 31,903 33,598 34,520 34,538 34,569 35,267 2.0% 1.1% 2.0%
CORE 50+ times 76,837 76,606 76,362 77,544 78,146 78,762 0.8% 0.8% 0.5%
US Participants, Ages 6+
All participation figures are in 000s
Definition 2007 2008 2009 2010 2011 2012Change2011/ 2012
2 year AAG
5 year AAG
Abdominal Machine/Device
Total participation 1+ times 20,426 20,172 19,691 18,978 18,721 18,907 1.0% -0.2% -1.5%
Casual 1-49 times 7,625 7,782 7,448 7,383 7,549 7,640 1.2% 1.7% 0.1%
CORE 50+ times 12,801 12,390 12,243 11,596 11,172 11,267 0.9% -1.4% -2.5%
Calisthenics
Total participation 1+ times 8,629 8,888 9,127 9,097 8,787 9,356 6.5% 1.5% 1.7%
Casual 1-49 times 2,041 2,539 3,131 3,182 2,996 3,287 9.7% 1.9% 10.6%
CORE 50+ times 6,588 6,344 5,991 5,915 5,791 6,069 4.8% 1.4% -1.6%
Conditioning Activities
SPORTS PARTICIPATION DATA
172013 SFIA Participation Topline Report
US Participants, Ages 6+
All participation figures are in 000s
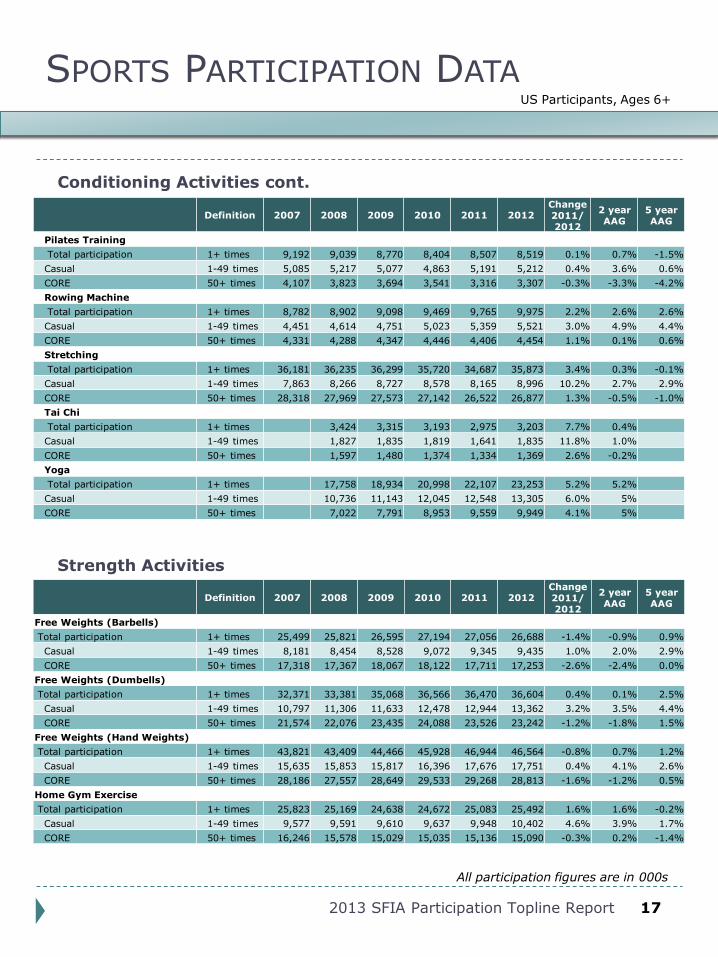
Conditioning Activities cont.
Definition 2007 2008 2009 2010 2011 2012Change2011/ 2012
2 year AAG
5 year AAG
Pilates Training
Total participation 1+ times 9,192 9,039 8,770 8,404 8,507 8,519 0.1% 0.7% -1.5%
Casual 1-49 times 5,085 5,217 5,077 4,863 5,191 5,212 0.4% 3.6% 0.6%
CORE 50+ times 4,107 3,823 3,694 3,541 3,316 3,307 -0.3% -3.3% -4.2%
Rowing Machine
Total participation 1+ times 8,782 8,902 9,098 9,469 9,765 9,975 2.2% 2.6% 2.6%
Casual 1-49 times 4,451 4,614 4,751 5,023 5,359 5,521 3.0% 4.9% 4.4%
CORE 50+ times 4,331 4,288 4,347 4,446 4,406 4,454 1.1% 0.1% 0.6%
Stretching
Total participation 1+ times 36,181 36,235 36,299 35,720 34,687 35,873 3.4% 0.3% -0.1%
Casual 1-49 times 7,863 8,266 8,727 8,578 8,165 8,996 10.2% 2.7% 2.9%
CORE 50+ times 28,318 27,969 27,573 27,142 26,522 26,877 1.3% -0.5% -1.0%
Tai Chi
Total participation 1+ times 3,424 3,315 3,193 2,975 3,203 7.7% 0.4%
Casual 1-49 times 1,827 1,835 1,819 1,641 1,835 11.8% 1.0%
CORE 50+ times 1,597 1,480 1,374 1,334 1,369 2.6% -0.2%
Yoga
Total participation 1+ times 17,758 18,934 20,998 22,107 23,253 5.2% 5.2%
Casual 1-49 times 10,736 11,143 12,045 12,548 13,305 6.0% 5%
CORE 50+ times 7,022 7,791 8,953 9,559 9,949 4.1% 5%
Definition 2007 2008 2009 2010 2011 2012Change2011/ 2012
2 year AAG
5 year AAG
Free Weights (Barbells)
Total participation 1+ times 25,499 25,821 26,595 27,194 27,056 26,688 -1.4% -0.9% 0.9%
Casual 1-49 times 8,181 8,454 8,528 9,072 9,345 9,435 1.0% 2.0% 2.9%
CORE 50+ times 17,318 17,367 18,067 18,122 17,711 17,253 -2.6% -2.4% 0.0%
Free Weights (Dumbells)
Total participation 1+ times 32,371 33,381 35,068 36,566 36,470 36,604 0.4% 0.1% 2.5%
Casual 1-49 times 10,797 11,306 11,633 12,478 12,944 13,362 3.2% 3.5% 4.4%
CORE 50+ times 21,574 22,076 23,435 24,088 23,526 23,242 -1.2% -1.8% 1.5%
Free Weights (Hand Weights)
Total participation 1+ times 43,821 43,409 44,466 45,928 46,944 46,564 -0.8% 0.7% 1.2%
Casual 1-49 times 15,635 15,853 15,817 16,396 17,676 17,751 0.4% 4.1% 2.6%
CORE 50+ times 28,186 27,557 28,649 29,533 29,268 28,813 -1.6% -1.2% 0.5%
Home Gym Exercise
Total participation 1+ times 25,823 25,169 24,638 24,672 25,083 25,492 1.6% 1.6% -0.2%
Casual 1-49 times 9,577 9,591 9,610 9,637 9,948 10,402 4.6% 3.9% 1.7%
CORE 50+ times 16,246 15,578 15,029 15,035 15,136 15,090 -0.3% 0.2% -1.4%
Strength Activities

SPORTS PARTICIPATION DATA
182013 SFIA Participation Topline Report
US Participants, Ages 6+
All participation figures are in 000s
Strength Activities cont.
Definition 2007 2008 2009 2010 2011 2012Change2011/ 2012
2 year AAG
5 year AAG
Weight/Resistance Machines
Total participation 1+ times 39,290 38,844 39,075 39,185 39,548 38,999 -1.4% -0.2% -0.1%
Casual 1-49 times 14,555 14,742 14,411 14,484 15,287 15,383 0.6% 3.1% 1.1%
CORE 50+ times 24,735 24,102 24,665 24,701 24,261 23,617 -2.7% -2.2% -0.9%
Individual Sports
Definition 2007 2008 2009 2010 2011 2012Change2011/ 2012
2 year AAG
5 year AAG
Adventure Racing
Total participation 1+ times 698 809 1,005 1,214 1,202 1,618 34.6% 16.8% 18.9%
Casual 1 time 257 221 343 434 337 672 99.8% 38.7% 29.0%
CORE 2+ times 441 588 662 780 866 945 9.2% 10.1% 16.8%
Archery
Total participation 1+ times 5,950 6,180 6,368 6,323 6,471 7,173 10.8% 6.6% 3.9%
Casual 1-25 times 4,839 5,070 5,336 5,387 5,546 5,967 7.6% 5.3% 4.3%
CORE 26+ times 1,111 1,110 1,032 936 926 1,205 30.2% 14.6% 2.5%
Billiards/Pool
Total participation 1+ times 51,089 50,054 46,012 41,195 36,831 34,712 -5.8% -8.2% -7.4%
Casual 1-12 times 30,795 31,318 29,572 26,560 24,700 23,639 -4.3% -5.7% -5.1%
CORE 13+ times 20,294 18,736 16,440 14,635 12,132 11,073 -8.7% -12.9% -11.3%
Bowling
Total participation 1+ times 60,184 59,417 57,972 56,585 53,906 48,614 -9.8% -7.3% -4.1%
Casual 1-12 times 44,762 44,965 44,582 43,732 42,423 37,939 -10.6% -6.8% -3.2%
CORE 13+ times 15,422 14,452 13,389 12,853 11,483 10,674 -7.0% -8.8% -7.1%
Boxing for Fitness
Total participation 1+ times 4,788 4,631 4,831 4.3% 0.5%
Casual 1-12 times 2,495 2,228 2,075 -6.8% -8.8%
CORE 13+ times 2,293 2,404 2,756 14.7% 9.7%
Boxing for Competition
Total participation 1+ times 855 747 959 28.3% 7.9%
Casual 1-12 times 598 516 769 49.1% 17.6%
CORE 13+ times 257 232 190 -17.9% -13.9%
Darts
Total participation 1+ times 24,709 24,080 21,737 19,070 17,249 16,190 -6.1% -7.8% -8.0%
Casual 1-12 times 16,106 15,845 14,433 12,667 11,707 11,080 -5.4% -6.5% -7.1%
CORE 13+ times 8,603 8,235 7,304 6,403 5,541 5,110 -7.8% -10.6% -9.8%
Horseback Riding
Total participation 1+ times 12,098 11,457 10,286 9,782 9,335 8,423 -9.8% -7.2% -7.0%
Casual 1-12 times 8,330 7,857 7,134 6,927 6,813 6,136 -9.9% -5.8% -5.9%
CORE 13+ times 3,768 3,600 3,152 2,855 2,522 2,287 -9.3% -10.5% -9.5%

SPORTS PARTICIPATION DATA
192013 SFIA Participation Topline Report
US Participants, Ages 6+
All participation figures are in 000s
Individual Sports cont.
Definition 2007 2008 2009 2010 2011 2012Change2011/ 2012
2 year AAG
5 year AAG
Ice Skating
Total participation 1+ times 11,430 11,215 10,964 11,477 11,626 11,214 -3.5% -1.1% -0.3%
Casual 1-12 times 9,514 9,556 9,480 9,817 9,898 9,375 -5.3% -2.2% -0.3%
CORE 13+ times 1,916 1,659 1,485 1,660 1,728 1,838 6.4% 5.3% -0.3%
Martial Arts
Total participation 1+ times 6,865 6,818 6,643 6,002 5,037 5,075 0.8% -7.7% -5.6%
Casual 1-12 times 1,366 1,431 1,435 1,424 1,171 1,207 3.1% -7.3% -2.1%
CORE 13+ times 5,499 5,388 5,209 4,579 3,866 3,869 0.1% -7.7% -6.6%
Mixed Martial Arts for Competition
Total participation 1+ times 910 713 749 5.1% -8.3%
Casual 1-12 times 528 419 638 52.5% 15.9%
CORE 13+ times 382 294 182 -38.1% -30.6%
Mixed Martial Arts for Fitness
Total participation 1+ times 1,745 1,697 1,977 16.5% 6.9%
Casual 1-12 times 577 536 816 52.2% 22.6%
CORE 13+ times 1,168 1,162 1,161 0.0% -0.3%
Roller Skating (2x2 wheels)
Total participation 1+ times 8,921 8,388 8,001 8,137 7,851 7,274 -7.3% -5.4% -3.9%
Casual 1-12 times 7,004 6,648 6,324 6,289 6,311 5,928 -6.1% -2.9% -3.2%
CORE 13+ times 1,917 1,741 1,677 1,848 1,540 1,347 -12.5% -14.6% -6.4%
Roller Skating (Inline wheels)
Total participation 1+ times 10,814 10,211 8,942 8,128 7,451 6,647 -10.8% -9.6% -9.2%
Casual 1-12 times 6,094 6,002 5,572 5,257 5,055 4,548 -10.0% -6.9% -5.6%
CORE 13+ times 4,720 4,210 3,371 2,871 2,397 2,100 -12.4% -14.5% -14.9%
Scooter Riding (Non-motorized)
Total participation 1+ times 6,782 6,588 5,729 4,963 4,829 4,636 -4.0% -3.3% -7.2%
Casual 1-12 times 2,971 2,569 1,922 1,716 1,642 1,755 6.9% 1.3% -9.4%
CORE 13+ times 4,460 4,346 3,810 3,247 3,187 2,881 -9.6% -5.7% -8.2%
Skateboarding
Total participation 1+ times 8,429 8,118 7,580 7,080 6,318 6,227 -1.4% -6.1% -5.8%
Casual 1-25 times 4,589 4,332 4,006 3,832 3,420 3,527 3.1% -3.8% -5.0%
CORE 26+ times 3,840 3,787 3,574 3,248 2,897 2,700 -6.8% -8.8% -6.7%
Trail Running
Total participation 1+ times 4,216 4,537 4,845 4,985 5,373 5,806 8.1% 7.9% 6.6%
Triathlon (Non-Traditional/Off Road)
Total participation 1+ times 483 543 634 798 819 1,075 31.3% 17.0% 17.8%
Casual 1 time 121 205 254 206 167 341 104.8% 42.9% 31.9%
CORE 2+ times 362 338 380 592 653 734 12.5% 11.4% 16.9%
Triathlon (Traditional/Road)
Total participation 1+ times 798 943 1,148 1,593 1,686 1,789 6.1% 6.0% 18.1%
Casual 1 time 248 300 374 496 519 616 18.8% 11.7% 20.4%
CORE 2+ times 550 643 774 1,097 1,167 1,173 0.5% 3.4% 17.2%

SPORTS PARTICIPATION DATA
202013 SFIA Participation Topline Report
US Participants, Ages 6+
All participation figures are in 000s
Definition 2007 2008 2009 2010 2011 2012Change2011/ 2012
2 year AAG
5 year AAG
Badminton
Total participation 1+ times 7,057 7,148 7,469 7,645 7,135 7,278 2.0% -2.3% 0.7%
Casual 1-12 times 4,785 4,937 5,123 4,973 4,687 5,092 8.7% 1.5% 1.4%
CORE 13+ times 2,272 2,211 2,346 2,672 2,448 2,185 -10.7% -9.6% -0.4%
Cardio Tennis
Total participation 1+ times 830 1,004 1,340 1,293 1,442 11.5% 4%
Racquetball
Total participation 1+ times 4,229 4,611 4,784 4,603 4,357 4,070 -6.6% -6.0% -0.6%
Casual 1-12 times 2,292 2,603 2,807 2,754 2,587 2,572 -0.6% -3.3% 2.6%
CORE 13+ times 1,937 2,008 1,978 1,849 1,772 1,498 -15.5% -9.8% -4.8%
Squash
Total participation 1+ times 612 659 796 1,031 1,112 1,290 16.0% 11.9% 16.4%
Casual 1-7 times 323 389 512 689 725 928 28.1% 16.6% 24.0%
CORE 8+ times 289 269 284 342 387 361 -6.5% 3.3% 5.1%
Table Tennis
Total participation 1+ times 15,955 16,578 18,251 19,374 18,561 16,823 -9.4% -6.8% 1.3%
Casual 1-12 times 10,865 11,530 12,773 13,245 12,963 12,041 -7.1% -4.6% 2.3%
CORE 13+ times 5,090 5,048 5,478 6,129 5,598 4,782 -14.6% -11.6% -0.7%
Tennis
Total participation 1+ times 16,940 17,749 18,546 18,719 17,772 17,020 -4.2% -4.6% 0.2%
Racquet Sports
Definition 2007 2008 2009 2010 2011 2012Change2011/ 2012
2 year AAG
5 year AAG
Baseball
Total participation 1+ times 16,058 15,539 14,429 14,198 13,561 12,976 -4.3% -4.4% -4.2%
Casual 1-12 times 4,493 4,674 4,639 4,640 4,212 3,931 -6.7% -8.0% -2.5%
CORE 13+ times 11,565 10,866 9,790 9,558 9,350 9,046 -3.3% -2.7% -4.7%
Basketball
Total participation 1+ times 25,961 26,108 25,131 25,156 24,790 23,708 -4.4% -2.9% -1.8%
Casual 1-12 times 7,956 8,269 8,070 8,094 8,118 7,389 -9.0% -4.3% -1.4%
CORE 13+ times 18,005 17,839 17,061 17,062 16,672 16,319 -2.1% -2.2% -1.9%
Cheerleading
Total participation 1+ times 3,279 3,192 3,070 3,134 3,049 3,244 6.4% 1.8% -0.1%
Casual 1-25 times 1,144 1,251 1,309 1,462 1,487 1,514 1.8% 1.8% 5.8%
CORE 26+ times 2,135 1,940 1,761 1,672 1,562 1,730 10.8% 2.1% -3.8%
Field Hockey
Total participation 1+ times 1,127 1,122 1,092 1,182 1,147 1,237 7.8% 2.4% 2.0%
Casual 1-7 times 550 560 493 539 536 578 7.8% 3.7% 1.3%
CORE 8+ times 577 562 600 644 611 659 7.8% 1.4% 2.8%
Team Sports

SPORTS PARTICIPATION DATA
212013 SFIA Participation Topline Report
US Participants, Ages 6+
All participation figures are in 000s
Team Sports cont.
Definition 2007 2008 2009 2010 2011 2012Change2011/ 2012
2 year AAG
5 year AAG
Football (Flag)
Total participation 1+ times 7,310 6,932 6,660 6,325 5,865 -7.3% -6%
Casual 1-12 times 4,001 3,776 3,623 3,501 2,963 -15.4% -9%
CORE 13+ times 3,309 3,156 3,037 2,825 2,902 2.7% -2%
Football (Touch)
Total participation 1+ times 10,493 9,726 8,663 7,684 7,295 -5.1% -8.2%
Casual 1-12 times 6,199 5,650 5,024 4,614 4,015 -13.0% -10.6%
CORE 13+ times 4,294 4,077 3,639 3,069 3,280 6.9% -4.4%
Football (Tackle)
Total participation 1+ times 7,939 7,816 7,243 6,850 6,448 6,220 -3.5% -4.7% -4.7%
Casual 1-25 times 3,700 3,585 3,291 3,060 2,691 2,566 -4.7% -8.4% -7.0%
CORE 26+ times 4,239 4,230 3,952 3,790 3,757 3,655 -2.7% -1.8% -2.9%
Gymnastics
Total participation 1+ times 4,066 3,975 3,952 4,418 4,824 5,115 6.0% 7.6% 4.8%
Casual 1-49 times 2,262 2,321 2,461 2,734 2,991 3,252 8.7% 9.1% 7.6%
CORE 50+ times 1,804 1,654 1,492 1,684 1,832 1,863 1.7% 5.3% 1.0%
Ice Hockey
Total participation 1+ times 1,840 1,871 2,018 2,140 2,131 2,363 10.9% 5.3% 5.2%
Casual 1-12 times 558 724 918 1,006 957 1,082 13.1% 4.1% 14.9%
CORE 13+ times 1,282 1,148 1,101 1,134 1,174 1,281 9.1% 6.3% 0.2%
Lacrosse
Total participation 1+ times 1,058 1,092 1,162 1,423 1,501 1,607 7.1% 6.3% 8.9%
Casual 1-12 times 349 456 543 637 701 788 12.4% 11.2% 17.9%
CORE 13+ times 709 637 619 786 800 819 2.4% 2.1% 3.6%
Paintball
Total participation 1+ times 5,476 5,167 4,705 4,104 3,606 3,528 -2.2% -7.1% -8.3%
Casual 1-7 times 3,195 3,062 2,886 2,739 2,579 2,456 -4.7% -5.3% -5.1%
CORE 8+ times 2,281 2,105 1,820 1,365 1,028 1,072 4.3% -10.2% -13.3%
Roller Hockey
Total participation 1+ times 1,681 1,569 1,427 1,374 1,237 1,367 10.5% 0.3% -3.8%
Casual 1-12 times 950 959 902 926 834 875 5.0% -2.5% -1.5%
CORE 13+ times 731 609 524 448 404 493 22.1% 6.1% -6.6%
Rugby
Total participation 1+ times 617 654 720 940 850 887 4.4% -2.6% 8.3%
Casual 1-7 times 301 351 420 599 544 526 -3.3% -6.2% 13.3%
CORE 8+ times 316 303 300 342 306 361 18.2% 3.8% 3.3%
Soccer (Indoor)
Total participation 1+ times 4,237 4,487 4,825 4,920 4,631 4,617 -0.3% -3.1% 1.8%
Casual 1-12 times 1,866 1,983 2,051 2,156 2,120 2,006 -5.4% -3.5% 1.6%
CORE 13+ times 2,371 2,505 2,775 2,765 2,511 2,611 4.0% -2.6% 2.2%
Soccer (Outdoor)
Total participation 1+ times 13,708 13,966 13,957 13,883 13,667 12,944 -5.3% -3.4% -1.1%
Casual 1-25 times 7,342 7,542 7,545 7,418 7,314 6,740 -7.9% -4.6% -1.6%
CORE 26+ times 6,366 6,424 6,413 6,466 6,353 6,205 -2.3% -2.0% -0.5%

SPORTS PARTICIPATION DATA
222013 SFIA Participation Topline Report
US Participants, Ages 6+
All participation figures are in 000s
Team Sports cont.
Definition 2007 2008 2009 2010 2011 2012Change2011/ 2012
2 year AAG
5 year AAG
Softball (Fast Pitch)
Total participation 1+ times 2,345 2,331 2,476 2,513 2,400 2,624 9.4% 2.4% 2.4%
Casual 1-25 times 1,013 1,055 1,166 1,317 1,235 1,245 0.9% -2.7% 4.4%
CORE 26+ times 1,332 1,276 1,310 1,197 1,166 1,379 18.3% 7.9% 1.1%
Softball (Slow-Pitch)
Total participation 1+ times 9,485 9,660 9,180 8,477 7,809 7,411 -5.1% -6.5% -4.8%
Casual 1-12 times 3,415 3,672 3,659 3,493 3,281 2,825 -13.9% -10.0% -3.5%
CORE 13+ times 6,070 5,988 5,522 4,985 4,528 4,586 1.3% -3.9% -5.4%
Swimming (Competition)
Total participation 1+ times 2,363 2,502 5.9%
Casual 1-49 times 840 1,065 26.8%
CORE 50+ times 1,523 1,437 -5.6%
Track and Field
Total participation 1+ times 4,691 4,604 4,480 4,383 4,341 4,257 -1.9% -1.4% -1.9%
Casual 1-25 times 1,977 2,091 2,175 2,007 1,830 1,820 -0.5% -4.7% -1.5%
CORE 26+ times 2,714 2,513 2,305 2,376 2,511 2,437 -2.9% 1.4% -2.0%
Ultimate Frisbee
Total participation 1+ times 4,038 4,459 4,636 4,571 4,868 5,131 5.4% 6.0% 5.0%
Casual 1-12 times 2,720 3,120 3,320 3,175 3,391 3,647 7.5% 7.2% 6.2%
CORE 13+ times 1,318 1,339 1,316 1,396 1,476 1,484 0.6% 3.2% 2.4%
Volleyball (Beach/Sand)
Total participation 1+ times 3,878 4,025 4,324 4,752 4,451 4,505 1.2% -2.6% 3.2%
Casual 1-12 times 2,439 2,765 3,153 3,372 3,163 3,040 -3.9% -5.0% 4.9%
CORE 13+ times 1,330 1,205 1,171 1,381 1,289 1,465 13.7% 3.5% 2.5%
Volleyball (Court)
Total participation 1+ times 6,986 7,588 7,737 7,315 6,662 6,384 -4.2% -6.5% -1.6%
Casual 1-12 times 2,930 3,211 3,394 3,261 2,754 2,553 -7.3% -11.4% -2.3%
CORE 13+ times 4,056 4,378 4,343 4,055 3,909 3,831 -2.0% -2.8% -1.0%
Volleyball (Grass)
Total participation 1+ times 4,940 5,013 4,970 4,714 4,211 4,088 -2.9% -6.8% -3.6%
Casual 1-12 times 3,280 3,560 3,699 3,359 2,958 2,955 -0.1% -6.0% -1.8%
CORE 13+ times 1,660 1,453 1,271 1,355 1,253 1,133 -9.5% -8.5% -7.1%
Wrestling
Total participation 1+ times 3,313 3,335 3,170 2,536 1,971 1,922 -2.5% -12.4% -9.8%
Casual 1-25 times 1,736 1,806 1,817 1,362 915 965 5.5% -13.7% -9.5%
CORE 26+ times 1,458 1,469 1,354 1,174 1,056 957 -9.4% -9.7% -8.0%

SPORTS PARTICIPATION DATA
232013 SFIA Participation Topline Report
US Participants, Ages 6+
All participation figures are in 000s
Outdoor Sports
Definition 2007 2008 2009 2010 2011 2012Change2011/ 2012
2 year AAG
5 year AAG
Backpacking Overnight - More Than 1/4 Mile From Vehicle/Home
Total participation 1+ times 6,637 7,252 7,757 7,998 7,722 7,933 2.7% -0.4% 3.7%
Bicycling – BMX
Total participation 1+ times 1,887 1,896 1,858 2,090 1,958 1,861 -5.0% -5.6% -0.1%
Casual 1-12 times 750 756 743 865 807 856 6.2% -0.3% 3.0%
CORE 13+ times 1,137 1,140 1,115 1,226 1,152 1,005 -12.8% -9.4% -2.2%
Bicycling (Mountain/Non-Paved Surface)
Total participation 1+ times 6,892 7,242 7,367 7,152 6,989 7,265 4.0% 1.6% 0.8%
Casual 1-12 times 3,051 3,271 3,393 3,386 3,218 3,270 1.6% -3.4% -1.7%
CORE 13+ times 3,841 3,971 3,974 3,766 3,771 3,995 5.9% 3.0% 0.9%
Bicycling (Road/paved surface)
Total participation 1+ times 38,940 38,527 39,127 39,730 39,834 39,790 -0.1% 0.2% 0.1%
Casual 1-25 times 17,789 17,977 18,535 18,965 19,127 18,966 -0.8% 0.0% 0.0%
CORE 26+ times 21,151 20,551 20,592 20,765 20,708 20,824 0.6% 0.1% -0.3%
Birdwatching More Than 1/4 Mile From Home/Vehicle
Total participation 1+ times 13,476 13,938 13,847 13,317 13,067 13,535 3.6% 0.9% 0.1%
Camping (Recreational vehicle)
Total participation 1+ times 16,168 16,343 16,977 16,651 16,282 15,903 -2.3% -2.3% -0.3%
Casual 1-7 times 7,942 7,981 8,401 8,464 8,250 8,316 0.8% -0.9% 1.0%
CORE 8+ times 8,226 8,362 8,576 8,187 8,033 7,587 -5.5% -3.7% -1.6%
Camping Within 1/4 Mile of Vehicle/Home
Total participation 1+ times 31,375 32,531 34,012 32,667 31,961 31,454 -1.6% -1.9% 0.1%
Climbing (Sport/Indoor/Boulder)
Total participation 1+ times 4,514 4,642 4,541 4,542 4,445 4,355 -2.0% -2.1% -0.7%
Climbing (Traditional/Ice/Mountaineering)
Total participation 1+ times 2,062 2,175 2,062 2,017 1,904 1,899 -0.2% -2.9% -1.6%
Fishing (Fly)
Total participation 1+ times 5,756 5,849 5,755 5,523 5,581 5,848 4.8% 2.9% 0.4%
Casual 1-7 times 2,923 3,018 3,099 3,022 3,123 3,598 15.2% 9.3% 4.4%
CORE 8+ times 2,833 2,831 2,656 2,501 2,457 2,250 -8.4% -5.1% -4.5%
Fishing (Freshwater-Other)
Total participation 1+ times 43,859 42,095 40,646 39,911 38,864 39,002 0.4% -1.1% -2.3%
Casual 1-7 times 20,145 19,531 19,499 19,577 19,363 20,341 5.1% 2.0% 0.2%
CORE 8+ times 23,714 22,565 21,147 20,334 19,501 18,660 -4.3% -4.2% -4.7%
Fishing (Saltwater)
Total participation 1+ times 14,437 14,121 13,054 12,056 11,896 12,000 0.9% -0.2% -3.6%
Casual 1-7 times 8,460 8,438 7,866 7,138 7,119 7,251 1.9% 0.8% -2.9%
CORE 8+ times 5,977 5,683 5,188 4,918 4,777 4,749 -0.6% -1.7% -4.5%
Hiking (Day)
Total participation 1+ times 29,965 31,238 32,542 32,534 33,494 34,519 3.1% 3.0% 2.9%
Hunting (Bow)
Total participation 1+ times 3,818 3,770 3,974 4,067 4,271 4,354 2.0% 3.5% 2.7%
Casual 1-7 times 1,718 1,730 1,937 1,972 1,883 2,066 9.7% 2.6% 3.9%
CORE 8+ times 2,100 2,040 2,037 2,096 2,388 2,288 -4.2% 4.9% 1.9%

SPORTS PARTICIPATION DATA
242013 SFIA Participation Topline Report
US Participants, Ages 6+
All participation figures are in 000s
Outdoor Sports cont.
Definition 2007 2008 2009 2010 2011 2012Change2011/ 2012
2 year AAG
5 year AAG
Hunting (Handgun)
Total participation 1+ times 2,595 2,734 2,575 2,493 2,690 3,112 15.7% 11.8% 4.0%
Casual 1-7 times 1,572 1,674 1,614 1,581 1,613 1,923 19.2% 10.6% 4.4%
CORE 8+ times 1,023 1,060 961 912 1,078 1,189 10.3% 14.2% 3.5%
Hunting (Rifle)
Total participation 1+ times 10,635 10,490 10,729 10,632 10,479 10,485 0.1% -0.7% -0.3%
Casual 1-12 times 6,960 6,959 7,507 7,676 7,338 7,337 0.0% -2.2% 1.1%
CORE 13+ times 3,675 3,530 3,222 2,956 3,140 3,149 0.3% 3.3% -2.9%
Hunting (Shotgun)
Total participation 1+ times 8,545 8,638 8,611 8,276 8,370 8,426 0.7% 0.9% -0.3%
Casual 1-7 times 4,171 4,322 4,620 4,489 4,244 4,516 6.4% 0.5% 1.7%
CORE 8+ times 4,374 4,316 3,991 3,788 4,126 3,910 -5.2% 1.9% -2.1%
Shooting (Sport Clays)
Total participation 1+ times 4,115 4,199 4,232 4,291 4,296 4,544 5.8% 3.0% 2.0%
Casual 1-7 times 2,596 2,685 2,724 2,808 2,866 3,061 6.8% 4.4% 3.4%
CORE 8+ times 1,519 1,514 1,509 1,484 1,431 1,484 3.7% 0.1% -0.4%
Shooting (Trap/Skeet)
Total participation 1+ times 3,376 3,523 3,519 3,489 3,453 3,591 4.0% 1.5% 1.3%
Casual 1-7 times 2,051 2,132 2,192 2,293 2,208 2,222 0.7% -1.5% 1.7%
CORE 8+ times 1,325 1,391 1,327 1,197 1,245 1,369 9.9% 7.0% 0.9%
Target Shooting (Handgun)
Total participation 1+ times 11,736 12,551 12,919 12,485 13,638 15,418 13.1% 11.1% 5.8%
Casual 1-7 times 6,222 6,764 7,279 7,345 8,135 8,990 10.5% 10.6% 7.7%
CORE 8+ times 5,514 5,787 5,640 5,140 5,504 6,428 16.8% 11.9% 3.5%
Target Shooting (Rifle)
Total participation 1+ times 12,436 12,769 12,916 12,637 13,032 13,853 6.3% 4.7% 2.2%
Casual 1-7 times 6,743 7,071 7,465 7,604 7,823 7,912 1.1% 2.0% 3.3%
CORE 8+ times 5,693 5,699 5,452 5,033 5,209 5,941 14.1% 8.8% 1.1%
Wildlife Viewing More Than 1/4 Mile From Home/Vehicle
Total participation 1+ times 22,974 23,544 22,702 21,158 21,495 22,482 4.6% 3.1% -0.3%
Definition2006/2007
2007/2008
2008/2009
2009/2010
2010/2011
2011/2012
Change2011/ 2012
2 year AAG
5 year AAG
Skiing (Alpine/Downhill)
Total participation 1+ times 10,362 10,346 10,919 11,504 10,201 8,243 -19.2% -15.3% -4.0%
Skiing (Cross-country)
Total participation 1+ times 3,530 3,848 4,157 4,530 3,641 3,307 -9.2% -14.4% -0.6%
Skiing (Freestyle)
Total participation 1+ times 2,817 2,711 2,950 3,647 4,318 5,357 24.1% 21.2% 14.2%
Winter Sports

SPORTS PARTICIPATION DATA
252013 SFIA Participation Topline Report
US Participants, Ages 6+
All participation figures are in 000s
Water Sports
Definition 2007 2008 2009 2010 2011 2012Change2011/ 2012
2 year AAG
5 year AAG
Boardsailing/Windsurfing
Total participation 1+ times 1,118 1,213 1,218 1,373 1,384 1,372 -0.9% 0.0% 4.3%
Casual 1-7 times 796 883 917 946 941 1,108 17.8% 8.6% 7.0%
CORE 8+ times 322 331 302 428 444 264 -40.5% -18.4% -0.2%
Canoeing
Total participation 1+ times 9,797 9,866 9,997 10,306 10,170 9,813 -3.5% -2.4% 0.1%
Jet Skiing
Total participation 1+ times 8,055 7,935 7,770 7,739 7,574 6,996 -7.6% -4.9% -2.7%
Casual 1-7 times 4,919 5,027 5,138 5,203 5,400 5,125 -5.1% -0.6% 0.9%
CORE 8+ times 3,136 2,908 2,632 2,536 2,174 1,870 -14.0% -14.1% -9.7%
Kayaking (Recreational)
Total participation 1+ times 5,070 5,655 6,226 6,339 7,347 8,187 11.4% 13.7% 10.2%
Kayaking (Sea/Touring)
Total participation 1+ times 1,485 1,633 1,776 1,958 2,087 2,238 7.2% 6.9% 8.6%
Kayaking (White Water)
Total participation 1+ times 1,207 1,225 1,306 1,606 1,694 1,712 1.1% 3.3% 7.5%
Rafting
Total participation 1+ times 4,340 4,496 4,485 4,389 4,141 3,756 -9.3% -7.5% -2.8%
Sailing
Total participation 1+ times 3,786 4,006 4,284 4,106 3,797 3,841 1.2% -3.2% 0.4%
Casual 1-7 times 2,264 2,452 2,687 2,604 2,470 2,565 3.9% -0.6% 2.7%
CORE 8+ times 1,522 1,554 1,598 1,502 1,328 1,276 -3.9% -7.7% -3.3%
Scuba Diving
Total participation 1+ times 2,965 3,091 2,970 2,938 2,866 2,781 -3.0% -2.7% -1.2%
Casual 1-7 times 1,947 2,065 2,015 2,014 2,027 1,932 -4.7% -2.0% -0.1%
CORE 8+ times 1,018 1,026 955 925 840 849 1.1% -4.1% -3.5%
Definition2006/2007
2007/2008
2008/2009
2009/2010
2010/2011
2011/2012
Change2011/ 2012
2 year AAG
5 year AAG
Snowboarding
Total participation 1+ times 6,841 7,159 7,421 8,196 7,579 7,351 -3.0% -5.3% 1.6%
Snowmobiling
Total participation 1+ times 4,811 4,736 4,729 4,957 4,908 3,788 -22.8% -11.9% -4.1%
Casual 1-7 times 2,814 2,866 2,956 3,086 3,301 2,286 -30.7% -11.9% -2.9%
CORE 8+ times 1,997 1,870 1,773 1,871 1,607 1,502 -6.5% -10.3% -5.3%
Snowshoeing
Total participation 1+ times 2,400 2,922 3,431 3,823 4,111 4,029 -2.0% 2.8% 11.2%
Telemarking (Downhill)
Total participation 1+ times 1,173 1,435 1,482 1,821 2,099 2,766 31.8% 23.5% 19.1%
Winter Sports cont.

SPORTS PARTICIPATION DATA
262013 SFIA Participation Topline Report
US Participants, Ages 6+
All participation figures are in 000s
Water Sports cont.
Definition 2007 2008 2009 2010 2011 2012Change2011/ 2012
2 year AAG
5 year AAG
Snorkeling
Total participation 1+ times 9,294 9,795 9,827 9,332 9,312 8,664 -6.9% -3.6% -1.3%
Casual 1-7 times 7,168 7,568 7,716 7,329 7,272 6,904 -5.0% -2.9% -0.7%
CORE 8+ times 2,126 2,227 2,111 2,003 2,041 1,760 -13.7% -5.9% -3.5%
Stand-Up Paddling
Total participation 1+ times 1,050 1,146 1,392 21.5% 15.3%
Surfing
Total participation 1+ times 2,206 2,407 2,505 2,585 2,481 2,545 2.6% -0.7% 3.0%
Casual 1-7 times 1,256 1,408 1,429 1,423 1,462 1,544 5.6% 4.2% 4.3%
CORE 8+ times 950 999 1,077 1,162 1,019 1,001 -1.7% -7.0% 1.4%
Wakeboarding
Total participation 1+ times 3,521 3,532 3,561 3,611 3,517 3,368 -4.2% -3.4% -0.9%
Casual 1-7 times 2,405 2,409 2,418 2,462 2,378 2,237 -5.9% -4.7% -1.4%
CORE 8+ times 1,116 1,124 1,143 1,150 1,141 1,132 -0.7% -0.8% 0.3%
Water Skiing
Total participation 1+ times 5,918 5,756 5,228 4,849 4,626 4,434 -4.2% -4.4% -5.6%
Casual 1-7 times 3,811 3,796 3,545 3,278 3,094 3,122 0.9% -2.4% -3.9%
CORE 8+ times 2,107 1,959 1,683 1,571 1,532 1,312 -14.3% -8.4% -8.9%

272013 SFIA Participation Topline Report
2013 Physical Activity CouncilNo part of the report may be reproduced or transmitted in any form or by any means, including photocopying, without the written permission of The Physical Activity Council, any application for which should be addressed to The Physical Activity Council. Written permission must also be obtained before any part of the report is stored in a retrieval system of any nature. Contact :Sports Marketing Surveys USA at (561) 427-0647 or [email protected]
DisclaimerWhile proper due care and diligence has been taken in the preparation of this
document, The Physical Activity Council cannot guarantee the accuracy of the information and does not accept any liability for any loss or damage caused as a result of using information or recommendations contained within this document

28
About SFIA Research
SFIA Research, powered by Sports Marketing Surveys USA (SMS), is the sole provider of marketing research and analysis for the Sports & Fitness Industry Association (SFIA). This partnership places SMS at the forefront when it comes to marketing
research of all things sports, sports participation and current trends in sports.
Sports Marketing Surveys USA has been in business since 1985, providing quantitative and qualitative marketing research and information for many of the leading manufactures and organizations throughout the industry.
Quantitative and Qualitative Consumer Research
Dealer Studies
Market Trend Analysis
Participation Based Geo Targeting
Sponsorship Evaluation
Market Size Evaluations
New Product Feasibility Studies
Sports & Fitness Industry Association
8505 Fenton Street, Suite 211
Silver Spring, MD 20910
P:301.495.6321
F:301.495.6322
www.sfia.org
Sports Marketing Surveys USA
6650 West Indiantown Road, Suite 220
Jupiter, FL 33458
P: 561.427.0647
F: 561.427.0648
www.sportsmarketingsurveysusa.com
Copyright:
©2013 Sports Marketing Surveys USA
No part of the report may be reproduced or transmitted in any form or by any means, including photocopying, without the written permission of Sports Marketing Surveys USA, any application for which should be addressed to Sports Marketing Surveys USA. Written permission must also be obtained before any part of the report is stored in a retrieval system of any nature.