Embed Size (px)
Citation preview

The Innovator in Healthcare Workforce Solutions2013 ANNUAL REPORT
Corporate Headquarters 12400 High Bluff Drive San Diego, CA 92130 Toll Free: (866) 871-8519 © 2014 AMN Healthcare AMN 14-C001
the healthcare “Baker’s Dozen Award” for outstanding quality
and customer service in RPO.
• The Nurse and Allied Staffing segment’s revenue growth
of 4% was moderated by tepid demand. Healthcare providers
tightened spending as the impact of weaker hospital censuses,
sequestration and additional reimbursement cuts took hold.
As a result, we believe many providers are operating with
a very lean workforce today. We would expect demand for
temporary staff to increase as general unemployment continues
to decline, patient volumes increase, clinician shortages worsen,
and providers seek to maintain a more flexible workforce.
• Our physician businesses experienced strong revenue
growth amidst steadier market demand. As the physician
employment trend continues and health systems take
responsibility for recruitment and coverage, administrators
have become more open to outsourced workforce solutions.
Our Locum Tenens team delivered superior performance as
prior changes to improve pricing and align our teams with the
greatest growth opportunities began to pay off. With solid
execution and favorable market dynamics, our outlook for the
Locum Tenens and Physician Permanent Placement segments
remains positive for 2014.
• As further affirmation of our corporate citizenship, in April
2014, we will launch our inaugural Corporate Social Responsibility
report outlining our performance on key indicators in the areas of
economic, environmental and social performance in accordance
with the G4 Sustainability Reporting Guidelines Core level.
THE ROAD AHEAD
We are excited about the opportunities for AMN Healthcare
to continue expanding our leadership position and
partnering with clients to create innovative approaches to the
massive workforce challenges that lie ahead. A confluence of
trends is expected in the near and long term to drive demand
for healthcare services – more citizens gaining access to
healthcare through insurance exchange enrollment and Medicaid
expansion, the aging population, and retiring clinicians. In a 2013
AMN survey, nearly two thirds of hospital executives said they
believed the influx of newly insured patients will increase the
need for physicians and nurses at their facilities. In the longer
term, the physician and nurse shortage is projected to worsen to
unprecedented levels of 130,600 and 260,000, respectively, by
2025. With clinical labor representing roughly half of hospitals’
cost structures, providers are adopting strategic outsourced work-
force solutions, particularly as they seek sophisticated, innovative
and economically beneficial approaches to address their labor
needs and improve patient outcomes.
As we endeavor to deliver greater value to our clients, we are
similarly committed to creating value for our shareholders.
The path to growing revenues profitably and delivering a 10%
adjusted EBITDA margin includes several key initiatives:
• Operating Leverage Through Revenue Growth. AMN is
best-positioned to capitalize on market trends as they
unfold and drive future demand. Our investment in the digital
transformation of our online marketing and mobile recruitment
technologies will support future market-leading growth and
bottom-line contribution as we meet client needs quickly with
scalable efficiencies.
• Growth of Innovative Workforce Solutions. The mutual
efficiencies achieved in recruiting clinical labor through workforce
solutions generally result in stronger operating margins
compared with traditional contracts. We will continue driving
revenue through these platforms, both organically and through
opportunistic acquisitions that expand our spectrum
of workforce solutions to meet client needs.
• Streamlined Infrastructure. We are upgrading many of our
processes and systems in order to provide best-in-industry
speed-to-market and scalability. These investments will drive
further efficiencies and are essential to achieving our long-term
margin goal.
The most important ingredient in the strong execution of
AMN Healthcare’s strategy is our talented, experienced and
highly engaged team. Our team members are exceptionally
committed to AMN’s purpose of Helping Achieve Professional
and Personal Goals Every Day and they fulfill this purpose
through our core values of passion, trust, respect,
innovation, customer focus and continuous improvement.
This level of engagement, execution, and corporate
social responsibility, combined with our clear,
differentiated strategy, has delivered value to all of our
stakeholders and solidified AMN’s position as
healthcare’s innovator in workforce solutions and
largest provider of staffing services in the nation.
Healthcare is undergoing a sea change, and we
are committed to being an integral part of the
solution. We take this opportunity and
responsibility very seriously, and we thank
you for your continued support and
interest in the mission of AMN Healthcare.
Dear AMN Healthcare Shareholders,
In 2013, AMN Healthcare achieved continued revenue and
profitability growth, as well as further recognition as the leader in
delivering innovative workforce solutions and staffing services to
healthcare organizations across our nation.
Healthcare is undergoing transformational change, with an
unprecedented number of factors dramatically impacting how,
when, where and at what cost healthcare will be delivered.
For providers to be successful in this new world, they will need
the right clinicians, in the right numbers, in the right place, at the
right time. As a result, they are seeking trusted, strategic partners
who can integrate seamlessly within their models to reduce
complexity, drive efficiency and improve patient satisfaction and
outcomes.
As healthcare’s innovator in workforce solutions, we are uniquely
positioned to meet this evolving demand to enable quality patient
outcomes and economic benefit for our clients. The competitive
differentiators we have built make AMN a partner of choice and
contribute to our industry leadership:
• Unparalleled Workforce Offerings. We offer the most
comprehensive suite of innovative workforce solutions, ranging
from traditional staffing and recruitment to managed services
programs, vendor management systems, recruitment process
outsourcing, EMR implementation services, telehealth staffing
and other solutions designed specifically to meet our clients’
individual needs.
• Highest Quality. Our focus on quality standards, credential-
ing, and thought leadership is best-in-industry. In recognition of
our quality commitment, we hold Joint Commission certification
and Credentials Verification Organization certification from the
National Committee for Quality Assurance.
• Largest Network of Clinicians & Physicians. Our ability to recruit
hard-to-find clinicians and physicians effectively and efficiently is
a key differentiator in this supply-constrained market. Our
innovative recruitment approaches and technologies and a vast
affiliate network are unparalleled in the industry.
• Unmatched Service Excellence. A relentless commitment to our
core values of innovation and customer focus, combined with our
consultative, solutions-oriented client approach,
enables us to deliver superior service.
THE YEAR IN REVIEW
In 2013, AMN Healthcare delivered a total shareholder return
of 27% through solid execution of our differentiated strategy.
Despite turmoil within the healthcare market and a tempered
demand environment, consolidated revenue grew 6% and
adjusted EBITDA grew 16%, reflecting improved operating
leverage and profitability. This resulted in an adjusted EBITDA
margin of 8.4%, a 70 basis point improvement towards our
long-term goal of 10%. Our growth was led by our Locum Tenens
and Physician Permanent Placement segments, both of which
delivered double-digit operating income growth on strong
revenue growth of 10% and 9%, respectively. We ended the year
with a healthy balance sheet, with $159 million of debt and a
leverage ratio of 2.0 times. Other 2013 highlights include:
• As healthcare’s leader in delivering managed services
programs, we added new MSP contracts with an estimated $70
million in annualized gross spend under management at
maturity. Our direct revenue through MSP contracts increased to
$296 million, representing nearly 30% of our consolidated
revenue. In non-healthcare sectors, MSP usage often reaches
50% to 60% among buyers, and we believe healthcare can reach
a similar level. Through MSP contracts, we typically achieve higher
fill rates than in traditional contracts, enabling greater efficiency
as well as faster growth during expansion periods and some
protection during downturns.
• We acquired ShiftWise, the leading provider of VMS and
other web-based healthcare workforce solutions. ShiftWise’s
vendor management system and technologies help manage
contingent staffing vendors, internal float pool resources, and
credentialing, while seamlessly integrating staffing resources into
one proprietary system. This strategic acquisition addresses a
need for clients who desire a vendor-neutral technology
option, as well as expanding our own capabilities and workforce
technology solutions.
• Our other workforce solutions – Recruitment Process
Outsourcing and Electronic Medical Records Staffing –
experienced robust growth. While these offerings are small in
revenue, they strengthen our position as a strategic partner able
to respond to the diverse needs of our clients. This year, AMN
Healthcare was awarded HRO Today’s “2013 Provider
Superstar” for outstanding provider service and leadership in
human resources outsourcing, as well as winning the top spot in
I N N O VAT I O N I N H E A LT H C A R E W O R K F O R C E S O L U T I O N S
Susan R. Salka
President and Chief Executive Officer

COMMITTEE MEMBERSHIP. The Company’s Audit Committee is comprised of Paul E. Weaver, Mark Foletta and Andrew M. Stern. The Company’s Corporate Governance Committee is comprised of Michael M.E. Johns, Andrew M. Stern, R. Jeffrey Harris and Martha H. Marsh. The Company’s Compensation and Stock Plan Committee is comprised of Martha H. Marsh, R. Jeffrey Harris and Michael M.E. Johns. The Company’s Executive Committee is comprised of Douglas D. Wheat, Susan R. Salka, and Paul E. Weaver.
FORWARD-LOOKING STATEMENTS. This annual report contains “forward-looking statements” within the meaning of Section 27A of the Securities Act of 1933, as amended, and Section 21E of the Securities Exchange Act of 1934, as amended. Such statements include Ms. Salka’s statements regarding anticipated long term growth and demand drivers of the industry; future business strategy; the shifting behavior, need and focus of healthcare clients; anticipated growth in revenues and profitability; anticipated EBITDA margins; and the anticipated growth in MSP contracts. The Company based these forward-looking statements on its current expectations and projec-tions about future events. Actual results could differ materially from those discussed in, or implied by, these forward-looking statements. Forward-looking statements are identified by words such as “believe,” “anticipate,” “expect,” “intend,” “plan,” “will,” “should,” “would,” “project,” “may,” variations of such words and other similar expressions. In addition, statements that refer to projections of financial items; anticipated growth and revenues; future economic conditions and performance; plans, objectives and strategies for future operations; and other characterizations of future events or circumstances are forward-looking statements. Factors that could cause actual results to differ from those implied by the forward-looking statements contained in this annual report are set forth in the Company’s annual report on Form 10-K for the year ended December 31, 2013, its quarterly reports on Form 10-Q, its current reports on Form 8-K, and other filings with the Securities and Exchange Commission. These statements reflect the Company’s current beliefs and are based upon information currently available to it. Be advised that developments subsequent to this annual report are likely to cause these statements to become outdated with the passage of time. From time to time, the Company makes available additional information regarding non-GAAP financial measures on the Company’s website at http://amnhealthcare.com/investors.
MANAGEMENT
SUSAN R. SALKA
President and Chief Executive Officer
BRIAN M. SCOTT
Chief Financial Officer and Chief Accounting Officer
DENISE L. JACKSON Senior Vice President, General Counsel and Secretary
JULIE R. FLETCHER
Chief Talent Officer
RALPH S. HENDERSON
President Healthcare Staffing
ROBERT E. LIVONIUS
PresidentStrategic Workforce Solutions
MARK E. SMITH
PresidentPhysician Permanent Placement Services
MARCIA R. FALLER, RN, PhD
Chief Clinical Officer
BOARD OF DIRECTORS
DOUGLAS D. WHEAT
Chairman, Board of DirectorsPartner, Southlake Equity Group
SUSAN R. SALKA
President, Chief Executive OfficerAMN Healthcare Services, Inc.
MARK G. FOLETTA
Director
R. JEFFREY HARRIS
Director
MICHAEL M.E. JOHNS, M.D.
Chairman, Corporate Governance CommitteProfessor of Medicine andPublic Health, Emory University
MARTHA H. MARSH
Chairman, Compensation & StockPlan Committee
ANDREW M. STERN
DirectorChairman, Chief Executive OfficerSunwest Communications, Inc.
PAUL E. WEAVER
Chairman, Audit Committee
CORPORATE HEADQUARTERS
AMN Healthcare Services, Inc.12400 High Bluff DriveSan Diego, CA 92130(866) 871-8519www.amnhealthcare.com
ANNUAL MEETING
April 23, 20148:30 AM CSTAMN Healthcare Services, Inc.5001 Statesman DriveIrving, TX 75063
TRANSFER AGENT
American Stock Transfer & Trust Company, LCC6201 15th AvenueBrooklyn, NY 11219(800) 937-5449www.amstock.com
CORPORATE COUNSEL
Paul, Weiss, Rifkind, Wharton & Garrison LLP1285 Avenue of the AmericasNew York, NY 10019-6064www.paulweiss.com
INDEPENDENT AUDITORS
KPMG LLP4747 Executive Drive, Suite 600San Diego, CA 92121www.kpmg.com
SHAREHOLDER INQUIRIES
Amy C. ChangVice President, Investor RelationsAMN Healthcare Services, Inc.12400 High Bluff DriveSan Diego, CA 92130(866) [email protected]
FOLLOW US ON:
C O R P O R AT E I N F O R M AT I O N

UNITED STATES SECURITIES AND EXCHANGE COMMISSIONWashington, D.C. 20549
FORM 10-K(Mark One)
ANNUAL REPORT PURSUANT TO SECTION 13 OR 15(d) OF THE SECURITIES EXCHANGE ACT OF 1934
For the fiscal year ended December 31, 2013, or
TRANSITION REPORT PURSUANT TO SECTION 13 OR 15(d) OF THE SECURITIES EXCHANGE ACT OF 1934
For the transition period from to Commission File No.: 001-16753
AMN HEALTHCARE SERVICES, INC.(Exact Name of Registrant as Specified in Its Charter)
Delaware 06-1500476(State or Other Jurisdiction of
Incorporation or Organization) (I.R.S. Employer
Identification No.)
12400 High Bluff Drive, Suite 100San Diego, California 92130
(Address of principal executive offices) (Zip Code)
Registrant’s Telephone Number, Including Area Code: (866) 871-8519Securities registered pursuant to Section 12(b) of the Act:
Title of Each Class Name of each exchange on which registeredCommon Stock, $0.01 par value New York Stock Exchange
Securities registered pursuant to Section 12(g) of the Act:None.
Indicate by check mark if the registrant is a well-known seasoned issuer, as defined in Rule 405 of the Securities Act. Yes No
Indicate by check mark if the registrant is not required to file reports pursuant to Section 13 or Section 15(d) of the Exchange Act. Yes No
Indicate by check mark whether the registrant: (1) has filed all reports required to be filed by Section 13 or 15(d) of the Securities Exchange Act of 1934 during the preceding 12 months (or for such shorter period that the registrant was required to file such reports), and (2) has been subject to such filing requirements for the past 90 days. Yes No
Indicate by check mark whether the registrant has submitted electronically and posted on its corporate Web site, if any, every Interactive Data File required to be submitted and posted pursuant to Rule 405 of Regulation S-T during the preceding 12 months (or for such shorter period that the registrant was required to submit and post such files). Yes No
Indicate by check mark if disclosure of delinquent filers pursuant to Item 405 of Regulation S-K (§ 229.405 of this chapter) is not contained herein, and will not be contained, to the best of registrant’s knowledge, in definitive proxy or information statements incorporated by reference in Part III of this Form 10-K or any amendment to this Form 10-K.
Indicate by check mark whether the registrant is a large accelerated filer, an accelerated filer, a non-accelerated filer, or a smaller reporting company. See the definitions of “large accelerated filer”, “accelerated filer” and “smaller reporting company” in Rule 12b-2 of the Exchange Act. (Check one):
Large accelerated filer Accelerated filer Non-accelerated filer Smaller reporting company
Indicate by check mark whether the registrant is a shell company (as defined in Rule 12b-2 of the Exchange Act). Yes No
The aggregate market value of the voting and non-voting common equity held by non-affiliates computed by reference to the price at which the common equity was last sold, or the average bid and asked price of such common equity, as of June 30, 2013, was $557,172,455 based on a closing sale price of $14.32 per share.
As of February 18, 2014, there were 46,359,065 shares of common stock, $0.01 par value, outstanding.Documents Incorporated By Reference: Portions of the registrant’s definitive proxy statement for the annual meeting of
stockholders scheduled to be held on April 23, 2014 have been incorporated by reference into Part III of this Form 10-K.

TABLE OF CONTENTS
Item Page
PART I
1.1A.1B.2.3.4.
PART II
5.
6.7.7A.8.9.9A.9B.
PART III
10.11.12.13.14.
PART IV
15.
Business 1Risk Factors 8Unresolved Staff Comments 13Properties 13Legal Proceedings 14Mine Safety Disclosures 14
Market for Registrant’s Common Equity, Related Stockholder Matters and Issuer Purchases of Equity Securities 15Selected Financial Data 17Management’s Discussion and Analysis of Financial Condition and Results of Operations 19Quantitative and Qualitative Disclosures about Market Risk 31Financial Statements and Supplementary Data 32Changes In and Disagreements With Accountants on Accounting and Financial Disclosure 60Controls and Procedures 60Other Information 63
Directors, Executive Officers and Corporate Governance 63Executive Compensation 63Security Ownership of Certain Beneficial Owners and Management and Related Stockholder Matters 63Certain Relationships and Related Transactions, and Director Independence 64Principal Accounting Fees and Services 64
Exhibits and Financial Statement Schedules 65Signatures 69

1
References in this Annual Report on Form 10-K to “AMN Healthcare,” the “Company,” “we,” “us” and “our” refer to AMN Healthcare Services, Inc. and its wholly owned subsidiaries.
PART I
Item 1. Business
Our Company
We are the innovator in healthcare workforce solutions and staffing services to healthcare facilities across the nation. As an innovative workforce solutions partner, our managed services programs, or “MSP,” vendor management systems, or “VMS,” recruitment process outsourcing, or “RPO,” consulting services, and placement of physicians, nurses and allied healthcare professionals into temporary and permanent positions enable our clients to successfully reduce complexity, increase efficiency and improve patient outcomes within the rapidly evolving healthcare environment. Our clients include acute and sub-acute care hospitals, government facilities, community health centers and clinics, physician practice groups, and several other healthcare settings.
Our clients utilize our workforce solutions and healthcare staffing services to manage their clinical workforce needs, both temporary and permanent, in an economically beneficial manner. Our managed services program and vendor management systems enable healthcare organizations to increase their efficiency by managing all of their supplemental workforce needs through one company or technology. Short- and long-term shortages in our clients’ workforce arise due to a variety of circumstances, including a lack of qualified, specialized local clinicians, attrition, leave schedules, census fluctuations, electronic medical records, or “EMR,” conversions and new unit openings. Increasingly, our clients seek innovative, proven and capable partners that provide a strategic, sophisticated and integrated clinical workforce approach that enables them to achieve high quality patient outcomes more efficiently. We believe our clients contract with us based on our value proposition of quality and service excellence, our comprehensive suite of innovative workforce solutions that reduce complexity, drive efficiency, improve patient satisfaction and outcomes and provide an economic benefit, together with our execution capabilities, our national footprint and our access to a wide network of clinicians and physicians. Our large number of hospital, healthcare facility and other clients provides us with the opportunity to offer positions to clinicians and physicians typically in all 50 states and in a variety of work environments and clinical settings.
Clinicians and physicians choose temporary assignments for a variety of reasons that include seeking flexible work opportunities, exploring different areas of the country and diverse practice settings, building clinical skills and experience by working at prestigious healthcare facilities, avoiding the demands and political environment of working as permanent staff, working through life and career transitions, and as a means of access into a permanent staff position. We provide our temporary clinicians and physicians with a competitive compensation and benefit package that may include professional development opportunities, professional liability insurance, 401(k) plan and health insurance. In addition, we may provide reimbursements for meals and incidentals, travel and housing, or company provided housing if they elect not to receive reimbursement. We believe that we attract temporary clinicians and physicians due to our long-standing reputation for providing a high level of service, our numerous employment opportunities, our benefit packages, our innovative marketing programs and word-of-mouth referrals from the thousands of current and former clinicians and physicians who have worked with us.
We use distinct brands to market our different services to our two client bases: (1) healthcare organizations and (2) clinicians and physicians. We market our managed services solutions, travel nurse and allied recruitment services to hospitals and healthcare facilities generally under one brand, AMN Healthcare®, as a single managed services provider with access to clinicians through multiple recruitment brands, including American Mobile®, Nursefinders®, Medical ExpressSM, NurseChoice®, NursesRx®, Med Travelers®, Club Staffing®, Rx Pro Health®, and O’Grady Peyton International®. For our other service offerings, we generally market using brand names, including ShiftWise® for our VMS technology, StaffCare® and Linde Healthcare® for our locum tenens businesses, and Merritt Hawkins® and Kendall & Davis® for our physician permanent placement services. Each brand has a distinct clinician focus, market strength and brand reputation.
2
Competition
The healthcare recruitment and workforce solutions industry is highly competitive. We compete in national, regional and local markets for both clinicians and physicians, as well as healthcare facility clients. We believe that our value proposition is our quality and service excellence, our comprehensive suite of innovative workplace solutions that reduce complexity, drive efficiency, improve patient satisfaction and outcomes and provide an economic benefit, together with our execution capabilities, our national footprint and our access to a wide network of clinicians and physicians. When recruiting for clinicians and physicians, in addition to other recruitment and staffing firms, we also compete with hospital systems that have developed their own recruitment departments and interim staffing pools. We compete for clinicians and physicians primarily based on customer service, recruitment and placement expertise, the quantity, diversity and quality of available assignments and placement opportunities, compensation packages and the benefits that we provide to them while they are on assignment.
We believe that larger, national firms that offer a broad spectrum of workforce solutions such as us have distinct, scalable advantages over smaller, local and regional competitors and companies whose service offerings are not as robust. The breadth of our services allows us to provide even greater value through a more strategic, comprehensive and integrated approach to our clients. Larger firms also generally have a deeper, more comprehensive infrastructure with a more established operating model and processes that provide the long-term stability and foundation for quality standards recognition, such as the Joint Commission staffing agency certification and National Committee for Quality Assurance Credentials Verification Organization certification. We believe a solid financial structure also provides us with an advantage as the provision of payroll and housing services are working capital intensive. With respect to our recruitment and placement businesses, we generally have access to a larger pool of available candidates than our competitors, substantial word-of-mouth referral networks and recognizable brand names, enabling us to attract a consistent flow of new applicants.
All of our business segments operate in highly competitive and fragmented markets. In the nurse and allied healthcare staffing business, we compete with a few national competitors together with numerous smaller, more regional and local companies, particularly in the per diem business. We believe we are one of the largest providers of nurse and allied healthcare staffing in the United States. Similarly, we believe we are one of the largest providers of locum tenens staffing services in the United States. The locum tenens staffing market consists of many small- to mid-sized companies with only a relatively small number of national competitors. The physician permanent placement services market is also highly fragmented and consists of many small- to mid-sized companies that do not have a national footprint. Some of our larger competitors in the healthcare staffing, clinical workforce managed services and VMS sectors include CHG Healthcare Services, Cross Country Healthcare, Maxim Healthcare, Jackson Healthcare, On Assignment, Parallon and MedAssets.
Demand and Supply Drivers
Demand Drivers
• Adoption of Outsourced Workforce Solutions. Healthcare organizations are increasingly seeking sophisticated, innovative and economically beneficial workforce solutions that improve patient outcomes. According to a Staffing Industry Analysts 2012 survey of large hospital systems (1) nearly 30% had a managed services provider or vendor management system in place to manage their supplemental clinical labor and (2) an additional 20% were seriously considering implementing one. The changes in reimbursement methodologies coupled with clinical labor representing a significant portion of a healthcare facility’s cost structure appear to be accelerating the adoption of strategic outsourced workforce solutions.
• Demographics and Advances in Medicine. We believe that the demand for both temporary and permanent clinicians and physicians will increase as the United States population ages and medical technological advances result in longer life expectancy. According to the Bureau of Labor Statistics, the number of adults age 65 or older will grow an estimated 39% between 2010 and 2020. Adults age 65 or older are three times more likely to have a hospital stay, and visit physician offices twice as often, compared with the rest of the population.
• Physician and Nursing Shortage. Many regions of the United States are experiencing a shortage of physicians and clinicians. According to the Association of American Medical Colleges, the physician shortage is expected to grow to approximately 91,500 and 130,600 physicians in 2020 and 2025, respectively. In June 2009, Health Affairs Journal reported that the registered nurse workforce is expected to be 260,000 nurses below the projected requirements by 2025. The demand for our recruitment and placements is correlated with activity in the permanent labor market. When nurse vacancy rates increase, nurse staffing order levels typically increase as well. Factors that we believe are contributing to the current and long-term supply shortage of clinicians and physicians include:

3
— Aging of Physician and Nurse Population. Approximately 47% of all licensed physicians in the United States are 50 years and older, and according to the Association of American Medical Colleges, nearly one-third of all physicians will retire in the next decade. The U.S. Department of Health and Human Services reported that nurses over the age of 50 comprised 45% of the total nurse population in 2008, compared with 33% in 2000.
— Shortage of Medical Schools. A shortage of qualified faculty and funding limits the availability of medical schools to prospective physicians. Some believe that the numbers of medical schools today may be insufficient to generate the number of physicians needed to address the current and projected shortage.
— Clinicians Leaving Patient Care Environments for Different Career Opportunities. Clinicians’ career opportunities have expanded beyond the traditional bedside role. Pharmaceutical companies, insurance companies, HMOs and hospital management, service and supply companies offer clinicians attractive positions which involve work that may be perceived as more rewarding, and with increased compensation, less demanding work schedules and more varied career progression and opportunity.
— Physicians Leaving Private Practice Due to Burdens of Malpractice Insurance and Reimbursement. Physicians are concerned over reimbursement levels from insurance companies and government agencies and frustrated with claim billing requirements and paperwork. The cost of malpractice insurance is also considered a motivator for physicians to leave private practice.
• Increased Access to Healthcare Services. Beginning this year, an estimated 30 million uninsured citizens are expected to gain access to health insurance upon implementation of the Patient Protection and Affordable Care Act of 2010 (“PPACA”).
Supply Drivers
• Traditional Reasons for Clinicians and Physicians to Work on a Temporary Assignment. Temporary assignments allow clinicians and physicians to explore new areas of the United States, work at prestigious hospitals, learn new skills, manage work-life balance, earn supplemental income, build their resumes, try out different clinical settings, reduce administrative burdens, allow for a transitional period between permanent jobs and avoid unwanted workplace politics that may accompany a permanent position.
• Word-of-Mouth Referrals. New applicants are often referred to us by other clinicians and physicians who have taken temporary assignments with or been placed in a permanent position. The growth in the number of clinicians and physicians who have worked on temporary assignments or have been placed in permanent positions, as well as growth in the number of hospital and healthcare facilities that have utilized our suite of solutions and services creates more opportunities for referrals.
• Physicians May Choose Temporary Staffing Due to Increased Malpractice, Reimbursement and Collection Concerns. Locum tenens positions provide physicians the opportunity to practice medicine without undue concern for increased malpractice costs, government agency or private insurance reimbursement or collections administration.
• Nurses Choose Travel Staffing Due to the Nursing Shortage. In times of nursing shortages, permanent nurses are often required to assume greater responsibility and patient loads, work overtime and deal with increased pressures within the hospital. Many experienced nurses choose to leave their permanent employer and look for a more flexible and rewarding position. This may be offset in times of economic difficulties when general unemployment levels may reduce hospital attrition rates due to nurses or their spouses’ employment or job security concerns.
• Legislation Increasing Nurse Mobility. The Mutual Recognition Compact Legislation, promoted by the National Council of State Boards of Nursing, allows nurses to work more freely within states participating in the Compact Legislation without obtaining additional state licenses. As of December 31, 2013, twenty-four states had implemented the recognition legislation.
• Physicians Seeking Health System Employment. Physicians are increasingly seeking employment with health systems rather than their own practices to enhance their work-life balance and achieve a more consistent income level, which for some results in higher job satisfaction. Companies providing locum tenens and direct placement opportunities are an effective avenue for identifying compelling career options in health systems.
4
Business Strategy
The following components comprise the key elements of our business strategy to expand our position as the innovator in healthcare workforce solutions and staffing services in the United States.
• Deliver Differentiated Value and Innovation in Healthcare Workforce Solutions. We continually explore diversification into other healthcare workforce solutions, in addition to our current managed services programs, VMS, RPO and consulting services, so that we can better serve our clients’ workforce needs. We continue to look at expansion into other service offerings through both internal development and select acquisition opportunities. When considering any such expansion we analyze the following key criteria: (1) the needs of our customers; (2) alignment with our core expertise of recruitment, credentialing, and access to clinical labor; (3) strengthening and broadening of our client relationships; (4) reduction in exposure to economic cycles; (5) enhancement of our long-term sustainable, differentiated business model; and (6) return on invested capital.
• Strengthen and Expand Our Relationships with Hospitals and Healthcare Facilities. We continue to strengthen and expand our relationships with our current hospital and healthcare facility clients, while also developing new relationships. Many hospitals and healthcare facilities seek to fulfill their human capital needs through a strong business partner who can provide comprehensive workforce solutions, including the development of innovative strategies that are economically beneficial such as managed services programs, VMS and RPO. Over the past few years, hospitals and healthcare facilities have shown a preference for workforce solutions that provide efficiency by working with fewer vendors. For example, MSP relationships represent approximately 30% of our business. We believe that our execution capabilities and value proposition centered on quality, service excellence and a suite of solutions that reduce complexity, drive efficiency and improve patient satisfaction and outcomes position us well to serve our clients’ needs today and in the future.
• Expand Our Network of Qualified Healthcare Professionals. Through our recruiting efforts, we continue to expand our network of qualified clinicians and physicians and our breadth of specialties. We have made significant investments in innovative online recruitment, including social media and mobile technologies to increase the efficiency and effectiveness of our strategies to attract quality clinicians and physicians. At the same time, we continue to build our supply of clinicians and physicians through referrals from those who are currently working with, or have been placed by, us in the past.
• Leverage Our Business Model and Technology Infrastructure. We seek to increase our operational effectiveness, efficiency, scalability and agility through expansion of the service lines that we provide to each of our large base of hospital and healthcare facility clients, leveraging technology and innovative marketing and recruitment programs. We are making significant investments in our front and back office network applications as well as our technology infrastructure to help ensure we are able to achieve scale efficiencies, provide superior customer service and meet the current and future demands of our clients and our clinicians and physicians.
• Client Connection through Innovative Technology. We continue to be an innovation leader in healthcare workforce solutions by providing online services and tools, including VMS to both our hospital and healthcare facility clients and our healthcare professionals. Through VMS, our hospital and healthcare facility clients streamline their communications and process flow to secure and manage staffing services, access credential verification and schedule their workforce. Another online resource, The Service Connection, provides our clinicians the ability to track assignment information and complete key forms electronically.
• Build the Strongest Team to Optimize Our Business Model. We continue to focus on training and professional development for all levels of management and staff and continue to hire skilled and experienced team members to deliver superior service to our hospital and healthcare facility clients. As an employer-of-choice, our differentiated employment value proposition is focused on fostering a values-driven culture, leader and co-worker quality, development and career opportunities, and a collegial work environment. During 2013, we were listed in Achievers 50 Most Engaged Workplaces™ in the United States. This annual award recognizes top employers that display leadership and innovation to engage their employees.
5
Business Overview
Services Provided
We conduct our business and provide our services through three reportable segments as set forth below.
Nurse and Allied Healthcare Staffing Segment
Through our nurse and allied healthcare staffing segment, we provide hospital and other healthcare facilities with a range of clinical workforce solutions, including (1) a comprehensive managed services workforce solution in which we can manage all of the contingent needs for a client; (2) a recruitment process outsourcing program that leverages our expertise and support systems to replace or complement a client’s existing internal recruitment function for permanent staffing needs; (3) a vendor management system delivered via a software as a service, or “SaaS,” model through our newly acquired subsidiary, ShiftWise, Inc.; and (4) traditional staffing service solutions of local, short- and long-term assignment lengths. We set forth our nurse and allied healthcare staffing segment’s revenue and operating income in “Item 8. Financial Statements and Supplementary Data—Notes to Consolidated Financial Statements—Note 1(r).”
Nurses. We provide a wide range of nurse specialties and disciplines, most of whom are registered nurses, for temporary assignments throughout the United States. Assignments in acute-care hospitals, including teaching institutions, trauma centers and community hospitals comprise the majority of our assignments. The length of the assignment varies with a typical travel nurse assignment of 13 weeks. We also offer a shorter-term staffing solution of four to eight weeks under our NurseChoice® brand to address hospitals’ urgent need for registered nurses. NurseChoice® is targeted to recruit and staff nurses who can begin assignments within one to two weeks in acute-care facilities in contrast to the three to five week lead time that may be required for travel nurses. Additionally, NurseChoice® provides clinicians for hospitals and health systems undergoing EMR technology implementations pursuant to grants available to healthcare facilities under the federal Health Information Technology for Economic and Clinical Health Act. We also offer local staffing. Local staffing involves the placement of locally based healthcare professionals on daily shift work on an as-needed basis. Hospitals and healthcare facilities often give only a few hours notice of their local staffing assignments that require a turnaround from their staffing agencies of generally less than 24 hours. Nurses comprised approximately 85% of total nurse and allied temporary healthcare professionals working for us in 2013.
Allied Health Professionals. We provide allied health professionals under brands that include Med Travelers®, Club Staffing® and Rx Pro Health® to acute-care hospitals and other healthcare facilities such as skilled nursing facilities, rehabilitation clinics, and retail and mail-order pharmacies. Allied health professionals include such disciplines as physical therapists, respiratory therapists, occupational therapists, medical and radiology technologists, speech pathologists, rehabilitation assistants, pharmacists and pharmacy technicians. Allied health professionals comprised approximately 15% of the total nurse and allied temporary healthcare professionals working for us in 2013.
Locum Tenens Staffing Segment
Similar to our nurse and allied healthcare staffing segment, through our locum tenens staffing segment, we can provide our clients with (1) managed service programs, (2) a VMS solution, and (3) traditional temporary staffing (“locum tenens”) services. We place as independent contractors physicians of all specialties, advanced practice clinicians and dentists on a locum tenens basis with all types of healthcare organizations throughout the United States, including hospitals, health systems, medical groups, occupational medical clinics, psychiatric facilities, government institutions and insurance companies. We recruit these professionals nationwide and typically place them on multi-week contracts with assignment lengths ranging from a few days up to one year. We set forth our locum tenens staffing segment’s revenue and operating income in “Item 8. Financial Statements and Supplementary Data—Notes to Consolidated Financial Statements—Note 1(r).”
Physician Permanent Placement Services Segment
We provide physician permanent placement services under our Merritt Hawkins® and Kendall & Davis® brands to hospitals, healthcare facilities and physician practice groups throughout the United States. Using a distinct consultative approach that we believe is more client-oriented, we perform the vast majority of our services on a retained basis through our Merritt Hawkins® brand, for which we are generally paid through a blend of retained search fees and variable fees tied to work performed and successful placement. To a smaller degree, we also perform our services on a contingent basis exclusively through our Kendall & Davis® brand, for which fees are paid once physician candidates are ultimately hired by our clients. Our broad specialty offerings include over 70 specialist and sub-specialist opportunities such as internal medicine, family practice and surgery. We set forth our physician permanent placement services segment’s revenue and operating income in “Item 8. Financial Statements and Supplementary Data—Notes to Consolidated Financial Statements—Note 1(r).”
6
National Presence and Diversified Hospital and Healthcare Facility Client Base
We offer clinicians and physicians placement opportunities and provide staffing solutions to our clients throughout the
United States. During each of the past three years (1) we generated all of our revenue (other than a de minimus amount) in the United States and (2) all of our long-lived assets were located in the United States. We typically generate revenue in all 50 states. During 2013, the largest percentages of our revenue were concentrated in California, Texas, New York, North Carolina and Pennsylvania.
The majority of our temporary healthcare professional assignments are at acute-care hospitals. In addition to acute-care hospitals, we provide services to sub-acute healthcare facilities, physician groups, rehabilitation centers, dialysis clinics, pharmacies, home health service providers and ambulatory surgery centers. Our clients include Kaiser Foundation Hospitals, New York Presbyterian Health System, MedStar Health, HCA, NYU Medical Center, Stanford Hospital and Clinics, UCLA Medical Center, Rady Children’s Hospital and Johns Hopkins Health System. No single client healthcare system comprised more than 10% of consolidated revenue and no single client facility comprised more than 3% of consolidated revenue for the year ended December 31, 2013. One managed services program client comprised more than 10% of our nurse and allied healthcare staffing segment revenue for the year ended December 31, 2013. If we were to lose that managed services program client relationship and were unable to directly or indirectly as a subcontractor continue to provide significant staffing services to such client it may have a material adverse effect on our nurse and allied healthcare staffing segment. Our success in winning MSP contracts means some larger health systems have grown and may continue to grow substantially relative to our other revenue sources. The dynamics could lead to a greater client concentration than that which we have historically experienced.
Our Business Model
We have developed and continually refine our business model to achieve greater levels of productivity and service delivery efficiency. We seek to optimize the communication with, and service to, our clinicians and physicians and our clients.
Marketing and Recruitment of New Clinicians and Physicians
We believe that we attract clinicians and physicians because of our customer service and relationship-oriented approach, our competitive compensation and benefits package, and our large and diverse offering of work assignments that provide the opportunity to work at numerous attractive locations throughout the United States. We believe that our multi-brand recruiting strategy makes us more effective at reaching a larger number of healthcare professionals, while still leveraging operational efficiencies.
In our effort to attract and retain highly qualified clinicians and physicians, we offer an attractive package of benefits, which may include competitive compensation, professional development opportunities, professional liability insurance, 401(k) plan and health insurance. In addition, we may provide reimbursements for meals and incidentals, travel and housing, or company provided housing if they elect not to receive reimbursement.
Screening, Licensing and Quality Management
We design our internal processes to ensure that the clinicians and physicians that we directly place with clients have the appropriate experience, credentials and skills. When placed on assignment, we continue to evaluate our clinicians and physicians to ensure adequate performance and manage risk, as well as to determine feasibility for future placements. To a certain extent, we utilize subcontractors for placement of temporary clinicians and physicians in our managed services programs, and the subcontractors are responsible for the screening, licensing and privileging of these temporary clinicians and physicians. Our experience has shown us that well-matched placements result in more satisfied clinicians, physicians, healthcare facility clients and patients.
Placement
Through our nurse and allied healthcare staffing segment, we provide acute-care systems as well as other healthcare facilities with a range of clinical workforce management and staffing solutions. These offerings include a comprehensive managed services workforce solution in which we can manage all of the temporary staffing needs for a client, a recruitment process outsourcing service that leverages our expertise and support systems to replace or complement our client’s existing internal recruitment function for permanent staffing needs, VMS technology delivered through a SaaS model, and more traditional staffing service solutions of local, short- and long-term assignment lengths. Under our national sales approach, staffing orders are available to the recruiters at all of our recruitment brands.
7
Our locum tenens staffing and physician permanent placement services segments generate nationwide orders for both temporary physicians and permanent physician placement. Our recruiters utilize our extensive database and our proven processes to fill permanent physician orders and schedule temporary physician assignments.
Client Billing
We bill our clients for the temporary clinicians and physicians on assignment based on hours and days worked. The clinician is our employee for payroll and benefits purposes and the locum tenens is an independent contractor, typically paid directly by us on behalf of our clients. We bill our clients at an hourly or daily rate that effectively includes reimbursement for recruitment fees, compensation and, for temporary clinicians who are our employees, any benefits and any applicable employer taxes. Housing, travel expenses, and meals and incidentals, if applicable, are either included in the hourly/daily rate or billed separately.
For our physician permanent placement services, we typically bill clients for a search initiation fee, hours worked and expenses on the search engagement and a non-refundable placement fee once the placement occurs.
Technology and Information Systems
Our technology infrastructure and systems are essential to the operation of our business and achievement of our strategic and financial goals. Over the past two years, we have invested in our digital presence on websites, social media and mobile applications focused on lead management and recruitment. We are shifting our investments towards the modernization of our front office, back office and infrastructure domains. For both front office and back office functions, we intend to update and further expand our utilization of established commercially available platforms including PeopleSoft and Salesforce.com. We will continue to develop and maintain proprietary technology in areas in which we can differentiate our service offerings for our innovative workforce solutions such as VMS.
Risk Management
We have developed an integrated risk management program that focuses on loss analysis, education and assessment in an effort to reduce our operational costs and risk exposure. We regularly analyze our losses on professional liability claims and workers compensation claims to identify trends. This allows us to focus our resources on those areas that may have the greatest impact on us, price our services appropriately and adjust our sales and operational approach in these areas. We have also developed educational materials for distribution to our employed clinicians to address specific work-injury risks and documentation of clinical events.
In addition to our proactive measures, we engage in a review process for incidents involving our clinicians and physicians. Upon notification of a clinician’s or physician’s involvement in an incident that may result in liability for us, we review his or her actions and make a prompt determination regarding whether he or she will continue the assignment and whether we will place him or her on future assignments. We also rely on our hospital and healthcare facility clients’ assessment, national database information and the state professional associations’ investigation of incidents involving our clinicians and physicians in determining continued and future assignments.
Regulation
The healthcare industry is subject to extensive and complex federal and state laws and regulations related to professional licensure, conduct of operations, payment for services and payment for referrals. We provide services to our clients on a contract basis and receive payment directly from them. Accordingly, Medicare, Medicaid and managed care reimbursement policies generally do not affect us directly, though reimbursement changes in government programs, particularly Medicare and Medicaid, can and do indirectly affect our business. We continuously monitor legislation and regulatory changes for their potential effect on our business and allocate or redirect resources accordingly.
Some states require state licensure for businesses that employ, assign and/or place healthcare personnel who provide healthcare services at hospitals and other healthcare facilities. We believe we are currently licensed in all states that require such licenses and take measures to ensure compliance with all material state licensure requirements. Our travel nurse and allied healthcare staffing divisions, as well as one of our locum tenens companies, Staff Care, Inc., and 25 of our local staffing offices have all received Joint Commission certification based on a review of our compliance with national standards. AMN Healthcare has also obtained its Credentials Verification Organization certification from the National Committee for Quality Assurance.

8
Most of the clinicians and physicians that we employ or independently contract with are required to be individually licensed or certified under applicable state laws. We believe we take appropriate and reasonable steps to validate that our clinicians and physicians possess all necessary licenses and certifications.
Employees
As of December 31, 2013, we had approximately 1,900 corporate employees. During the fourth quarter of 2013, we had an average of 5,609 nurses, allied and other clinical healthcare professionals contracted to work for us. This does not include our locum tenens, all of whom are independent contractors and not employees.
Additional Information
We incorporated in the state of Delaware on November 10, 1997. We maintain a corporate website at www.amnhealthcare.com. We make available our annual reports on Form 10-K, quarterly reports on Form 10-Q, current reports on Form 8-K and amendments to these reports, as well as other information free of charge through our website as soon as reasonably practicable after being filed with or furnished to the Securities and Exchange Commission (“SEC”). The information found on our website is not part of this Annual Report on Form 10-K or any other report we file with or furnish to the SEC.
Special Note Regarding Forward-Looking Statements
This Annual Report on Form 10-K, including the section entitled “Management’s Discussion and Analysis of Financial Condition and Results of Operations,” contains “forward-looking statements” within the meaning of Section 27A of the Securities Act of 1933, as amended (the “Securities Act”), and Section 21E of the Securities Exchange Act of 1934, as amended (the “Exchange Act”), that are subject to safe harbors under the Securities Act and the Exchange Act. We base these forward-looking statements on our current expectations, estimates, forecasts and projections about future events and the industry in which we operate. Forward-looking statements are identified by words such as “believe,” “anticipate,” “expect,” “intend,” “plan,” “will,” “should,” “would,” “project,” “may,” variations of such words and other similar expressions. In addition, statements that refer to projections of financial items; anticipated growth; future growth and revenue; future economic conditions and performance; plans, objectives and strategies for future operations; and other characterizations of future events or circumstances, are forward-looking statements. Our actual results could differ materially from those discussed in, or implied by, these forward-looking statements. Factors that could cause actual results to differ from those implied by the forward-looking statements in this Annual Report on Form 10-K are described below, elsewhere in this Annual Report on Form 10-K and our other filings with the SEC.
Item 1A. Risk FactorsYou should carefully read the following risk factors in connection with evaluating us and the forward-looking statements
contained in this Annual Report on Form 10-K. Any of the following risks could materially adversely affect our business or our consolidated operating results, financial condition and cash flows, which, in turn, could cause the price of our common stock to decline. The risk factors described below and elsewhere in this Annual Report on Form 10-K are not the only risks we face. Factors we currently do not know, factors that we currently consider immaterial or factors that are not specific to us, such as general economic conditions, may also materially adversely affect our business or our consolidated operating results, financial condition or cash flows. The risk factors described below qualify all forward-looking statements we make, including forward-looking statements within this section entitled “Risk Factors.”
Risk Factors that May Affect the Demand for Our Services Economic downturns and slow recoveries could result in less demand from clients or otherwise negatively affect our clients, either of which could negatively impact our financial condition, results of operations and cash flows.
Demand for staffing services is sensitive to changes in economic activity. As economic activity slows, hospitals and other healthcare entities typically experience decreased attrition and reduce their use of temporary employees before undertaking layoffs of their regular employees, which results in decreased demand for our services. In times of economic downturn and high unemployment rates, permanent full time and part time healthcare facility staff are generally inclined to work more hours and overtime, resulting in fewer available vacancies and less demand for our services. Fewer placement opportunities for our temporary clinicians and physicians also impair our ability to recruit and place them both on a temporary and permanent basis.
Many healthcare facilities utilize temporary clinicians and physicians to accommodate an increase in hospital admissions. Alternatively, when hospital admissions decrease, due to reduced consumer spending, general unemployment causing an
9
increase in under- and uninsured patients and other factors, the demand for our temporary clinicians and physicians typically declines. This may have an even greater negative impact on demand for physicians in certain specialties such as surgery, radiology and anesthesiology. In addition, we may experience more competitive pricing pressure during periods of decreased patient occupancy and hospital admissions, negatively affecting our revenue and profitability.
During challenging economic times, our clients, in particular our clients that rely on state government funding, may face issues gaining access to sufficient credit, which could result in an impairment of their ability to make payments to us, timely or otherwise, for services rendered. If that were to occur, we may increase our allowance for doubtful accounts and our days sales outstanding would be negatively affected. Our business depends upon our ability to maintain and secure existing and new clients because we generally do not have long-term or guaranteed contracts.
We generally do not have long-term or guaranteed order contracts for our recruitment and placement services with our clients. Outside of our managed services and VMS offerings, our hospital, healthcare facility and physician practice group clients are generally free to award contracts to and place orders and new searches with our competitors.
In addition, we provide services to some of our government clients through businesses such as small businesses or minority-owned contractors who have received set-aside awards. These intermediary organizations may negatively affect our ability to obtain new clients and maintain our existing client relationships by impeding our ability to access and contract directly with clients and may also negatively affect the profitability of these client relationships. Consolidation and concentration in buyers of healthcare workforce solutions and staffing services could negatively affect pricing of our services and our ability to mitigate credit risk.
We extend credit and payment terms to our clients. In addition to ongoing credit evaluations of our clients’ financial condition, we traditionally seek to mitigate our credit risk by managing client concentration. We have seen an increase in our clients’ use of intermediaries such as vendor management service companies and group purchasing organizations as well as consolidation of healthcare systems, which may provide these organizations enhanced bargaining power. At the same time, our own success in winning managed services contracts means some larger health systems have grown and may continue to grow substantially relative to our other revenue sources. These dynamics could lead to a greater concentration of buyers of healthcare staffing services and less diversification of our customer base, which could negatively affect pricing for our services and our ability to mitigate credit risk.
One of our managed services program clients within our nurse and allied healthcare staffing segment comprised more than 10% of that segment’s revenue in 2013. If we were to lose that client and were unable to provide a significant amount of services to that client, whether directly or as a subcontractor, such loss may have a material adverse effect on our nurse and allied healthcare staffing segment. If we are unable to quickly respond to changing marketplace conditions, such as alternative modes of healthcare delivery, reimbursement and client needs, we may not remain competitive.
The settings for the delivery of patient services continually evolve and implicate alternative modes of healthcare delivery, such as telemedicine. Government mandates, third-party reimbursements and the public’s adoption and demand for such new modes of healthcare delivery may negatively affect our clients’ demand for our services, which, in turn, could negatively affect our revenue, results of operations and cash flows.
Our success depends upon our ability to quickly adapt to changing marketplace conditions and client needs. The success of new service lines and business models will depend on many factors, including our ability to properly anticipate and satisfy client needs, quickly come into compliance with new federal or state regulations, and differentiate our services and abilities from those of our competitors. Moreover, our competition may respond more quickly to new or emerging client needs and marketplace conditions. The development of these service lines and business models requires close attention to emerging trends and proposed federal and state legislation related to the healthcare industry. If we are unable to anticipate changing marketplace conditions, adapt our current business model to adequately meet changing conditions in the healthcare industry and develop and successfully implement innovative services, we may not remain competitive. The ability of our clients to retain and increase the productivity of their permanent staff or their ability to increase the efficiency and effectiveness of their internal recruiting efforts, through online recruiting or otherwise, may affect the demand for our services, which could negatively affect our revenue, results of operation and cash flows.

10
If our clients retain and increase the productivity of their permanent clinical staff, their need for our recruitment and placement services for temporary positions may decline. Higher permanent staff retention rates and increased productivity of permanent staff members could result in increased efficiencies, thereby reducing the demand for both our recruitment and placement services for temporary positions, which could negatively affect our revenue, results of operation and cash flows. Additionally, many of our clients maintain internal recruitment functions of various degrees of sophistication for their staffing needs. If such clients are able to successfully increase the efficiency and effectiveness of their internal recruiting efforts, through more effective internet- or social media-based recruiting or otherwise, it could reduce the demand for our permanent and temporary staffing services, which could negatively affect our revenue, results of operation and cash flows.
Regulatory and Legal Risk Factors We are subject to federal and state healthcare industry regulation including professional licensure, conduct of operations, and costs and payment for services and payment for referrals as well as laws regarding employment practices and government contracting.
The healthcare industry is subject to extensive and complex federal and state laws and regulations related to professional licensure, conduct of operations, costs and payment for services and payment for referrals. We provide workforce solutions and services on a contract basis to our clients, who pay us directly. Accordingly, Medicare, Medicaid and insurance reimbursement policy changes generally do not directly impact us. Nevertheless, reimbursement changes in government programs, particularly Medicare and Medicaid, can and do indirectly affect the demand and the prices paid for our services. For example, our clients could receive reduced or no reimbursements because of a change in the rates or conditions set by federal or state governments, which would negatively affect the demand and the prices for our services. In addition, our hospital, healthcare facility and physician practice group clients could suffer civil and criminal penalties, and be excluded from participating in Medicare, Medicaid and other healthcare programs for failure to comply with applicable laws and regulations, which may negatively affect our profitability.
A significant portion of our hospital and healthcare facility clients are state and federal government agencies, where our ability to compete for new contracts and orders, and the profitability of these contracts and orders, may be affected by government legislation, regulation or policy. Additionally, in providing services to state and federal government clients and to clients who participate in state and federal programs, we are also subject to specific laws and regulations, which government agencies have broad latitude to enforce. If we were to be excluded from participation in these programs or should there be regulatory or policy changes or modification of application of existing regulations, it would likely materially adversely affect our business and our consolidated operating results, financial condition and cash flows.
The success of our business depends on our ability to quickly and efficiently obtain licenses and privileges for our clinicians and physicians in the various jurisdictions and settings in which we operate. The costs to comply and obtain the necessary licensure may impact the revenue and profitability of our business.
We are also subject to certain laws and regulations applicable to recruitment and placement agencies. Like all employers, we must also comply with various laws and regulations relating to employment and pay practices. There is a risk that we could be subject to payment of additional wages, insurance and employment and payroll-related taxes. Because of the nature of our business, the impact of these employment and payroll laws and regulations may have a more pronounced effect on our business. These laws and regulations may also impede our ability to grow the size and profitability of our operations. Legislation regarding the current delivery and third party payor system for healthcare may have significant and unforeseeable effects on our business.
The PPACA was signed into law on March 23, 2010. The PPACA was subsequently amended on March 30, 2010 by the Reconciliation Act. The PPACA and Reconciliation Act (collectively, the “Act”) entail sweeping health care reforms with staggered effective dates from 2010 through 2018, and many provisions in the Act require the issuance of additional guidance from the U.S. Department of Labor, the IRS, the U.S. Department of Health & Human Services, and the states.
Beginning in 2014, a number of key provisions of the Act take effect including, the establishment of state insurance exchanges (“Exchanges”), insurance market reforms and the imposition of excise taxes on the health insurance industry and reinsurance taxes on insurers and third party administrators. Collectively, these items have the potential to significantly change the insurance marketplace and how employers provide insurance to employees.
Although the “pay or play” penalties on large employers have been delayed until 2015, in future periods, the effects of the Act may result in increased costs to us. Additionally, contractual arrangements and competitive market conditions may limit or delay our ability to increase our prices to offset any associated potential increased costs.

11
The challenge to the classification of certain of our healthcare professionals as independent contractors could adversely affect our profitability.
We treat physicians and certain advanced practitioners, such as certified nurse anesthetists, nurse practitioners and physician assistants, as independent contractors. Federal or state taxing authorities may take the position that such professionals are employees exposing us to additional wage and insurance claims, and employment and payroll-related taxes. A reclassification of our locum tenens clinicians and physicians to employees from independent contractors could result in liability that would have a significant negative impact on the profitability of the period in which assessed, and would require changes to our payroll and related business processes, which could be costly. In addition, many states have laws that prohibit non-physician owned companies from employing physicians, referred to as the “corporate practice of medicine.” If our independent contractor physicians were classified as employees in states that prohibit the corporate practice of medicine, we may be prohibited from conducting our locum tenens staffing business in those states under our current business model, which may have a substantial negative effect on our revenue, results of operations and profitability.
Medical malpractice, violation of employment and wage regulations and other claims asserted against us could subject us to substantial liabilities.
We, along with our clients, clinicians and physicians are subject to investigations, claims and legal actions alleging malpractice or related legal theories. At times, plaintiffs name us in these lawsuits and actions regardless of our contractual obligations, the competency of the clinicians and physicians, the standard of care provided by the clinicians and physicians, the quality of service that we provided or our actions. In certain instances, we are contractually required to indemnify our clients against some or all of these potential legal actions. Additionally, we may be subject to various employment claims, including wage and hour claims, by our corporate employees and our employed clinicians. We are also subject to possible claims alleging discrimination, sexual harassment and other similar activities in which we or our hospital and healthcare facility clients and their agents have allegedly engaged.
We maintain various types of insurance coverage, including professional liability and employment practices, through insurance carriers, and/or we self-insure for these claims through accruals for retention reserves. However, the cost of defending such claims, even if groundless, could be substantial and the associated negative publicity could adversely affect our ability to attract, retain and place qualified employees, clinicians and physicians in the future. We may also experience increased insurance costs and reserve accruals and may not be able to pass on all or any portion of increased insurance costs to our clients, thereby reducing our profitability. Additionally, our insurance coverage and reserve accruals may not be sufficient to cover all claims against us.
We are also subject to exam from various federal and state taxation authorities from time to time and an unforeseen negative outcome from such an exam could have a negative impact on our financial position, results of operations and cash flow.
Risk Factors Related to Our Operations, Personnel and Information Systems Our inability to implement new infrastructure and technology systems may adversely affect our operating results and ability to manage our business effectively.
We have technology, operations and human capital infrastructures to support our existing business. We must continue to invest in these infrastructures including implementing new operating and front and back office technology systems to support our growth and improve our efficiency, and have embarked on a five-year plan to upgrade and convert our infrastructure, back office and front office network platforms. Implementing new systems is costly and involves risks inherent in the conversion to a new technology platform, including loss of information, disruption to our normal operations, changes in accounting procedures and internal control over financial reporting, as well as problems achieving accuracy in the conversion of electronic data. Failure to properly or adequately address these issues could result in increased costs, the diversion of management’s and employees’ attention and resources and could materially adversely affect our operating results, internal controls over financial reporting and ability to manage our business effectively. Technology disruptions and obsolescence may negatively affect our business operations.
Our ability to deliver services to our clients and to manage our internal systems depends largely upon our access to and the performance of our management information and communications systems, including our VMS and other client/clinician-facing self-service websites. These technology systems also maintain accounting and financial information, upon which we depend to fulfill our financial reporting obligations. Although we have risk mitigation measures, these systems, and our access to these systems, are not impervious to floods, fire, storms, or other natural disasters, or service interruptions. Additionally,
12
these systems are subject to other non-environmental risks, including technological obsolescence and lack of strategic alignment with our evolving business. We have embarked on a five-year plan to update and align our technology with our current and future business needs. If our current or planned systems do not adequately support our operations, are damaged or disrupted or if we are unable to replace, repair, maintain or expand them, it may adversely affect our business operations and our profitability. If we do not continue to recruit and retain sufficient quality clinicians and physicians at reasonable costs, it could increase our operating costs and negatively affect our business and our profitability.
We rely significantly on our ability to recruit and retain a sufficient number of clinicians and physicians who possess the skills, experience and licenses necessary to meet the requirements of our clients. We compete with healthcare staffing companies, recruitment and placement agencies, including online staffing and recruitment agencies, and with hospitals, healthcare facilities and physician practice groups to attract clinicians and physicians based on the quantity, diversity and quality of assignments offered, compensation packages and the benefits that we provide. We rely on our human capital intensive, relationship-oriented approach and national infrastructure to enable us to compete in all aspects of our business, but particularly in the physician permanent placement business. We must continually evaluate and expand our temporary and permanent healthcare professional network to serve the needs of our clients.
Our ability to recruit and retain temporary and permanent clinicians and physicians depends on several factors, including our ability to provide our clinicians and physicians with assignments and placements that they view as attractive and to provide competitive compensation packages. The costs of attracting clinicians and physicians and providing them with attractive compensation packages may be higher than we anticipate, or we may be unable to pass these costs on to our hospital and healthcare facility clients, which may reduce our profitability. Moreover, if we are unable to recruit temporary and permanent clinicians and physicians, our service execution may deteriorate and, as a result, we could lose clients. The inability to properly screen and match quality clinicians and physicians with suitable placements may negatively affect demand for our services.
Our success depends on the quality of our clinicians and physicians. A quality or licensure issue could adversely affect our business, client demand for our services, and potential for growth for us and our sector. Our ability to ensure the quality of our clinicians and physicians relies heavily on the effectiveness of our data and communication systems as well as properly trained and competent operational employees that screen and match clinicians and physicians in suitable placements. An inability to properly screen, match, and monitor clinicians and physicians for acceptable credentials, experience, and performance may cause clients to lose confidence in our services, which may damage our reputation and result in clients opting to utilize competitors’ services or rely on their own internal resources. Our operations may deteriorate if we are unable to continue to attract, develop and retain our sales and operations team members.
Our success depends heavily upon the performance of our sales and operations team members. The number of individuals who meet our qualifications for these positions is limited, and we may experience difficulty in attracting qualified candidates. In addition, we commit substantial resources to the training, development and support of our team members. Competition for qualified sales team members in the line of business in which we operate is strong, and we may not be able to retain some of our sales team members after we have expended the time and expense to recruit and train them. The loss of key officers and management personnel could adversely affect our business and operating results.
We believe that the success of our business strategy and our ability to maintain our recent levels of profitability depends on the continued employment of our senior management team. We have an employment agreement with Susan R. Salka, our President and Chief Executive Officer, through May 4, 2015, which is renewable on an annual basis. Other senior members of the team are employees at will with standard severance agreements. If members of our senior management team become unable or unwilling to continue in their present positions, our business and financial results could be adversely affected.
Our inability to maintain the positive brand identities that we have developed and acquired may adversely affect our results of operations.
We have invested substantial amounts in acquiring, developing and maintaining our brands, and our success depends substantially on our ability to maintain positive brand identities for existing services and effectively building up brand image for new services. We cannot assure that additional expenditures and our continuing commitment to marketing and improving our brands will have the desired effect on our brands’ value, which may adversely affect our results of operations.
13
We maintain a substantial amount of goodwill and indefinite lived intangibles on our balance sheet that may decrease our earnings or increase our losses if we recognize an impairment to goodwill or indefinite lived intangibles.
We maintain goodwill on our balance sheet, which represents the excess of the total purchase price of our acquisitions over the fair value of the net assets and indefinite lived intangibles we acquired. We evaluate goodwill and indefinite lived intangibles for impairment annually, or when evidence of potential impairment exists. If we identify an impairment, we record a charge to earnings. An impairment charge to goodwill or indefinite lived intangibles would decrease our earnings or increase our losses, as the case may be, which may adversely affect the price of our common stock.
Risk Factors Related to Our Indebtedness and Other Liabilities We have substantial accruals for self-insured retentions and unrecognized tax benefits on our balance sheet, and any significant adverse adjustments in these accruals may decrease our earnings or increase our losses and negatively impact our cash flow.
We maintain accruals for self-insured retentions for professional liability, health insurance, workers compensation and other employment practices related matters on our balance sheet. A significant increase to these self-insured retention accruals may decrease our earnings. We determine the adequacy of our self-insured retention accruals by evaluating our historical experience and trends, related to both insurance claims and payments, information provided to us by our insurance brokers, attorneys, third party administrators, actuarial firms and tax advisors as well as industry experience and trends. If such information collectively indicates that our accruals are overstated or understated, we reduce or provide for additional accruals, as appropriate.
In addition, we maintain an unrecognized tax benefits accrual related to certain income tax positions that we have taken. As of December 31, 2013, the unrecognized tax benefits including interest and penalties was $27.2 million. Adjustments in the amount or nature of accruals for tax matters may negatively impact our financial results and, if there are payments to governmental agencies associated with these tax positions, our cash flow.
Our level of indebtedness could adversely affect our future financial condition.
We are party to a credit agreement, which contains various financial covenants, restricts the payment of dividends, and limits the amount of repurchases of our common stock. As of December 31, 2013, our term loans outstanding, net of discount, equaled $148.7 million.
Our indebtedness could have a material adverse effect on our financial condition by, among other things:
• increasing our vulnerability to a downturn in general economic conditions or to increases in interest rates, particularly with respect to the portion of our outstanding debt that is subject to variable interest rates;
• potentially limiting our ability to obtain additional financing or to obtain such financing on favorable terms;
• causing us to dedicate a portion of future cash flow from operations to service or pay down our debt, which reduces the cash available for other purposes, such as operations, capital expenditures, and future business opportunities; and
• possibly limiting our ability to adjust to changing market conditions and placing us at a competitive disadvantage compared to our competitors who may be less leveraged.
Our ability to service our indebtedness will depend on our ability to generate cash in the future. We cannot assure you that our business will generate sufficient cash flow from operations or that future borrowings will be available in an amount sufficient to enable us to service our indebtedness or to fund other liquidity needs. Additionally, if we are not in compliance with the covenants in our credit agreement, we would be in default, and the lenders could call the debt, which would have a material adverse effect on our business.
Item 1B. Unresolved Staff Comments
None.
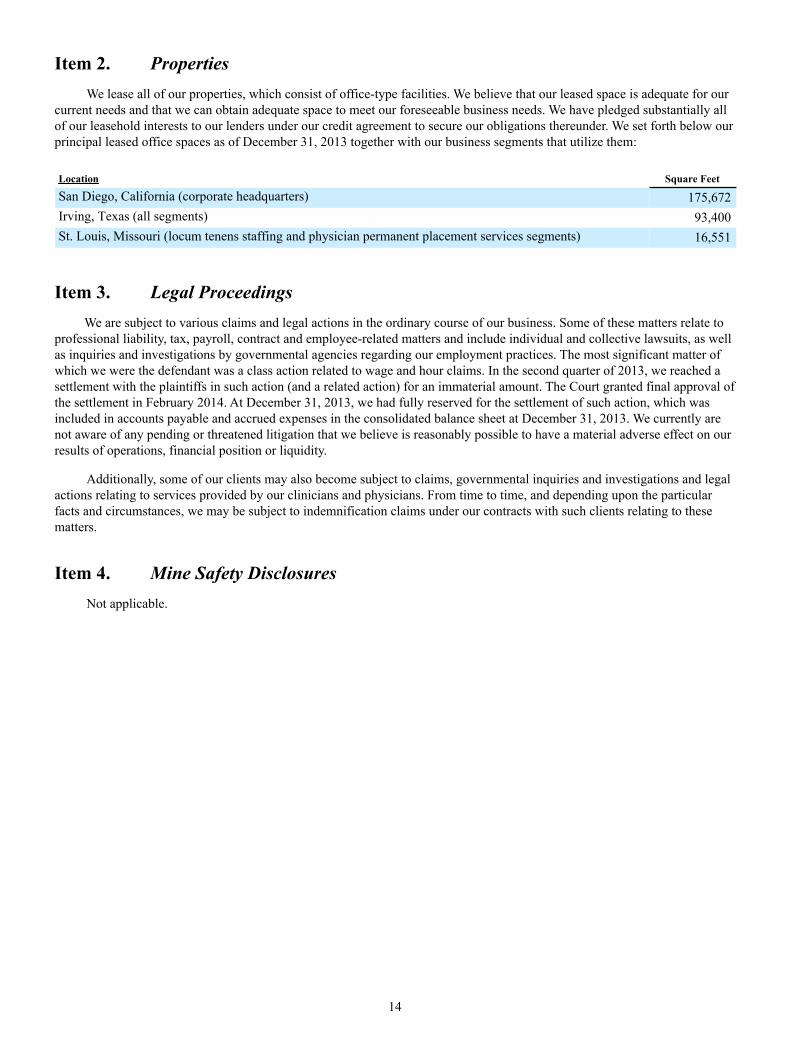
14
Item 2. Properties
We lease all of our properties, which consist of office-type facilities. We believe that our leased space is adequate for our current needs and that we can obtain adequate space to meet our foreseeable business needs. We have pledged substantially all of our leasehold interests to our lenders under our credit agreement to secure our obligations thereunder. We set forth below our principal leased office spaces as of December 31, 2013 together with our business segments that utilize them:
Location Square Feet
San Diego, California (corporate headquarters) 175,672Irving, Texas (all segments) 93,400St. Louis, Missouri (locum tenens staffing and physician permanent placement services segments) 16,551
Item 3. Legal Proceedings We are subject to various claims and legal actions in the ordinary course of our business. Some of these matters relate to professional liability, tax, payroll, contract and employee-related matters and include individual and collective lawsuits, as well as inquiries and investigations by governmental agencies regarding our employment practices. The most significant matter of which we were the defendant was a class action related to wage and hour claims. In the second quarter of 2013, we reached a settlement with the plaintiffs in such action (and a related action) for an immaterial amount. The Court granted final approval of the settlement in February 2014. At December 31, 2013, we had fully reserved for the settlement of such action, which was included in accounts payable and accrued expenses in the consolidated balance sheet at December 31, 2013. We currently are not aware of any pending or threatened litigation that we believe is reasonably possible to have a material adverse effect on our results of operations, financial position or liquidity.
Additionally, some of our clients may also become subject to claims, governmental inquiries and investigations and legal actions relating to services provided by our clinicians and physicians. From time to time, and depending upon the particular facts and circumstances, we may be subject to indemnification claims under our contracts with such clients relating to these matters.
Item 4. Mine Safety Disclosures
Not applicable.

15
PART II
Item 5. Market For Registrant’s Common Equity, Related Stockholder Matters and Issuer Purchases of Equity Securities
Our common stock trades on the New York Stock Exchange under the symbol “AHS.” The last reported sale of our
common stock on February 18, 2014 on the New York Stock Exchange was $14.11 per share. The following table sets forth, for the periods indicated, the high and low sales prices reported by the New York Stock Exchange.
Sales Price High Low
Year Ended December 31, 2013First Quarter $ 15.94 $ 10.34Second Quarter $ 15.91 $ 12.29Third Quarter $ 16.20 $ 13.50Fourth Quarter $ 14.88 $ 11.30
Year Ended December 31, 2012First Quarter $ 6.35 $ 3.86Second Quarter $ 7.68 $ 5.45Third Quarter $ 10.07 $ 5.50Fourth Quarter $ 12.17 $ 9.49
During the quarter ended December 31, 2013, neither we nor any “affiliated purchaser” on our behalf repurchased any
shares of our common stock. During the fiscal year ended December 31, 2013, we did not sell any equity securities that were not registered under the Securities Act.
As of February 18, 2014, there were 29 stockholders of record of our common stock, one of which was Cede & Co., a nominee for Depository Trust Company. All of our common stock held by brokerage firms, banks and other financial institutions as nominees for beneficial owners are considered to be held of record by Cede & Co., who is considered to be one stockholder of record. A substantially greater number of holders of our common stock are “street name” or beneficial holders, whose shares are held of record by banks, brokers and other financial institutions. Because such shares are held on behalf of stockholders, and not by the stockholders directly, and because a stockholder can have multiple positions with different brokerage firms, banks and other financial institutions, we are unable to determine the total number of stockholders we have without undue time and expense.
We have not paid any dividends on our common stock in the past and currently do not expect to pay cash dividends or make any other distributions on common stock in the future. We expect to retain our future earnings, if any, for use in the operation and expansion of our business and to pay down debt. Any future determination to pay dividends on common stock will be at the discretion of our board of directors and will depend upon our financial condition, results of operations, capital requirements and such other factors as the board deems relevant. In addition, our ability to declare and pay dividends on our common stock is subject to covenants restricting such actions in our credit agreement. See “Item 7. Management’s Discussion and Analysis of Financial Condition and Results of Operations—Liquidity and Capital Resources.”
The information required by Item 201(d) of Regulation S-K is incorporated by reference to the table regarding compensation plans under which our equity securities are authorized for issuance set forth in Part III, Item 12 entitled “Security Ownership of Certain Beneficial Owners and Management and Related Stockholder Matters” below.
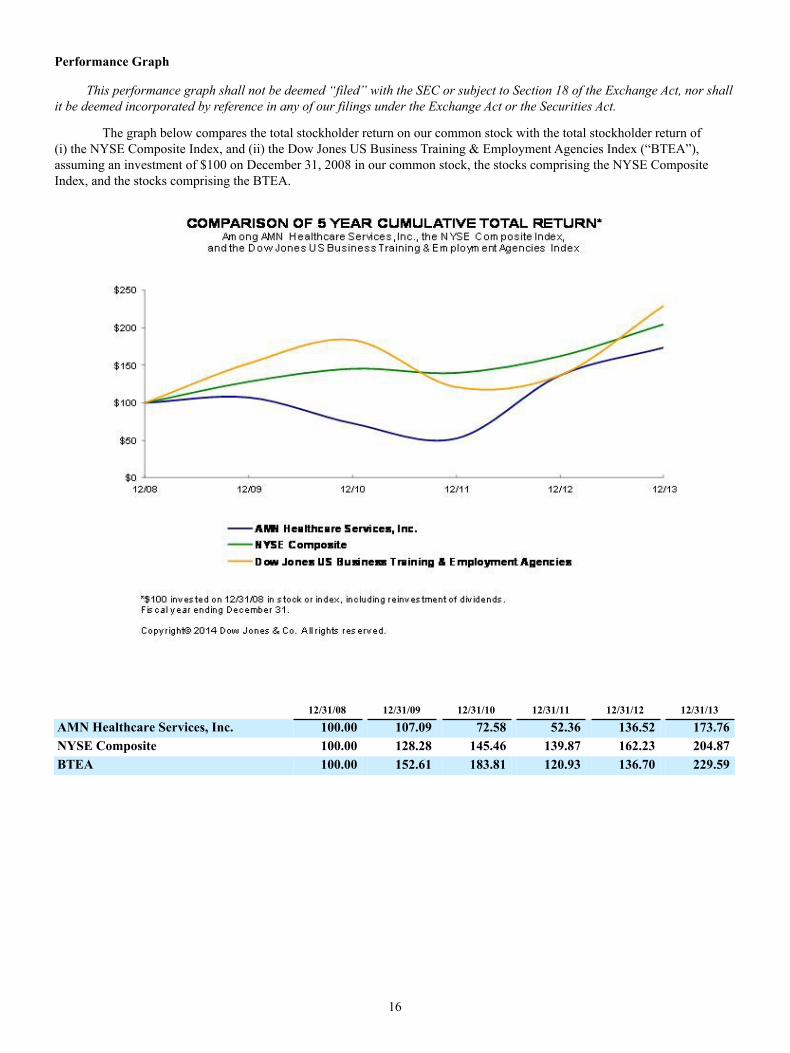
16
Performance Graph
This performance graph shall not be deemed “filed” with the SEC or subject to Section 18 of the Exchange Act, nor shall it be deemed incorporated by reference in any of our filings under the Exchange Act or the Securities Act.
The graph below compares the total stockholder return on our common stock with the total stockholder return of (i) the NYSE Composite Index, and (ii) the Dow Jones US Business Training & Employment Agencies Index (“BTEA”), assuming an investment of $100 on December 31, 2008 in our common stock, the stocks comprising the NYSE Composite Index, and the stocks comprising the BTEA.
12/31/08 12/31/09 12/31/10 12/31/11 12/31/12 12/31/13
AMN Healthcare Services, Inc. 100.00 107.09 72.58 52.36 136.52 173.76NYSE Composite 100.00 128.28 145.46 139.87 162.23 204.87BTEA 100.00 152.61 183.81 120.93 136.70 229.59
17
Item 6. Selected Financial Data
You should read the selected financial and operating data presented below in conjunction with “Item 7. Management’s Discussion and Analysis of Financial Condition and Results of Operations” and “Item 8. Financial Statements and Supplementary Data” below. We derive our statements of operations data for the years ended December 31, 2013, 2012 and 2011, and the balance sheet data at December 31, 2013 and 2012 from the audited financial statements included elsewhere in this Annual Report on Form 10-K. We derive the statements of operations data for the years ended December 31, 2010 and 2009 and the balance sheet data at December 31, 2011, 2010 and 2009 from audited financial statements of ours that do not appear herein.
We completed our acquisition of NF Investors, Inc., a Delaware corporation (“NFI”), the parent company of Medfinders, on September 1, 2010. Accordingly, the consolidated statement of operations for the year ended December 31, 2010 includes the result of operations of NFI since the date of acquisition. Our acquisition of NFI in September 2010 affects the comparability of the selected financial data of the pre-acquisition time period and post-acquisition time period.
During the fourth quarter of 2011, we decided to divest our home healthcare services segment. Accordingly, we classify the home healthcare services segment as a disposal group held for sale as of December 31, 2011 and its results of operations as discontinued operations for the years ended December 31, 2012, 2011 and 2010, the only three years in which we maintained a home healthcare services segment. We completed the sale of this segment in January 2012.
We completed our acquisition of ShiftWise on November 20, 2013. Accordingly, the consolidated statement of operations for the year ended December 31, 2013 includes the result of operations of ShiftWise since the date of acquisition.
We have not paid any cash dividends during the past five fiscal years.
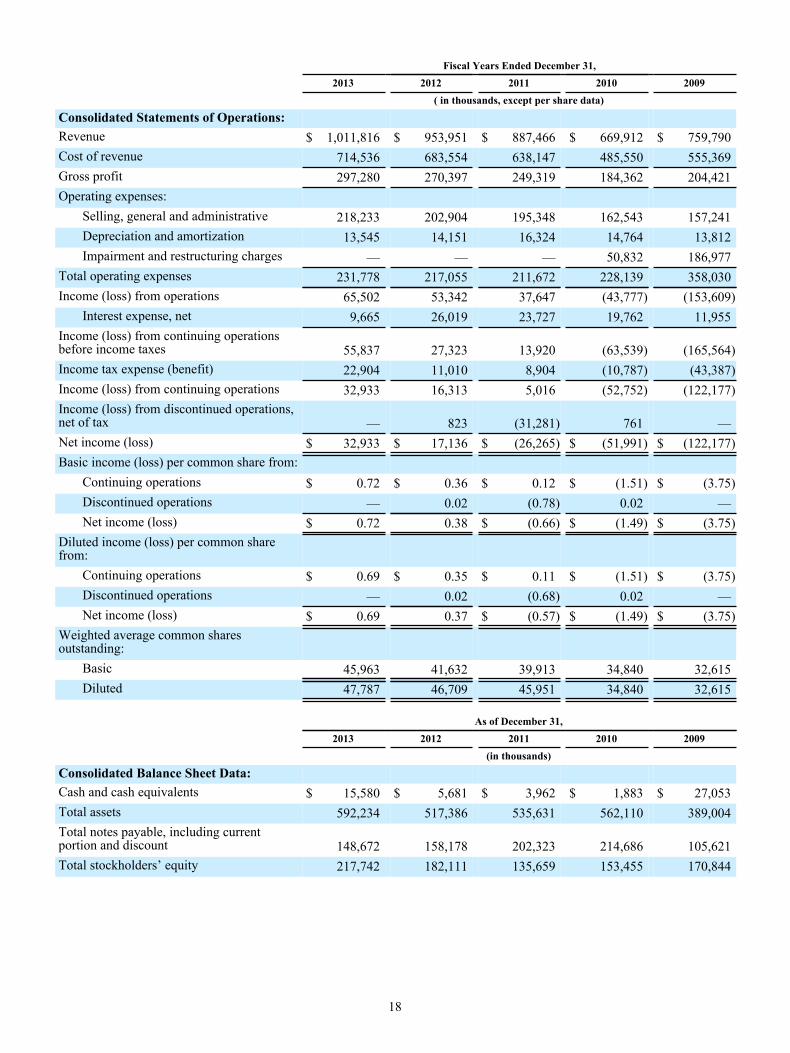
18
Fiscal Years Ended December 31, 2013 2012 2011 2010 2009 ( in thousands, except per share data)
Consolidated Statements of Operations:Revenue $ 1,011,816 $ 953,951 $ 887,466 $ 669,912 $ 759,790Cost of revenue 714,536 683,554 638,147 485,550 555,369Gross profit 297,280 270,397 249,319 184,362 204,421Operating expenses:
Selling, general and administrative 218,233 202,904 195,348 162,543 157,241Depreciation and amortization 13,545 14,151 16,324 14,764 13,812Impairment and restructuring charges — — — 50,832 186,977
Total operating expenses 231,778 217,055 211,672 228,139 358,030Income (loss) from operations 65,502 53,342 37,647 (43,777) (153,609)
Interest expense, net 9,665 26,019 23,727 19,762 11,955Income (loss) from continuing operationsbefore income taxes 55,837 27,323 13,920 (63,539) (165,564)Income tax expense (benefit) 22,904 11,010 8,904 (10,787) (43,387)Income (loss) from continuing operations 32,933 16,313 5,016 (52,752) (122,177)Income (loss) from discontinued operations,net of tax — 823 (31,281) 761 —Net income (loss) $ 32,933 $ 17,136 $ (26,265) $ (51,991) $ (122,177)Basic income (loss) per common share from:
Continuing operations $ 0.72 $ 0.36 $ 0.12 $ (1.51) $ (3.75)Discontinued operations — 0.02 (0.78) 0.02 —Net income (loss) $ 0.72 0.38 $ (0.66) $ (1.49) $ (3.75)
Diluted income (loss) per common sharefrom:
Continuing operations $ 0.69 $ 0.35 $ 0.11 $ (1.51) $ (3.75)Discontinued operations — 0.02 (0.68) 0.02 —Net income (loss) $ 0.69 0.37 $ (0.57) $ (1.49) $ (3.75)
Weighted average common sharesoutstanding:
Basic 45,963 41,632 39,913 34,840 32,615Diluted 47,787 46,709 45,951 34,840 32,615
As of December 31, 2013 2012 2011 2010 2009 (in thousands)
Consolidated Balance Sheet Data:Cash and cash equivalents $ 15,580 $ 5,681 $ 3,962 $ 1,883 $ 27,053Total assets 592,234 517,386 535,631 562,110 389,004Total notes payable, including currentportion and discount 148,672 158,178 202,323 214,686 105,621Total stockholders’ equity 217,742 182,111 135,659 153,455 170,844
19
Item 7. Management’s Discussion and Analysis of Financial Condition and Results of Operations
You should read the following discussion in conjunction with our consolidated financial statements and the notes thereto
and other financial information included elsewhere in this Annual Report on Form 10-K. Certain statements in this “Management’s Discussion and Analysis (“MD&A”) of Financial Condition and Results of Operations” are “forward-looking statements.” See “Special Note Regarding Forward-Looking Statements” under Item 1, “Business.” We intend this MD&A section to provide you with a narrative from the perspective of our management on our financial condition, results of operations, liquidity and certain other factors that may affect our future results. The following sections comprise this MD&A:
• Overview
• Management Initiatives
• Recent Trends
• Critical Accounting Policies and Estimates
• Results of Operations
• Liquidity and Capital Resources
• Contractual Obligations
• Off-Balance Sheet and Other Financing Arrangements
• Potential Fluctuations in Quarterly Results and Seasonality
• Inflation
• Recent Accounting Pronouncements
Overview
We are the innovator in healthcare workforce solutions and staffing services to healthcare facilities across the nation. As an innovative workforce solutions partner, our managed services programs, vendor management solutions, recruitment process outsourcing, and recruitment and placement of physicians, nurses and allied healthcare professionals into temporary and permanent positions enable our clients to successfully reduce complexity, increase efficiency and improve patient outcomes within the rapidly evolving healthcare environment. Our clients include acute and sub-acute care hospitals, government facilities, community health centers and clinics, physician practice groups, and several other healthcare-related settings. Our clients utilize our workforce solutions and healthcare staffing services to manage their temporary and permanent clinical workforce needs in an economically beneficial manner. Our managed services programs and vendor management solutions enable healthcare organizations to increase their efficiency by managing all of their clinical supplemental workforce needs through one company or technology.
We conduct business through three reportable segments: nurse and allied healthcare staffing, locum tenens staffing and physician permanent placement services. For the year ended December 31, 2013, we recorded revenue of $1,011.8 million, as compared to revenue of $954.0 million for 2012. We recorded net income of $32.9 million for 2013, as compared to $17.1 million for 2012.
Nurse and allied healthcare staffing segment revenue comprised 68% and 69% of total consolidated revenue for the years ended December 31, 2013 and 2012, respectively. Through our nurse and allied healthcare staffing segment, we provide hospital and other healthcare facilities with a range of clinical workforce solutions, including: (1) a comprehensive managed services solution in which we manage all of the temporary nursing and allied staffing needs of a client; (2) a SaaS VMS through which our clients can manage all of their temporary nursing and allied staffing needs; (3) traditional clinical staffing solutions of variable assignment lengths; and (4) a recruitment process outsourcing program that leverages our expertise and support systems to replace or complement a client’s existing internal recruitment function for permanent placement needs.
Locum tenens staffing segment revenue comprised 28% and 27% of total consolidated revenue for the years ended December 31, 2013 and 2012, respectively. Through our locum tenens staffing segment, we provide (1) a comprehensive managed services solution in which we manage all of the locum tenens needs of a client; (2) a SaaS VMS through which our clients can manage all of their locum tenens needs and (3) place physicians of all specialties, as well as dentists and other advanced practice providers with clients on a temporary basis as independent contractors. These locum tenens are used by our
20
healthcare facility and physician practice group clients to fill temporary vacancies created by vacation and leave schedules and to bridge the gap while they seek permanent candidates or explore expansion. Our locum tenens clients represent a diverse group of healthcare organizations throughout the United States, including hospitals, health systems, medical groups, occupational medical clinics, psychiatric facilities, government institutions and insurance entities. The professionals we place are recruited nationwide and are typically placed on multi-week contracts with assignment lengths ranging from a few days up to one year.
Physician permanent placement services segment revenue comprised 4% of total consolidated revenue for each of the years ended December 31, 2013 and 2012. Through our physician permanent placement services segment, we assist hospitals, healthcare facilities and physician practice groups throughout the United States in identifying and recruiting physicians for permanent placement. We perform the vast majority of our services on a retained basis through our Merritt Hawkins® brand, for which we are generally paid through a blend of retained search fees and variable fees tied to work performed and successful placement. To a smaller degree, we also perform our services on a contingent basis, exclusively through our Kendall & Davis® brand, for which fees are paid once physician candidates are ultimately hired by our clients. Our broad specialty offerings include over 70 specialist and sub-specialist opportunities such as internal medicine, family practice and orthopedic surgery.
We completed the sale of our home healthcare services segment in January 2012. Accordingly, we classified the home healthcare services segment as a disposal group held for sale as of December 31, 2011 and its results of operations as discontinued operations for the years ended December 31, 2012 and 2011.
We completed our acquisition of ShiftWise on November 20, 2013. Accordingly, the consolidated statement of operations for the year ended December 31, 2013 includes the results of operations of ShiftWise since the date of its acquisition.
Management Initiatives
Our growth strategy focuses on providing an innovative and differentiated value and experience to our clients, clinicians and physicians. To accomplish this, we have broadened our service offerings beyond our traditional travel nurse and allied temporary staffing, locum tenens staffing, and physician permanent placement services, to include more strategic and recurring revenue sources from innovative workforce solutions offerings such as managed services programs, VMS and RPO. Through these differentiated services, we have built strategic relationships with our clients to assist them in improving their financial, operational and patient care results through productivity and candidate quality enhancements. We continually seek strategic opportunities to expand into complementary service offerings that leverage our core capabilities of recruiting and credentialing clinicians and physicians, while providing a more recurring stream of revenue that reduces our exposure to economic cycle risk. At the same time, we continue to invest in our innovative workforce solutions, new candidate recruitment initiatives and technology infrastructure to ensure we are strategically ready in the long term to capitalize on the demand growth anticipated from the significant healthcare workforce shortages due to healthcare reform and the aging population.
Recent Trends
Early into 2014, demand in our travel nursing division has improved from mid-year levels, although overall demand is currently trending at levels below prior year. Our allied business is experiencing relatively stable demand levels across all modalities. We believe the lack of significant demand growth is resulting from a combination of factors including weaker inpatient hospital admissions, reimbursement cuts, and tight spending controls from hospitals due to the uncertainty of near-term impacts from implementation of the PPACA.
We continue to see clients migrate to managed services program relationships, and during the year ended December 31, 2013, revenue from these contracts represented approximately 40% of our nurse and allied healthcare staffing segment revenue. With the inclusion of ShiftWise in this operating segment and continued penetration of managed service programs, we expect that revenue attributable to our workforce solutions will continue to grow. As a result of these managed services relationships, we have an improved ability to fill more of the demand and create operational efficiencies. Although our gross margins have improved throughout 2013, we are experiencing an increase in insurance and housing rent costs as a constrained rental market continues to drive rates higher. We have partially mitigated this impact by contracting with new lower cost rental properties and through bill rate increases.
In our locum tenens staffing segment, our managed services program offering is growing as we add new clients and increase penetration with existing clients.
21
Throughout 2013 and into 2014, we have experienced increased demand for our services within our physician permanent placement services segment. We have also seen an increase in our recruiter productivity completing those searches, which has translated into improved profitability.
Critical Accounting Policies and Estimates
The preparation of our consolidated financial statements in conformity with United States generally accepted accounting principles requires us to make estimates and judgments that affect our reported amounts of assets and liabilities, revenue and expenses, and related disclosures of contingent assets and liabilities. On an ongoing basis, we evaluate our estimates, including those related to asset impairment, accruals for self-insurance and compensation and related benefits, revenue recognition, accounts receivable, contingencies and litigation, valuation and recognition of share-based payments, and income taxes. We base these estimates on the information that is currently available to us and on various other assumptions that we believe are reasonable under the circumstances. Actual results could vary from these estimates under different assumptions or conditions. We believe that the following critical accounting policies affect the more significant judgments and estimates used in the preparation of our consolidated financial statements:
Goodwill and Indefinite-lived Intangible Assets
Our business acquisitions typically result in the recording of goodwill and other intangible assets, and the recorded values of those assets may become impaired in the future. The determination of the value of such intangible assets requires management to make estimates and assumptions that affect our consolidated financial statements. For intangible assets purchased in a business combination, the estimated fair values of the assets received are used to establish their recorded values. In accordance with accounting guidance on goodwill and other intangible assets, we perform annual impairment analysis to assess the recoverability of the goodwill and indefinite-lived intangible assets. We assess the impairment of goodwill of our reporting units and indefinite-lived intangible assets annually, or more often if events or changes in circumstances indicate that the carrying value may not be recoverable. We may first assess qualitative factors to determine whether it is more likely than not that the fair value of a reporting unit is less than its carrying amount. If, after assessing the totality of events and circumstances, we determine that it is more likely than not that the fair value of the reporting unit is greater than its carrying amount, the quantitative impairment test is unnecessary. If the reporting unit does not pass the qualitative assessment, then the reporting unit’s carrying value is compared to its fair value. The fair values of the reporting units are estimated using market and discounted cash flow approaches. Goodwill is considered impaired if the carrying value of the reporting unit exceeds its fair value. Application of the goodwill impairment test requires judgment, including the identification of reporting units, assignment of assets and liabilities to reporting units, assignment of goodwill to reporting units, and determination of the fair value of each reporting unit. Valuation techniques consistent with the market approach and income approach are used to measure the fair value of each reporting unit. Significant judgments are required to estimate the fair value of reporting units including estimating future cash flows, and determining appropriate discount rates, growth rates, company control premium and other assumptions. Changes in these estimates and assumptions could materially affect the determination of fair value for each reporting unit.
We experienced declines in home healthcare revenue subsequent to the acquisition of NFI due to federal and state reimbursement rate and funding pressures, such that during the third quarter of 2011, we lowered our projected near-term growth rate in the home healthcare services segment. The revised growth rate triggered interim impairment testing on the home healthcare services segment, which was also the reporting unit, as of August 31, 2011. The performance of the test involves a two-step process. The first step of the impairment test involves comparing the fair value of the reporting unit with the reporting unit’s carrying amount, including goodwill. We determined the fair value of the reporting unit using a combination of the income approach (using discounted future cash flows) and the market valuation approach. If the carrying amount of the reporting unit exceeds the reporting unit’s fair value, we perform the second step of the goodwill impairment test to determine the amount of impairment loss. The second step of the goodwill impairment test involves comparing the implied fair value of our reporting unit’s goodwill based on a number of factors, including the implied discount rate, with the carrying amount of that goodwill. During the third quarter of 2011, we completed the first step of our goodwill impairment testing, which indicated that the fair value of our home healthcare services reporting unit was lower than its carrying value. The decrease in value was due to lower projected near-term growth rates in the home healthcare industry, lowering the anticipated growth trend used for goodwill impairment testing. We recognized a preliminary pre-tax goodwill impairment charge of approximately $24.5 million during the third quarter of 2011, which represented management’s best estimate of the goodwill impairment based on the fair value analysis completed to date. During the fourth quarter of 2011, we finalized the interim valuation of our identified tangible and intangible assets and liabilities for purposes of determining the implied fair value of goodwill and determined there was no further impairment of goodwill at that time. We included the goodwill impairment charges in loss from discontinued operations on the consolidated statement of comprehensive loss for the year ended December 31, 2011. During the fourth quarter of 2011, we performed our annual impairment test as of October 31, 2011 and determined there was no impairment of our goodwill. In addition, during the third quarter of 2011, as a result of lowering our projected near-term growth rate in the home healthcare

22
services segment, we recorded a preliminary pre-tax impairment charge of $6.7 million, which related to an indefinite-lived intangible asset shared by the nurse staffing reporting unit and home healthcare services reporting unit. During the fourth quarter of 2011, we performed our annual impairment testing and recorded an additional impairment charge of $7.7 million as a result of the January 2012 sale of the home healthcare business, which further impaired the above indefinite-lived asset. We included the intangible asset charges in loss from discontinued operations on the consolidated statement of comprehensive loss for the year ended December 31, 2011.
We performed the annual impairment test at October 31, 2012 and determined there was no impairment of goodwill and indefinite-lived intangible assets.
We performed the annual impairment test at October 31, 2013 and determined there was no impairment of goodwill and indefinite-lived intangible assets. We assessed qualitative factors to determine whether it is more likely than not that the fair value of a reporting unit and indefinite-lived intangible assets are less than their carrying amount. As a result of the qualitative assessments, we determined that it is more likely than not that the fair value of the reporting units and indefinite-lived intangible assets are greater than their carrying amounts and there was no impairment of goodwill and indefinite-lived intangible assets. No events or circumstances have occurred subsequent to October 31, 2013 that indicate that impairment may have occurred.
Intangible assets with estimable useful lives are required to be amortized over their respective estimated useful lives and reviewed for impairment whenever events or changes in circumstances indicate that the carrying amount may not be recoverable. An impairment evaluation is based on an undiscounted cash flow analysis at the lowest level at which cash flows of the long-lived assets are largely independent of other groups of assets and liabilities. We assess potential impairments to intangible assets when there is evidence that events or changes in circumstances indicate that the carrying amount of an asset or asset group may not be recovered. Our judgments regarding the existence of impairment indicators and future cash flows related to intangible assets are based on operational performance of our businesses, market conditions and other factors. Although there are inherent uncertainties in this assessment process, the estimates and assumptions we use, including estimates of future cash flows, volumes, market penetration and discount rates, are consistent with our internal planning. If these estimates or their related assumptions change in the future, we may be required to record an impairment charge on all or a portion of our long-lived intangible assets. Furthermore, we cannot predict the occurrence of future impairment-triggering events nor the impact such events might have on our reported asset values. Future events could cause us to conclude that impairment indicators exist and that long-lived intangible assets associated with our acquired businesses are impaired. Any resulting impairment loss could have an adverse impact on our results of operations. We have analyzed our amortizable long-lived assets for impairment and determined that there is no impairment for the years ended December 31, 2013 and 2012.
Professional Liability Reserve
We maintain an accrual for professional liability self-insured retention limits that we include in accounts payable and accrued expenses and other long-term liabilities in our consolidated balance sheets. We determine the adequacy of this undiscounted accrual by evaluating our historical experience and trends, loss reserves established by our insurance carriers, management and third party administrators, as well as by analyzing independent actuarial studies. We obtain actuarial studies on a semi-annual basis that use our historical claims data and industry data to assist us in determining the adequacy of our reserves each year.
In November 2012, we established a captive insurance subsidiary, which provides coverage, on an occurrence basis, for professional liability within our nurse and allied healthcare staffing segment. Liabilities include provisions for estimated losses incurred but not yet reported (“IBNR”), as well as provisions for known claims. IBNR reserve estimates involve the use of assumptions and are primarily based upon historical loss experience, industry data and other actuarial assumptions. We maintain excess insurance coverage for losses above the per occurrence retention.
Workers Compensation Reserve
We maintain an accrual for workers compensation self-insured retention limits, which we include in accrued compensation and benefits and other long-term liabilities in our consolidated balance sheets. We determine the adequacy of these undiscounted accruals by evaluating our historical experience and trends, loss reserves established by our insurance carriers and third party administrators, as well as by analyzing independent actuarial studies. We obtain updated actuarial studies on a semi-annual basis that use our payroll and actual claims data, as well as industry data, to determine the appropriate reserves for each policy year. The actuarial study for workers compensation provides us with the estimated losses for prior policy years and an estimated percentage of payroll compensation to be accrued for the current year. We record our accruals based on the amounts provided in the actuarial study, which we believe is the best estimate of our liability.

23
Revenue Recognition
Revenue consists of fees earned from the permanent and temporary placement of clinicians and physicians. We recognize revenue when earned and realizable. We have contracts with healthcare organizations to provide managed services programs. Under these contract arrangements, we use our temporary clinicians along with those of third party subcontractors to fulfill customer orders. If we use subcontractors, we record revenue net of related subcontractors expense. The resulting net revenue represents the administrative fee we charge for our managed services programs. We generally pay the subcontractor after we receive payment from the customer. We record subcontractor accounts receivable from the client in the consolidated balance sheets. We include payables to subcontractors in accounts payable and accrued expenses in the consolidated balance sheets.
Accounts Receivable
We record accounts receivable at the invoiced amount. Accounts receivable are non-interest bearing. We maintain an allowance for doubtful accounts for estimated credit losses resulting from collection risk, including the inability of our customers to make required payments under contractual agreements. We report the allowance for doubtful accounts as a reduction of accounts receivable in our consolidated balance sheets. We determine the adequacy of this allowance by evaluating historical delinquency and write-off trends, the financial condition and credit risk and history of each customer, historical payment trends as well as the current economic conditions and the impact of such conditions on our customers’ liquidity and overall financial condition. If the financial condition of our customers deteriorates, affecting their ability to make payments, additional allowances would be provided. We also maintain a sales allowance to reserve for potential credits issued to customers. We determine the amount of the reserve based on historical credits issued.
Contingent Liabilities
We are subject to various claims and legal actions in the ordinary course of our business. Some of these matters relate to professional liability, tax, payroll, contract and employee-related matters and include individual and collective lawsuits, as well as inquiries and investigations by governmental agencies regarding our employment practices. The most significant matter of which we were the defendant during 2013 was a class action related to wage and hour claims. In the second quarter of 2013, we reached a settlement with the plaintiffs in such action (and a related action) for an immaterial amount. The Court granted final approval of the settlement in February 2014. At December 31, 2013, we had fully reserved for the settlement of such action, which we included in accounts payable and accrued expenses in the consolidated balance sheet at December 31, 2013. We currently are not aware of any pending or threatened litigation that we believe is reasonably possible to have a material adverse effect on our results of operations, financial position or liquidity.
Additionally, some of our clients may also become subject to claims, governmental inquiries and investigations and legal actions relating to services provided by our clinicians and physicians. From time to time, and depending upon the particular facts and circumstances, we may be subject to indemnification obligations under our contracts with such clients relating to these matters.
Staff Care, Inc., an indirect wholly-owned subsidiary of the Company, was the subject of an assessment by the California Employment Development Department (“EDD”) with respect to the payment of certain payroll-related taxes in connection with locum tenens and allied providers, for the period between April 1, 2001 and June 30, 2007. We appealed the EDD’s assessment, but made a payment to the EDD in the amount of $2.3 million on September 5, 2008 to cease the accrual of interest during the pendency of the appeal. On March 28, 2012, we and the EDD entered into a settlement agreement, which resolved all assessments and claims regarding the subject matter of the appeal from April 1, 2001 through June 30, 2007. In connection with the settlement, the EDD refunded to us $2.0 million of the $2.3 million payment made by us on September 5, 2008. As a result, we recorded a $2.0 million benefit offsetting selling, general and administrative (“SG&A”) expenses for the year ended December 31, 2012.
Share-Based Payments
All share-based payments, including grants of stock options, stock appreciation rights, restricted stock units and performance restricted stock units, are recognized in our financial statements based upon their respective grant date fair values. We expense the estimated fair value of share-based awards over the requisite employee service period, which is the vesting period. We amortize the fair value of equity awards granted on a straight-line basis over the requisite service periods of the awards. The measurement of share-based compensation cost is based on several criteria including, but not limited to, the valuation model used and associated input factors such as expected term of the award, our stock price volatility, dividend rate, risk free interest rate, and award forfeiture rate. The input factors used in the valuation model are based on subjective future expectations combined with management judgment. We use historical data to estimate pre-vesting equity award forfeitures and record share-based compensation expense only for those awards that we expect to vest. The excess tax benefits recognized in

24
equity related to equity award exercises are reflected as cash inflows from financing activities in the consolidated statements of cash flows. There is a corresponding cash outflow from operating activities for excess tax benefits in the consolidated statements of cash flows.
Income Taxes
The objectives of accounting for income taxes are to recognize the amount of taxes payable or refundable for the current year and deferred tax liabilities and assets for the future tax consequences of events that have been recognized in an entity’s financial statements or tax returns. In assessing the realizability of deferred tax assets, we consider whether it is more likely than not that some portion or all of the deferred tax assets will not be realized. The ultimate realization of deferred tax assets is dependent upon the generation of future taxable income during the periods in which those temporary differences become deductible.
We consider the scheduled reversal of deferred tax liabilities (including the impact of available carryback and carryforward periods), projected future taxable income, and tax-planning strategies in making this assessment. We evaluate our unrecognized tax benefits in accordance with the guidance for accounting for uncertainty in income taxes. We recognize the tax benefit from an uncertain tax position only if it is more likely than not that the tax position will be sustained on examination by the taxing authorities, based on the technical merits of the position. The tax benefits recognized in the financial statements from such a position are measured based on the largest benefit that has a greater than 50% likelihood of being realized upon ultimate settlement. Guidance is also provided for recognition of income tax assets and liabilities, classification of current and deferred income tax assets and liabilities, accounting for interest and penalties associated with tax positions, and income tax disclosures. Judgment is required in assessing the future tax consequences of events that have been recognized in our financial statements or tax returns. Variations in the actual outcome of these future tax consequences could materially affect our results of operations.
Results of Operations
The following table sets forth, for the periods indicated, certain statements of operations data as a percentage of revenue. Our results of operations include three reportable segments: (1) nurse and allied healthcare staffing; (2) locum tenens staffing; and (3) physician permanent placement services. Our historical results are not necessarily indicative of our results of operations to be expected in the future.
Years Ended December 31, 2013 2012 2011
Consolidated Statements of Operations:Revenue 100.0 % 100.0 % 100.0 %Cost of revenue 70.6 71.7 71.9Gross profit 29.4 28.3 28.1Selling, general and administrative 21.6 21.3 22.0Depreciation and amortization 1.3 1.5 1.8Income from operations 6.5 5.5 4.2Interest expense, net 1.0 2.7 2.7Income from continuing operations before income taxes 5.5 2.8 1.5Income tax expense 2.3 1.2 1.0Income from continuing operations 3.2 1.6 0.5Income (loss) from discontinued operations, net of tax — 0.1 (3.5)Net income (loss) 3.2 % 1.7 % (3.0) %
Comparison of Results for the Year Ended December 31, 2013 to the Year Ended December 31, 2012
Revenue. Revenue increased 6% to $1,011.8 million for 2013 from $954.0 million for 2012, as a result of higher
revenue in all three of our reportable segments.
Nurse and allied healthcare staffing segment revenue increased 4% to $682.0 million for 2013 from $653.8 million for 2012. The increase was primarily attributable to a 2% increase in the average number of clinicians on assignment, which was driven by increased travel nurse volume and increased volume of electronic medical record engagements during 2013, with the
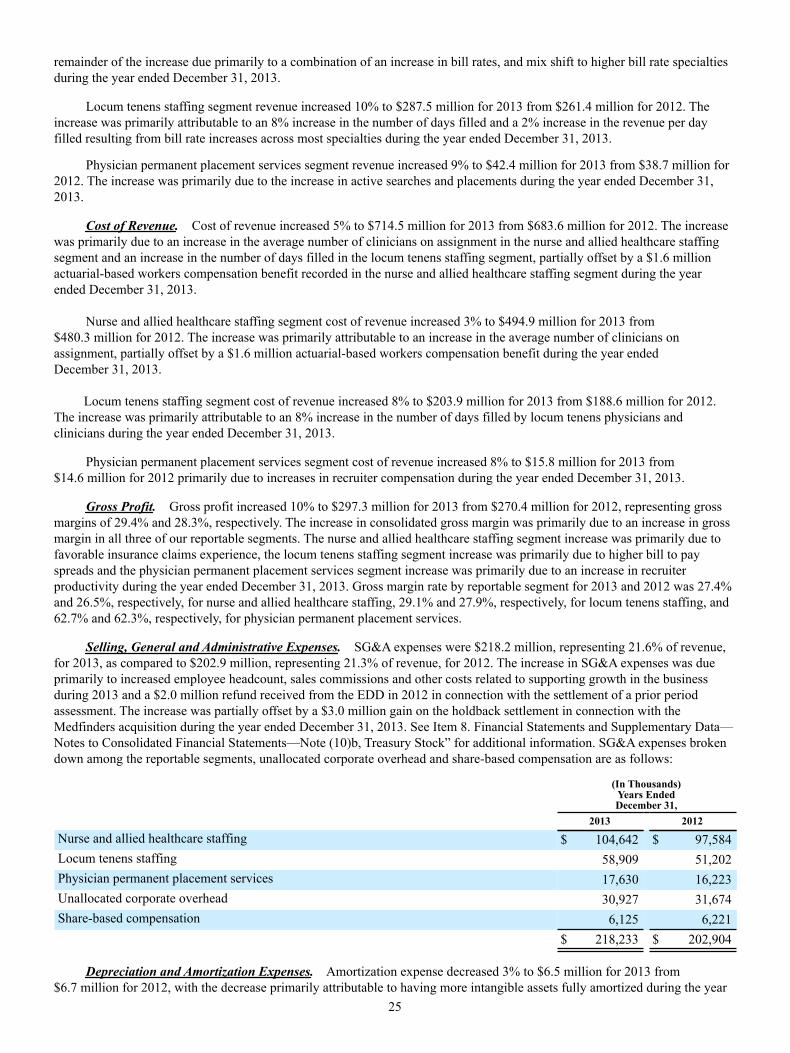
25
remainder of the increase due primarily to a combination of an increase in bill rates, and mix shift to higher bill rate specialties during the year ended December 31, 2013.
Locum tenens staffing segment revenue increased 10% to $287.5 million for 2013 from $261.4 million for 2012. The increase was primarily attributable to an 8% increase in the number of days filled and a 2% increase in the revenue per day filled resulting from bill rate increases across most specialties during the year ended December 31, 2013.
Physician permanent placement services segment revenue increased 9% to $42.4 million for 2013 from $38.7 million for 2012. The increase was primarily due to the increase in active searches and placements during the year ended December 31, 2013.
Cost of Revenue. Cost of revenue increased 5% to $714.5 million for 2013 from $683.6 million for 2012. The increase was primarily due to an increase in the average number of clinicians on assignment in the nurse and allied healthcare staffing segment and an increase in the number of days filled in the locum tenens staffing segment, partially offset by a $1.6 million actuarial-based workers compensation benefit recorded in the nurse and allied healthcare staffing segment during the year ended December 31, 2013.
Nurse and allied healthcare staffing segment cost of revenue increased 3% to $494.9 million for 2013 from $480.3 million for 2012. The increase was primarily attributable to an increase in the average number of clinicians on assignment, partially offset by a $1.6 million actuarial-based workers compensation benefit during the year ended December 31, 2013.
Locum tenens staffing segment cost of revenue increased 8% to $203.9 million for 2013 from $188.6 million for 2012. The increase was primarily attributable to an 8% increase in the number of days filled by locum tenens physicians and clinicians during the year ended December 31, 2013.
Physician permanent placement services segment cost of revenue increased 8% to $15.8 million for 2013 from $14.6 million for 2012 primarily due to increases in recruiter compensation during the year ended December 31, 2013.
Gross Profit. Gross profit increased 10% to $297.3 million for 2013 from $270.4 million for 2012, representing gross margins of 29.4% and 28.3%, respectively. The increase in consolidated gross margin was primarily due to an increase in gross margin in all three of our reportable segments. The nurse and allied healthcare staffing segment increase was primarily due to favorable insurance claims experience, the locum tenens staffing segment increase was primarily due to higher bill to pay spreads and the physician permanent placement services segment increase was primarily due to an increase in recruiter productivity during the year ended December 31, 2013. Gross margin rate by reportable segment for 2013 and 2012 was 27.4% and 26.5%, respectively, for nurse and allied healthcare staffing, 29.1% and 27.9%, respectively, for locum tenens staffing, and 62.7% and 62.3%, respectively, for physician permanent placement services.
Selling, General and Administrative Expenses. SG&A expenses were $218.2 million, representing 21.6% of revenue, for 2013, as compared to $202.9 million, representing 21.3% of revenue, for 2012. The increase in SG&A expenses was due primarily to increased employee headcount, sales commissions and other costs related to supporting growth in the business during 2013 and a $2.0 million refund received from the EDD in 2012 in connection with the settlement of a prior period assessment. The increase was partially offset by a $3.0 million gain on the holdback settlement in connection with the Medfinders acquisition during the year ended December 31, 2013. See Item 8. Financial Statements and Supplementary Data—Notes to Consolidated Financial Statements—Note (10)b, Treasury Stock” for additional information. SG&A expenses broken down among the reportable segments, unallocated corporate overhead and share-based compensation are as follows:
(In Thousands)Years EndedDecember 31,
2013 2012
Nurse and allied healthcare staffing $ 104,642 $ 97,584Locum tenens staffing 58,909 51,202Physician permanent placement services 17,630 16,223Unallocated corporate overhead 30,927 31,674Share-based compensation 6,125 6,221
$ 218,233 $ 202,904
Depreciation and Amortization Expenses. Amortization expense decreased 3% to $6.5 million for 2013 from $6.7 million for 2012, with the decrease primarily attributable to having more intangible assets fully amortized during the year

26
ended December 31, 2013. Depreciation expense decreased 7% to $7.0 million for 2013 from $7.5 million for 2012, with the decrease primarily attributable to having more fixed assets fully depreciated for the year ended December 31, 2013.
Interest Expense, Net. Interest expense, net, was $9.7 million for 2013 as compared to $26.0 million for 2012. The decrease was primarily attributable to a $9.8 million loss on debt extinguishment recorded during the year ended December 31, 2012 and a lower average debt outstanding balance and lower interest rate for the year ended December 31, 2013.
Income Tax Expense. We recorded an income tax expense of $22.9 million for 2013 from continuing operations as compared to $11.0 million for 2012, reflecting effective income tax rates of 41.0% and 40.3% for these periods, respectively. The difference in the effective income tax rate was primarily attributable to the relationship of pre-tax income to permanent differences. See additional information in “Item 8. Financial Statements and Supplementary Data—Notes to Consolidated Financial Statements—Note 7, Income Taxes.”
Income From Discontinued Operations. We recorded no income from discontinued operations for the year ended December 31, 2013. For the year ended December 31, 2012, income from discontinued operations of $0.8 million was comprised of a $1.2 million gain on sale, net of tax, and a $0.4 million loss from discontinued operations, net of tax. See additional information in “Item 8. Financial Statements and Supplementary Data—Notes to Consolidated Financial Statements—Note 2, Discontinued Operations.”
Comparison of Results for the Year Ended December 31, 2012 to the Year Ended December 31, 2011
Revenue. Revenue increased 7% to $954.0 million for 2012 from $887.5 million for 2011, primarily due to higher revenue in the nurse and allied healthcare staffing segment, partially offset by lower revenue in the locum tenens staffing segment.
Nurse and allied healthcare staffing segment revenue increased 15% to $653.8 million for 2012 from $570.7 million for 2011. The increase was primarily attributable to a 10% increase in the average number of clinicians on assignment, with the reminder of the increase due primarily to a combination of an increase in bill rates, and mix shift to higher bill rate specialties and an extra billable day during the year ended December 31, 2012.
Locum tenens staffing segment revenue decreased 6% to $261.4 million for 2012 from $277.9 million for 2011. The decrease was primarily attributable to an 8% decline in the number of days filled and an increasing percentage of our days filled being attributable to lower bill rate specialties, partially offset by an increase in the average bill rate across most specialties.
Physician permanent placement services segment revenue decreased slightly to $38.7 million for 2012 from $38.9 million for 2011. Revenue without the impact of deferred revenue accounting changes implemented in 2011 was up 9% over prior year due to the increases in new searches and placements.
Cost of Revenue. Cost of revenue increased 7% to $683.6 million for 2012 from $638.1 million for 2011. The increase was primarily due to an increase in the average number of clinicians on assignment in the nurse and allied healthcare staffing segment.
Nurse and allied healthcare staffing segment cost of revenue increased 15% to $480.3 million for 2012 from $417.6 million for 2011. The increase was primarily attributable to a 10% increase in the average number of clinicians on assignment for the year ended December 31, 2012 and a $2.0 million actuarial-based workers compensation benefit recorded during the year ended December 31, 2011.
Locum tenens staffing segment cost of revenue decreased 9% to $188.6 million for 2012 from $206.2 million for 2011. The decrease was primarily attributable to an 8% decline in the number of days filled by locum tenens physicians and clinicians and a decrease in our housing and travel cost per day filled.
Physician permanent placement services segment cost of revenue increased slightly to $14.6 million for 2012 from $14.4 million for 2011 primarily due to increases in travel expenses and recruiter compensation.
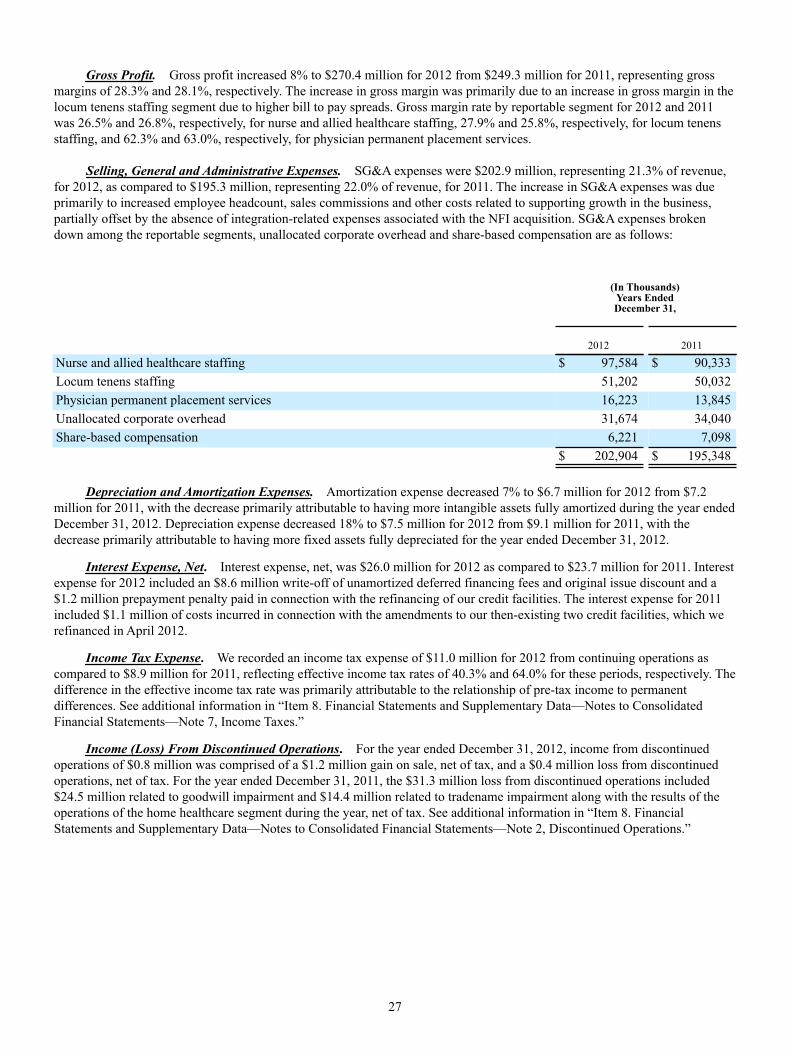
27
Gross Profit. Gross profit increased 8% to $270.4 million for 2012 from $249.3 million for 2011, representing gross margins of 28.3% and 28.1%, respectively. The increase in gross margin was primarily due to an increase in gross margin in the locum tenens staffing segment due to higher bill to pay spreads. Gross margin rate by reportable segment for 2012 and 2011 was 26.5% and 26.8%, respectively, for nurse and allied healthcare staffing, 27.9% and 25.8%, respectively, for locum tenens staffing, and 62.3% and 63.0%, respectively, for physician permanent placement services.
Selling, General and Administrative Expenses. SG&A expenses were $202.9 million, representing 21.3% of revenue,
for 2012, as compared to $195.3 million, representing 22.0% of revenue, for 2011. The increase in SG&A expenses was due primarily to increased employee headcount, sales commissions and other costs related to supporting growth in the business, partially offset by the absence of integration-related expenses associated with the NFI acquisition. SG&A expenses broken down among the reportable segments, unallocated corporate overhead and share-based compensation are as follows:
(In Thousands)Years EndedDecember 31,
2012 2011
Nurse and allied healthcare staffing $ 97,584 $ 90,333Locum tenens staffing 51,202 50,032Physician permanent placement services 16,223 13,845Unallocated corporate overhead 31,674 34,040Share-based compensation 6,221 7,098 $ 202,904 $ 195,348
Depreciation and Amortization Expenses. Amortization expense decreased 7% to $6.7 million for 2012 from $7.2 million for 2011, with the decrease primarily attributable to having more intangible assets fully amortized during the year ended December 31, 2012. Depreciation expense decreased 18% to $7.5 million for 2012 from $9.1 million for 2011, with the decrease primarily attributable to having more fixed assets fully depreciated for the year ended December 31, 2012.
Interest Expense, Net. Interest expense, net, was $26.0 million for 2012 as compared to $23.7 million for 2011. Interest expense for 2012 included an $8.6 million write-off of unamortized deferred financing fees and original issue discount and a $1.2 million prepayment penalty paid in connection with the refinancing of our credit facilities. The interest expense for 2011 included $1.1 million of costs incurred in connection with the amendments to our then-existing two credit facilities, which we refinanced in April 2012.
Income Tax Expense. We recorded an income tax expense of $11.0 million for 2012 from continuing operations as compared to $8.9 million for 2011, reflecting effective income tax rates of 40.3% and 64.0% for these periods, respectively. The difference in the effective income tax rate was primarily attributable to the relationship of pre-tax income to permanent differences. See additional information in “Item 8. Financial Statements and Supplementary Data—Notes to Consolidated Financial Statements—Note 7, Income Taxes.”
Income (Loss) From Discontinued Operations. For the year ended December 31, 2012, income from discontinued operations of $0.8 million was comprised of a $1.2 million gain on sale, net of tax, and a $0.4 million loss from discontinued operations, net of tax. For the year ended December 31, 2011, the $31.3 million loss from discontinued operations included $24.5 million related to goodwill impairment and $14.4 million related to tradename impairment along with the results of the operations of the home healthcare segment during the year, net of tax. See additional information in “Item 8. Financial Statements and Supplementary Data—Notes to Consolidated Financial Statements—Note 2, Discontinued Operations.”
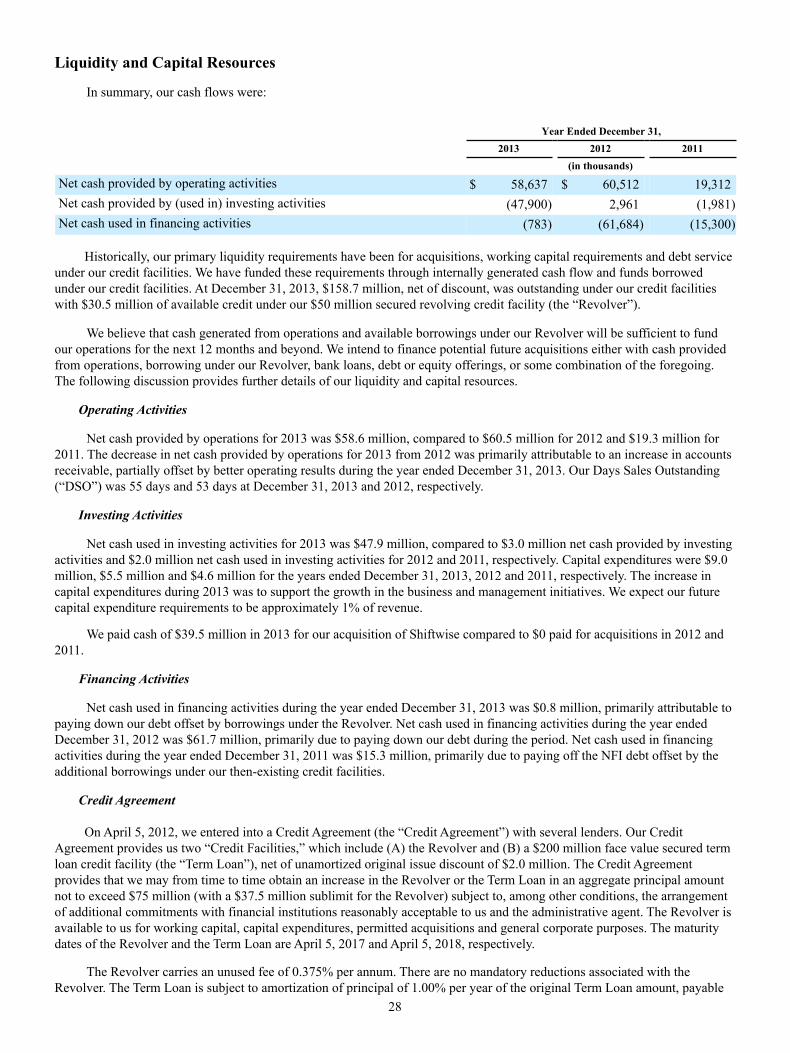
28
Liquidity and Capital Resources
In summary, our cash flows were:
Year Ended December 31, 2013 2012 2011 (in thousands)
Net cash provided by operating activities $ 58,637 $ 60,512 19,312Net cash provided by (used in) investing activities (47,900) 2,961 (1,981)Net cash used in financing activities (783) (61,684) (15,300)
Historically, our primary liquidity requirements have been for acquisitions, working capital requirements and debt service under our credit facilities. We have funded these requirements through internally generated cash flow and funds borrowed under our credit facilities. At December 31, 2013, $158.7 million, net of discount, was outstanding under our credit facilities with $30.5 million of available credit under our $50 million secured revolving credit facility (the “Revolver”).
We believe that cash generated from operations and available borrowings under our Revolver will be sufficient to fund our operations for the next 12 months and beyond. We intend to finance potential future acquisitions either with cash provided from operations, borrowing under our Revolver, bank loans, debt or equity offerings, or some combination of the foregoing. The following discussion provides further details of our liquidity and capital resources.
Operating Activities
Net cash provided by operations for 2013 was $58.6 million, compared to $60.5 million for 2012 and $19.3 million for 2011. The decrease in net cash provided by operations for 2013 from 2012 was primarily attributable to an increase in accounts receivable, partially offset by better operating results during the year ended December 31, 2013. Our Days Sales Outstanding (“DSO”) was 55 days and 53 days at December 31, 2013 and 2012, respectively.
Investing Activities
Net cash used in investing activities for 2013 was $47.9 million, compared to $3.0 million net cash provided by investing activities and $2.0 million net cash used in investing activities for 2012 and 2011, respectively. Capital expenditures were $9.0 million, $5.5 million and $4.6 million for the years ended December 31, 2013, 2012 and 2011, respectively. The increase in capital expenditures during 2013 was to support the growth in the business and management initiatives. We expect our future capital expenditure requirements to be approximately 1% of revenue.
We paid cash of $39.5 million in 2013 for our acquisition of Shiftwise compared to $0 paid for acquisitions in 2012 and 2011.
Financing Activities
Net cash used in financing activities during the year ended December 31, 2013 was $0.8 million, primarily attributable to paying down our debt offset by borrowings under the Revolver. Net cash used in financing activities during the year ended December 31, 2012 was $61.7 million, primarily due to paying down our debt during the period. Net cash used in financing activities during the year ended December 31, 2011 was $15.3 million, primarily due to paying off the NFI debt offset by the additional borrowings under our then-existing credit facilities.
Credit Agreement
On April 5, 2012, we entered into a Credit Agreement (the “Credit Agreement”) with several lenders. Our Credit Agreement provides us two “Credit Facilities,” which include (A) the Revolver and (B) a $200 million face value secured term loan credit facility (the “Term Loan”), net of unamortized original issue discount of $2.0 million. The Credit Agreement provides that we may from time to time obtain an increase in the Revolver or the Term Loan in an aggregate principal amount not to exceed $75 million (with a $37.5 million sublimit for the Revolver) subject to, among other conditions, the arrangement of additional commitments with financial institutions reasonably acceptable to us and the administrative agent. The Revolver is available to us for working capital, capital expenditures, permitted acquisitions and general corporate purposes. The maturity dates of the Revolver and the Term Loan are April 5, 2017 and April 5, 2018, respectively.
The Revolver carries an unused fee of 0.375% per annum. There are no mandatory reductions associated with the Revolver. The Term Loan is subject to amortization of principal of 1.00% per year of the original Term Loan amount, payable

29
in equal quarterly installments. The voluntary prepayments we made during 2012 satisfied all scheduled quarterly principal amortization payments due under the Credit Facilities through the remaining term of the Credit Agreement.
The Credit Agreement contains various customary affirmative and negative covenants, including restrictions on assumption of additional indebtedness, declaration and payment of dividends, dispositions of assets, consolidation into another entity, capital expenditures in excess of specified amounts and allowable investments. It also contains financial covenants that require us (1) not to exceed a certain maximum consolidated leverage ratio and (2) to maintain a minimum consolidated interest coverage ratio. We were in compliance with these requirements as of December 31, 2013.
We entered into the First Amendment to Credit Agreement (the “First Amendment”), which became effective on April 9, 2013. For more detail regarding the terms of the First Amendment, please see “Item 8. Financial Statements and Supplementary Data—Notes to Consolidated Financial Statements—Note 8, Notes Payable and Related Credit Agreement.”
Borrowings Under Credit Facilities
As of December 31, 2013 and 2012, the total of our Term Loan outstanding (including both the current and long-term portions), net of discount, was $148.7 million and $158.2 million, respectively. As of December 31, 2013, there was $10 million outstanding under the Revolver. At December 31, 2012, there were no amounts outstanding under the Revolver.
Financing Costs Under Credit Facilities
In connection with the First Amendment, we incurred approximately $0.9 million in deferred financing fees, of which $0.3 million were capitalized and are amortized to interest expense over the term of the Credit Agreement and the remaining amount was recorded as interest expense in April 2013. In addition, in April 2013, we wrote off to interest expense $0.4 million of unamortized deferred financing fees and original issue discount resulting from the First Amendment.
Letters of Credit
At December 31, 2013, we maintained outstanding standby letters of credit totaling $27.7 million as collateral in relation to our professional liability insurance agreements, workers compensation insurance agreements, and a corporate office lease agreement. Of the $27.7 million outstanding letters of credit, we have cash collateralized $18.2 million and the remaining amount has been collateralized by the Revolver. Outstanding standby letters of credit at December 31, 2012 totaled $31.9 million.
Contractual Obligations
The following table summarizes our contractual obligations as of December 31, 2013 (in thousands):
Fiscal Year 2014 2015 2016 2017 2018 Thereafter Total
Notes payable (1) $ 5,611 $ 5,611 $ 5,611 $ 5,611 $ 151,080 $ — $ 173,524Capital lease obligations (2) 542 2 — — — — 544Operating lease obligations (3) 14,534 13,679 11,311 10,869 6,194 — 56,587Total contractual obligations $ 20,687 $ 19,292 $ 16,922 $ 16,480 $ 157,274 $ — $ 230,655
(1) Amounts represent contractual amounts due under the Term Loan, including interest calculated on rate in effect at
December 31, 2013. The voluntary prepayments we made during 2012 have satisfied all scheduled quarterly principal amortization payments due under the Credit Facilities through the term of the Credit Agreement.
(2) Amounts represent contractual amounts due, including interest, with initial or remaining lease terms in excess of one year.
(3) Amounts represent minimum contractual amounts, with initial or remaining lease terms in excess of one year. We have assumed no escalations in rent or changes in variable expenses other than as stipulated in lease contracts. The amounts have not been reduced by minimum sublease rents of $0.2 million expected to be recovered under operating subleases.
In addition to the above disclosed contractual obligations, the unrecognized income tax benefits, including interest and penalties, was $27.2 million at December 31, 2013. Based on the uncertainties associated with the settlement of these items, we are unable to make reasonably reliable estimates of the period of potential settlements, if any, with taxing authorities. Increases to the accrual may decrease our earnings and cash flow may be negatively impacted if there are payments associated with these reserves.

30
Off-Balance Sheet and Other Financing Arrangements
At December 31, 2013 and 2012, we did not have any material relationships with unconsolidated entities or financial partnerships, such as entities often referred to as structured finance, variable interest or special purpose, which would have been established for the purpose of facilitating off-balance-sheet arrangements or other contractually narrow or limited purposes. In addition, we do not engage in trading activities involving non-exchange traded contracts. As such, we are not materially exposed to any financing, liquidity, market or credit risk that could arise if we had engaged in such relationships. We do not have any material relationships or transactions with persons or entities that derive benefits from their non-independent relationship with us or our related parties.
Potential Fluctuations in Quarterly Results and Seasonality
Due to the regional and seasonal fluctuations in the hospital patient census and staffing needs of our hospital and healthcare facility and other clients and due to the seasonal preferences for destinations of our clinicians and physicians, revenue, earnings and the number of clinicians and physicians on assignment are subject to moderate seasonal fluctuations.
Inflation
Although inflation has remained relatively stable during the last several years, the rate of inflation in healthcare related services continues to exceed the rate experienced by the economy as a whole. Our contracts typically provide for an annual increase in the fees paid to us by our clients based on increases in various inflation indices, which provides us the opportunity to pass on inflation costs to our clients.
Recent Accounting Pronouncements
See “Item 8. Financial Statements and Supplementary Data—Notes to Consolidated Financial Statements—Note 1(s), Summary of Significant Accounting Policies-Recently Adopted Accounting Pronouncements” for information regarding the effect of recently adopted accounting pronouncements on our financial statements.

31
Item 7A. Quantitative and Qualitative Disclosures about Market Risk
Market risk is the risk of loss arising from adverse changes in market rates and prices, such as interest rates, foreign currency exchange rates and commodity prices.
During 2013, our primary exposure to market risk was interest rate risk associated with our debt instruments. Borrowings under the Term Loan bear interest at floating rates based upon either a LIBOR (with a floor of 0.75%) or a base rate option selected by us, plus a spread of 3.00% and 2.00%, respectively. A 1% change in interest rates on our variable rate debt would not have resulted in a material effect on our consolidated financial statements for 2013.
We conduct a de minimus amount of international operations. Accordingly, we believe that our foreign currency risk is immaterial.

32
Item 8. Financial Statements and Supplementary Data
INDEX TO CONSOLIDATED FINANCIAL STATEMENTS
Page
Report of Independent Registered Public Accounting Firm 33Consolidated Balance Sheets as of December 31, 2013 and 2012 34Consolidated Statements of Comprehensive Income (Loss) for the years ended December 31, 2013, 2012 and 2011 35Consolidated Statements of Stockholders’ Equity for the years ended December 31, 2013, 2012 and 2011 36Consolidated Statements of Cash Flows for the years ended December 31, 2013, 2012 and 2011 37Notes to Consolidated Financial Statements 39
33
Report of Independent Registered Public Accounting Firm The Board of Directors and StockholdersAMN Healthcare Services, Inc.: We have audited the accompanying consolidated balance sheets of AMN Healthcare Services, Inc. and subsidiaries (the Company) as of December 31, 2013 and 2012, and the related consolidated statements of comprehensive income (loss), stockholders’ equity, and cash flows for each of the years in the three-year period ended December 31, 2013. In connection with our audits of the consolidated financial statements, we have also audited the financial statement schedule of valuation and qualifying accounts. These consolidated financial statements and financial statement schedule are the responsibility of the Company’s management. Our responsibility is to express an opinion on these consolidated financial statements and financial statement schedule based on our audits. We conducted our audits in accordance with the standards of the Public Company Accounting Oversight Board (United States). Those standards require that we plan and perform the audit to obtain reasonable assurance about whether the financial statements are free of material misstatement. An audit includes examining, on a test basis, evidence supporting the amounts and disclosures in the financial statements. An audit also includes assessing the accounting principles used and significant estimates made by management, as well as evaluating the overall financial statement presentation. We believe that our audits provide a reasonable basis for our opinion. In our opinion, the consolidated financial statements referred to above present fairly, in all material respects, the financial position of AMN Healthcare Services, Inc. and subsidiaries as of December 31, 2013 and 2012, and the results of their operations and their cash flows for each of the years in the three-year period ended December 31, 2013, in conformity with U.S. generally accepted accounting principles. Also, in our opinion, the related financial statement schedule of valuation and qualifying accounts, when considered in relation to the basic consolidated financial statements taken as a whole, presents fairly, in all material respects, the information set forth therein. We also have audited, in accordance with the standards of the Public Company Accounting Oversight Board (United States), AMN Healthcare Services, Inc. and subsidiaries' internal control over financial reporting as of December 31, 2013, based on criteria established in Internal Control—Integrated Framework (1992) issued by the Committee of Sponsoring Organizations of the Treadway Commission (COSO), and our report dated February 21, 2014 expressed an unqualified opinion on the effectiveness of the Company’s internal control over financial reporting.
/s/ KPMG LLP San Diego, CaliforniaFebruary 21, 2014
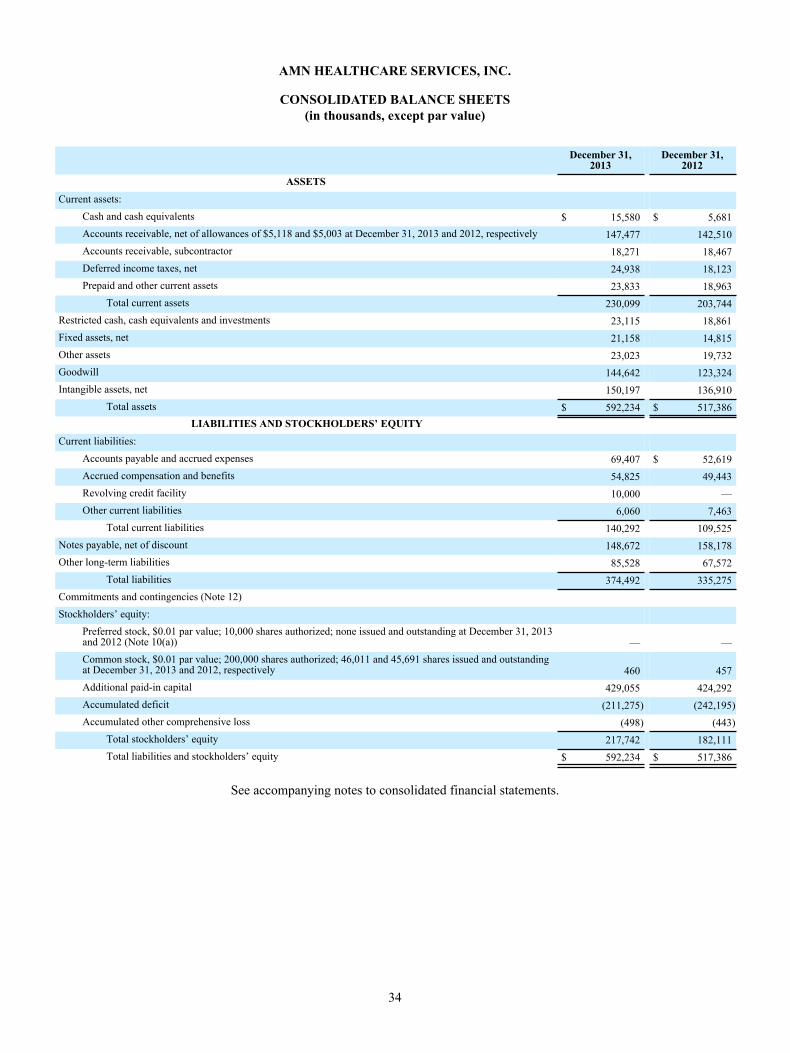
34
AMN HEALTHCARE SERVICES, INC.
CONSOLIDATED BALANCE SHEETS(in thousands, except par value)
December 31,2013
December 31,2012
ASSETSCurrent assets:
Cash and cash equivalents $ 15,580 $ 5,681Accounts receivable, net of allowances of $5,118 and $5,003 at December 31, 2013 and 2012, respectively 147,477 142,510Accounts receivable, subcontractor 18,271 18,467Deferred income taxes, net 24,938 18,123Prepaid and other current assets 23,833 18,963
Total current assets 230,099 203,744Restricted cash, cash equivalents and investments 23,115 18,861Fixed assets, net 21,158 14,815Other assets 23,023 19,732Goodwill 144,642 123,324Intangible assets, net 150,197 136,910
Total assets $ 592,234 $ 517,386LIABILITIES AND STOCKHOLDERS’ EQUITY
Current liabilities:Accounts payable and accrued expenses 69,407 $ 52,619Accrued compensation and benefits 54,825 49,443Revolving credit facility 10,000 —Other current liabilities 6,060 7,463
Total current liabilities 140,292 109,525Notes payable, net of discount 148,672 158,178Other long-term liabilities 85,528 67,572
Total liabilities 374,492 335,275Commitments and contingencies (Note 12)Stockholders’ equity:
Preferred stock, $0.01 par value; 10,000 shares authorized; none issued and outstanding at December 31, 2013and 2012 (Note 10(a)) — —Common stock, $0.01 par value; 200,000 shares authorized; 46,011 and 45,691 shares issued and outstandingat December 31, 2013 and 2012, respectively 460 457Additional paid-in capital 429,055 424,292Accumulated deficit (211,275) (242,195)Accumulated other comprehensive loss (498) (443)
Total stockholders’ equity 217,742 182,111Total liabilities and stockholders’ equity $ 592,234 $ 517,386
See accompanying notes to consolidated financial statements.
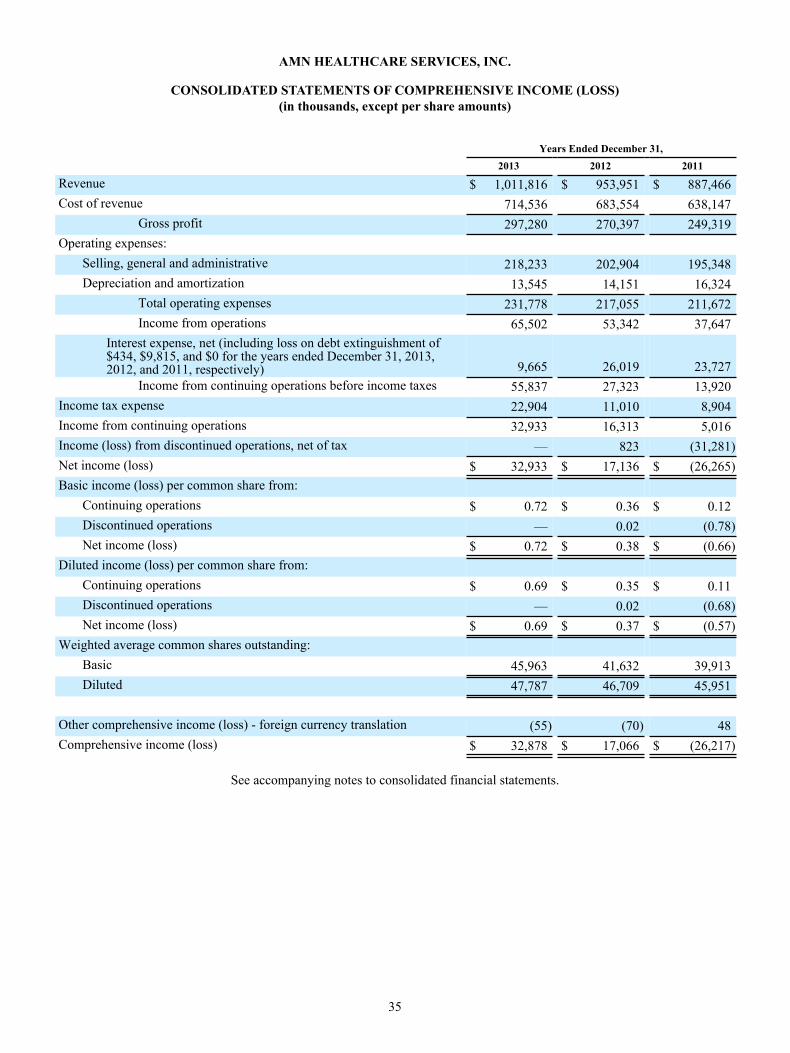
35
AMN HEALTHCARE SERVICES, INC.
CONSOLIDATED STATEMENTS OF COMPREHENSIVE INCOME (LOSS)(in thousands, except per share amounts)
Years Ended December 31, 2013 2012 2011
Revenue $ 1,011,816 $ 953,951 $ 887,466Cost of revenue 714,536 683,554 638,147
Gross profit 297,280 270,397 249,319Operating expenses:
Selling, general and administrative 218,233 202,904 195,348Depreciation and amortization 13,545 14,151 16,324
Total operating expenses 231,778 217,055 211,672Income from operations 65,502 53,342 37,647
Interest expense, net (including loss on debt extinguishment of$434, $9,815, and $0 for the years ended December 31, 2013,2012, and 2011, respectively) 9,665 26,019 23,727
Income from continuing operations before income taxes 55,837 27,323 13,920Income tax expense 22,904 11,010 8,904Income from continuing operations 32,933 16,313 5,016Income (loss) from discontinued operations, net of tax — 823 (31,281)Net income (loss) $ 32,933 $ 17,136 $ (26,265)Basic income (loss) per common share from:
Continuing operations $ 0.72 $ 0.36 $ 0.12Discontinued operations — 0.02 (0.78)Net income (loss) $ 0.72 $ 0.38 $ (0.66)
Diluted income (loss) per common share from:Continuing operations $ 0.69 $ 0.35 $ 0.11Discontinued operations — 0.02 (0.68)Net income (loss) $ 0.69 $ 0.37 $ (0.57)
Weighted average common shares outstanding:Basic 45,963 41,632 39,913Diluted 47,787 46,709 45,951
Other comprehensive income (loss) - foreign currency translation (55) (70) 48Comprehensive income (loss) $ 32,878 $ 17,066 $ (26,217)
See accompanying notes to consolidated financial statements.

36
AMN HEALTHCARE SERVICES, INC.
CONSOLIDATED STATEMENTS OF STOCKHOLDERS’ EQUITY Years Ended December 31, 2013, 2012 and 2011
(in thousands)
Common Stock AdditionalPaid-inCapital
Treasury Stock AccumulatedDeficit
AccumulatedOther
ComprehensiveLoss Total Shares Amount Shares Amount
Balance, December 31, 2010 39,186 $ 392 $ 386,550 — $ — $ (233,066) $ (421) $ 153,455Equity awards vested andissued and exercised 418 4 (2,062) — — — — (2,058)Preferred Stock convertedto common stock 850 9 4,291 — — — — 4,300Income tax shortfall fromequity awards vested andissued and exercised — — (953) — — — — (953)Share-based compensation
— — 7,132 — — — — 7,132Comprehensive income (loss) (26,265) 48 (26,217)
Balance, December 31, 2011 40,454 $ 405 $ 394,958 — $ — $ (259,331) $ (373) $ 135,659Equity awards vested andissued and exercised 486 5 (550) — — — — (545)Preferred Stock convertedto common stock 4,751 47 23,992 — — — — 24,039Preferred Stock retirement — — 37 — — — — 37Income tax shortfall fromequity awards vested andissued and exercised — — (369) — — — — (369)Share-based compensation — — 6,224 — — — — 6,224Comprehensive income (loss) — — — — — 17,136 (70) 17,066Balance, December 31, 2012 45,691 $ 457 $ 424,292 — $ — $ (242,195) $ (443) $ 182,111Settlement of acquisitionshare holdback — — — — (3,046) — — (3,046)Treasury stock retirement (204) (2) (1,031) — 3,046 (2,013) — —Equity awards vested andissued and exercised 524 5 (1,498) — — — — (1,493)Income tax benefit fromequity awards vested andissued and exercised — — 1,167 — — — — 1,167Share-based compensation — — 6,125 — — — — 6,125Comprehensive income (loss) — — — — — 32,933 (55) 32,878Balance, December 31, 2013 46,011 $ 460 $ 429,055 — $ — $ (211,275) $ (498) $ 217,742
See accompanying notes to consolidated financial statements.
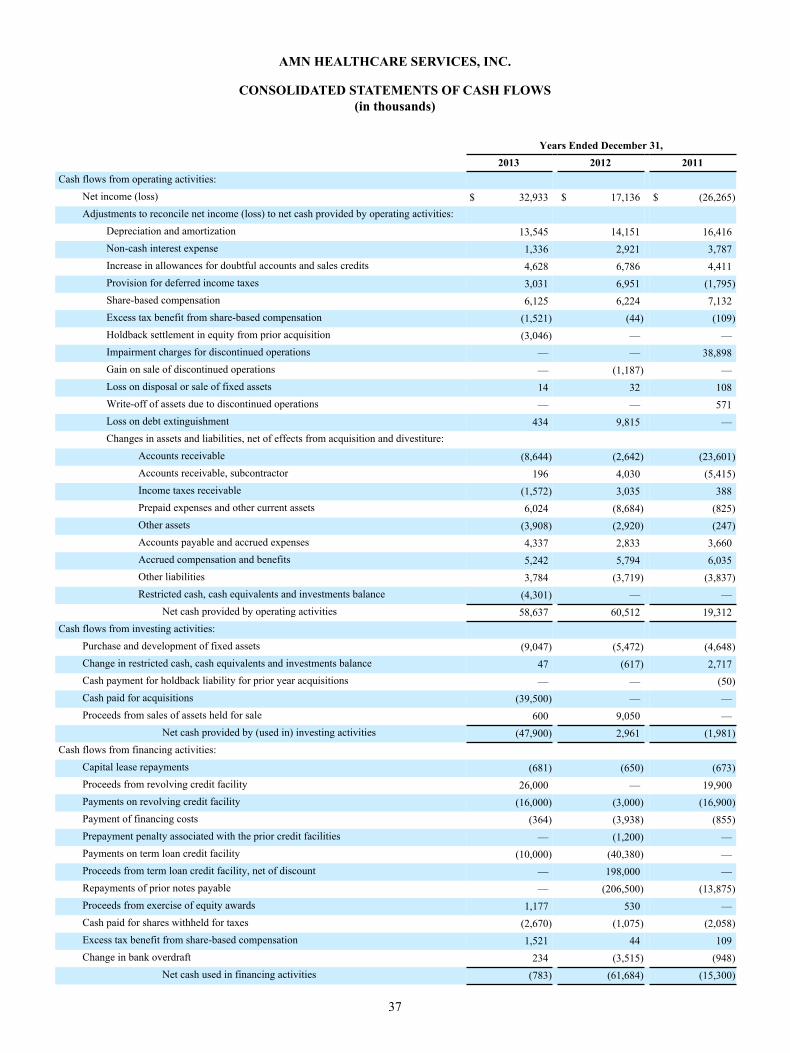
37
AMN HEALTHCARE SERVICES, INC.
CONSOLIDATED STATEMENTS OF CASH FLOWS(in thousands)
Years Ended December 31, 2013 2012 2011Cash flows from operating activities:
Net income (loss) $ 32,933 $ 17,136 $ (26,265)Adjustments to reconcile net income (loss) to net cash provided by operating activities:
Depreciation and amortization 13,545 14,151 16,416Non-cash interest expense 1,336 2,921 3,787Increase in allowances for doubtful accounts and sales credits 4,628 6,786 4,411Provision for deferred income taxes 3,031 6,951 (1,795)Share-based compensation 6,125 6,224 7,132Excess tax benefit from share-based compensation (1,521) (44) (109)Holdback settlement in equity from prior acquisition (3,046) — —Impairment charges for discontinued operations — — 38,898Gain on sale of discontinued operations — (1,187) —Loss on disposal or sale of fixed assets 14 32 108Write-off of assets due to discontinued operations — — 571Loss on debt extinguishment 434 9,815 —Changes in assets and liabilities, net of effects from acquisition and divestiture:
Accounts receivable (8,644) (2,642) (23,601)Accounts receivable, subcontractor 196 4,030 (5,415)Income taxes receivable (1,572) 3,035 388Prepaid expenses and other current assets 6,024 (8,684) (825)Other assets (3,908) (2,920) (247)Accounts payable and accrued expenses 4,337 2,833 3,660Accrued compensation and benefits 5,242 5,794 6,035Other liabilities 3,784 (3,719) (3,837)Restricted cash, cash equivalents and investments balance (4,301) — —
Net cash provided by operating activities 58,637 60,512 19,312Cash flows from investing activities:
Purchase and development of fixed assets (9,047) (5,472) (4,648)Change in restricted cash, cash equivalents and investments balance 47 (617) 2,717Cash payment for holdback liability for prior year acquisitions — — (50)Cash paid for acquisitions (39,500) — —Proceeds from sales of assets held for sale 600 9,050 —
Net cash provided by (used in) investing activities (47,900) 2,961 (1,981)Cash flows from financing activities:
Capital lease repayments (681) (650) (673)Proceeds from revolving credit facility 26,000 — 19,900Payments on revolving credit facility (16,000) (3,000) (16,900)Payment of financing costs (364) (3,938) (855)Prepayment penalty associated with the prior credit facilities — (1,200) —Payments on term loan credit facility (10,000) (40,380) —Proceeds from term loan credit facility, net of discount — 198,000 —Repayments of prior notes payable — (206,500) (13,875)Proceeds from exercise of equity awards 1,177 530 —Cash paid for shares withheld for taxes (2,670) (1,075) (2,058)Excess tax benefit from share-based compensation 1,521 44 109Change in bank overdraft 234 (3,515) (948)
Net cash used in financing activities (783) (61,684) (15,300)
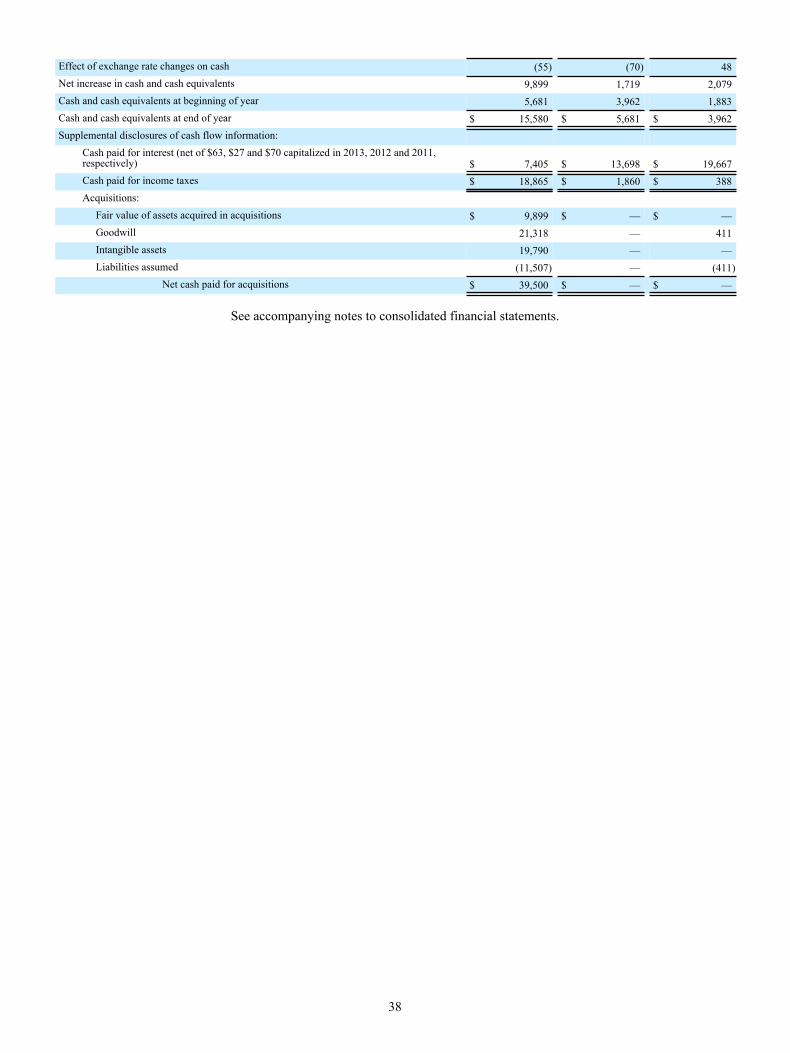
38
Effect of exchange rate changes on cash (55) (70) 48Net increase in cash and cash equivalents 9,899 1,719 2,079Cash and cash equivalents at beginning of year 5,681 3,962 1,883Cash and cash equivalents at end of year $ 15,580 $ 5,681 $ 3,962Supplemental disclosures of cash flow information:
Cash paid for interest (net of $63, $27 and $70 capitalized in 2013, 2012 and 2011,respectively) $ 7,405 $ 13,698 $ 19,667Cash paid for income taxes $ 18,865 $ 1,860 $ 388
Acquisitions: Fair value of assets acquired in acquisitions $ 9,899 $ — $ — Goodwill 21,318 — 411 Intangible assets 19,790 — — Liabilities assumed (11,507) — (411)
Net cash paid for acquisitions $ 39,500 $ — $ —
See accompanying notes to consolidated financial statements.
39
AMN HEALTHCARE SERVICES, INC.
NOTES TO CONSOLIDATED FINANCIAL STATEMENTSDecember 31, 2013, 2012 and 2011
(in thousands, except per share amounts) (1) Summary of Significant Accounting Policies
(a) General
AMN Healthcare Services, Inc. was incorporated in Delaware on November 10, 1997. AMN Healthcare Services, Inc. and its subsidiaries (collectively, the “Company”) provide healthcare workforce solutions and staffing services at acute and sub-acute care hospitals and other healthcare facilities throughout the United States.
(b) Principles of Consolidation
The accompanying consolidated financial statements include the accounts of AMN Healthcare Services, Inc. and its wholly-owned subsidiaries. All significant intercompany balances and transactions have been eliminated in consolidation.
(c) Use of Estimates
The preparation of financial statements in conformity with accounting principles generally accepted in the United States of America requires management to make a number of estimates and assumptions relating to the reporting of assets and liabilities and the disclosure of contingent assets and liabilities at the dates of the financial statements and the reported amounts of revenue and expenses during the reporting periods. On an ongoing basis, the Company evaluates its estimates, including those related to asset impairment, accruals for self-insurance and compensation and related benefits, revenue recognition, accounts receivable, contingencies and litigation, valuation and recognition of share-based payments, and income taxes. The Company bases these estimates on the information that is currently available and on various other assumptions that it believes are reasonable under the circumstances. Actual results could differ from those estimates under different assumptions or conditions.
(d) Cash and Cash Equivalents
The Company considers all highly liquid investments with an original maturity of three months or less to be cash equivalents. Cash and cash equivalents include currency on hand, deposits with financial institutions and highly liquid investments.
(e) Restricted Cash, Cash Equivalents and Investments
Restricted cash, cash equivalents and investments primarily represent the cash and U.S. Treasury securities on deposit with financial institutions that serve as collateral for the Company’s outstanding letters of credit. The original maturity terms for the U.S. Treasury securities were between 6-months and 12-months. See Note (4), “Fair Value Measurement” and Note (8), “Notes Payable and Credit Agreement” for additional information.
(f) Fixed Assets
The Company records furniture, equipment, leasehold improvements and internal-use software at cost less accumulated amortization and depreciation. The Company records equipment acquired under capital leases at the present value of the future minimum lease payments. The Company capitalizes major additions and improvements, and expenses maintenance and repairs when incurred. The Company calculates depreciation on furniture, equipment and software using the straight-line method based on the estimated useful lives of the related assets (three to seven years). The Company amortizes leasehold improvements and equipment obtained under capital leases over the shorter of the term of the lease or their estimated useful lives. The Company includes amortization of equipment obtained under capital leases with depreciation expense in the accompanying consolidated financial statements.
The Company capitalizes and records at cost the costs it incurs to develop internal-use software during the application development stage. Application development stage costs generally include costs associated with internal-use software configuration, coding, installation and testing. The Company also capitalizes costs of significant upgrades and enhancements that result in additional functionality, whereas it expenses as incurred costs for maintenance and minor upgrades and enhancements. The Company amortizes capitalized costs using the straight-line method over three to seven years once the software is ready for its intended use.

40
The Company reviews long-lived assets for impairment annually and whenever events or changes in circumstances indicate that the carrying amount of an asset may not be recoverable and has determined that no triggering events have occurred during the period that would require the Company to perform an impairment test. Recoverability of assets to be held and used is measured by a comparison of the carrying amount of an asset group to the future undiscounted net cash flows that are expected to be generated by the asset group. If such asset group is considered to be impaired, the impairment to be recognized is measured by the amount by which the carrying amount of the asset group exceeds the fair value of the asset group. The Company reports assets to be disposed of at the lower of the carrying amount or fair value less costs to sell.
(g) Goodwill
The Company records as goodwill the portion of the purchase price that exceeds the fair value of net assets of entities acquired. The Company evaluates goodwill annually for impairment at the reporting unit level and whenever circumstances occur indicating that goodwill may be impaired. The Company may first assess qualitative factors to determine whether it is more likely than not that the fair value of a reporting unit is less than its carrying amount. If, after assessing the totality of events and circumstances, the Company determines that it is more likely than not that the fair value of the reporting unit is greater than its carrying amount, the quantitative impairment test is unnecessary. The performance of the quantitative impairment test involves a two-step process. The first step of the test involves comparing the fair value of the Company’s reporting units with the reporting unit’s carrying amount, including goodwill. The Company generally determines the fair value of its reporting units using a combination of the income approach (using discounted future cash flows) and the market valuation approach. If the carrying amount of the Company’s reporting units exceeds the reporting unit’s fair value, the Company performs the second step of the test to determine the amount of impairment loss. The second step of the test involves comparing the implied fair value of the Company’s reporting unit’s goodwill with the carrying amount of that goodwill. The amount, by which the carrying value of the goodwill exceeds its implied fair value, if any, is recognized as an impairment loss.
The Company experienced declines in home healthcare revenue subsequent to the acquisition of NF Investors, Inc., a Delaware corporation (“NFI”), the parent company of Medfinders, due to federal and state reimbursement rate and funding pressures, such that during the third quarter of 2011, the Company lowered its projected near-term growth rate in the home healthcare services segment. The revised growth rate triggered interim impairment testing on the home healthcare services segment, which was also the reporting unit, as of August 31, 2011. The Company completed the valuation during the fourth quarter of 2011. As a result, the Company recognized a pre-tax goodwill impairment charge of $24,498 in 2011. The Company included the charge in loss from discontinued operations on the consolidated statement of comprehensive loss for the year ended December 31, 2011. Subsequent to year end, the Company completed the sale of this segment. See Note (2), “Discontinued Operations” and Note (5), “Goodwill and Identifiable Intangible Assets” for additional information. The Company performed the annual impairment testing at the reporting unit level at October 31, 2011, and determined there was no further impairment of goodwill.
The Company performed the annual impairment testing at the reporting unit level at October 31, 2012, and determined there was no impairment of goodwill.
The Company performed the annual impairment test at October 31, 2013 and determined there was no impairment of goodwill. The Company assessed qualitative factors to determine whether it is more likely than not that the fair value of each reporting unit is less than its carrying amount. As a result of the qualitative assessments, the Company determined that it is more likely than not that the fair value of each of its reporting units is greater than its carrying amount and there was no impairment of goodwill. No events or circumstances have occurred subsequent to October 31, 2013 that indicate that impairment may have occurred.
(h) Intangible Assets
Intangible assets consist of identifiable intangible assets acquired through acquisitions. Identifiable intangible assets include tradenames and trademarks, customer relationships, non-compete agreements, staffing databases, acquired technology and online courses. The Company amortizes intangible assets, other than tradenames and trademarks with an indefinite life, using the straight-line method over their useful lives. The Company amortizes non-compete covenants using the straight-line method over the lives of the related agreements. The Company reviews for impairment intangible assets with estimable useful lives whenever events or changes in circumstances indicate that the carrying amount may not be recoverable and has determined that no triggering events have occurred during the period that would require the Company to perform an impairment test.
The Company does not amortize indefinite lived tradenames and trademarks and instead reviews them for impairment annually. The Company may first perform a qualitative assessment to determine whether it is more likely than not that an indefinite-lived intangible asset is impaired. If, after assessing the totality of events and circumstances, the Company

41
determines that it is more likely than not that the indefinite-lived intangible asset is not impaired, no quantitative fair value measurement is necessary. If a quantitative fair value measurement calculation is required for the indefinite-lived intangible assets, the Company compares the fair value of the Company’s indefinite-lived intangibles with their carrying amount. If the carrying amount exceeds the fair value, the Company records the excess as an impairment loss.
The Company experienced declines in home healthcare revenue subsequent to the acquisition of NFI due to federal and state reimbursement rate and funding pressures, such that during the third quarter of 2011, the Company lowered its projected near-term growth rate in the home healthcare services segment. The revised growth rate triggered interim impairment testing on the home healthcare services segment, which was also the reporting unit, as of August 31, 2011. The Company completed the interim valuation during the fourth quarter of 2011. As a result, the Company recognized a pre-tax impairment charge of $6,700 in 2011 related to an indefinite-lived intangible asset shared by the nurse staffing reporting unit and home healthcare services reporting unit. The Company performed its annual impairment testing at October 31, 2011 and recorded an additional impairment charge of $7,700 related to the above indefinite-lived intangible asset. The additional fourth quarter impairment resulted from the incremental loss of revenue related to the home healthcare services segment from the sale of the disposal group in January 2012. See Note (2), “Discontinued Operations” for additional information. The Company included these charges in loss from discontinued operations on the consolidated statement of comprehensive loss for the year ended December 31, 2011.
The Company performed its annual impairment testing at October 31, 2012 and determined there was no impairment of its indefinite lived tradenames and trademarks.
The Company performed its annual impairment testing at October 31, 2013 and determined there was no impairment of its indefinite-lived tradenames and trademarks. The Company assessed qualitative factors to determine whether it is more likely than not that the fair value of tradenames and trademarks are less than their carrying amount. As a result of the qualitative assessments, the Company determined that it is more likely than not that the fair values of its tradenames and trademarks are greater than their carrying amounts and there was no impairment of its indefinite-lived tradenames and trademarks. No events or circumstances have occurred subsequent to October 31, 2013 that indicate that impairment may have occurred.
(i) Insurance Reserves
The Company maintains an accrual for professional liability self-insured retention limits that is included in accounts payable and accrued expenses and other long-term liabilities in the consolidated balance sheets. The expense is included in the selling, general and administrative expenses in the consolidated statement of comprehensive income (loss). The Company determines the adequacy of this undiscounted accrual by evaluating its historical experience and trends, loss reserves established by the Company’s insurance carriers, management and third-party administrators, as well as by analyzing independent actuarial studies. The Company obtains actuarial studies on a semi-annual basis that use the Company’s actual claims data and industry data to assist the Company in determining the adequacy of its reserves each year.
In November 2012, the Company established a captive insurance subsidiary, which provides coverage, on an occurrence basis, for professional liability within its nurse and allied healthcare staffing segment. Liabilities include provisions for estimated losses incurred but not yet reported (“IBNR”), as well as provisions for known claims. IBNR reserve estimates involve the use of assumptions and are primarily based upon historical loss experience, industry data and other actuarial assumptions. The Company maintains excess insurance coverage for losses above the per occurrence retention.
The Company maintains an accrual for workers compensation self-insured retention limits, which is included in accrued compensation and benefits and other long-term liabilities in the consolidated balance sheets. The Company determines the adequacy of this undiscounted accrual by evaluating its historical experience and trends, loss reserves established by the Company’s insurance carriers and third party administrators, as well as by analyzing independent actuarial studies. The Company obtains actuarial studies on a semi-annual basis that use the Company’s payroll and actual claims data, as well as industry data, to determine the appropriate reserve both for (1) reported claims and (2) IBNR claims for each policy year. The actuarial study for workers compensation provides the Company with the estimated losses for prior policy years and an estimated percentage of payroll compensation to be accrued for the current year. The Company records its accruals based on the amounts provided in the actuarial study, which it believes is the best estimate of its liability.
(j) Revenue Recognition
Revenue consists of fees earned from the permanent and temporary placement of clinicians and physicians. Revenue is recognized when earned and realizable. The Company has contracts with healthcare organizations to provide managed services programs. Under these contract arrangements, the Company uses its clinicians along with those of third party subcontractors to fulfill client orders. If the Company uses subcontractors, it records revenue net of related subcontractors expense. The resulting
42
net revenue represents the administrative fee the Company charges for its managed services programs. The Company records subcontractor accounts receivable from the client in the consolidated balance sheets. The Company generally pays the subcontractor after it has received payment from the client. The Company includes payables to subcontractors in accounts payable and accrued expenses in the consolidated balance sheets.
(k) Accounts Receivable
The Company records accounts receivable at the invoiced amount. Accounts receivable are non-interest bearing. The Company maintains an allowance for doubtful accounts for estimated credit losses resulting from collection risk, including the inability of customers to make required payments under contractual agreements. The allowance for doubtful accounts is reported as a reduction of accounts receivable in the consolidated balance sheets. The Company determines the adequacy of this allowance by evaluating historical delinquency and write-off trends, the financial condition and credit risk and history of each customer, historical payment trends as well as current economic conditions and the impact of such conditions on the customers’ liquidity and overall financial condition. The Company also maintains a sales allowance to reserve for potential credits issued to customers. The Company determines the amount of the reserve based on historical credits issued.
(l) Concentration of Credit Risk
The majority of the Company’s business activity is with hospitals located throughout the United States. Credit is extended based on the evaluation of each entity’s financial condition, and collateral is generally not required. Credit losses have been within management’s expectations. No single client healthcare system exceeded 10% of consolidated revenue for the years ended December 31, 2013, 2012 and 2011. One managed services program client comprised more than 10% of the Company’s nurse and allied healthcare staffing segment revenue for the year ended December 31, 2013. As of December 31, 2013 and 2012, accounts receivable from the Company’s top five clients represented approximately 12% and 14%, respectively, of the net accounts receivable balance, excluding amounts due to subcontractors.
The Company’s cash and cash equivalents and restricted cash, cash equivalents and investments accounts are also financial instruments that are exposed to concentration of credit risk. The Company maintains its cash balances with high-credit quality and federally insured institutions. Cash balances may be invested in a non-federally insured money market account. As of December 31, 2013 and 2012, there were $23,115 and $18,861, respectively, of restricted cash, cash equivalents and investments primarily invested in a non-federally insured U.S. Treasury security account.
(m) Income Taxes
The Company records income taxes using the asset and liability method. Deferred tax assets and liabilities are recognized for the future tax consequences attributable to differences between the financial statement carrying amounts of existing assets and liabilities and their respective tax basis. Deferred tax assets and liabilities are measured using enacted tax rates expected to apply to taxable income in the years in which those temporary differences are expected to be recovered or settled. The effect on deferred tax assets and liabilities of a change in tax rates is recognized in the period the changes are enacted. In assessing the realizability of deferred tax assets, the Company considers whether it is more likely than not that some portion or all of the deferred tax assets will not be realized. The ultimate realization of deferred tax assets is dependent upon the generation of future taxable income during the periods in which those temporary differences become deductible. The Company considers the scheduled reversal of deferred tax liabilities (including the impact of available carryback and carryforward periods), projected future taxable income, and tax-planning strategies in making this assessment. The Company recognizes the effect of income tax positions only if it is more likely than not that such positions will be sustained. Recognized income tax positions are measured at the largest amount that is greater than 50% likely of being realized. Changes in recognition or measurement are reflected in the period in which the change in judgment occurs. The Company records interest and penalties related to unrecognized tax benefits in income tax expense.
(n) Fair Value of Financial Instruments
The carrying amounts of cash and cash equivalents, accounts receivable, subcontractor accounts receivable, income tax receivable, restricted cash, cash equivalents and investments, bank overdraft, accounts payable and accrued expenses, accrued compensation and benefits and other current liabilities approximate their respective fair values due to the short-term nature and liquidity of these financial instruments. The carrying amount of notes payable (both current and long-term portions), net of discount, approximates fair value as the instrument’s interest rates are variable and comparable to rates currently offered for similar debt instruments of comparable maturity (significant other observable inputs - level 2). See Note (8), “Notes Payable and Credit Agreement” for additional information. The fair value of the long-term portion of the Company’s self insurance accruals cannot be estimated as the Company cannot reasonably determine the timing of future payments.
43
(o) Share-Based Compensation
The Company accounts for its share-based employee compensation plans by expensing the estimated fair value of share-based awards over the requisite employee service period, which is the vesting period. The Company amortizes the fair value of equity awards granted on a straight-line basis over the requisite service periods of the awards. The measurement of share-based compensation expense is based on several criteria including, but not limited to, the valuation model used and associated input factors such as expected term of the award, stock price volatility, dividend rate, risk free interest rate, and award forfeiture rate. The input factors to use in the valuation model are based on subjective future expectations combined with management judgment. The Company uses historical data to estimate pre-vesting equity award forfeitures and records share-based compensation expense only for those awards that are expected to vest. The excess tax benefits recognized in equity related to equity award exercises are reflected as cash inflows from financing activities in the consolidated statements of cash flows. There is a corresponding cash outflow from operating activities for excess tax benefits in the consolidated statements of cash flows.
(p) Net Income (Loss) per Common Share
Securities that are entitled to participate in dividends with common stock, such as the Company’s Series A Conditional Convertible Preferred Stock (the “Preferred Stock”), are considered to be participating securities and the two-class method is used for purposes of calculating basic net income per share. Under the two-class method, a portion of net income is allocated to participating securities and excluded from the calculation of basic net income per common share. On December 21, 2012, all outstanding Preferred Stock were converted into common stock; accordingly, for the two-class method calculation, the net income was allocated between common stock and Preferred Stock on a proportionate basis using a systematic and reasonable basis (based on number of days outstanding) for purpose of calculating the basic net income per share for the year ended December 31, 2012. For the 2011 basic net loss per common share calculation, the two-class method was not applicable due to the overall net loss for the year. Diluted net income per common share reflects the effects of potentially dilutive share-based equity instruments and common stock issuable upon conversion of the Preferred Stock.
Share-based awards to purchase 308, 1,902 and 2,253 shares of common stock for the years ended December 31, 2013, 2012 and 2011, respectively, were not included in the calculation of diluted net income per common share because the effect of these instruments was anti-dilutive.
The following table sets forth the computation of basic and diluted net income (loss) per common share for the years ended December 31, 2013, 2012 and 2011, respectively:
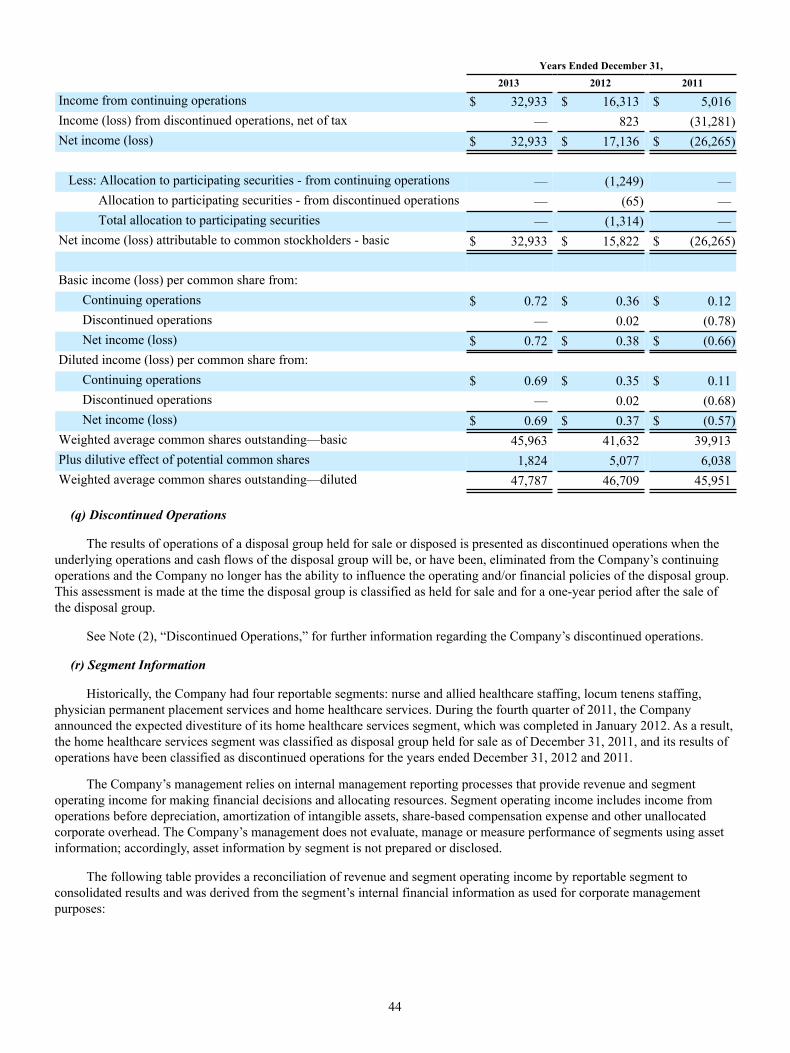
44
Years Ended December 31, 2013 2012 2011
Income from continuing operations $ 32,933 $ 16,313 $ 5,016Income (loss) from discontinued operations, net of tax — 823 (31,281)Net income (loss) $ 32,933 $ 17,136 $ (26,265)
Less: Allocation to participating securities - from continuing operations — (1,249) — Allocation to participating securities - from discontinued operations — (65) — Total allocation to participating securities — (1,314) —Net income (loss) attributable to common stockholders - basic $ 32,933 $ 15,822 $ (26,265)
Basic income (loss) per common share from:Continuing operations $ 0.72 $ 0.36 $ 0.12Discontinued operations — 0.02 (0.78)Net income (loss) $ 0.72 $ 0.38 $ (0.66)
Diluted income (loss) per common share from:Continuing operations $ 0.69 $ 0.35 $ 0.11Discontinued operations — 0.02 (0.68)Net income (loss) $ 0.69 $ 0.37 $ (0.57)
Weighted average common shares outstanding—basic 45,963 41,632 39,913Plus dilutive effect of potential common shares 1,824 5,077 6,038Weighted average common shares outstanding—diluted 47,787 46,709 45,951
(q) Discontinued Operations
The results of operations of a disposal group held for sale or disposed is presented as discontinued operations when the
underlying operations and cash flows of the disposal group will be, or have been, eliminated from the Company’s continuing operations and the Company no longer has the ability to influence the operating and/or financial policies of the disposal group. This assessment is made at the time the disposal group is classified as held for sale and for a one-year period after the sale of the disposal group.
See Note (2), “Discontinued Operations,” for further information regarding the Company’s discontinued operations.
(r) Segment Information
Historically, the Company had four reportable segments: nurse and allied healthcare staffing, locum tenens staffing, physician permanent placement services and home healthcare services. During the fourth quarter of 2011, the Company announced the expected divestiture of its home healthcare services segment, which was completed in January 2012. As a result, the home healthcare services segment was classified as disposal group held for sale as of December 31, 2011, and its results of operations have been classified as discontinued operations for the years ended December 31, 2012 and 2011.
The Company’s management relies on internal management reporting processes that provide revenue and segment operating income for making financial decisions and allocating resources. Segment operating income includes income from operations before depreciation, amortization of intangible assets, share-based compensation expense and other unallocated corporate overhead. The Company’s management does not evaluate, manage or measure performance of segments using asset information; accordingly, asset information by segment is not prepared or disclosed.
The following table provides a reconciliation of revenue and segment operating income by reportable segment to consolidated results and was derived from the segment’s internal financial information as used for corporate management purposes:

45
Years Ended December 31, 2013 2012 2011
RevenueNurse and allied healthcare staffing $ 681,979 $ 653,829 $ 570,677Locum tenens staffing 287,484 261,431 277,919Physician permanent placement services 42,353 38,691 38,870
$ 1,011,816 $ 953,951 $ 887,466Segment Operating Income
Nurse and allied healthcare staffing $ 82,458 $ 75,907 $ 62,786Locum tenens staffing 24,712 21,613 21,689Physician permanent placement services 8,929 7,868 10,634
116,099 105,388 95,109Unallocated corporate overhead 30,927 31,674 34,040Depreciation and amortization 13,545 14,151 16,324Share-based compensation 6,125 6,221 7,098Interest expense, net (including loss on debt extinguishment of $434,$9,815, and $0 for the years ended December 31, 2013, 2012 and 2011,respectively) 9,665 26,019 23,727Income from continuing operations before income taxes $ 55,837 $ 27,323 $ 13,920
(s) Recently Adopted Accounting Pronouncements
In July 2012, the Financial Accounting Standards Board issued an accounting standard update intended to simplify how an entity tests indefinite-lived intangible assets other than goodwill for impairment by providing entities with an option to perform a qualitative assessment to determine whether further impairment testing is necessary. This accounting standard update is effective for annual and interim impairment tests performed for fiscal years beginning after September 15, 2012. The Company adopted this guidance effective January 1, 2013 and performed a qualitative assessment on its annual impairment testing date and such adoption did not have a material effect on its consolidated financial statements. See Note (1)(h), “Summary of Significant Accounting Policies - Intangible Assets” for additional information.
(2) Discontinued Operations
In January 2012, the Company completed the sale of its home healthcare services segment and the related results of operations have been classified as discontinued operations for the years ended December 31, 2012 and 2011.
The following table represents the revenue and the components of discontinued operations, net of tax:
2012 2011
Revenue $ 3,885 $ 53,954(Loss) before income taxes $ (547) $ (38,484)Income tax benefit 183 7,203
Loss from discontinued operations $ (364) $ (31,281)
Gain on sale of discontinued operations, before income taxes $ 3,825 $ —Income tax expense (2,638) —
Gain on sale of discontinued operations $ 1,187 $ —Total income (loss) from discontinued operations $ 823 $ (31,281)
For the year ended December 31, 2011, the loss before income taxes was composed of a $24,498 goodwill impairment
charge and $14,400 tradename impairment charge and partially offset by income from operations of $414.

46
(3) Business Combinations
ShiftWise Acquisition
On November 20, 2013, the Company completed its acquisition of ShiftWise, a leading national provider of web-based healthcare workforce solutions, including its VMS utilized by hospitals and other healthcare systems. The strategic combination has added a new and more robust technology platform to the Company’s current workforce solutions offerings and will allow the Company to enhance its managed services business and provide a vendor neutral VMS option for interested clients. The acquisition is not considered a material business combination and, accordingly, pro forma information is not provided. The acquisition was funded through cash on-hand and we have not incurred any material acquisition related costs.
The Company accounted for the acquisition using the acquisition method of accounting and, accordingly, it recorded the tangible and intangible assets acquired and liabilities assumed at their estimated fair values as of the date of the acquisition. The purchase price of the acquisition totaled $39,500, of which $6,000 was deposited in escrow to satisfy any indemnification claims by the Company with respect to, among other customary items, breaches of representations, warranties and covenants by ShiftWise and post-closing purchase price adjustments. As of the date of this Annual Report on Form 10-K, the Company is still finalizing the allocation of the purchase price. The provisional items pending finalization are primarily related to tax related matters upon the completion of ShiftWise’s tax return, which the Company expects to complete during 2014.
The preliminary allocation of the purchase price consisted of $9,899 of fair value of assets acquired, $11,507 of liabilities assumed (including $2,639 of deferred tax liabilities), $21,318 of goodwill and $19,790 of identified intangible assets. The intangible assets include the fair value of trade names and trademarks, customer relationships, non-compete agreements and acquired technologies. The weighted average useful life of the acquired intangible assets subject to amortization is approximately 8 years. There is no goodwill recognized as part of this acquisition that is deducible for tax purposes.
The Company recorded $389 in acquisition-related costs for accounting, legal and other costs in connection with the acquisition within selling, general and administrative expenses in its consolidated statement of comprehensive income for 2013.
The results of operations of ShiftWise from and after the acquisition date, which were not material, have been included in the nurse and allied healthcare staffing segment in the Company’s consolidated financial statements.
(4) Fair Value Measurement
The authoritative guidance defines fair value as the exchange price that would be received for an asset or paid to transfer a liability (an exit price) in the principal or most advantageous market for the asset or liability in an orderly transaction between market participants on the measurement date. It also establishes a fair value hierarchy which requires an entity to maximize the use of observable inputs and minimize the use of unobservable inputs when measuring fair value. The standard describes three levels of inputs that may be used to measure fair value:
Level 1—Quoted prices in active markets for identical assets or liabilities.
Level 2—Observable inputs other than Level 1 prices such as quoted prices for similar assets or liabilities; quoted prices in markets that are not active; or other inputs that are observable or can be corroborated by observable market data for substantially the full term of the assets or liabilities.
Level 3—Unobservable inputs that are supported by little or no market activity and that are significant to the fair value of the assets or liabilities.
Financial assets and liabilities
The Company utilizes the market approach to measure fair value for its financial assets and liabilities. The market approach uses prices and other relevant information generated by market transactions involving identical or comparable assets or liabilities. As of December 31, 2013 and 2012, the Company held certain assets that are required to be measured at fair value on a recurring basis. These included the restricted cash equivalents and investments and the Company’s investments associated with the Company’s deferred compensation plan. The Company’s restricted cash equivalents and investments typically consist of U.S. Treasury securities and money market funds, and the fair value is based on quoted prices in active markets for identical assets. The Company’s investments associated with its deferred compensation plan typically consist of money market funds and mutual funds that are publicly traded and for which market prices are readily available.
Financial assets measured at fair value on a recurring basis are summarized below:
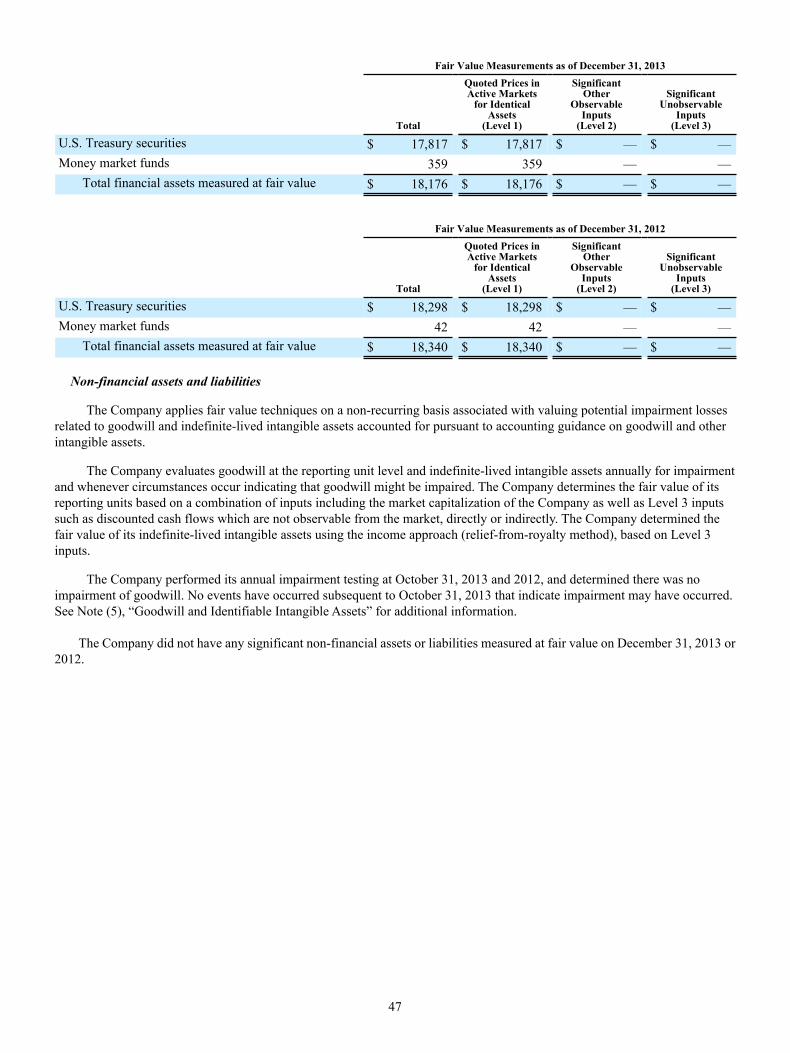
47
Fair Value Measurements as of December 31, 2013
Total
Quoted Prices inActive Markets
for IdenticalAssets
(Level 1)
SignificantOther
ObservableInputs
(Level 2)
SignificantUnobservable
Inputs(Level 3)
U.S. Treasury securities $ 17,817 $ 17,817 $ — $ —Money market funds 359 359 — —
Total financial assets measured at fair value $ 18,176 $ 18,176 $ — $ —
Fair Value Measurements as of December 31, 2012
Total
Quoted Prices inActive Markets
for IdenticalAssets
(Level 1)
SignificantOther
ObservableInputs
(Level 2)
SignificantUnobservable
Inputs(Level 3)
U.S. Treasury securities $ 18,298 $ 18,298 $ — $ —Money market funds 42 42 — —
Total financial assets measured at fair value $ 18,340 $ 18,340 $ — $ —
Non-financial assets and liabilities
The Company applies fair value techniques on a non-recurring basis associated with valuing potential impairment losses related to goodwill and indefinite-lived intangible assets accounted for pursuant to accounting guidance on goodwill and other intangible assets.
The Company evaluates goodwill at the reporting unit level and indefinite-lived intangible assets annually for impairment and whenever circumstances occur indicating that goodwill might be impaired. The Company determines the fair value of its reporting units based on a combination of inputs including the market capitalization of the Company as well as Level 3 inputs such as discounted cash flows which are not observable from the market, directly or indirectly. The Company determined the fair value of its indefinite-lived intangible assets using the income approach (relief-from-royalty method), based on Level 3 inputs.
The Company performed its annual impairment testing at October 31, 2013 and 2012, and determined there was no impairment of goodwill. No events have occurred subsequent to October 31, 2013 that indicate impairment may have occurred. See Note (5), “Goodwill and Identifiable Intangible Assets” for additional information.
The Company did not have any significant non-financial assets or liabilities measured at fair value on December 31, 2013 or 2012.

48
(5) Goodwill and Identifiable Intangible Assets
As of December 31, 2013 and 2012, the Company had the following acquired intangible assets:
As of December 31, 2013 As of December 31, 2012
GrossCarryingAmount
AccumulatedAmortization
NetCarryingAmount
GrossCarryingAmount
AccumulatedAmortization
NetCarryingAmount
Intangible assets subject to amortization:Staffing databases $ 5,450 $ (4,444) $ 1,006 $ 5,450 $ (3,839) $ 1,611Customer relationships 72,990 (29,363) 43,627 64,990 (24,539) 40,451Tradenames and trademarks 16,871 (6,203) 10,668 16,871 (5,231) 11,640Non-compete agreements 1,666 (1,484) 182 1,476 (1,468) 8Acquired technology 6,200 (886) 5,314 800 (800) —Online courses 59 (59) — 59 (59) —
$ 103,236 $ (42,439) $ 60,797 $ 89,646 $ (35,936) $ 53,710Intangible assets not subject toamortization:
Goodwill $ 144,642 $ 123,324Tradenames and trademarks 89,400 83,200
$ 234,042 $ 206,524
Aggregate amortization expense for intangible assets was $6,503 and $6,665 for the years ended December 31, 2013 and 2012, respectively. Based on the current amount of intangibles subject to amortization, the estimated amortization expense as of December 31, 2013 is as follows:
Amount
Year ending December 31, 2014 $ 7,618Year ending December 31, 2015 7,414Year ending December 31, 2016 6,946Year ending December 31, 2017 6,729Year ending December 31, 2018 6,527Thereafter 25,563
$ 60,797
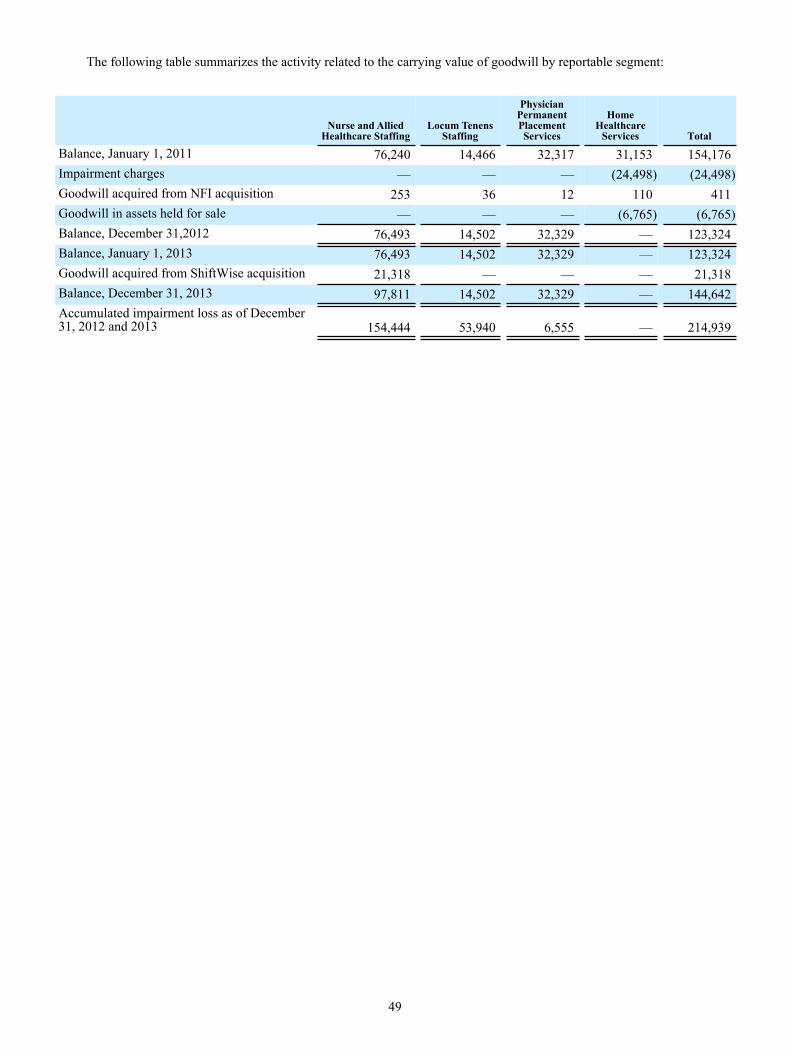
49
The following table summarizes the activity related to the carrying value of goodwill by reportable segment:
Nurse and AlliedHealthcare Staffing
Locum TenensStaffing
PhysicianPermanentPlacementServices
HomeHealthcare
Services Total
Balance, January 1, 2011 76,240 14,466 32,317 31,153 154,176Impairment charges — — — (24,498) (24,498)Goodwill acquired from NFI acquisition 253 36 12 110 411Goodwill in assets held for sale — — — (6,765) (6,765)Balance, December 31,2012 76,493 14,502 32,329 — 123,324Balance, January 1, 2013 76,493 14,502 32,329 — 123,324Goodwill acquired from ShiftWise acquisition 21,318 — — — 21,318Balance, December 31, 2013 97,811 14,502 32,329 — 144,642Accumulated impairment loss as of December31, 2012 and 2013 154,444 53,940 6,555 — 214,939

50
(6) Balance Sheet Details
The consolidated balance sheets detail is as follows as of December 31, 2013 and 2012:
As of December 31,
2013 2012
Prepaids and other current assets: Prepaid expenses $ 8,128 $ 7,282 Restricted cash 8,325 2,540 Income taxes receivable 3,084 337 Other current assets 4,296 8,804
Prepaids and other current assets $ 23,833 $ 18,963Fixed assets:
Furniture and equipment $ 16,413 $ 15,786Software 62,471 60,195Leasehold improvements 5,305 5,062
84,189 81,043Accumulated depreciation and amortization (63,031) (66,228)
Fixed assets, net $ 21,158 $ 14,815Accounts payable and accrued expenses:
Trade and accrued accounts payable $ 29,857 $ 26,229Accounts payable to agencies 7,431 —Subcontractor payable 22,051 18,129Professional liability reserve 8,485 6,535Other 1,583 1,726
Accounts payable and accrued expenses $ 69,407 $ 52,619Accrued compensation and benefits:
Accrued payroll $ 17,216 $ 14,992Accrued bonuses 11,359 10,812Accrued travel expense 2,203 3,132Accrued health insurance reserve 2,022 2,330Accrued workers compensation reserve 4,187 4,161Deferred compensation 17,731 13,935Other 107 81
Accrued compensation and benefits $ 54,825 $ 49,443
Other current liabilities:Facility client deposits $ 2,409 $ 2,831Bank overdraft 234 —Other 3,417 4,632
Other current liabilities $ 6,060 $ 7,463
Other long-term liabilities:Workers compensation reserve $ 9,849 $ 10,549Professional liability reserve 21,395 18,053Deferred rent 6,625 7,785Unrecognized tax benefits 27,178 24,593Deferred income taxes, net 17,764 5,281Other 2,717 1,311
Other long-term liabilities $ 85,528 $ 67,572

51
(7) Income Taxes
The provision for income taxes from continuing operations for the years ended December 31, 2013, 2012 and 2011 consists of the following:
Years Ended December 31, 2013 2012 2011
Current income taxes:Federal $ 17,268 $ 3,334 $ 8,493State 2,605 727 2,246Foreign — (2) (40)
Total 19,873 4,059 10,699Deferred income taxes:
Federal 1,693 5,663 (1,500)State 1,338 1,288 (390)Foreign — — 95
Total 3,031 6,951 (1,795)Provision for income taxes from continuing operations $ 22,904 $ 11,010 $ 8,904
The Company’s income tax expense differs from the amount that would have resulted from applying the federal statutory
rate of 35% to pretax income (loss) from continuing operations because of the effect of the following items during the years ended December 31, 2013, 2012 and 2011:
Years Ended December 31, 2013 2012 2011
Tax expense at federal statutory rate $ 19,543 $ 9,563 $ 4,871State taxes, net of federal benefit 2,302 1,263 1,067Unrecognized tax benefit 1,952 742 2,198Non-deductible goodwill and intangibles impairment (19) (18) (18)Other, net (874) (540) 786
Income tax expense from continuing operations $ 22,904 $ 11,010 $ 8,904
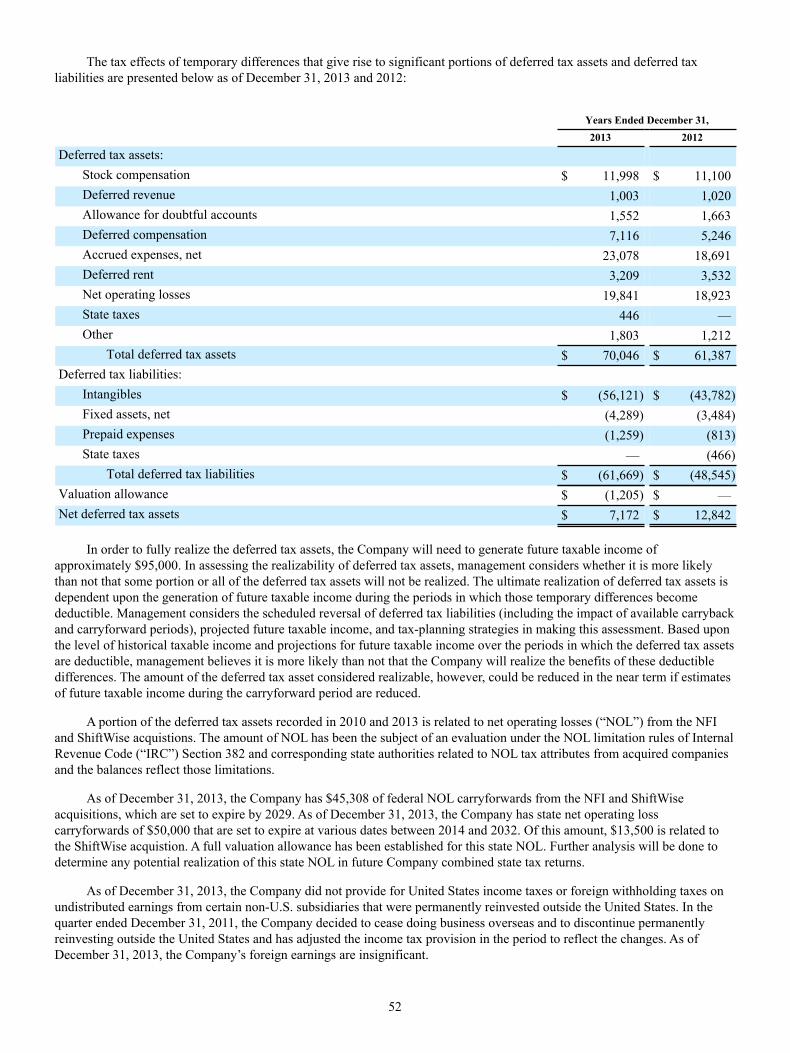
52
The tax effects of temporary differences that give rise to significant portions of deferred tax assets and deferred tax liabilities are presented below as of December 31, 2013 and 2012:
Years Ended December 31, 2013 2012
Deferred tax assets:Stock compensation $ 11,998 $ 11,100Deferred revenue 1,003 1,020Allowance for doubtful accounts 1,552 1,663Deferred compensation 7,116 5,246Accrued expenses, net 23,078 18,691Deferred rent 3,209 3,532Net operating losses 19,841 18,923State taxes 446 —Other 1,803 1,212
Total deferred tax assets $ 70,046 $ 61,387Deferred tax liabilities:
Intangibles $ (56,121) $ (43,782)Fixed assets, net (4,289) (3,484)Prepaid expenses (1,259) (813)State taxes — (466)
Total deferred tax liabilities $ (61,669) $ (48,545)Valuation allowance $ (1,205) $ —Net deferred tax assets $ 7,172 $ 12,842
In order to fully realize the deferred tax assets, the Company will need to generate future taxable income of
approximately $95,000. In assessing the realizability of deferred tax assets, management considers whether it is more likely than not that some portion or all of the deferred tax assets will not be realized. The ultimate realization of deferred tax assets is dependent upon the generation of future taxable income during the periods in which those temporary differences become deductible. Management considers the scheduled reversal of deferred tax liabilities (including the impact of available carryback and carryforward periods), projected future taxable income, and tax-planning strategies in making this assessment. Based upon the level of historical taxable income and projections for future taxable income over the periods in which the deferred tax assets are deductible, management believes it is more likely than not that the Company will realize the benefits of these deductible differences. The amount of the deferred tax asset considered realizable, however, could be reduced in the near term if estimates of future taxable income during the carryforward period are reduced.
A portion of the deferred tax assets recorded in 2010 and 2013 is related to net operating losses (“NOL”) from the NFI and ShiftWise acquistions. The amount of NOL has been the subject of an evaluation under the NOL limitation rules of Internal Revenue Code (“IRC”) Section 382 and corresponding state authorities related to NOL tax attributes from acquired companies and the balances reflect those limitations.
As of December 31, 2013, the Company has $45,308 of federal NOL carryforwards from the NFI and ShiftWise acquisitions, which are set to expire by 2029. As of December 31, 2013, the Company has state net operating loss carryforwards of $50,000 that are set to expire at various dates between 2014 and 2032. Of this amount, $13,500 is related to the ShiftWise acquistion. A full valuation allowance has been established for this state NOL. Further analysis will be done to determine any potential realization of this state NOL in future Company combined state tax returns.
As of December 31, 2013, the Company did not provide for United States income taxes or foreign withholding taxes on undistributed earnings from certain non-U.S. subsidiaries that were permanently reinvested outside the United States. In the quarter ended December 31, 2011, the Company decided to cease doing business overseas and to discontinue permanently reinvesting outside the United States and has adjusted the income tax provision in the period to reflect the changes. As of December 31, 2013, the Company’s foreign earnings are insignificant.

53
A summary of the changes in the amount of unrecognized tax benefits for 2013, 2012 and 2011 is as follows:
2013 2012 2011
Beginning balance of unrecognized tax benefits $ 21,415 $ 21,221 $ 19,291Additions based on tax positions related to the current year 809 1,096 1,541Additions based on tax positions of prior years 349 — 512Reductions for tax positions of prior years — — (123)Reductions due to lapse of applicable statute of limitation — (902) —Ending balance of unrecognized tax benefits $ 22,573 $ 21,415 $ 21,221
At December 31, 2013, if recognized, approximately $24,085, net of $3,093 of temporary differences, would affect the
effective tax rate (including interest and penalties).
The Company recognizes interest and penalties related to unrecognized tax benefits in income tax expense. The Company has approximately $4,605, $3,178 and $2,710 of accrued interest and penalties related to unrecognized tax benefits at December 31, 2013, 2012 and 2011, respectively. The amount of interest and penalties recognized in 2013, 2012 and 2011 were $1,427, $468 and $709, respectively.
The Company is subject to taxation in the U.S. and various states and foreign jurisdictions. With few exceptions, as of December 31, 2013, the Company is no longer subject to U.S. federal, state, local or foreign examinations by tax authorities for years before 2005. The Internal Revenue Service (“IRS”) completed its tax audit of the Company for the years 2007, 2008, 2009 and 2010. The IRS has issued a Revenue Agent Report (RAR) to the Company related to its completed tax examination. The RAR seeks adjustments to the Company’s taxable income for 2007-2010 and net operating loss carryforwards from 2005-2006. The adjustments to the Company’s taxable income relate to the proposed disallowance of certain per diems paid to our clinicians and locum tenens providers on the Company’s income tax return. Concurrent with the RAR, the Company received an Employment Tax Examination Report (ETER) for 2009 and 2010. The ETER adjustments propose additional Company payroll tax liabilities and penalties related to the treatment of certain non-taxable per diem allowances and travel benefits. The positions in the RAR and ETER are mutually exclusive. The RAR and ETER contain multiple tax positions, some of which are contrary to each other. Thus, the Company is unable to determine any reasonable range of potential claim at this time.
The Company has filed a Protest Letter for both the RAR and ETER and intends to defend its position. The Company recently held its first meeting with the IRS Appeals office. The Company does not expect resolution of this matter within twelve months and cannot predict with certainty the timing of such resolution. The Company believes its reserve for unrecognized tax benefits and contingent tax issues is adequate. Notwithstanding, the Company could adjust its provision for income taxes and or contingent tax liability based on future developments. The IRS has begun a separate 2011-2012 income and payroll tax audit during November 2013.
The Company does not foresee material changes to its gross unrecognized tax benefits within the next twelve months. (8) Notes Payable and Credit Agreement
On April 5, 2012, the Company entered into a Credit Agreement (the “Credit Agreement”) with several lenders to provide for two credit facilities (the “Credit Facilities”), including (A) a $50,000 secured revolving credit facility (the “Revolver”) that included a $20,000 sublimit for the issuance of letters of credit and a $15,000 sublimit for swingline loans and (B) a $200,000 face value secured term loan credit facility (the “Term Loan”), net of unamortized original issue discount of $2,000. In addition, the Credit Agreement provides that the Company may from time to time obtain an increase in the Revolver or the Term Loan in an aggregate principal amount not to exceed $75,000 (with a $37,500 sublimit for the Revolver) subject to, among other conditions, the arrangement of additional commitments with financial institutions reasonably acceptable to the Company and the administrative agent.
The Credit Agreement contains various customary affirmative and negative covenants, including restrictions on assumption of additional indebtedness, declaration and payment of dividends, dispositions of assets, consolidation into another entity, capital expenditures in excess of specified amounts and allowable investments. It also contains financial covenants that require the Company (1) not to exceed a certain maximum consolidated leverage ratio and (2) to maintain a minimum consolidated interest coverage ratio.
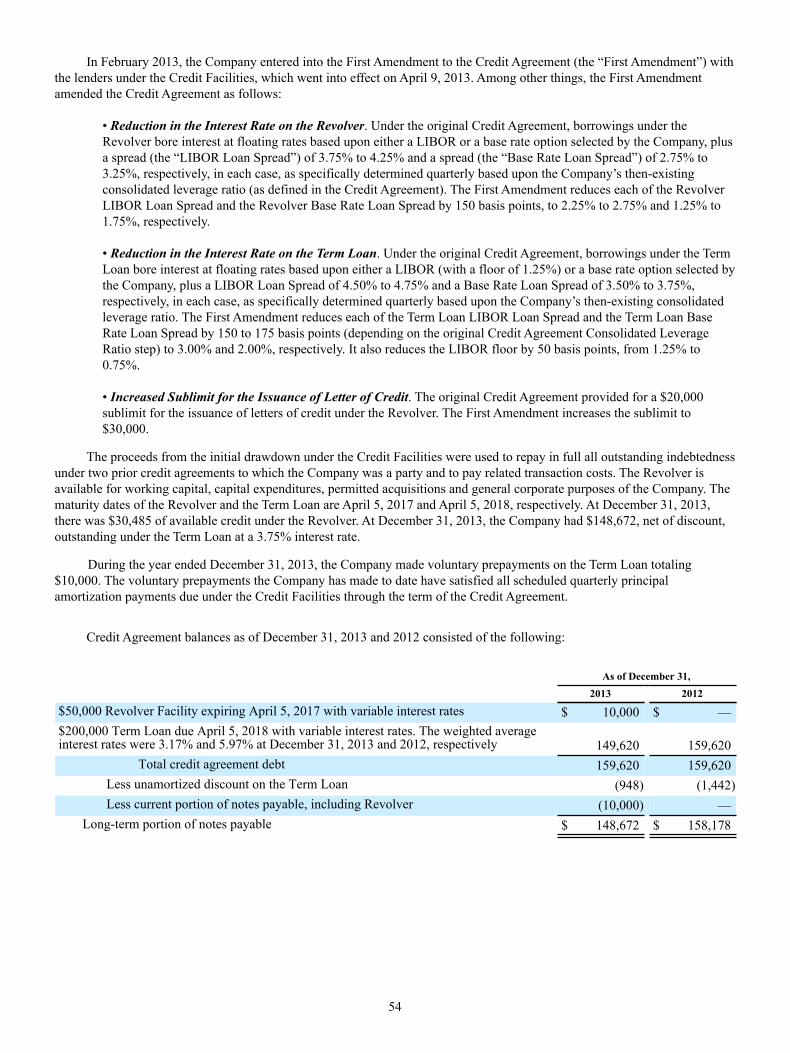
54
In February 2013, the Company entered into the First Amendment to the Credit Agreement (the “First Amendment”) with the lenders under the Credit Facilities, which went into effect on April 9, 2013. Among other things, the First Amendment amended the Credit Agreement as follows:
• Reduction in the Interest Rate on the Revolver. Under the original Credit Agreement, borrowings under the Revolver bore interest at floating rates based upon either a LIBOR or a base rate option selected by the Company, plus a spread (the “LIBOR Loan Spread”) of 3.75% to 4.25% and a spread (the “Base Rate Loan Spread”) of 2.75% to 3.25%, respectively, in each case, as specifically determined quarterly based upon the Company’s then-existing consolidated leverage ratio (as defined in the Credit Agreement). The First Amendment reduces each of the Revolver LIBOR Loan Spread and the Revolver Base Rate Loan Spread by 150 basis points, to 2.25% to 2.75% and 1.25% to 1.75%, respectively.
• Reduction in the Interest Rate on the Term Loan. Under the original Credit Agreement, borrowings under the Term Loan bore interest at floating rates based upon either a LIBOR (with a floor of 1.25%) or a base rate option selected by the Company, plus a LIBOR Loan Spread of 4.50% to 4.75% and a Base Rate Loan Spread of 3.50% to 3.75%, respectively, in each case, as specifically determined quarterly based upon the Company’s then-existing consolidated leverage ratio. The First Amendment reduces each of the Term Loan LIBOR Loan Spread and the Term Loan Base Rate Loan Spread by 150 to 175 basis points (depending on the original Credit Agreement Consolidated Leverage Ratio step) to 3.00% and 2.00%, respectively. It also reduces the LIBOR floor by 50 basis points, from 1.25% to 0.75%.
• Increased Sublimit for the Issuance of Letter of Credit. The original Credit Agreement provided for a $20,000 sublimit for the issuance of letters of credit under the Revolver. The First Amendment increases the sublimit to $30,000.
The proceeds from the initial drawdown under the Credit Facilities were used to repay in full all outstanding indebtedness under two prior credit agreements to which the Company was a party and to pay related transaction costs. The Revolver is available for working capital, capital expenditures, permitted acquisitions and general corporate purposes of the Company. The maturity dates of the Revolver and the Term Loan are April 5, 2017 and April 5, 2018, respectively. At December 31, 2013, there was $30,485 of available credit under the Revolver. At December 31, 2013, the Company had $148,672, net of discount, outstanding under the Term Loan at a 3.75% interest rate.
During the year ended December 31, 2013, the Company made voluntary prepayments on the Term Loan totaling $10,000. The voluntary prepayments the Company has made to date have satisfied all scheduled quarterly principal amortization payments due under the Credit Facilities through the term of the Credit Agreement.
Credit Agreement balances as of December 31, 2013 and 2012 consisted of the following:
As of December 31, 2013 2012
$50,000 Revolver Facility expiring April 5, 2017 with variable interest rates $ 10,000 $ —$200,000 Term Loan due April 5, 2018 with variable interest rates. The weighted averageinterest rates were 3.17% and 5.97% at December 31, 2013 and 2012, respectively 149,620 159,620
Total credit agreement debt 159,620 159,620Less unamortized discount on the Term Loan (948) (1,442)Less current portion of notes payable, including Revolver (10,000) —
Long-term portion of notes payable $ 148,672 $ 158,178

55
Annual principal maturities of outstanding debts, excluding the Revolver, are as follows:
2014 $ —2015 — 2016 — 2017 — 2018 149,620
$ 149,620
The Company’s outstanding debt instruments at December 31, 2013 and 2012 were secured by substantially all of the assets of the Company and the common stock or equity interests of its domestic subsidiaries.
Letters of Credit
At December 31, 2013, the Company maintained outstanding standby letters of credit totaling $27,691 as collateral in relation to its professional liability insurance agreements, workers compensation insurance agreements, and a corporate headquarters office lease agreement. Of the $27,691 outstanding letters of credit, the Company has cash collateralized $18,176 and the remaining amount has been collateralized by the Revolver. Outstanding standby letters of credit at December 31, 2012 totaled $31,879. (9) Retirement Plans
The Company maintains the AMN Services 401(k) Retirement Savings Plan (the “AMN Plan”), which the Company believes complies with the Internal Revenue Code Section 401(k) provisions. The AMN Plan covers all employees that meet certain age and other eligibility requirements. An annual discretionary matching contribution is determined by the Compensation and Stock Plan Committee of the Board of Directors each year. The amount of the employer contributions, net of forfeitures, under the AMN Plan were $165, $0 and $0 for the years ended December 31, 2013, 2012 and 2011, respectively.
The Company has a deferred compensation plan for certain executives and key employees (the “Plan”). The Plan is not intended to be tax qualified and is an unfunded plan. The Plan is composed of deferred compensation and all related income and losses attributable thereto. Discretionary matching contributions to the Plan are made that vest incrementally so that the employee is fully vested in the match following five years of employment with the Company. Under the Plan, participants can defer up to 80% of their base salary, 90% of their bonus (100% of their bonus prior to 2011) and 100% of their vested restricted stock units or vested performance restricted stock units. An annual discretionary matching contribution is determined by the Compensation and Stock Plan Committee of the Board of Directors each year. The amount of the employer contributions under the Plan were $384, $343 and $327 for the years ended December 31, 2013, 2012 and 2011, respectively. (10) Capital Stock
(a) Preferred Stock
The Company has 10,000 shares of preferred stock authorized for issuance in one or more series (including preferred stock designated as Series A Conditional Convertible Preferred Stock), at a par value of $0.01 per share. At December 31, 2013 and 2012, no shares of preferred stock were outstanding.
(b) Treasury Stock
In connection with the 2010 acquisition of NFI, 457 shares of the Company’s common stock remained in escrow as of December 31, 2012 for potential Company indemnification claims. During the second quarter of 2013, the Company and former NFI selling shareholders agreed to release all 457 shares in escrow as follows: 1) 204 shares were returned to the Company for settlement of certain indemnification claims, which have been recorded as a $3,046 benefit offsetting selling, general and administrative expenses for the year ended December 31, 2013; and 2) the remaining 253 shares were released from escrow to the former NFI selling shareholders. During 2013, the Company cancelled and retired all 204 shares of treasury stock. Upon cancellation and retirement, these shares were returned to the status of authorized and unissued.
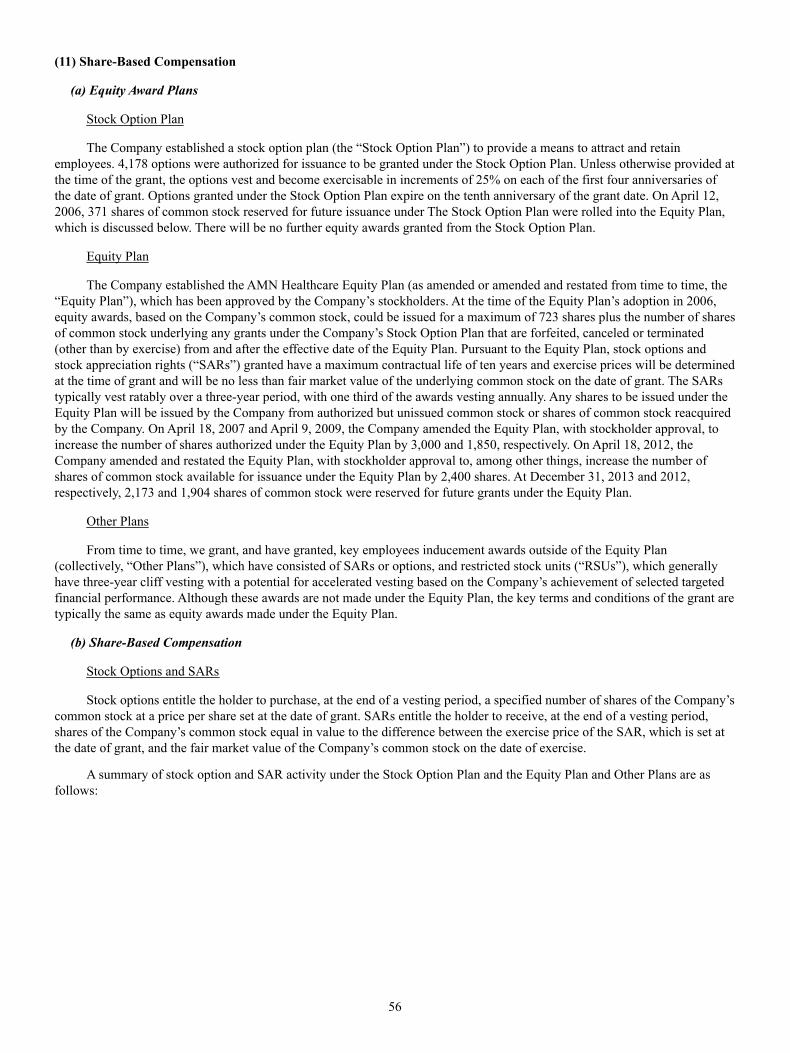
56
(11) Share-Based Compensation
(a) Equity Award Plans
Stock Option Plan
The Company established a stock option plan (the “Stock Option Plan”) to provide a means to attract and retain employees. 4,178 options were authorized for issuance to be granted under the Stock Option Plan. Unless otherwise provided at the time of the grant, the options vest and become exercisable in increments of 25% on each of the first four anniversaries of the date of grant. Options granted under the Stock Option Plan expire on the tenth anniversary of the grant date. On April 12, 2006, 371 shares of common stock reserved for future issuance under The Stock Option Plan were rolled into the Equity Plan, which is discussed below. There will be no further equity awards granted from the Stock Option Plan.
Equity Plan
The Company established the AMN Healthcare Equity Plan (as amended or amended and restated from time to time, the “Equity Plan”), which has been approved by the Company’s stockholders. At the time of the Equity Plan’s adoption in 2006, equity awards, based on the Company’s common stock, could be issued for a maximum of 723 shares plus the number of shares of common stock underlying any grants under the Company’s Stock Option Plan that are forfeited, canceled or terminated (other than by exercise) from and after the effective date of the Equity Plan. Pursuant to the Equity Plan, stock options and stock appreciation rights (“SARs”) granted have a maximum contractual life of ten years and exercise prices will be determined at the time of grant and will be no less than fair market value of the underlying common stock on the date of grant. The SARs typically vest ratably over a three-year period, with one third of the awards vesting annually. Any shares to be issued under the Equity Plan will be issued by the Company from authorized but unissued common stock or shares of common stock reacquired by the Company. On April 18, 2007 and April 9, 2009, the Company amended the Equity Plan, with stockholder approval, to increase the number of shares authorized under the Equity Plan by 3,000 and 1,850, respectively. On April 18, 2012, the Company amended and restated the Equity Plan, with stockholder approval to, among other things, increase the number of shares of common stock available for issuance under the Equity Plan by 2,400 shares. At December 31, 2013 and 2012, respectively, 2,173 and 1,904 shares of common stock were reserved for future grants under the Equity Plan.
Other Plans
From time to time, we grant, and have granted, key employees inducement awards outside of the Equity Plan (collectively, “Other Plans”), which have consisted of SARs or options, and restricted stock units (“RSUs”), which generally have three-year cliff vesting with a potential for accelerated vesting based on the Company’s achievement of selected targeted financial performance. Although these awards are not made under the Equity Plan, the key terms and conditions of the grant are typically the same as equity awards made under the Equity Plan.
(b) Share-Based Compensation
Stock Options and SARs
Stock options entitle the holder to purchase, at the end of a vesting period, a specified number of shares of the Company’s common stock at a price per share set at the date of grant. SARs entitle the holder to receive, at the end of a vesting period, shares of the Company’s common stock equal in value to the difference between the exercise price of the SAR, which is set at the date of grant, and the fair market value of the Company’s common stock on the date of exercise.
A summary of stock option and SAR activity under the Stock Option Plan and the Equity Plan and Other Plans are as follows:
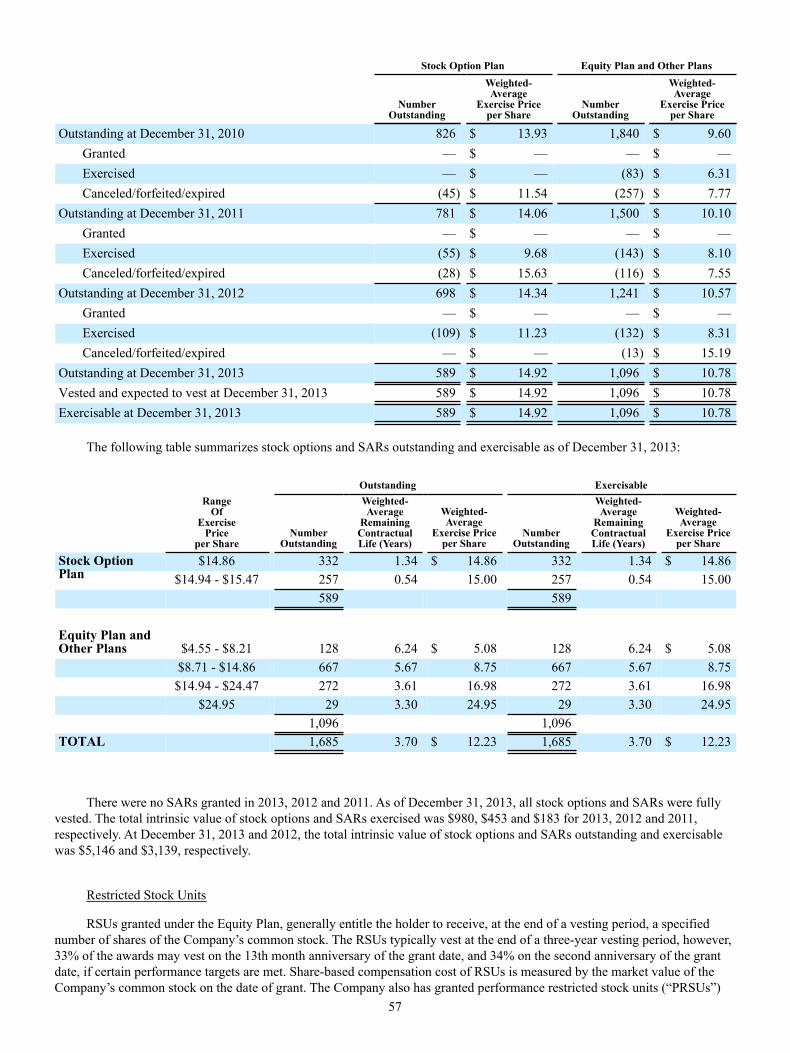
57
Stock Option Plan Equity Plan and Other Plans
Number
Outstanding
Weighted-Average
Exercise Priceper Share
NumberOutstanding
Weighted-Average
Exercise Priceper Share
Outstanding at December 31, 2010 826 $ 13.93 1,840 $ 9.60Granted — $ — — $ —Exercised — $ — (83) $ 6.31Canceled/forfeited/expired (45) $ 11.54 (257) $ 7.77
Outstanding at December 31, 2011 781 $ 14.06 1,500 $ 10.10Granted — $ — — $ —Exercised (55) $ 9.68 (143) $ 8.10Canceled/forfeited/expired (28) $ 15.63 (116) $ 7.55
Outstanding at December 31, 2012 698 $ 14.34 1,241 $ 10.57Granted — $ — — $ —Exercised (109) $ 11.23 (132) $ 8.31Canceled/forfeited/expired — $ — (13) $ 15.19
Outstanding at December 31, 2013 589 $ 14.92 1,096 $ 10.78Vested and expected to vest at December 31, 2013 589 $ 14.92 1,096 $ 10.78Exercisable at December 31, 2013 589 $ 14.92 1,096 $ 10.78
The following table summarizes stock options and SARs outstanding and exercisable as of December 31, 2013:
Outstanding Exercisable
RangeOf
ExercisePrice
per ShareNumber
Outstanding
Weighted-Average
RemainingContractualLife (Years)
Weighted-Average
Exercise Priceper Share
NumberOutstanding
Weighted-Average
RemainingContractualLife (Years)
Weighted-Average
Exercise Priceper Share
Stock OptionPlan
$14.86 332 1.34 $ 14.86 332 1.34 $ 14.86$14.94 - $15.47 257 0.54 15.00 257 0.54 15.00
589 589
Equity Plan andOther Plans $4.55 - $8.21 128 6.24 $ 5.08 128 6.24 $ 5.08
$8.71 - $14.86 667 5.67 8.75 667 5.67 8.75$14.94 - $24.47 272 3.61 16.98 272 3.61 16.98
$24.95 29 3.30 24.95 29 3.30 24.951,096 1,096
TOTAL 1,685 3.70 $ 12.23 1,685 3.70 $ 12.23
There were no SARs granted in 2013, 2012 and 2011. As of December 31, 2013, all stock options and SARs were fully vested. The total intrinsic value of stock options and SARs exercised was $980, $453 and $183 for 2013, 2012 and 2011, respectively. At December 31, 2013 and 2012, the total intrinsic value of stock options and SARs outstanding and exercisable was $5,146 and $3,139, respectively.
Restricted Stock Units
RSUs granted under the Equity Plan, generally entitle the holder to receive, at the end of a vesting period, a specified number of shares of the Company’s common stock. The RSUs typically vest at the end of a three-year vesting period, however, 33% of the awards may vest on the 13th month anniversary of the grant date, and 34% on the second anniversary of the grant date, if certain performance targets are met. Share-based compensation cost of RSUs is measured by the market value of the Company’s common stock on the date of grant. The Company also has granted performance restricted stock units (“PRSUs”)
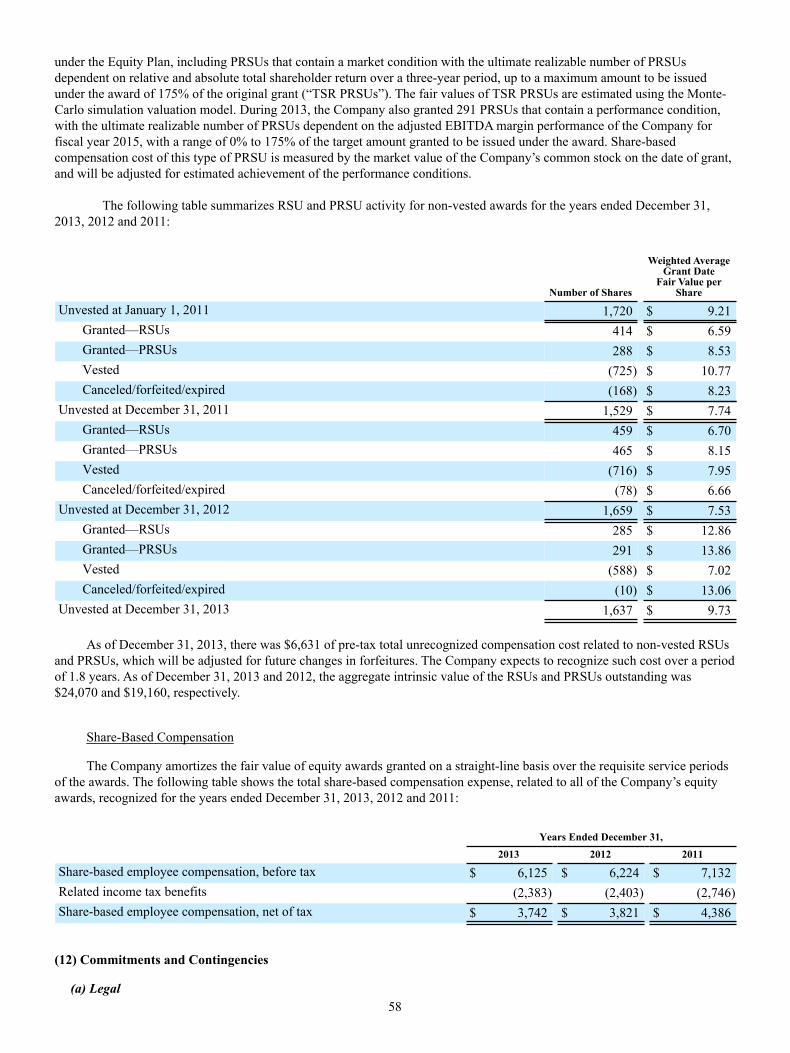
58
under the Equity Plan, including PRSUs that contain a market condition with the ultimate realizable number of PRSUs dependent on relative and absolute total shareholder return over a three-year period, up to a maximum amount to be issued under the award of 175% of the original grant (“TSR PRSUs”). The fair values of TSR PRSUs are estimated using the Monte-Carlo simulation valuation model. During 2013, the Company also granted 291 PRSUs that contain a performance condition, with the ultimate realizable number of PRSUs dependent on the adjusted EBITDA margin performance of the Company for fiscal year 2015, with a range of 0% to 175% of the target amount granted to be issued under the award. Share-based compensation cost of this type of PRSU is measured by the market value of the Company’s common stock on the date of grant, and will be adjusted for estimated achievement of the performance conditions.
The following table summarizes RSU and PRSU activity for non-vested awards for the years ended December 31, 2013, 2012 and 2011:
Number of Shares
Weighted AverageGrant Date
Fair Value perShare
Unvested at January 1, 2011 1,720 $ 9.21Granted—RSUs 414 $ 6.59Granted—PRSUs 288 $ 8.53Vested (725) $ 10.77Canceled/forfeited/expired (168) $ 8.23
Unvested at December 31, 2011 1,529 $ 7.74Granted—RSUs 459 $ 6.70Granted—PRSUs 465 $ 8.15Vested (716) $ 7.95Canceled/forfeited/expired (78) $ 6.66
Unvested at December 31, 2012 1,659 $ 7.53Granted—RSUs 285 $ 12.86Granted—PRSUs 291 $ 13.86Vested (588) $ 7.02Canceled/forfeited/expired (10) $ 13.06
Unvested at December 31, 2013 1,637 $ 9.73
As of December 31, 2013, there was $6,631 of pre-tax total unrecognized compensation cost related to non-vested RSUs and PRSUs, which will be adjusted for future changes in forfeitures. The Company expects to recognize such cost over a period of 1.8 years. As of December 31, 2013 and 2012, the aggregate intrinsic value of the RSUs and PRSUs outstanding was $24,070 and $19,160, respectively.
Share-Based Compensation
The Company amortizes the fair value of equity awards granted on a straight-line basis over the requisite service periods of the awards. The following table shows the total share-based compensation expense, related to all of the Company’s equity awards, recognized for the years ended December 31, 2013, 2012 and 2011:
Years Ended December 31, 2013 2012 2011
Share-based employee compensation, before tax $ 6,125 $ 6,224 $ 7,132Related income tax benefits (2,383) (2,403) (2,746)Share-based employee compensation, net of tax $ 3,742 $ 3,821 $ 4,386
(12) Commitments and Contingencies
(a) Legal
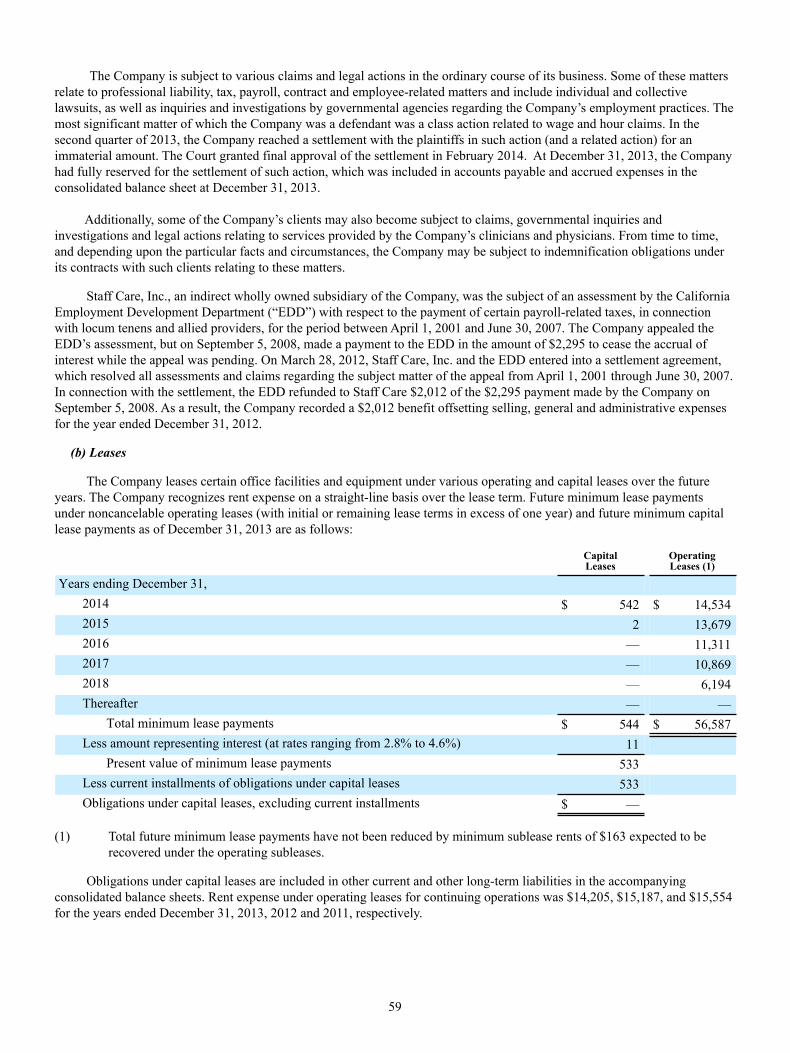
59
The Company is subject to various claims and legal actions in the ordinary course of its business. Some of these matters
relate to professional liability, tax, payroll, contract and employee-related matters and include individual and collective lawsuits, as well as inquiries and investigations by governmental agencies regarding the Company’s employment practices. The most significant matter of which the Company was a defendant was a class action related to wage and hour claims. In the second quarter of 2013, the Company reached a settlement with the plaintiffs in such action (and a related action) for an immaterial amount. The Court granted final approval of the settlement in February 2014. At December 31, 2013, the Company had fully reserved for the settlement of such action, which was included in accounts payable and accrued expenses in the consolidated balance sheet at December 31, 2013.
Additionally, some of the Company’s clients may also become subject to claims, governmental inquiries and investigations and legal actions relating to services provided by the Company’s clinicians and physicians. From time to time, and depending upon the particular facts and circumstances, the Company may be subject to indemnification obligations under its contracts with such clients relating to these matters.
Staff Care, Inc., an indirect wholly owned subsidiary of the Company, was the subject of an assessment by the California Employment Development Department (“EDD”) with respect to the payment of certain payroll-related taxes, in connection with locum tenens and allied providers, for the period between April 1, 2001 and June 30, 2007. The Company appealed the EDD’s assessment, but on September 5, 2008, made a payment to the EDD in the amount of $2,295 to cease the accrual of interest while the appeal was pending. On March 28, 2012, Staff Care, Inc. and the EDD entered into a settlement agreement, which resolved all assessments and claims regarding the subject matter of the appeal from April 1, 2001 through June 30, 2007. In connection with the settlement, the EDD refunded to Staff Care $2,012 of the $2,295 payment made by the Company on September 5, 2008. As a result, the Company recorded a $2,012 benefit offsetting selling, general and administrative expenses for the year ended December 31, 2012.
(b) Leases
The Company leases certain office facilities and equipment under various operating and capital leases over the future years. The Company recognizes rent expense on a straight-line basis over the lease term. Future minimum lease payments under noncancelable operating leases (with initial or remaining lease terms in excess of one year) and future minimum capital lease payments as of December 31, 2013 are as follows:
CapitalLeases
OperatingLeases (1)
Years ending December 31,2014 $ 542 $ 14,5342015 2 13,6792016 — 11,3112017 — 10,8692018 — 6,194Thereafter — —
Total minimum lease payments $ 544 $ 56,587Less amount representing interest (at rates ranging from 2.8% to 4.6%) 11
Present value of minimum lease payments 533Less current installments of obligations under capital leases 533Obligations under capital leases, excluding current installments $ —
(1) Total future minimum lease payments have not been reduced by minimum sublease rents of $163 expected to be recovered under the operating subleases.
Obligations under capital leases are included in other current and other long-term liabilities in the accompanying consolidated balance sheets. Rent expense under operating leases for continuing operations was $14,205, $15,187, and $15,554 for the years ended December 31, 2013, 2012 and 2011, respectively.

60
(13) Quarterly Financial Data (Unaudited)
Year Ended December 31, 2013
First
QuarterSecondQuarter
ThirdQuarter
FourthQuarter Total Year
(In thousands, except per share data)
Revenue $ 252,120 $ 253,943 $ 257,095 $ 248,658 $ 1,011,816Gross profit $ 73,007 $ 74,413 $ 75,667 $ 74,193 $ 297,280Net income $ 7,563 $ 8,399 $ 8,615 $ 8,356 $ 32,933Net income per share from:
Basic $ 0.17 $ 0.18 $ 0.19 $ 0.18 $ 0.72Diluted $ 0.16 $ 0.18 $ 0.18 $ 0.17 $ 0.69
Year Ended December 31, 2012
First
QuarterSecondQuarter
ThirdQuarter
FourthQuarter Total Year
(In thousands, except per share data)
Revenue $ 226,412 $ 235,786 $ 243,912 $ 247,841 $ 953,951Gross profit $ 63,214 $ 66,973 $ 69,583 $ 70,627 $ 270,397Income from continuing operations, net of tax $ 3,453 $ (81) $ 5,858 $ 7,083 $ 16,313Income (loss) from discontinued operations,net of tax $ 823 $ — $ — $ — $ 823Net income (loss) $ 4,276 $ (81) $ 5,858 $ 7,083 $ 17,136Basic income (loss) per share from:
Continuing operations $ 0.07 $ — $ 0.13 $ 0.16 $ 0.36Discontinued operations $ 0.02 $ — $ — $ — $ 0.02Net income (loss) $ 0.09 $ — $ 0.13 $ 0.16 $ 0.38
Diluted income (loss) per share from:Continuing operations $ 0.07 $ — $ 0.12 $ 0.15 $ 0.35Discontinued operations $ 0.02 $ — $ — $ — $ 0.02Net income (loss) $ 0.09 $ — $ 0.12 $ 0.15 $ 0.37
Item 9. Changes In and Disagreements With Accountants on Accounting and Financial Disclosure
None.
Item 9A. Controls and Procedures (1) Evaluation of Disclosure Controls and Procedures
We carried out an evaluation, under the supervision and with the participation of our management, including our principal executive officer and principal financial officer, of the effectiveness of our disclosure controls and procedures, as defined in Rules 13a-15(e) and 15d-15(e) of the Exchange Act. Based on that evaluation, our Chief Executive Officer and Chief Financial Officer have concluded that our disclosure controls and procedures as of December 31, 2013 were effective to ensure that information required to be disclosed by us in reports that we file or submit under the Exchange Act is recorded, processed, summarized and reported within the time periods specified in the SEC’s rules and forms.

61
(2) Management’s Annual Report on Internal Control over Financial Reporting
Our management is responsible for establishing and maintaining adequate internal control over financial reporting, as such term is defined in Rule 13a-15(f) of the Exchange Act. Under the supervision and with the participation of our management, including our Chief Executive Officer and Chief Financial Officer, we conducted an evaluation of the effectiveness of our internal control over financial reporting based on the framework in Internal Control—Integrated Framework (1992) issued by the Committee of Sponsoring Organizations of the Treadway Commission (COSO). Because of its inherent limitations, internal control over financial reporting may not prevent or detect misstatements. Also, projections of any evaluation of effectiveness to future periods are subject to the risk that controls may become inadequate because of changes in conditions, or that the degree of compliance with the policies or procedures may deteriorate. Based on our evaluation under the framework set forth in Internal Control—Integrated Framework (1992), management concluded that our internal control over financial reporting was effective as of December 31, 2013.
A company may omit an assessment of an acquired business’s internal control over financial reporting from its assessment of the registrant’s internal control; however, such exclusion may not extend beyond one year from the date of the acquisition, nor may such assessment be omitted from more than one annual management report on internal control over financial reporting. Accordingly, we acquired ShiftWise, Inc. (ShiftWise) on November 20, 2013, and excluded from the assessment of the effectiveness of our internal control over financial reporting as of December 31, 2013, ShiftWise’s internal control over financial reporting associated with total net assets of approximately $39.5 million and total revenues of approximately $1.4 million included in the consolidated financial statements as of and for the year ended December 31, 2013.
The effectiveness of our internal control over financial reporting as of December 31, 2013 has been audited by KPMG LLP, an independent registered public accounting firm, as stated in its report, which we include herein. KPMG’s audit of internal control over financial reporting of the Company also excluded an evaluation of the internal control over financial reporting of ShiftWise. (3) Changes in Internal Control Over Financial Reporting
There were no changes in our internal control over financial reporting that occurred during the quarter ended December 31, 2013 that have materially affected, or are reasonably likely to materially affect, our internal control over financial reporting.
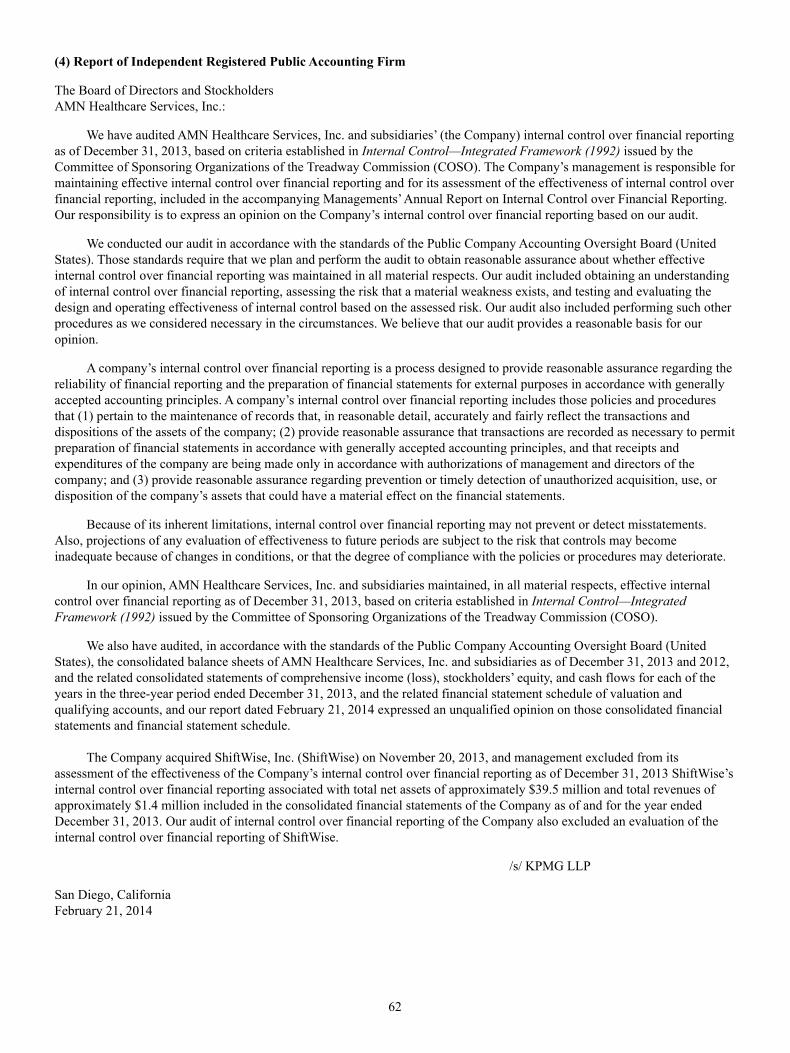
62
(4) Report of Independent Registered Public Accounting Firm The Board of Directors and StockholdersAMN Healthcare Services, Inc.:
We have audited AMN Healthcare Services, Inc. and subsidiaries’ (the Company) internal control over financial reporting as of December 31, 2013, based on criteria established in Internal Control—Integrated Framework (1992) issued by the Committee of Sponsoring Organizations of the Treadway Commission (COSO). The Company’s management is responsible for maintaining effective internal control over financial reporting and for its assessment of the effectiveness of internal control over financial reporting, included in the accompanying Managements’ Annual Report on Internal Control over Financial Reporting. Our responsibility is to express an opinion on the Company’s internal control over financial reporting based on our audit.
We conducted our audit in accordance with the standards of the Public Company Accounting Oversight Board (United States). Those standards require that we plan and perform the audit to obtain reasonable assurance about whether effective internal control over financial reporting was maintained in all material respects. Our audit included obtaining an understanding of internal control over financial reporting, assessing the risk that a material weakness exists, and testing and evaluating the design and operating effectiveness of internal control based on the assessed risk. Our audit also included performing such other procedures as we considered necessary in the circumstances. We believe that our audit provides a reasonable basis for our opinion.
A company’s internal control over financial reporting is a process designed to provide reasonable assurance regarding the reliability of financial reporting and the preparation of financial statements for external purposes in accordance with generally accepted accounting principles. A company’s internal control over financial reporting includes those policies and procedures that (1) pertain to the maintenance of records that, in reasonable detail, accurately and fairly reflect the transactions and dispositions of the assets of the company; (2) provide reasonable assurance that transactions are recorded as necessary to permit preparation of financial statements in accordance with generally accepted accounting principles, and that receipts and expenditures of the company are being made only in accordance with authorizations of management and directors of the company; and (3) provide reasonable assurance regarding prevention or timely detection of unauthorized acquisition, use, or disposition of the company’s assets that could have a material effect on the financial statements.
Because of its inherent limitations, internal control over financial reporting may not prevent or detect misstatements. Also, projections of any evaluation of effectiveness to future periods are subject to the risk that controls may become inadequate because of changes in conditions, or that the degree of compliance with the policies or procedures may deteriorate.
In our opinion, AMN Healthcare Services, Inc. and subsidiaries maintained, in all material respects, effective internal control over financial reporting as of December 31, 2013, based on criteria established in Internal Control—Integrated Framework (1992) issued by the Committee of Sponsoring Organizations of the Treadway Commission (COSO).
We also have audited, in accordance with the standards of the Public Company Accounting Oversight Board (United States), the consolidated balance sheets of AMN Healthcare Services, Inc. and subsidiaries as of December 31, 2013 and 2012, and the related consolidated statements of comprehensive income (loss), stockholders’ equity, and cash flows for each of the years in the three-year period ended December 31, 2013, and the related financial statement schedule of valuation and qualifying accounts, and our report dated February 21, 2014 expressed an unqualified opinion on those consolidated financial statements and financial statement schedule.
The Company acquired ShiftWise, Inc. (ShiftWise) on November 20, 2013, and management excluded from its assessment of the effectiveness of the Company’s internal control over financial reporting as of December 31, 2013 ShiftWise’s internal control over financial reporting associated with total net assets of approximately $39.5 million and total revenues of approximately $1.4 million included in the consolidated financial statements of the Company as of and for the year ended December 31, 2013. Our audit of internal control over financial reporting of the Company also excluded an evaluation of the internal control over financial reporting of ShiftWise.
/s/ KPMG LLP San Diego, CaliforniaFebruary 21, 2014

63
Item 9B. Other Information
None.
PART III
Item 10. Directors, Executive Officers and Corporate Governance
Information required by this item, other than the information below concerning our Code of Ethics for Senior Financial Officers and stockholder recommended nominations, is incorporated by reference to the Proxy Statement to be distributed in connection with our Annual Meeting of Stockholders currently scheduled to be held on April 23, 2014 (the “2014 Annual Meeting Proxy Statement”) under the headings “Election of Directors – Nominees for the Board of Directors,” “Executive Compensation Disclosure – Non-Director Executive Officers,” “Security Ownership and Other Matters – Section 16(a) Beneficial Ownership Reporting Compliance” and the table set forth in “Corporate Governance – Committees of the Board” identifying, among other things, members of our Board committees, and “Corporate Governance – Committees of the Board – Audit Committee.”
We have adopted a Code of Ethics for Senior Financial Officers that applies to our principal executive officer, principal financial officer, and principal accounting officer or any person performing similar functions, which we post on our website in the “Corporate Governance” link located at www.amnhealthcare.com/investors. We intend to publish any amendment to, or waiver from, the Code of Ethics for Senior Financial Officers on our website. We will provide any person, without charge, a copy of such Code of Ethics upon written request, which may be mailed to 12400 High Bluff Drive, Suite 100, San Diego, California 92130, Attn: Corporate Secretary.
There have been no material changes to the procedures by which stockholders may recommend nominees to our Board since we last disclosed information related to such procedures.
Item 11. Executive Compensation
Information required by this item is incorporated by reference to the 2014 Annual Meeting Proxy Statement under the headings “Compensation, Discussion and Analysis,” “Executive Compensation Disclosure,” “Director Compensation and Stock Ownership Guidelines – Director Compensation Table,” “Corporate Governance – Board Role In Risk Oversight,” “Corporate Governance – Committees of the Board – Compensation Committee – Compensation Committee Interlocks and Insider Participation,” and “Compensation Committee Report.”
Item 12. Security Ownership of Certain Beneficial Owners and Management and Related Stockholder Matters
Information required by this item, other than the information below concerning our equity compensation plans, is
incorporated by reference to the 2014 Annual Meeting Proxy Statement under the heading “Security Ownership and Other Matters – Security Ownership of Certain Beneficial Owners and Management.”
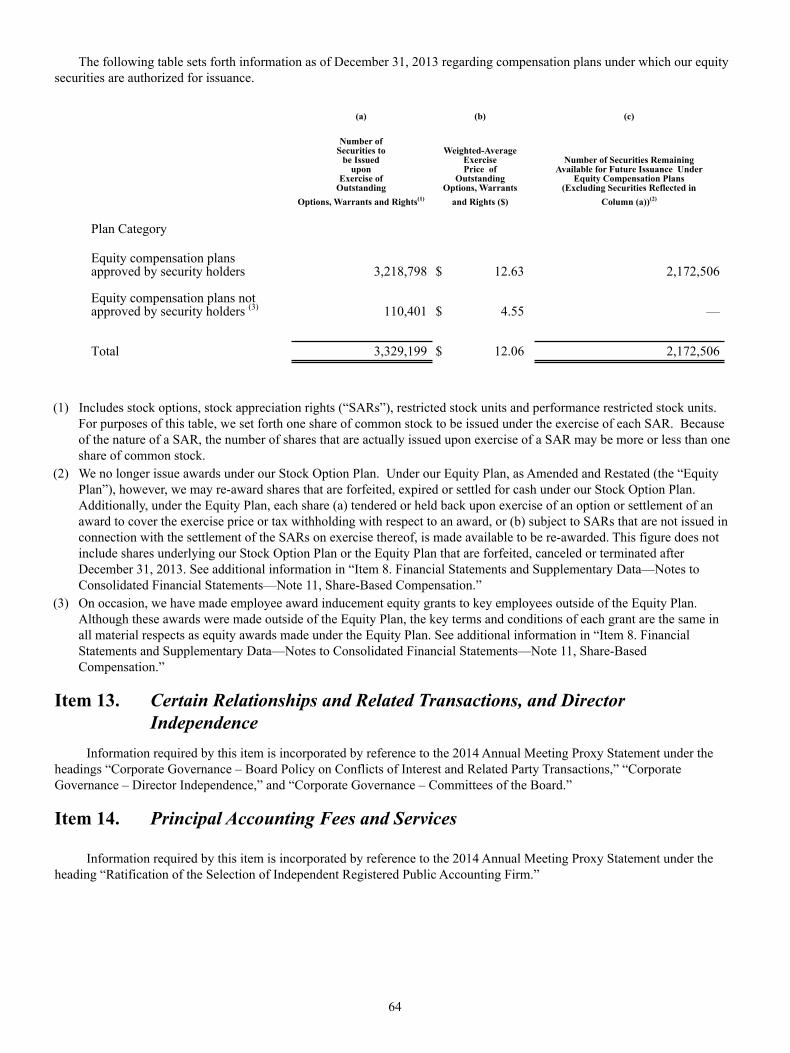
64
The following table sets forth information as of December 31, 2013 regarding compensation plans under which our equity securities are authorized for issuance.
(a) (b) (c)
Number ofSecurities to
be Issuedupon
Exercise ofOutstanding
Options, Warrants and Rights(1)
Weighted-AverageExercisePrice of
OutstandingOptions, Warrants
and Rights ($)
Number of Securities RemainingAvailable for Future Issuance Under
Equity Compensation Plans(Excluding Securities Reflected in
Column (a))(2)
Plan Category
Equity compensation plansapproved by security holders 3,218,798 $ 12.63 2,172,506
Equity compensation plans not approved by security holders (3) 110,401 $ 4.55 — Total 3,329,199 $ 12.06 2,172,506
(1) Includes stock options, stock appreciation rights (“SARs”), restricted stock units and performance restricted stock units. For purposes of this table, we set forth one share of common stock to be issued under the exercise of each SAR. Because of the nature of a SAR, the number of shares that are actually issued upon exercise of a SAR may be more or less than one share of common stock.
(2) We no longer issue awards under our Stock Option Plan. Under our Equity Plan, as Amended and Restated (the “Equity Plan”), however, we may re-award shares that are forfeited, expired or settled for cash under our Stock Option Plan. Additionally, under the Equity Plan, each share (a) tendered or held back upon exercise of an option or settlement of an award to cover the exercise price or tax withholding with respect to an award, or (b) subject to SARs that are not issued in connection with the settlement of the SARs on exercise thereof, is made available to be re-awarded. This figure does not include shares underlying our Stock Option Plan or the Equity Plan that are forfeited, canceled or terminated after December 31, 2013. See additional information in “Item 8. Financial Statements and Supplementary Data—Notes to Consolidated Financial Statements—Note 11, Share-Based Compensation.”
(3) On occasion, we have made employee award inducement equity grants to key employees outside of the Equity Plan. Although these awards were made outside of the Equity Plan, the key terms and conditions of each grant are the same in all material respects as equity awards made under the Equity Plan. See additional information in “Item 8. Financial Statements and Supplementary Data—Notes to Consolidated Financial Statements—Note 11, Share-Based Compensation.”
Item 13. Certain Relationships and Related Transactions, and Director Independence
Information required by this item is incorporated by reference to the 2014 Annual Meeting Proxy Statement under the
headings “Corporate Governance – Board Policy on Conflicts of Interest and Related Party Transactions,” “Corporate Governance – Director Independence,” and “Corporate Governance – Committees of the Board.”
Item 14. Principal Accounting Fees and Services
Information required by this item is incorporated by reference to the 2014 Annual Meeting Proxy Statement under the heading “Ratification of the Selection of Independent Registered Public Accounting Firm.”

65
PART IV
Item 15. Exhibits and Financial Statement Schedules
(a) Documents filed as part of the report.
(1) Consolidated Financial Statements
Report of Independent Registered Public Accounting FirmConsolidated Balance Sheets as of December 31, 2013 and 2012Consolidated Statements of Comprehensive Income (Loss) for the years ended December 31, 2013, 2012
and 2011 Consolidated Statements of Stockholders’ Equity for the years ended December 31, 2013, 2012 and 2011 Consolidated Statements of Cash Flows for the years ended December 31, 2013, 2012 and 2011 Notes to Consolidated Financial Statements
(2) Financial Statement Schedules
Schedule II—Valuation and Qualifying Accounts
All other schedules have been omitted because the required information is presented in the financial statements or notes
thereto, the amounts involved are not significant or the schedules are not applicable.
(3) Exhibits

66
ExhibitNumber Description
2.1 Agreement and Plan of Merger by and among AMN Healthcare Services, Inc., Nightingale Acquisition, Inc.,Nightingale Acquisition, LLC, NF Investors, Inc. and GSUIG, L.L.C. (in its capacity as the Representative),dated as of July 28, 2010 (Incorporated by reference to Exhibit 2.1 of the Registrant’s Quarterly Report onForm 10-Q for the quarter ended June 30, 2010, filed with the SEC on July 30, 2010).
2.2 Amendment No. 1 to Agreement and Plan of Merger, dated August 29, 2010, by and among AMN HealthcareServices, Inc., Nightingale Acquisition, Inc., Nightingale Acquisition, LLC, NF Investors, Inc. and GSUIG,L.L.C. (Incorporated by reference to Exhibit 2.2 of the Registrant’s Current Report on Form 8-K dated August 29,2010, filed with the SEC on September 1, 2010).
3.1 Amended and Restated Certificate of Incorporation of AMN Healthcare Services, Inc. (Incorporated by referenceto Exhibit 3.1 of the Registrant’s Annual Report on Form 10-K for the fiscal year ended December 31, 2001, filedwith the SEC on March 18, 2002).
3.2 Seventh Amended and Restated By-laws of AMN Healthcare Services, Inc., effective July 27, 2010 (Incorporatedby reference to Exhibit 3.1 of the Registrant’s Quarterly Report on Form 10-Q for the quarter ended June 30,2010, filed with the SEC on July 30, 2010).
3.3 Certificate of Designations of Series A Conditional Convertible Preferred Stock (Incorporated by reference toExhibit 3.1 of the Registrant’s Current Report on Form 8-K dated August 29, 2010, filed with the SEC onSeptember 1, 2010).
4.1 Specimen Stock Certificate (Incorporated by reference to Exhibit 4.1 of the Registrant’s Annual Report on Form10-K for the fiscal year ended December 31, 2001, filed with the SEC on March 18, 2002).
4.2 Credit Agreement, dated as of April 5, 2012, by and among AMN Healthcare, Inc., as borrower, AMN HealthcareServices, Inc., AMN Services, LLC, O’Grady-Peyton International (USA), Inc., AMN Staffing Services, LLC,The MHA Group Inc., Merritt, Hawkins & Associates, AMN Healthcare Allied, Inc., RN Demand, Inc., StaffCare, Inc., AMN Allied Services, LLC, Pharmacy Choice, Inc., Rx Pro Health, Inc., Nursefinders, LLC, LindeHealth Care Staffing, Inc., National Healthcare Staffing, LLC, as guarantors, the lenders identified on thesignature pages thereto, as lenders, and SunTrust Bank, as administrative agent (Incorporated by reference toExhibit 4.1 filed with the Registrant’s Quarterly Report on Form 10-Q for the quarter ended March 31, 2012, filedwith the SEC on May 4, 2012).
4.3 First Amendment to Credit Agreement, dated as of February 28, 2013, by and among AMN Healthcare, Inc., asborrower, AMN Healthcare Services, Inc., AMN Services, LLC, O’Grady-Peyton International (USA), Inc., AMNStaffing Services, LLC, Merritt, Hawkins & Associates, LLC, AMN Healthcare Allied, Inc., Staff Care, Inc.,AMN Allied Services, LLC, Pharmacy Choice, Inc., Rx Pro Health, Inc., Nursefinders, LLC, Linde Health CareStaffing, Inc., as guarantors, the lenders identified on the signature pages thereto, as lenders, and SunTrust Bank,as administrative agent (Incorporated by reference to Exhibit 4.1 filed with the Registrant’s Quarterly Report onForm 10-Q for the quarter ended March 31, 2013, filed with the SEC on May 3, 2013).
4.4 Registration Rights Agreement, dated September 1, 2010, by and among AMN Healthcare Services, Inc. and thestockholders named therein (Incorporated by reference to Exhibit 4.1 of the Registrant’s Current Report on Form8-K dated August 29, 2010, filed with the SEC on September 1, 2010).
10.1 Office Lease, dated as of April 2, 2002, between Kilroy Realty, L.P. and AMN Healthcare, Inc. (Incorporated byreference to Exhibit 10.45 of the Registrant’s Registration Statement on Form S-1 (File No. 333-86952), filedwith the SEC on April 25, 2002).
10.2 Stock Option Plan (Management Contract or Compensatory Plan or Arrangement) (Incorporated herein byreference to Appendix 2 of the Registrant’s Definitive Proxy Statement on Schedule 14A filed with the SEC onApril 14, 2004).
10.3 Stock Option Plan Stock Option Agreement, dated as of May 18, 2004, between the Registrant and Andrew M.Stern (Management Contract or Compensatory Plan or Arrangement).**
10.4 Stock Option Plan Stock Option Agreement, dated as of May 18, 2004, between the Registrant and Susan R.Nowakowski (aka Susan R. Salka) (Management Contract or Compensatory Plan or Arrangement).**
10.5 Stock Option Plan Stock Option Agreement, dated as of September 28, 2005, between the Registrant and DouglasD. Wheat (Management Contract or Compensatory Plan or Arrangement) (Incorporated by reference to Exhibit10.3 of the Registrant’s Quarterly Report on Form 10-Q for the quarter ended September 30, 2005, filed with theSEC on November 7, 2005).
67
ExhibitNumber Description
10.6 AMN Healthcare Equity Plan, as Amended and Restated (Management Contract or Compensatory Plan orArrangement) (Incorporated by reference to Exhibit 10.1 of the Registrant’s Current Report on Form 8-K datedApril 18, 2012, filed with the SEC on April 20, 2012).
10.7 Form of AMN Healthcare Equity Plan Stock Appreciation Right Agreement—Director (Management Contract orCompensatory Plan or Arrangement).***
10.8 Form of AMN Healthcare Equity Plan Restricted Stock Unit Agreement—Director (Management Contract orCompensatory Plan or Arrangement).***
10.9 Form of AMN Healthcare Equity Plan Stock Appreciation Right Agreement—Officer (Management Contract orCompensatory Plan or Arrangement).***
10.10 Form of AMN Healthcare Equity Plan Restricted Stock Unit Agreement—Officer (Management Contract orCompensatory Plan or Arrangement).***
10.11 Form of AMN Healthcare Equity Plan Restricted Stock Unit Agreement—Officer (Management Contract orCompensatory Plan or Arrangement) (Incorporated by reference to Exhibit 10.1 of the Registrant’s QuarterlyReport on Form 10-Q for the quarter ended March 31, 2010, filed with the SEC on May 7, 2010).
10.12 Form of AMN Healthcare Equity Plan Performance Restricted Stock Unit Agreement—Officer (ManagementContract or Compensatory Plan or Arrangement) (Incorporated by reference to Exhibit 10.1 of the Registrant’sQuarterly Report on Form 10-Q for the quarter ended March 31, 2011, filed with the SEC on May 6, 2011).
10.13 Form of AMN Healthcare Equity Plan Performance Restricted Stock Unit Agreement (Adjusted EBITDAMargin) (Management Contract or Compensation Plan or Arrangement) (Incorporated by reference to Exhibit10.1 of the Registrant’s Quarterly Report on Form 10-Q for the quarter ended March 31, 2013, filed with the SECon May 3, 2013).
10.14 Form of AMN Healthcare Equity Plan Performance Restricted Stock Unit Agreement—Director (One YearVesting and Settlement) (Management Contract or Compensatory Plan or Arrangement) (Incorporated byreference to Exhibit 10.2 of the Registrant’s Quarterly Report on Form 10-Q for the quarter ended June 30, 2012,filed with the SEC on August 7, 2012).
10.15 AMN Healthcare Services, Inc. Senior Management Bonus Plan, as Amended and Restated (ManagementContract or Compensatory Plan or Arrangement) (Incorporated by reference to Appendix A of the Registrant’sDefinitive Proxy Statement on Schedule 14A, filed on March 9, 2012).
10.16 The 2005 Amended and Restated Executive Nonqualified Excess Plan of AMN Healthcare, Inc., effectiveJanuary 1, 2009 (Management Contract or Compensatory Plan or Arrangement) (Incorporated by reference toExhibit 10.2 of the Registrant’s Quarterly Report on Form 10-Q for the quarter ended September 30, 2008, filedwith the SEC on November 7, 2008).
10.17 Employment Agreement, dated as of May 4, 2005, between AMN Healthcare, Inc. and Susan R. Nowakowski(aka Susan R. Salka) (Management Contract or Compensatory Plan or Arrangement) (Incorporated by referenceto Exhibit 10.3 of the Registrant’s Quarterly Report on Form 10-Q for the quarter ended March 31, 2005, filedwith the SEC on May 9, 2005).
10.18 First Amendment to Employment Agreement, dated as of February 6, 2008, between AMN Healthcare, Inc. andSusan R. Nowakowski (aka Susan R. Salka) (Management Contract or Compensatory Plan or Arrangement).****
10.19 Executive Severance Agreement between AMN Healthcare, Inc. and Denise L. Jackson, dated February 6, 2008(Management Contract or Compensatory Plan or Arrangement).****
10.20 Executive Severance Agreement between AMN Healthcare, Inc. and Ralph Henderson, dated February 6, 2008(Management Contract or Compensatory Plan or Arrangement).****
10.21 Executive Severance Agreement between AMN Healthcare, Inc. and Brian M. Scott, effective as of January 24,2011 (Management Contract or Compensatory Plan or Arrangement) (Incorporated by reference to Exhibit 99.3of the Registrant’s Current Report on Form 8-K dated January 3, 2011, filed with the SEC on January 5, 2011).
10.22 Form of Indemnification Agreement—Officer and Director (Incorporated by reference to Exhibit 10.14 of theRegistrant’s Annual Report on Form 10-K for the fiscal year ended December 31, 2009, filed with the SEC onMarch 5, 2010).
10.23 Stockholders Agreement between AMN Healthcare Services, Inc. and the Persons Listed on Schedule 1, datedJuly 28, 2010 (Incorporated by reference to Exhibit 10.1 filed with the Registrant’s Quarterly Report on Form 10-Q for the quarter ended June 30, 2010, filed with the SEC on July 30, 2010).

68
ExhibitNumber Description
21.1 Subsidiaries of the Registrant.*
23.1 Consent of Independent Registered Public Accounting Firm.*
31.1 Certification by Susan R. Salka pursuant to Rule 13a-14(a) of the Securities Exchange Act of 1934.*
31.2 Certification by Brian M. Scott pursuant to Rule 13a-14(a) of the Securities Exchange Act of 1934.*
32.1 Certification by Susan R. Salka pursuant to 18 U.S.C. Section 1350, as adopted pursuant to Section 906 of theSarbanes-Oxley Act of 2002.*
32.2 Certification by Brian M. Scott pursuant to 18 U.S.C. Section 1350, as adopted pursuant to Section 906 of theSarbanes-Oxley Act of 2002.*
101.INS XBRL Instance Document.*
101.SCH XBRL Taxonomy Extension Schema Document.*
101.CAL XBRL Taxonomy Extension Calculation Linkbase Document.*
101.DEF XBRL Taxonomy Extension Definition Linkbase Document.*
101.LAB XBRL Taxonomy Extension Label Linkbase Document.*
101.PRE XBRL Taxonomy Extension Presentation Linkbase Document.*
* Filed herewith.
** Incorporated by reference to the applicable exhibit of the Registrant’s Annual Report on Form 10-K for the fiscalyear ended December 31, 2004, filed with the SEC on March 11, 2005.
*** Incorporated by reference to the applicable exhibit of the Registrant’s Current Report on Form 8-K dated April12, 2006, filed with the SEC on April 14, 2006.
**** Incorporated by reference to the applicable exhibit of the Registrant’s Current Report on Form 8-K datedFebruary 12, 2008, filed with the SEC on February 12, 2008.
69
SIGNATURES
Pursuant to the requirements of Section 13 or 15(d) of the Securities Exchange Act of 1934, the registrant has duly caused this report to be signed on its behalf by the undersigned, thereunto duly authorized.
AMN HEALTHCARE SERVICES, INC.
/S/ SUSAN R. SALKASusan R. Salka
President and Chief Executive Officer Date: February 21, 2014
Pursuant to the requirements of the Securities Exchange Act of 1934, this report has been signed below by the following persons on behalf of the registrant and in the capacities indicated and on the 21st day of February, 2014.
/S/ SUSAN R. SALKA
Susan R. SalkaDirector, President and Chief Executive Officer
(Principal Executive Officer)
/S/ BRIAN M. SCOTT
Brian M. ScottChief Accounting Officer,
Chief Financial Officer and Treasurer(Principal Accounting and Financial Officer)
/S/ DOUGLAS D. WHEAT
Douglas D. WheatDirector and Chairman of the Board
/S/ MARK G. FOLETTA
Mark G. FolettaDirector
/S/ R. JEFFREY HARRIS
R. Jeffrey HarrisDirector
/S/ MICHAEL M.E. JOHNS
Michael M.E. JohnsDirector
/S/ MARTHA H. MARSH
Martha H. MarshDirector
/S/ ANDREW M. STERN
Andrew M. SternDirector
/S/ PAUL E. WEAVER
Paul E. WeaverDirector
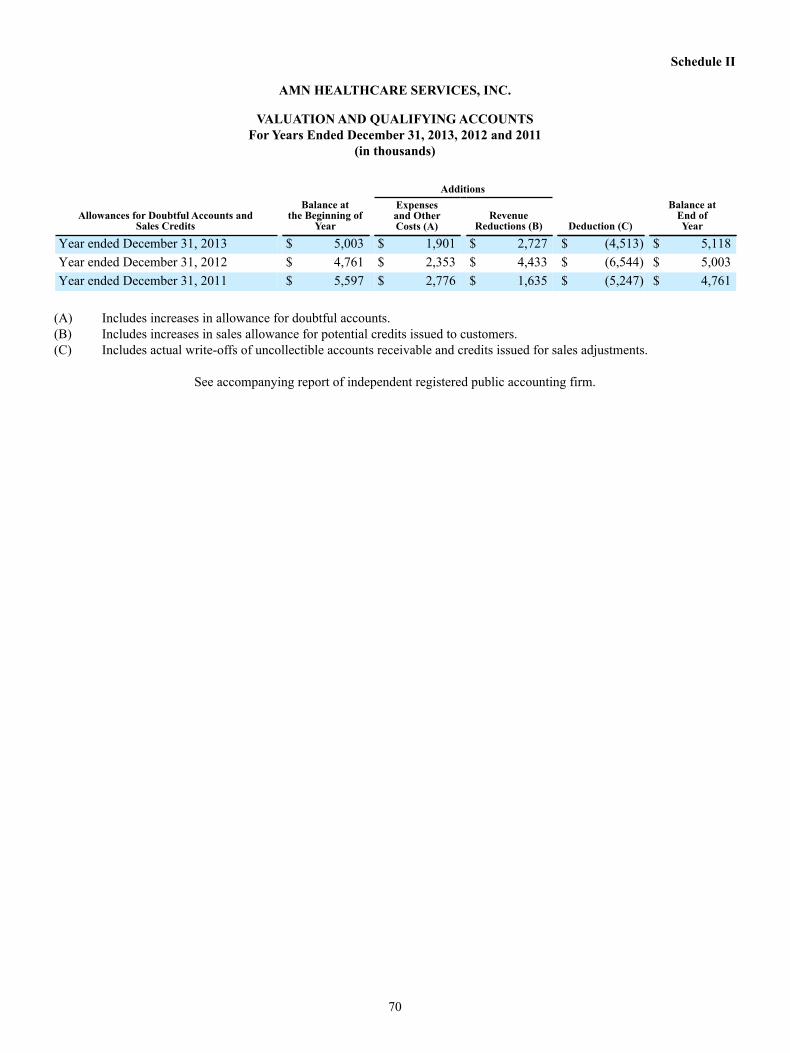
70
Schedule II
AMN HEALTHCARE SERVICES, INC.
VALUATION AND QUALIFYING ACCOUNTSFor Years Ended December 31, 2013, 2012 and 2011
(in thousands)
Allowances for Doubtful Accounts andSales Credits
Balance atthe Beginning of
Year
Additions
Deduction (C)
Balance atEnd ofYear
Expensesand OtherCosts (A)
RevenueReductions (B)
Year ended December 31, 2013 $ 5,003 $ 1,901 $ 2,727 $ (4,513) $ 5,118Year ended December 31, 2012 $ 4,761 $ 2,353 $ 4,433 $ (6,544) $ 5,003Year ended December 31, 2011 $ 5,597 $ 2,776 $ 1,635 $ (5,247) $ 4,761
(A) Includes increases in allowance for doubtful accounts.(B) Includes increases in sales allowance for potential credits issued to customers.(C) Includes actual write-offs of uncollectible accounts receivable and credits issued for sales adjustments.
See accompanying report of independent registered public accounting firm.

Exhibit 21.1
Subsidiaries of the Registrant, as of December 31, 2013
Subsidiary
Jurisdiction ofOrganization
AMN Allied Services, LLC Delaware
AMN Healthcare, Inc. Nevada
AMN Healthcare Allied, Inc. Texas
AMN Services, LLC North Carolina
AMN Staffing Services, LLC Delaware
Linde Health Care Staffing, Inc. Missouri
Merritt, Hawkins & Associates, LLC California
Nursefinders, LLC Texas
O’Grady-Peyton International (USA), Inc. Massachusetts
O’Grady-Peyton International (Australia) (Pty), Ltd. Australia
O’Grady Peyton International Recruitment U.K. Limited United Kingdom
O’Grady Peyton International (SA) (Proprietary) Limited South Africa
O’Grady-Peyton International (Europe) Limited United Kingdom
O’Grady Peyton International (India) Private Limited India
Rx Pro Health, LLC Colorado
ShiftWise, Inc. Oregon
Spectrum Insurance Company, Inc. Hawaii
Staff Care, Inc. Delaware
Exhibit 23.1
Consent of Independent Registered Public Accounting Firm
The Board of Directors AMN Healthcare Services, Inc.:
We consent to incorporation by reference in the registration statements (No. 333-73482, No. 333-117695, No. 333-133227, No. 333-133305, No. 333-142187, No. 333-158523, No. 333-161184, No. 333-180856, and No. 333-180857) on Form S-8 and in the registration statement (No. 333-171309) on Form S-3 of AMN Healthcare Services, Inc. (the Company) of our reports dated February 21, 2014, with respect to the consolidated balance sheets of the Company and subsidiaries, as of December 31, 2013 and 2012, and the related consolidated statements of comprehensive income (loss), stockholders’ equity, and cash flows for each of the years in the three-year period ended December 31, 2013, and the related financial statement schedule of valuation and qualifying accounts, and the effectiveness of internal control over financial reporting as of December 31, 2013, which reports appear in the December 31, 2013 Annual Report on Form 10-K of AMN Healthcare Services, Inc. Our report over the effectiveness of the Company’s internal control over financial reporting as of December 31, 2013 includes an explanatory paragraph stating that management excluded from its assessment of the effectiveness of the Company’s internal control over financial reporting as of December 31, 2013, the internal control over financial reporting of ShiftWise, Inc. (ShiftWise) associated with total net assets of approximately $39.5 million as of December 31, 2013 and total revenues of approximately $1.4 million for the year ended December 31, 2013. Our audit of internal control over financial reporting of the Company also excluded an evaluation of the internal control over financial reporting of ShiftWise.
/s/ KPMG LLP
San Diego, California February 21, 2014
Exhibit 31.1
Certification Pursuant ToRule 13a-14(a) of the Securities Exchange Act of 1934
I, Susan R. Salka, certify that:
1. I have reviewed this report on Form 10-K of AMN Healthcare Services, Inc.; 2. Based on my knowledge, this report does not contain any untrue statement of a material fact or omit to state a material fact
necessary to make the statements made, in light of the circumstances under which such statements were made, not misleading with respect to the period covered by this report;
3. Based on my knowledge, the financial statements, and other financial information included in this report, fairly present in all
material respects the financial condition, results of operations and cash flows of the registrant as of, and for, the periods presented in this report;
4. The registrant’s other certifying officer and I are responsible for establishing and maintaining disclosure controls and procedures
(as defined in Exchange Act Rules 13a-15(e) and 15d-15(e)) and internal control over financial reporting (as defined in Exchange Act Rules 13a-15(f) and 15d-15(f)) for the registrant and have:
a) Designed such disclosure controls and procedures, or caused such disclosure controls and procedures to be designed
under our supervision, to ensure that material information relating to the registrant, including its consolidated subsidiaries, is made known to us by others within those entities, particularly during the period in which this report is being prepared;
b) Designed such internal control over financial reporting, or caused such internal control over financial reporting to be
designed under our supervision, to provide reasonable assurance regarding the reliability of financial reporting and the preparation of financial statements for external purposes in accordance with generally accepted accounting principles;
c) Evaluated the effectiveness of the registrant’s disclosure controls and procedures and presented in this report our
conclusions about the effectiveness of the disclosure controls and procedures, as of the end of the period covered by this report based on such evaluation; and
d) Disclosed in this report any change in the registrant’s internal control over financial reporting that occurred during the
registrant’s most recent fiscal quarter (the registrant’s fourth fiscal quarter in the case of an annual report) that has materially affected, or is reasonably likely to materially affect, the registrant’s internal control over financial reporting; and
5. The registrant’s other certifying officer and I have disclosed, based on our most recent evaluation of internal control over financial
reporting, to the registrant’s auditors and the audit committee of the registrant’s board of directors (or persons performing the equivalent functions):
a) All significant deficiencies and material weaknesses in the design or operation of internal control over financial
reporting which are reasonably likely to adversely affect the registrant’s ability to record, process, summarize and report financial information; and
b) Any fraud, whether or not material, that involves management or other employees who have a significant role in the
registrant’s internal control over financial reporting.
/S/ SUSAN R. SALKA
Susan R. SalkaDirector, President and Chief Executive Officer
(Principal Executive Officer) Date: February 21, 2014
Exhibit 31.2
Certification Pursuant ToRule 13a-14(a) of the Securities Exchange Act of 1934
I, Brian M. Scott, certify that:
1. I have reviewed this report on Form 10-K of AMN Healthcare Services, Inc.; 2. Based on my knowledge, this report does not contain any untrue statement of a material fact or omit to state a material fact
necessary to make the statements made, in light of the circumstances under which such statements were made, not misleading with respect to the period covered by this report;
3. Based on my knowledge, the financial statements, and other financial information included in this report, fairly present in all
material respects the financial condition, results of operations and cash flows of the registrant as of, and for, the periods presented in this report;
4. The registrant’s other certifying officer and I are responsible for establishing and maintaining disclosure controls and procedures
(as defined in Exchange Act Rules 13a-15(e) and 15d-15(e)) and internal control over financial reporting (as defined in Exchange Act Rules 13a-15(f) and 15d-15(f)) for the registrant and have:
a) Designed such disclosure controls and procedures, or caused such disclosure controls and procedures to be designed
under our supervision, to ensure that material information relating to the registrant, including its consolidated subsidiaries, is made known to us by others within those entities, particularly during the period in which this report is being prepared;
b) Designed such internal control over financial reporting, or caused such internal control over financial reporting to be
designed under our supervision, to provide reasonable assurance regarding the reliability of financial reporting and the preparation of financial statements for external purposes in accordance with generally accepted accounting principles;
c) Evaluated the effectiveness of the registrant’s disclosure controls and procedures and presented in this report our
conclusions about the effectiveness of the disclosure controls and procedures, as of the end of the period covered by this report based on such evaluation; and
d) Disclosed in this report any change in the registrant’s internal control over financial reporting that occurred during the
registrant’s most recent fiscal quarter (the registrant’s fourth fiscal quarter in the case of an annual report) that has materially affected, or is reasonably likely to materially affect, the registrant’s internal control over financial reporting; and
5. The registrant’s other certifying officer and I have disclosed, based on our most recent evaluation of internal control over financial
reporting, to the registrant’s auditors and the audit committee of the registrant’s board of directors (or persons performing the equivalent functions):
a) All significant deficiencies and material weaknesses in the design or operation of internal control over financial
reporting which are reasonably likely to adversely affect the registrant’s ability to record, process, summarize and report financial information; and
b) Any fraud, whether or not material, that involves management or other employees who have a significant role in the
registrant’s internal control over financial reporting.
/S/ BRIAN M. SCOTT
Brian M. ScottChief Accounting Officer,
Chief Financial Officer and Treasurer(Principal Accounting and Financial Officer)
Date: February 21, 2014

Exhibit 32.1
AMN Healthcare Services, Inc.
CERTIFICATION PURSUANT TO 18 U.S.C. SECTION 1350,AS ADOPTED PURSUANT TO SECTION 906OF THE SARBANES-OXLEY ACT OF 2002
In connection with the Annual Report of AMN Healthcare Services, Inc. (the “Company”) on Form 10-K for the period ended
December 31, 2013 as filed with the Securities and Exchange Commission on the date hereof (the “Report”), I, Susan R. Salka, President and Chief Executive Officer of the Company, certify, pursuant to 18 U.S.C. Section 1350, as adopted pursuant to Section 906 of the Sarbanes-Oxley Act of 2002, that:
(1) The Report fully complies with the requirements of section 13(a) or 15(d) of the Securities Exchange Act of 1934; and (2) The information contained in the Report fairly presents, in all material respects, the financial condition and results of
operations of the Company.
/S/ SUSAN R. SALKA
Susan R. SalkaPresident and Chief Executive Officer
Date: February 21, 2014

Exhibit 32.2
AMN Healthcare Services, Inc.
CERTIFICATION PURSUANT TO 18 U.S.C. SECTION 1350,AS ADOPTED PURSUANT TO SECTION 906OF THE SARBANES-OXLEY ACT OF 2002
In connection with the Annual Report of AMN Healthcare Services, Inc. (the “Company”) on Form 10-K for the period ended
December 31, 2013 as filed with the Securities and Exchange Commission on the date hereof (the “Report”), I, Brian M. Scott, Chief Accounting Officer, Chief Financial Officer and Treasurer of the Company, certify, pursuant to 18 U.S.C. Section 1350, as adopted pursuant to Section 906 of the Sarbanes-Oxley Act of 2002, that:
(1) The Report fully complies with the requirements of section 13(a) or 15(d) of the Securities Exchange Act of 1934; and (2) The information contained in the Report fairly presents, in all material respects, the financial condition and results of
operations of the Company.
/S/ BRIAN M. SCOTT
Brian M. ScottChief Accounting Officer,
Chief Financial Officer and Treasurer
Date: February 21, 2014

The Innovator in Healthcare Workforce Solutions2013 ANNUAL REPORT
Corporate Headquarters 12400 High Bluff Drive San Diego, CA 92130 Toll Free: (866) 871-8519 © 2014 AMN Healthcare AMN 14-C001