Embed Size (px)
Citation preview

2013 Victim SerViceS NeedS ASSeSSmeNt Volume Vii: SummAry report of fiNdiNgSNext StepS iN Victim SerVice proViSioN iN peNNSylVANiA
Conducted forThe Office of Victims’ Services,
Pennsylvania Commission on Crime and Delinquency
Prepared byInstitute of State and Regional Affairs
Penn State Harrisburg777 West Harrisburg PikeMiddletown, Pennsylvania
December 2013
With Amendments by the Access to Services SubcommitteeAugust 2014
The Pennsylvania Commission on Crime and Delinquency (PCCD) secured federal American Recovery and Reinvestment Act/Justice Assistance Grant funding from the Bureau of Justice Assistance to implement this Needs Assessment.
About the 2013 PCCD Victim Services Needs AssessmentThe Office of Victims’ Services of the Pennsylvania Commission on Crime and Delinquency engaged a research team at Penn State Harrisburg to conduct the 2013 Needs Assessment of Pennsylvania’s Victim Community. The primary goal of this initiative, was to begin to develop a comprehensive understanding of unmet needs and service gaps through the perspectives of both service providers and victims. By documenting this information, this project aimed to increase the stature of victims’ needs and contribute to understanding how victims can access core services.
The activities undertaken by the Institute of State and Regional Affairs are documented individually in specific stand-alone reports (listed below) and culminate in a Summary Report of Findings (Volume VII).
The individual reports include:Volume I: In-Depth Interviews of Agency Directors Volume II: Focus Groups of Victim PopulationsVolume III: Administrative Web SurveyVolume IV: Statewide Telephone and Web SurveyVolume V: Demographic Background ResearchVolume VI: Crime Victim Needs: Insights from ResearchVolume VII: Summary Report of Findings
The project team from the Institute of State and Regional Affairs at Penn State Harrisburg included:Michael Behney, Director, Institute of State and Regional Affairs, Overall project coordinationDr. Chiara Sabina, Assistant Professor of Social Sciences, School of Behavioral Sciences and EducationStephanie Wehnau, Director, Center for Survey Research, Survey instrument developmentNicole Sturges, Assistant Director, Center for Survey Research, Focus group moderatorTim Servinsky, Project Manager, Center for Survey Research, Survey tabulation and analysisSue Copella, Director, Pennsylvania State Data Center, Demographic data collection coordinationJennifer Shultz, Associate Director for Operations, Pennsylvania State Data Center, Demographic researchJohn Maurer, Project Associate, Pennsylvania State Data Center, Demographic researchLarry Meyers, Project Associate, Pennsylvania State Data Center, GIS/MappingDonna Byrne, Advocate in the domestic violence movement and former Executive Director of A Woman’s Place in Bucks County, PA
Special thanks for assistance from a statewide Advisory Group that acted as a sounding board for ideas and questions as well as provided review and comment on methods and findings. Advisory Group members included: Kathy Buckley, Manager, Victims’ Services Program, Office of Victims’ ServicesPennsylvania Commission on Crime and DelinquencyAnn Emmerling, Executive DirectorBlackburn Center Against Domestic & Sexual ViolenceCarole Alexy, Director of ContractsPennsylvania Coalition Against Domestic ViolenceRick Azzaro, Chief Services OfficerYork YWCAPennie Hockenberry, Director of Victim Services / Office of Victim AdvocatePennsylvania Board of Probation and ParoleJoyce Lukima, Vice President, ServicesPennsylvania Coalition Against Rape/National Sexual Violence Resource CenterMichelle Robinson-Ritter, Executive DirectorDomestic Violence Services of Southwestern PALee Ann Labecki, DirectorOffice of Research, Evaluation, and Strategic Policy DevelopmentPennsylvania Commission on Crime and Delinquency
Table of Contents
Recommendations ..............................................................................................................41. Scope of the issue .........................................................................................................62. Method ...........................................................................................................................63. Definitions ......................................................................................................................74. What types of crime experiences do victims have? ......................................................95. What services are available and accessed? ...................................................................106. What are the barriers to services? .................................................................................137. What services are needed? ............................................................................................158. Which demographic groups and types of victimizations are underserved? ..................189. What issues are VSOs facing? ......................................................................................21References ..........................................................................................................................23
2013 Victim Services Needs Assessment
Volume VII: Summary Report of Findings | Page 4
RECOMMENDATIONS
The primary goal of the one-year initiative, the 2013 Needs Assessment of Pennsylvania’s Victim Community, is to begin to develop a comprehensive understanding of unmet needs and service gaps through the perspectives of both service providers and victims. The following recommendations resulted from this multi-method needs assessment. These are in order as they appear in the summary report; the ordering is not reflective of their priority.
1. Recommendation: The needs assessment identified that many victims experience multiple crimes. In addition, crime victims do not have the same needs or access services in the same way or with the same frequency. It is important for each Pennsylvania county to understand the needs of all types of crime victims in their communities and identify the gaps in meeting those needs. (pg. 9)
2. Recommendation: Attention should be directed toward understanding the service needs of property crime victims and violent crime victims, as victims of these crimes less frequently use victim service organizations (VSOs). It is important to understand why this occurs. (pg. 9)
3. Recommendation: Overall, victims expressed satisfaction with services received from formal sources (formal sources included law enforcement, district attorneys’ offices, victim service organizations, medical services, counseling agencies, and related entitites). However, more work will need to be done to bring interpersonal crime victims’ levels of satisfaction with law enforcement and district attorney services into parity with other formal sources of services. (pg. 13)
4. Recommendation: Service providers need to continue to amplify their outreach and education efforts, as many victims are not aware of services or where to access services. While it is likely that not all crime victims require VSOs’ services (as indicated by the top reason for not seeking services), awareness of services may prompt some in that category to seek services. (pg. 15)
5. Recommendation: According to victims and agency administrators, victims need services that address basic areas of well-being such as access to affordable housing, meeting economic needs, transportation, support, adequate medical care, and counseling. Expansion of victim services in these areas should be explored, including collaborations with other service providers. (pg. 17)
6. Recommendation: Despite VSOs offering victims compensation assistance, many victims are not using the service and some identify compensation as an unmet need. PCCD and local VSOs should work together to identify and overcome barriers to accessing and/or receiving compensation. (pg. 17)
7. Recommendation: Pennsylvania has a diverse population that emphasizes the need for training of VSOs to increase competency for the provision of culturally competent services. The four main groups identified as underserved by VSO administrators include people who identify as LGBTQ, immigrants, seniors, and Hispanics. Further data analysis is needed to identify where and what type of culturally specific training is needed. Additionally, approaches to better reach out to these groups should be developed. (pg. 20)
2013 Victim Services Needs Assessment 2013 Victim Services Needs Assessment
Volume VII: Summary Report of Findings | Page 5
8. Recommendation: Victim service organizations have experienced significant funding cuts and challenges as well as staffing concerns over the past decade. In spite of this, they strive to meet the needs of the increasing numbers of diverse crime victims in their communities. Continued commitment by leadership at the local, state and federal levels to support adequate funding for services is the key to meeting the varied and complex needs of the large percentage of Pennsylvanians who are victims of crime. (pg. 23)
2013 Victim Services Needs Assessment
Volume VII: Summary Report of Findings | Page 6
Next Steps in Victim Service Provision in Pennsylvania
1. SCOPE OF THE ISSUE
Each year thousands of Pennsylvanians experience a range of crimes including theft/larceny, robbery, domestic violence, assault, stalking, homicide, and sexual assault, among others. The magnitude of the problem is evidenced by several recent statistics as reported in Volume V of this needs assessment and The National Intimate Partner and Sexual Violence Survey by The Centers for Disease Control and Prevention (Black et al., 2011):
• There were 87,335 property and violent crimes in 2011 that came to the attention of the Pennsylvania police, 72% of which were property crimes.
• Sexual assault and domestic violence are significantly underreported to police, compared to other types of crime, which would contribute to a lower percentage of interpersonal violent crime in annual crime statistics.
• Sexual assault and domestic violence services were sought by 120,775 individuals in fiscal year 2011-2012.
• Procedural services for crimes were sought by 205,093 individuals in calendar year 2012. • Over five million Pennsylvanians have experienced sexual violence or stalking in their lifetime,
according to The Centers for Disease Control and Prevention. • Over 1.9 million Pennsylvanians have experienced intimate partner violence in their lifetime,
according to The Centers for Disease Control and Prevention.
The Pennsylvania Commission on Crime and Delinquency aims to make services available to crime victims to transcend their trauma and move forward with their lives. Pennsylvania’s services for crime victims include domestic violence programs, rape crisis centers, comprehensive centers, and victim/witness units; they provide a wide range of assistance including, but not limited to, hotline support, victims compensation assistance, advocacy/counseling and shelter. Research shows that multiple factors play into the help-seeking decisions of victims, including type and severity of violence and relationship with the perpetrator (McCart, Smith, & Sawyer, 2010). It is vitally important that high-quality services are available to meet the multiple needs of crime victims when they decide to seek assistance. The purpose of the current study was to examine the needs of crime victims in order to identify areas for future development.
2. METHOD
The needs assessment was guided by a research team of 10 from the Institute of State and Regional Affairs at Penn State Harrisburg and an Advisory Board of nine from across the commonwealth. In order to understand what services are needed for crime victims in Pennsylvania, we gathered input from service providers, victims who sought services, and victims who did not seek services. The information garnered comes from surveys of 148 different victim service organizations (VSOs); directors from 20 of these organizations also talked with us in-depth about needed services. We also gathered information from almost 900 victims of crime (n = 872), 150 of whom sought services from
2013 Victim Services Needs Assessment 2013 Victim Services Needs Assessment
Volume VII: Summary Report of Findings | Page 7
a VSO and 692 of whom did not seek services from a VSO. Twenty-two of the victims discussed their experiences with us at length during focus groups, and the remainder either participated in a randomized phone survey of Pennsylvania residents who were screened for having experienced crime (n = 755) or completed an online survey distributed mainly by VSOs (n = 95). Additionally, we gathered data from the Pennsylvania State Police Uniform Crime Reporting System, Pennsylvania Coalition Against Rape, Pennsylvania Coalition Against Domestic Violence, the Pennsylvania Commission on Crime and Delinquency’s Office of Victims’ Services, the 2010 Decennial census, and the 2007-2011 American Community Survey. We also reviewed research literature to contextualize the trends in Pennsylvania and inform development of the other parts of the project. Six previous volumes are available and detail the I) In-depth interviews of agency directors, II) Focus groups of victim populations, III) Administrative web survey, IV) Statewide telephone and web survey, V) Demographic background research, and VI) Crime victim needs: Insights from research. All work for this project was completed during 2013. This summary report brings the various findings together and offers recommendations. Please refer to previous volumes for additional information and analyses.
3. DEFINITIONS
We grouped VSOs into two main categories according to funding streams received and services provided. These two groups are community-based VSOs and system-based VSOs.
Community-Based VSOs: Private, non-profit agencies that provide counseling and other services to victims and survivors of crime. Services may include free and confidential crisis counseling; accompaniment of victims to the hospital or to other medical facilities, the police station, or to court; support groups and/or emergency shelter.System-Based VSOs: Agencies located in local government district attorney offices or juvenile probation offices that provide procedural and other services to victims and survivors of crime. Services may include assisting victims and witnesses of crime during their involvement with the criminal justice system by providing notifications of proceedings and accompaniment within the justice system and providing information regarding victims’ rights, restitution, and victim impact statements.
In order to describe the range of victimization experiences, we found it helpful to group victimizations into three main categories. While the Federal Bureau of Investigation uses the two main categories of violent crimes and property crimes, we spilt violent crimes into two groups: violent crimes and interpersonal violent crimes. Interpersonal violent crimes include domestic violence and sexual assault.
Property Crimes: Arson, theft/larceny, burglary, vandalism, identity theft, and fraud, including internet fraudViolent Crimes: Assault, hate crime1, homicide (homicide survivor), robbery, and driving under the influence (DUI)Interpersonal Violent Crimes: Domestic/dating violence, elder abuse, stalking, rape, and sexual assault
1 Crimes committed against someone because of their personal characteristics.

2013 Victim Services Needs Assessment
Volume VII: Summary Report of Findings | Page 8
Pennsylvania includes 67 counties and there is substantial diversity with regard to urban, suburban, and rural counties. We segmented the commonwealth into six regions, illustrated in the following map. As can be seen, the urban areas fall in the Southeast, South-Central, and Southwest Regions of the commonwealth.
2013 Victim Services Needs Assessment 2013 Victim Service Needs Assessment
Volume VII: Summary Report of Findings | Page 9
4. WHAT TYPES OF CRIME EXPERIENCES DO VICTIMS HAVE?
The statewide telephone survey revealed that property crimes were most common. In fact, 68% of respondents experienced property crimes. The most common property crimes were theft/larceny (32% of all respondents), burglary (16%), and vandalism (15%). About 40% of respondents experienced a violent crime, with robbery being the most common (21% of all respondents). Further, 24% experienced interpersonal violent crimes, with dating/domestic violence being the most common (19%). Rape/sexual assault (5.3%) were less common. However, the victim focus groups and web survey revealed another view of crime with dating/domestic violence and sexual assault being much more common. These two samples were largely recruited through VSOs, indicating that VSOs tend to serve victims of interpersonal violent crime. The phone survey corroborated this trend. Of those who sought services at a VSO, 67% experienced an interpersonal violent crime, 25% experienced a violent crime, and 5% experienced a property crime. The difference between victimization patterns seen in the general population and the victimization patterns of those who utilized VSOs is an area for future investigation. Do property crime victims need services less often as suggested later in this report (see Section 5)? Are property crime victim needs met by the criminal justice system? Or are unique services needed by property crime victims that are currently not offered?
Another aspect of crime experiences is that many people experienced more than one crime. The phone survey showed an average of 1.64 crimes among respondents. The average numbers of victimizations for those who participated in the web survey and the focus groups were 2.97 and 2.32 respectively. In fact, 43% of phone survey respondents across the commonwealth experienced more than one crime and 57% of those who completed the web survey experienced more than one crime. Focus group participants shared their numerous victimization experiences, with one saying that she was “abused her whole life.” While VSOs most often serve interpersonal crime victims, almost half of interpersonal crime victims (47.8%) also experienced a property crime, and over one-third (37.9%) experienced another violent crime, pointing to the need to take a comprehensive view of victimization.
RECOMMENDATION: The needs assessment identified that many victims experience multiple crimes. In addition, crime victims do not have the same needs or access services in the same way or with the same frequency. It is important for each Pennsylvania county to understand the needs of all types of crime victims in their communities and identify gaps in meeting those needs.
RECOMMENDATION: Attention should be directed towards understanding the service needs of property crime victims and violent crime victims, as victims of these crimes less frequently use victim service organizations (VSOs). It is important to understand why this occurs.
Another aspect of crime experiences is that many people experienced more than one crime.
2013 Victim Services Needs Assessment
Volume VII: Summary Report of Findings | Page 10
5. WHAT SERVICES ARE AVAILABLE AND ACCESSED?
One of the basic issues facing crime victims is availability of services. There are 163 victim service organizations funded through the Pennsylvania Commission on Crime and Delinquency, the Pennsylvania Coalition Against Rape, or the Pennsylvania Coalition Against Domestic Violence. Sixty-two of these VSOs are system-based, while 101 are community-based. Over 65% of counties are served by only one system-based VSO and 54% of counties are served by only one community-based VSO. Community-based VSOs include domestic violence and rape crisis programs, among others. Over half (52%) of the community-based VSOs focus on domestic violence, sexual assault or both, 35% of community-based VSOs are comprehensive2 in nature and 13% specialize in other forms of violence (e.g., drunk driving, child abuse). Given this spread, although a community-based VSO may be available in a victim’s county, it is possible that the VSO does not specialize in the type of crime the victim experienced.
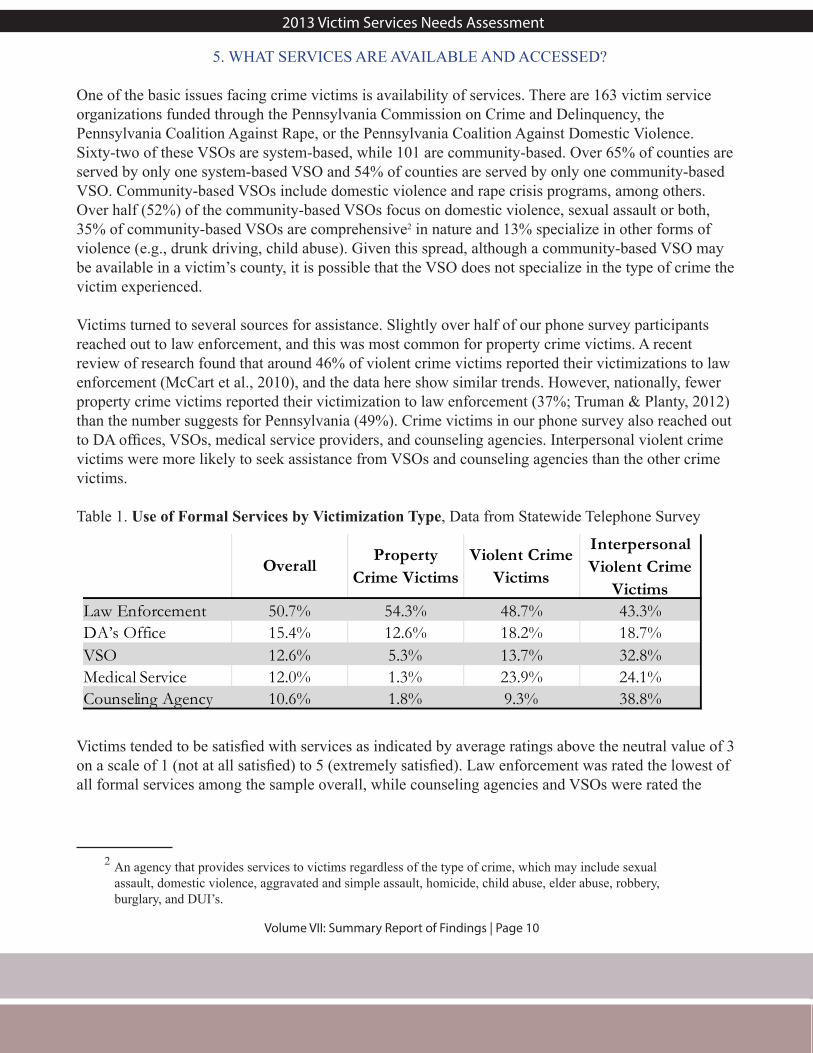
Victims turned to several sources for assistance. Slightly over half of our phone survey participants reached out to law enforcement, and this was most common for property crime victims. A recent review of research found that around 46% of violent crime victims reported their victimizations to law enforcement (McCart et al., 2010), and the data here show similar trends. However, nationally, fewer property crime victims reported their victimization to law enforcement (37%; Truman & Planty, 2012) than the number suggests for Pennsylvania (49%). Crime victims in our phone survey also reached out to DA offices, VSOs, medical service providers, and counseling agencies. Interpersonal violent crime victims were more likely to seek assistance from VSOs and counseling agencies than the other crime victims.
Table 1. Use of Formal Services by Victimization Type, Data from Statewide Telephone Survey
Victims tended to be satisfied with services as indicated by average ratings above the neutral value of 3 on a scale of 1 (not at all satisfied) to 5 (extremely satisfied). Law enforcement was rated the lowest of all formal services among the sample overall, while counseling agencies and VSOs were rated the
2 An agency that provides services to victims regardless of the type of crime, which may include sexual assault, domestic violence, aggravated and simple assault, homicide, child abuse, elder abuse, robbery, burglary, and DUI’s.
Overall Property Crime Victims
Violent Crime Victims
Interpersonal Violent Crime
VictimsLaw Enforcement 50.7% 54.3% 48.7% 43.3%DA’s Office 15.4% 12.6% 18.2% 18.7%VSO 12.6% 5.3% 13.7% 32.8%Medical Service 12.0% 1.3% 23.9% 24.1%Counseling Agency 10.6% 1.8% 9.3% 38.8%
2013 Victim Services Needs Assessment 2013 Victim Services Needs Assessment
Volume VII: Summary Report of Findings | Page 11
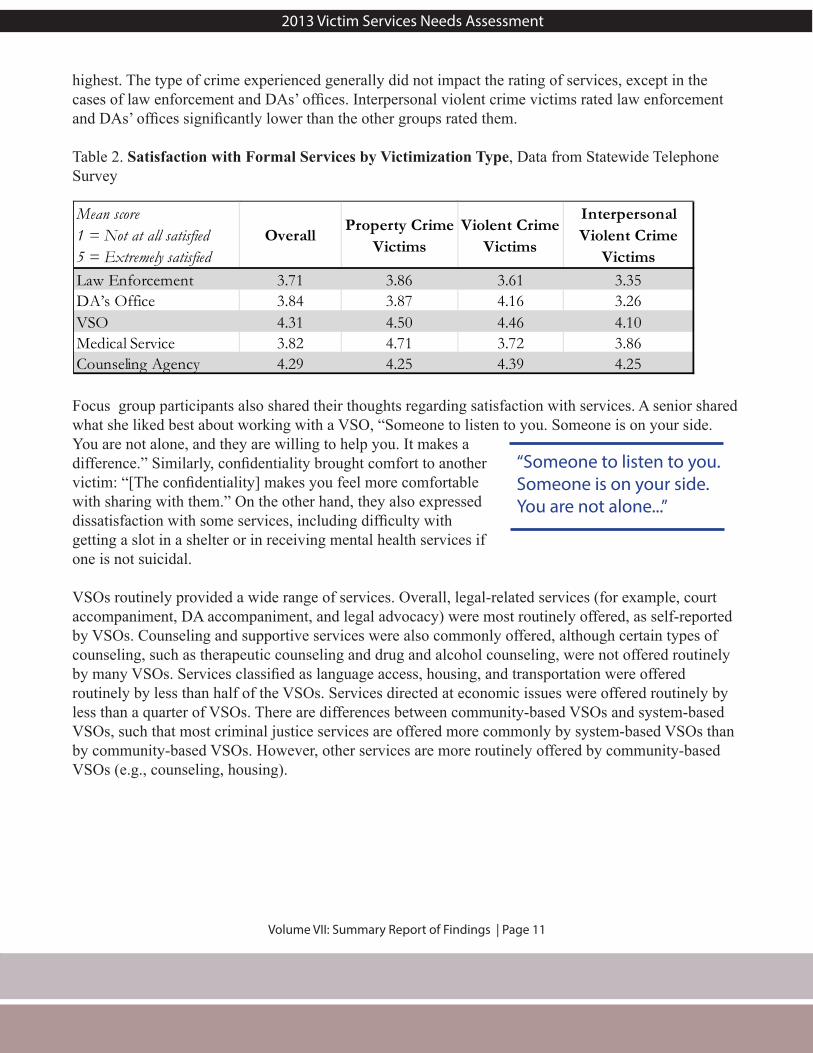
highest. The type of crime experienced generally did not impact the rating of services, except in the cases of law enforcement and DAs’ offices. Interpersonal violent crime victims rated law enforcement and DAs’ offices significantly lower than the other groups rated them.
Table 2. Satisfaction with Formal Services by Victimization Type, Data from Statewide Telephone Survey
Focus group participants also shared their thoughts regarding satisfaction with services. A senior shared what she liked best about working with a VSO, “Someone to listen to you. Someone is on your side. You are not alone, and they are willing to help you. It makes a difference.” Similarly, confidentiality brought comfort to another victim: “[The confidentiality] makes you feel more comfortable with sharing with them.” On the other hand, they also expressed dissatisfaction with some services, including difficulty with getting a slot in a shelter or in receiving mental health services if one is not suicidal.
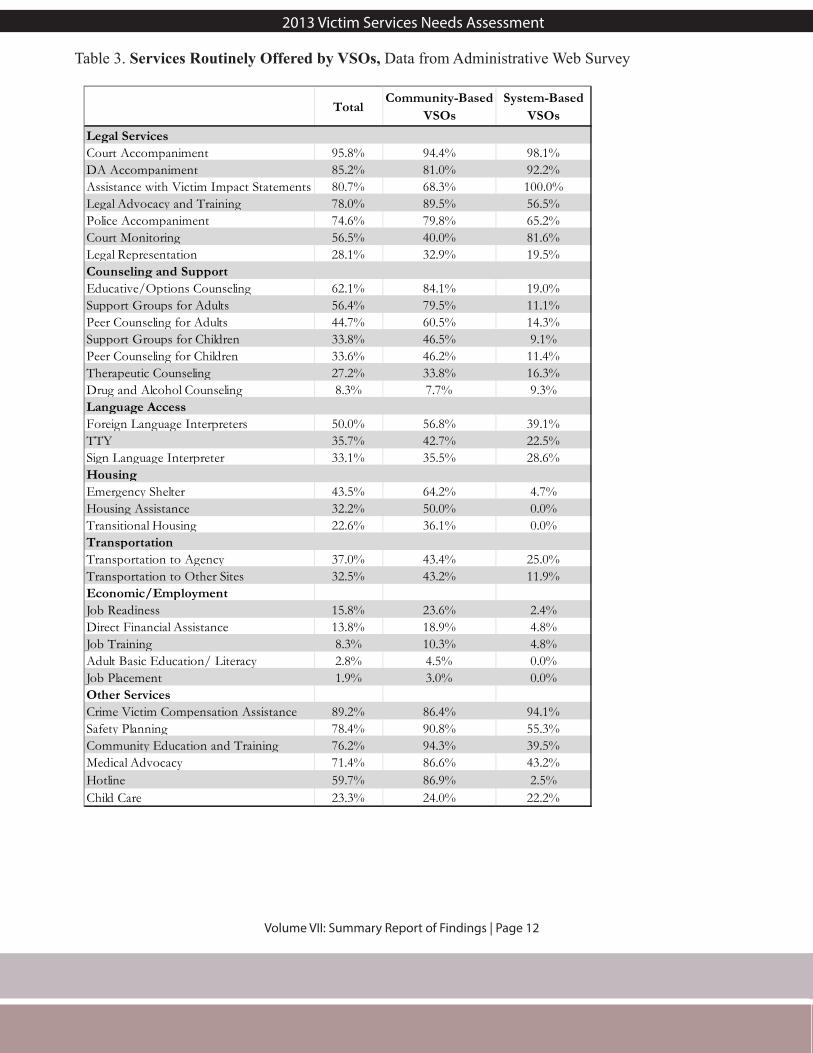
VSOs routinely provided a wide range of services. Overall, legal-related services (for example, court accompaniment, DA accompaniment, and legal advocacy) were most routinely offered, as self-reported by VSOs. Counseling and supportive services were also commonly offered, although certain types of counseling, such as therapeutic counseling and drug and alcohol counseling, were not offered routinely by many VSOs. Services classified as language access, housing, and transportation were offered routinely by less than half of the VSOs. Services directed at economic issues were offered routinely by less than a quarter of VSOs. There are differences between community-based VSOs and system-based VSOs, such that most criminal justice services are offered more commonly by system-based VSOs than by community-based VSOs. However, other services are more routinely offered by community-based VSOs (e.g., counseling, housing).
Mean score 1 = Not at all satisfied 5 = Extremely satisfied
Overall Property Crime Victims
Violent Crime Victims
Interpersonal Violent Crime
VictimsLaw Enforcement 3.71 3.86 3.61 3.35DA’s Office 3.84 3.87 4.16 3.26VSO 4.31 4.50 4.46 4.10Medical Service 3.82 4.71 3.72 3.86Counseling Agency 4.29 4.25 4.39 4.25
“Someone to listen to you. Someone is on your side. You are not alone...”
2013 Victim Services Needs Assessment
Volume VII: Summary Report of Findings | Page 12
Table 3. Services Routinely Offered by VSOs, Data from Administrative Web Survey
TotalCommunity-Based
VSOsSystem-Based
VSOsLegal Services Court Accompaniment 95.8% 94.4% 98.1%DA Accompaniment 85.2% 81.0% 92.2%Assistance with Victim Impact Statements 80.7% 68.3% 100.0%Legal Advocacy and Training 78.0% 89.5% 56.5%Police Accompaniment 74.6% 79.8% 65.2%Court Monitoring 56.5% 40.0% 81.6%Legal Representation 28.1% 32.9% 19.5%Counseling and Support Educative/Options Counseling 62.1% 84.1% 19.0%Support Groups for Adults 56.4% 79.5% 11.1%Peer Counseling for Adults 44.7% 60.5% 14.3%Support Groups for Children 33.8% 46.5% 9.1%Peer Counseling for Children 33.6% 46.2% 11.4%Therapeutic Counseling 27.2% 33.8% 16.3%Drug and Alcohol Counseling 8.3% 7.7% 9.3%Language AccessForeign Language Interpreters 50.0% 56.8% 39.1%TTY 35.7% 42.7% 22.5%Sign Language Interpreter 33.1% 35.5% 28.6%Housing Emergency Shelter 43.5% 64.2% 4.7%Housing Assistance 32.2% 50.0% 0.0%Transitional Housing 22.6% 36.1% 0.0%TransportationTransportation to Agency 37.0% 43.4% 25.0%Transportation to Other Sites 32.5% 43.2% 11.9%Economic/EmploymentJob Readiness 15.8% 23.6% 2.4%Direct Financial Assistance 13.8% 18.9% 4.8%Job Training 8.3% 10.3% 4.8%Adult Basic Education/ Literacy 2.8% 4.5% 0.0%Job Placement 1.9% 3.0% 0.0%Other ServicesCrime Victim Compensation Assistance 89.2% 86.4% 94.1%Safety Planning 78.4% 90.8% 55.3%Community Education and Training 76.2% 94.3% 39.5%Medical Advocacy 71.4% 86.6% 43.2%Hotline 59.7% 86.9% 2.5%Child Care 23.3% 24.0% 22.2%
2013 Victim Services Needs Assessment 2013 Victim Services Needs Assessment
Volume VII: Summary Report of Findings | Page 13
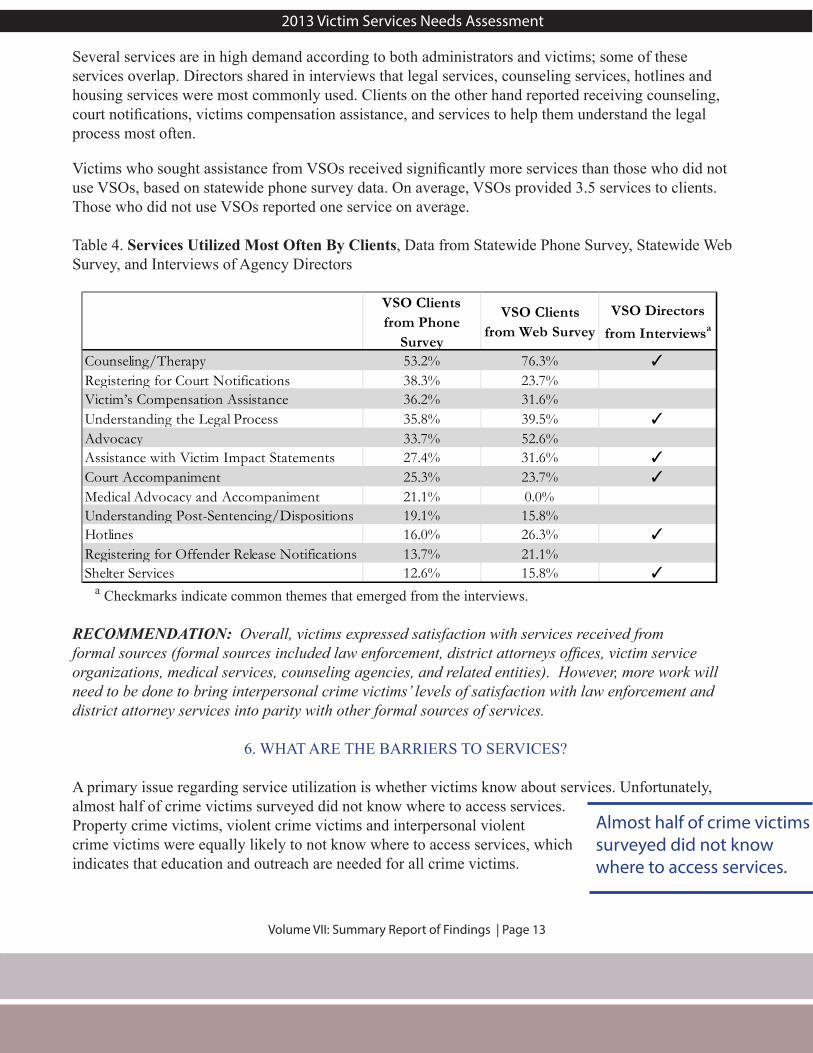
Several services are in high demand according to both administrators and victims; some of these services overlap. Directors shared in interviews that legal services, counseling services, hotlines and housing services were most commonly used. Clients on the other hand reported receiving counseling, court notifications, victims compensation assistance, and services to help them understand the legal process most often.
Victims who sought assistance from VSOs received significantly more services than those who did not use VSOs, based on statewide phone survey data. On average, VSOs provided 3.5 services to clients. Those who did not use VSOs reported one service on average.
Table 4. Services Utilized Most Often By Clients, Data from Statewide Phone Survey, Statewide Web Survey, and Interviews of Agency Directors
VSO Clients from Phone
Survey
VSO Clients from Web Survey
VSO Directors from Interviewsa
Counseling/Therapy 53.2% 76.3% ✓
Registering for Court Notifications 38.3% 23.7%Victim’s Compensation Assistance 36.2% 31.6%Understanding the Legal Process 35.8% 39.5% ✓
Advocacy 33.7% 52.6%Assistance with Victim Impact Statements 27.4% 31.6% ✓
Court Accompaniment 25.3% 23.7% ✓
Medical Advocacy and Accompaniment 21.1% 0.0%Understanding Post-Sentencing/Dispositions 19.1% 15.8%Hotlines 16.0% 26.3% ✓
Registering for Offender Release Notifications 13.7% 21.1%Shelter Services 12.6% 15.8% ✓
a Checkmarks indicate common themes that emerged from the interviews.
RECOMMENDATION: Overall, victims expressed satisfaction with services received from formal sources (formal sources included law enforcement, district attorneys offices, victim service organizations, medical services, counseling agencies, and related entities). However, more work will need to be done to bring interpersonal crime victims’ levels of satisfaction with law enforcement and district attorney services into parity with other formal sources of services.
6. WHAT ARE THE BARRIERS TO SERVICES?
A primary issue regarding service utilization is whether victims know about services. Unfortunately, almost half of crime victims surveyed did not know where to access services. Property crime victims, violent crime victims and interpersonal violent crime victims were equally likely to not know where to access services, which indicates that education and outreach are needed for all crime victims.
9.1%
3.2%2.6%
0.0%
2.0%
4.0%
6.0%
8.0%
10.0%
United States Northeast Region Pennsylvania
Population Change, 2000 - 2009
9.1%
3.2%2.6%
0.0%
2.0%
4.0%
6.0%
8.0%
10.0%
United States Northeast Region Pennsylvania
Population Change, 2000 - 2009
9.1%
3.2%2.6%
0.0%
2.0%
4.0%
6.0%
8.0%
10.0%
United States Northeast Region Pennsylvania
Population Change, 2000 - 2009
9.1%
3.2%2.6%
0.0%
2.0%
4.0%
6.0%
8.0%
10.0%
United States Northeast Region Pennsylvania
Population Change, 2000 - 2009
Almost half of crime victims surveyed did not know where to access services.
2013 Victim Services Needs Assessment
Volume VII: Summary Report of Findings | Page 14
Lack of knowledge of services available was identified as a main barrier to services by the literature review, showing that Pennsylvania is not unique with regard to this barrier.
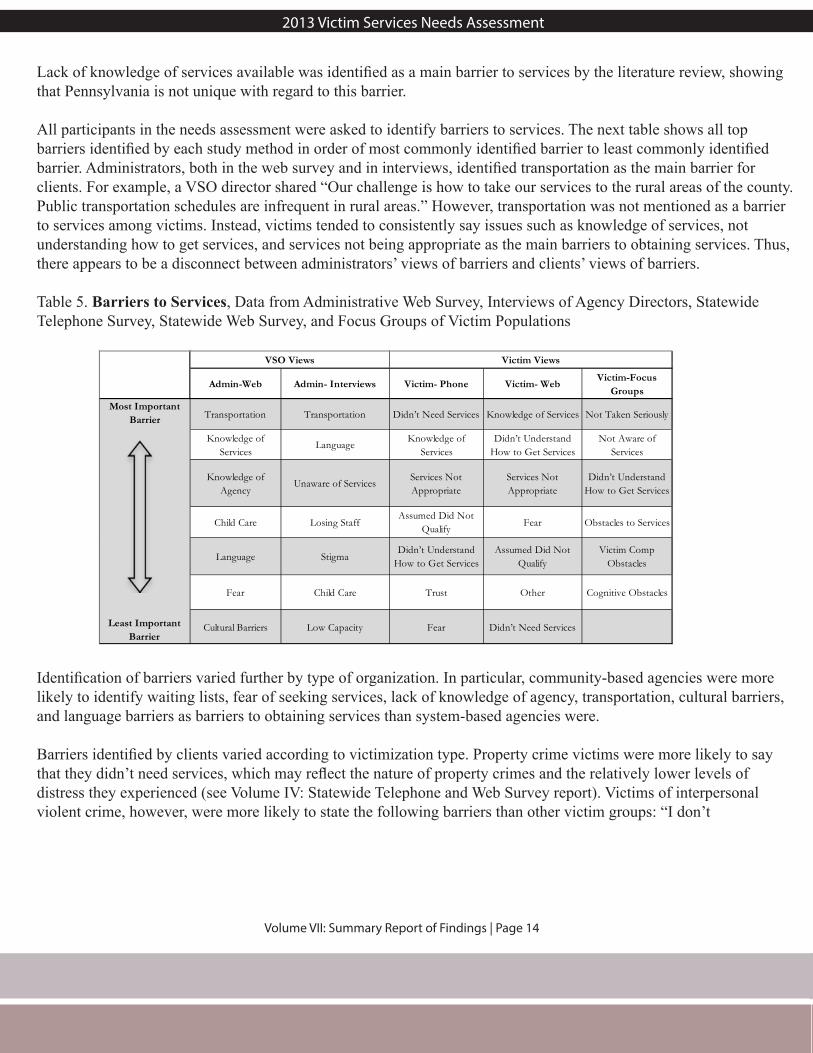
All participants in the needs assessment were asked to identify barriers to services. The next table shows all top barriers identified by each study method in order of most commonly identified barrier to least commonly identified barrier. Administrators, both in the web survey and in interviews, identified transportation as the main barrier for clients. For example, a VSO director shared “Our challenge is how to take our services to the rural areas of the county. Public transportation schedules are infrequent in rural areas.” However, transportation was not mentioned as a barrier to services among victims. Instead, victims tended to consistently say issues such as knowledge of services, not understanding how to get services, and services not being appropriate as the main barriers to obtaining services. Thus, there appears to be a disconnect between administrators’ views of barriers and clients’ views of barriers.
Table 5. Barriers to Services, Data from Administrative Web Survey, Interviews of Agency Directors, Statewide Telephone Survey, Statewide Web Survey, and Focus Groups of Victim Populations
Admin-Web Admin- Interviews Victim- Phone Victim- Web Victim-Focus Groups
Transportation Transportation Didn’t Need Services Knowledge of Services Not Taken Seriously
Knowledge of Services
LanguageKnowledge of
ServicesDidn’t Understand
How to Get ServicesNot Aware of
Services
Knowledge of Agency
Unaware of ServicesServices Not Appropriate
Services Not Appropriate
Didn’t Understand How to Get Services
Child Care Losing StaffAssumed Did Not
QualifyFear Obstacles to Services
Language StigmaDidn’t Understand
How to Get ServicesAssumed Did Not
QualifyVictim Comp
Obstacles
Fear Child Care Trust Other Cognitive Obstacles
Least Important Barrier
Cultural Barriers Low Capacity Fear Didn’t Need Services
Most Important Barrier
VSO Views Victim Views
Identification of barriers varied further by type of organization. In particular, community-based agencies were more likely to identify waiting lists, fear of seeking services, lack of knowledge of agency, transportation, cultural barriers, and language barriers as barriers to obtaining services than system-based agencies were.
Barriers identified by clients varied according to victimization type. Property crime victims were more likely to say that they didn’t need services, which may reflect the nature of property crimes and the relatively lower levels of distress they experienced (see Volume IV: Statewide Telephone and Web Survey report). Victims of interpersonal violent crime, however, were more likely to state the following barriers than other victim groups: “I don’t
2013 Victim Services Needs Assessment 2013 Victim Services Needs Assessment
Volume VII: Summary Report of Findings | Page 15
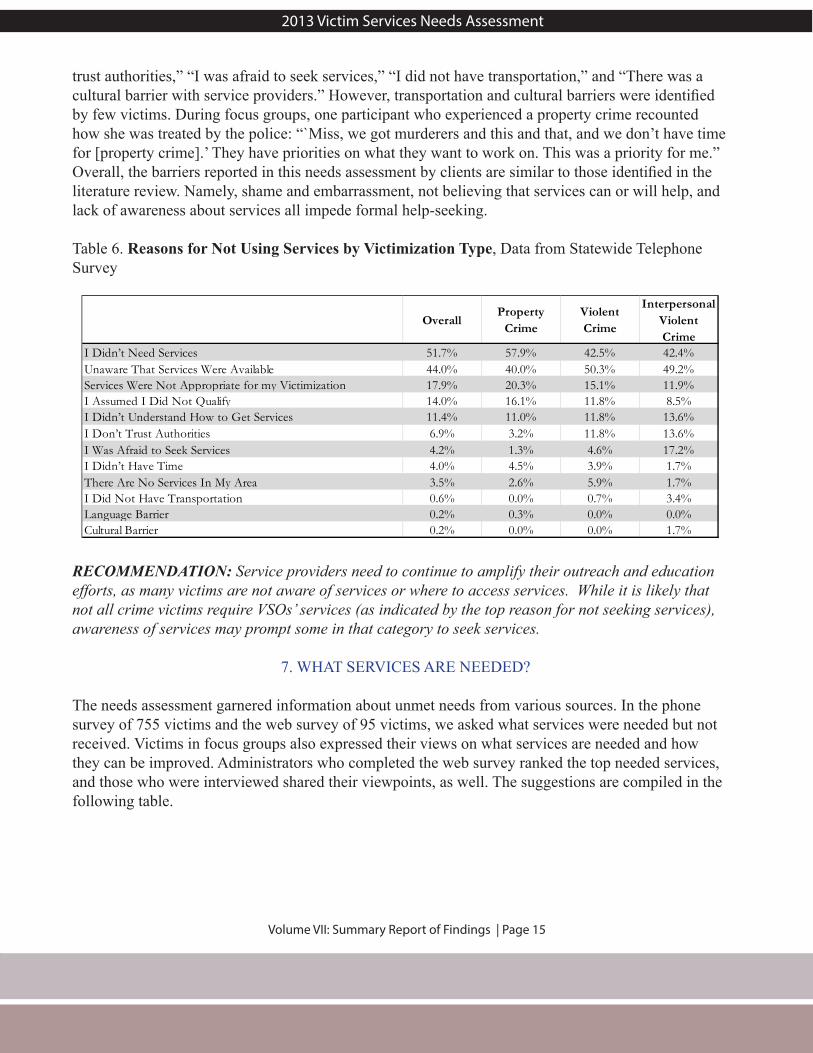
trust authorities,” “I was afraid to seek services,” “I did not have transportation,” and “There was a cultural barrier with service providers.” However, transportation and cultural barriers were identified by few victims. During focus groups, one participant who experienced a property crime recounted how she was treated by the police: “`Miss, we got murderers and this and that, and we don’t have time for [property crime].’ They have priorities on what they want to work on. This was a priority for me.” Overall, the barriers reported in this needs assessment by clients are similar to those identified in the literature review. Namely, shame and embarrassment, not believing that services can or will help, and lack of awareness about services all impede formal help-seeking.
Table 6. Reasons for Not Using Services by Victimization Type, Data from Statewide Telephone Survey
OverallProperty
CrimeViolent Crime
Interpersonal Violent Crime
I Didn’t Need Services 51.7% 57.9% 42.5% 42.4%Unaware That Services Were Available 44.0% 40.0% 50.3% 49.2%Services Were Not Appropriate for my Victimization 17.9% 20.3% 15.1% 11.9%I Assumed I Did Not Qualify 14.0% 16.1% 11.8% 8.5%I Didn’t Understand How to Get Services 11.4% 11.0% 11.8% 13.6%I Don’t Trust Authorities 6.9% 3.2% 11.8% 13.6%I Was Afraid to Seek Services 4.2% 1.3% 4.6% 17.2%I Didn’t Have Time 4.0% 4.5% 3.9% 1.7%There Are No Services In My Area 3.5% 2.6% 5.9% 1.7%I Did Not Have Transportation 0.6% 0.0% 0.7% 3.4%Language Barrier 0.2% 0.3% 0.0% 0.0%Cultural Barrier 0.2% 0.0% 0.0% 1.7%
RECOMMENDATION: Service providers need to continue to amplify their outreach and education efforts, as many victims are not aware of services or where to access services. While it is likely that not all crime victims require VSOs’ services (as indicated by the top reason for not seeking services), awareness of services may prompt some in that category to seek services.
7. WHAT SERVICES ARE NEEDED?
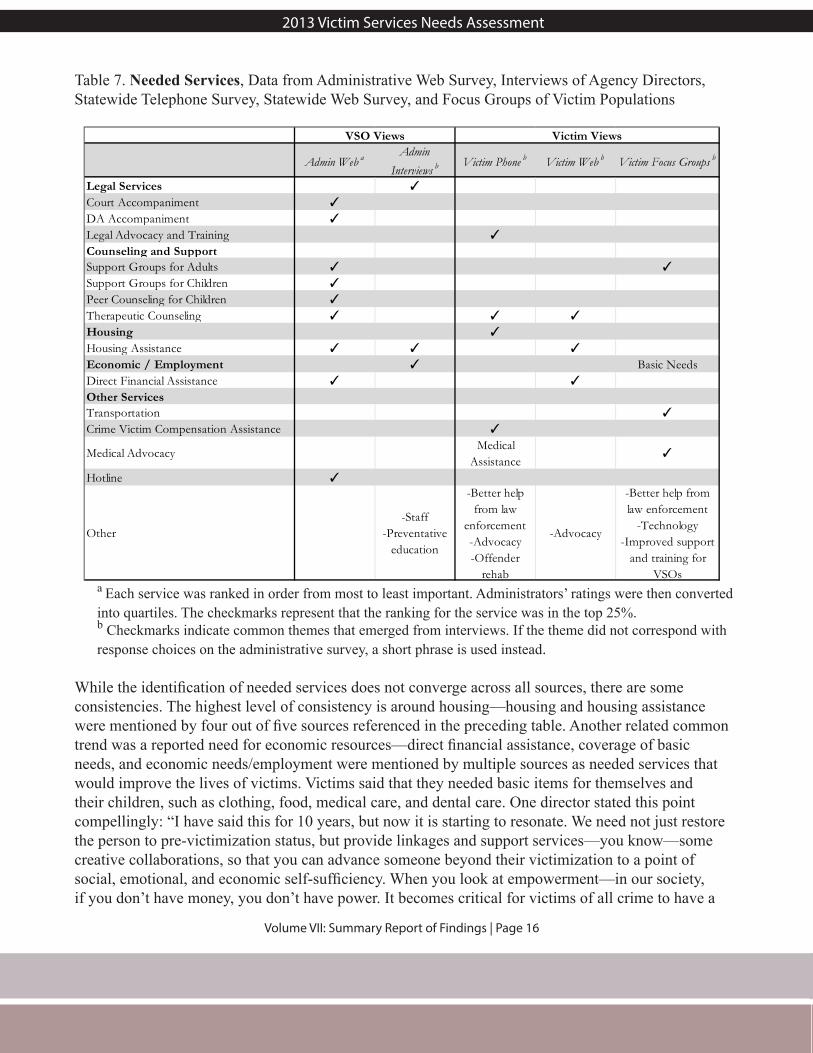
The needs assessment garnered information about unmet needs from various sources. In the phone survey of 755 victims and the web survey of 95 victims, we asked what services were needed but not received. Victims in focus groups also expressed their views on what services are needed and how they can be improved. Administrators who completed the web survey ranked the top needed services, and those who were interviewed shared their viewpoints, as well. The suggestions are compiled in the following table.
2013 Victim Services Needs Assessment
Volume VII: Summary Report of Findings | Page 16
Table 7. Needed Services, Data from Administrative Web Survey, Interviews of Agency Directors, Statewide Telephone Survey, Statewide Web Survey, and Focus Groups of Victim Populations
Admin Web a Admin Interviews b Victim Phone b Victim Web b Victim Focus Groups b
Legal Services ✓
Court Accompaniment ✓
DA Accompaniment ✓
Legal Advocacy and Training ✓
Counseling and Support Support Groups for Adults ✓ ✓
Support Groups for Children ✓
Peer Counseling for Children ✓
Therapeutic Counseling ✓ ✓ ✓
Housing ✓
Housing Assistance ✓ ✓ ✓
Economic / Employment ✓ Basic NeedsDirect Financial Assistance ✓ ✓
Other ServicesTransportation ✓
Crime Victim Compensation Assistance ✓
Medical AdvocacyMedical
Assistance✓
Hotline ✓
Other-Staff
-Preventative education
-Better help from law
enforcement -Advocacy -Offender
rehab
-Advocacy
-Better help from law enforcement
-Technology -Improved support
and training for VSOs
VSO Views Victim Views
a Each service was ranked in order from most to least important. Administrators’ ratings were then converted into quartiles. The checkmarks represent that the ranking for the service was in the top 25%.b Checkmarks indicate common themes that emerged from interviews. If the theme did not correspond with response choices on the administrative survey, a short phrase is used instead.
While the identification of needed services does not converge across all sources, there are some consistencies. The highest level of consistency is around housing—housing and housing assistance were mentioned by four out of five sources referenced in the preceding table. Another related common trend was a reported need for economic resources—direct financial assistance, coverage of basic needs, and economic needs/employment were mentioned by multiple sources as needed services that would improve the lives of victims. Victims said that they needed basic items for themselves and their children, such as clothing, food, medical care, and dental care. One director stated this point compellingly: “I have said this for 10 years, but now it is starting to resonate. We need not just restore the person to pre-victimization status, but provide linkages and support services—you know—some creative collaborations, so that you can advance someone beyond their victimization to a point of social, emotional, and economic self-sufficiency. When you look at empowerment—in our society, if you don’t have money, you don’t have power. It becomes critical for victims of all crime to have a
2013 Victim Services Needs Assessment 2013 Victim Services Needs Assessment
Volume VII: Summary Report of Findings | Page 17
path to self-sufficiency. It is critical to provide advancement strategies to truly move them beyond their victimization.” Another research study of VSO directors found similar trends—many identified housing as an ideal service, defined as a service that is central to an organization’s mission, but may not be provided due to a lack of funding or other barriers (Macy, Giattina, Montijo & Ermentrout, 2010). Some of the services identified as needed (e.g., housing and economic assistance) are not commonly offered, as shown in Table 3. VSOs may be experiencing a tug between providing core services and providing additional needed services, especially given funding cuts.
Within counseling and support services, both administrators and victims agree that support groups for adults and therapeutic counseling are needed. Victims expressed that meeting medical needs and medical advocacy are needed services along with victims compensation. Together, these trends point to the need for victim services to continue to reach beyond the traditional foci of physical safety and empowerment.
Community-based programs gave more priority than system-based programs to hotlines and emergency shelters as needed services, while system-based programs gave more priority to court accompaniment, support groups for children, and drug and alcohol counseling than community-based programs.
With regard to hotlines, only administrators ranked them as a top-needed service. This could indicate that victims are satisfied with the current level of services or that they are not a top priority for victims. As indicated previously, many VSO clients did not use a hotline. Further, victims overall tended to not use a hotline. In fact, only 2.3% of victims used a hotline, though this number is substantially higher for interpersonal violent crime victims. Specifically, interpersonal violent crime victims were most likely to use hotlines (9.1%), followed by violent crime victims (1.8%), and property crime victims (0.2%). Additional analysis of PCCD’s statewide Hotline Evaluation Study could provide insight into the feasibility of providing hotline services for victims of crime.
Unmet needs, or services/assistance that were needed, but not received, were most frequent among violent crime victims (23.7%), but were also apparent among interpersonal violent crime victims (22.0%) and property crime victims (11.2%). The top three unmet needs among violent crime victims were victims compensation assistance, better assistance from law enforcement, and counseling/therapy. The top three unmet needs among interpersonal violent crime victims were counseling/therapy, advocacy, and better assistance from law enforcement. Finally, the top three unmet needs among property crime victims were better assistance from law enforcement, victims compensation assistance, and counseling/therapy.
RECOMMENDATION: According to victims and agency administrators, victims need services that address basic areas of well-being such as access to affordable housing, meeting economic needs, transportation, support, adequate medical care, and counseling. Expansion of victim services in these areas should be explored, including collaborations with other service providers.
RECOMMENDATION: Despite VSOs offering victims compensation assistance, many victims are not using the service and some identify compensation as an unmet need. PCCD and local VSOs should
2013 Victim Services Needs Assessment
Volume VII: Summary Report of Findings | Page 18
work together to identify and overcome barriers to accessing and/or receiving compensation.
8. WHICH DEMOGRAPHIC GROUPS AND TYPES OF VICTIMIZATIONS ARE UNDERSERVED?
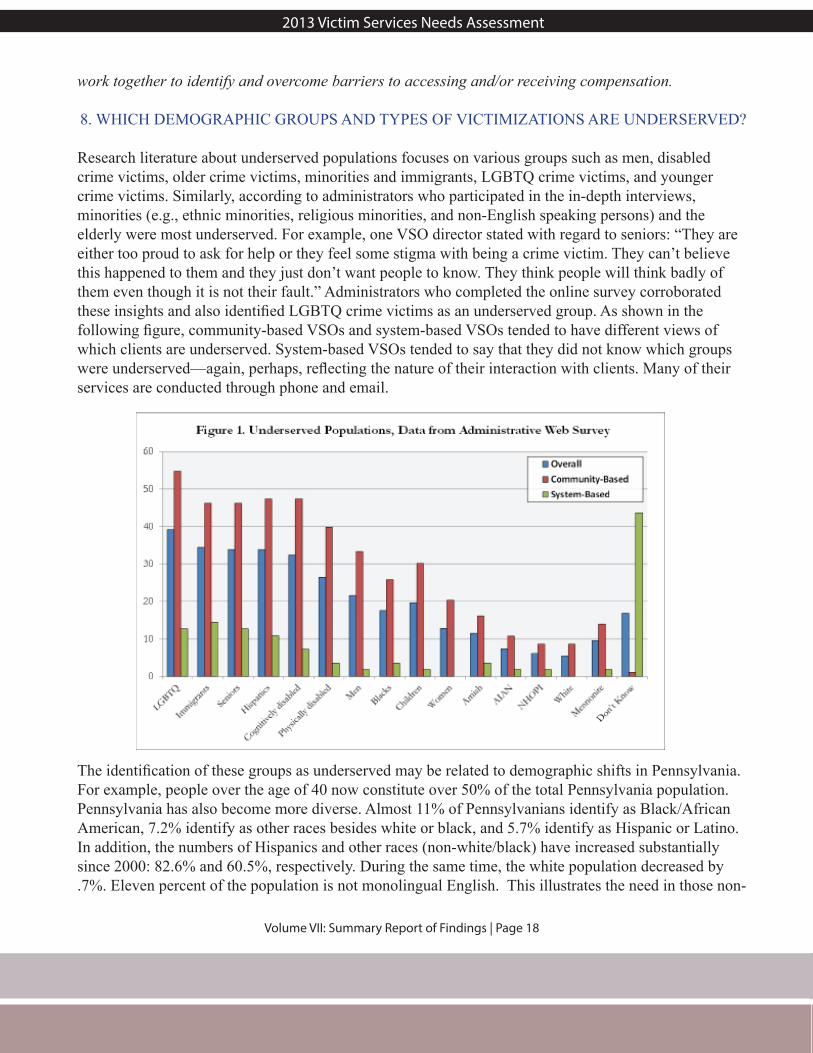
Research literature about underserved populations focuses on various groups such as men, disabled crime victims, older crime victims, minorities and immigrants, LGBTQ crime victims, and younger crime victims. Similarly, according to administrators who participated in the in-depth interviews, minorities (e.g., ethnic minorities, religious minorities, and non-English speaking persons) and the elderly were most underserved. For example, one VSO director stated with regard to seniors: “They are either too proud to ask for help or they feel some stigma with being a crime victim. They can’t believe this happened to them and they just don’t want people to know. They think people will think badly of them even though it is not their fault.” Administrators who completed the online survey corroborated these insights and also identified LGBTQ crime victims as an underserved group. As shown in the following figure, community-based VSOs and system-based VSOs tended to have different views of which clients are underserved. System-based VSOs tended to say that they did not know which groups were underserved—again, perhaps, reflecting the nature of their interaction with clients. Many of their services are conducted through phone and email.
The identification of these groups as underserved may be related to demographic shifts in Pennsylvania. For example, people over the age of 40 now constitute over 50% of the total Pennsylvania population. Pennsylvania has also become more diverse. Almost 11% of Pennsylvanians identify as Black/African American, 7.2% identify as other races besides white or black, and 5.7% identify as Hispanic or Latino. In addition, the numbers of Hispanics and other races (non-white/black) have increased substantially since 2000: 82.6% and 60.5%, respectively. During the same time, the white population decreased by .7%. Eleven percent of the population is not monolingual English. This illustrates the need in those non-

2013 Victim Services Needs Assessment 2013 Victim Services Needs Assessment
Volume VII: Summary Report of Findings | Page 19
monolingual English counties for VSOs to offer services in various languages.
While we did not ask victims themselves if they were underserved, we can determine which groups received and did not receive services (i.e., services from VSOs, district attorneys’ offices, law enforcement, counseling agencies, medical services, banks, and insurance companies) by reviewing characteristics reported in the Statewide Telephone Survey. Service utilization did not vary by type of victimization experience. Those who did not receive services were characterized as:
• having reported a significantly lower number of victimization experiences (1.51 among those who did not receive services, 1.70 among those who received services),
• having had the index crime occur fewer times (4.01 among those who did not receive services, 6.48 among those who received services),
• having had the crime occur further in the past (11.90 years ago among those who did not receive services, 9.36 years among those who received services), and
• using fewer informal supports (1.21 among those who did not receive services, 1.74 among those who received services).
Those who did not receive services were more likely to not know their offender and to reside in the Northeast Region, be male, be African-American or Asian, and identify as LGBTQ than served victims. Specifically, 47% of the victims in the Northeast did not receive services, 54% of male victims did not receive services, 38% of African American victims did not receive services, 100% of Asian victims (n = 7) did not receive services, and 54.2% of LGBTQ victims did not receive services.
When asked if they offered culturally specific services for specific groups (identified in the following table), VSOs indicated that culturally specific services are offered by some, but not a majority of programs. This is especially true of system-based VSOs. Please note that this question was intended to identify services that were designed to be culturally specific, and does not indicate that services are not generally available to these populations.
Table 8. Culturally-Specific Services, Data from Administrative Web Survey
Overall Community-Based System-BasedTeens / Young Adults 58.7% 78.3% 20.9%Seniors 40.2% 47.6% 25.6%Male Victims 35.7% 51.2% 6.8%Cognitively Disabled 35.3% 46.8% 14.3%Hispanics 30.1% 40.5% 11.4%LGBTQ Victims 29.5% 42.5% 4.8%
Comparison of clients routinely served with the trainings offered allows for identification of training needs. Specifically, VSOs serve men and Hispanics in higher numbers than their training would suggest. Hence, VSOs may consider these areas for training.
2013 Victim Services Needs Assessment
Volume VII: Summary Report of Findings | Page 20
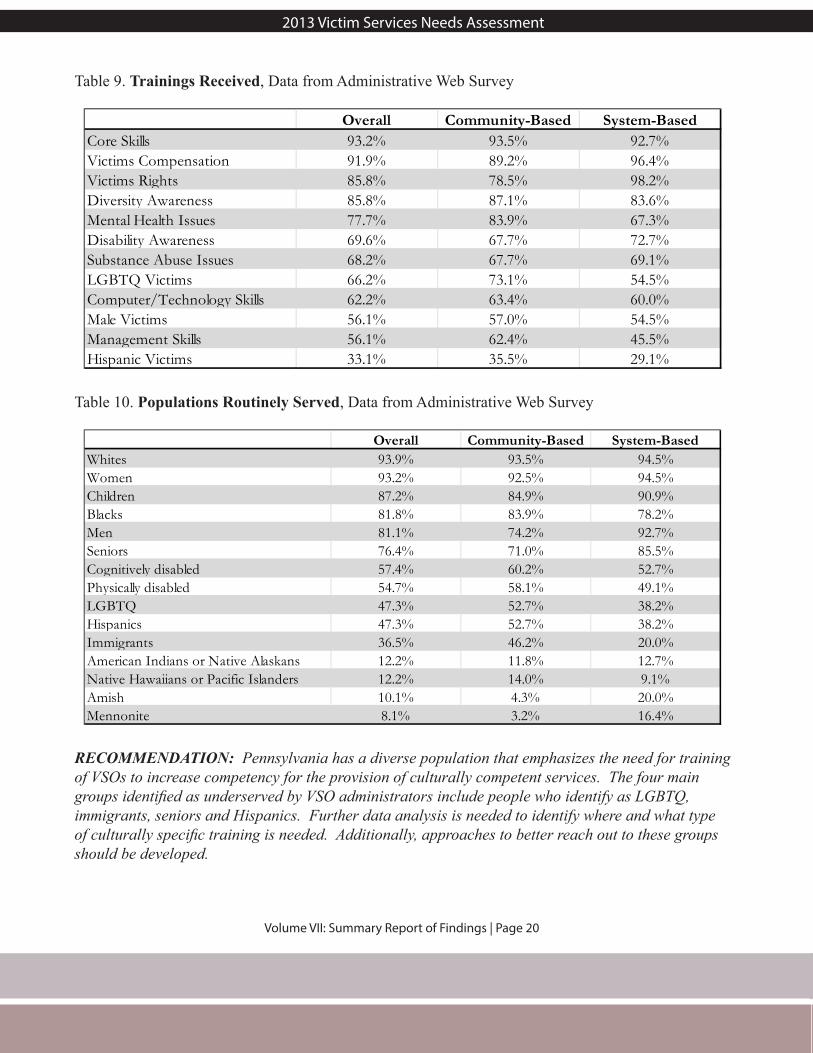
Table 9. Trainings Received, Data from Administrative Web Survey
Overall Community-Based System-BasedCore Skills 93.2% 93.5% 92.7%Victims Compensation 91.9% 89.2% 96.4%Victims Rights 85.8% 78.5% 98.2%Diversity Awareness 85.8% 87.1% 83.6%Mental Health Issues 77.7% 83.9% 67.3%Disability Awareness 69.6% 67.7% 72.7%Substance Abuse Issues 68.2% 67.7% 69.1%LGBTQ Victims 66.2% 73.1% 54.5%Computer/Technology Skills 62.2% 63.4% 60.0%Male Victims 56.1% 57.0% 54.5%Management Skills 56.1% 62.4% 45.5%Hispanic Victims 33.1% 35.5% 29.1%
Table 10. Populations Routinely Served, Data from Administrative Web Survey
Overall Community-Based System-BasedWhites 93.9% 93.5% 94.5%Women 93.2% 92.5% 94.5%Children 87.2% 84.9% 90.9%Blacks 81.8% 83.9% 78.2%Men 81.1% 74.2% 92.7%Seniors 76.4% 71.0% 85.5%Cognitively disabled 57.4% 60.2% 52.7%Physically disabled 54.7% 58.1% 49.1%LGBTQ 47.3% 52.7% 38.2%Hispanics 47.3% 52.7% 38.2%Immigrants 36.5% 46.2% 20.0%American Indians or Native Alaskans 12.2% 11.8% 12.7%Native Hawaiians or Pacific Islanders 12.2% 14.0% 9.1%Amish 10.1% 4.3% 20.0%Mennonite 8.1% 3.2% 16.4%
RECOMMENDATION: Pennsylvania has a diverse population that emphasizes the need for training of VSOs to increase competency for the provision of culturally competent services. The four main groups identified as underserved by VSO administrators include people who identify as LGBTQ, immigrants, seniors and Hispanics. Further data analysis is needed to identify where and what type of culturally specific training is needed. Additionally, approaches to better reach out to these groups should be developed.
2013 Victim Services Needs Assessment 2013 Victim Services Needs Assessment
Volume VII: Summary Report of Findings | Page 21
9. WHAT ISSUES ARE VSOS FACING?
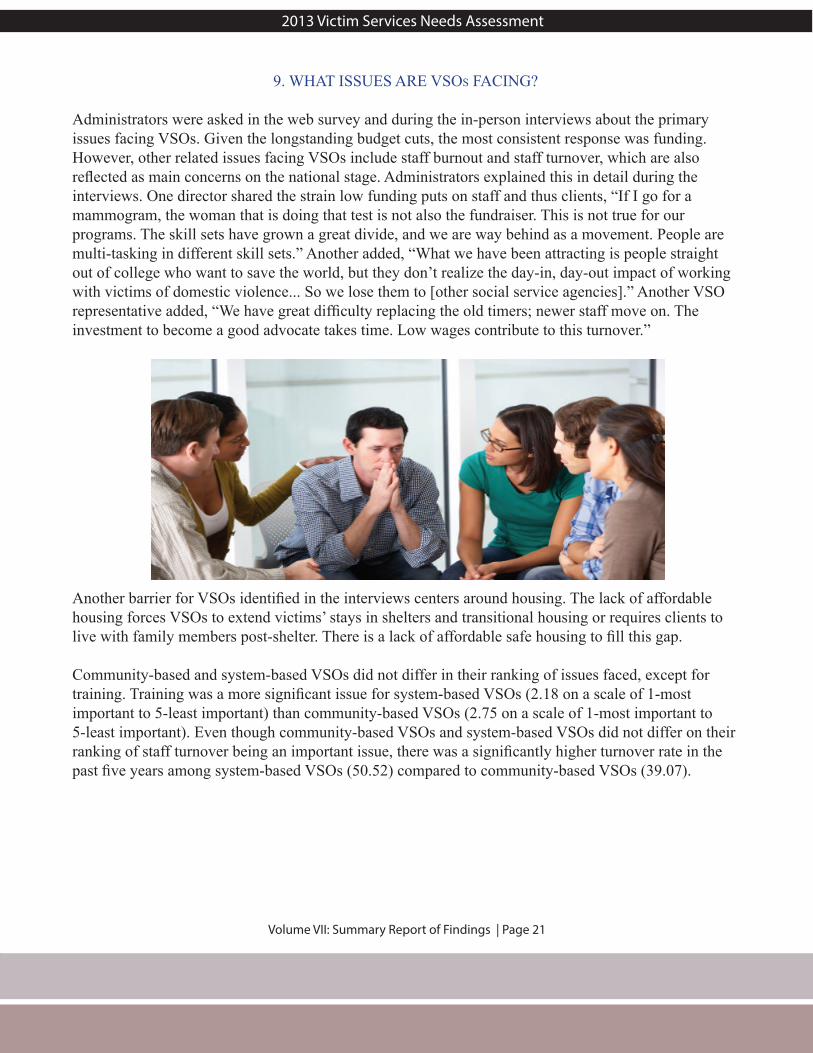
Administrators were asked in the web survey and during the in-person interviews about the primary issues facing VSOs. Given the longstanding budget cuts, the most consistent response was funding. However, other related issues facing VSOs include staff burnout and staff turnover, which are also reflected as main concerns on the national stage. Administrators explained this in detail during the interviews. One director shared the strain low funding puts on staff and thus clients, “If I go for a mammogram, the woman that is doing that test is not also the fundraiser. This is not true for our programs. The skill sets have grown a great divide, and we are way behind as a movement. People are multi-tasking in different skill sets.” Another added, “What we have been attracting is people straight out of college who want to save the world, but they don’t realize the day-in, day-out impact of working with victims of domestic violence... So we lose them to [other social service agencies].” Another VSO representative added, “We have great difficulty replacing the old timers; newer staff move on. The investment to become a good advocate takes time. Low wages contribute to this turnover.”
Another barrier for VSOs identified in the interviews centers around housing. The lack of affordable housing forces VSOs to extend victims’ stays in shelters and transitional housing or requires clients to live with family members post-shelter. There is a lack of affordable safe housing to fill this gap.
Community-based and system-based VSOs did not differ in their ranking of issues faced, except for training. Training was a more significant issue for system-based VSOs (2.18 on a scale of 1-most important to 5-least important) than community-based VSOs (2.75 on a scale of 1-most important to 5-least important). Even though community-based VSOs and system-based VSOs did not differ on their ranking of staff turnover being an important issue, there was a significantly higher turnover rate in the past five years among system-based VSOs (50.52) compared to community-based VSOs (39.07).
2013 Victim Services Needs Assessment
Volume VII: Summary Report of Findings | Page 22
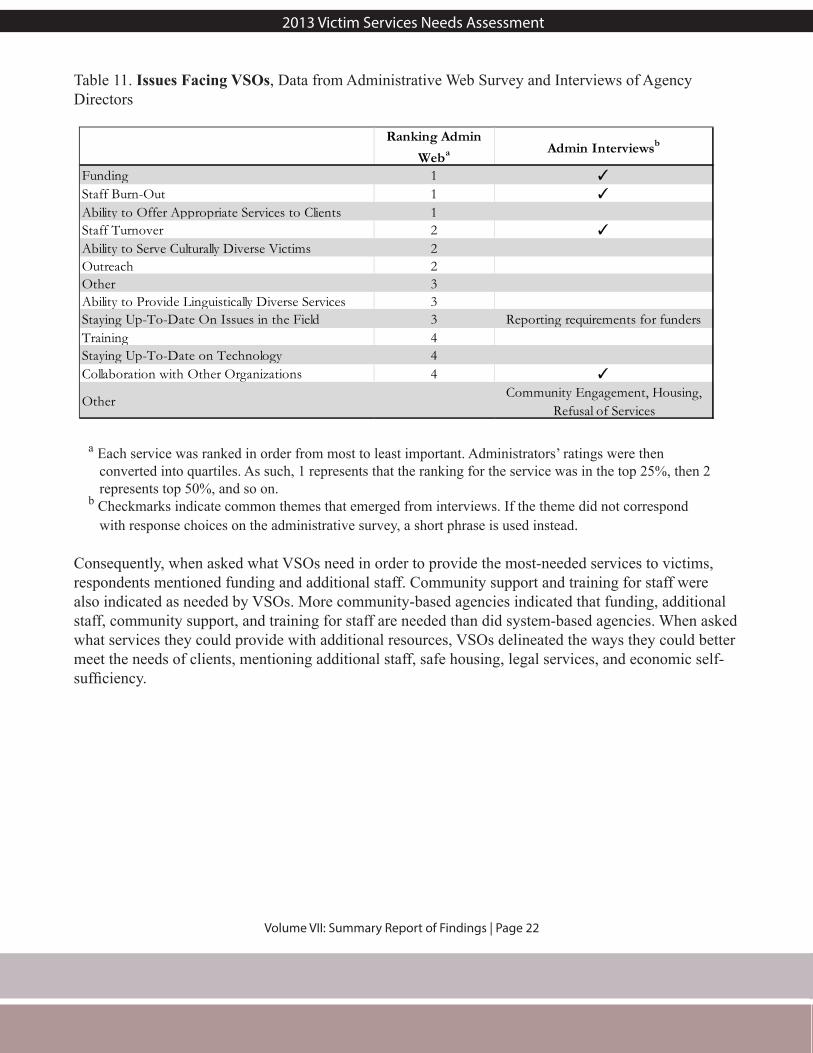
Table 11. Issues Facing VSOs, Data from Administrative Web Survey and Interviews of Agency Directors
Ranking Admin Weba Admin Interviewsb
Funding 1 ✓
Staff Burn-Out 1 ✓
Ability to Offer Appropriate Services to Clients 1Staff Turnover 2 ✓
Ability to Serve Culturally Diverse Victims 2Outreach 2Other 3Ability to Provide Linguistically Diverse Services 3Staying Up-To-Date On Issues in the Field 3 Reporting requirements for fundersTraining 4Staying Up-To-Date on Technology 4Collaboration with Other Organizations 4 ✓
OtherCommunity Engagement, Housing,
Refusal of Services
a Each service was ranked in order from most to least important. Administrators’ ratings were then converted into quartiles. As such, 1 represents that the ranking for the service was in the top 25%, then 2 represents top 50%, and so on. b Checkmarks indicate common themes that emerged from interviews. If the theme did not correspond with response choices on the administrative survey, a short phrase is used instead.
Consequently, when asked what VSOs need in order to provide the most-needed services to victims, respondents mentioned funding and additional staff. Community support and training for staff were also indicated as needed by VSOs. More community-based agencies indicated that funding, additional staff, community support, and training for staff are needed than did system-based agencies. When asked what services they could provide with additional resources, VSOs delineated the ways they could better meet the needs of clients, mentioning additional staff, safe housing, legal services, and economic self-sufficiency.
2013 Victim Services Needs Assessment 2013 Victim Services Needs Assessment
Volume VII: Summary Report of Findings | Page 23
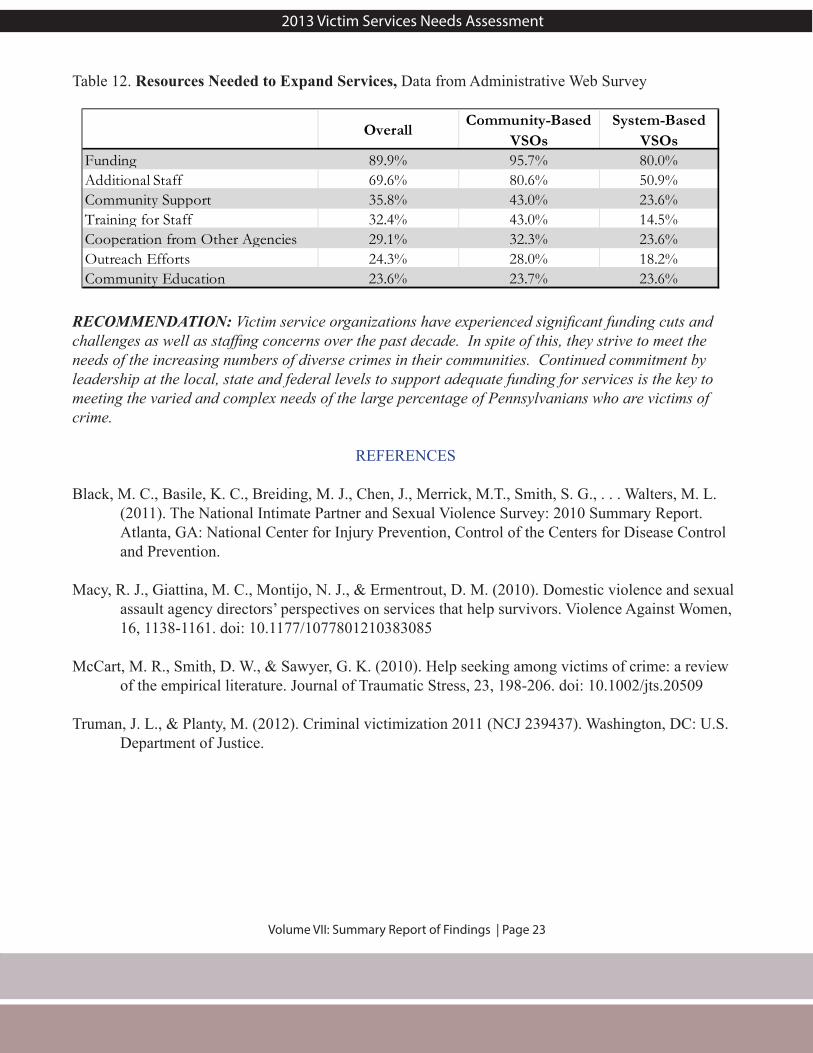
Table 12. Resources Needed to Expand Services, Data from Administrative Web Survey
Overall Community-Based VSOs
System-Based VSOs
Funding 89.9% 95.7% 80.0%Additional Staff 69.6% 80.6% 50.9%Community Support 35.8% 43.0% 23.6%Training for Staff 32.4% 43.0% 14.5%Cooperation from Other Agencies 29.1% 32.3% 23.6%Outreach Efforts 24.3% 28.0% 18.2%Community Education 23.6% 23.7% 23.6%
RECOMMENDATION: Victim service organizations have experienced significant funding cuts and challenges as well as staffing concerns over the past decade. In spite of this, they strive to meet the needs of the increasing numbers of diverse crimes in their communities. Continued commitment by leadership at the local, state and federal levels to support adequate funding for services is the key to meeting the varied and complex needs of the large percentage of Pennsylvanians who are victims of crime.
REFERENCES
Black, M. C., Basile, K. C., Breiding, M. J., Chen, J., Merrick, M.T., Smith, S. G., . . . Walters, M. L. (2011). The National Intimate Partner and Sexual Violence Survey: 2010 Summary Report. Atlanta, GA: National Center for Injury Prevention, Control of the Centers for Disease Control and Prevention.
Macy, R. J., Giattina, M. C., Montijo, N. J., & Ermentrout, D. M. (2010). Domestic violence and sexual assault agency directors’ perspectives on services that help survivors. Violence Against Women, 16, 1138-1161. doi: 10.1177/1077801210383085
McCart, M. R., Smith, D. W., & Sawyer, G. K. (2010). Help seeking among victims of crime: a review of the empirical literature. Journal of Traumatic Stress, 23, 198-206. doi: 10.1002/jts.20509
Truman, J. L., & Planty, M. (2012). Criminal victimization 2011 (NCJ 239437). Washington, DC: U.S. Department of Justice.


![202 Chapitre VII - > [, ] ] } v Ç v v - la vie paysanne ...viepaysanneautrefois.free.fr/chapitres/ch02/223_VaisseliersBuffets... · 202 Chapitre VII - > [, ] ] } v Ç v v ... sur](https://img.pdfslide.net/doc/110x75/5b9e7b1409d3f26e288b82d9/202-chapitre-vii-v-c-v-v-la-vie-paysanne-202-chapitre-vii.jpg)


![CHAPTER V,VI,&VII[1]](https://img.pdfslide.net/doc/110x75/56d6bf291a28ab3016951c2a/chapter-vvivii1.jpg)