Embed Size (px)
Citation preview
DRAFT IDP 2013 Page 0
TABLE OF CONTENTS
DRAFT INTERGRATED DEVELOPMENT PLAN
2013/14- 2018

DRAFT IDP 2013 Page 1
TABLE OF CONTENT
1. Vision, Mission and Values......................................................5
2. Foreword by the Mayor..............................................................6
3. Executive Summary...................................................................7
4. The Planning Process...............................................................13
5. Situational Analysis..................................................................33
6. Strategy Phase..........................................................................136
7. Project Phase and Budget Summary......................................176
8. Integration Phase......................................................................203

DRAFT IDP 2013 Page 2
LIST OF ACRONYMS
BBBEE BROAD BASED BLACK ECONOMIC EMPOWERMENT
CPA COMMUNITY PROPERTY ASSOCIATION
COGHSTA Cooperative Governance and Traditional Affairs
CDW COMMUNITY DEVELOPMENT WORKER
CRDP COMPREHESIVE RURAL DEVELOPMENT PLAN
DGDS DISTRICT GROWTH DEVELOPMENT SUMMIT
DPLG DEPARTMENT OF PROVINCIAL AND LOCAL GOVERNMENT
DOE DEPARTMENT OF EDUCATION
DWA DEPARTMENT OF WATER AFFAIRS
EPWP EXPANDED PUBLIC WORKS PROGRAMME
ESKOM ELECTRICITY SUPPLY COMMITTEE
GDP GROSS DOMESTIC PRODUCT
GEAR GROWTH EMPLOYMENT AND REDISTRIBUTION
IDP INTEGRATED DEVELOPMENT PLAN
IGR INTER-GOVERNMENTAL RELATIONS
LDA LIMPOPO DEPARTMENT OF AGRICULTURE
LED LOCAL ECONMIC DEVELOPMENT
LUMS LAND USE MANAGEMENT SCHEME
DRAFT IDP 2013 Page 3
MDM MOPANI DISTRICT MUNICIPALITY
MEC MEMBER OF EXECUTIVE COUNCIL
MFMA MUNICIPAL FINANCE MANAGEMENT ACT
MLM MARULENG LOCAL MUNICIPALITY
MSA MUNICIPAL STRUCTURES ACT
MSA MUNICIPAL SYSTEMS ACT
MTAS MUNICIPAL TURN AROUND STRATEGY
NGO NON-GOVERNMENTAL ORGANISATION
NSDP NATIONAL SPATIAL DEVELOPMENT PERSPECTIVE
PGDS PROVINCIAL GROWTH AND DEVELOPMENT STRATEGY
PMS PERFORMANCE MANAGEMENT SYSTEM
RAL ROAD AGENCY LIMPOPO
RDP RECONSTRUCTION AND DEVELOPMENT PROGRAM
SAPS SOUTH AFRICAN POLICE SERVICE
SDBIP SERVICE DELIVERY AND BUDGET IMPLEMENTATION PLAN
SMME SMALL MEDIUM MICRO ENTEPRISE
SWOT STRENGTH, WEAKNESSES, OPPORTUNITIES AND THREATS

DRAFT IDP 2013 Page 4
1. Vision, Mission and Values
Vision
To be the power house of socio-economic development through sustainable and integrated agriculture and tourism.
Mission
Maruleng Local Municipality is committed to the provision of the basic services and the promotion of socio-economic development in an integrated and sustainable
manner.
Slogan
Wildlife haven.
Values and ethics
The municipality adheres to the following values and ethics that uphold the constitution of the Republic of South Africa through:
Courtesy
Transparency
Commitment
Trustworthy
Accountability
Reliability
Accessible
Honesty
Respect
Professionalism

DRAFT IDP 2013 Page 5
MAYOR’S FOREWORD
This document- the Draft Integrated Development Plan (IDP) is the first strategic plan of the current Council which came in office after the 2011 Local Government
Election. It is also the product of many months of consultation within the Maruleng municipal Council and with communities, institutions, organizations and individuals in
the wider civil society. This IDP Review for 2013/18 is a developmental but political-driven plan, developed to guide socio-economic development in the municipal area. It
is a strategic plan that defines the synergy between various priority needs and the sector plans that address community needs.
The 2013/18 IDP review process has also assisted in determining community and stakeholder needs, prioritizing developmental
objectives and seeking better ways to implement programmers to achieve key objectives and measuring municipal performance. The
municipality has prioritized communities needs particularly, the rural poor.
There have been ongoing processes to review the institutional arrangements of the administrative structures of the Council to enable
the municipality to meet the developmental challenges as per its Constitutional mandate. Council is also improving its communication,
participatory and decision-making mechanisms to ensure that IDP remains the only popular strategic roadmap to the betterment of life
for all. The focus for this financial year will be on accelerated service delivery and job creation. On behalf of Council I would like to
appreciate the contribution of all our stakeholders through the IDP process. “No government can claim legitimacy if is not based
on the will of the people.”
TOGETHER WE CAN BUILD BETTER COMMUNITIES!
P.A.MAFOLOGELE
MAYOR

DRAFT IDP 2013 Page 6
EXECUTIVE SUMMARY
The IDP has to be reviewed annually in order to:
Ensure its relevance as the Municipality’s Strategic Plan
Inform other components of the Municipal business process including institutional, financial, planning and budgeting.
Inform the cyclical inter-governmental planning and budgeting cycle.
For the IDP to remain relevant a municipality must assess its performance and the achievements of its targets and strategic objectives. The IDP will therefore have to
reflect the impact of successes as well as corrective measures to address challenges.
The IDP, as the Maruleng Municipality’s strategic plan, informs municipal decision-making as well as all business processes of the Municipality. The IDP must inform the
municipality’s financial and institutional planning and most importantly, the drafting of the annual budget.

DRAFT IDP 2013 Page 7
The IDP process and the budget process are two distinct but integrally linked processes which must be coordinated to ensure that the IDP and budget related policies
and the tabled budget are mutually consistent and credible. (Municipal Finance Management Act, 2003; Local Government: Municipal Planning and Performance
Management Regulations, 2001).
The IDP process will address internal and external circumstances that impact on the priority issues, objectives, strategies, projects and programmes of integrated
planning as reflect below in figure 1.

DRAFT IDP 2013 Page 8
Preparing for the IDP
PU
BLIC
PA
RTIC
IPA
TION
Situational Analysis
Refined Objectives, Strategies
and Project Phase
Drafting Review Document,
including Budget
Approval
IDP IMPLEMENTATION
Performance
Management

DRAFT IDP 2013 Page 9
Key Elements to be addressed during this Process
During the process of deepening strategic influence of the IDP, consideration to the constantly changing environment impacting on the municipality needs to be
considered too. In general terms the review then also addresses the following:
Incorporation of comments from various Role Players
Incorporate comments from Provincial MEC
Review and inclusion of new/additional information
Weaknesses through self-assessment
Alignment of Sector Plans
Alignment of IDP with Provincial Programmes and Policies
This executive summary gives a concise overview of the municipality, its current situation, key challenges and opportunities. It also highlights priorities, strategies to
improve the situation, how progress will be measured as well as powers and functions of the municipality.
Strategic objectives
The Department of Local Government and Housing has identified Key Performance Areas (KPAs) whereby the Strategic Agenda can be implemented and monitored. Of
critical nature for the municipality will be to link its strategic objectives to the Strategic Agenda of National Government. The table below provides the detail whereby the
strategic objectives of the municipality can be linked to the five Key Performance Areas as stipulated by the Department of Local Government and Housing:
DRAFT IDP 2013 Page 10
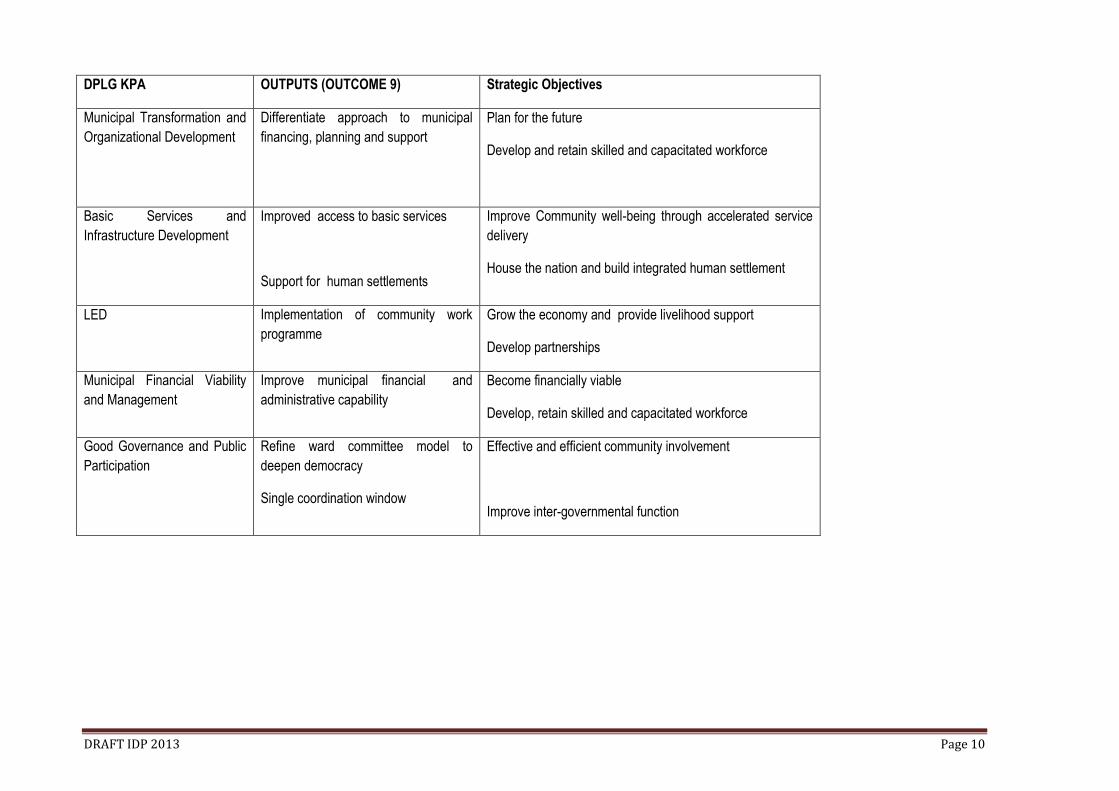
DPLG KPA OUTPUTS (OUTCOME 9) Strategic Objectives
Municipal Transformation and
Organizational Development
Differentiate approach to municipal
financing, planning and support
Plan for the future
Develop and retain skilled and capacitated workforce
Basic Services and
Infrastructure Development
Improved access to basic services
Support for human settlements
Improve Community well-being through accelerated service
delivery
House the nation and build integrated human settlement
LED Implementation of community work
programme
Grow the economy and provide livelihood support
Develop partnerships
Municipal Financial Viability
and Management
Improve municipal financial and
administrative capability
Become financially viable
Develop, retain skilled and capacitated workforce
Good Governance and Public
Participation
Refine ward committee model to
deepen democracy
Single coordination window
Effective and efficient community involvement
Improve inter-governmental function

DRAFT IDP2013 Page 11
Progress made thus far
The municipality has managed to fill most of the strategic positions. All Senior Managers have signed performance contracts and are continuously assessed Most major roads are tarred (58%) About 68% of the households have access to RDP Standard water 93.7 % of the population have access electricity About 93.1% have access to sanitation Effective Project Management Unit Unqualified Audit Opinion for financial 2009-10 The municipality has won Vuna awards on Service Delivery Provincial in 2008/9 The municipality has won back-to-back District Executive Mayor’s Excellent Award on Best Performing Municipality
Challenges
The majority of people in Maruleng are located far away from the economic hub of the municipality, namely Hoedspruit. The town is the economic node of the municipality
surrounded by privately – owned land which is not readily available for new development. There is a general shortage of technical skills in the area and most of rural
communities get jobs in Tzaneen and Phalaborwa and thus promoting economic activities outside their municipality. 18.5% of the municipal area is subjected to 25
registered land claims. However, recently the municipality has acquired land in Zandspruit in Hoedspruit which will be used for the development of both low and medium
income settlement. This will assist the municipality in its quest to have an integrated settlement in its economic hub
The municipality has a small revenue base and it is not able to meet some of its constitutional obligations and none availability of unlicensed landfill site. However
processes are underway to have a registered landfill site in Worcester and to extend collection of waste in rural areas. Another major challenge is financial resources to
maintain the existing infrastructure as MIG does not cater for.
Flooding is also a major problem during heavy rains. On the 19th- 20th January 2012 intensive rainfall was experienced over lowveld of Mpumalanga and Limpopo
Provinces, and resulted in extraordinary floods occurring in all major rivers. Lower Olifants area was affected and rivers such as Selati, Blyde, Klaserie, Timbavati and all

DRAFT IDP2013 Page 12
tributaries East of Tzaneen experienced abnormal high flows, resulting in infrastructure damages and flooding. About 307 households were affected by the rain in rural
areas. Molalane village was the most affected. A total number of 355 households were affected by floods on the farms around Hoedspruit. These floods impacted
negatively on the progress made regarding provisioning of services. The estimated cost to damages is about R250 million.
Opportunities
Tourism
The Maruleng Municipality has large game farms from which the municipality can grow its tax base. It also boasts of the East gate Airport through which it can promote its
tourism status and ensure direct access to other provinces for marketing. The area is also imbued with agro-products across
Maruleng municipality is wedged between some of Limpopo prime tourist attractions, including the Kruger National Park, Timbavati Private Reserve and Blyde River
Canyon. Significant tourism related activities exist as well as numerous private lodges and guesthouses. An existing airport will play a significant role to increase tourist
traffic and establish the area as a gateway to the Kruger and surrounding areas.
There are an estimated 2814 beds in 70 lodges 10 guesthouses and 10 resorts in the municipality. Estimated 70 to 80% of Lowveld luxury lodges.R527 route gives
access to Khamai Reptile Park, Bombyx Mori Silk farm and Moholoholo Animal Rehabilitation centre. Maruleng municipality boasts major Private Game Reserves and 5-
star luxury lodges, namely;
Thornbush and Kapama
Timbavati (home of the white lions)
Klaserie
Babule and Oliphants
DRAFT IDP2013 Page 13
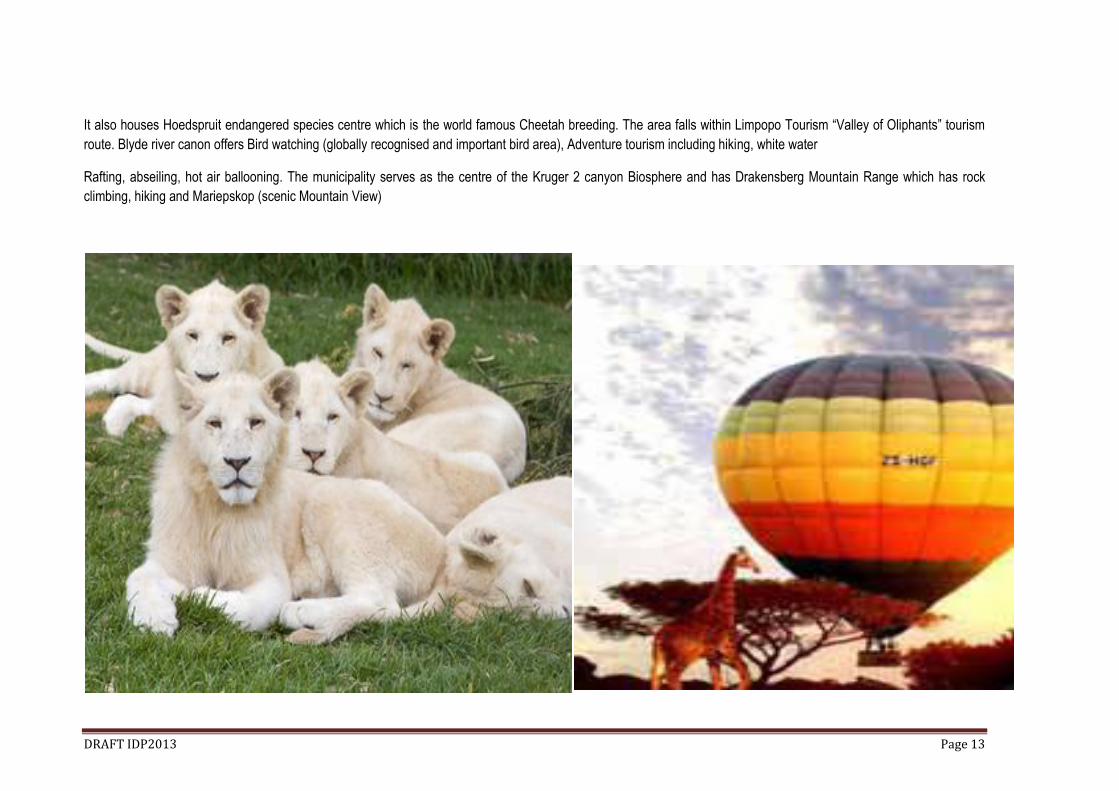
It also houses Hoedspruit endangered species centre which is the world famous Cheetah breeding. The area falls within Limpopo Tourism “Valley of Oliphants” tourism
route. Blyde river canon offers Bird watching (globally recognised and important bird area), Adventure tourism including hiking, white water
Rafting, abseiling, hot air ballooning. The municipality serves as the centre of the Kruger 2 canyon Biosphere and has Drakensberg Mountain Range which has rock
climbing, hiking and Mariepskop (scenic Mountain View)

DRAFT IDP2013 Page 14
Agriculture
Agriculture currently is, and is likely to remain a key economic sector and employment generator in Maruleng. Maruleng dominant economic activity is commercial
agriculture. The region is the leading producer and exporters of mango and one of the largest producers of citrus. Other crops such as vegetables are increasingly
becoming important. Citrus and mango require significant production levels in order to be profitable and there are concerns that these are not viable options for small
emerging farmers unless structured through co-operatives. Potential exists to introduce sugar cane would provide alternatives for smaller emerging farmers.
The types of products grown in the area vary between subsistence and commercial farming, with the latter relying on irrigation to produce variety of crops namely:
Field crops such as maize Produce crops such as citrus, mango, vegetables, tomatoes, avocados and onions.
There are other agricultural activities such as live stock which focuses on cattle, goats and poultry, and game farms and marula.
However the following critical areas must be addressed if the agriculture is to remain competitive;
The speedy and effective resolution of land claims and the introduction of Private sector partnerships to ensure skills transfer and ongoing commercial viability of farms.
Significant investment in transportation infrastructure, notably
Roads and rails as well as the exploring of options to establish and
Airfreight hub in Hoedspruit.

DRAFT IDP2013 Page 15
The more effective branding and marketing of Maruleng produce and Securing of contracts with local and domestic customers such as large food Retail chains.
The development and expansion of agro-processing activities such as juice processing, fruit drying etc.
Infrastructure
The municipality has a fairly good infrastructure
Most services are easily accessible to most of the people.
All the major roads are tarred.
Thusong centre which is in Metz central provides most of the essential services to the rural areas
Information centres in Hoedspruit and The Oaks

DRAFT IDP2013 Page 16
Accommodation places are in good standards and offer excellent services.
Municipal Future Plans
Ensure that all communities have access to clean portable water by 2014
Ensure that all communities have access to electricity by 2014
Ensure that unemployment is halved by 2014
Provide access to housing
Create job opportunities and reduce poverty rate through infrastructure development, service delivery, procurement and support for SMME’s and Broad Based Black Economic Empowerment (BBBEE)
Provide infrastructure that is conducive for economic development and growth
Provide universal waste removal to all communities
Acquire more resources to provide and maintain the existing and proposed infrastructure
Integrated planning and service provision in rural areas
Integrated human settlement in Hoedspruit
Strengthen community participation and IGR
Effectively deal with communicable and non-communicable diseases
Facilitation of economic activities in both urban and rural areas.
Increase revenue base
1.11. Progress Measurement
The Municipal Finance Management Act No.56 of 2003, Section 1 states that the mayor of the municipality should approve a Service Delivery Budget Implementation
Plan (SDBIP) each financial Year. SDBIP should include monthly projections; revenue collected indicating sources, operational and capital expenditure by vote and
indicates delivery targets and performance indicators. The municipality recognizes the fact that a well designed SDBIP will generate a good performance management
system. Therefore the municipality develops and adopts SDBIP on an annual basis. The SDBIP is divided into four quarters and monitoring and evaluation is done on
quarterly basis.
The SDBIP is an operational plan that clearly outlines Key Performance indicators, Objectives, Timeframes, outputs, outcomes and strategies for each program and
projects. The SDBIP is informed by the IDP and Budget.

DRAFT IDP2013 Page 17
Municipal Systems Act No. 32 of 2000, Chapter 6 compels municipalities to establish performance management system that is:
Commensurate with its resources
Best suited to its circumstances
In line with the priorities, objectives, indicators and targets contained in the IDP
The municipality has established the performance management system which monitors, measures and reviews performance on regular basis.

DRAFT IDP2013 Page 18
4. Planning Process
4.1. Background
The integrated development plan (IDP) as a primary outcome of the process of integrated development planning, is a tool for bridging gap between the current reality and
the vision of (1) alleviating poverty and meeting the short-term development needs of the community and stakeholders within the municipality area and (2) eradicating
poverty from our municipality over the long-term in an efficient, effective and sustainable manner.
The constitution of the Republic of South Africa (Act 108 of 1996) is the supreme law of the country and has fundamental aims to protect human rights and promote
democratic governance. The constitution also provides for a new approach to government on national, provincial and local government levels .The constitutional mandate
that the constitution gives to local government, is to:
Provide democratic and accountable government for all communities.
Ensure the provision of services to communities in a sustainable manner.
Promote social and economic development.
Promote a safe and healthy environment.
Encourage the involvement of communities and community organizations in the matters of local government.
The white paper on Local Government expects municipalities to be working with citizens and groups within the community to find sustainable ways to meet their
economic, social and material needs and improve the quality of their lives.
The Municipal Systems Act (MSA 2000) defines the IDP as one of the core functions of a municipality and makes it a legal requirement for every council to adopt a single,
inclusive and strategic plan for the development of its municipality.

DRAFT IDP2013 Page 19
Other laws amongst others that provide guidelines for the development of IDPs include:
The Local Government Translation Act second Amendment Act 1996 (Act 97 of 1996);
The Municipal Demarcation Act,1998 that provides the framework for the on-going demarcation process;
The Municipal Structures Act, 1998 that defines the institutional settings for the municipalities and describe core functions and responsibilities;
The National Environment Management Act 1998;
The Water service Act, 1997 Act;
Regulations passed in terms of the Environment Conservation Act, 1989; and
Municipal Finance Management Act 56 of 2003 that seeks to secure sound and sustainable management of the financial affairs of the municipalities and other institutions of the local sphere of government.
4.2. Framing the 2013/18 IDP
The 2013/18 IDP was prepared within the legal and policy requirements, opportunities provided and challenges posed by the local, provincial and national context.
4.2.1. The National Planning Context.
The Maruleng Local Municipality is aware of the critical challenges facing the country as a whole, as well as the National Strategies Priority Areas to meet those
challenges. The government has identified five priority areas for the next five years:
Creation of decent work and sustainable livelihoods;
Education;
Health;
Rural development, food security and land reform; and
The fight against crime and corruption.
DRAFT IDP2013 Page 20
In order to achieve these objectives the performance and developmental impact of the state will have to vastly be improved. While capacity building, better systems, a
greater focus on implementation, and improved performance management will play a key part in this endeavor, integration, alignment and synergy between the actions of
three spheres government are important.
As decided by Cabinet around aligning the NSDP,PGDS and IDPs, the key to this activity is ensuring that the three spheres of government use the common platform of
(1) “need/poverty” and (2) “developmental potential” as espoused in the NSDP to analyze the space economy of their areas of jurisdiction. In addition to this decision it
requires for the role of the IDPs of the municipalities in determining and structuring public investment and development spending to be drastically strengthened. This
means that municipalities should play a greater role in determining priorities and resources allocation. The IDPs have to become far more decisive on the areas of need
and development.
The National Development Plan focuses amongst others on the following:
The active efforts and participation of all South Africans in their own development
Redressing the injustices of the past effectively
Faster economic growth and higher investment and employment
Rising standards of education, a healthy population and effective social protection
Strengthening the links between economic and social strategies
Collaboration between the private and public sector
4.2.2. The Provincial Planning Context
The primary influencing factor in the provincial domain is the Limpopo Employment Growth and Development Plan (LEGDP). The LEGDP sees the competitive advantage
of the Province in mining, agriculture, tourism and manufacturing. Clustering is viewed as key to success in these sectors. In case of the District, the strategy emphasis
investments in agriculture, forestry, tourism and to a lesser extent, trade.

DRAFT IDP2013 Page 21
In order to give effect to the strategic objectives, as spelled out in the electorate mandate of the ruling party ( the African National Congress) , The provincial Government
of Limpopo has contextualized ten priority areas , as contained in the Medium Term Strategic Framework into key strategic priorities which will guide service delivery for
the next five years.
The key Strategic Priorities of the LEGDP are:
Ensuring more inclusive economic growth, decent work and sustainable livelihoods
Economic and social infrastructure
Rural development, food security and land reform
Access to quality education
Improved health care
Fighting crime and corruption
Cohesive and sustainable communities
Creation of better world and better Africa
Sustainable resource management and use
A developmental state, including improvement of public services
The LEGDP also argues that IDP’s should, in addition to the municipal focus, also consider wider Provincial and National issues. It also mentions that IDPs should strike
a balance between interventions focused on addressing the social needs of citizens and promotion of economic growth. The LEGDP emphasizes on decent work and
sustainable livelihoods as the foundation of the fight against poverty and inequality and its promotion should be the cornerstone of all the efforts.

DRAFT IDP2013 Page 22
4.2.3. The Local Planning Context.
At the local level, a number of fundamental issues impact on the planning processes of the Maruleng municipality. Firstly, the municipality is informed by national.
Provincial and district programmes such as NDP, New Growth Path, NSDP, LEGDP and the District Growth and Development Summit (DGDS).
Secondly, and most important its geographical location and key features such agro-processing and tourism if optimal utilised may see the rapid development.
The 2013/18 Maruleng IDP is a continuation of the drive towards the alleviation of poverty over a short term and eliminating of endemic poverty over the longer period.
This IDP also focuses on the National Development Plan (NDP), Limpopo Employment Growth and Development Plan etc.
At the core of the 2012/17 IDP is the challenge and commitment to(1) deepen local democracy, (2) enhance political and economic leadership, (3) accelerate service
delivery, (4) build a developmental local government, (5) ensure that the municipal planning and implementation are done in an integrated manner within all spheres of
government.

DRAFT IDP2013 Page 23
Powers and Functions
The powers and functions of the Municipality in terms of section 155(6) (a) and (7) Act 108 of 1996 and as delegated by the MEC of Local Government and Housing are
defined as follows:
Building regulations
Billboards and the display of advertisements in public places
Local Tourism
Cleansing
Municipal Planning
Storm water Management
Municipal Parks and Recreation
Municipal Roads
Special Programmes
Disaster Management
Street Lighting
Refuse Removal, Refuse Dumps and Solid Waste
Traffic and Licensing
The division of powers and functions between the district municipalities and local municipalities were adjusted by the MEC for Local Government and Housing in terms of
sections 16 and 85 of the Municipal Structures Act, 1998 and published in the Provincial Gazette No.878, dated 07 March 2003 which gave Local Municipalities the
function of promoting local tourism. In terms of refuse removal the municipality is outsourcing the serves of West Group as the municipality does not have the required
capacity but currently building the required capacity to perform the function in-house. There are very few functions that are not critical in nature which the municipality is
not currently performing due to lack of capacity which is currently building functions such as dog licensing etc.

DRAFT IDP2013 Page 24
4.3. Basis for IDP Review Process
The preparation and review of the IDP is a continuous process providing a framework for all development planning in the municipality. As such the IDP is not only
annually assessed in terms of delivery and the prevailing conditions in the municipality, but also improved upon each and every year. The following aspects informed the
2013/18 IDP Review process:
Updating baseline information to ensure sound decision-making in addressing service delivery gaps;
Meeting the national targets in terms of service provisioning;
Responding to key issues raised in the 2013 State of the Nation and Provincial Addresses focusing on “job creation through massive infrastructure development”.
Aligning Sector Departments’ strategic plans to the municipality service delivery programmes;
Strengthening focused Community and stakeholder participation in the IDP processes;
Meeting targets in terms of the KPAs of the local government strategic agenda;
Responding to the Community priorities for 2012/17as reflected in the matrix on pages
Responding to issues raised during the municipality Assessment (SWOT);
Updating and developing pending sector plans and programmes of the IDP
Revising the vision, mission, objectives, strategies, programmes and projects; and
Alignment of IDP, Budget and PMS activities.
National Key Priority Areas and the National Outcomes

DRAFT IDP2013 Page 25
4.5. MEC Comments
Table 3 indicates the specific interventions that will address the MEC comments on 2011/12 IDP. It must however, be indicated that only few areas need interventions in
terms of the MEC’s Assessment.
MEC COMMENTS INTERVENTIONS
No indication of Municipal Institutional Plan To be developed in the next financial year
No indication of 5year financial Plan To be developed in the next financial year
4.6. Institutional Arrangements to Drive IDP Process
The following table portrays the structures/stakeholders, composition, and their roles and responsibilities in respect of the Integrated Development Planning Process in
the Maruleng Local Municipality.

DRAFT IDP2013 Page 26
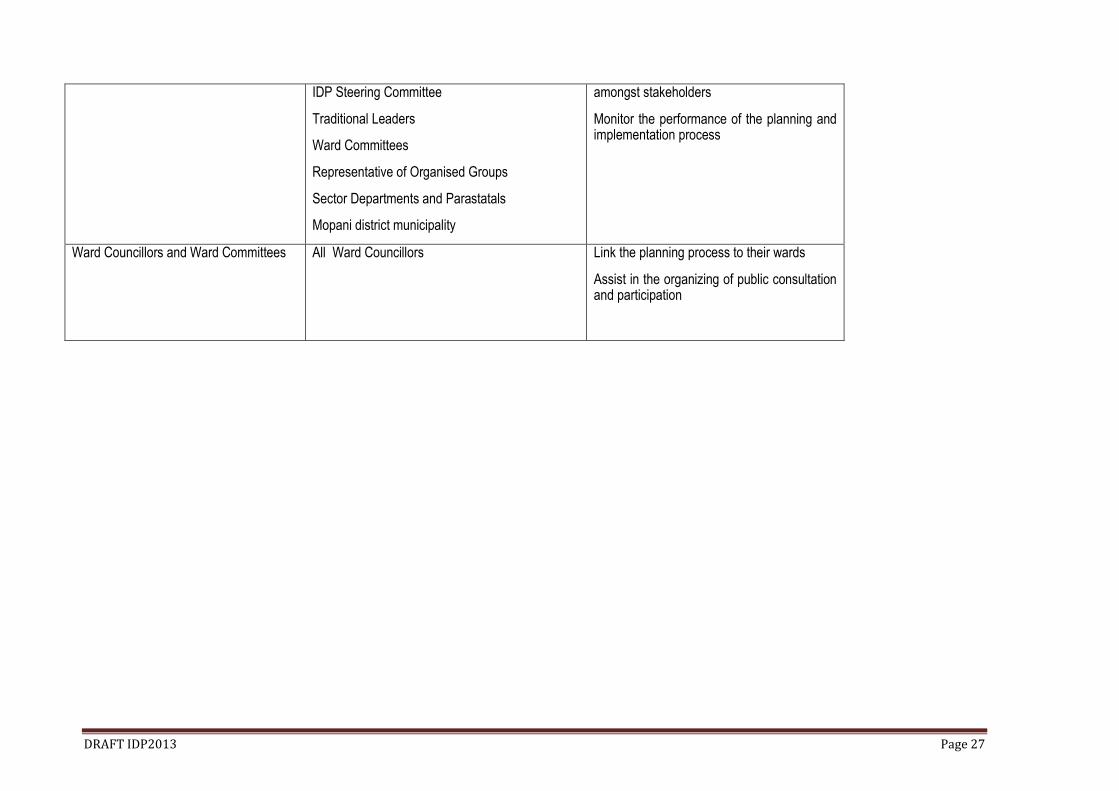
Table1: IDP STRUCTURES, ROLES AND RESPONSIBILITIES
STRUCTURE/STAKEHOLDER COMPOSITION ROLES AND RESPONSIBILITIES
Executive Committee Mayor, Portfolio chairpersons and members of the management Committee
Mayor chairs IDP Forum meetings
EXCO decides on the Process Plan and makes recommendations to Council
Council All Councillors Approves the Process Plan and IDP
Municipal Manager Municipal Manager Oversees the whole process and takes responsibility therefore
IDP/PMS Manager IDP/PMS Manager Managing the IDP Process on a daily basis
Secretariat Provided by the office of the Municipal Manager Record proceedings at IDP meetings
Issue invites for all IDP meetings
Distribute minutes and reports to all stakeholders
IDP Steering(Technical) Committee Municipal Manager
IDP/PMS Manager
Section 57 Managers
Sectional Heads
Communication Officer
Provide technical expertise and support
Ensure that the annual municipal budget and business plans are linked to and based on the IDP
IDP Representative Forum Mayor
Executive Committee Members
Councillors
Represent interest of their constituents in the IDP process
Provide organizational mechanism for discussion, negotiation and decision making
DRAFT IDP2013 Page 27
IDP Steering Committee
Traditional Leaders
Ward Committees
Representative of Organised Groups
Sector Departments and Parastatals
Mopani district municipality
amongst stakeholders
Monitor the performance of the planning and implementation process
Ward Councillors and Ward Committees All Ward Councillors Link the planning process to their wards
Assist in the organizing of public consultation and participation

DRAFT IDP2013 Page 28
4.6.1. Process Overview: Steps and Events
The IDP Process Plan was approved by the Maruleng Municipal Council on 7st August 2012.
The activities that transpired during Maruleng Municipal IDP review are presented in Table 2:
DATE STRUCTURE PURPOSE/ACTIVITY
01 July 2012 IDP Steering Committee Development of the Process Plan
16 July 2012 IDP Representative Forum Presentation of Process Plan
01 August 2012 Council Adoption of the Process Plan
1 October 2012 IDP Steering Committee Preparation of the Analysis Phase
2 October 2012 IDP Representative Forum Presentation of the Analysis Phase
25 October 2012 Council Adoption of the Analysis Phase
14 November 2012 IDP Steering Committee Preparation of the Strategic Planning Session
23rd- 25th November 2012 Councillors, Management, Sectional Heads, Mopani District Municipality, Sector Departments, OTP and Traditional Leaders
Strategic Planning Session
13 March 2013 IDP Steering Committee Consolidation of projects
14 March 2013 IDP Representative Forum Presentation of Project Phase
28 March 2013 Council Adoption of Draft IDP/Budget

DRAFT IDP2013 Page 29
4.7. Public Participation
4.7.1. IDP Representative Forum Meetings
The municipality had 3 IDP Representative Forums. These meetings were well attended by most stakeholders. The attendance by Sector Departments has improved
compared to the previous year. However participation by Private Sector remains a critical challenge.
4.7.2. Community Inputs
The municipality has functional ward committees in all its 14 wards but one and 09 CDW’s which serve as conduits between the municipality and community regarding
municipal business. They are attending all municipal activities as expected. About five Mayoral Public Participation Meetings (community meetings) were held where
communities were given progress reports and continuous seeking mandate.
4.8. Inter-Governmental Relations
Maruleng Local Municipality is responsible for facilitating inter-governmental relations within its area of jurisdiction. The municipality is the convenor of the Manager’s
forum a “key forum for strategic alignment, coordination and integration” that serves as an inter-governmental structure where the Sector Departmental Managers in the
municipality meet with their municipal counterparts. The relationship between the municipality and sector departments has improved. Two successful forums were held to
date. This structure has strengthened inter-governmental relations. The Managers Forum has resolved to establish clusters which will serve as Technical Committees.

DRAFT IDP2013 Page 30
5. Situational Analysis
5.1 Geographic Location and Key Features
Maruleng is a Sepedi word derived from the name of the fruit “marula” which is indigenous in Limpopo. The name means a place of Marula. The Marula tree is indigent to
this area and is used in many ways,for instance marula drink, essential oil, fruit, jam, beer, certain types of nuts and the medicinal bark. The Maruleng municipality is
situated in the South eastern quadrant of the Limpopo province within the Mopani District Municipal Area of jurisdiction. The Maruleng municipality is bordered by the
greater Kruger National Park to the east, the Ba-Phalaborwa and Tzaneen municipalities to the north, the Lepelle Nkumpi municipality to the west, and Tubatse and
Bushbuckridge to the south. Maruleng is characterised by typical lowveld vegetation. To the south municipal area borders the Drankensberg escarpment. Although
resources within the boundaries of the municipal area are scarce, the local of natural resources (in terms of game and nature reserves) within its boundaries as well as on
the perimeter of its boundaries offer many opportunities for development. The main access points to the municipal area are Klaserie and the Strijdom tunnel in the south,
Ofcolaco in the west and Mica in the north. The town of Hoedspruit is the administrative and economic centre of the area. Hoedspruit is 74km south of Ba-Phalaborwa
(R40),135km north-east of Lydenberg and 225 km from Polokwane. It has one major urban area (Hoedspruit) which harbours 2.3% of population and 36 communities
which harbour 88.7% and farms which harbour 9% and a total of 14 wards. Hoedspruit also houses South African Air Force Base. The Maruleng municipal area is
approximately 3247 km2.

DRAFT IDP2013 Page 31
5.2. Demographics Analysis
Maruleng’s population is youthful, with Sepedi being the main language. The following analogy provides an overview of the important demographic indicators of the
Maruleng Municipality. It covers the population size, age distribution, unemployment, income generation, educational levels and services backlogs. The socio-economic
profile of the Municipality provides an indication of poverty levels of and development prospectus
5.2.1 Population Trends
The reconciled total population of Maruleng Municipality is as follows in Table 4 below:
POPULATION
HOUSEHOLDS
Census 2001 Census 2011 Census 2001 2011
94383 94 857 19 668 24 470
% increased 0.49 (474 persons) % increased 24.4% (4 802 households)
Source: (census 2011)

DRAFT IDP2013 Page 32
Population per Ward per Gender
Ward Total Population Male Female
Ward 1 5 622 2 986 2 636
Ward 2 8 255 4 075 4 180
Ward 3 6 861 3 083 3 778
Ward 4 6 298 2 822 3 475
Ward 5 5 927 2 648 3 279
Ward 6 7 235 3 320 3 914
Ward 7 6 184 2 832 3 352
Ward 8 7 669 3 421 4 248
Ward 9 6 366 2 884 3 523
Ward 10 6 648 2 902 3 741
Ward 11 8 792 3 987 4 807
Ward 12 8 259 3 798 4 460
Ward 13 6 083 2 792 3 291
Ward 14 4 659 2 062 2 597
TOTAL 94 857 43 576 51 281
Source: (census 2011)

DRAFT IDP2013 Page 33
Households per Ward
Ward Households Percentage
Ward 1 2 065 8.43
Ward 2 2 396 9.79
Ward 3 1 675 6.84
Ward 4 1 449 5.92
Ward 5 1 579 6.45
Ward 6 1 959 8.00
Ward 7 1 532 6.26
Ward 8 1 841 7.52
Ward 9 1 652 6.75
Ward 10 1 649 9.08
Ward 11 2 223 9.08
Ward 12 2 014 8.23
Ward 13 1 420 5.80
Ward 14 1 016 4.17
TOTAL 24470 100%

DRAFT IDP2013 Page 34
5.3. Age and Gender Distribution
The population distribution by age categories and gender of the Municipality is presented in figure 2 and table 1, it is clear that the percentage of females increase along
with age, implying that women live longer in the age group 0-4 years the percentage of males and females are fairly even, compared to the age group 35-65 and older
where female constitute 54 % of the population.
FIGURE 1 : ESTIMATED POPULATION BY AGE AND GENDER (2001)
0
5000
10000
15000
20000
0 – 4 5 – 14 15 – 34 35 - 64 Over 65
MALE
FEMALE

DRAFT IDP2013 Page 35
Table 5: ESTIMATED POPULATION BY AGE AND GENDER
0 – 4 5 – 14 15 – 34 35 – 54 55-65 Over 65 Total
No % ** No % No % No % No % No
MALE 6 039 10 446 16 525 6 864 2 189 1 513 43 576
FEMALE 5 997 10 107 18 528 10 502 2 972 3 175 51 281
TOTAL 12036 12.6 20553 21.6 35053 36.9 17366 18.3 5161 5.4 4688 (4.9) 94 857
Source: STASSA 2011

DRAFT IDP2013 Page 36
5.4. Employment Profile
Table 6: depicts employment status
Economic Active Employed Unemployed Discouraged work- seekers
26 798 13 498 8 945 4 357
Census 20011
Employment rate is 50,3 % of the economic active population
While unemployment is at 33.3% of the economic active population
Discouraged work-seekers represents 16.2% of the economic active population
5.5. Household income
About 3700 households (15%) in the municipality fall within the category earning below R1500.00 per month and about 32 871 people live on grants.

DRAFT IDP2013 Page 37
Table 7: Individual Monthly income
INCOME CATEGORY Persons
NO INCOME 42,564
R 1 - R 400 26,034
R 4 01 - R 800 2,578
R 801 - R 1600 12,489
R 1601- R 3200 1, 261
R 3201 - R 6400 1,374
R 6 401 - R 12 800 1,625
R 12 801 - R 25 600 1,085
R 25601-R 51 600 288
R 51601-R 102 400 54
R 1 02401 - R 204 800 57
R 204800 or more 38
Unspecified 3,031
Not applicable 1,398
Census 2011

DRAFT IDP2013 Page 38
5.8. Level of Education
About 11.6 % of the population lacks any kind of schooling. About 36.8% of the population has some form of education. 9.06 % of the adult population has higher
education according to the 2011 Census which is about 4 % improvement from Census 2001.1380 females have higher education compared to their male counterparts of
only 1057.
Level Number Male Female
No schooling 11 011 3 830 7 181
Grade 0 3 872 1 933 1 939
Grade 1 (sub A) 3 177 1 618 1 559
Grade 7 (Std 5) 4 279 2 186 2 093
Grade 8 (Std 6 ) 5 867 3 035 2 832
Grade 10 (Std 8) 7 841 4 379 3 462
Grade 12 (Std 10) 9 811 3 996 5 815
Diploma with Grade 12 805 343 462
Higher Diploma 708 307 401
Bachelors Degree 405 190 215
Bachelors Degree and Post Graduate Diploma 176 72 104
Honours 211 76 135
Masters and PhD Degrees 132 69 63

DRAFT IDP2013 Page 39
5.7. People with disabilities in the municipality
There are 3340 people with disability in the municipality. The major challenge facing people with disabilities ranges from lack of skills, lack of employment opportunities as
well as assistance devices like wheelchairs, walking sticks, hearing aids etc.
Table 9: below depicts disability by gender
Type of disability Male Female
Sight 295 116
Hearing 320 57
Communication 331 124
Physical 606 465
Intellectual 0 57
Emotional 463 347
Multiple 102 57
Total 2117 1223
(Census 2011)

DRAFT IDP2013 Page 40
5.8 Spatial Rationale
5.8.1. Purpose of spatial analysis
The spatial analysis exercise provides a visual picture of the existing spatial pattern (that nodes, networks and areas) that has emerged in the municipal area. This
analysis serves to describe the municipal area in spatial terms and understand how space is utilized in the municipality. It also looks at settlement patterns and growth
points (nodes), population concentration areas, land claims and their socio-economic implications. All these aspects have a bearing on future land usage, infrastructure
investment, establishment of sustainable human settlements, public transport and local economic development
5.8.2. Settlement patterns.
The Maruleng population is concentrated in 33 rural communities. Maruleng’s spatial economic development pattern is deeply marked by legacy of Apartheid with the
majority of black population confined to dense rural settlements with limited economic activity and access to urban infrastructure. The Western quadrant comprises mainly
dense residential areas which 90% of Maruleng’s population resides and little economic development and major infrastructure and service backlog. The Northern
quadrant is dominated by game reserves.
Limited mining in Mica and Hoedspruit at the Southern edge is the administrative and commercial centre of the region. While the Southern quadrant is mainly a tourism
activities centered on the Blyde Canyon and, the Eastern quadrant is mostly game reserves and private lodges with few mainly white residence.
Map 1; municipal area
Map 2; Mopani District Area

DRAFT IDP2013 Page 41
5.8.3. Spatial Challenges
Scattered settlements thus become too cost to provide services
Hoedspruit which is the economic hub is located far away from the villages and it is easily accessible by the poor.
The apartheid residential is still very much evident with sprawling rural villages situated in traditional authority areas located far away from employment
opportunities, thus become too costly for people to travel to their working places.
5.8.9 Access to land.
Large areas of land in Hoedspruit is privately owned and not easily accessible for development..
State- owned land is mostly under the custodianship of Traditional Authorities. Large percentage of land is held under leasehold title and Permission to Occupy.
Because of this, land ownership is regarded as insecure, which in turn acts as a hurdle to land development
Land in state ownership includes Hoedspruit Air Force Base which owns considerable hectares of land which cannot be utilised for development because of
state security considerations.
5.8.10 Opportunities
Maruleng is characterized by clearly identifiable land use areas, including: extensive agriculture areas, predominated by the growing of citrus fruit; game reserves and
nature reserves, including game lodges; sprawling rural residential villages along the foothills of the Drakensberg escarpment; extensive areas in the form of wildlife
estates, centred on Hoedspruit; the Hoedspruit Air Force Base and East Gate Airport, which shares runways; rural residential development at Kampersrus; and, low-
intensity mining at Mica.
5.8.11 Settlement Hierarchy
Settlement hierarchy of the municipality is usually based on the classification of individual settlement as depicted below in table 3.

DRAFT IDP2013 Page 42
TYPE Characteristics AREAS
FIRST ORDER
Provincial growth point
Centre of the tourism industry in the
municipality
Well developed with existing infrastructure
Potential for futher growth
HOEDSPRUIT
SECOND ORDER
Municipal growth point
Strategically located (surrounded by many villages)
Existing infrastructure
Potential for further development
METZ CENTRAL
THIRD ORDER
Population concentration areas
- The Oaks-Metz-Trichardsdal development
corridor – establishment of a municipal
development corridor linking the rural villages
Limited mining in Mica
THE OAKS
KAMPERSRUS
MICA
BLYDE
FOURTH ORDER
Little economic activities
Huge infrastructure backlog
But situated along the foothills of Drakensberg
Environmental area which has potential for
economic growth
ALL OTHER VILLAGES

DRAFT IDP2013 Page 43
Maruleng Spatial Pattern - Settlements

DRAFT IDP2013 Page 44
5.8.12 Strategically located land
Private owned- land in Hoedspruit - Intensification and expansion of the provincial growth node which includes the provision of land for affordable housing for people employed at Hoedspruit, but who currently cannot find suitable residential accommodation in the town.
Communal land- The Oaks-Metz-Trichardsdal development corridor – establishment of a municipal development corridor linking the rural villages
Communal land- Metz Central- development of a municipal growth node
Extensive land areas devoted to agriculture ,which include agricultural processing facilities, and, areas devoted to game reserves
K2C Biosphere- establishment of the Drakensberg Environmental Zone
5.8.13 Land Use and Land Claims
Approximately 18.5% of the total land area is subject to 5 registered land claims. Considerable land area held in ownership by the state under custodianship of traditional
Authorities which accommodates some 90% of the residents of the municipal area. Large areas of land in private ownership are utilized mainly for
Conservation/Tourism/game farming and commercial hunting. The situation exerts considerable existing and potential influence on future land use and management.
Land restitution and redistribution processes may results in many people access to land, resulting in improved living standards and quality of life. However it could result
in large-scale sterilization of economically productive land and consequential loss of job opportunities, if not well planned and managed within the context of a spatial
development framework. About five land claims were settled. One of which is Moletele CPA which entered in to a Private-Public-Partnership. This PPP is working so well
and the municipality will use this PPP as a bench mark of further land settlements. The tables below give the status of land claims and claims settled respectively:
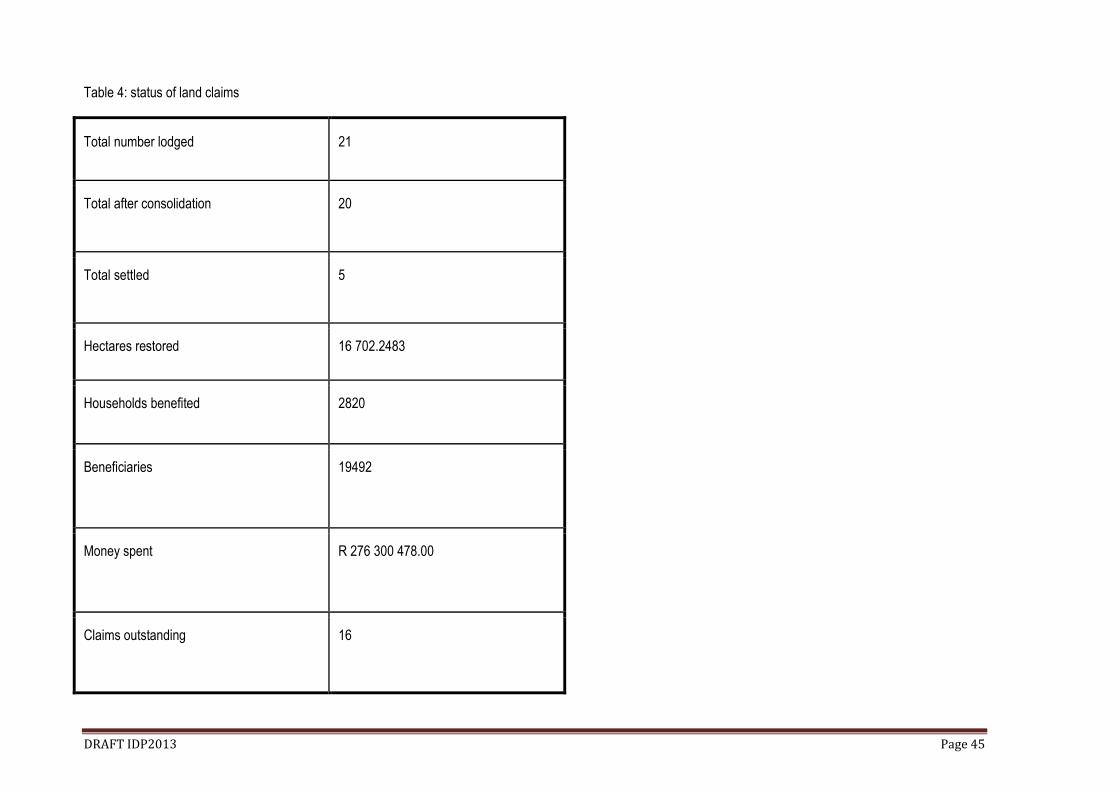
DRAFT IDP2013 Page 45
Table 4: status of land claims
Total number lodged 21
Total after consolidation 20
Total settled 5
Hectares restored 16 702.2483
Households benefited 2820
Beneficiaries 19492
Money spent R 276 300 478.00
Claims outstanding 16

DRAFT IDP2013 Page 46
Table 5: claims settled
REF/KPA NO. CLAIMANT
4028 Moletele Community
2098 Sekororo
5346 Mpuru Letebele
836 Mokgwanatjane N.M (consolidated to Sekororo claim)
1453 Baropodi Ba Moraba
DRAFT IDP2013 Page 47
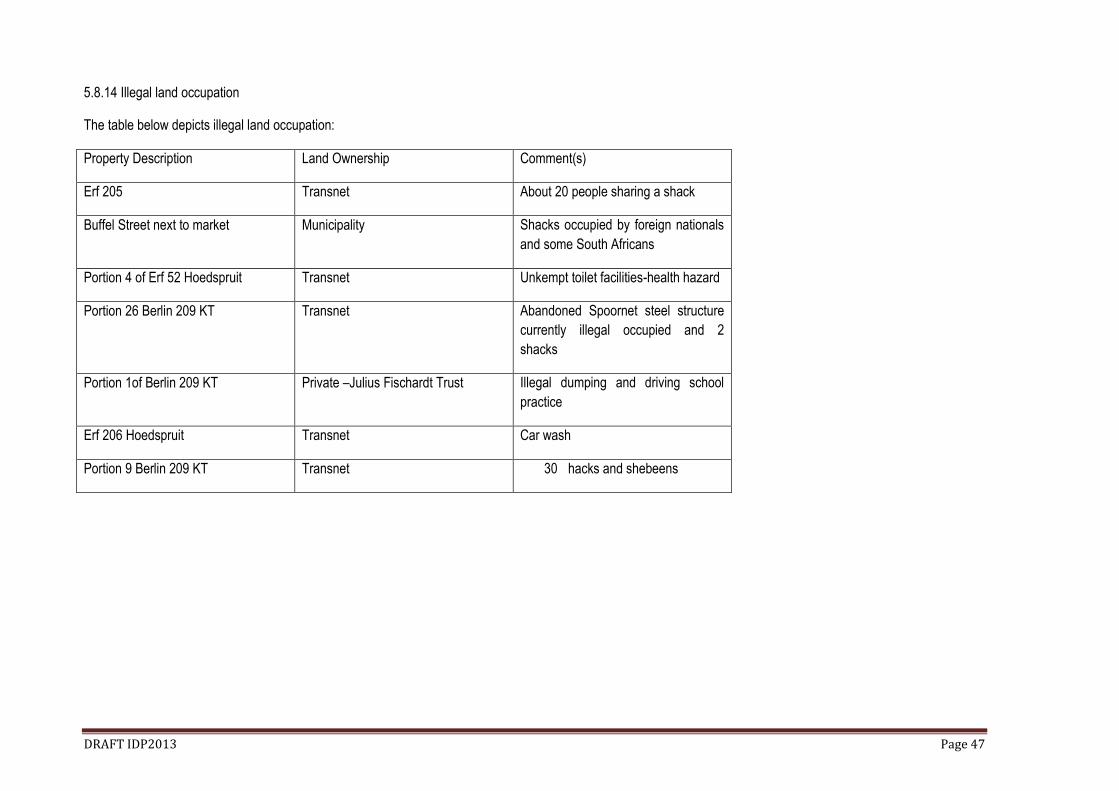
5.8.14 Illegal land occupation
The table below depicts illegal land occupation:
Property Description Land Ownership Comment(s)
Erf 205 Transnet About 20 people sharing a shack
Buffel Street next to market Municipality Shacks occupied by foreign nationals
and some South Africans
Portion 4 of Erf 52 Hoedspruit Transnet Unkempt toilet facilities-health hazard
Portion 26 Berlin 209 KT Transnet Abandoned Spoornet steel structure
currently illegal occupied and 2
shacks
Portion 1of Berlin 209 KT Private –Julius Fischardt Trust Illegal dumping and driving school
practice
Erf 206 Hoedspruit Transnet Car wash
Portion 9 Berlin 209 KT Transnet 30 hacks and shebeens

DRAFT IDP2013 Page 48
STRENGTH WEAKNESSES
LUMS SDF
Scattered settlement Illegal land occupation
OPPORTUNITIES THREATS
Identifiable land use areas State-owned land K2C Biosphere Growth points
Unavailable land of development in Hoedspruit

DRAFT IDP2013 Page 49
5.8. 15. ENVIRONMENTAL Analysis
BACKGROUND
The Maruleng Municipal Area is faced with environmental risks and trends that lead to environmental degradation. In order to ensure that developments carried out by the
municipality are sustainable, the IDP takes in consideration environmental and socio-economic issues in decision making, project planning and implementation. A
summary of an environmental analysis is here outlined and it will provide the basis for identification of priority environmental challenges facing the municipality.
5.8.15.1. Climate
Most of the rain in the municipal area is received during summer (75%). The temperature ranges from a high average of 21 degrees Celsius to a very high average of 25
degrees Celsius.
5.8.15.2 Global Warming
Global warming is defined as the increase in the average temperature on earth. As the earth gets hotter, disasters like hurricanes, floods, droughts and raging forest fires
do get more frequent. The municipality experienced heavy flooding during 2011/12 financial year. Global warming is caused by climate change that results in rise of
temperatures.
5.8.15.3 Air Pollution.
Pollution of the air is a major environmental problem. Vehicles, mines and industries pollute the air by releasing harmful gases. Another source of air pollution is leakage
of sewage and companies burning their waste, causing bad odour.
5.8.15.4. Water pollution.
Water pollution in the municipal area affects most people as many of them stay in rural areas and depend on river water. The major cause of water pollution is the
sewage leakage and release of industrial waste into streams as well as illegal solid waste dumping along the river system. People washing their clothes in rivers using
detergents also cause water pollution as well as usage of herbicides and pesticides by farmers. The lack of water-borne sewerage systems leads to the contamination of
ground water. The municipality has lost five lives due to cholera as a result of contaminated water.

DRAFT IDP2013 Page 50
5.8.15.5 Deforestation.
Deforestation is one of the identified major environmental problems affecting most areas in the municipality. This is a problem affecting almost every forest or veld in the
municipality. This problem is caused by the wood carvers, fire wood collectors, farmers and villagers residing around deforested areas. This can be attributed to poverty,
lack of knowledge, unemployment, unclear land policy, traditional practices and economic gains.
5.8.15.6. Veld fires
The municipal area often experience uncontrolled veld fires. These fires have a negative environmental and economic impact. The veld fires are also a threat to human
and animal life. The major cause of this problem is poaching, fire wood collector, uncontrolled burning for green bite, lack of knowledge about veld fire destruction,
lightning and negligence.
5.8.15.7. Soil erosion
Soil erosion has a negative effect on the environment as it affects the larger part of the municipal area. This affects people residing in eroded areas, by worsening floods
and decreasing agricultural production. The major causes of this condition are deforestation, overgrazing and poor land use management.
5.8.15.8 Chemical spills and hazardous accidents
There are numerous areas in the municipality that are subject to chemical spills and hazardous accidents that have a detrimental impact on the lives of people. This
occurs mainly in the railway lines and along major routes, polluting the air and ground.
5.8.15.9 Overgrazing
Overgrazing on agricultural land around villagers in the municipality is a common phenomenon. The major cause of this condition is overstocking by farmers as well as
drought and floods.
5.8.15.10 Heritage Sites
There are number of heritage sites in the municipality such as Lekgalametse which is government owned and privately owned Klaseri, Thornybush and Timbavati. There
is also natural heritage in the Westfalia Estates.
5.8.15.11 Natural Water Bodies/Wetlands
A wetland was identified in Makgaung area and if properly-managed, could be of economic importance to the local community

DRAFT IDP2013 Page 51
5.9. BASIC SERVICES AND INFRASTRUCTURE DEVELOPMENT
5.9.1. Background.
The success of local economic development is tied to the provision of basic and other types of infrastructure to the people. All services under analysis in this section are
located in a specific locality (as per SDF) and have potential to boast socio-economic development. Infrastructure analysis focuses on the status quo regarding water
supply, sanitation facilities, energy and housing provision, roads and public transport, waste management and telecommunications – all of which underpins socio-
economic development and determines people’s quality of life. The provision of adequate municipal infrastructure remains a challenge throughout the municipality.
5.9.2. Water
The Maruleng municipality is characterized by low rainfall. This results in limited water resources culminating in severe water shortages and drought condition. There is
stiff competition amongst different water users. Water for domestic purpose becomes crucial.
However, great strides have been made in providing water in the municipality. About 16721 households which amount to 68% of the population have access to water in
terms of RDP standard. However, it must be noted that only 2.3% of the population have access to portable water.
Table 10: depicts access of water in terms of distance
TYPE NUMBER OF HOUSEHOLDS
Piped (tap) water inside dwelling 2 669
Piped (tap) water inside yard 9006
Piped (tap) water on communal stand: distance less than 200m from dwelling 4 987
Piped (tap) water on communal stand: distance between 200m and 500m from dwelling 2 088
Piped (tap) water on communal stand :between 500m and 1000m (1km) from dwelling 1 067
Piped (tap) water on communal stand: distance greater than 1km from dwelling 285
No access to piped (tap) water 4368
(Source: census 2011)
DRAFT IDP2013 Page 52
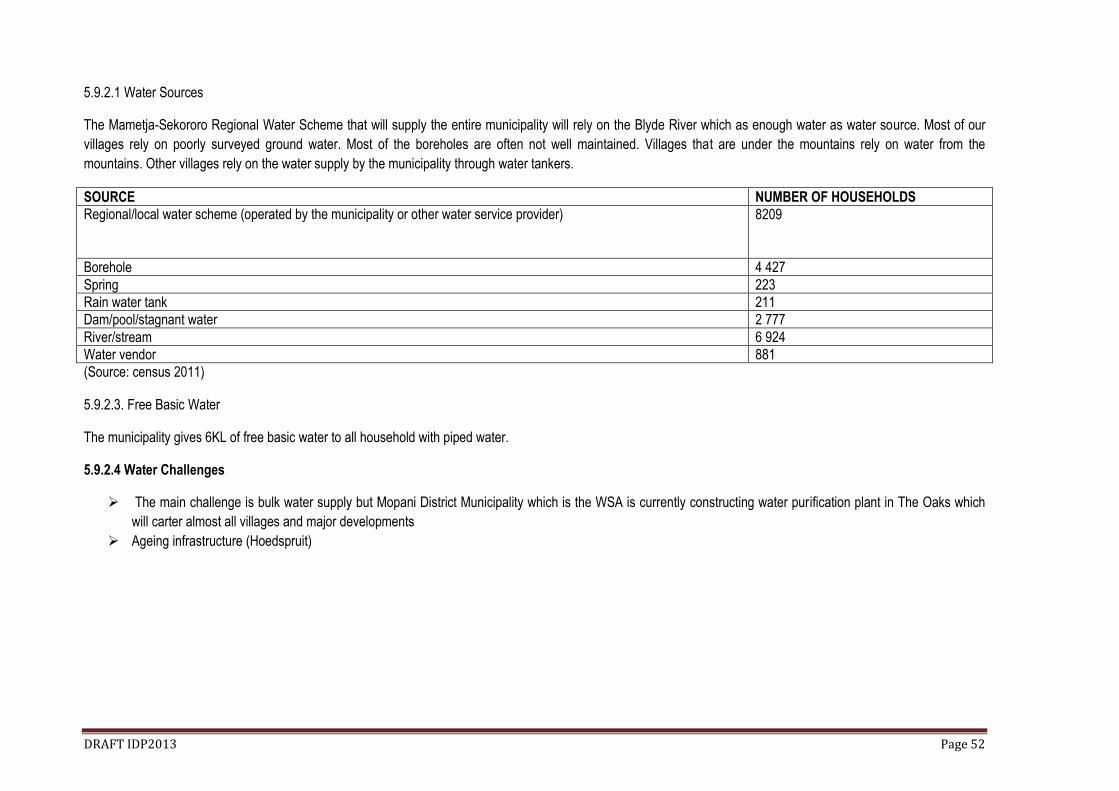
5.9.2.1 Water Sources
The Mametja-Sekororo Regional Water Scheme that will supply the entire municipality will rely on the Blyde River which as enough water as water source. Most of our
villages rely on poorly surveyed ground water. Most of the boreholes are often not well maintained. Villages that are under the mountains rely on water from the
mountains. Other villages rely on the water supply by the municipality through water tankers.
SOURCE NUMBER OF HOUSEHOLDS
Regional/local water scheme (operated by the municipality or other water service provider)
8209
Borehole 4 427
Spring 223
Rain water tank 211
Dam/pool/stagnant water 2 777
River/stream 6 924
Water vendor 881
(Source: census 2011)
5.9.2.3. Free Basic Water
The municipality gives 6KL of free basic water to all household with piped water.
5.9.2.4 Water Challenges
The main challenge is bulk water supply but Mopani District Municipality which is the WSA is currently constructing water purification plant in The Oaks which
will carter almost all villages and major developments
Ageing infrastructure (Hoedspruit)

DRAFT IDP2013 Page 53
5.9.3 Sanitation
The municipality through Mopani District Municipality has reached the millennium target of 100% regarding provisioning of this basic service to our communities. About 24
589 households which account to 100% of the population have access to basic sanitation. However, the challenge will be on the households that will emerge because
sanitation like other basic services is a moving target.
Table 11: depicts percentage distribution of households by type of toilet facility as of 2011.
Type of toilet facility Census 2001 Census 2011
Flush toilet(sewerage system) 8.8 2001
Flush toilet (septic tank) 2.9 1088
Chemical toilet 1.1 102
Pit latrine with ventilation 8.3 7 335
Pit latrine without ventilation 40.8 12 240
None 38,2 1 487
Total 100 100
Census 2011

DRAFT IDP2013 Page 54
5.9.4. Energy and Electricity.
Energy distribution has important economic developmental implications with a potential to make considerable impact. This impact relates to improved living conditions,
increased productivity and greater sustainability of the environment. In the municipality electricity is largely generated by Eskom. The provision of electricity to house has
been achieved to the larger extent. About 22166 households have access to electricity which amount to 90.58% of the population. All villages are electrified except post
connections and new extensions. The backlog is about 2340 households. However, ESKOM is currently completing 511 units and the municipality is electrifying 400 units
through INEP grant.
Table 12: depicts: Electricity Usage
Usage No. Households
Cooking 7 299
Heating 6 431
Lighting 22 166
(Census 2011)
In the mean electricity is used for lighting. About 16 575 (67.7%) households use wood for cooking. The usage of wood as a source of energy is a worrying factor as it is
harmful to the environment. The Municipality and the Department of Environmental Affairs need to conduct educational awareness campaigns against this practice.
DRAFT IDP2013 Page 55
5.9.4.1 Free Basic Electricity
The municipality has budget R 630, 000for the provision of FBE to its 3700 indigent households. Only 1739 indigent households have access to free basic electricity due
to the snail-pace of ESKOM in configuration of the register. However, the municipality is currently the indigent register
5.9.4.2. Indigent Register
The municipality has an adopted indigent policy and register. This register facilitates the provision of free basic services. The municipality has budgeted R630, 000 for
free basic services for the year 2013/14. The updated indigent register has about 3700 households as beneficiaries.

DRAFT IDP2013 Page 56
5.9.5. Waste Management
5.9.5.1. Refuse removal.
The municipality provides waste collection services in three urbanized areas: Hoedspruit, Kampersrus for a total of 1666 households and it accounts to about 6.8% of
households. In both commercial and residential areas collection takes place once a week. No refuse removal is provided to the 33 villages. These households rely mostly
on backyard dumping and burning. Maruleng has outsourced collection and transportation. The municipality is planning to roll-out waste collections to all villages.
5.9.5.2 Waste disposal.
The municipality has one licensed land fill in Worcester area.
Table 15: depicts percentage distribution of households by type of refuse disposal
Type of refuse removal Census 2001 Census 2011
Removed by local municipality/private company at least once a week - 1 434
Removed by local municipality/private company less often - 232
Communal refuse dump 275 250
Own refuse dump 14 692 19 410
No rubbish disposal 3 678 2 828
Other - 315
Total 19 668 24 470
Census 2011
DRAFT IDP2013 Page 57
5.9. Transport Infrastructure
5.9.1. Road Network
Transportation and transportation infrastructure make a major contribution to the facilitation of economic activity. A major stride has being made in improving the condition
of the roads in the municipality. The municipality has a total of 563.2km road network.321.79km road tarred which constituents 51.13% of the total road network. But
maintenance remains a major challenge. The following strategic roads are tarred:
The R527, from Strijdom tunnel to Hoedspruit
The R40, linking Hoedspruit with Mica and Tzaneen to the North-West
Southwards from Hoedspruit, the R40 leads to Klaserie and onwards to Nelspruit
The R531, which runs along the Drakensberg foothills, linking the R527 with Kampersrus and Klaserie
North of Mica the R530 links Hoedspruit with the town of Phalaborwa
The link road between Mica and R36, running south-westward from Mica
The R36, which leads northwards from the R527 towards Tzaneen and it is currently being rehabilitated
Development Corridor
An important road upgrading project is The Oaks- Trichardsdal road linking the rural villages with Tzaneen and Hoedspruit. This road leads from R36 in the south, in
a northern-westerly direction linking Trichardsdal, Sekororo, and The Oaks to Ofcaloco in the north. This road has greatly improved movement between the villages,
as well as providing access to the main road network and Hoedspruit.
DRAFT IDP2013 Page 58
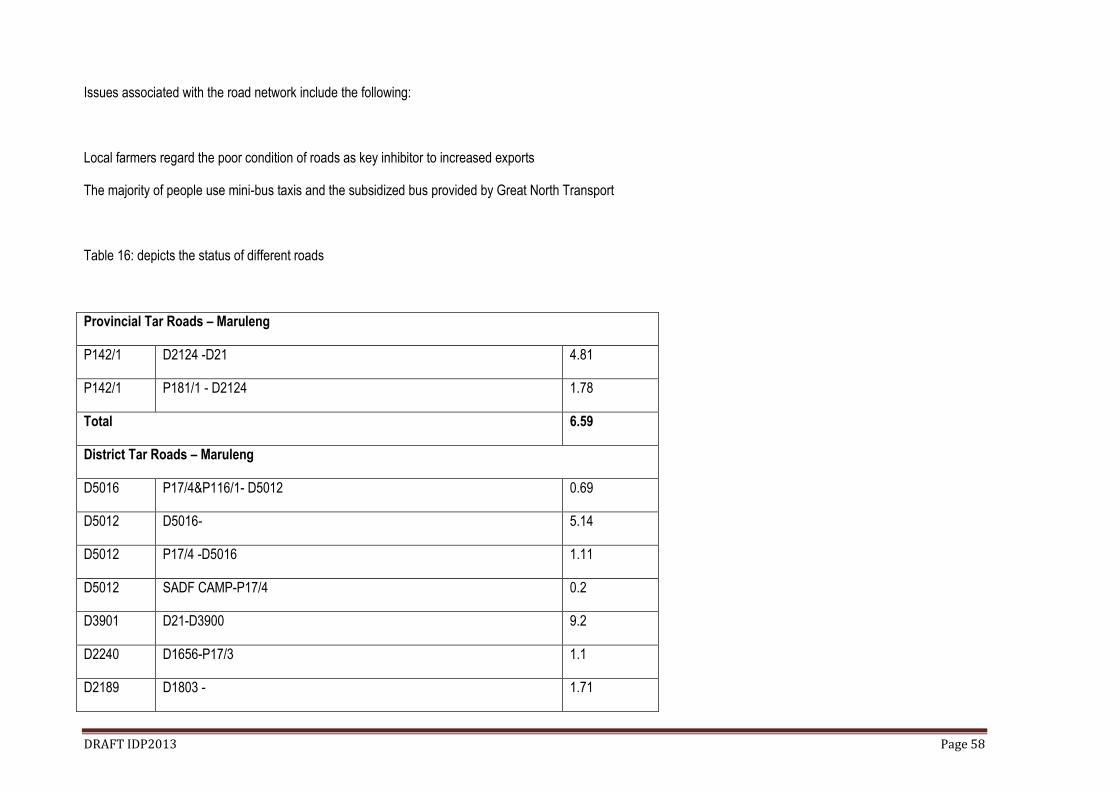
Issues associated with the road network include the following:
Local farmers regard the poor condition of roads as key inhibitor to increased exports
The majority of people use mini-bus taxis and the subsidized bus provided by Great North Transport
Table 16: depicts the status of different roads
Provincial Tar Roads – Maruleng
P142/1 D2124 -D21 4.81
P142/1 P181/1 - D2124 1.78
Total 6.59
District Tar Roads – Maruleng
D5016 P17/4&P116/1- D5012 0.69
D5012 D5016- 5.14
D5012 P17/4 -D5016 1.11
D5012 SADF CAMP-P17/4 0.2
D3901 D21-D3900 9.2
D2240 D1656-P17/3 1.1
D2189 D1803 - 1.71

DRAFT IDP2013 Page 59
D2189 P146/1-D1803 5.67
D2119 D1909- 0.1
D2119 P194/1- 9.91
D1803 P116/1 - D2189 12.87
D1185 P146/1-P116/1 4.35
Total 52.05
District Gravel Roads – Maruleng
D70 P146/1 -D3934 7.81
D4164 D21- MOSIBUDI HIGH SCHOOL 2.4
D3914 D21 -D3912 2.49
D3913 D21 -D21 5.1
D3912 D3004 - 1.09
D3912 D3004 -D3004 0.71
D3912 D3914 -D3004 7.04
D3912 D21 - D3914 1.63
D3911 D21 - 5.38
D3909 D3908 -D3009 0.33
D3908 D21 - 1.51

DRAFT IDP2013 Page 60
D3908 D3909 -D21 8.25
D3908 D3009 - D3909 1.37
D3906 D21 -D21 4.96
D3905 D3900 -D3900 2.49
D3904 D3900 -D3900 2.48
D3903 D21 - D3902 1.93
D3902 D21 -D3903 4.5
D3900 D3901 -P181/1 3
D3900 D3905-D3901 4.48
D3900 D3905-D3905 0.87
D3900 D3904-D3904 0.09
D3900 D3904-D3904 1.25
D3900 D21-D3904 1.8
D3899 D21 - 3.82
D3898 D3878 -D21&D3003 3.6
D3887 P81- 11.25
D3009 D3909 -D21 4.81
D3009 D3908 -D3009 1.31

DRAFT IDP2013 Page 61
D3009 P181/1 -D3908 4.19
D3004 D3912-D3912 3.34
D3003 D21-D21 4.97
D240 P116/1- 8.36
D2259 D1909- 3.9
D2119 27.57
D202 D1828-P81/1 14.53
D202 D21-D3878 3.62
D1771 P194/1 14.61
D2124 P142/1 -D21 5.86
Total 188.7

DRAFT IDP2013 Page 62
5.9.2. Public Transport
5.9.2.1. Taxi Facilities
Within the municipality, there are four major taxi facilities:
1. Metz taxi rank
The rank is formal and is situated at Metz village. It has the following facilities: shelter, loading bays, ablution block which needs water, no seating facilities, paved
and has dustbins. Telephone facilities are at the nearby shop. The rank covers the following main destinations: Tzaneen, Phalaborwa and Johannesburg.
2. The Oaks taxi rank
The rank is situated at The Oaks. It has the following facilities: paved surface, shelter, information boards, ablution block, telephone facilities, no dust bins and
seating facilities. The rank covers the following destinations: Tzaneen, Phalaborwa, Hoedspruit and Johannesburg.
3. Masokisi
This is a formal rank situated at GaSekororo. It has the following facilities: information boards, shelter, loading bays, lights, ablution block which needs proper
maintenance, no seating facilities, paved and has dustbins. The rank covers the following destinations: Tzaneen, Phalaborwa, Hoedspruit and Johannesburg.

DRAFT IDP2013 Page 63
4. Hoedspruit taxi rank (informal)
Hoedspruit has two informal minibus taxi ranks without any shelter. The routes are Phalaborwa, The Oaks and Acornhoek.
5.9.2.2. Air Links
A regional airport, East Gate Airport, is located outside Hoedspruit. This civilian airport is situated at the southern end of the Air Force Base Hoedspruit, with which it
shares airport infrastructure. The airport serves mainly international tourist market, with connecting flights from and to O.R. Tambo International Airport and some
airstrips.
5.9.2.3 Railway links
Hoedspruit is linked by rail with Nelspruit in the south, Tzaneen in the north-west and Phalaborwa in the north-east. The main function of the rail network is transportation
of goods.
5.9.2.4. Public Transport Challenges
In-fighting amongst taxi associations for routes
No integrated transport system

DRAFT IDP2013 Page 64
5.9.2.5 Backlog on Storm Water
The municipality has a backlog of about 10 roads that need storm water drainage. In the current financial only the following roads will be addressed regarding storm water
drainage:
Ga-Fanie-Turkey road (fully) Metz-Bismarck road (fully) Mahlomeling road (fully) Madeira internal road (fully) Rakgolokoane- Enable road (fully)

DRAFT IDP2013 Page 65
Comparative report on basic servicesAverage Access : 71.03%
82.14%
93.90%90.58%
6.80%
57.10%
95.60%
0
0.2
0.4
0.6
0.8
1
1.2
Water Sanitation Electricity Refuse removal Roads Housing

DRAFT IDP2013 Page 66
FREE BASIC SERVICES
SERVICE NO. INDIGENT HOUSEHOLDS ACCESS BACKLOG
Water 3700 2 405 1 295
Sanitation 3700 3 213 1 487
Electricity 3700 1 739 1 961
Refuse Removal 3700 0 3 700
STRENGTH WEAKNESSES
MIG Allocation Strategic roads tarred Most households have access to basic sanitation
No bulk water supply Ageing infrastructure (water & sanitation) Poor road maintenance Usage of wood as a source of energy No refuse removal in rural areas Few indigent households have access to basic services
OPPORTUNITIES THREATS
Water source East Gate Airport Rail transportation
Drought In-fighting amongst taxi association

DRAFT IDP2013 Page 67
5.10. Social Analysis
5.10.1. Background
The historic imbalances in South African society resulted in the majority of our people living without land and housing, access to safe water and sanitation for all,
affordable and sustainable energy sources, illiteracy, poor quality education and training, poor and inaccessible health services. Here is the socio-analytic reflection of
MLM.
5.10.2. Housing
Housing is the mandate of COGHSTA and the municipality plays a facilitation role between the community and the department. About 23 416 (95.69 %) of all households
are residing in a formal dwelling and 4.6% households reside in either informal or traditional dwelling. The housing backlog is estimated at 1050. Table 18: below depicts
the type of dwelling.
Type of dwelling Census 2001 Census 2011
House or brick on a separate stand or yard on a farm 75.4 23 125
Traditional dwelling/hut/structure made of traditional materials 15.8 637
Flat or apartment in blocks or flats 2.3 142
Cluster house in complex 0.4 21
Townhouse (semi-detached house in a complex) 1.6 24
Semi-detached house 1.5 18
House/flat/room in backyard 1.5 86
Informal dwelling/shack in back yard 1.5 138
Informal dwelling (shack not in a backyard; e.g in an informal/squatter or on a farm) 1.2 84
Room/flatlet on a property or larger dwelling/servants quarters/granny flat 0.3 73
Caravan or tent - 26
Total 100 100
Census 2011
DRAFT IDP2013 Page 68
Housing Backlog
According to municipal information the current housing backlog exists mainly in the rural villages and is estimated at 1050 households. The municipality has a Housing
Chapter that outlines how the backlog will be eradicated.
5.10.3 Challenges
None availability of land in Hoedspruit (economic hub) to build low costing housing as an attempt to build integrated human settlement.
5.10.4 Informal settlement.
Informal settlement has major negative effect to the environment in that through its practice the vegetation is destroyed when buildings are built. The major causes of
informal settlements are poverty, unemployment, population growth and urbanization.
The municipality has two informal settlements with 590 dwellings accommodating 3540 households.
5.11. Health and Social Development.
The challenge of the health sector in South Africa is to develop a unified national health system capable of delivering quality health care to all citizens efficiently and a
caring environment. Overall health care expenditure and access to health care in the municipality remain poor.
Maruleng municipality has approximately 75% of communities situated within a 20km radius and 70.83% of the communities situated within a 5km radius of a clinic.
At the moment there is 1 Hospital at Sekororo and 10 clinics at various villages. Welfare policies and programmes form an important part of government’s anti poverty
strategy, with most of the budget being allocated to provinces. About 7592 people receive social grants. There is still limited knowledge of, and access to these grants,
especially in rural areas. One more critical challenge is recorded in Foster Care grants whereby a delay is witnessed when social worker take unreasonable time to
assess the families.
To this end, a sizeable number of poor households are currently not receiving any form of social assistance and the child support grant has failed to respond to the
deepening problem of child poverty. There are 12 Early Childhood Development Centres. Table 19 indicates number of health facilities.

DRAFT IDP2013 Page 69
Table 19: depicts Health Facilities:
VILLAGE NAME HOSPITAL NAME CLINIC NAME
Bismarck Bismarck clinic
Ga-sekororo Sekororo clinic
Lorraine Lorraine clinic
Mabins A Mabins clinic
Sofaya Sofaya clinic
The Oaks The Oaks clinic
The Willows The Willows clinic
Turkey 1 Turkey clinic
Calais Calais clinic
Hoedspruit Hoedspruit clinic
Metz Sekororo hospital
NB: many of the smaller settlements have access to mobile clinic services.

DRAFT IDP2013 Page 70
5.11.1 HIV and AIDS Prevalence
During the past decades, there has been an exponential growth in the number of HIV/AIDS infections in South Africa. This growth has been accompanied by greater
visibility of the epidemic, especially owing to increasingly number of AIDS deaths. Despite the scale of the epidemic, there is relatively limited data on the impact at
personal, community, business or national level. One reasons for this undoubtedly the enormous stigma that is still attached to HIV infections. The rate of HIV/AIDS
according to census 2007 has slightly decline from 27% to 26,8% but it is still higher compared to the 23% of the District. The contributory factors for high prevalence of
HIV/AIDS and related diseases amongst others are:
Poverty, gender inequality and orphanage
Rapid urbanization and cultural modernization.
Cross border gates and national route
Dynamics of a growing economy
Increase in the commercialization of sexual activities.
High unemployment rate
Low literacy rate
Alcohol and substance abuse
High crime rate
Submissive feeling to superiors
Although the epidemic affects all sectors of society, poor households carry the greatest burden and have least resources available to cope with the impact of the disease.
There are number of non-governmental organisations focusing on HIV/AIDS education, awareness and prevention programmes such as Hlokomela. Other prevalent
diseases in the municipality are:
Diarrhea
Pneumonia
Tuberculosis
Malaria
Sexual Transmitted Infections (STI)
And recently, Cholera which has claimed about 5 lives.

DRAFT IDP2013 Page 71
5.12 Safety and Security.
The South African Police service (SAPS) is responsible for the safety and security in the municipality. Hoedspruit police station has shown a decline since 2002.
However, crime particular theft, murder and witchcraft have recently increased in the municipality. The most common crimes in the area are assault and theft. There are
Community Policing Forums (CPFs) in all the wards. There is one police station which is in Hoedspruit and one satellite police station in Hlohlokwe. Maake police station
also provides service to some of our areas. Shortage of police personnel and in effective community policing are critical challenges.
For the municipality to achieve economic growth, safety and security is required to attract investments and thus create jobs and poverty alleviation. The municipality
should jointly with the Department of Safety and Security, develop and implement crime prevention strategy. The following areas were identified as crime hotspots:
CRIME CATEGORY FREQUENCIES CRIME HOT SPOTS AREAS FACILITIES
GBH 91 Contact crime The Oaks The Willows Winlake Farm Royal Lorraine
1 Police station 2Satellite stations Burglary (residence) 62
Burglary ( non-residence) 53
Common Assault 48 Property related The Oaks Champion Chicken Marula Park Jonkmanspruit
Malicious damage to property 43
Source: Dept Safety & Security.
5.13 Education
There are 38 primary schools, 1 combined school and 23 secondary schools. There are also approximately 32000 learners in schools. Hoedspruit which is the economic
hub of the municipality doesn’t have a public secondary school. The teacher pupil ratio is 1:43 on average in primary and 1:39 in secondary schools, although the norm
is 1:35 in secondary schools and 1: 40 in primary schools. Learner: teacher ratios are substantially higher than the national norm.
There is a serious shortage of schools, and more specially, classrooms in both primary and secondary schools. Infrastructure such as electricity, water, sanitation is also
needed in many schools. Education investments are crucial for sustained economic growth as it directly contributes to increased work productivity, more rapid
technological adaptation and innovation, as well as better natural resource management. There are 61 ABET centres.
The municipality does not have a single institution of higher learning hence the shortage of skills in the area. The municipality has a backlog of 66 classrooms. The
municipality recorded a grade 12 pass rate of 41.7% in the 2011 academic year

DRAFT IDP2013 Page 72
5.14 Sports and Recreation.
Sports and recreational activities are coordinated by the Department of Sports, Arts and Culture in liaison with the local municipality. Sports council was established in the
municipality which co-ordinates sporting activities (comprise by community members, Department of sports and officials from the municipality). The development of sports
in the municipality is still a challenge. The municipality has two stadia namely Maruleng show ground and The Willows. There is also Metz sports hub which has facilities
of different sporting codes. There is a general need for constant maintenance and upgrading of these facilities in the light of the 2010 World Cup. Currently the
municipality is upgrading Willows stadium.
5.14.1 Arts and Culture.
Arts and Culture Committee was established to coordinate Arts and Cultural activities in the municipality. The municipality also participate in the annual district Arts and
Cultural competitions.
5.14.2 Library Facilities.
There are three libraries in the municipality, two managed by the municipality and the other by the South African National Defence Force. The library in Metz is an
important milestone because its location and accessibility by most community members.
5.14.4. Thusong Centre Services
Thusong centre in Metz is functional from the beginning of February 2008. Between the 1st of January 2010 and January 2011 about 24000 people were serviced at the
centre. These community members were supposed to have travelled long distance to access these services. The following organizations provide services in the centre:
SAPS
LEDET
Home Affairs
Department of Labour
Department of Agriculture
Maruleng Municipality
IEC
Khutso-Kurhula
The centre intends to bring government close to the people.

DRAFT IDP2013 Page 73
5.15 Disaster Risk Management in the Municipality
Background
Disaster Management is a continuous and integrated multi-sectoral and multi- disciplinary process of planning and implementation of measures aimed at disaster
prevention, mitigation, preparedness, response, recovery, and rehabilitation (Disaster Management Act, Act 57 of 2000). The municipality has a Disaster Risk
Management Plan which is in line with Act 57 of 2000. The plan will soon be adopted by Council.
The responsibility for the coordination of the overall implementation of the plan is the Disaster Officer and assisted by two interns.
The following were identified as the major disaster risk challenges:
5.15.8 Floods
The following rivers and dams were identified: Olifants and Blyde rivers, and Loskop, Bylde, and Klaseria dams
Table 29: depicts major disaster risks prevalent in the municipality
TYPE RISK
1 Hydro meteological hazards Drought, Cyclone, Floods, Fire, Hailstorms, Lightning, Severe storms, Wind storms & Tornado
2 Geological hazards Landslide/mudflow
3 Biological hazards Food poisoning, foot and mouth disease, malaria, rabies (animals) & communicable diseases
4 Technological hazards Dam failure, Hazardous material by road accidents
5 Environmental degradation Air pollution, Deforestation, Soil pollution, Siltation & Land degradation

DRAFT IDP2013 Page 74
5.16 Telecommunications
Telecommunications is an information infrastructure that plays a crucial role in the development of other socio-economic sectors. Thus, an effective telecommunication
infrastructure, that includes universal access, is essential to enable the delivery of basic services and the reconstruction and development of deprived areas. About 53%
of all households have access to a public telephone as much as 21.6% of households have access to a cell phone but the proportion of households with an in-house
telephone within their dwelling is limited to just over 6%. Telkom has a problem regarding telephone infrastructure in terms of new connections.
Access to telecommunications facilities is as follows:
About 21 368 households have access to cellphone
Only 580 households have access to landline
About 10 533 households have access to radio
About 16 298 households have access to television
Only 3 182 households have access to satellite television
Only 1 299 households have access to a computer
Only 519 households have access to internet from home
About 5 678 households have to post mail post box/bag
(Source: census 2011)
STRENGTH WEAKNESSES
Metz regional library Most households have access to housing
Lack of facilities Network coverage
OPPORTUNITIES THREATS
Advanced technology Thusong centre services Social grants
Disaster risks Crime
DRAFT IDP2013 Page 75
6. Economic Analysis (LED)
61. Background
To undertake a proper analysis of the political economy of the district, it becomes important to consider the background of the South African economy in general. Thus,
the district economy needs to be viewed as an integral part of the provincial economy that is linked to the national economy. The national economy is part of the Southern
African regional economy within the world economy. Thus, Maruleng municipality as part of Mopani is a constituent to the global economy positioned to take advantage
of its comparative strengths in its relation to the other regions of the world.
6.2. A Broad Economic Overview of South Africa
South Africa is a middle-income developing country with an abundant supply of natural resources, well-developed financial, legal, communication, energy and transport
sectors, a modern infrastructure, and a stock exchange which rank among the 10 largest in the world. Its economic policy over the past nine years has been shaped by
the government’s development strategy in areas of education, health, social development, security, land reform and poverty alleviation. The government’s policy
decisions have been designed to promote sustainable economic growth, and to ensure that the benefits of growth are shared across an increasingly greater spectrum of
society.
The country’s economic policy is based on the macro-economic policy called Growth, Employment and Redistribution (GEAR). It aims to find a balance between
promoting economic growth on one hand, and social service delivery and job creation on the other. Gear combines the goals of deficit reduction, reprioritization of
government expenditure to enhance poverty reduction, and embarking on macro-economic reforms to promote job creation. The social transition that has accompanied
the demise of apartheid has seen a vast increase in economic participation. Factors underlying this have included an increase on female participation in the economy, as
well as migration to urban areas by the rural poor. South Africa also has a dual agricultural economy: a well-developed commercial sector and a predominantly
subsistence oriented sector in the traditionally settled rural areas, of which Mopani district is constituted. This is probably one of the glaring factors that provides for the
South African economy as consisting of the First and the Second Economy. The first and second Economy in our country is separated from each other by a structural
fault. The second economy emerged during the long period of colonialism and apartheid as a result of the deliberate imposition of social, political and economic exclusion
of the African majority by a racist state. Whilst exacerbated by the imperatives of globalization, the restructuring of the economy also reflect, to some degree the response
DRAFT IDP2013 Page 76
of capital to the extension of citizenship and economic rights to the previously disenfranchised. This restructuring has segmented the labour market into three overlapping
zones, namely core workforce, non-core workforce and the peripheral workforce.
The core workforce consist of workers that benefit directly from global integration, advances in worker rights and other forms of inclusion in social, economic and political
institutions. Formal sector workers are generally highly organized in the trade union movement, although new jobs created in the formal sector tend to be associated with
lower levels of worker organization. Though the size of the formal sector workforce has diminished, it still constitutes more than half of the economically active population.
While they enjoy higher salaries, secure employment and good working conditions, growing numbers of people depend on their wages. Men rather than women are more
easily absorbed into this core of labour market.
The restructuring of the workforce is increasing the levels of a typical employment. This includes actualization, fixed term contracts and working from home.
Those pushed into these more precarious and intensive working conditions become part of non-core workforce. Because of the temporary nature of their work, union
organization is much harder amongst the non-core workforce. The rights won by workers in the core of the economy are difficult to realize in an environment of poorly
organized temporary workers, where women are more likely to find work.
The peripheral zone consists of those who have been excluded from the formal economy and engage in informal income generating activities on the margins, or depend
on the support of friends and family and/or social grants.
This includes the street traders and hawkers who sell basic commodities to the poor, memorabilia to the tourists and food to urban workers. While some of those
operating in the urban economy are able to secure relatively stable niches in markets created by formal sector economic activity, others find themselves excluded from
such markets altogether and eke out a survival through dependence on welfare grants and the barter of goods and services.

DRAFT IDP2013 Page 77
6.3. Locating the Mopani District and Maruleng Economy within the Provincial Economy
The provincial economic development study of 2000, identified tourism, agriculture, mining and trade and manufacturing as sectors with a potential for growth in the
Mopani district. The Mopani District also has a large number and of diverse under exploited tourism assets e.g. the northern portion of the Kruger National Park. A
national park, nature reserves and game farms cover almost half of the district, identified as one of the five best conserved ecosystems in the world, providing ample
opportunity for Eco Tourism and SMME development. The district also has comparative advantages in agriculture, manufacturing and trade. Hereunder is an analysis of
the district economy.
A superficial glance at the available statistics suggests that Mopani District has one of Limpopo’s more developed economies. 2006 per capita GDP (R24,056) was above
the provincial average (R21,787) and the 2006 Mopani GDP (R27.3 billion) placed the district third behind Waterberg and Capricorn by way of economic contribution to
the province. The Mopani economy grew by 4%, above the provincial and national average, between 1996 and 2006.
The Maruleng economy in the Mopani District of Limpopo Province is significant but small (R1.9 billion in 2006), influenced by the global and national economies, and
structurally dependent on the economies of the Limpopo and Mpumalanga Provinces.
Maruleng, despite a reasonable GDP, is one of poorer nodes, over 80% of households live below the households subsistence level, only 28% of the adult population is
employed, and a significant number of households are dependent on pension/grants as their primary source of income.
Growth in the Maruleng economy between 1996 and 2006 was volatile but average 3.1%, which is below the national (3.5%) and provincial (3.9%) average.
Maruleng essentially comprises four divergent sub-economies:
The Public sector which is the largest contributor to GDP
Agriculture comprising mainly large-scale commercial farming which contributes 41% of all formal employment and small-scale or subsistence agriculture
Retail and Service businesses (mainly in Hoedspruit)
Transport and Communications which is the second biggest GDP contributor

DRAFT IDP2013 Page 78
6.4. Opportunities for economic growth and employment in Maruleng
The Maruleng municipality has a large game farms from which the municipality can its tax base. It also boasts of the East-gate Airport through which it can promote
its tourism status and ensure direct access to other provinces and countries for marketing. The area is also imbued with agro-products across the seasons from
which jobs can be created to ensure poverty alleviation. Its strategic location in relation to the Maputo Corridor, positions it to can attract investment in its area. The
following are the major economic pillars of the municipality:
Agriculture, including Agro-processing which is already the largest source of formal employment
Tourism, which is a key sector with significant opportunities for expansion and growth
Retail and Service businesses.
6. 5. Comparative advantages
The Maruleng municipality has comparative advantage in irrigated agriculture where water is available along the banks of the Blyde River. The striking natural landscapes
and proximity to Kruger National Park and other iconic natural parks ensures a sophisticated and expanding tourism.
6.6. Local skills base
Skills training within MLM should be concentrated on the three priority sectors, namely agriculture, tourism and retail. There is generally shortage of technical skills on
these sectors. The municipality relies on the Department of Agriculture on agricultural technical skills. On tourism, mostly private operators have skills and very few blacks
appointed by these operators have skills. The municipality has developed a bursary scheme in order to develop local skill base on these economic sectors mainly to the
previous historic disadvantaged people.
6.7. Challenges in the Municipal Economy
The majority of people in Maruleng are located far away from the economic hub of the municipality, namely, Hoedspruit. The town which is the economic node of the
municipality is surrounded by privately-owned land which is not readily available for new development. There is general shortage of technical skills in the area and most of
the rural communities of Maruleng get jobs in Tzaneen and Phalaborwa and thus promoting economic activities outside their municipality. One other issue is that many
people working in Hoedspruit are from Bushbuckridge in Mpumalanga province and they spent their income outside Maruleng. 18,5% of the municipal area is subject to
21 registered land claims. There is also a general infrastructure backlog which hampers potential new economic infrastructure development in the area.

DRAFT IDP2013 Page 79
6.8. Strategically located land
The two nodal points in the municipality are strategically located land in which the LED could thrive. The Hoedspruit nodal point which is largely private-owned does well
in agriculture, tourism and retail, while Metz which is earmarked for the development of shopping complex will do well in terms of retail.
6.9. SECTOR ANALYSIS
6.9.1. TOURISM SECTOR
6.9.1.1. Overview of the tourism sector
Maruleng municipality is wedged between some of Limpopo prime tourist attractions, including the Kruger National Park, Timbavati Private Reserve and Blyde River
Canyon. Significant tourism related activities exist as well as numerous private lodges and guesthouses. An existing airport will play a significant role to increase tourist
traffic and establish the area as a gateway to the Kruger and surrounding areas.
6.9.1.1.1. Tourist attractions and facilities in Maruleng
There are an estimated 2814 beds in 70 lodges 10 guesthouses and 10 resorts in the municipality. Estimated 70 to 80% of Lowveld luxury lodges.R527 route gives
access to Khamai Reptile Park, Bombyx Mori Silk farm and Moholoholo Animal Rehabilitation centre. Maruleng municipality boasts Major Private Game Reserves and 5-
star luxury lodges, namely;
Thornbush and Kapama Timbavati (home of the white lions) Klaserie Babule and Oliphants
It also houses Hoedspruit endangered species centre which is the world famous Cheetah breeding. The area falls within Limpopo Tourism “Valley of Oliphant’s” tourism
route. Blyde river canon offers Bird watching (globally recognized and important bird area), Adventure tourism including hiking, white water
Rafting, abseiling, hot air ballooning. The municipality serves as the centre of the Kruger 2 canyon Biosphere and has Drakensberg Mountain Range which has rock
climbing, hiking and Mariepskop (scenic Mountain View)

DRAFT IDP2013 Page 80
6.9.2. AGRICULTURAL SECTOR
Agriculture currently is, and is likely to remain a key economic sector and employment generator in Maruleng. Maruleng dominant economic activity is commercial
agriculture. The region is the leading producer and exporters of mango and one of the largest producers of citrus. Other crops such as vegetables are increasingly
becoming important. Citrus and mango require significant production levels in order to be profitable and there are concerns that these are not viable options for small
emerging farmers unless structured through co-operatives. Potential exists to introduce sugar cane would provide alternatives for smaller emerging farmers.
6.9.2.1. Types of products
The types of products grown in the area vary between subsistence and commercial farming, with the latter relying on irrigation to produce variety of crops namely:
Field crops such as maize
Produce crops such as citrus, mango, vegetables, tomatoes, avocados and onions.
There are other agricultural activities such as live stock which focuses on cattle, goats and poultry, and game farms and marula.
However the following critical areas must be addressed if the agriculture is to remain competitive;
The speedy and effective resolution of land claims and the introduction of Private sector partnerships to ensure skills transfer and ongoing commercial viability of farms.
Significant investment in transportation infrastructure, notably o Roads and rails as well as the exploring of options to establish and o Airfreight hub in Hoedspruit.
The more effective branding and marketing of Maruleng produce and
Securing of contracts with local and domestic customers such as large food Retail chains.
The development and expansion of agro-processing activities such as juice processing, fruit drying etc.
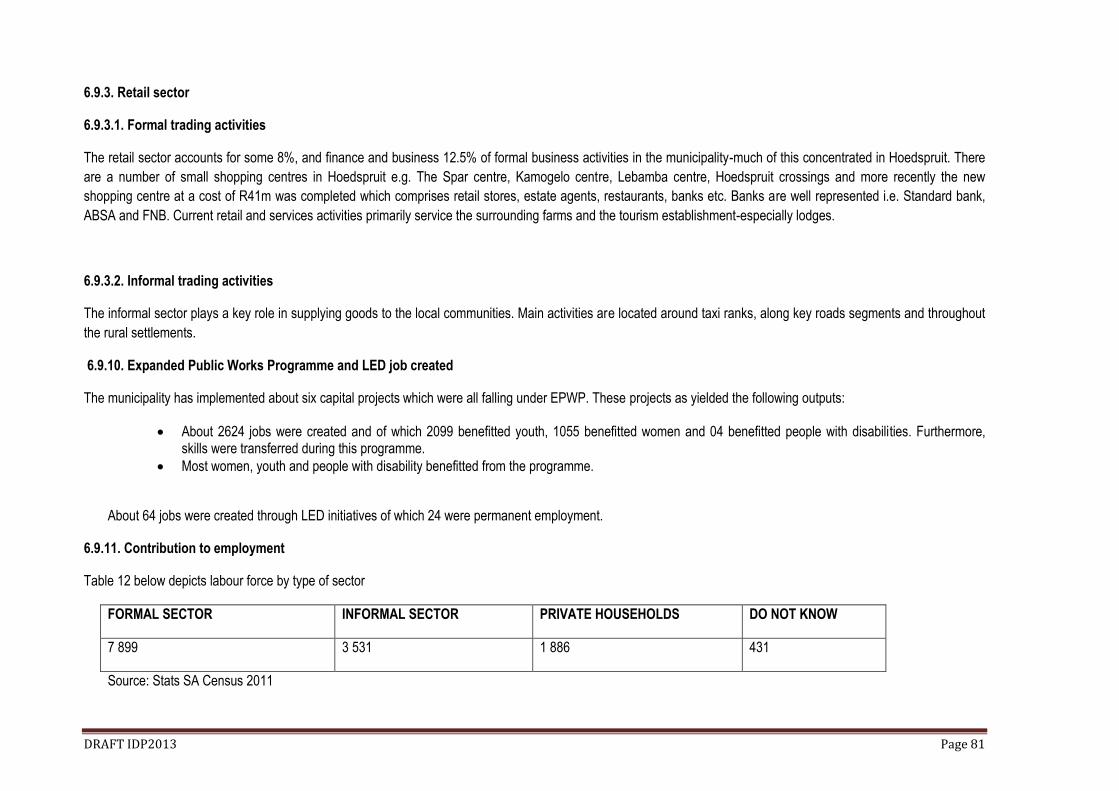
DRAFT IDP2013 Page 81
6.9.3. Retail sector
6.9.3.1. Formal trading activities
The retail sector accounts for some 8%, and finance and business 12.5% of formal business activities in the municipality-much of this concentrated in Hoedspruit. There
are a number of small shopping centres in Hoedspruit e.g. The Spar centre, Kamogelo centre, Lebamba centre, Hoedspruit crossings and more recently the new
shopping centre at a cost of R41m was completed which comprises retail stores, estate agents, restaurants, banks etc. Banks are well represented i.e. Standard bank,
ABSA and FNB. Current retail and services activities primarily service the surrounding farms and the tourism establishment-especially lodges.
6.9.3.2. Informal trading activities
The informal sector plays a key role in supplying goods to the local communities. Main activities are located around taxi ranks, along key roads segments and throughout
the rural settlements.
6.9.10. Expanded Public Works Programme and LED job created
The municipality has implemented about six capital projects which were all falling under EPWP. These projects as yielded the following outputs:
About 2624 jobs were created and of which 2099 benefitted youth, 1055 benefitted women and 04 benefitted people with disabilities. Furthermore, skills were transferred during this programme.
Most women, youth and people with disability benefitted from the programme.
About 64 jobs were created through LED initiatives of which 24 were permanent employment.
6.9.11. Contribution to employment
Table 12 below depicts labour force by type of sector
FORMAL SECTOR INFORMAL SECTOR PRIVATE HOUSEHOLDS DO NOT KNOW
7 899 3 531 1 886 431
Source: Stats SA Census 2011

DRAFT IDP2013 Page 82
6.9.12 Community Works Programme
Community Works Programme is a programme initiated by COGHSA in a drive to create jobs for the unemployed in line with the government priority of job creation.
About 1324 jobs were created thus far.

IDP 2012/13 Page 83
7. FINANCIAL VIABILITY.
7.1. BACKGROUND
The purpose of analyzing the financial status of the municipality is to determine the financial soundness of the institution so that the municipality can improve its
financial management capacity and revenues.
Financial viability is about being able to generate sufficient income to meet operating payments, debt commitments and, where applicable, to allow growth while
maintaining service levels.
7.2. FINANCIAL MANAGEMENT POLICIES
The financial management system comprises of policies, procedures, personnel and equipment.
The Municipality’s budgeting process is guided and governed by relevant legislation, frameworks, strategies and related policies.
The following financial management policies and procedures were developed and reviewed
7.2.1 Review of credit control and debt collection procedures/policies

IDP 2012/13 Page 84
The Credit Control and Debt Collection Policy was reviewed, the policy is credible, sustainable, manageable and informed by affordability and value for
money there has been a need to review certain components to achieve a higher collection rate. Some of the revisions included the lowering of the credit
periods for the down payment of debt. In addition emphasis will be placed on speeding up the indigent registration process to ensure that credit control
and debt collection efforts are not fruitlessly wasted on these debtors.
The 2012/13 MTREF has been prepared on the basis of achieving an average debtors’ collection rate on current billings. In addition the collection of debt
in excess of 90 days has been prioritized as a relevant strategy in increasing the Municipality’s cash levels.
7.2.2 Inventory and Asset Management Policy
A proxy for asset consumption can be considered the level of depreciation each asset incurs on an annual basis. Preserving the investment in existing
infrastructure needs to be considered a significant strategy in ensuring the future sustainability of infrastructure and the Municipality’s revenue base.
7.2.3 Supply Chain Management Policy
The Supply Chain Management Policy was reviewed and a change to the PPPF Act was taken into account.
7.2.4 Banking and Investment Policy
The Municipality’s banking and Investment Policy was reviewed. The aim of the policy is to ensure that the Municipality’s surplus cash and investments
are adequately managed, especially the funds set aside for the cash backing of certain reserves. The Policy details the minimum cash and a cash
equivalent required at any point in time and introduces time frames to achieve certain benchmarks.
7.2.5 Tariff Policies

IDP 2012/13 Page 85
The Municipality’s tariff policies provide a broad framework within which the Council can determine fair, transparent and affordable charges that also
promote sustainable service delivery. The policies envisaged to be compiled for ease of administration and implementation of the next two years.
7.2.6 Indigent Policies
In terms of the Municipality’s Indigent policy, Households with a total monthly gross income of R1 500,00 or less qualifies to a subsidy on property rates
and services charges for sewerage and refuse removal and will additionally receive 6 kl of water per month free of charge.
7.2.7 Rates Policy
Maruleng council in adopting this rates policy has sought to give effect to the sentiments expressed in the preamble of the Property Rates Act, The Rates
policy allows the municipality to exercise their power to impose rates within a statutory framework which enhance certainty, uniformity and simplicity
across the nation, and which takes account of historical imbalances and the burden of rates on the poor.
7.2.8 Write off Policy
The policy is in accordance with the Local Government Municipal Finance Management Act 2003, Local Government Municipal Systems Act 2000, as
amended and other related legislation. The Policy ensures that before any debt is written off it must be proved that the debt has become irrecoverable.
7.2.9 Travel and Subsistence Policy
The purpose of this policy is to reimburse the necessary extra costs of meals, accommodation and travel arising as results of official duties away from
home.
7.3. FINANCIAL SOURCES OF THE MUNICIPALITY
Revenue classified by main revenue source

IDP 2012/13 Page 86
Description 2011/12 2012/13
Original Budget
Budget Year 2013/14
Budget Year+1 2014/15 Budget Year +2 2015/16
Property rates 10 312 536
12,000,000
12,612,000
13,229,988
13,878,257
Service charges- water revenue -
-
-
-
-
Service charges – sanitation revenue -
-
-
-
-
Service charges- refuse revenue 2 084 724
2,208,000
2,320,608
2,434,317
2,553,599
Rental of facilities and equipments 323 974
296,600
311,726
327,001
343,024
Interest earned- external investments 713 880
800,000
840,000
881,999
925,217
Interest earned- outstanding debtors 92 388
107,400
112,887
118,408
124,210
Fines 131 676 200,000 210,200 220,449 231,304
Licenses and permits 6 729 272 9,000,000 9,459,000 9,922,491 10,408
Transfer recognized –operational 54 814 074
95 157 756
105,207,000
99,082,000
Total Revenue (excluding capital transfers and contributions)
91 440 663
In the 2011/12 financial year, revenue from rates and services charges totaled R10.3 million or 11 per cent as calculated to the total revenue. This increases to
R12 million, R14 million and R16 million in the respective financial years of the MTREF. The above table excludes revenue foregone arising from discounts and
rebates associated with the tariff policies of the Municipality
Apart from Transfers recognized – operational which is about 57.8 percentage of the total revenue mix, other revenue is the largest own revenue source in
2012/13 financial period. The second largest own sources is, property rates which consists of various items such as town planning fees, building plan fees,
clearance certificates, rental sign boards, tender documents and sales of Transnet houses ,etc. Municipality has been urged to review the tariffs of these items on
an annual basis to ensure they are cost effective and market related.

IDP 2012/13 Page 87
Operating Transfers and Grant Receipts
DESCRIPTION
2012/13
MEDIUM TERM EXPENDITURE FRAMEWORK
Actual Original Budget 2012/13
Budget Year 2013/14
Budget Year + 1 2014/15
Budget Year +2 2015/16
Equitable Shares
47 176 000
53,513,000
60,742,000
71,900,000
92,865,000
Finance Management 1 819 600 1,606,432 1,620,000 1,800,000 1,950,000
Municipal Systems Improvement 1 204 474
1,071,438
890,000
934,000
967,000
Integrated National Electrification -
5,000,000
- - -
EPWP Incentive 614 000 1,689,000 1,000,000 - -
Mopani District Municipality 4, 000,000 103,895 - - -
National Disaster Emergency Fund
- 2,000,000 3,000,000 - -
Municipal Infrastructure Grant (MIG)
29 279 734
30, 174,000
28,647,000
25,322,000
26,578,000
TOTAL RECEIPTS OF TRANSFERS & GRANTS
84 093 808
95,157,756
95,899,000
99,956,000
122,360,000
Operating grants and transfers totals R54.8 million in the 2011/12 financial year and steadily increases to R65.4 million by 2014/15. Note that the year-on-year
growth for operating grants for 2012/13 financial year is 67 per cent when compared to total grants and increase to 68.9 and 66 percent for the two outer years.

IDP 2012/13 Page 88
7.4. BUDGET AND TREASURY MANAGEMENT
Currently the budget preparation process of the municipality is linked to the IDP Process and Performance Management System. Treasury management
entails the management of cash flows, bank accounts and investments. Monthly and quarterly reconciliations and reporting are done by the municipality
to comply with the MFMA, for example SDBIP and Treasury regulations.
7.4.1. Previous and current Budgets
2009/10 2010/11 2011/12 2012/13 2013/14
81 529 130.00 94 897 368.08 109 292 694.00 135,492,612 132,478,520
7.4.1.2. Submission of financial statements to the Office of A-G
The municipality also adheres to the stipulated timeframes with regard to submission of financial statements to A-G in terms of Section 71 of MFMA and
addresses audit queries raised timeously.
7.4.1.3. Addressing comments from the Auditor General’s report
The municipality has developed an annual action plan which responds to the A-G’s comments. The plan has clear targets with timeframes. This plan will also
assist the municipality to improve the management of the municipal business.

IDP 2012/13 Page 89
7.4.2. REVENUE MANAGEMENT
The municipality has the following revenue management systems or tools:
7.4.2.1. BILLING SYSTEM
The municipality has an effective billing system. This system enables the municipality to generate its income. This income amounts to 36% of the
revenue budget.
7.4.2.2. REVENUE ENHANCEMENT STRATEGY
The municipality has a revenue enhancement strategy to address revenue collection with regards to rates and services. This strategy enables the
municipality to collect own revenue
7.5. EXPENDITURE MANAGEMENT
The municipality has formulated and implemented a Supply Chain Management Policy as a legislative requirement. Creditors are paid within 30 days
from date of submission of invoices. The critical challenge is staffing to manage this policy.
7. 6. CASHFLOW MANAGEMENT
Cash flow management and forecasting is a critical step in determining if the budget is funded over the medium-term. The table below is consistent with
international standards of good financial management practice and also improves financial knowledge of Councilors and management. Some specific
features include:
Clear separation of receipts and payments within each cash flow category;
Clear separation of capital and operating receipts from government, which also enables cash from “Ratepayers and other to be provided for as cash inflow based on actual performance. In other words the actual collection rate of billed revenue,

IDP 2012/13 Page 90
DESCRIPTION
2011/12
CURRENT FINANCIAL YEAR 2012/13
MEDIUM TERM EXPENDITURE FRAMEWORK
Original Budget 2012/13
Adjusted Budget 2012/13
Budget Year 2013/14
Budget Year + 1 2014/15
Budget Year +2 2015/16
CASH FLOW FROM OPERATING ACTIVITIES
Receipts
Ratepayers and other 12 811 729 25 022 053 30 436 903 39 910 032 24 589 059 26 306 906
Government- operating 41 599 260 52 966 000 52 994 474 56 813 000 60 377 000 65 412 000
Government- capital 14 98 753 25 470 461 29 279 734 28 174 000 29 830 000 31 670 000
Interest 569 233 306 306 000 806 268 857 400 902 842 947 081
Suppliers and employees
- 47 408 131 - 72 341 033 -70 422 737 -77 915 461 -79 139 963 - 83 068 964
Finance charges 536 520
NET CASH FROM (USED) OPERATING
23 094 364
31 423 480
43 074 642
47 838 972
36 558 939
41 267 024

IDP 2012/13 Page 91
DESCRIPTION
2011/12
CURRENT FINANCIAL YEAR 2012/13
MEDIUM TERM EXPENDITURE FRAMEWORK
Actual Original Budget 2012/13
Budget Year 2013/14
Budget Year + 1 2014/15
Budget Year +2 2015/16
CASH FLOW FROM INVESTMENT ACTIVITIES
Receipts
Proceeds on disposal of PPE
4 180 000 -
Decrease (increase) in non-current debtors
1 950 000
1 950 000
1 850 000
840 000
-249 000
Decrease (increase) in non-current receivables
1 890
1 890
Decrease (increase) in non-current investment
-212 500
-
-212 500
1 532 270
1 000,000
1 500 000
Payments
Capital assets -15 167 039 - 33 451 661 -44 789 084 -44 665 915 -35 569 049 - 37 039 841
NET CASH FROM (USED) INVESTING ACTIVITIES
-10 987 039
-31 712 271
-43 049 694
-41 283 645
-33 725 049
-35 788 841

IDP 2012/13 Page 92
DESCRIPTION
2011/12
CURRENT FINANCIAL YEAR 2012/13
MEDIUM TERM EXPENDITURE FRAMEWORK
Actual Original Budget 2012/13
Budget Year 2013/14
Budget Year + 1 2014/15
Budget Year +2 2015/16
CASH FLOW FROM OPERATING ACTIVITIES
Receipts
Borrowing long term/ refining
16 092
Payments
NET CASH FROM (USED) FINANCING ACTIVITIES
16 092
-
-
-
-
-
NET INCREASE/DECREASE IN CASH HELD
12 123 417
-288 790
-
24 948
24 948
6 555 327
6 555 327
Cash/cash equivalents at the year begin:
10 612 795
9 274 790
620 575
620 575
11 600 000
11 600 000
Cash/cash equivalents at the year end:
22 736 212
8 986 000
620 575
620 575
18 155 327
18 155 327
IDP 2012/13 Page 93
The above table shows that cash and cash equivalents of the Municipality decreased from 12.1 million to 288 thousand between 2011/12 financial year,
moving to a positive cash balance of R6.5 million to R5.4 million for 2014/15 MTREF. With the 2011/12 adjustments budget various cost efficiencies and
savings had to be realized to ensure the Municipality could meet its operational expenditure commitments.
In addition the Municipality undertook an extensive debt collection process to boost cash levels. These initiatives and interventions have translated into a
positive cash position for the Municipality. For the 2012/13 MTREF the budget has been prepared to ensure high levels of cash and cash equivalents
over the medium-term with cash levels anticipated to exceed R18.1million by 2012/13 and steadily increasing to R26.4 million by 2014/15.

IDP 2012/13 Page 94
8. GOOD GOVERNANCE AND PUBLIC PARTICIPATION
8.1. Background
One of the Objectives of Local Government captured in section 152 of the Constitution is to encourage the involvement of communities and community
organizations in the matters of local government. The white paper on local government expects the municipalities to be working with citizens and groups within the
community to find sustainable ways to meet their economic, social and material needs and improve the quality of their lives. Therefore the municipality is using a
number of ways and systems to involve communities and improve governance.
8.2. Relationship with traditional Leaders
In general, the municipality has a good relationship with the traditional leaders. Traditional leaders participate in most municipal activities such as IDP
Representative Forums, Public Participation meetings, Council sittings etc.
8.3. Community Participation (Ward committees and CDW’s)
The municipality has functional ward committees in all its 14 wards but one and 09 CDW’s which serve as conduits between the municipality and community
regarding municipal business. They are attending all municipal activities as expected. About five Mayoral Public Participation Meetings (community meetings)
were held where communities were given progress reports and continuous seeking mandate. Public participation on IDP/PMS/Budget was conducted during the
month of April 2012 where the public and stakeholders made inputs which informed the final IDP output.
8.4. Municipal Public Accounts Committee

IDP 2012/13 Page 95
The municipality has established a Municipal Public Accounts Committee in terms of Sections 33 and 79 of the Municipal Structures Act 1998. This committee
plays an oversight role of the council. The committee consists of nine non-executive councilors.
8.5. Inter-Governmental Relations
Maruleng municipality is responsible for facilitating inter-governmental relations within its area of jurisdiction. The municipality is the convener of the manager’s
forum a “key forum for strategic alignment, coordination and integration” that serves as an intergovernmental structure where Sector Departmental managers in
the municipality meet with their municipal counterparts. The relationship between the municipality and Sector departments has improved.
8.6. Audit, Anti-Corruption and risk management challenges
8.6.1. Internal Audits
Internal controls and compliance audits are conducted and reports are submitted to the management and acted upon. The municipality has just appointed the
Internal Auditor who will add value to the financial management. There is also a District-Shared Audit Committee which renders services to its local municipalities.
AUDIT OPINIONS
2007/08 2008/09 2009/10 2010/11 2011/12

IDP 2012/13 Page 96
Disclaimer Qualified Unqualified Unqualified Qualified
The municipality received qualified opinion due to its asset register. The municipality has already appointed service provider to unbundle its asset. The
municipality also developed action plan to address issues raised by the A-G. The action plan has already met about 40% of its targets.
8.6.2. Anti-Corruption
Corruption is defined as “ any conduct or behavior in relation to persons entrusted with responsibilities in public office which violates their duties as public officials
and which is aimed at obtaining undue gratification of any kind for themselves or for others.” Public Service Anti-Corruption Strategy.
The municipality has developed the anti-corruption strategy, whose objectives are:
To prevent and combat fraud and corruption and to related corrupt activities
To punish perpetrators of corruption and fraud
To safeguard MLM properties, funds, business and interest
8.6.3. Risk management
The municipality has identified the following as the major risks:
Lack of access to land and increased land prices
Theft and vandalism of projects
Untraced rate payers
Shortage of skilled personnel

IDP 2012/13 Page 97
Health hazard
Failure to attend IDP meetings by business sector
The municipality has developed risk policies which will outlines how the municipality will deal with risks. The Risk Management Officer will be appointed in the
current financial year.
8.6.4 Public Participation Programme
The municipality has developed an annual public participation programme. The programme targets all wards and specific villages. These meetings afford
politicians opportunity to report back on progress made and direct contact with ordinary community members.
9. MUNICIPAL TRANSFORMATION AND ORGANISATIONAL DEVELOPMENT
9.1. INSTITUTIONAL ANALYSIS
9.2. BACKGROUND
The purpose of conducting an institutional analysis is to ensure that the municipal development strategies take existing institutional capacities into consideration
and that institutional shortcomings are addressed. The Maruleng local municipality was established in 2000 in terms of the Municipal Structures Act, 1998(Act
No.117 of 1998). The municipal offices are situated in Hoedspruit town, 65 Springbok street.

IDP 2012/13 Page 98
9.3. POWERS AND FUNCTIONS OF MARULENG LOCAL MUNICIPALITY
The powers and functions of the Municipality in terms of section 155(6) (a) and (7) Act 108 of 1996 and as delegated by the MEC of Local Government and
Housing are defined as follows:
1. Building regulations
2. Billboards and the display of advertisements in public places
3. Local Tourism
4. Cleansing
5. Municipal Planning
6. Storm water Management
7. Municipal Parks and Recreation
8. Municipal Roads
9. Special Programmes
10. Disaster Management
11. Street Lighting
12. Refuse Removal, Refuse Dumps and Solid Waste
13. Traffic and parking
The division of powers and functions between the district municipalities and local municipalities were adjusted by the MEC for Local Government and Housing in
terms of sections 16 and 85 of the Municipal Structures Act, 1998 and published in the Provincial Gazette No.878, dated 07 March 2003 which gave Local
Municipalities the function of promoting local tourism. Fewer functions that are not critical in nature which the municipality is not currently performing due to lack of
capacity, functions such as dog licensing etc.
9.4. INSTITUTIONAL STRUCTURE

IDP 2012/13 Page 99
The Maruleng Local Municipality has implemented an Executive and Ward Participatory System of local governance which ensures that governance is taken right
down to community level and that all citizens within the municipality are represented in decision making. This increases residents’ sense of belonging,
accountability and empowerment and actively involves them in all issues dealt with by the municipality.
9.4.1. POLITICAL STRUCTURE
The Council consists of 24 councillors, of both elected (ward representatives) and proportional (12Councillors). Each of the 12 ward councillors chairs a ward
committee as part of the Ward Participatory System that brings participation down to community level. Ward councillors play a central role in the communication
process between the communities they represent and the council, reporting back regularly through ward meetings and assisting the community in identifying
needs and priority areas of development which feed into the municipality’s planning processes. The new demarcation increases the wards from 12 to 14 and from
24 councillors to 27 respectively.
The mayor heads the Executive Committee which comprises of five councillors. The municipality has three full-time councillors i.e. is the Mayor, Speaker and
Chief Whip.

IDP 2012/13 Page 100
Finance, corporate and
shared services
Municipal
Manager
SPED, Social
services, Agriculture
and Environmental
management
Sport s,
Recreation and
culture
Infrastructure development,
Roads, Public transport and
Water services
Executive
Committee
Council
Directorate of
Budget & Treasury
Directorate of
Corporate
Services
Directorate of
Technical
services
Directorate of
Community
Services
Directorate of Spatial
Planning &
Economical
Development
Mayor’s officeSpeaker
MARULENG MUNICIPAL ORGANOGRAM – GOVERNANCE STRUCTURE
Municipal
Manager’s office
49
Political oversight of the administration is ensured via Section 80 Committees in control of different portfolios’ in Council, which comprise:

IDP 2012/13 Page 101
Table 20: Portfolio Committees:
NAME OF COMMITTEE CHAIRPERSON SUPPORT DEPARTMENT
Finance, Corporate and shared services Cllr. Moshilo Popela Budget and Treasury Offices and Corporate services
Economic Development, Housing, Spatial planning, social
services, agriculture and environmental management
Cllr.Joyce Mahlo Spatial Planning and Economic Development and
Community Services
Sports, recreation and culture Cllr. Mathaba A.T Community Services
Infrastructure Development, roads, public transport and water
services
Cllr.Nyathi Julia Technical Services
9.5 ADMINISTRATION
The municipal manager, who is the Chief Accounting Officer, heads the administration. The total positions in the organogram stand at 180 whereas the positions
filled are 154 which amount to 85.6% while the vacant positions are 26. There are 3 vacant Section 56 positions namely: CFO, Directors SPED and Community
Services.
Table 22: depicts Departmental or Directorates Responsibilities
MUNICIPAL MANAGER’S OFFICE CORPORATE SERVICES

IDP 2012/13 Page 102
Overall responsibility for the organization
Strategic Planning (IDP,PMS,SDBIP)
Communication
Internal Auditing
Disaster Management
Information Technology
Public Participation
General Administration (Human Resource)
Legal Services
Council Support
Policies and Procedures
Capacity Building/Training
Occupational Health and Safety
SPATIAL PLANNING AND ECONOMIC DEVELOPMENT TECHNICAL SERVICES
Spatial Planning
LED
Land Reform
Building Regulations
Municipal Roads and Storm Water
Infrastructure management
Project Management
Drainage and Storm Water
Housing Facilitation
BUDGET AND TREASURY COMMUNITY SERVICES
Income and Expenditure
Debt Management
Budgets
Asset Management
Financial Reporting
Supply Chain Management
Fleet Management
Waste Management
Sports and Recreation
Parks and Cemeteries
Traffic and licensing
Youth and Gender matters
Thusong Services Centre
9.6. MANAGEMENT SYSTEMS
The Management has developed management systems that are used to deliver services to the municipal constituencies. A management system consists of
policies, procedures, personnel, plans and equipments to enable the municipality to have good governance, cost effective and efficient delivery of services. A
synopsis of the various management systems are highlighted hereunder:

IDP 2012/13 Page 103
9.7. Human Resource Management System
The municipality has a human resource management system that is constituted of human resource management policies, procedures, personnel and plans. The
specific employee relations policies have the primary objective to establish the MLM approach towards its employees and external agencies that play a part in
employer-employee relations. The policies include inter alia:
Joint Representation Forum Principles;
Recognition Agreements;
Disciplinary Procedures;
Basic Conditions of Employment;
Grievance Procedures; and
Training Policy
Labour relations are dealt through the Local Labour Forum. The employees of Maruleng are affiliated to SAMWU and IMATU.
9.8 SKILLS DEVELOPMENT
The municipality places greater emphasis towards capacitating its personnel in line with the Skills Development Act (Act.NO.97 of 1998) and the Skills
Development Levies Act (Act No. 9 of 1999).
The municipality has developed a comprehensive Work Skills Plan which the Equity Plan forms an integral part and has registered with the Local Government
Sector Education and Training Authority.
This legal framework and the National Skills Development Strategy are intended to encourage employers to comply with legislations by so doing:
Support economic growth for employment creation and poverty eradication
Promote productive citizens by aligning skills development with national strategies for growth and development
Accelerate Broad based Black Economic Empowerment and Employment Equity, and
Help to create a competitive and productive work environment.
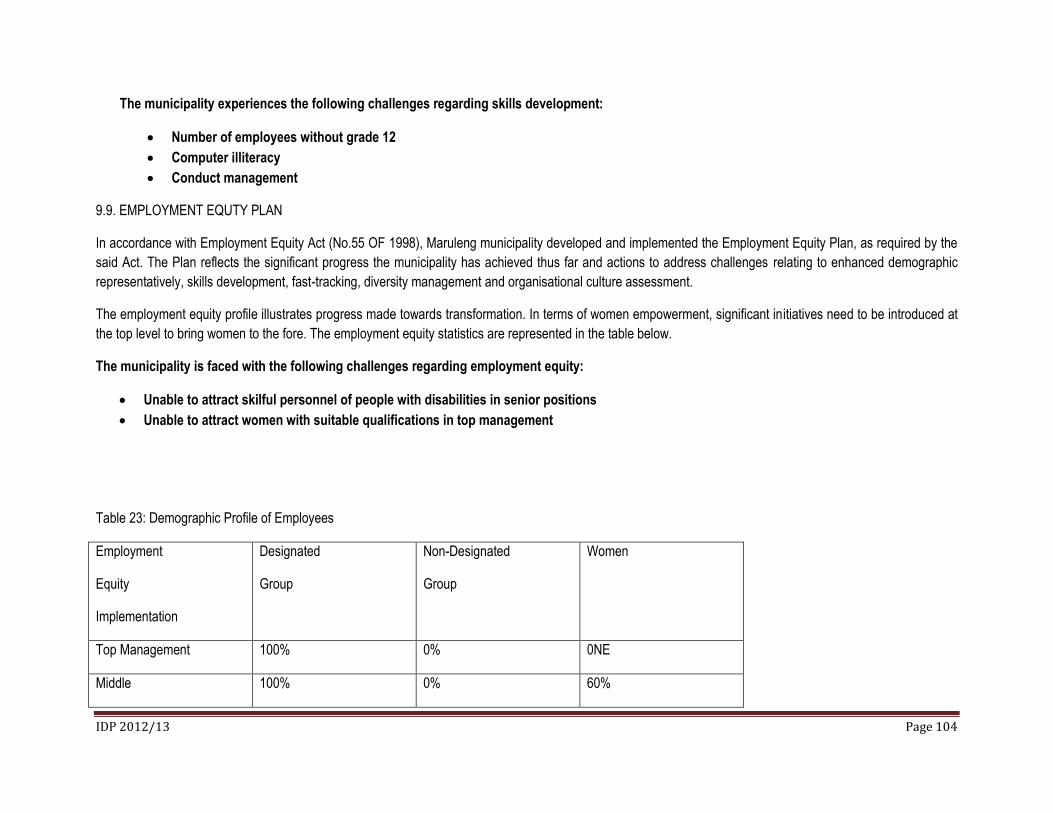
IDP 2012/13 Page 104
The municipality experiences the following challenges regarding skills development:
Number of employees without grade 12
Computer illiteracy
Conduct management
9.9. EMPLOYMENT EQUTY PLAN
In accordance with Employment Equity Act (No.55 OF 1998), Maruleng municipality developed and implemented the Employment Equity Plan, as required by the
said Act. The Plan reflects the significant progress the municipality has achieved thus far and actions to address challenges relating to enhanced demographic
representatively, skills development, fast-tracking, diversity management and organisational culture assessment.
The employment equity profile illustrates progress made towards transformation. In terms of women empowerment, significant initiatives need to be introduced at
the top level to bring women to the fore. The employment equity statistics are represented in the table below.
The municipality is faced with the following challenges regarding employment equity:
Unable to attract skilful personnel of people with disabilities in senior positions
Unable to attract women with suitable qualifications in top management
Table 23: Demographic Profile of Employees
Employment
Equity
Implementation
Designated
Group
Non-Designated
Group
Women
Top Management 100% 0% 0NE
Middle 100% 0% 60%

IDP 2012/13 Page 105
Management
Professional
Staff
100% 1% 80%
9.10. Performance Management System
The municipality has a functional performance management system aligned to the IDP, Budget and SDBIP. This system assists the municipality to monitor
measure and assess performance of both the institution and individuals. Reports are generated on a monthly, quarterly and annual basis.
9.11 Communication System
The municipality has implemented communication strategy and appointed Communication Officer. The above initiatives have improved communication amongst
stakeholders around key municipal activities and programmes.
The Strategic plan of any organisation can only be developed once a proper environmental analysis has been conducted. One of the best known strategic tools
for environmental analysis is the SWOT analysis. The SWOT analysis focuses on the internal environment by determining the Strengths and Weaknesses within
the organisation. When analyzing the external environment the focus should be on identifying Opportunities, and Threats facing the organisation. After meaningful
participation, the following SWOT identified by the participants as the strong and weak points of the Municipality, were tabled as follows:
9.12. Special Programmes of Council
The special programmes of Council, namely, Gender, Youth and the Disability Desks have been established in the office of the Mayor, to champion the interest of
these designated groupings in the programmes of the municipality. The needs of the special groups amongst others are:
Skills Development Employment opportunities Assistance devices like wheelchairs, walking sticks, hearing aids etc Housing Access to government facilities and services

IDP 2012/13 Page 106
MUNICIPAL SWOT ANALYSIS
STRENGHTS (Internal) WEAKNESSES (Internal) OPPORTUNITIES (External) THREATS (External)
MFMA compliance Maintenance of infrastructure Agriculture Water shortage
IDP,PMS and Budget aligned Grant dependent Tourism, Tourism Body Land claims
Effective council structures Revenue collection Revival of non-functional LED projects Lack of available land for development in town
Batho Pele principles are lived out Vacancy on critical positions (finance, Public Participation and Risk Officers)
K2C Biosphere Licensing of landfill sites
Effective implementation of SDF Enforcement of By-laws and policies Small scale mining (Mica) Economic recess
Non-reliance on bank loans and overdrafts
Data management East Gate Airport (customs and excise Unit, chartered flights to land at East Gate, commercial opportunities
Lack of affordable accommodation in Hoedspruit
Political support SCM compliance Blyde 800 Water Resource (bulk water from Blyde)
Climate change, drought, fires, floods etc
Infrastructure (offices and roads) MIG expenditure Alternative energy source (Hydro and solar)
Hazardous materials
Most positions filled Asset and Inventory Management Smart partnerships HIV/AIDS and communicable diseases
Delay in fillingvacant Section 56 positions Cooperation with traditional Leadership Lack of tertiary institutions
Unable to attract and retain skilful and competent personnel
Crime- Theft

IDP 2012/13 Page 107
3.10. PRIORITIZATION
Government does not have sufficient resources to address all issues identified by communities. Prioritization assists government, and in this case, primarily the
municipality in allocating scarce resources. The following informed the municipality in determining municipal-wide priorities:
Greatest needy area
Impact the service will make
The potential for poverty alleviation, cost recovery and job creation
Revenue generation
3.10.1. Priorities of Maruleng Municipality
The following are the priorities of the municipality:
Provision of water and sanitation services Job creation and livelihoods (LED) Provision of health services Provision of roads and public transport Disaster management and emergency services Provision of educational infrastructure and services Refuse removal , waste and environmental management Safety and security Provision of social amenities (particularly sports facilities) Land use management and land ownership, and
.

IDP 2012/13 Page 108
9.12. Priorities, Problem Statement and Objectives
TABLE: 24
PRIORITIES PROBLEM STATEMENT OBJECTIVES
1. WATER The main problem with regard
to water is source
Reach balance between the supply and demand of water sources
To roll-out provision of new water connections to formalized areas
To improve quality of portable water to consumers
To maintain the existing infrastructure
To provide new infrastructure for new development
2. SANITATION Lack of access to basic
sanitation has created massive
and environmental and health
problems in both rural and
urban areas in the municipality
To address backlogs regarding sanitation
To maintain and upgrade existing infrastructure
3. LED To promote local economic development in the municipality in order to create sustainable jobs
4. ENERGY Failure or interruption of supply
and communities receive
inadequate services
To ensure that there is a balance between supply and demand of electricity
To have cost effective electricity serving mechanisms
To ensure reviewal of service provision methods to communities
5. HIV AND AIDS AND
OTHER DISEASES
HIV and AIDS is a serious
problem threatening our
workforce and the community at
large, thus increasing the
number of orphans and child-
headed families
To manage and prevent the spread of HIV/AIDS and other diseases in the workforce and community
6. EMERGENCY SERVICES
AND DISASTER
Unavailability of Disaster and To have advanced communication and dispatching system in the centres
To render effective and efficient service delivery to the community by quick

IDP 2012/13 Page 109
MANAGEMENT Emergency centres respond to all emergency calls
To have proper accommodation for public safety
7. ROADS AND
STORMWATER
Most roads are not well
maintained and there is a
general shortage of bridges
To ensure the existing of planning and budgeting tools for road maintenance
To improve road mobility in the municipal roads
8. INSTITUTIONAL
DEVELOPMENT
Shortage of personnel in
Finance and Planning
Filling of strategic positions
9. TRANSPORT AND
COMMUNICATION
Non- formalization of tax
Industry within the
municipality
No proper bus and taxi ranks in Hoedspruit
No access of telecommunication in most rural areas
To formalize the taxi industry
To build multi-modal public transport stop in Hoedspruit
Access of telecommunication by rural communities
10. ENVIRONMENTAL
MANAGEMENT
The municipality experiences
severe environmental
effects/problems
To develop and implement Environmental Management Plan
11. SAFETY AND SECURITY Shortage of police stations in
the municipality
To provide safety and security to all residents by providing adequate facilities and police visibility
To make Maruleng safer tourist destination
12. HOUSING About 4.6% of our population
reside in either informal or
traditional housing
To provide proper shelter to all residents of Maruleng
13. HEALTH AND SOCIAL
WELFARE
There is only one hospital and nine clinics
There is general
To provide comprehensive primary health care services
To render an effective sport and recreational services in the municipality
To make social welfare facilities accessible to community members

IDP 2012/13 Page 110
shortage of sports and recreational facilities
Not enough pay points for social grants
14. EDUCATION There is a serious need for education and skills ad only 6% of the population have tertiary education
Shortage of educational infrastructure
To develop education and training strategy which will be informed by the LED Strategy
To communicate all educational needs and issues to the department of education
15. LAND USE
MANAGEMENT AND
OWNERSHIP
Shortage of land for
development and residential for
low and middle income in
Hoedspruit
To purchase land for development and residential
16. REFUSE REMOVAL AND
WASTE MANAGEMENT
The municipal collects waste in urban areas only
The municipality does not have a land fill site
To render a sustainable, cost effective refuse removal services to domestic as well as businesses in the entire municipal area
To manage waste effectively
To have a licensed land fill site
This Developmental Analysis comprises of the technical analysis and needs. Both provide a proper understanding of the status quo in the municipality. Having
undertaken the various analysis approach to issues (per sector, per social strata etc), the municipality has come to understand the strengths, weaknesses,
opportunities and threats of its own municipal area. The needs and technical issues raised in this Developmental Analysis are critical for the way forward because
they are the foundation on which strategies, projects and implementation are based. In this manner, outputs of the analysis phase serve as inputs for strategy
formulation.

IDP 2012/13 Page 111
DEVELOPMENTAL STRATEGIES
10. INTRODUCTION
Maruleng Local Municipality Integrated Development Plan (IDP) maps the needs of the community and also determines strategies and plans to address the needs
as highlighted by the communities through the process of consultation. This section outlines the vision, objectives and strategies set by the municipality to achieve
its developmental aims. The approach adopted in this section is based on developing a strategic intent which is firmly entrenched in:
Responding to the gap analysis and ensuring a developmental approach and an integrated response
10.1. THE STRATEGIC INTENT OF MARULENG LOCAL MUNICIPALITY
An effective integrated planning review process which included a Strategic Planning session held on the 23rd- 25th November 2011 culminated into the review of
the strategic intent which ultimately is a summary of what the municipality intends to achieve. The foundation established through strategic planning will assist
Maruleng Local Municipality to focus all efforts and actions towards the attainment of the objectives identified, enabling the municipality to live up to the
expectations of their communities.
10.1.1. VISION
A vision is the most ambitious dream for the organisation and as such it provides direction. A vision defines what the organisation hopes to achieve in 5 or 10
years. Maruleng Local Municipality confirmed the already existing vision during the Strategic Planning session to be still steering the municipality as an
organization to its dream.
The vision of Maruleng Local Municipality is:
“To be the powerhouse of socio-economic development through sustainable and integrated agriculture and tourism”
This vision culminates from the following factors: The diverse cultural opportunities within the Maruleng Local Municipality area should be developed into tourist
attractions. The agriculture sector growth, and processing opportunities together with that, motivates the opportunity for even more superseded agricultural sector
growth and processing.
Maruleng Local Municipality’s vision compliments the vision of Mopani District Municipality, which is: “To be the food basket of Southern Africa and tourism
destination of choice” as well as the other municipalities within the District area in order for the District as a whole to succeed.

IDP 2012/13 Page 112
10.1.2. MISSION
A Mission Statement portrays the municipality’s reason for existence; it maps out how the vision of Maruleng Local Municipality as an organization is going to be
achieved.
The mission of Maruleng Local Municipality is:
“Maruleng Local Municipality is committed to the provision of basic services and the promotion of socio-economic development in an integrated and
sustainable manner.”
This mission addresses the objectives of local government section 152 of the constitution and also supports the key provisions of the System Act that is to:
“…provide for the core principles, mechanisms and processes that are necessary to enable municipalities to move progressively towards the social and economic
upliftment of local communities and ensure universal access to essential services that is affordable to all”
10.1.3. SLOGAN
A slogan is a memorable motto or phrase used in a repetitive expression of an idea or purpose. A slogan expresses the uniqueness of an organisation. The
proposed slogan for Maruleng Local Municipality is:
“Wildlife Haven”
This slogan is informed by the fact that the municipality has the largest game/wild farming in the world as part of the municipal area. Many of these game farms
are also situated adjacent to the Kruger National Park and therefore provides access to this renowned international natural resource.
10.1.4. VALUES
The values describe the interrelationship between people within an institution and the interrelationship between them and the people they serve. As such it
describes the business practices applied and the value placed on certain principles. The values Endeavour to reflect the culture that prevails or should prevail in a
specific institution.

IDP 2012/13 Page 113
In the case of a municipality, the ethos focuses on the interrelationships between:
Councillors to Councillors Councillors to Administration Councillors to Community Administration to Administration Administration to Councillors Administration to Community
To put the culture that must prevail in an institution such as a municipality, in perspective, the following must be kept in mind. The public surrenders its rights to
councillors, thereby giving them the authority to represent them. In return the public expects councillors to maintain the services of the municipality.
To render these services councillors need expertise and personnel. The officials of the municipality have this expertise and on behalf of councillors they render
municipal services to the public while being accountable to the council as their employer and the public as their clients.
On the other hand councillors take responsibility for the effectiveness of their employees, while being accountable to the public. Thus councillors and officials are
in a partnership aimed at fulfilling the needs of the public. To make effective service rendering to the public possible, both councillors and officials, towards each
other and within each group, must have a relationship based on mutual trust, respect and accountability.
The relationship between trade unions and officials/councillors has as its primary aim the negotiation of conditions of employment of trade union members.
Councillors are the employers of trade union members. It is very important to remember that councillors and officials derive their powers from the public and as
such are primarily accountable to the public.
Councillors are the custodians/guardians of the public interest and their main mission is the rendering of services to the public and acting in the best interests of
the public.

IDP 2012/13 Page 114
The following values were identified from the interrelationships between Councillors to Councillors, Councillors to Administration, Councillors to Community,
Administration to Administration, Administration to Councillors as well as Administration to Community:
Courtesy
Transparency
Commitment
Trustworthy
Accountability
Reliability
Accessible
Honesty
Respect
Professionalism
People’s behavior is determined by our beliefs, values and attitude and so is the case with an organization like the municipality.
NATIONAL PRIORITY AREAS
Creation of decent work and sustainable livelihoods;
Education;
Health;
Rural development, food security and land reform; and
The fight against crime and corruption

IDP 2012/13 Page 115
10.2 12 NATIONAL OUTCOMES
Improved quality of basic education
Along and healthy life for all South Africans
All people in South Africa feel and are safe
Decent employment through inclusive economic growth
Skilled and capable work force to support inclusive growth path
An efficient, competitive and responsive economic infrastructure network
Vibrant, equitable and sustainable rural communities with food security for all
Sustainable human settlement and improved quality of household life
A responsive, accountable, effective and efficient local government system
Environmental assets and natural resources that are well protected and continually enhanced
Create a better South Africa and contribute to a better and safer Africa and World
An efficient, effective and development oriented public service and empowered, fair and inclusive citizenship

IDP 2012/13 Page 116
MTSF NDP LEGDP MLM Strategic Objectives OUTCOME 9
Strategic Priority 1: Speeding up growth and transforming the economy to create decent work and sustainable livelihoods i.e. expenditure management
Faster economic growth and higher investment and employment
Ensuring more inclusive economic growth, decent work and sustainable livelihoods: to respond appropriately, promptly and effectively so that growth and decent employment as well as improvements in income security are reinforced and the sustainability of investments.
Grow the economy and provide livelihood
Implement the community work programme and cooperatives supported
Strategic Priority 2: Massive programme to build economic and social infrastructure i.e. infrastructure investment programme, public transport infrastructure, low-cost and affordable housing, improving provincial and local government capacity, health, education, library, sporting, recreation.
Strengthening the links between economic and social strategies
Economic and social infrastructure: infrastructure investment programme aimed at expanding and improving social and economic infrastructure in order to increase access, quality and reliability of public services and to support economic activities, while considering environmental sustainability and pursuing maximum employment impact.
Improve community well-being through accelerated service delivery
Improved access to basic services Actions supportive to human settlement outcomes
Strategic priority 3: Comprehensive rural development strategy linked to land and agrarian reform and food security i.e. land reform policies, agricultural production, rural livelihoods and food security, service delivery, rural transport, revitalisation of rural towns, support non-farm economic activities
Redressing the injustices of the past effectively
Rural development, food security and land reform: to develop and implement a comprehensive strategy of rural development that will be aimed at improving the quality of life of rural households, enhancing the country’s food security through a broader base of agricultural production, exploiting the varied economic potential that each region of the country enjoys
Plan for the future Implement a differentiated approach to municipal financing, planning and support
Strategic Priority 4: Strengthen the skills and human resource base i.e. adequate basic services (water, sanitation, electricity to schools; access to facilities such as libraries,
Raising standards of education, a healthy population and effective social protection
Access to quality education: to focus on skills and education system towards the delivery of quality outcomes
Develop and retain skilled and capacitated workforce
Improve administrative capacity

IDP 2012/13 Page 117
classrooms and laboratories.
Strategic Priority 5: Improve the health profile of all South Africans i.e. filling of critical vacant posts, improving the national emergency medical (ambulance) service model, implement Comprehensive Plan for the Treatment, Management and Care of HIV and AIDS
Raising standards of education, a healthy population and effective protection
Improved health care: to transform health system, improve quality of care and public facilities, boast human resources and set up the fight against HIV and AIDS, TB and other communicable diseases, as well as life style and other causes of ill-health and mortality.
Effective and efficient community involvement
Deepen democracy through a refined ward committee model
Strategic Priority 6: Intensify the fight against crime and corruption i.e. fight against crime and corruption in the public and private
Raising standards of education, a healthy population and effective social protection
Fighting crime and corruption: to curb levels of crime and corruption.
Become financial viable Single window of coordination
Strategic Priority 7: Build cohesive, caring and sustainable communities i.e. development and strengthening of community organisations such as school governing bodies, community policing forum, ward committees,
Collaboration between the private and public sector
Cohesive and sustainable communities: the meet the target of halving poverty and unemployment by 2014, and, in conjunction with other priorities, to strengthen human capabilities, promote shared values and social solidarity and strive to reduce overall inequalities.
Effective and efficient community involvement
Strategic Priority 8: Pursuing African advancement and enhanced international co-operation
The active efforts and participation of all South Africans in their own development
Creation of a better Africa and a better world: ensure that foreign relations contribute to the creation of an environment conducive to economic growth and development domestically, within Africa and in other developing countries.
Develop partnerships Single window of coordination
Strategic Priority 9: Sustainable Resource Management and use
The active efforts and participation of all South Africans in their own development
Sustainable Resource Management and use: diversification of the energy mix in pursuit of renewable energy alternatives and the promotion of energy efficiency, enforcing a zero tolerance approach to illegal and unsustainable food
Develop and retain skilled and capacitated workforce
Implement a differentiated approach to municipal financing, planning and support

IDP 2012/13 Page 118
production, and promoting sustainable water use and preserving quality of drinking water
Strategic Priority 10: Building a developmental state including improvement of public services and strengthening democratic institutions i.e. Improving the capacity and efficacy of the state, improving the delivery and quality of public services, entrenching a culture and practice of efficient, transparent, honest and compassionate public service and building partnership with society and strengthening democratic institutions
Raising standards of education, a healthy population and effective social protection
A developmental state, including improvement of public services: Improving the capacity and efficacy of the state, improving the delivery and quality of public services, entrenching a culture and practice of efficient, transparent, honest and compassionate public service and building partnership with society and strengthening democratic institutions.
Develop and retain skilled and capacitated workforce
Improve administrative capacity

IDP 2012/13 Page 119
During the strategizing process, further cognizance was taken of the national guidelines to guide local development. The localised strategic guidelines are an
important element of the strategies phase that determines how development should be undertaken taking into cognizance the relevant policy guidelines and
legislation. The rationale behind the need to develop localised strategic guidelines to ensure that cross cutting dimensions such as the spatial development
principles, local economic development strategies, environmental sustainability and poverty alleviation and gender equity aspects are adequately considered
when strategies and projects are planned. The localised strategic guideline discussed hereunder, outline the way in which the municipality development strategies
and projects consider the national guidelines into consideration the specific conditions in the municipality as indicated in the analysis phase.
10.3. STRATEGY MAP
As part of the Balanced Scorecard methodology a strategy map is used to develop a picture of the strategy of the municipality. It depicts the objectives in support
of the strategy in terms of different perspectives, namely the learning perspective, institutional perspective, the financial and the customer perspective. This step
in strategy formulation acts as the integration of strategy and operational planning. The following are the most important benefits of developing a strategy map:
It focuses on the most important institutional processes that need to be addressed;
It combines a growth strategy as well as a productivity strategy to be sustainable;
It creates a foundation to be innovative;
It focuses on both the tangible as well as intangible
The Strategy Map’s methodology is aimed to steer away from a sectoral approach to ensure integrated development of the needs of the municipality.
The strategy map leads to the development of Scorecards at different levels that will be used as the management tool whereby planning, implementation,
monitoring, review measurement and assessment can be facilitated. This approach aims to ascertain whether the Maruleng Local Municipality has made any
progress towards attainment of its strategies and the objectives as identified. A good strategy map focuses on the strategic logic between cause and effect
relationships and between current activities and long-term success. The revised strategy map is shown in the picture below:
The strategy map identifies the objectives that Maruleng Local Municipality will aim to achieve. The strategy map clearly indicates the two different strategies -
growth and excellence – through the colours used for the different strategic objectives.

IDP 2012/13 Page 120
10.4 STRATEGIC OBJECTIVES
Using the perspectives of the Balanced Scorecard Methodology, the Strategy Map was developed by focusing on the Learning and Growth Perspective as point of
departure:
Develop and retain skilled and capacitated workforce – In order for Maruleng Local Municipality to be able to deliver on its constitutional mandate there is a need to put in place a viable and practical workplace skills plan which will in result in the development of a strategy whereby skilled and capacitated employees will enable the municipality to deliver on their objectives and plans. Critical for the municipality is also to retain those employees who have been trained and capacitated and not to lose them to larger municipalities and other sector departments.
Focusing on the above objectives will enable the Municipalities to have a better equipped and capacitated workforce and thereby improve the institutional
processes:
Plan for the future – In order for the municipality to achieve its vision, it needs to focus on planning to ensure co-ordination of all sector plans to avoid duplication of efforts and conflicting goals. The planning and implementation cycles within the municipality should be seamlessly integrated and efforts should be focused on to more effectively manage information, including the identification and determination of baseline information and smart application of information to achieve results.
Improve community well-being through accelerated service delivery - In order to become an effective and efficient area, urgent attention needs to be paid to the provision of services (as per the constitutional requirements) to improve the accessibility of services to all members within the municipal area.
Build ffective and efficient Organisation – To improve effectiveness and efficiency, standardised policies and procedures need to be established within the municipality. This will lead to open and transparent decision-making and sound governance practices.
Improved effectiveness and efficiency within the municipality will advance the utilisation and allocation of financial resources:
Become financially viable – The municipality needs to improve its financial position to ensure optimal utilisation of financial resources and thereby becoming financially viable to ensure sustainable service delivery to the communities.
Develop partnerships – The municipality will not be able to achieve financial viability on its own. Partnerships will have to be developed with private enterprises, NGO’s and other agencies with a view to increasing its financial viability.
Grow the economy and halve unemployment – As a result of the high unemployment rate within the municipal area, special emphasis should be placed on local economic development and job creation initiatives.

IDP 2012/13 Page 121
The objectives within the three perspectives discussed above, will lead to addressing the strategic objectives on the community satisfaction and well-being
perspective:
Effective and efficient community involvement – The main focus will be on the upliftment of the socio economic status of the communities within the municipal area. Maruleng will work to keep the town one of the safest in the country and to create "an informed, aware and involved community."
10.5. OUTCOMES
The Department of Co-operative Governance and Traditional Affairs (COGTA) has identified outcomes whereby the Strategic Agenda can be implemented and
monitored. Of critical nature for the municipality will be to link its strategic objectives to Outcome 9. The table below provides the detail whereby the strategic
objectives of the municipality can be linked to the six outputs or five Key Performance Areas as stipulated by the Department of Co-operative Governance and
Traditional Affairs (DCOGTA)

DRAFT IDP2013 Page 122
DPLG KPA Outcome 9 Strategic Objectives
Municipal Transformation and Organisational
Development
Implementation of differentiated
approach to planning, financing and
administration.
Administrative and financial
capability
Plan for the future
Develop and retain skilled and capacitated
workforce
Basic Service Delivery Improved access to basic services Improve Community well-being through
accelerated service delivery
LED Community works programme Grow the economy and provide livelihood
Develop partnerships
Municipal Financial Viability and Management Administrative and financial
capability
Become financially viable
Good Governance and Public Participation Deepen democracy through refined
ward committee system
Effective and efficient community involvement
Table 26: DCOGTA Key Performance Areas and Strategic Objectives

DRAFT IDP2013 Page 123
10.6. OPERATIONAL STRATEGIES
Section 26 (1) (g) of the Municipal Systems Act (Act 32 of 200) clearly stipulate that the IDP should also contain the operational strategies of the municipality and
Maruleng has achieved this by linking programmes implemented within the municipality to the KPA’s identified and linked to the Strategic objectives as contained
within the strategy map. Council also must be in a position to measure the impact that the programme intends to achieve and this is indicated by the intended
programme result as shown in the tables below. This result must further be measured to determine and indicate progress towards the outcome and therefore a
column indicating the programme KPI is also included in the table below. The development of a strategy means that the municipality must be able to plan on a
longer term and the strategies should provide an indication on how the municipality intends to achieve the results as shown in the table below.
The operational strategies are represented below in terms of the different KPA’s as mentioned previously, but due to the fact that the Integrated Development Plan
should be implemented within a specific spatial area within the borders of South Africa all of this should be linked to the Spatial Rationale within which planning
takes place.
SPATIAL RATIONALE
STRATEGIC OBJECTIVE: PLAN FOR THE FUTURE
PRIOITY AREA STRATEGIC OBJECTIVES STRATEGIES/ INTERVENTIONS OUTCOMES
Settlement- Scattered Formalization and
demarcation of sites
Liaise with Traditional Leaders for site identification
Liaise with COGHSTA for sites demarcation and
formalization
Formalized sites
Township establishment
Demarcated sites

DRAFT IDP2013 Page 124
PRIOITY AREA STRATEGIC OBJECTIVES STRATEGIES/ INTERVENTIONS OUTCOMES
Land- none availability of land for the
development of low cost housing in
Hoedspruit
Acquisition of land Liaise with Sector Departments to assist in land
acquisition or land release
Negotiate with private land owners
Low cost housing in
Hoedspruit
Integrated human settlement
BASIC SERVICE DELIVERY
STRATEGIC OBJECTIVE: COMMUNITY WELL-BEING THROUGH ACCELERATED SERVICE DELIVERY
1. WATER AND SANITATION
PRIOITY AREA STRATEGIC OBJECTIVES STRATEGIES/ INTERVENTIONS OUTCOMES
Water: Bulk water supply Provide water to all households in
2016
Liaise with Mopani District Municipality to fast-track the
construction of water purification plant
Water per household

DRAFT IDP2013 Page 125
PRIOITY AREA STRATEGIC OBJECTIVES STRATEGIES/ INTERVENTIONS OUTCOMES
Water-ageing infrastructure in Hoedspruit Provide new water infrastructure in
Hoedspruit by 2014
Liaise with Mopani District Municipality to fast-track the
construction of water infrastructure in Hoedspruit
Adequate water supply in
Hoedspruit
Sanitation: ageing sanitation infrastructure
in Hoedspruit and Kampersrus
Provide new sewer system
infrastructure in Hoedspruit and
Kampersrus by 2015
Liaise with Mopani District Municipality to fast-track the
construction of sewer plants in Hoedspruit and Kampersrus
Adequate sewer system in
Hoedspruit and Kampersrus
2. ELECTRICITY
PRIOITY AREA STRATEGIC OBJECTIVES STRATEGIES/ INTERVENTIONS OUTCOMES
Electricity: 2304 h/h do not have
electricity
Provide electricity to 2304 h/h by
2015
Liaise with ESKOM to compete the current units
Municipality to fast-track electrification of households through
INEP grant
Electricity per household

DRAFT IDP2013 Page 126
3. WASTE MANAGEMENT
PRIOITY AREA STRATEGIC OBJECTIVES STRATEGIES/ INTERVENTIONS OUTCOMES
Refuse Removal: 22 804 h/h do not have
access to refuse removal
Provide refuse removal to 4 510
h/h by 2014
Extend refuse removal to households adjacent to the landfill site Refuse removal per household
4. ROADS AND STORM WATER MANAGEMENT
PRIOITY AREA STRATEGIC OBJECTIVES STRATEGIES/ INTERVENTIONS OUTCOMES
Road: gravel to tar roads: 241.41km
road not tarred
Upgrade 60km road from gravel to
tar by 2014
Liaise with RAL to fast-track the upgrading of Tickyline/
Balloon/ Moshate road
Liaise with MDM to complete the upgrading of Metz-
Bismarck and Bochabelo roads
Developed road infrastructure
Road maintenance: poor road
maintenance
To ensure maintenance of roads Liaise with all road- authorities to ensure regular road
maintenance.
Liaise with MISA to assist the municipality to develop
Road Master Plan
Maintained road infrastructure

DRAFT IDP2013 Page 127
5. PUBLIC TRANSPORT
PRIOITY AREA STRATEGIC OBJECTIVES STRATEGIES/ INTERVENTIONS OUTCOMES
Public Transport: some households do
not have access to reliable public
transport
Ensure that households have
access to public transport
Liaise with all public transport stakeholders in order to ensure the
provision of reliable public transportation
Increased access to reliable
public transportation
6. POST ANDTELECOMMUNICATIONS
PRIOITY AREA STRATEGIC OBJECTIVES STRATEGIES/ INTERVENTIONS OUTCOMES
Telecommunications: most poor
households do not have access to
telecommunication services
Ensure that all households have
access to telecommunication
services
Liaise with all telecommunication stakeholders in order to ensure the
provision of communication services
Informed community

DRAFT IDP2013 Page 128
7. FREE BASIC SERVICES
PRIOITY AREA STRATEGIC OBJECTIVES STRATEGIES/ INTERVENTIONS OUTCOMES
FBW: only 2 405 indigent h/h have
access to water
Ensure that all indigent
households have access to FBS
by 2015
Establish backlog of provision of FBS to indigent
households.
Develop strategies on how to deliver FBS to indigent
households.
Improved quality of life for
all community members
FBS: only 3 213 households have access
to free basic sanitation
FBE: only 1 739 have access to FBE
Refuse removal: no indigent households
have access to refuse removal
LOCAL ECONOMIC DEVELOPMENT
STRATEGIC OBJECTIVE: GROW THE ECONOMY AND PROVIDE LIVELIHOOD SUPPORT AND DEVELOP PARTNERSHIPS
PRIOITY AREA STRATEGIC OBJECTIVES STRATEGIES/ INTERVENTIONS OUTCOMES
Job creation: unemployment
Alleviate poverty through LED
projects and initiatives
Develop plans and strategies to ensure local economic
development through agriculture, tourism and enterprise
development
Employment for all economic
active people
Promote: Tourism and agriculture To promote tourism and
agricultural activities
Promote tourism and agriculture and establish partnership Increased employment through
tourism and agricultural
initiatives
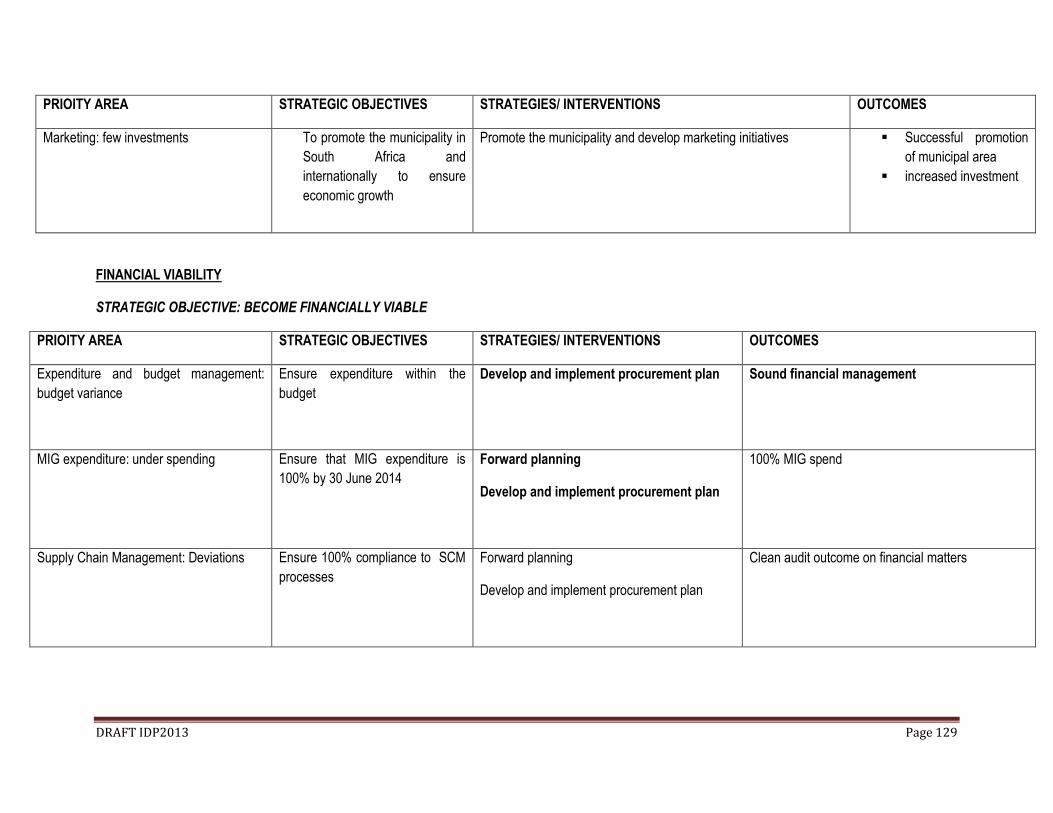
DRAFT IDP2013 Page 129
PRIOITY AREA STRATEGIC OBJECTIVES STRATEGIES/ INTERVENTIONS OUTCOMES
Marketing: few investments To promote the municipality in
South Africa and
internationally to ensure
economic growth
Promote the municipality and develop marketing initiatives Successful promotion
of municipal area
increased investment
FINANCIAL VIABILITY
STRATEGIC OBJECTIVE: BECOME FINANCIALLY VIABLE
PRIOITY AREA STRATEGIC OBJECTIVES STRATEGIES/ INTERVENTIONS OUTCOMES
Expenditure and budget management:
budget variance
Ensure expenditure within the
budget
Develop and implement procurement plan
Sound financial management
MIG expenditure: under spending
Ensure that MIG expenditure is
100% by 30 June 2014
Forward planning
Develop and implement procurement plan
100% MIG spend
Supply Chain Management: Deviations
Ensure 100% compliance to SCM
processes
Forward planning
Develop and implement procurement plan
Clean audit outcome on financial matters

DRAFT IDP2013 Page 130
FINANCIAL VIABILITY
STRATEGIC OBJECTIVE: BECOME FINANCIALLY VIABLE
PRIOITY AREA STRATEGIC OBJECTIVES STRATEGIES/ INTERVENTIONS OUTCOMES
Asset management: none- compliance to
GRAP
Ensure 100% GRAP compliance
Develop and implement asset register
Unbundle assets
100% GRAP compliance
Budget and reporting: 80% compliance to
Budget Process Plan
Ensure 100% compliance to
budget process plan
Adherence to budget process plan
Clean audit
Investment Financial mobilization Implementation of the policy.
Ensure that investment is made with
credible financial institutions
Increased financial resources

DRAFT IDP2013 Page 131
GOOD GOVERNANCE AND PUBLIC PARTICIPATION
STRATEGIC OBJECTIVE: BUILD EFFECTIVE AND EFFICIENT ORGANIZATION
PRIOITY AREA STRATEGIC OBJECTIVES STRATEGIES/ INTERVENTIONS OUTCOMES
Auditing: matters of emphasis
Ensure 0 % on matters of
emphasis
Adherence to Audit and Risk plans
Clean governance
Oversight : Strengthening structures that
provide oversight roles
Ensure that MPAC, Audit, Anti-
corruption and Risk management
committees are strengthened
Establish and provide requisite support to oversight
structures
Clean governance and accountability
STRATEGIC OBJECTIVE: EFFECTIVE AND EFFICIENT COMMUNITY INVOLVEMENT AND IMPROVE INTER-GOVERNMENTAL FUNCTION
PRIOITY AREA STRATEGIC OBJECTIVES STRATEGIES/ INTERVENTIONS OUTCOMES
Public participation and Ward Committees To facilitate structured participation
in Council participation
Development of public participation
program/strategy
Effective community participation
IGR: ineffective Local Managers Forum
To establish and develop sound
inter-governmental relations
Development of corporate Inter-governmental
calendar
Good governance and sustainable partnership
Information Technology Ensure integrated risk IT managed
environment
Develop and implement IT plans and programmes Effective IT systems

DRAFT IDP2013 Page 132
MUNICIPAL TRANSFORMATION AND ORGANISATIONAL DEVELOPMENT
STRATEGIC OBJECTIVE: PLAN FOR THE FUTURE
PRIOITY AREA STRATEGIC OBJECTIVES STRATEGIES/ INTERVENTIONS OUTCOMES
Planning and development : no effective
implementation and monitoring
Ensure planning and development
is done according to SDF
Adherence to IDP process plan
Continuous IDP monitoring through PMS
Credible IDP
STRATEGIC OBJECTIVE: DEVELOP AND RETAIN SKILLED AND CAPACITATED WORKFORCE
PRIOITY AREA STRATEGIC OBJECTIVES STRATEGIES/ INTERVENTIONS OUTCOMES
Human resource management:
demoralized and unfocused workforce
Ensure focused and disciplined
workforce
Encouraged accountability and
responsibility.
Develop change and diversity programme
Focused and disciplined workforce
Human resource management: Filling of
S54 & 56 Positions
Ensure that all S54 & 56 Positions
are filled
Filling of S54 & 56 positions with 3 months Effective and efficient governance
Capacity building and training : 60%
capacitated workforce
Ensure skilled and capacitated
workforce
Conduct skills and competency profile.
Develop training programmes
Skilled workforce

DRAFT IDP2013 Page 133
PRIOITY AREA STRATEGIC OBJECTIVES STRATEGIES/ INTERVENTIONS OUTCOMES
Employment Equity Ensure compliance to EEP Appoint people from equity group to three highest
level in terms of equity targets
Representative
PMS To promote accountability and
compliance
Conduct regular reporting and assessment Competent and accountable workforce
STRATEGIC OBJECTIVE: DEVELOP AND RETAIN SKILLED AND CAPACITATED WORKFORCE
PRIOITY AREA STRATEGIC OBJECTIVES STRATEGIES/ INTERVENTIONS OUTCOMES
Occupational Health Safety To ensure safe working
environment
Develop and implement OHS programme Healthy and safer working environment
Administration; payroll management Ensure effective record keeping
and data collection
Capture all leaves, bonus and wages by the 20th of
every month
Improved record keeping and data collection
Labour Relations Ensure sound labour relations Functional and effective Local Labour Forum Sound labour relations
Legal Services: contracts management Ensure that the municipality has
SLA with all service providers
Conclude SLA with all service providers within 14
days
Effective and efficient organization

DRAFT IDP2013 Page 134
SPECIAL PROGRAMMES OF COUNCIL
PRIOITY AREA STRATEGIC OBJECTIVES STRATEGIES/ INTERVENTIONS OUTCOMES
Youth Development Ensure the participation of youth in
government initiatives
Functional Youth Council Increased participation by youth in municipal
initiatives and mainstream programmes
Disability Development Ensure the participation of people
with disabilities in government
initiatives
Functional Disability Desk and forums Improved quality of life for people with disability
Gender Development To ensure that gender equality is
promoted through government
initiatives
Functional Gender and women forums Increased gender equality
Programme for the Elderly Ensure that elderly people are
taken care
Support and promotion of elderly programmes Improved lifespan of the elderly

DRAFT IDP2013 Page 135
SOCIAL SERVICES
PRIOITY AREA STRATEGIC OBJECTIVES STRATEGIES/ INTERVENTIONS OUTCOMES
Housing: 1050 h/h do not have houses Ensure the provision of RDP
housing to 1050 households
Liaise with COGHSTA to provide RDP housing to the 1050
households
All households live in at least RDP
standard of housing
Sports, Arts and Culture To ensure provision of SAC
amenities and participation thereof
Develop SAC programmes
Liaise with Department of SAC in coordination of
programmes
Mental and physical fit community
members
Education: classroom backlogs Ensure the provision of
educational facilities
Liaise with the Department of Education to provide requisite
educational facilities
Educated nation
Safety and security: rate of crime Ensure the safety of the
community and visitors
Liaise with the Department of Safety and security to provide
personnel and facilities
Safer nation
Health Services Ensure accessible and affordable
health services
Liaise with the Department of Health to provide health
services
Healthy nation
Social Development Services Ensure accessibility of social
development services
Liaise with the Department of Social Development to
provide health services
A caring nation

DRAFT IDP2013 Page 136
DISASTER MANAGEMENT
PRIOITY AREA STRATEGIC OBJECTIVES STRATEGIES/ INTERVENTIONS OUTCOMES
Disaster Management: Disaster
Risks
To prevent loss of life lives and
infrastructure damages due to
disasters
Implementation of Disaster Risk Management
Strategy
Liaise with relevant stakeholders in order to
mitigate disaster risks
Safe and secure society

DRAFT IDP2013 Page 137
11. PROJECT PHASE
This phase involves the design and specifications of projects identified in the strategy phase by proving clear target to measure performance and impact of the
project , timeframe, responsible agent to manage the project , cost implication of the project and the who will be funding the projects
11.1 SPATIAL RATIONALE
PRIORITY ISSUES: SDF, Sites demarcation and formalization, LUMS and GIS
PROJECT NAME PROJECT LOCATION MEDIUM TERM EXPENDITURE FRAME WORK IMPLEMENTING AGENT
2013/2014 2014/2015 2015/2016
Review of SDF Maruleng municipal area COGHSTA
Site demarcation COGHSTA
Formalization of sites COGHSTA
Update of LUMS Maruleng municipal area OPEX OPEX OPEX Maruleng municipality
Update of GIS Maruleng municipal area Maruleng municipality

DRAFT IDP2013 Page 138
11.2 BASIC SERVICE AND INFRASTRUCTURAL DEVELOPMENT
Priority Issues: Water & Sanitation
PROJECT PROJECT LOCATION MEDIUM TERM EXPENDITURE FRAMEWORK IMPLEMENTING AGENT
2013/2014 2014/2015 2015/2016
Hoedspruit bulk water
supply
Hoedspruit
(2149hh)
25,000,000 - - Mopani District Municipality
Upgrading of water
reticulation and
extension
Maruleng municipal area
(33 villages)
25,000.000 - - Mopani District Municipality
Kampersrus sewage
plant
Kampersrus
(1700 hh)
30,000,000 - - Mopani District Municipality
Kampersrus bulk
water supply
kamperarus
(2256 hh)
3,500,000 - - Mopani District Municipality
Bulk purchase of
water
Municipal Area 1,100,405 1,155,425 - Mopani District Municipality

DRAFT IDP2013 Page 139
PRIORIUTY ISSUES: Roads, storm water & bridges
PROJECT NAME PROJECT
LOCATION
MEDIUM TERM EXPENDITURE FRAMEWORK IMPLEMENTING AGENT
2013/2014 2014/2015 2015/2016
Rita/Tickeyline to Burgersdorp
to Julesburg/Rhulani to Hoveni
to Balloon to Sekororo
(gravel to tar:38km)
Balloon-Moshate RAL
Bridge construction Kampersus/
Klaseria road
RAL
Bochabelo Road Bochabelo MDM
Hlohlokwe access ring road Hlohlokwe 6,600,000 Maruleng municipality
Turkey 03-04 ring road Turkey 03-04 5,500,000 Maruleng municipality
Turkey 02 access road Turkey 02 400,000 Maruleng municipality
Metz internal streets Metz 6,600,000 Maruleng municipality

DRAFT IDP2013 Page 140
PRIORITY ISSUES: Roads, storm water & bridges)
PROJECT PROJECT
LOCATION
MEDIUM TERM EXPENDITURE FRAMEWORK IMPLEMENTING AGENT
2013/2014 2014/2015 2015/2016
Metz- Bismarck road Metz-Bismarck 7 100 000 0.00 0.00 MDM
Rehabilitation of
Hoedspruit main streets
Hoedspruit 750,000 0.00 0.00 Maruleng municipality
Maruleng low level
bridges
Maruleng
municipal area
3,000,000 0.00 0.00 Maruleng municipality
Lorraine storm water
management
Lorraine 266,280.54 0.00 0.00 Maruleng municipality

DRAFT IDP2013 Page 141
Priority Issues: Maintenance and repairs
PROJECT PROJECT LOCATION MEDIUM TERM EXPENDITURE FRAMEWORK IMPLEMENTING AGENT
2013/2014 2014/2015 2015/2016
Rehabilitation of the
main offices
Hoedspruit
1,500,000 0.00 0.00 Maruleng municipality
Traffic station Hoedspruit 1,135,000 0.00 0.00 Maruleng municipality
Roads & bridges Maruleng municipal area 210,600 220,919 231,744 Maruleng municipality
Buildings Maruleng municipal area 315,900 331,379 347,616 Maruleng municipality
Parks & gardens Maruleng municipal area 105,300 110,459 115,872 Maruleng municipality
Street lighting Maruleng municipal area 150,000 157,350 165,060 Maruleng municipality
Machines (Grade,TLB &
Truck
Maruleng municipal area 526,500 552,298 579,361 Maruleng municipality
Mopani Roads
Maintenance
Maruleng municipal area 1,000,000 - - Mopani District Municipaliy

DRAFT IDP2013 Page 142
Priority Issue: Electricity.
PROJECT PROJECT
LOCATION
MEDIUM TERM EXPENDITURE FRAMEWORK IMPLEMENTING AGENT
2013/2014 2014/2015 2015/2016
Households
electrification
Makgaung- 20
Sofaya -21
Worcester -40
Willows -60
Sedawa - 34
(175 units)
2,362,500 - -. ESKOM
Metz
Electrification
Metz 5,000,000 - -. MDM
FBE Maruleng municipal
area
631,800. 662,758 695,233 Maruleng municipality

DRAFT IDP2013 Page 143
Priority Issue: Waste management
PROJECT PROJECT
LOCATION
MEDIUM TERM EXPENDITURE FRAMEWORK IMPLEMENTING AGENT
2013/2014 2014/2015 2015/2016
Rehabilitation of
Kampersrus
landfill site
Kampersrus 2,000,000 2,098,000 2,200,802 Maruleng Municipality
Refuse removal Maruleng
municipal area
2,316,600 2,430,113 2,549,188 Maruleng Municipality
Mopani buy-back
recycling centre
Maruleng
municipal area
DEAT
Priority Issues: Recreation & other facilities
PROJECT PROJECT
LOCATION
MEDIUM TERM EXPENDITURE FRAMEWORK IMPLEMENTING AGENT
2013/2014 2014/2015 2015/2016
Willows sports field The Willows 3,397,000 1,500,000 500,000 Maruleng Municipality
Maruleng indoor sports
centre
Show ground 6,063,719.46 3,144.543 4,811,818 Maruleng Municipality
Bochabelo community hall Bochabelo 250,000 2,956,818 Maruleng Municipality
Butswana community hall Butswana 250,000 2,956,818 Maruleng Municipality

DRAFT IDP2013 Page 144
Moshate community hall Moshate 0.00 3,800,000 Maruleng Municipality
Turkey 3 community hall Turkey 3 250,000 2,956,818 Maruleng Municipality
Fencing of cemeteries Maruleng
municipal area
1,233,000 1,500,000 1,500,000 Maruleng Municipality
Priority Issues: Other facilities
PROJECT PROJECT
LOCATION
MEDIUM TERM EXPENDITURE FRAMEWORK IMPLEMENTING AGENT
2013/2014 2014/2015 2015/2016
Office furniture Municipality
Offices
450,000 472,050 495,180 Maruleng Municipality
Soft Ware Municipality
Offices
200,000 209,800 220,080 Maruleng Municipality
Server Upgrade Municipality
Offices
800,000 0.00 0.00 Maruleng Municipality
Server room upgrade Municipality
Offices
150,000 157,350 165,060 Maruleng Municipality
Vehicles Municipality
Offices
800,000 800,000 1,200,000 Maruleng Municipality
Two-way radios Municipality
Offices
150,000 157,350 165,060 Maruleng Municipality
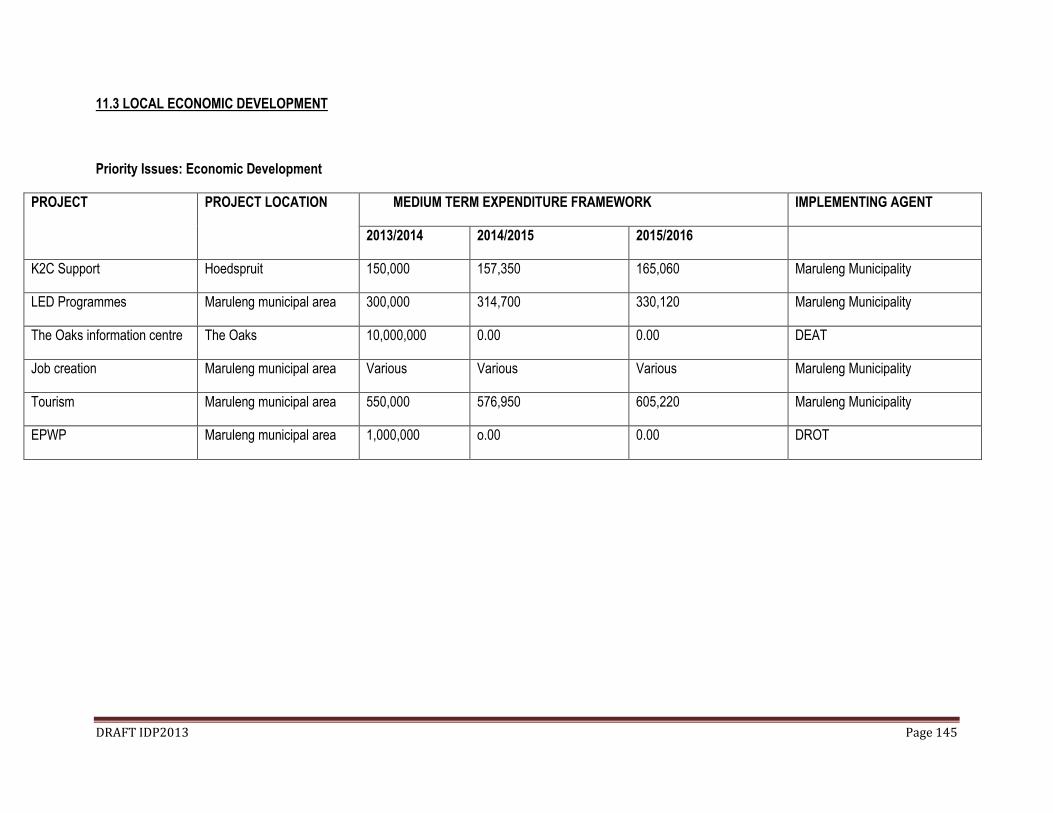
DRAFT IDP2013 Page 145
11.3 LOCAL ECONOMIC DEVELOPMENT
Priority Issues: Economic Development
PROJECT PROJECT LOCATION MEDIUM TERM EXPENDITURE FRAMEWORK IMPLEMENTING AGENT
2013/2014 2014/2015 2015/2016
K2C Support Hoedspruit 150,000 157,350 165,060 Maruleng Municipality
LED Programmes Maruleng municipal area 300,000 314,700 330,120 Maruleng Municipality
The Oaks information centre The Oaks 10,000,000 0.00 0.00 DEAT
Job creation Maruleng municipal area Various Various Various Maruleng Municipality
Tourism Maruleng municipal area 550,000 576,950 605,220 Maruleng Municipality
EPWP Maruleng municipal area 1,000,000 o.00 0.00 DROT

DRAFT IDP2013 Page 146
Priority Issues: Economic Development
PROJECT PROJECT
LOCATION
MEDIUM TERM EXPENDITURE FRAMEWORK IMPLEMENTING AGENT
2013/2014 2014/2015 2015/2016
Market stalls Hoedspruit 250,000 0.00 0.00 Maruleng Municipality
Signage and Branding Hoedspruit 600,000 0.00 0.00 Maruleng Municipality
Sedawa Women Cooperative
Empowerment
Sedawa 100,000 30,000 0.00 MDM
Shopping complex Metz Private Private Private Private

DRAFT IDP2013 Page 147
11.4. FINANCIAL VIABILITY
Priority Issues: Financial Management
PROJECT PROJECT
LOCATION
MEDIUM TERM EXPENDITURE FRAMEWORK IMPLEMENTING AGENT
2013/2014 2014/2015 2015/2016
Updating financial
management systems
Maruleng
municipal area
Treasury
Supplementary valuation
roll (2012/2013)
Maruleng
municipal area
OPEX OPEX OPEX Maruleng Municipality
Revenue enhancement Maruleng
municipal area
OPEX OPEX OPEX Maruleng Municipality
Asset & inventory
management
Maruleng
municipal area
OPEX OPEX OPEX Maruleng Municipality
MFMA implementation Maruleng
municipal area
OPEX OPEX OPEX Maruleng Municipality
Supply chain management Maruleng
municipal area
OPEX OPEX OPEX Maruleng Municipality
MIG Expenditure Maruleng
municipal area
28,647,00.00 25,320,000 26,578,000 Maruleng Municipality
Fleet management Maruleng
municipal area
OPEX OPEX OPEX Maruleng Municipality

DRAFT IDP2013 Page 148
11.5 GOOD GOVERNANCE AND PUBLIC PARTICIPATION
Priority Issues: Governance and Public Participation
PROJECT PROJECT LOCATION MEDIUM TERM EXPENDITURE FRAMEWORK IMPLEMENTING
AGENT
2013/2014 2014/2015 2015/2016
Communication Maruleng municipal area 52,650.00 55,2229.85 57,936.11 Maruleng Municipality
External auditing Maruleng municipal area 1,800,000 1,888,200 1,980,721 Maruleng Municipality
Internal auditing Maruleng municipal area 430,000 451,070 473,172 Maruleng Municipality
Publication & Newspapers Maruleng municipal area 157,950.00 165,689 173,808 Maruleng Municipality
Functions (Events & protocol) Maruleng municipal area 2,357,081.53 2,472,578 2,593,734 Maruleng Municipality
Ward committees support Maruleng municipal area 1,969,110.00 2,065,596 2,166,810 Maruleng Municipality
Mayoral bursary fund Maruleng municipal area 368,550.00 386,608 405,552 Maruleng Municipality
Council function & support Maruleng municipal area OPEX OPEX OPEX Maruleng Municipality
Local Managers Forum Maruleng municipal area OPEX OPEX OPEX Maruleng Municipality
Traditional Leaders Allowance Maruleng municipal area 10,530.00 11,045.00 11,587.22 Maruleng Municipality

DRAFT IDP2013 Page 149
Disaster Risk Management
PROJECT PROJECT
LOCATION
MEDIUM TERM EXPENDITURE FRAMEWORK IMPLEMENTING AGENT
2013/2014 2014/2015 2015/2016
Disaster Risk
Management
(DRM) awareness
campaigns
Maruleng
municipal area
450,000.00 472,050 495,180 Maruleng Municipality
Review of the
DRM Plan
Maruleng Municipality
DRM strategic
planning session
Maruleng Municipality

DRAFT IDP2013 Page 150
11.6 MUNICIPAL TRANSFORMATION AND ORGANIZATIONAL DEVELOPMENT
PROJECT PROJECT LOCATION MEDIUM TERM EXPENDITURE FRAMEWORK IMPLEMENTING AGENT
2013/2014 2014/2015 2015/2016
IDP Review Maruleng municipal area 200,000.00 209,800 220,080 Maruleng Municipality
IDP/PMS strategic planning
session
Maruleng municipal area 200,070.00 209,873 220,157 Maruleng Municipality
PMS Maruleng municipal area OPEX OPEX OPEX Maruleng Municipality
Policy development, by-laws &
reviews
Maruleng municipal area OPEX OPEX OPEX Maruleng Municipality
IT programmes & support Maruleng municipal area 347,490.00 364,517.01 Maruleng Municipality
HR management Maruleng municipal area OPEX OPEX OPEX Maruleng Municipality
Legal services Maruleng municipal area 150,000 157,350 165,060 Maruleng Municipality
Skills Development Maruleng municipal area 479,998.93 503,983 528,678 Maruleng Municipality
OHS Maruleng municipal area 126,360.00 132,551 139,046 Maruleng Municipality
Administration: Payroll
Management
Maruleng municipal area 37,889,013.43 44,889,034 46,768,980 Maruleng Municipality
Labour Relations Maruleng municipal area OPEX OPEX OPEX Maruleng Municipality

DRAFT IDP2013 Page 151
COUNCIL SPECIAL PROGRAMMES
Priority Issues: Special Programmes
PROJECT PROJECT LOCATION MEDIUM TERM EXPENDITURE FRAMEWORK IMPLEMENTING AGENT
2013/2014 2014/2015 2015/2016
Women’s day Maruleng municipal area 70,000 80,000 80,000 Maruleng Municipality
Elderly Maruleng municipal area 120,000 140,000 140,000 Maruleng Municipality
16 Days of activism Maruleng municipal area 70,000 80,000 80,000 Maruleng Municipality
HIV/AIDS programmes Maruleng municipal area 220,000 240,000 240,000 Maruleng Municipality
SAWID Maruleng municipal area 70,000 80,000 80,000 Maruleng Municipality
Christmas party Maruleng municipal area 120,000 140,000 140,000 Maruleng Municipality
Gender Programme Maruleng municipal area 70,000 80,000 80,000 Maruleng Municipality
Disability month Maruleng municipal area 120,000 140,000 140,000 Maruleng Municipality
Women month’s programme Maruleng municipal area 100,000 120,000 120,000 Maruleng Municipality
New born baby Maruleng municipal area 15,000 20,000 20,000 Maruleng Municipality
Awards to best performing
schools
Maruleng municipal area
120,000 140,000 140,000
Maruleng Municipality
Maruleng youth programme Maruleng municipal area 520,000 550,000 570,000 Maruleng Municipality
Greening Maruleng municipal area 220,000 240,000 260,000 Maruleng Municipality

DRAFT IDP2013 Page 152
11.7 SOCIAL SERVICES
Priority Issues: Municipality Social Services Support Programmes
PROJECT PROJECT LOCATION MEDIUM TERM EXPENDITURE FRAMEWORK IMPLEMENTING AGENT
2013/2014 2014/2015 2015/2016
Arts & culture support
programmes
Maruleng municipal area
120,000 140,000 160,000
Maruleng Municipality
Children rights council Maruleng municipal area 70,000 90,000 110,000 Maruleng Municipality
Education summit Maruleng municipal area 120,000 140,000 160,000 Maruleng Municipality
Educational Awareness
campaign on waste
Management
Maruleng municipal area
70,000 80,00 90,000
Maruleng Municipality
Mayoral Sports
tournament
Maruleng municipal area
320,000 350,000 380,000
Maruleng Municipality
Career guidance Maruleng municipal area 120,000 140,000 160,000 Maruleng Municipality
Golden Games(aged) Maruleng municipal area 100,000 110,000 120,000 MDM

DRAFT IDP2013 Page 153
12: FINANCIAL PLAN AND SDBIP
12.1. FINANCIAL PLAN
The Maruleng budget is MFMA complaint but the municipality needs to address its financial challenges on the following basis:
Ensuring that the systems introduced continuously improved during the year
Preserving the municipality’s cash flow position
Introducing efficiency measures to provide resources to ensure value for money for taxpayers.
Further enhancing public participation in the next budget cycle
Continuing to improve on information provided to decision makers
Ensuring that growth in services is more closely aligned with citizen’s expectations

DRAFT IDP2013 Page 154
The tables below give comparative analysis of the previous MEF Cycle, current year as well as the next Cycle in terms of:
Financial Performance Revenue and Expenditure by Source Capital Expenditure Revenue and Expenditure by Municipal Vote Capital Expenditure Program per Vote

DRAFT IDP2013 Page 155
SCHEDULE 1
Budget Year 2012/13
Budget Year +1 Budget Year +2 Budget Year +3
2013/14 2014/15 2015/16
REVENUE BY SOURCE Approved Budget Adjusted Budget Budget Budget Budget
R'000 R'000 R'000 R'000 R'000
B C E F F
Operating Revenue by Source
Property rates 12,000,000 12,000,000 12,612,000 13,229,998 13,878,257
Service charges - refuse removal from tariff billings 2,207,722.72 2,208,000 2,320,608 2,434,317.79 2,553,599
Service charges – clearance certificates 61,239.85 62,000 65,162 68,354.94 71,704
Service charges - library 4,366.26 2,500 2,627.50 2,756.25 2,891.30
Service charges – building plans 285,743.09 290,000 304,790.00 319,724.71 335,391.22
Service charges –town planning fees 22,914.64 30,000 31,530.00 33,074.97 34,695.64
Rental of facilities and equipments 310,120.32 296,600.00 311,726.60 327,001.20 343,024.26
Interest earned-external investments 750,000 800,000.00 840,800.00 881,999.20 925,217.16
Interest earned - outstanding debtors 107,400.00 107,400.00 112,887.40 118,408.39 124,210.40
Income from sale of Transnet houses 3,575,000.00 1,500,000.00 2,075,000.00 - -

DRAFT IDP2013 Page 156
Traffic motor licensing (80%) 7,481,850.62 6,000,000.00 6,306,000.00 6,614,994.00 6,939,128.71
Traffic learners - 3,000,000.00 3,153,000.00 3,307,497.00 3,469,564.35
Tender documents 127,080.00 150,000.00 157,650.00 165,374.85 173,478.22
SETA Training Refund 173,466.24 150,000.00 157,650.00 165,374.85 173,478.22
VAT refunds 3,500,000.00 3,500,000.00 3,678,500.00 3,858,746.50 4,047,825.08
Rental sign boards 37,809.48 37,809.48 39,737.26 41,684.38 43,726.92
Insurance refund 2,700,000.00 409,246.31 - - -
Income from accumulated funds 13,000,000.00 9,550,000.00 7,680,000.00 5,359,900.00 2,000,000
Government grants & subsidies 91,987,000.00 95,157,756.83 105,207,000.00 99,082,000.00 122,360,000
Traffic fines 139,444.88 200,000.00 210,200.00 220,499.80 231,304.29
Mopani - operation and maintenance 1,841,006.07 41,300.00 114,661.60 120,738.66
Total Revenue By Source 140,312,155.16 135,492,612.14 145,381,520.36 136,352,435.50 132,286,435.12

DRAFT IDP2013 Page 157
BREAK DOWN OF GOVERNMENT GRANTS
2013/14 2014/15 2015/16
EQUITABLE SHARE 57,977,000.00 62,712,000.00 92,865,000
FMG GRANT 1,500,000.00 1,750,000.00 1,950,000
MISG GRANT 900,000.00 890,000.00 967,000
MIG GRANT 28,647,000.00 25,000,000 26,578,000
EPWP 1,000,000.00 - -
NATIONAL DISASTER FUND 3,000,000.00 - -
TOTAL GRANTS 92,144,000 90,352,000 122,360,000

DRAFT IDP2013 Page 158
EXPENDITURE PER VOTE
VOTE 2013/14 2014/15 2015/16
SALARIES AND WAGES:STAFF AND MANAGEMENT 37,889,013.43 40,351,917.13 42,530,796.47
SALARIES AND WAGES:COUNCILLORS 9,051,349.65 9,503,917.13 10,017,128.66
REPAIRS AND MAINTENANCE 2,017,485.00 1,788,492.67 1,874,413.81
GENERAL EXPENSES 44,094,082.28 46,940,441.16 49,240,522.78
CAPITAL EXPENDITURE: OWN REVENUE 11,815,490 5,160,785 5,629,913
CAPITAL EXPENDITURE: MIG 28,647,000.00 25,000,000 26,578,000
TOTAL 145,381,520.36 136,352,435.50 132,286,435.12

DRAFT IDP2013 Page 159
13: INTEGRATION
INTRODUCTION
THE MAJOR OUT OF THIS SECTION IS INTEGRATION OF PLANS AND PROGRAMMES:
13.1. OVERVIEW OF THE SECTOR PLANS
13.2. AN INTEGRATED SPATIAL DEVELOPMENT FRAMEWORK
1. Legislative Imperative.
Municipal Systems Act, 32 of 2000) requires a municipality to compile a Spatial Development Framework (SDF) for its area of jurisdiction to serve as a core
component of its IDP.
In addition to the aforementioned Act, the formulation of a SDF for a municipal area is also guided by the following:
Municipal Planning and Performance Management Regulations,2001
White Paper on Spatial Planning and Land Use Management,2001
The Municipal SDF together with the IDP must:
Give effect to the principles contained in chapter 1 of the Development Facilitation Act,1995
Set out objectives that reflect that desired spatial form of the municipality
Contain strategies and policies regarding the manner in which to achieve the objectives referred to, which strategies and policies must:
Indicate the desired patterns of land use within the municipality

DRAFT IDP2013 Page 160
Address the spatial reconstruction of the location and nature of development within the municipality
Provide strategic guidance in respect of the location and nature of development within the municipality
Set out basic guidelines for a land-use management system in the municipality
Set out a capital investment framework for the municipal’s development programs
Contain a strategic assessment of the environmental impact of the spatial development framework
Identify programs and projects for the development of land within the municipality
Be aligned with the spatial development frameworks reflected in the integrated development plans of neighbouring municipalities, and etc.
2. Executive Summary of Maruleng SDF
The SDF for the municipality, which forms part of Mopani District Municipality in the Limpopo Province, which was adopted by council in one of its sitting in
January 2008, focuses on the spatial dimensions of development in Maruleng and, as such, is a core component of the municipal IDP. The SDF seeks to create a
spatial environment that supports economic growth and development to the benefit of the people of Maruleng.
The analysis of development in Maruleng revealed that most people are poor, with at least half unemployed. They live in rural villages in which the level of
economic activity is low with most people being dependent on subsistence living. Places of employment are generally far from the villages, where more than
ninety percent of the people live. While the situation is improving, many residents have limited or no access to basic services. (Attached as annexure J.1)
Tourism and agriculture are cornerstones of the Maruleng economy. Hoedspruit is the only urban node of note, with growth of the town driven by tourism.
Maruleng is blessed with tremendous natural assets, including rivers and mountain areas, an abundance of wildlife, and areas of great natural beauty. Maruleng
contains a large part of the most extensive area of private game reserves on earth, making it an international tourist destination. The world famous Kruger National
Park is situated to the east of Maruleng and the SDF include the following:
Intensification and expansion of the provincial growth node at Hoedspruit
Establishment of a municipal development corridor linking the rural villages (The Oaks-Metz-Trichardsdal development corridor)
Development of a municipal growth node at Metz Central
Concentration of economic activity at a strategic location within each village
Establishment of Drakensberg Environmental Zone (K2C Biosphere)
Extensive land areas devoted to agriculture, which include agricultural processing facilities and areas devoted to game reserve.

DRAFT IDP2013 Page 161
13.3. LAND USE MANAGEMENT SYSTEM
13.3.1. BACKGROUND
The Council at its sitting of the 2008 adopted the Land Use Management Scheme which determines and regulates the use and development of land in the
municipal area in accordance with the Town-planning and Township Ordinance, 1986 (Ordinance No. 15 of 1986) and is a component of land use management.
13.3.2. PURPOSE
Land Use Management Scheme enables the municipality to enforce SDF
LUMS is an implementation tool of the Spatial Development Framework
13.3.3. COMPONENTS OF LUMS
In the LUMS contains the following important components:
General conditions applicable to all properties
Interpretation of use zones and use of land and buildings
Specific conditions and development criteria applicable to use zones
Special, written and temporary consent of the local municipality, and
Application of scheme and powers of the local municipality. (attached as annexure J.2)

DRAFT IDP2013 Page 162
3.4. LOCAL ECONOMIC DEVELOPMENT (LED) STRATEGY
The Department of Local Government and Housing appointed Econ Logic Consultants to develop Local Economic Development Strategy for the Municipality. The
LED is a component of the Municipality’s overall strategic plan as outlined in the IDP process. The strategy provides the municipality with guidelines to create and
facilitate economic development, realise the underlying economic development potential, and encourage private sector investment and job creation. The LED
Strategy has been recently adopted by Council.
Certain development constraints in the municipality include inter alia lack of education and skills, poverty, lack of infrastructure, lack of municipal capacity access
to funding etc. These constraints need to be addressed to ensure sustainable economic growth and development in Maruleng municipality.
However, numerous opportunities exist in the municipality. Agriculture inputs and outputs create opportunities in the manufacturing and processing sector.
Furthermore the tourism (natural beauty) and small-scale mining also provide opportunities.
The Strategy identifies 12 short- term and 16 longer-term thrusts, which are to form focus of the Municipality’s LED effort over the next 10 years.
The emphasis in the next 3 years should be on the 12 short-term thrusts. These include:
i. Define Maruleng as a place of global leadership in sustainable development, and showcase the advantages of addressing human and ecological needs simultaneously
ii. Redress the space economy through increased affordable housing in Hoedspruit, greater competition in and between the taxi and bus sectors, improved road infrastructure and, in the long term, rail networks and services
iii. Focus on the socio-economic returns on the infrastructure spend by creating greater awareness of the mechanisms by which infrastructure leads to LED and by consulting communities and businesses prior to infrastructure roll-outs.
iv. Develop enterprise support skills within the municipality so as to better assist emerging businesses, and more effectively engage the private sector. Enterprise support involves a process rather than a once-off transfer of funds. Central to this process is the securing of markets for goods and services
v. Support growth and employment in the agricultural sector as means of protecting employment and generating export revenue. vi. Promote the tourism sector and facilitate better linkages between tourism lodges and local economy
vii. Proactively manage land reform so as to prevent a rural catastrophe and an economic liability that will burden the municipality. viii. Implement the National Water Act so as to ensure a more rational distribution of the scarce water resources, and to use water as a development
tool ix. Support higher economic multipliers on sector salaries by facilitating local transactions and encouraging gender equity in public sector
employment x. Enter the knowledge economy by way of long-term and co-ordinated innovative partnerships with universities and agencies, so as to ensure that
knowledge products and the use of technology reflect local capacity and needs

DRAFT IDP2013 Page 163
xi. Establish a municipality-wide socio-economic monitoring and evaluation system so as to ensure better use of available resources and to hold offices to account
Long- term thrusts involve more complex issues which are:
i. Increasing private tenure to allow more of the population to benefit from property price rises ii. Highlighting important social choices between modernity and traditionalism iii. Establishing new rail networks and services iv. Providing and international customs point at East gate Airport v. Developing a sustainable development strategy vi. Controlling diseases(attached as annexure J.3)
13.5. INTEGRATED WASTE MANAGEMENT STRATEGIC PLAN
1. Overall aims and goals
The Integrated Waste Management Plan was developed so that the municipality is able to provide services on waste management to all households and
businesses in its municipal area. The IWMP provides universal services, cost effectiveness, reduce the negative impact of waste on human health and the
environment, maximize job creation and create opportunity to promote Broad-Based Black Economic Empowerment.
2. Collection
The municipality provides waste collection services in three urbanised areas: Hoedspruit, Kampersrus and Drakensig for a total of 660 households. This accounts
for collection from about 3% of households. In both commercial and residential areas collection takes place once a week. No refuse removal is provided in the 29
villages. These households rely mostly on backyard dumping, burial and burning. These practices adversely impact on human health and the environment.
Burning waste is not acceptable under National Policy, Legislation and Regulations.
3. Transporting waste
The municipality has outsourced collection and transportation. The municipality provides a collection service only for garden waste. Waste is removed from
households and businesses in Hoedspruit and Kampersrus directly to the disposal site.
DRAFT IDP2013 Page 164
4. Recycling
A recycling company from Phalaborwa collects materials from a recycling collection point at the gate of the Timbavati Game Reserve. No recycling companies
were identified that are based in Maruleng.
5. Disposal
All collected waste is disposed at the Hoedspruit disposal site. Currently the municipality does not a licensed landfill site. (Attached as annexure J.4)
13.6. AN INTEGRATED HIV/AIDS POLICY
1. Background
Municipalities have a constitutional mandate to promote safe and healthy environment. But during the past decades, there has been an exponential growth in the
number of HIV/AIDS infections in South Africa. This growth has been accompanied by greater visibility of the epidemic, especially owing to increased number of
AIDS deaths. Mopani District Municipality has the highest HIV/ AIDS prevalence which has resulted in the increase of child-headed families without any source of
income and Maruleng Municipality is no exception as the HIV prevalence rate has sharply increased from 1996 to 2000 and it stands at 27%.
The contributory factors for high prevalence of HIV/AIDS and related diseases amongst others are:
Poverty, gender inequality and orphanage
Rapid urbanization and cultural modernization
Cross border gates and national routes
Dynamics of growing economy
Increased in the commercialization of sexual activities
High unemployment rate
Low literacy rate
Alcohol and substance abuse
High crime rate
The municipality has developed an HIV/AIDS Programme in line with the National Policies and Guidelines.

DRAFT IDP2013 Page 165
2. Objectives
To ensure that there will be a collaborative efforts by all in ensuring that a programme is put in place and implemented to support those living with HIV/AIDS
To prevent the spread of the disease
To provide clear guidelines in line with legal mandates on dealing with this scourge
The management of HIV/AIDS will include that of STDs as there is a linkage between them
3. Legal Mandates
Labour Relations Act
Basic Condition of Employment Act
The Constitution of RSA
National HIV/AIDS policy guidelines
Occupational Health and Safety Act
Compensation for Occupational Injuries and Disease Act 4. Interaction With stakeholders
The municipality will endeavor to interact and utilise available resources to ensure its contributions to the fight against HIV/AIDS
The municipality will interact with sector departments, private sector, CBOs, NGOs etc and participate in their programmes. (Attached as annexure J.5)
13.7. SKILLS DEVELOPMENT Plan
The municipality places greater emphasis towards capacitating its personnel in line with the Skills Development Act (Act.NO.97 of 1998) and the Skills
Development Levies Act (Act No. 9 of 1999).
The municipality has developed a comprehensive Work Skills Plan which the Equity Plan forms an integral part and has registered with the Local Government
Sector Education and Training Authority.

DRAFT IDP2013 Page 166
This legal framework and the National Skills Development Strategy are intended to encourage employers to comply with legislations by so doing:
Support economic growth for employment creation and poverty eradication
Promote productive citizens by aligning skills development with national strategies for growth and development
Accelerate Broad based Black Economic Empowerment and Employment Equity, and
Help to create a competitive and productive work environment.
The plan is attached as annexure J.6
13.8. EMPLOYMENT EQUITY PLAN
PREAMBLE
Maruleng Municipality has taken into cognizance the history of apartheid laws and practices with the resultant disparities and inequalities, in the spirit of
Employment Equity Act (attached as annexureJ7) is geared towards achieving employment equity across all occupational levels and categories.
It is further committed to the right to equality as clearly enshrined the Constitution of the Republic of South Africa.
Attempts will be made in order to ensure that the work force is a true reflection of the demographics of the municipal area, the province and the country.
The plan is also aimed at ensuring that South Africa fulfills her obligations as a member of the International Labour Organization.
OBJECTIVES
To do away with all forms of unfair discrimination with regard to employment practices and policies.
To develop and communicate a sexual harassment policy that is in line with the Code of Conduct on Sexual Harassment
To eradicate all barriers that may hamper the advancement of the designated groups.
To create a corporate culture that affirms and exploits workplace diversity.
To ensure that management is actively committed to implementing employment equity.
To create IDP related strategies that can be employed to make reasonable and serious progress on employment equity on all occupational levels and categories

DRAFT IDP2013 Page 167
13.9. HOUSING CHAPTER
BACKGROUND
The following matters were highlighted by the municipality as being the major housing related problems/concerns in the municipality:
The municipality does not have a dedicated housing unit. At the moment the housing function is housed with the PMU, which only deals with the monitoring of
both the waiting list and construction of RDP housing units allocated by the Department of Local Government and Housing. The previous housing facilitator has
also resigned, and the duties are currently handled by the Building Inspector.
The municipality does not own any land, both in Hoedspruit and its outposts.
Municipality is unable to access land for low to middle income housing development in and around the town of Hoedspruit. This is because most of the land is
privately owned and also priced way above what the municipality can afford to pay. At the moment the municipality does not own any land. However, some
government departments and parastatals own portion of land in the area:
National Department of Public Work owns land on Berlin 209 KT and Amsterdam 208 KT,
Limpopo Department of Public Works owns land at Bedford 419 KT. These three portions are strategically situated to address the issue of integrated housing development within the town, if only negotiations with the sister departments can succeed, and
Transnet owns property in town and the houses are currently occupied by illegal tenants. (Transnet is no longer operational in the area). This fact adds to the strain on municipal infrastructure because there is no management therefore there is no payment for municipal services used. Illegal occupation has led to overcrowding and construction of informal structures.
Applications to the DPLGH to assist in purchasing such land is ongoing, but it takes too long and it is also overtaken by private developer driven residential projects
The lack of racial and economic integration within the municipality, i.e. the residents in the Hoedspruit town are predominantly white and affluent, whilst those that live almost 40km north west are predominantly black and poor. High prices of land and houses in and around town. This fact makes it almost impossible for the black people who work in town to afford property nearer their places of work.
Residential development is largely developer driven, making it a challenge for the municipality to have control over housing development.
The over-extended bulk infrastructure in the town of Hoedspruit, which needs an upgrade. At the moment the municipality lacks capacity and funds to deal with this problem. However Mopani District Municipality has appointed service providers to upgrade the current bulk water and sewerage infrastructure.
Minimal or total lack of bulk infrastructure in the villages. Municipality lacks capacity and funds to address current backlog.

DRAFT IDP2013 Page 168
The municipality also raised challenges in relation to the way the DPLGH deals with issues without proper consultations with the municipality. The following issues
were listed:
Blocked projects – housing units that are either incomplete or of poor quality,
The allocation of houses and beneficiary screening,
Appointment of developers, and how their work needs to be monitored , and
The non-payment of local labourers by developers
(This Housing Chapter is attached as annexure J8)
13.10. STRATEGIC AUDIT PLAN
Purpose of this document
This document sets out the Strategic Three-year rolling Internal Audit Plan as well as the Annual Internal Audit Plan for the financial year ending 30 June 2010 (collectively referred to as the Internal Audit Plan), for consideration and approval by the Audit Committee. It was prepared on the combined assurance principle with the aim to avoid excessive duplication of effort between the various assurance providers of serving Maruleng Local Municipality.
The Internal Audit Plan for Maruleng Local Municipality was prepared to provide an efficient and effective assurance service to:
The Executive Mayor;
The Executive Council;
Municipal Manager;
The Audit Committee; and
Line Management.
The approach was to formulate a risk-based plan to align the priorities of the maruleng Local Municipality Internal Audit with the objectives and goals of the municipality and the related strategic risks as identified for the three years 2009/10 to 2012/13
Restriction on distribution of this document
This document has been prepared for the sole and exclusive use of Maruleng Local Municipality and may not be made available to anyone other than authorised persons within Maruleng Local Municipality, nor relied upon by any third party without the prior written consent of Maruleng Local Municipality Internal Audit.

DRAFT IDP2013 Page 169
Internal Audit Roles and responsibilities
The Institute of Internal Auditors defines internal auditing as follows:
“… an independent, objective assurance and consulting activity designed to add value and improve an organisation’s operations. It helps an organisation accomplish its objectives by bringing a systematic, disciplined approach to evaluate and improve the effectiveness of risk management, control and governance processes.”
Maruleng Local Municipality Internal Audit therefore evaluates and contributes to the improvement of risk management, control and governance systems.
Governance
Internal Audit should assist Council and Management in achieving goals of Maruleng Local Municipality by evaluating the process through which:
Goals and values are established and communicated;
Goals are accomplished and monitored; and
Accountability is ensured and corporate values are preserved.
Risk Management
The Maruleng Local Municipality Internal Audit should assist the municipality in identifying, evaluating and assessing significant organisational risks and should provide assurance as to the effectiveness of related internal controls regarding the focus areas reviewed.
Furthermore Internal Audit should evaluate the risk management process of the municipality for efficiency and effectiveness.
Controls
Internal audit should evaluate if the controls of the focus areas as set out in the Internal Audit Plan and which management relies on to manage the risks down to acceptable levels, are appropriate and functioning as intended (i.e. are they effective and efficient) and make recommendations for enhancement or improvement of the current system of internal control.
It must be stressed that Internal Audit is not responsible for implementing and managing controls. Internal Audit is responsible for reporting on the effectiveness of the control environment.
Internal Audit is authorised to:
Have unrestricted access to all functions, records, property and personnel;
Have full and uninhibited access to the Audit Committee;
Allocate its own resources; determine frequencies, subjects, scope of work to be performed; and apply the techniques required to accomplish its audit
objectives; and

DRAFT IDP2013 Page 170
Obtain the necessary assistance of personnel in departments and functions of Maruleng Local Municipality where they perform audits, as well as other
specialised services from within or outside the organisation.
Internal Audit is not authorised to:
Perform any operational duties for Maruleng Local Municipality;
Initiate or approve accounting transactions external to the internal auditing function; and
Direct the activities of any employee outside Internal Audit, except to the extent that such employees have been appropriately assigned to auditing teams or to
otherwise assist Internal Audit in carrying out its functions.(attached as J 9)
13.11. RISK MANAGEMENT POLICY
According to sec 62(1)(c)of the MFMA, the accounting officer of a municipality is responsible for managing the financial administration of the municipality, and
must for this purpose take all reasonable steps to ensure that the municipality has and maintains effective and efficient and transparent systems:
i. Of financial and risk management and internal control; and
ii. Of internal audit operating in accordance with prescribed norms and standards.
The municipality subscribe to the fundamental principles that all resources will be utilized economically to ensure:
Maintain the highest standards of service delivery
Management system containing the appropriate elements aimed at minimising risks and costs in the interest of all stakeholders
Educating and training of all our staff members to ensure continuous improvement in knowledge, skills and capabilities which facilitate constituent
conformance to stakeholders expectations; and
Maintaining an environment, which promotes the right attitude and sensitivity towards internal and external stakeholder satisfaction
The Policy is attached as annexure J.10
DRAFT IDP2013 Page 171
13.12. ANTI-CORRUPTION POLICY
1. INTRODUCTION
The MLM as established through Systems Act of 2000 is one of the high interactive government level. The inter-activeness nature has a potential to generate
illegal, fraudulent and corrupt activities. The MLM has zero tolerance to illegal activities inclusive fraud and corruption. This policy is intended to stop and limit a
corruption and fraud friendly environment.
2. OBJECTIVES
To give effect to prevention and combating of corrupt activities in terms of Act 12 of 2004, MFMA, MLM Code of Conduct and MLM Supply Chain Policy
To prevent and combat fraud and corruption and to related corrupt activities.
To punish perpetrators of corruption and fraud
To safeguard MLM properties, funds, business and interest
The policy is attached as annexure J.11
3.13 Draft Disaster Risk Management Plan
13.13.1. Background
With the new Disaster Management Act (Act 57 of 2002), disaster management is approached in South Africa has undergone major reform when government took
the decision to move away from the customary perception that disasters were inevitable and therefore could only be dealt with once they had occurred. The
essence of the Disaster Management Act can broadly be summarized as:
The integration of risk reduction strategies into development initiatives.
The development of a strategy to reduce the vulnerability of South Africans especially poor and disadvantaged communities – to disasters.
The establishment of a National Disaster Management Centre to:
- ensure that an effective disaster management strategy is established and implemented;
- co-ordinate disaster management at various levels of government;
- Promote and assist the implementation of disaster management activities in all sectors of society.

DRAFT IDP2013 Page 172
The introduction of a new disaster management funding system which:
- ensures that risk reduction measures are taken;
- builds sufficient capacity to respond to disasters;
- Provides for adequate post-disaster recovery.
The new Disaster Management Act;
- Brings about an uniform approach to disaster management;
- Seeks to eliminate the confusion created by current legislation regarding declarations of disasters;
- Addresses legislative shortcomings by implementing key policy objectives.
The establishment of a framework (strategic policy) to enable communities to be informed, alert and self-reliant and capable of supporting and co-operating with government in disaster prevention and mitigation.( annexure J.12)

DRAFT IDP2013 Page 173
14: ORGANISATIONAL PERFORMANCE MANAGEMENT SYSTEM
14.1. INTRODUCTION
Section 41(1) of the Municipal Systems Act, (Act 32 of 2000) states that a municipality must:
Set KPI’s as a yardstick for measuring performance targets
Monitor performance
Measure and Review performance at least once per year
Steps to improve performance where performance targets are not met
Establish a process of regular reporting
Section 42 of the same Act:
States that a municipality must involve the local community in the development, implementation and review of the Performance Management System. In view of the above, the intention of Maruleng Local Municipality is to in future involve the community in setting strategic KPI’s and measuring performance targets of the municipality. Monitoring and evaluation was incorporated to the Maruleng Local Municipality’s strategy through their Performance Management Systems in terms of quarterly assessment of performance.
IDP fulfills the planning stage of PM and PM fulfills the implementation, management, monitoring and evaluation of the IDP process. The Performance
Management Systems developed, implemented and maintained within the Maruleng Local Municipality provides the framework to ensure the IDP is implemented
and measured.
14.2. MONITORING, ASSESSMENT, EVALUATION AND REVIEW
Monitoring is the regular observation and recording of activities taking place in a project or programme. Relevant data is gathered in an efficient and timely manner
and in sufficient quantities to provide meaningful results after which it is processed to identify and categorize factors relevant to specific concerns. In monitoring,
data should be analysed and the results displayed so that personnel can take appropriate actions.
Monitoring which involves a process of routinely gathering information on all aspects of the objective, programme or project has been operationalised within the
Maruleng Local Municipality by making use of the SDBIP reporting to monitor quarterly progress towards targets as set out.. Cascading the SDBIP further down to
the departmental/sectional level will help Maruleng Local Municipality to review performance quarterly and be able to take necessary steps to improve
performance where performance targets are not met

DRAFT IDP2013 Page 174
Assessment is a process of measuring or quantifying the level of attainment or competence within a specified domain whereby scores are attached to see how
well the theme, objective, programmes or projects have been achieved. On the other hand evaluation is determining of value, or the measurement of value added.
The municipality needs to determine whether, or not, the programme or project adds value or is contributing to the organisation’s strategy.
Review simply means to look at something again, critically to make sure that it is adequate, accurate, or correct. It also means to reconsider or revisit a process or
programme with an aim of improving the results. Review in PM must ensure that action is taken in response to actual performance to make outcomes better than
they would otherwise be, thus the time to make adjustments or to re-devise the strategies. Typically this should be the case at the IDP and PM review
14.3. REPORTING
Information Management became the backbone of any business and IT governance is inseparable from good corporate governance. Maruleng Local Municipality
is still reporting on a manual spreadsheet system but plans on investigating the implementation of automated system that will greatly enhance reporting within
municipality. The utilisation of an automated performance management system will allow for feed-back regarding the attainment of targets and progress on project
implementation as indicated in the IDP and SDBIP documents. This will allow Council with the opportunity to have access to real time information.
Maruleng Local Municipality will in this financial year strive to schedule Performance Reports, Budgets and other reports as required by legislation. The following
reports will be produced:
Quarterly Council Report
Monthly Management Report
Monthly Departmental. Performance Reports
Quarterly SDBIP Report
Half-year DPLG Report
Annual DPLG Report
Annual Performance Report

DRAFT IDP2013 Page 175
Reporting in the monitoring process also involves giving feedback about the progress of the project to the donors, implementers and beneficiaries of the project.
Maruleng Local Municipality has been able to develop a Ward Monitoring Scorecard though at a pilot stage to help ward committees to give report back to the
communities who will beneficiaries of the project.
In the process of establishing regular reporting to council, other political structures, political office bearers and staff of the municipality and the public and
appropriate organs of state, Maruleng Local Municipality is guided by the principles of reliability, relevance, clarity, comparability, timeliness and verifiability. It is
attached as annexure J.12
CONCLUSION
Maruleng Local Municipality addressed gaps that were identified by adopting a developmental approach and by ensuring that it can respond to and meet the
challenges it faces as an organisation. The municipality has developed its strategic focus within its integrated developmental processes with programmes based
on both national KPA’s and municipal strategic priorities.
Maruleng Local Municipality has properly planned on how it will be able to deliver services efficiently, effectively and economically and complying with the
identified needs. The Balanced Scorecard methodology will help the municipality to focus on attainment of its strategic objectives and measurements of effective
implementation of its strategies.