Embed Size (px)
Citation preview

2014 – 15 Budget Review (adopted 19
th February 2015)

10. Estimated Income Statement
Description Budget Actual Budget Review
2014-15 30-Nov-14 2014-15
Income
Rates & Charges 1,404,286 1,410,233 1,409,742
User Charges 774,582 254,952 777,618
Interest 221,200 70,765 221,200
Reimbursements 750 (673) 750
Grants 1,832,957 1,111,631 1,659,902
Other Revenue 96,750 22,047 111,350
Profit (Loss) on Sale of Assets 7,000 - 7,000
Total Income 4,337,525 2,868,955 4,187,562
Expenses
Employee Expenses 2,095,774 713,342 2,096,935
Materials & Supplies 1,552,755 582,924 1,600,205
Contractors 681,378 159,264 681,378
Depreciation 1,359,000 - 1,442,756
Other Expenditure 137,917 3,370 51,000
Total Expenses 5,826,824 1,458,900 5,872,274
Operating Surplus (Deficit) (1,489,299) 1,410,056 (1,684,712)
Capital Grants and Contributions 1,073,815 277,849 1,000,883
Total Surplus (Deficit) (415,484) 1,687,905 (683,829)
Capital Expenses
Capital Works Program (3,398,417) 450,523 (3,856,958)
Depreciation 1,359,000 - 1,442,756
Transfer to Reserves 187,000 - 187,000
Transfers from Reserves 848,228 - 848,228
Total Capital Expenditure (1,004,189) 450,523 (1,378,974)
Total Surplus (Deficit) after Capital Items (1,419,673) 2,138,428 (2,062,803)
Estimated Income Statement 2014-15

8. Reserves
Opening Transfers Transfers Closing
Balance IN OUT Balance
1-Jul-14 30-Jun-15
Asset Revaluation Reserve
2014-15 42,478,917 N/A N/A 42,478,917
Balance at EOY 2013-14 42,478,917 42,478,917
Unallocated Cash Reserves
Budget 2014-15 3,605,957 - 260,728 3,345,229
Balance at EOY 2013-14 3,605,957 3,605,957
Bequests Reserves
Budget 2014-15 106,818 - - 106,818
Balance at EOY 2013-14 106,818 106,818
Airport Cash Reserve
Budget 2014-15 527,500 - 527,500 -
Balance at EOY 2013-14 527,500 527,500
Infrastructure Asset Reserve
Budget 2014-15 39,000 187,000 60,000 166,000
Balance at EOY 2013-14 66,000 66,000
Ben Lomond Water Investment Reserve
Budget 2014-15 58,213 - - 58,213
Balance at EOY 2013-14 58,213 58,213
TOTAL 2013-14 46,816,405 187,000 848,228 47,851,633
TOTAL 2012-13 46,843,405 - 46,843,405

9. Capital Works ProgramProject Budget Actual Budget Review
Dept Code 2014-15 At 30 Nov 2014 2014-15
Administrative Support
Office Computer Systems ADM CAPADMOCS1 12,000 - 12,000
Records Management ADM 10,000 10,000
Records Storage Facility ADM 5,000 5,000
Total Administrative Support 27,000 - 27,000
Roads
Footpaths
Footpaths Program RDS CAPRDSFP1 35,000 91 35,000
Sub-Total Footpaths 35,000 91 35,000
Bridges
Samphire Bridge, Badger Corner Road WIP RDS - - -
Capital Improvements - Bridge Guard Rails RDS CAPRDSBG1 60,000 - 60,000
Sub-Total Bridges 60,000 - 60,000
Quarry
Lughrata Quarry Development RDS CAPRDSLQ1 260,728 12,392 260,728
Reseals
Esplanade, Whitemark RDS CAPRS1 5,787 - 1,700
Gunter Street RDS CAPRS2 14,000 - 2,300
James Court RDS CAPRS3 6,000 - 1,000
Lackrana Road RDS CAPRS4 89,976 449 22,000
Memana Road RDS CAPRS5 144,744 914 35,500
Melrose Road RDS CAPRS6 65,586 626 16,500
Palana Road - Reseal RDS CAPRS7 89,976 449 22,000
Palana Road - Reconstruction & seal RDS CAPRS7 106,551 18,462 106,551
Thule Road RDS CAPRS8 52,083 - 13,000
Purchase of bitumen sprayer truck & two new spreader boxes 450,000
Stock on hand. RDS 454,152
Sub-Total Reseals 574,703 20,900 1,124,703
Resheeting
Reedy Lagoon Road RDS CAPRG36 10,347 10,347
Summer Camp & Lookout Roads RDS CAPRG11 4,934 4,934
Wallanippi Road RDS CAPRG14 5,720 5,720
Cameron's Inlet Road RDS CAPRG16 13,519 - 13,519
Fairhaven Road RDS CAPRG17 9,798 9,798
Conways Road RDS CAPRG19 4,900 4,900
Lees Road RDS CAPRG20 4,901 - 4,901
Memana Road RDS CAPRG5 10,347 - 10,347
Sub-Total Resheeting 64,466 - 64,466
TOTAL Roads 994,897 33,383 1,544,897
Waste Management
Whitemark/Lady Barron site improvements WST CAPWST1 80,000 14,253 80,000
Cape Barren Is - New Waste Site WST 21,262 - 21,262
Effluent Reuse Project WST CAPWST2 80,000 - 80,000
TOTAL Waste Management 181,262 14,253 181,262
Art Gallery TMT CAPTMTAG1 10,000 8,086 11,359
Whitemark Hall (FAEC) TMT CAPTMTWH1 32,090 18,742 32,090
Anzac Centenary TMT CAPANZ1 9,000 10,876 13,134
House 1 (Robert St) TMT CAPTMTC1 9,465 915 9,465
House 3 (Martin St) TMT CAPTMTC2 1,500 - 1,500
Child Care Centre TMT CAPTMTCC1 1,550 - 1,550
Depot Office TMT CAPTMTD1 5,000 - 5,000
Emita Hall TMT CAPTMTE1 163,099 122,472 163,099
Lady Barron Hall Upgrade TMT CAPTMTH1 220,000 395 220,000
Lady Barron Tennis Courts TMT CAPTMTTT1 9,000 - 9,000
LB Marine Facilities Upgrade TMT CAPTNTLMP1 100,000 - 100,000
Yellow Beach - Water Tank TMT CAPTMTY1 5,000 - 5,000
Town Maintenance (Buildings, Parks, Reserves & Funeral
Services)

Civic Centre Dev at FAEC (now Rose Garden Upgrade) TMT CAPTMTWH1 1,300 1,555 1,300
Whitemark Beautification/Foreshore Upgrade TMT CAPTMTF1 140,875 14,939 140,875
Whitemark Boat Jetty upgrade TMT CAPTMTBJ1 19,720 - 19,720
Funeral Services (equipment upgrade) NEW TMT CAPTMTFS1 4,641 5,130 4,641
CBI Community Hall Upgrade TMT - - -
Public Toilet upgrades x 3 TMT CAPTMTPT1 60,000 890 60,000
Hearse TMT CAPTMTH1 15,000 15,000
Crown Land Transfer TMT CAPTMTCL1 20,000 28,000
Depot Workshop Shed TMT CAPTMTDS1 30,000 16,100 30,000
Signage TMT CAPTMTS1 10,000 11,100
Demolition of Summer Camp TMT - - -
Whitemark Showgrounds TMT - 10,643 10,643
TOTAL Town Maintenance 867,240 200,100 892,476
Airport
Apron Extension (RAAP Funding) 2nd Funding Round AIR 786,018 60,482 786,018
Excavator AIR 50,000 71,700 71,000
Airport Runway Upgrade AIR 200,000 3,183 100,000
Airport Terminal AIR 15,000 - 15,000
Airport Business Plan AIR 100,000 4,634 20,000
TOTAL Airport 1,151,018 60,482 992,018
Plant & Equipment
Mulching Head PLT 50,000
Kerb Machine PLT 12,000 - 12,000
D6 Bulldozer PLT 150,000 142,305 142,305
Slasher PLT 15,000 - 15,000
TOTAL Plant & Equipment 177,000 142,305 219,305
TOTAL Capital Works 3,398,417 450,523 3,856,958

Corporate Services Division
Core Activities
The Corporate Services Division incorporates General Administration and Governance Areas.
2014-15 BUDGET DRAFT
Corporate Division Income Expenditure Net Cost
$ $ $
Corporate Services 293,405 839,531 546,126
Goverance 2,070,072 777,722 (1,292,350)
Total Corporate Division 2,363,477 1,617,253 (746,224)
Program: Corporate Services Division
Description Budget Actual at Budget Review
2014-15 30-Nov-14 2014-15
Operating Income $ $ $
Rates 1,230,535 1,235,493 1,235,002
User Charges 12,300 1,960 12,300
Interest 221,200 70,765 221,200
Reimbursements 500 (673) 500
Grants 689,649 498,738 673,475
Grants - Capital 250,000 175,000 175,000
Other 46,000 4,003 46,000
Total Income 2,450,184 1,985,285 2,363,477
Operating Expenditure
Employee Expenses 669,250 263,936 670,250
Materials & Supplies 685,643 368,770 703,693
Contracts 216,670 57,217 216,670
Depreciation 25,000 - 26,640
Other 500 - -
Total Expenditure 1,597,063 689,924 1,617,253
Net Operating Cost 853,121 1,295,362 746,224
Profit (Loss) on Sale of Assets - - -
Depreciation & Amortisation 25,000 - 26,640
Capital Works (27,000) - (27,000)
851,121 1,295,362 745,864
Description Budget Actual at Budget Review
2014-15 30-Nov-14 2014-15
Corporate RevenueFire Levy - All 56,105 56,595 56,105
Other Revenue (GST Free) 2,000 1,964 2,000
Other Revenue (GST Payable) 2,000 1,360 2,000
Commissons - -
Meeting Room & Facilities Hire 500 - 500
132 & 337 Certificates (and rates notices) 10,000 1,351 10,000
Photocopies/Facsimiles 1,000 609 1,000
Equipment Hire 100 - 100
Hall & Sports Stadiums Hire 500 - 500
Interest Income 200,200 60,802 200,200
Interest & Penalties on overdue Rates 21,000 9,963 21,000
Subtotal Corporate (ADM) 293,405 132,644 293,405
Governance Revenue
General Rate - All 1,174,430 1,178,897 1,178,897
Other Revenue (GST Free) 2,000 164 2,000
Other Revenue (GST Payable) 10,000 515 10,000
Flinders Arts & Entertainment Centre Hire 200 - 200
TasWater Water Equiv/Dividends 30,000 - 30,000
Pensioner Remission (Fire Levy) 500 (673) 500
Pensioner Remission - State Govt. 30% - - -
Grants - Financial Assistance Grant 689,649 498,738 673,475
Grants - Other Capital -
Grants - Other Non Capital 250,000 175,000 175,000
Subtotal Governance (GOV) 2,156,779 1,852,641 2,070,072
Total Revenue Corporate Serv Divn. 2,450,184 1,985,285 2,363,477
Operating Budget - Revenue

Description Budget Actual at Budget Review
2014-15 30-Nov-14 2014-15
Corporate ExpenditureSalaries & Wages 324,055 114,042 324,055
Overtime 4,500 1,113 4,500
Payroll Tax 38,000 14,929 38,000
Fringe Benefits Tax (FBT) 3,272 814 3,272
Workers Comp Insurance 24,145 28,521 24,145
Medical Costs (W/Comp) - - -
Superannuation 40,507 13,378 40,507
Allowances 1,040 309 1,040
Training 15,000 163 15,000
Conferences and Seminars 2,500 - 2,500
Uniforms & Protective Clothing 2,200 548 2,200
Staff Amenities - -
Advertising - 395 500
Audit Fees 19,800 4,805 25,000
Bank Charges 9,500 4,632 9,500
Cleaning Items 500 29 500
Computer Hardware Purchase - - -
Computer Software Purchase - - -
Computer Consumables - - -
IT Expenses 24,400 8,984 24,400
Computer Training -
Computing Consultancies -
Computing Lease Charges 26,728 27,118 26,728
Computing Licence Fees / Maint. 12,500 409 12,500
Consultancy - Brighton Council & Meander Valley - -
Consulting / Contractor Services 46,670 34,295 46,670
Debt Collection 1,500 6,114 8,000
Consultancy - Northern Midlands Council - -
Utility Costs (Power, Gas & Water) - -
Fire Service Levy 54,000 13,465 54,000
Freight 600 85 600
General Expenses 1,000 2,141 1,000
Insurance - General 27,414 24,826 27,414
Land Tax 28,000 19,912 28,000
Legal Expenses -
Materials & Equipment 1,000 - 1,000
Photocopier 16,500 8,693 16,500
Postage 3,000 912 3,000
Printing and Stationery 2,750 1,362 2,750
Plant Hire - Internal Charges 1,000 1,127 1,000
Roundings Account 10 0 10
Security & Fire Prevention 100 - 100
Settlement Discount - Rates Payments 15,500 15,750 15,500
Subscriptions/Publications 2,000 156 2,000
Supplementary Revaluations 3,000 3,805 3,000
Telephone incl Fax & Internet 38,000 18,289 38,000
Travel Expenses 10,000 5,545 10,000
Depreciation - Furniture & Fittings 16,000 18,000
Amortisation Expense - Municipal Revaluation 9,000 8,640
Bad & Doubtful Debts 500 -
Subtotal Corporate (ADM) 826,191 376,667 839,531
Governance
Salaries & Wages 207,761 81,036 207,761
Overtime - 465 1,000
Superannuation 25,970 8,273 25,970
Allowances - -
Training 13,000 - 13,000
Conferences and Seminars 5,000 5,000
Uniforms 344 350
Advertising 4,000 2,177 4,000
Computer Hardware Purchase - -
IT Expenses 7,000 8,850 7,000
Consulting / Contractor Services 170,000 22,923 170,000
Council Member Allowances 77,500 35,768 77,500
Council Member Expenses 15,000 8,180 15,000
Donations and Gifts 13,500 4,005 12,500
Election Costs 500 383 7,000
Freight 250 14 250
General Expenses 120,000 64,565 120,000
Insurance - General 3,641 3,827 3,641
Insurance - Excess -
Legal Expenses 15,000 14,452 15,000
Materials 50 4 50
Postage 1,000 485 1,000
Printing and Stationery 3,000 556 3,000
Plant Hire - Internal Charges 9,500 4,993 9,500
Subscriptions/Publications 35,000 36,035 35,000
Telephone inc Internet 11,500 5,121 11,500
Travel Expenses 30,000 10,629 30,000
Web Page Design & Modifications 2,500 - 2,500
Wreaths/Flowers 200 173 200
Subtotal Governance (GOV) 770,872 313,256 777,722
Total Expenditure Corporate Serv Dvn. 1,597,063 689,924 1,617,253
Operating Budget - Expenditure
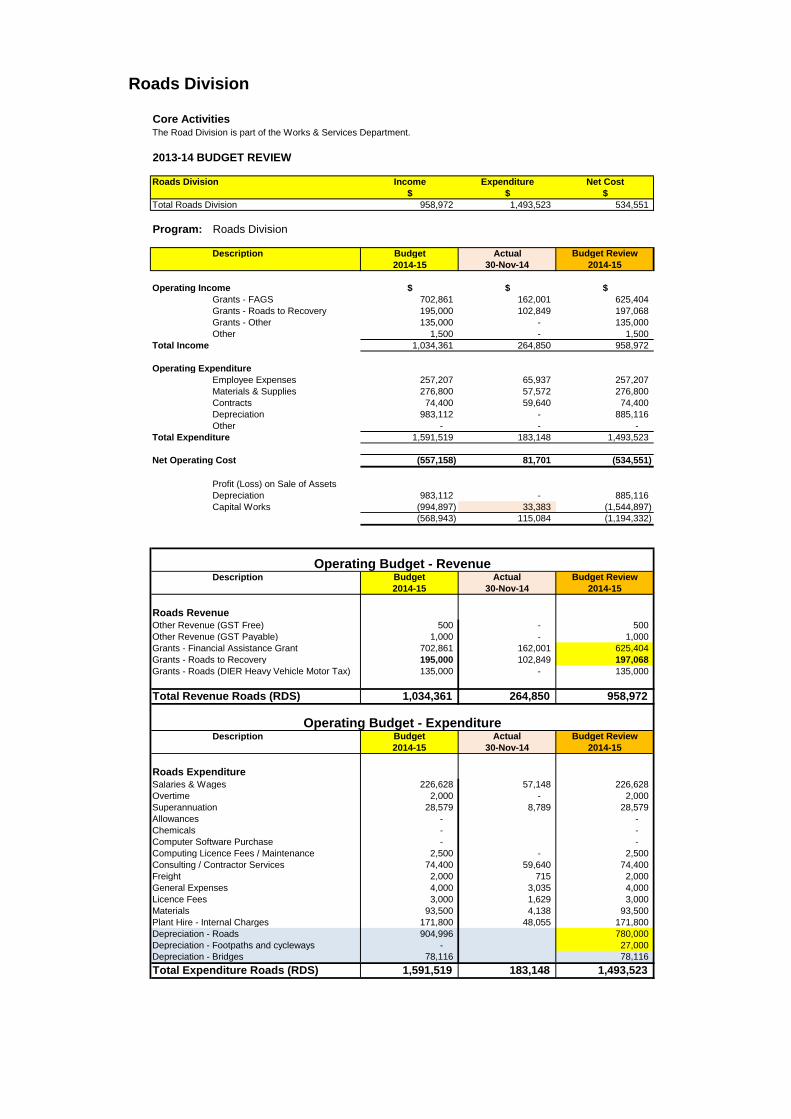
Roads Division
Core ActivitiesThe Road Division is part of the Works & Services Department.
2013-14 BUDGET REVIEW
Roads Division Income Expenditure Net Cost
$ $ $
Total Roads Division 958,972 1,493,523 534,551
Program: Roads Division
Description Budget Actual Budget Review
2014-15 30-Nov-14 2014-15
Operating Income $ $ $
Grants - FAGS 702,861 162,001 625,404
Grants - Roads to Recovery 195,000 102,849 197,068
Grants - Other 135,000 - 135,000
Other 1,500 - 1,500
Total Income 1,034,361 264,850 958,972
Operating Expenditure
Employee Expenses 257,207 65,937 257,207
Materials & Supplies 276,800 57,572 276,800
Contracts 74,400 59,640 74,400
Depreciation 983,112 - 885,116
Other - - -
Total Expenditure 1,591,519 183,148 1,493,523
Net Operating Cost (557,158) 81,701 (534,551)
Profit (Loss) on Sale of Assets
Depreciation 983,112 - 885,116
Capital Works (994,897) 33,383 (1,544,897)
(568,943) 115,084 (1,194,332)
Description Budget Actual Budget Review
2014-15 30-Nov-14 2014-15
Roads Revenue
Other Revenue (GST Free) 500 - 500
Other Revenue (GST Payable) 1,000 - 1,000
Grants - Financial Assistance Grant 702,861 162,001 625,404
Grants - Roads to Recovery 195,000 102,849 197,068
Grants - Roads (DIER Heavy Vehicle Motor Tax) 135,000 - 135,000
Total Revenue Roads (RDS) 1,034,361 264,850 958,972
Description Budget Actual Budget Review
2014-15 30-Nov-14 2014-15
Roads Expenditure
Salaries & Wages 226,628 57,148 226,628
Overtime 2,000 - 2,000
Superannuation 28,579 8,789 28,579
Allowances - -
Chemicals - -
Computer Software Purchase - -
Computing Licence Fees / Maintenance 2,500 - 2,500
Consulting / Contractor Services 74,400 59,640 74,400
Freight 2,000 715 2,000
General Expenses 4,000 3,035 4,000
Licence Fees 3,000 1,629 3,000
Materials 93,500 4,138 93,500
Plant Hire - Internal Charges 171,800 48,055 171,800
Depreciation - Roads 904,996 780,000
Depreciation - Footpaths and cycleways - 27,000
Depreciation - Bridges 78,116 78,116
Total Expenditure Roads (RDS) 1,591,519 183,148 1,493,523
Operating Budget - Revenue
Operating Budget - Expenditure

Waste Management Division
Core Activities
The Waste Management Division is part of the Works & Services Department and is responsible for Whitemark, Lady
Barron & CBI Tips as well waste transfer sites.
2013-14 BUDGET REVIEW
Waste Management Division Income Expenditure Net Cost
$ $ $
Total Waste Management Division 174,740 208,947 34,207
Program: Waste Management Division
Description Budget Actual Budget Review
2014-15 30-Nov-14 2014-15
Operating Income $ $ $
Rates 173,751 174,740 174,740
User Charges - - -
Grants
Other
Total Income 173,751 174,740 174,740
Operating Expenditure
Employee Expenses 92,635 20,317 92,635
Materials & Supplies 94,812 10,151 94,812
Contracts 15,000 - 15,000
Depreciation - 6,500
Other - - -
Total Expenditure 202,447 30,469 208,947
Net Operating Cost (28,696) 144,272 (34,207)
Profit (Loss) on Sale of Assets
Depreciation - - 6,500
Capital Works (181,262) 14,253 (181,262)
(209,958) 158,525 (208,969)
Description Budget Actual Budget Review
2014-15 30-Nov-14 2014-15
Waste Management Revenue
Rates - Waste Management - All 173,751 174,740 174,740
Waste Disposal Fees - -
Total Revenue Waste Mgt Dvn 173,751 174,740 174,740
Description Budget Actual Budget Review
2014-15 30-Nov-14 2014-15
Waste Management Expenditure
Salaries & Wages 68,734 15,897 68,734
Overtime 15,309 1,338 15,309
Superannuation 8,592 3,082 8,592
Cleaning 500 - 500
Computer Hardware Purchase - - -
Consulting / Contractor Services 15,000 - 15,000
Energy (Gas & Electricity) - - -
Freight 2,500 1,730 2,500
General Expenses 21,500 47 21,500
Insurance - General 112 112 112
Licence Fees 4,500 1,483 4,500
Materials 4,000 115 4,000
Printing and Stationery 500 - 500
Plant Hire - Internal charges 48,700 6,665 48,700
Tip Rehabilitation 10,000 - 10,000
Travel Expenses 2,500 - 2,500
All Other Expenses
Depreciation - Waste Management - - 6,500
Total Expenditure Waste Mgt Dvn 202,447 30,469 208,947
Operating Budget - Revenue
Operating Budget - Expenditure

Town Maintenance Division
Core ActivitiesThis Division provides for the maintenance and management of Council's properties and facilities (buildings,
parks & reserves), Funeral Services & Cementry maintenance.
2013-14 BUDGET REVIEW
Town Maintenance Division Income Expenditure Net Cost
$ $ $
Total Town Maintenance Division 72,610 417,982 345,372
Program : Town Maintenance Division
Description Budget Actual Budget Review
2014-15 30-Nov-14 2014-15
Operating Income $ $ $
Rates
User Charges 52,974 21,140 62,610
Grants - Capital - - -
Other 10,000 4,335 10,000
Total Income 62,974 25,476 72,610
Operating Expenditure
Employee Expenses 98,497 45,639 98,497
Materials & Supplies 159,985 34,282 159,985
Contracts 50,000 5,457 50,000
Depreciation 70,500 - 109,500
Other - - -
Total Expenditure 378,982 85,377 417,982
Net Operating Cost (316,008) (59,901) (345,372)
Profit (Loss) on Sale of Assets - - -
Depreciation 70,500 - 109,500
Capital Works (867,240) 200,100 (892,476)
(1,112,748) 140,199 (1,128,348)
Description Budget Actual Budget Review
2014-15 30-Nov-14 2014-15
Town Maintenance RevenueOther Revenue (GST Free) 8,000 3,623 8,000
Other Revenue (GST Payable) 2,000 713 2,000
Flinders Arts & Entertainment Centre - Hire 2,000 - 2,000
Meeting Room & Facilities Hire 1,650 - 1,650
Equipment Hire 200 29 200
Hall & Sports Stadiums Hire 200 505 200
Cemetery Fees - Burials & Other 38,000 15,869 38,000
Cemetery- Other Fees - -
Rent Received - Buildings 364 238 10,000
Staff Housing Rent 10,560 4,500 10,560
Grants - Other Capital - - -
Total Revenue (TMT) 62,974 25,476 72,610
Description Budget Actual Budget Review
2014-15 30-Nov-14 2014-15
Town Maintenance ExpenditureSalaries & Wages 85,775 40,446 85,775
Overtime 2,000 124 2,000
Superannuation 10,722 4,949 10,722
Allowances - -
Training 250 120 250
Advertising 2,080 148 2,080
Analysis & Environmental Sampling Fees 100 - 100
Cleaning 1,100 224 1,100
Consulting / Contractor Services 50,000 5,457 50,000
Energy (Gas & Electricity) 25,000 6,758 25,000
Fire Service Levy - - -
Freight 2,000 1,258 2,000
General Expenses 70,000 7,218 70,000
Insurance - General 28,905 12,329 28,905
Leases 300 - 300
Licence Fees - - -
Materials 11,200 543 11,200
Property Maintenance - -
Plant Hire - Internal charges 14,050 4,556 14,050
Security & Fire Prevention -
Subscriptions/Publications -
Travel Expenses 5,000 1,248 5,000
Depreciation - Building 67,000 62,000
Depreciation - Leasehold Improvements - 44,000
Depreciation - Plant & Equipment 3,500 3,500
Total Expenditure (TMT) 378,982 85,377 417,982
Operating Budget - Revenue
Operating Budget - Expenditure
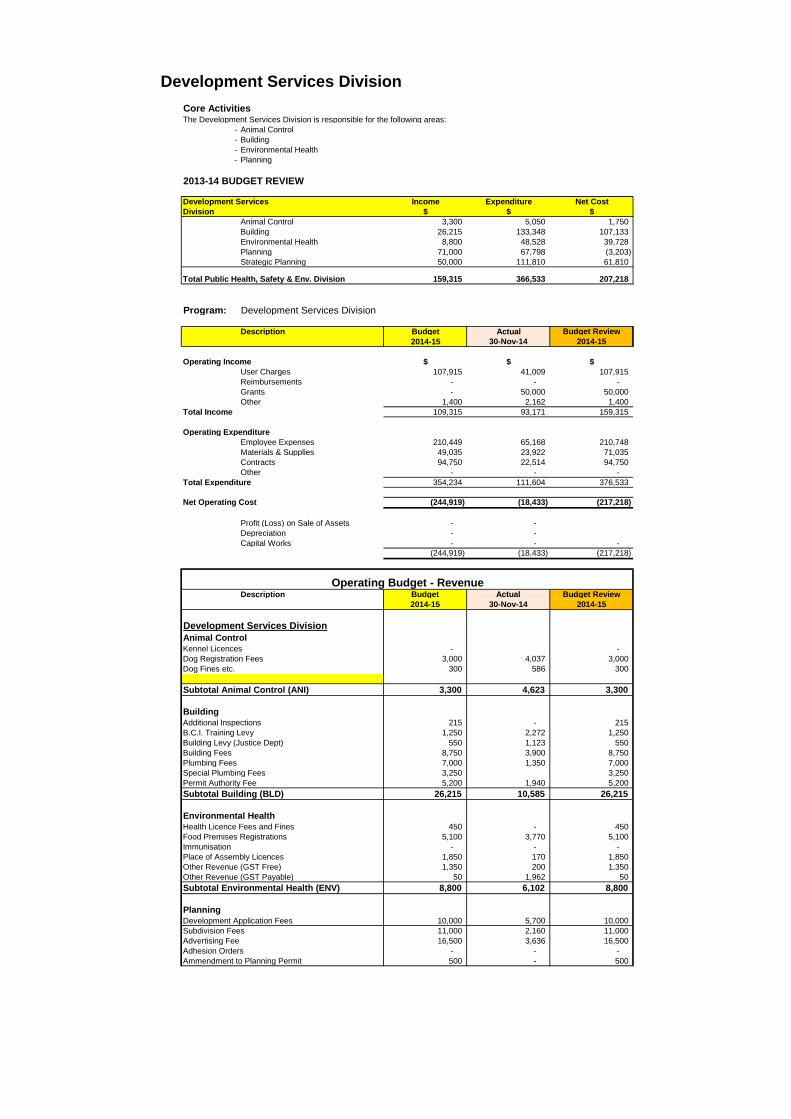
Development Services Division
Core ActivitiesThe Development Services Division is responsible for the following areas:
- Animal Control
- Building
- Environmental Health
- Planning
2013-14 BUDGET REVIEW
Development Services Income Expenditure Net Cost
Division $ $ $
Animal Control 3,300 5,050 1,750
Building 26,215 133,348 107,133
Environmental Health 8,800 48,528 39,728
Planning 71,000 67,798 (3,203)
Strategic Planning 50,000 111,810 61,810
Total Public Health, Safety & Env. Division 159,315 366,533 207,218
Program: Development Services Division
Description Budget Actual Budget Review
2014-15 30-Nov-14 2014-15
Operating Income $ $ $
User Charges 107,915 41,009 107,915
Reimbursements - - -
Grants - 50,000 50,000
Other 1,400 2,162 1,400
Total Income 109,315 93,171 159,315
Operating Expenditure
Employee Expenses 210,449 65,168 210,748
Materials & Supplies 49,035 23,922 71,035
Contracts 94,750 22,514 94,750
Other - - -
Total Expenditure 354,234 111,604 376,533
Net Operating Cost (244,919) (18,433) (217,218)
Profit (Loss) on Sale of Assets - -
Depreciation - -
Capital Works - - -
(244,919) (18,433) (217,218)
Description Budget Actual Budget Review
2014-15 30-Nov-14 2014-15
Development Services Division
Animal Control
Kennel Licences - -
Dog Registration Fees 3,000 4,037 3,000
Dog Fines etc. 300 586 300
Subtotal Animal Control (ANI) 3,300 4,623 3,300
Building
Additional Inspections 215 - 215
B.C.I. Training Levy 1,250 2,272 1,250
Building Levy (Justice Dept) 550 1,123 550
Building Fees 8,750 3,900 8,750
Plumbing Fees 7,000 1,350 7,000
Special Plumbing Fees 3,250 3,250
Permit Authority Fee 5,200 1,940 5,200
Subtotal Building (BLD) 26,215 10,585 26,215
Environmental Health
Health Licence Fees and Fines 450 - 450
Food Premises Registrations 5,100 3,770 5,100
Immunisation - - -
Place of Assembly Licences 1,850 170 1,850
Other Revenue (GST Free) 1,350 200 1,350
Other Revenue (GST Payable) 50 1,962 50
Subtotal Environmental Health (ENV) 8,800 6,102 8,800
Planning
Development Application Fees 10,000 5,700 10,000
Subdivision Fees 11,000 2,160 11,000
Advertising Fee 16,500 3,636 16,500
Adhesion Orders - - -
Ammendment to Planning Permit 500 - 500
Operating Budget - Revenue

Engineering Fees - -
Public Open Space Fees 33,000 10,365 33,000
Other Revenue (GST Payable) -
Subtotal Planning (PLN) 71,000 21,861 71,000
Strategic Planning
Grants - Other Non Capital - 50,000 50,000
Subtotal Strategic Planning - 50,000 50,000
Total Revenue Development Serv Division 109,315 93,171 159,315
Description Budget Actual Budget Review
2014-15 30-Nov-14 2014-15
Development Services Division
Animal Control
Advertising 200 - 200
Consulting / Contractor Services 3,500 - 3,500
Materials 300 - 300
Postage 200 23 200
Printing and Stationery 250 - 250
Travel Expenses 600 - 600
Subtotal Animal Control (ANI) 5,050 23 5,050
Building
Salaries & Wages 33,540 9,835 33,540
Superannuation 4,193 1,261 4,193
Allowances 50 - 50
Training 2,500 500 2,500
Conferences and Seminars 750 500 750
Staff Amenities - -
Analysis and Environmental Sampling Fees - -
Consultancy - Meander Valley Council - -
Consulting / Contractor Services 21,250 17,623 71,250
General Expenses 500 3,330 4,500
Immunisations - -
Insurance - General 415 415 415
Legal Expenses - - -
Materials 100 7 100
Postage 50 65 50
Telephone incl Internet 1,000 327 1,000
Travel Expenses 5,000 6,076 15,000
Subtotal Building (BLD) 69,348 39,940 133,348
Environmental Health
Salaries & Wages 33,540 9,775 33,540
Superannuation 4,193 1,261 4,193
Allowances 50 - 50
Training 1,000 255 1,000
Conferences and Seminars - -
Uniforms & Protective Clothing 330 - 330
Staff Amenities - - -
Analysis and Environmental Sampling Fees 250 - 250
Computer Hardware Purchase - - -
IT Expenses 500 474 500
Consulting / Contractor Services - -
Freight 150 49 150
General Expenses 1,400 1,686 1,400
Immunisations 250 230 250
Insurance - General 415 415 415
Materials 500 - 500
Postage 50 24 50
Printing and Stationery 100 11 100
Subscriptions/Publications 800 221 800
Telephone incl Internet 1,000 327 1,000
Travel Expenses 4,000 1,581 4,000
Subtotal Environmental Health (ENV) 48,528 16,309 48,528
Planning
Salaries & Wages 33,540 8,058 33,540
Superannuation 4,193 958 4,193
Allowances 50 - 50
Conferences and Seminars 750 1,000 750
Staff Amenities - -
Advertising 12,500 2,571 12,500
Computer Software Purchase - -
IT Expenses 800 - 800
Consultancy - Meander Valley Council - -
Consulting / Contractor Services 60,000 4,891 10,000
General Expenses 5,000 7 1,000
Insurance - General 415 415 415
Legal Expenses 1,000 - 1,000
Materials 200 - 200
Planning Scheme Expenses - - -
Postage 200 48 200
Printing and Stationery 50 147 50
Plant Hire - Internal Charges 500 934 500
Relocation Expenses - -
Subscriptions/Publications 100 390 100
Telephone incl Internet 1,000 327 1,000
Travel Expenses 1,500 822 1,500
Subtotal Planning (PLN) 121,798 20,567 67,798
Operating Budget - Expenditure

Strategic Planning
Salaries & Wages 84,089 29,557 84,089
Superannuation 10,511 3,728 10,511
Training 100
Uniforms 135 300
Consulting / Contractor Services 10,000 - 10,000
General Expenses 350 25 350
Planning Scheme Expenses 1,500 - 1,500
Printing and Stationery 500 9 500
Telephone incl Internet 1,560 636 1,560
Travel Expenses 1,000 575 3,000
Subtotal Strategic Planning (SPLN) 109,510 34,766 111,810
Total Expenditure Development Ser Division 354,234 111,604 366,533

Community & Economic Development Division
Core ActivitiesCommunity Development Division covers the following areas and is responsible for the leadership and management of following:-
Community & Economic Development (including Youth & Health)
Natural Resource Management
SES & Emergency Management
2013-14 BUDGET REVIEW
Community Development Division Income Expenditure Net Cost
$ $ $
Community & Economic Development 182,123 483,178 301,055
SES & Emergency Management 250 14,863 14,613
Total Community Development 182,373 498,041 315,668
Program : Community & Economic Development Division
Description Budget Actual Budget Review
2014-15 30-Nov-14 2014-15
Operating Income $ $ $
User Charges 2,500 689 2,500
Reimbursements 250 - 250
Grants 305,447 123,043 176,023
Grants - Capital - - -
Other 2,600 8,044 3,600
Total Income 310,797 131,777 182,373
Operating Expenditure
Employee Expenses 195,997 58,338 195,859
Materials & Supplies 79,824 12,581 89,724
Contracts 164,058 3,909 164,058
Other 137,417 3,370 51,000
Total Expenditure 577,296 78,198 500,641
Net Operating Cost (266,499) 53,578 (318,268)
Profit (Loss) on Sale of Assets - - -
Depreciation - - -
Capital Works - - -
(266,499) 53,578 (318,268)
Description Budget Actual Budget Review
2014-15 30-Nov-14 2014-15
Community Development Revenue
Other Revenue (GST Free) 93,924 2,445 5,500
Other Revenue (GST Payable) 2,600 5,599 3,600
Grants - Recreational - -
Grants - Community Development -
Grants - Other Non Capital 111,600 50,000 70,600
Grants - Rural Primary Health Services (RPHS) 99,923 73,043 99,923
Youth Program Contributions 2,500 689 2,500
Subtotal Community & Economic Development (CDV) 310,547 131,777 182,123
SES & Emergency Management Revenue
SES Contributions - MAIB Refunds 250 - 250
Grants - Other GST free grants (Non Capital) - -
Subtotal SES & Emergency Management (SES) 250 - 250
Total Revenue Community Development. 310,797 131,777 182,373
Operating Budget - Revenue

Description Budget Actual Budget Review
2014-15 30-Nov-14 2014-15
Community & Economic Development Expenditure
Salaries & Wages 162,400 49,571 161,300
Overtime 2,000 119 2,000
Superannuation 20,300 6,147 20,162
Allowances 1,000 - 1,000
Training 1,500 91 1,500
Conferences and Seminars 2,000 - 2,000
Staff Amenities - -
Uniforms - 1,100
Audit Fees 300 382 300
Consulting / Contractor Services 164,058 3,909 164,058
Freight 500 179 500
General Expenses (including Programs) 55,908 4,416 58,908
Legal Expenses 3,000 1,350 3,000
Materials 4,000 324 4,000
Postage 600 202 600
Printing and Stationery 250 34 250
Plant Hire - Internal charges 1,127 4,000
Subscriptions/Publications - - -
Telephone inc Fax & Internet 3,500 1,232 3,500
Travel Expenses 4,000 1,382 4,000
Events & Promotion 132,417 3,370 46,000
Events & Promotion INKIND 5,000 5,000
Subtotal Community & Economic Development (CDV) 562,733 73,835 483,178
SES & Emergency Management Expenditure
Salaries & Wages 7,746 2,248 7,746
Superannuation 1,051 253 1,051
Allowances - -
Conferences and Seminars - -
Freight 500 143 500
General Expenses 2,000 773 2,000
Insurance - General 316 316 316
Licence Fees 50 50 50
Materials 1,000 - 1,000
Motor vehicle repairs & maintenance - - -
Repairs - Plant and Equipment - - -
Security & Fire Prevention - - -
SES MAIB related expenditure 500 - 500
Travel Expenses 1,500 581 1,500
Minor Plant Purchase (< $100) 200 - 200
Subtotal SES & Emergency Management (SES) 14,863 4,364 14,863
Total Expend. Community & Economic Development Divn. 577,596 78,198 498,041
Operating Budget - Expenditure

Depot and Plant Division
Core ActivitiesThe Depot and Plant Division is part of the Works & Services Department and covers the following areas:
- Depot and Plant
- Private Works
2013-14 BUDGET REVIEW
Depot and Plant Division Income Expenditure Net Cost
$ $ $
Depot and Plant 1,250 528,597 527,347
Private Works 331,293 136,479 (194,814)
Total Depot and Plant Division 332,543 665,076 332,533
Program: Depot and Plant Division
Description Budget Actual Budget Review
2014-15 30-Nov-14 2014-15
Operating Income $ $ $
User Charges 331,293 68,337 331,293
Reimbursements - - -
Grants - - -
Other 1,250 338 1,250
Total Income 332,543 68,676 332,543
Operating Expenditure
Employee Expenses 306,970 105,229 306,970
Materials & Supplies 86,106 38,836 83,606
Contracts 21,500 6,659 21,500
Depreciation 167,388 - 253,000
Other - - -
Total Expenditure 581,964 150,724 665,076
Net Operating Cost (249,421) (82,049) (332,533)
Profit (Loss) on Sale of Assets - - -
Depreciation 167,388 - 253,000
Capital Works (177,000) 142,305 (219,305)
(259,033) 60,256 (298,838)
Description Budget Actual Budget Review
2014-15 30-Nov-14 2014-15
Depot & Plant Revenue
Other Revenue (GST Free) 1,000 - 1,000
Other Revenue (GST Payable) 250 338 250
Materials Sales - -
Sale of Plant and Equipment - -
Sub-total Depot & Plant (PLT) 1,250 338 1,250
Private Works Revenue
Lady Barron Road - DOSG Contract 161,293 43,018 161,293
Private Works Sales 170,000 25,319 170,000
Sub-total Private Works (PVW) 331,293 68,337 331,293
Total Revenue Depot & Plant 332,543 68,676 332,543
Description Budget Actual Budget Review
2014-15 30-Nov-14 2014-15
Depot & Plant Expenditure
Salaries & Wages 177,058 75,175 177,058
Overtime 500 - 500
Medical Costs 500 - 500
Superannuation 22,132 8,455 22,132
Allowances - - -
Training 10,000 - 10,000
Conferences and Seminars 2,000 - 2,000
Staff Amenities - -
Advertising 550 - 550
Cleaning 1,200 897 1,200
Computer Consumables 500 - 500
Operating Budget - Revenue
Operating Budget - Expenditure

Consulting / Contractor Services 18,500 749 18,500
Energy (Gas & Electricity) 500 - 500
Freight 2,000 272 2,000
General Expenses 550 2,107 550
Insurance - General 4,631 493 4,631
Materials 6,000 2,336 6,000
Printing and Stationery 500 107 500
Protective Clothing & Safety Equipment 2,500 864 2,500
Plant Hire - Internal Charges 12,500 4,432 12,500
Repairs - Plant and Equipment 6,000 1,764 6,000
Security & Fire Prevention 600 277 600
Telephone incl Fax & Internet 2,675 761 2,675
Travel Expenses 3,000 394 3,000
Minor Plant Purchase (< $100) 1,200 - 1,200
Depreciation - Building 12,000 8,000
Depreciation - Plant & Equipment 155,388 245,000
Subtotal Depot & Plant (PLT) 442,984 99,081 528,597
Private Works Expenditure
Salaries and Wages 84,693 13,933 84,693
Overtime 500 197 500
Superannuation 10,587 1,996 10,587
Allowances 11,000 5,473 11,000
Analysis and Environmental Sampling Fees - -
Consulting / Contractor Services 3,000 5,910 3,000
Freight 1,200 1,494 1,200
General Expenses 500 1,481 500
Materials 10,000 7,835 10,000
Plant Hire - Internal Charges 15,000 13,325 15,000
Telephone inc Fax, Internet, pagers 2,500 - -
Subtotal Private Works (PVW) 138,980 51,643 136,479
Total Expenditure Depot & Plant 581,964 150,724 665,076

Significant Business Activity - Flinders Island Airport
Core ActivitiesThe Flinders Island Airport is a significant Business Activity of the organisation.
2013-14 BUDGET REVIEW
Flinders Island Airport Income Expenditure Net Cost
$ $ $
Total Flinders Island Airport 937,415 592,322 (345,093)
Program: Flinders Island Airport
Description Budget Actual Budget Review
2014-15 30-Nov-14 2014-15
Operating Income $ $ $
User Charges 267,600 121,816 261,000
Grants - Capital 628,815 - 628,815
Other 34,000 3,164 47,600
Total Income 930,415 124,981 937,415
Operating Expenditure
Employee Expenses 264,772 88,778 264,772
Materials & Supplies 120,550 36,809 120,550
Contracts 45,000 3,868 45,000
Depreciation 113,000 - 162,000
Other - - -
Total Expenditure 543,322 129,455 592,322
Net Operating Cost 387,093 (4,474) 345,093
Profit (Loss) on Sale of Assets 7,000 - 7,000
Depreciation 113,000 - 162,000
Capital Works (1,151,018) 60,482 (992,018)
(643,925) 56,008 (477,925)
Description Budget Actual Budget Review
2014-15 30-Nov-14 2014-15
Airport Revenue
Other Revenue (GST Payable) 6,600 2,209 6,600
Airport Landing Charges 85,000 37,886 85,000
Airport Passenger Service Charge 160,000 76,095 160,000
Airport Terminal Rental & Buildings 16,000 7,835 16,000
Airport Other Revenue 34,000 955 34,000
Grants - Other GST Free Grants (Capital) 628,815 - 628,815
Sale of Plant and Equipment 7,000 - 7,000
Total Airport Revenue (AIR) 937,415 124,981 937,415
Description Budget Actual Budget Review
2014-15 30-Nov-14 2014-15
Airport Expenditure
Salaries & Wages 187,797 66,709 187,797
Overtime 37,500 3,497 37,500
Superannuation 23,475 8,558 23,475
Allowances 16,000 5,520 16,000
Training 2,000 - 2,000
Conferences and Seminars 5,000 4,494 5,000
Uniforms & Protective Clothing 1,000 - 1,000
Staff Amenities - -
Audit Fees 200 - 200
Chemicals 2,000 442 2,000
Cleaning 500 538 500
Computer Consumables 250 - 250
Consulting / Contractor Services 45,000 3,868 45,000
Energy (Gas & Electricity) 6,000 1,801 6,000
Freight 2,500 612 2,500
General Expenses 1,000 126 1,000
Insurance - General 15,000 12,280 15,000
Licence Fees 1,000 284 1,000
Materials 25,000 8,351 25,000
Motor Fuel (Generator & Roller) 1,000 - 1,000
Postage 50 - 50
Printing and Stationery 750 71 750
Property Maintenance - - 4,000
Plant Hire - Internal Charges 22,000 9,085 22,000
Plant Hire - External 5,000 417 5,000
Repairs - Plant and Equipment 16,000 - 12,000
Security & Fire Prevention 5,000 346 5,000
Subscriptions/Publications 2,100 - 2,100
Telephone incl Fax & Internet 4,200 1,143 4,200
Travel Expenses 3,000 1,311 3,000
Depreciation - Land & Improvements 113,000 162,000
Total Airport Expenditure (AIR) 543,322 129,455 592,322
Operating Budget - Revenue
Operating Budget - Expenditure