Embed Size (px)
Citation preview

HALF-YEARLY REVIEW 2014-15«
18 December 2014

This statement is released in compliance with section 8 of the Public Finance and Audit Act 1983. This section requires the Treasurer by 31 December in each year, to publicly release a statement (the Half-Yearly Review) containing: § revised projections for the current financial year and an explanation of any significant variation in those
revised projections from the original budget time projections § revised forward estimates, for major aggregates, over 3 years § the latest economic projections for the current financial year and an explanation of any significant variation
from the budget time projections contained in the Budget Papers.
Section 8 also requires the Half-Yearly Review to be based on actual results as at the end of the previous October.
Also published with this statement are Uniform Presentation Framework (UPF) tables to meet Australian Loan Council reporting obligations.
Budget Paper No. 2 Budget Statement contains the full details of the 2014-15 Budget, as well as budget scope and other explanatory information. All financial statements presented are prepared in accordance with Australian Accounting Standard AASB 1049 Whole of Government and General Government Sector Financial Reporting.
Notes to using this report
The Budget year refers to 2014-15, while the forward estimates period refers to 2015-16, 2016-17 and 2017-18.
Figures in tables, charts and text have been rounded. Discrepancies between totals and sums of components reflect rounding. Percentage changes are based on unrounded estimates.
www.treasury.nsw.gov.au
2014-15 Half-Yearly Review

Table of Contents
Page
Chart and Table List
Chapter 1: Overview .................................................................................................................. 1
1.1 Economic Outlook ................................................................................................ 1
1.2 Fiscal Position and Outlook ................................................................................. 2
Chapter 2: Economic Outlook ............................................................................................... 5
2.1 New South Wales Economic Outlook .................................................................. 5
2.2 Australian Economic Outlook ............................................................................. 8
2.3 International Economic Outlook ......................................................................... 9
2.4 Risks to the Outlook ............................................................................................ 10
Chapter 3: Fiscal Position and Outlook ........................................................................... 11
3.1 2014-15 Budget Aggregates ............................................................................... 11
3.2 Budget Aggregates Forward Estimates .............................................................. 16
Appendices:
A: Management Representation and Independent Assurance Practitioner’s Report ............................................................................................ 27
B: Statement of Significant Accounting Policies and Forecast Assumptions ............................................................................................................ 33
C: Uniform Financial Reporting ................................................................................. 43
C.1 Uniform Presentation Tables ....................................................................... 43
C.2 Loan Council Allocation ............................................................................... 59
D: Variations on Year to Date .................................................................................... 61
2014-15 Half-Yearly Review

Chart and Table List
Page
1. Overview
State Final Demand Chart 1.1 1
General Government Sector Budget Result Chart 1.2 2
General Government Sector Net Debt Chart 1.3 3
2. Economic Outlook
New South Wales Economic Performance and Outlook Table 2.1 5
NSW Business Investment Growth Chart 2.1 6
NSW Employment and Domestic Demand Growth Chart 2.2 7
Australian Terms of Trade and the Exchange Rate Chart 2.3 8
3. Fiscal Position and Outlook
Operating Statement Aggregates Table 3.1 11
Summary of Revenue Table 3.2 12
Revenue Variations since the 2014-15 Budget Chart 3.1 12
Summary of Expenses Table 3.3 14
Expense Variations since the 2014-15 Budget Chart 3.2 15
Budget Result Reconciliation - Budget to Half-Yearly Review Table 3.4 16
Revenue Reconciliation - Budget to Half-Yearly Review Table 3.5 17
Comparison of Expected Revenue Growth Rate over the Forward Estimates Chart 3.3 19
Expense Reconciliation – Budget to Half-Yearly Review Table 3.6 19
Comparison of Expected Expense Growth Rate over the Forward Estimates Chart 3.4 20
Capital Reconciliation - Budget to Half-Yearly Review Table 3.7 21
B. Statement of Significant Accounting Policies and Forecast Assumptions
Key Economic Performance Assumptions Table B.1 36
Superannuation Assumptions – Pooled Fund / State Super Schemes Table B.2 39
C. Uniform Financial Reporting
General Government Sector Operating Statement Table C.1 44
General Government Sector Balance Sheet Table C.2 46
General Government Sector Cash Flow Statement Table C.3 47
Derivation of ABS GFS General Government Sector Cash Surplus/(Deficit) Table C.4 48
Public Non-Financial Corporation Sector Operating Statement Table C.5 49
Public Non-Financial Corporation Sector Balance Sheet Table C.6 51
Public Non-Financial Corporation Sector Cash Flow Statement Table C.7 52
Derivation of ABS GFS Public Non-Financial Corporation Sector Cash Surplus/(Deficit) Table C.8 53
Non-Financial Public Sector Operating Statement Table C.9 54
Non-Financial Public Sector Balance Sheet Table C.10 56
Non-Financial Public Sector Cash Flow Statement Table C.11 57
Derivation of ABS GFS Non-Financial Public Sector Cash Surplus/(Deficit) Table C.12 58
Loan Council Allocation Estimates Table C.13 59
D. Variations on Year to Date
General Government Sector Operating Statement Table D.1 62
General Government Sector Balance Sheet Table D.2 64
General Government Sector Cash Flow Statement Table D.3 65
2014-15 Half-Yearly Review

Chapter 1: Overview
The 2014-15 Half-Yearly Review provides an update to the State’s economic and fiscal position since the 2014-15 Budget and demonstrates the Government’s continued commitment to sound economic and financial management. It sets out the current economic and fiscal outlook for the State and describes material variations that have occurred since the 2014-15 Budget.
The Government’s economic and fiscal strategy continues to support the maintenance of the State’s triple-A credit rating, which ensures that State finances and services are sustainable over the long term. The Government’s strength in financial management was affirmed through the removal of the negative outlook on the State’s triple-A credit rating by Standard & Poor’s Ratings Services on 15 October 2014 and the affirmation of the triple-A rating by Moody’s Investors’ Service on 10 December 2014. Maintaining the rating ensures that New South Wales continues to have access to high quality, low cost debt markets.
1.1 Economic Outlook
The New South Wales economy is forecast to grow at a trend rate of 2¾ per cent in 2014-15 before accelerating to 3 per cent growth in 2015-16. While domestic demand within New South Wales remains forecast to grow at a strong 3¼ per cent, growth in Gross State Product (GSP) for 2014-15 has been revised down by ¼ of a percentage point compared with Budget, reflecting weakness in the rest of Australia. Growth in New South Wales is anticipated to pick up in 2015-16, consistent with an expected improvement in momentum nationally.
Chart 1.1: State Final Demand
Sep-04 Sep-06 Sep-08 Sep-10 Sep-12 Sep-14
NSW Rest of Australia
Supportive monetary policy and high population growth are expected to drive strong State Final Demand over the forecast period, led by ongoing solid household consumption growth, strength in dwelling and non-mining business investment, as well as high levels of public investment. The recent weakness in the labour market, together with slower-than-expected economic growth in 2013-14 and 2014-15, means the unemployment rate is expected to remain at around recent levels in the near term before trending lower through 2015-16, to average around 5½ per cent rather than 5¼ per cent as expected at Budget.
-2
-1
0
1
2
3
4
5
6
7
8
Thro
ugh
the y
ear
per c
ent
2014-15 Half-Yearly Review Page 1

The national economic outlook has been revised lower relative to Budget due to the impacts of recent falls in commodity prices on the terms of trade and business investment. The consequent decline in national income growth is expected to weigh on NSW domestic demand and the labour market. Chapter 2 provides an overview of the revised economic forecasts for the New South Wales, national and global economies.
1.2 Fiscal Position and Outlook
The 2014-15 Half-Yearly Review projects a strong fiscal outlook for New South Wales, with surpluses estimated in 2014-15 and across the forward estimates. As shown in Chart 1.2, the revised forecast Budget Result for 2014-15 is a surplus of $272 million, a turnaround of $555 million on the $283 million deficit forecast in the 2014-15 Budget. This result is largely driven by higher forecast revenues, specifically transfer duties, on the back of a stronger-than-expected property market.
A slightly smaller surplus than Budget of $402 million is now expected in 2015-16. Over the forward estimates, the benefits of the property market are increasingly offset by weaker payroll tax, on the back of softer employment in 2013-14 and 2014-15, and weaker mining royalties given the lower commodity prices now in prospect. However, surpluses exceeding $1.0 billion are still projected for each of 2016-17 and 2017-18. The fiscal outlook will enable the Government to fund a portion of its infrastructure program through the recurrent budget and provides the budget with flexibility to respond to emerging fiscal pressures and priorities.
Chart 1.2: General Government Sector Budget Result
-0.5
0.0
0.5
1.0
1.5
2.0
2.5
$ bi
llion
s
2013-14 2014-15 2015-16 2016-17 2017-18
2014-15 Budget Half-Yearly Review
Budget aggregates have been adversely impacted by the treatment of contributions tax under the revised Australian Accounting Standard (AASB) 119 Employee Benefits (a deterioration of $1.2 billion over the four years to 2017-18). There is a further $862 million reduction in dividends and tax equivalent payments from the electricity network businesses over the four years to 2017-18 associated with the draft determinations recently released by the Australian Energy Regulator.
Page 2 2014-15 Half-Yearly Review

Continued fiscal discipline has allowed the Government to deliver surpluses and commit additional funds to a number of important new initiatives in the 2014-15 Half-Yearly Review. This includes initial funding for the Newcastle Revitalisation Program through the truncation of heavy rail and a new transport interchange at Wickham. Additional grants are also being provided to a number of Local Government Areas for water security projects through Restart NSW. These measures continue the Government’s plan to build the infrastructure that is required for the future productivity and welfare of New South Wales.
The strength of the State’s fiscal outlook is also reflected in improvements in net debt, with a projected reduction in net debt of $2.1 billion in 2017-18 compared with the 2014-15 Budget estimates. Net debt is projected to decline to $9.3 billion in June 2015 (1.8 per cent of GSP) and $10.7 billion in June 2018 (1.8 per cent of GSP). This significant improvement in the State’s net debt position reflects the improved 2013-14 operating result and the sale of Macquarie Generation assets in September 2014. Together with a continued focus on asset recycling, this places the State in a strong position to undertake the necessary investments in productive infrastructure that will drive future economic prosperity, without placing excessive pressure on debt levels or the credit metrics. Chart 1.3 demonstrates the strong improvement in net debt since the 2014-15 Budget.
Chart 1.3: General Government Sector Net Debt
0.0
2.0
4.0
6.0
8.0
10.0
12.0
14.0
16.0
$ bi
llion
s
2013-14 2014-15 2015-16 2016-17 2017-18
2014-15 Budget Half-Yearly Review
The 2014-15 Half-Yearly Review is prepared on the basis of the best available information up to 12 December 2014 and includes a number of economic and other assumptions. Changes in these assumptions and forecasts can impact on the fiscal aggregates. Fiscal risks in this Half-Yearly Review include State taxation revenues, which are based on available economic projections, and Commonwealth grants, which are largely estimated on the basis of the Commonwealth’s 2014-15 Budget.
Chapter 3 provides an overview of the revised revenue and expenditure estimates for the current year and the forward estimates years (2015-16 to 2017-18), and provides comprehensive information on fiscal risks.
2014-15 Half-Yearly Review Page 3

This page is intentionally left blank
Page 4 2014-15 Half-Yearly Review

Chapter 2: Economic Outlook
In 2013-14 economic activity in New South Wales showed increasing strength, with strong NSW domestic demand growth outpacing that of other states. Relative weakness in national demand, however, resulted in lower economic growth than expected at Budget. Sharp falls in global commodity prices led to a faster decline in the terms of trade than previously anticipated. This flowed through to weaker income growth and has had consequent dampening effects on business investment, the labour market and demand.
This pattern is set to continue in 2014-15, with strong NSW domestic demand expected to be tempered by weakness in the rest of Australia. NSW demand will be driven by continued solid household consumption, an emerging recovery in non-mining business investment, sustained strength in dwelling investment, and high levels of Government investment. The downgrade to the national outlook, however, means that while forecast NSW domestic demand growth remains in line with Budget, the outlook for Gross State Product (GSP) growth is slightly softer. GSP growth is now anticipated to strengthen to around trend in 2014-15, before accelerating to above trend in 2015-16 as the national economy gains momentum.
2.1 New South Wales Economic Outlook
Low interest rates, a surging property market, high population growth and a relatively low exposure to mining saw State Final Demand (SFD) growth pick up strongly through the second half of 2013-14, with this momentum continuing into the September quarter of 2014. Through the year SFD growth has remained well above other states for the last four quarters. However, NSW GSP growth in 2013-14, at 2.1 per cent, was lower than expected at Budget. The divergence reflected a substantial adverse impact from the balancing item—made up of inventories, interstate trade and other overseas trade adjustments—which detracted 1.3 percentage points from overall growth, largely due to relatively weak net export performance.
Table 2.1: New South Wales Economic Performance and Outlook(a)1
2013-14 2014-15 2015-16 2016-17 and 2017-18(b)
Budget Revised Budget Revised Budget Revised Outcome
Forecast Forecast Forecast Forecast Projection Projection
Real State Final Demand 2.6 3¼ 3¼ 3¼ 3¼
Real Gross State Product 2.1 3 2¾ 3 3 2¾ 2¾
Employment 0.5 1¾ 1¼ 2 2 1¼ 1½
Unemployment Rate(c) 5.7 5½ 5¾ 5¼ 5½
Sydney CPI(d) 2.5 2¼ 2 2¾ 2¾ 2½ 2½
- through the year to June quarter(d) 2.8 2¼ 2 2¾ 2¾
Wage Price Index 2.5 3 2½ 3½ 3¼ 3½ 3½
Nominal Gross State Product 3.1 4¾ 5 5¼ 5¼
(a) Per cent change, year average, unless otherwise indicated. (b) Average across 2016-17 and 2017-18. (c) Year average, per cent. (d) 2014-15 includes a ¾ of a percentage point detraction from the abolition of the carbon tax. 2014-15 to 2016-17 include a ¼ of a percentage point
increase due to tobacco excise increases.
Economic forecasts are based on data available at the time they were prepared, which includes results to June 2014 for Gross State Product, to the June quarter 2014 for State Final Demand, to the September quarter 2014 for Consumer Price Index and Wage Price Index, to the March quarter 2014 for population, and to October 2014 for the labour force.
2014-15 Half-Yearly Review Page 5
1

In 2014-15 above-trend domestic demand growth of 3¼ per cent is expected, in line with Budget. With net export (overseas and interstate) performance forecast to weigh more heavily than at Budget, the expectation for GSP growth has been revised down by ¼ of a percentage point, to 2¾ per cent. By 2015-16, as the national and global economies strengthen, net export performance is expected to improve, narrowing the wedge between domestic demand growth and GSP growth. The 2015-16 forecast for domestic demand growth therefore remains unchanged at 3¼ per cent, with GSP growth rising to an above-trend rate of 3 per cent.
Chart 2.1: NSW Business Investment Growth
-10
-5
0
5
10
15
20
Per c
ent
Forecast
01/02 03/04 05/06 07/08 09/10 11/12 13/14 15/16 Mining investment (contribution) Non-mining business investment (contribution) Underlying business investment
As at Budget, the outlook for 2014-15 continues to reflect solid growth in household consumption and accelerating dwelling investment growth. More supportive conditions, including a lower exchange rate, imply an earlier pick-up in non-mining business investment and stronger growth in overseas non-commodity exports. Offsetting these are weaker contributions from commodities exports than at Budget, driven by lower global commodity demand, drier-than-average farm conditions and weaker interstate demand.
Expectations for economic growth in 2015-16 are in line with Budget, with momentum expected to be maintained by strengthening non-mining business investment growth and improving net exports. Dwelling investment growth is expected to moderate, though remain solid. Household consumption growth is forecast to be underpinned by stronger labour income growth, even as house price growth is anticipated to slow.
Components of GSP
Consistent with Budget, household consumption is forecast to remain the main driver of economic growth through 2014-15, bolstered by high population growth and wealth gains from strong house price growth. Historically low interest rates, the removal of the carbon tax and declining petrol prices will support real household disposable income in the near term, offsetting slightly weaker wage and employment growth.
Increases in house prices, strong population growth, low interest rates, State Government policy measures and an ongoing housing undersupply will support continued strength in dwelling investment through 2014-15 and 2015-16. Combined with the early signs of the long-awaited resurgence in alterations and additions activity, this has seen the 2014-15 forecast for dwelling investment growth revised up slightly relative to Budget, before returning closer to trend in 2015-16. While building approvals have eased in recent months, they remain at high levels and there is a solid pipeline of residential work yet to be done which will provide ongoing support to the housing construction sector.
Page 6 2014-15 Half-Yearly Review

Mining investment is forecast to be a continuing drag on growth. However, its impact will be smaller than anticipated at Budget, given the larger-than-expected declines seen in 2013-14 prompted by sharp falls in global commodity prices, particularly for coal. The recent pick-up in non-mining business investment and improving leading indicators have seen the outlook for business investment revised up compared to Budget. Commercial lending continues to grow strongly as does the pipeline of non-residential building work. A lower exchange rate, increases in capacity utilisation and improved non-mining investment intentions suggest a stronger resurgence in business investment than at Budget. This growth is expected to be led by spending on machinery and equipment and non-residential building, while the decline in mining investment will continue to weigh on engineering construction.
Public demand will continue to contribute modestly to growth over the next two years, however, fiscal restraint at all levels of government is expected to moderate public demand growth. State public investment is expected to remain at high levels and provide support for NSW economic activity.
Net exports are expected to weigh on GSP growth in 2014-15, caused by weakness from interstate demand and strong import growth. By 2015-16 an expected pick-up in interstate and overseas demand will have gained momentum, easing the drag from net export growth. The recent sharp depreciation in the exchange rate, if sustained, will help boost Australia’s global competitiveness and provide some support for international exports. However, rural exports are expected to remain subdued in the near term due to drier-than-average conditions, and weaker global demand for commodities is anticipated to weigh on the contribution from coal exports. Imports are expected to grow strongly over the next two years in line with robust NSW domestic demand growth.
Labour market
NSW employment grew by 0.5 per cent in 2013-14, in line with Budget expectations. Strong growth in domestic demand and leading indicators (such as job ads) point to a strengthening of labour demand through the rest of the year, resulting in forecast employment growth of 1¼ per cent in 2014-15, down by ½ of a percentage point since Budget. This revision reflects the lagged effects of weaker GSP growth in 2013-14 and downward revisions to GSP growth in 2014-15. Slightly softer employment growth, combined with stronger forecast population growth, as labour is drawn into New South Wales given its relative economic strength, is now expected to result in the unemployment rate remaining at around recent levels through 2014-15.
Chart 2.2: NSW Employment and Domestic Demand Growth
Thro
ugh
the y
ear p
er ce
nt
7
6
5
4
3
2
1
0
-1
-2 Dec-04 Dec-06 Dec-08 Dec-10 Dec-12 Dec-14
Employment Real SFD - 2 quarter lead
2014-15 Half-Yearly Review Page 7

Employment growth is forecast to accelerate to an above-trend rate of 2 per cent in 2015-16, consistent with above-trend GSP growth. This is expected to result in the unemployment rate trending down through 2015-16, averaging 5½ per cent.
Wages and prices
Expectations of a softer labour market, combined with more subdued recent Wage Price Index (WPI) outcomes, have resulted in a downward revision to expected growth in the WPI across the forecast period. Broader measures of employee compensation from the National Accounts have been stronger recently, reflecting a shift towards full-time employment, increases in employer superannuation contributions and a gradual return of employee bonus payments. Even with above-trend employment growth in 2015-16, wage pressures are expected to remain well-contained given continuing spare labour capacity.
In year-average terms, the Sydney Consumer Price Index (CPI) grew by 2.5 per cent in 2013-14, in line with Budget expectations. Since Budget, the fall in global oil prices, weaker wage and price expectations and a more subdued labour market are expected to put downward pressure on prices, partly offset by a lower exchange rate. These factors are expected to weigh on prices in 2014-15, leading to a ¼ of a percentage point downward revision to Sydney CPI. For 2015-16 the outlook for CPI remains unchanged relative to Budget. These forecasts include the impacts of the abolition of the carbon tax and the increase in the tobacco excise, as was the case at Budget.
2.2 Australian Economic Outlook
The outlook for the national economy has been revised down since Budget as recent falls in global commodity prices weigh on the outlook for net exports and the terms of trade. The consequent decline in national income growth will impact domestic demand and the labour market. Softer demand growth for non-rural commodities coupled with increased supply, particularly for iron ore, is driving down global non-rural commodity prices. While declining oil prices have had some offsetting effect, the overall impact is for steeper declines in the terms of trade than forecast at Budget. Softer global non-rural commodity demand will also see a weaker net export performance, particularly in 2014-15.
Chart 2.3: Australian Terms of Trade and the Exchange Rate
50
60
70
80
90
100
110
120
130
0.40
0.50
0.60
0.70
0.80
0.90
1.00
1.10
1.20
Index USD
Sep-1999 Sep-2002 Sep-2005 Sep-2008 Sep-2011 Sep-2014
AUD/USD (LHS) Terms of Trade (RHS)
Page 8 2014-15 Half-Yearly Review
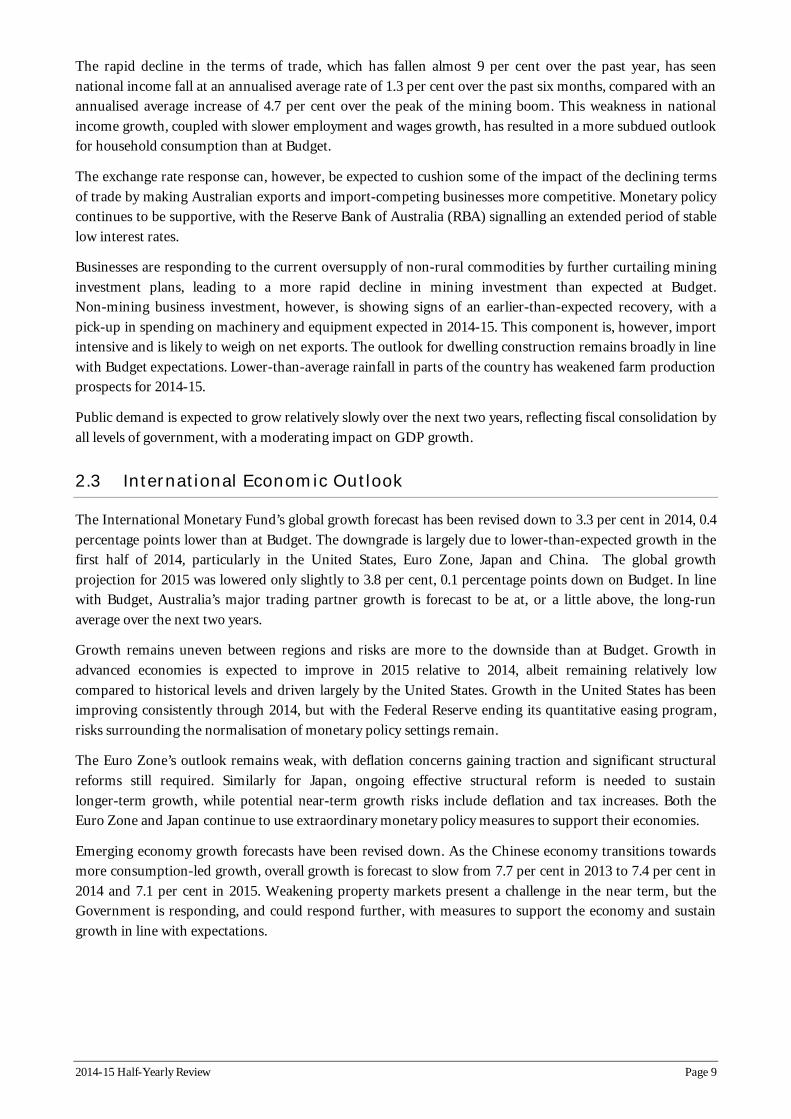
The rapid decline in the terms of trade, which has fallen almost 9 per cent over the past year, has seen national income fall at an annualised average rate of 1.3 per cent over the past six months, compared with an annualised average increase of 4.7 per cent over the peak of the mining boom. This weakness in national income growth, coupled with slower employment and wages growth, has resulted in a more subdued outlook for household consumption than at Budget.
The exchange rate response can, however, be expected to cushion some of the impact of the declining terms of trade by making Australian exports and import-competing businesses more competitive. Monetary policy continues to be supportive, with the Reserve Bank of Australia (RBA) signalling an extended period of stable low interest rates.
Businesses are responding to the current oversupply of non-rural commodities by further curtailing mining investment plans, leading to a more rapid decline in mining investment than expected at Budget. Non-mining business investment, however, is showing signs of an earlier-than-expected recovery, with a pick-up in spending on machinery and equipment expected in 2014-15. This component is, however, import intensive and is likely to weigh on net exports. The outlook for dwelling construction remains broadly in line with Budget expectations. Lower-than-average rainfall in parts of the country has weakened farm production prospects for 2014-15.
Public demand is expected to grow relatively slowly over the next two years, reflecting fiscal consolidation by all levels of government, with a moderating impact on GDP growth.
2.3 International Economic Outlook
The International Monetary Fund’s global growth forecast has been revised down to 3.3 per cent in 2014, 0.4 percentage points lower than at Budget. The downgrade is largely due to lower-than-expected growth in the first half of 2014, particularly in the United States, Euro Zone, Japan and China. The global growth projection for 2015 was lowered only slightly to 3.8 per cent, 0.1 percentage points down on Budget. In line with Budget, Australia’s major trading partner growth is forecast to be at, or a little above, the long-run average over the next two years.
Growth remains uneven between regions and risks are more to the downside than at Budget. Growth in advanced economies is expected to improve in 2015 relative to 2014, albeit remaining relatively low compared to historical levels and driven largely by the United States. Growth in the United States has been improving consistently through 2014, but with the Federal Reserve ending its quantitative easing program, risks surrounding the normalisation of monetary policy settings remain.
The Euro Zone’s outlook remains weak, with deflation concerns gaining traction and significant structural reforms still required. Similarly for Japan, ongoing effective structural reform is needed to sustain longer-term growth, while potential near-term growth risks include deflation and tax increases. Both the Euro Zone and Japan continue to use extraordinary monetary policy measures to support their economies.
Emerging economy growth forecasts have been revised down. As the Chinese economy transitions towards more consumption-led growth, overall growth is forecast to slow from 7.7 per cent in 2013 to 7.4 per cent in 2014 and 7.1 per cent in 2015. Weakening property markets present a challenge in the near term, but the Government is responding, and could respond further, with measures to support the economy and sustain growth in line with expectations.
2014-15 Half-Yearly Review Page 9

2.4 Risks to the Outlook
Risks to the outlook are slightly more to the downside than at Budget. Globally, risks include deeper-thanexpected downturns in the Euro Zone and Japan spreading more widely and deflationary expectations becoming more entrenched. Nationally, weaker-than-expected non-rural commodity prices could adversely affect the terms of trade, further constraining national income, the viability of some mining operations and economic activity more generally.
There is considerable uncertainty around the timing and strength of the increase in non-mining business investment, presenting both upside and downside risks to the central forecast scenario. In New South Wales, a sharper-than-expected slowing in house price growth may have implications for broader dwelling investment activity as well as for household consumption.
Were downside risks to eventuate, current policy settings provide flexibility to respond to sustained low income growth and weakening demand. Relatively low levels of net debt provide the Commonwealth with the capacity to adjust its pace of fiscal consolidation. Moreover, the RBA retains scope to lower interest rates further given inflationary and wage pressures appear well contained.
Page 10 2014-15 Half-Yearly Review

Chapter 3: Fiscal Position and Outlook
This chapter updates the financial position of the NSW general government sector (GGS). Estimates take account of policy decisions of the NSW Government, known revisions to Commonwealth Government funding and other information affecting the financial statements since the 2014-15 Budget, up to 12 December 2014.
The Budget Result for 2014-15 is now forecast to be in surplus by $272 million, compared to a $283 million deficit forecast at the time of the Budget. Surpluses are projected over the forward estimates.
Table 3.1: Operating Statement Aggregates
2013-14 Actual
$m
2014-15 Budget
$m
2014-15 Revised
$m
2015-16
$m
2016-17 2017-18 Forward Estimates
$m $m
Revenue Expenses Budget Result
66,005 64,757
1,247
67,113 67,396
-283
67,858 67,586
272
70,041 69,640
402
73,559 72,463
1,096
74,942 73,903
1,038
3.1 2014-15 Budget Aggregates
The $272 million surplus now forecast for 2014-15 represents a $555 million improvement since the 2014-15 Budget. It reflects an upwards revision since the Budget in forecast revenues of $745 million associated with higher-than-expected transfer duties on the back of a stronger-than-expected property market. The increase in revenues more than offsets a $190 million increase in forecast expenses since the 2014-15 Budget. The revised expenses estimate is more than accounted for by an adjustment associated with the revised Australian Accounting Standard (AASB) 119 Employee Benefits (see Box 3.1).
The 2014-15 Budget took into account the significant changes in the expected timing of Commonwealth grants, particularly transport. Without the reprofiling of grants, the Budget Result for 2014-15 would now be in surplus by around $1 billion. The Budget estimates do not include the impact of any incomplete business asset sale or lease transactions, or associated new capital and operational spending. Consistent with past practice, such impacts are only recognised when a transaction is finalised.
Box 3.1 Impact of the revised AASB 119 Employee Benefits
The State adopted the revised AASB 119 Employee Benefits in 2013-14. The 2014-15 Budget incorporated the impact of the revised calculation of the superannuation interest expense, which is now based on applying the long-term government bond rate to the net defined benefit liability. Since the Budget, further interpretations of the updated guidance on accounting for the superannuation contributions tax for defined benefit schemes were made available. As a result, the net defined benefit superannuation liability was increased (grossed up) by an amount representing superannuation contributions tax payable on future contributions required to fund the liability. This change was reflected in the audited Total State Sectors Accounts (TSSA) for 2013-14.
The Half-Yearly Review now records the impact of the contributions tax change going forward, resulting in higher defined benefit superannuation expenses in the operating statement and higher superannuation liabilities. For 2014-15, the change worsens the Budget Result by $316 million and on average, over the forward estimates, by around $280 million each year. In addition, the change increases the net defined benefit superannuation liability by around $5.7 billion for the GGS and on average by around $4.4 billion across the forward estimates.
2014-15 Half-Yearly Review Page 11

2014-15 revenue outlook
Table 3.2 summarises the revenue from transactions for the GGS.
Table 3.2: Summary of Revenue
2013-14 2014-15 2014-15 2015-16 2016-17 2017-18 Actual Budget Revised Forward Estimates
$m $m $m $m $m $m
Revenue from Transactions Taxation 24,295 25,489 25,923 27,256 28,304 29,840 Grants and Subsidies
Commonwealth General Purpose 15,894 16,810 16,948 17,717 18,367 18,988 Commonwealth Specific Purpose Payments 7,449 7,829 7,943 8,484 9,267 9,759 Commonwealth National Partnership Payments 3,963 2,632 2,592 2,675 3,447 2,281 Other Grants and Subsidies 1,026 1,029 1,027 1,039 987 742
Sale of Goods and Services 5,677 6,094 6,099 6,454 6,731 6,807 Interest 609 543 623 570 579 554 Dividend and Income Tax Equivalents from Other Sectors 2,260 2,336 2,436 1,445 1,266 1,108 Other Dividends and Distributions 700 370 382 426 458 484 Fines, Regulatory Fees and Other 4,133 3,981 3,886 3,975 4,154 4,379
Total Revenue from Transactions 66,005 67,113 67,858 70,041 73,559 74,942
Forecast general government total revenue in 2014-15 is $745 million higher than expected at Budget. This increase is predominantly driven by stronger forecast State taxation revenues. In particular, transfer duties are forecast to be markedly higher, driven by continuing strength in the property market that has extended further than anticipated at Budget. Offsetting this increase, and being reflected in collections, is an expectation of lower payroll tax due to a softer employment outlook and a reduction in mining royalties because of lower-than-expected commodity prices. Total dividend and income tax equivalent payments, predominantly from the water sector, as well as interest receipts are all higher than expected at Budget. Chart 3.1 shows the main revenue variations since the 2014-15 Budget. A detailed reconciliation of revenue changes since the Budget for 2014-15 and the forward estimates is shown in Table 3.5.
Chart 3.1: Revenue Variations since the 2014-15 Budget
Transfer Duty Payroll Tax Dividend and Income Fines, Regulatory Fees Other Revenue Tax Equivalents from and Other
Other Sectors
66,600
66,800
67,000
67,200
67,400
67,600
67,800
68,000
$ m
illio
ns
2014-15 Budget Total Revenue Decrease in Revenue Increase in Revenue 2014-15 Half-Yearly Review Total Revenue
Page 12 2014-15 Half-Yearly Review

At a detailed level, the main variations underlying the forecast increase of $745 million in revenue since the Budget are:
§ State taxation revenue is expected to be $434 million higher than at Budget:
– Transfer duty is continuing to exceed expectations following the very strong growth experienced in 2012-13 and 2013-14. The extended period of low interest rates and the higher-than-expected demand for property are underpinning further strong increases in transfer duty as the current buoyant market conditions persist. Residential transfer duty is now expected to increase by 12 per cent in 2014-15, following growth of 40 per cent in 2013-14 and 21 per cent in 2012-13. The stronger growth in transfer duty in 2014-15 is being principally supported by higher house prices than expected at Budget. Commercial and industrial property transfers have been stronger than expected at Budget.
– Payroll tax collections in 2014-15 have been weaker than expected at Budget and forecast employment growth in 2014-15 has been revised downward in the Half-Yearly Review.
§ GST grants revenue is projected to be $138 million higher, $122 million of which reflects a higher national GST pool in 2013-14 than the Commonwealth 2014-15 Budget forecast.
§ Other Commonwealth grants revenue is anticipated to be higher, in net terms, by $74 million, reflecting changes in the timing of Specific Purpose Payments and National Partnership Payments from 2013-14 to 2014-15. This relates principally to education, indigenous housing and coal seam gas programs, which are partly offset by reprofiling of transport payments into the forward estimates.
§ Total dividend and income tax equivalent payments are expected to be higher by $100 million in 2014-15, largely as a result of higher dividends paid by the metropolitan water sector, in turn associated with higher metropolitan water sales.
§ Interest income is expected to be higher by $80 million in 2014-15 compared to Budget, reflecting higher cash balances principally resulting from divestment of Government assets and better-thananticipated budget outcomes.
§ Fines, regulatory fees and other revenues is expected to be lower by $95 million principally due to weakness in mining royalties in 2014-15, which are expected to be $242 million lower than at Budget. This is largely due to a change in market conditions including lower international coal prices and a reduction in anticipated coal volumes. The lower Australian dollar is expected to only partly offset the effect of the lower prices.
2014-15 Half-Yearly Review Page 13
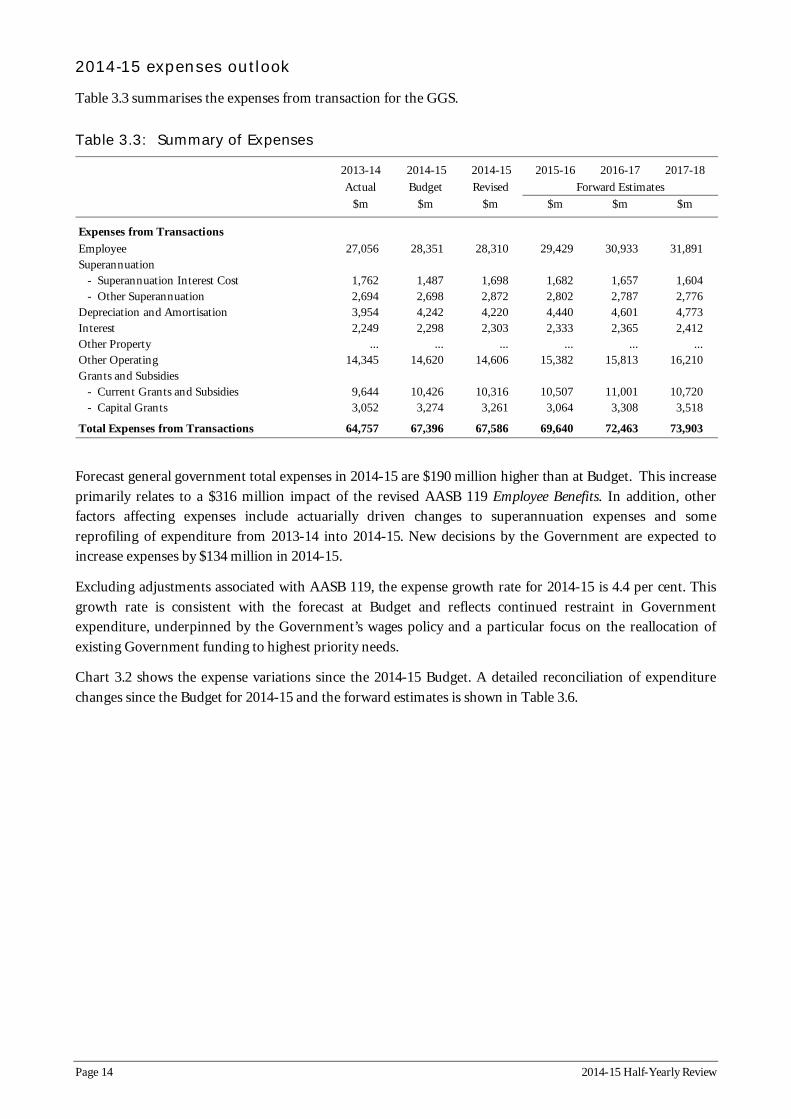
2014-15 expenses outlook
Table 3.3 summarises the expenses from transaction for the GGS.
Table 3.3: Summary of Expenses
2013-14 2014-15 2014-15 2015-16 2016-17 2017-18 Actual Budget Revised Forward Estimates
$m $m $m $m $m $m
Expenses from Transactions Employee 27,056 28,351 28,310 29,429 30,933 31,891 Superannuation
Superannuation Interest Cost 1,762 1,487 1,698 1,682 1,657 1,604 Other Superannuation 2,694 2,698 2,872 2,802 2,787 2,776
Depreciation and Amortisation 3,954 4,242 4,220 4,440 4,601 4,773 Interest 2,249 2,298 2,303 2,333 2,365 2,412 Other Property ... ... ... ... ... ... Other Operating 14,345 14,620 14,606 15,382 15,813 16,210 Grants and Subsidies
Current Grants and Subsidies 9,644 10,426 10,316 10,507 11,001 10,720 Capital Grants 3,052 3,274 3,261 3,064 3,308 3,518
Total Expenses from Transactions 64,757 67,396 67,586 69,640 72,463 73,903
Forecast general government total expenses in 2014-15 are $190 million higher than at Budget. This increase primarily relates to a $316 million impact of the revised AASB 119 Employee Benefits. In addition, other factors affecting expenses include actuarially driven changes to superannuation expenses and some reprofiling of expenditure from 2013-14 into 2014-15. New decisions by the Government are expected to increase expenses by $134 million in 2014-15.
Excluding adjustments associated with AASB 119, the expense growth rate for 2014-15 is 4.4 per cent. This growth rate is consistent with the forecast at Budget and reflects continued restraint in Government expenditure, underpinned by the Government’s wages policy and a particular focus on the reallocation of existing Government funding to highest priority needs.
Chart 3.2 shows the expense variations since the 2014-15 Budget. A detailed reconciliation of expenditure changes since the Budget for 2014-15 and the forward estimates is shown in Table 3.6.
Page 14 2014-15 Half-Yearly Review

Chart 3.2: Expense Variations since the 2014-15 Budget
67,100
67,200
67,300
67,400
67,500
67,600
67,700
67,800
67,900 $
mill
ions
Superannuation Superannuation Interest Economic Other Parameters New Policy (AASB119) (Other) Parameters
Decrease in Expenses 2014-15 Budget Total Expenses Increase in Expenses 2014-15 Half-Yearly Review Total Expenses
The main expense variations underlying the forecast increase of $190 million in 2014-15 since the Budget are parameter and technical adjustments associated with:
§ Actuarial changes which increased expenses by $385 million since the Budget, reflecting:
– Revisions to the Employee Benefits (AASB 119) Standard. A requirement to take into account contributions tax has resulted in the recognition of an increased expense of $316 million in 2014-15. In practice, contributions tax will be offset by franking credits earned on investment income.
– Changes in the assumptions associated with the second tranche of workers compensation legislation reform amendments that were introduced to offset the statutory requirements of earlier amendments to the scheme. This added an estimated $69 million to expenses.
§ Lower-than-anticipated expenses related to New South Wales Self Insurance Corporation actuarial adjustments ($99 million) and changes in the timing of expense profiles, particularly recurrent and capital grants.
§ New policy initiatives added only $134 million to expenses as they have largely been met from within existing departmental resources, with a primary impact on other operating expenses. The main decisions by the Government since the Budget affecting 2014-15 include:
§ expanding the Crime Prevention Grant Program in 2014-15 to allow non-government organisations and businesses to participate
§ funding to deliver the Plan for Growing Sydney
§ supporting the Accelerated Planning Assessment and Compliance Program, which is a two-staged review and reform program designed to accelerate assessment timelines and increase assessment compliance
§ supporting energy efficiency programs under the Energy Efficiency Action Plan, which was released in August 2013
§ funding the Newcastle Revitalisation Program, which includes the truncation of heavy rail as well as a new transport interchange at Wickham, including interim bus services
§ funding for the first and second tranches of the Local Government Areas for Water Security projects.
2014-15 Half-Yearly Review Page 15

3.2 Budget Aggregates Forward Estimates
Table 3.4 provides a reconciliation of changes to the Budget Result in 2014-15 and the forward estimates between the 2014-15 Budget and the 2014-15 Half-Yearly Review. It separately identifies the effect of policy decisions and the effect of parameter and other variations. Changes in policy arise from Government decisions while parameter and other variations reflect the impact of changing economic conditions, budget assumptions, tied grants from the Commonwealth and other accounting adjustments.
Table 3.4: Budget Result Reconciliation – Budget to Half-Yearly Review
2014-15 2015-16 2016-17 2017-18 Forward Estimates
$m $m $m $m
2014-15 Budget -283 660 2,155 1,666
Changes from 2014-15 Budget to 2014-15 Half-Yearly Review
Effect of Policy Decisions Revenues 1 3 5 6 Expenses -134 -128 -175 -92
Total Policy Decisions -133 -125 -170 -86
Effect of Parameter and Other Variations Revenues 744 113 -176 -374 Expenses -56 -246 -713 -167
Total of Parameter and Other Variations 688 -133 -889 -541
Total Variation 555 -258 -1,059 -627
2014-15 Half-Yearly Review 272 402 1,096 1,038
The $272 million surplus in 2014-15 is a $555 million improvement on the $283 million deficit forecast at the 2014-15 Budget and mainly reflects an upwards revision in forecast revenue associated with higher-thananticipated transfer duties. The forecast Budget Result would be in surplus by $588 million if not for the additional adjustments associated with the revised AASB119 Standard.
The Budget Result is expected to remain in surplus over the forward estimates. However, the surpluses now projected over 2015-16 to 2017-18 are softer than those forecast at the time of the 2014-15 Budget.
The softer revenue outlook over the forward estimates reflects an assumption of a steadying in the property market resulting in smaller contributions in transfer duties in the out-years ($1.8 billion), combined with downward revisions to payroll taxes ($1 billion) and mining royalties ($653 million). The lower payroll tax estimates reflect softer employment growth in 2013-14 and 2014-15, while mining royalties have been affected by lower commodity prices. Dividends are forecast to reduce with the commencement of the regulator’s new pricing determinations (refer to Box 3.2).
Higher expenses across the forward estimates predominantly reflect the ongoing impact of the revised AASB 119 Standard ($841 million), actuarial adjustments ($197 million) and changes in the expected timing of recurrent expenditure ($147 million). Of the $1.9 billion decline in the Budget Result across the 2015-16 to 2017-18 forward estimates period, decisions taken by the Government contribute only $381 million.
Page 16 2014-15 Half-Yearly Review

Forward estimates revenue outlook
Compared to the Budget, revenue is broadly unchanged in 2015-16 and detracts $539 million from the expected Budget Result across 2016-17 and 2017-18. Table 3.5 provides a reconciliation of Budget revenue aggregates between the 2014-15 Budget and the Half-Yearly Review.
Table 3.5: Revenue Reconciliation - Budget to Half-Yearly Review
2014-15 2015-16 2016-17 2017-18 Forward Estimates
$m $m $m $m
Revenue - 2014-15 Budget 67,113 69,925 73,730 75,310 Revenue Changes since Budget
Policy - Tax ... ... ... ... Other 1 3 5 6
Total Policy 1 3 5 6 Parameter and Other Budget Variations
- Transfer Duty 744 624 567 564 - Other Taxes -310 -272 -338 -388 - Roy alties -242 -233 -225 -195
Other 552 -6 -180 -355 Total Parameter and Other Budget Variations 744 113 -176 -374
Total Revenue Variations since 2014-15 Budget 745 116 -171 -368
Revenue - 2014-15 Half-Yearly Review 67,858 70,041 73,559 74,942
Total revenue over the forward estimates is estimated to be $423 million lower than at Budget. Over the forward estimates, revenue will be affected by slower growth in the NSW property market, softer employment and weaker commodity prices, with the latter partially offset by a lower Australian dollar.
Taxation revenue has been revised upwards by $757 million over the forward estimates compared to Budget, with higher transfer duty of $1.8 billion offset by lower-than-expected payroll tax of around $1 billion. Transfer duty is forecast to continue growing over the forward estimates but at a slower rate. Increased supply of dwellings is expected to lead to slower price growth over the forward estimates, contributing to the moderation in transfer duty growth.
Payroll tax has been revised down over the forward estimates compared to Budget mainly reflecting the impact of softer employment growth in 2013-14 and 2014-15.
There is a reduction in forecast revenue from mining royalties of $653 million. The revision to mining royalties over the forward estimates reflects lower thermal coal prices, partially offset by the lower Australian dollar. Lower thermal coal prices are estimated to have reduced the Budget Result by around $560 million over the three years to 2017-18. The recent deterioration in coal prices was reflected in lower-thananticipated royalties in the first quarter of 2014-15.
Dividends and tax equivalent payments from Government-owned businesses have been revised downwards by around $1 billion over the forward estimates since Budget. This primarily reflects the impact of the Australian Energy Regulator (AER) draft determinations released on 27 November 2014, which affect the Government’s electricity network businesses (TransGrid, Ausgrid, Endeavour Energy and Essential Energy). The draft determinations propose a lower Weighted Average Cost of Capital (WACC) allowance and reductions in network operating and capital costs that can be charged to customers. The reductions for the network businesses are between 24 per cent and 35 per cent of revenue over the next regulatory period.
2014-15 Half-Yearly Review Page 17

Only the potential changes in the regulatory WACC allowance have been reflected in the Half-Yearly Review as the allowance methodology has been the subject of wide consultation and is relatively well understood. This results in a reduction in dividend and tax revenue of $209 million in 2015-16 and $653 million over the remaining forward estimates. The proposed capital and operating expenditure allowances in the draft determinations have not been included in the Half-Yearly Review due to the ongoing development of the AER’s position, of which the draft determinations are a part. The AER will consider further submissions on these allowances before finalising its position. Refer to Box 3.2 for more information.
Box 3.2 Australian Energy Regulator Draft Revenue Determinations
The AER recently released draft revenue determinations for NSW electricity network businesses proposing to cut regulatory return (WACC), operating and capital expenditure allowances for the next regulatory period. Lower expenditure allowances are based on the AER’s benchmarking analysis that concluded the NSW network businesses were significantly less efficient than their private sector counterparts in Victoria and South Australia. The draft determinations, if implemented, would result in an estimated decrease to the average residential electricity bill of between $183 to $370 in 2015-16. The returns to the Government would also be lower.
The AER is expected to release final revenue determinations for the network businesses in April 2015 after consultation with stakeholders, and new network prices will apply from 1 July 2015. The AER has invited comments on whether it should provide for a transitional period for the businesses to reduce their costs, which will affect the final price path. The 2014-15 Half-Yearly Review fiscal aggregates include the impact of the lower regulatory WACC allowance contained in the draft determinations. However, given uncertainty surrounding the final determinations, the impact of the proposed reductions in operating and capital expenditure allowances on dividends and tax equivalent payments has not been included at this time. If the businesses were not to respond adequately to the lower operating and capital expenditure allowances, the full impact of the draft determinations would be to effectively reduce their dividends and tax equivalent payments to close to zero.
The table below shows the impact of the lower regulatory WACC allowance contained in the AER’s draft determinations on forward dividend and tax equivalent estimates.
Weighted Average Cost of Capital included in the Half-Yearly Review
2014-15 2015-16 2016-17 2017-18 Forward Estimates
$m $m $m $m
2014-15 Budget - electricity network dividends and tax equivalent payments 1,172 945 936 766 Impact of WACC on dividends and tax equivalent payments ... -209 -294 -359
2014-15 Half-Yearly Review 1,172 736 642 407
The full impact will be reflected in the Budget aggregates when final determinations are made.
Government policy decisions are forecast to increase revenue by around $14 million over the forward estimates, largely due to the implementation of a competitive neutral pricing policy for StateFleet services. This will ensure vehicle fleet services reflect efficient prices.
Revenue growth
Total revenue growth over the four years to 2017-18 is projected to average 3.2 per cent per annum. This is 0.4 percentage points lower than the average growth expected at Budget. Chart 3.3 shows the change in revenue growth each year over the forward estimates. The significant increase in 2015-16 is a result of the reprofiling of Commonwealth grants that occurred at the time of the 2014-15 Budget.
Page 18 2014-15 Half-Yearly Review

Chart 3.3: Comparison of Expected Revenue Growth Rate over the Forward Estimates
2.6
4.2
5.4
2.1
2.8 3.2
5.0
1.9
0.0
1.0
2.0
3.0
4.0
5.0
6.0
Per c
ent
2014-15 2015-16 2016-17 2017-18
2014-15 Budget Half-Yearly Review
Forward estimates expenses outlook
Expenses across the forward estimates have been revised upwards compared to Budget. Table 3.6 provides a reconciliation of Budget expense aggregates between the 2014-15 Budget and the Half-Yearly Review.
Table 3.6: Expense Reconciliation – Budget to Half-Yearly Review
2014-15 2015-16 2016-17 2017-18 Forward Estimates
$m $m $m $m
Expenses - 2014-15 Budget 67,396 69,265 71,575 73,644 Expense Changes since Budget
New Policy Measures 134 128 175 92 Total Policy 134 128 175 92
Parameter and Other Budget Variations Superannuation (AASB 119) 316 299 281 261 Other Superannuation 69 69 71 57 Interest 5 53 75 105 Economic Parameters and Technical Adjustments -76 95 128 -221 Other -258 -270 158 -35
Total Parameter and Other Budget Variations 56 246 713 167
Total Expense Variations since 2014-15 Budget 190 374 888 259
Expenses - 2014-15 Half-Yearly Review 67,586 69,640 72,463 73,903
Total expenses over the forward estimates are estimated to be $1.5 billion higher than at Budget. This result predominantly reflects parameter and technical adjustments associated with actuarial changes ($1.0 billion), with a smaller contribution from Government decisions ($395 million).
The main expense parameter and other variations since the Budget include:
§ Changes associated with the adoption of the revised AASB 119 Standard which have increased superannuation expenses by $841 million. Actuarial changes based on a movement in underlying economic assumptions have also led to an upwards revision in expenses of $197 million.
2014-15 Half-Yearly Review Page 19
§ Interest expenses refer to interest paid on borrowings to acquire capital assets and infrastructure, and the unwinding of discounts on a number of balance sheet liabilities. Over the three years to 2017-18, it is expected that interest expenses will increase by $233 million. This largely reflects changes to the unwinding of discounts.
§ Economic parameter and technical adjustments include lower-than-anticipated expenses related to New South Wales Self Insurance Corporation actuarial adjustments and capitalisation of costs previously expected to be expensed.
§ Movement in other expenses includes provisions for parameter and technical movements in future years and reprofiling of expenditure between the forward estimate years.
Government policy decisions are forecast to increase expenses by a net $395 million over the forward estimates. Consistent with the Government’s fiscal strategy, new policy proposals are being funded, where possible, from within existing departmental resources.
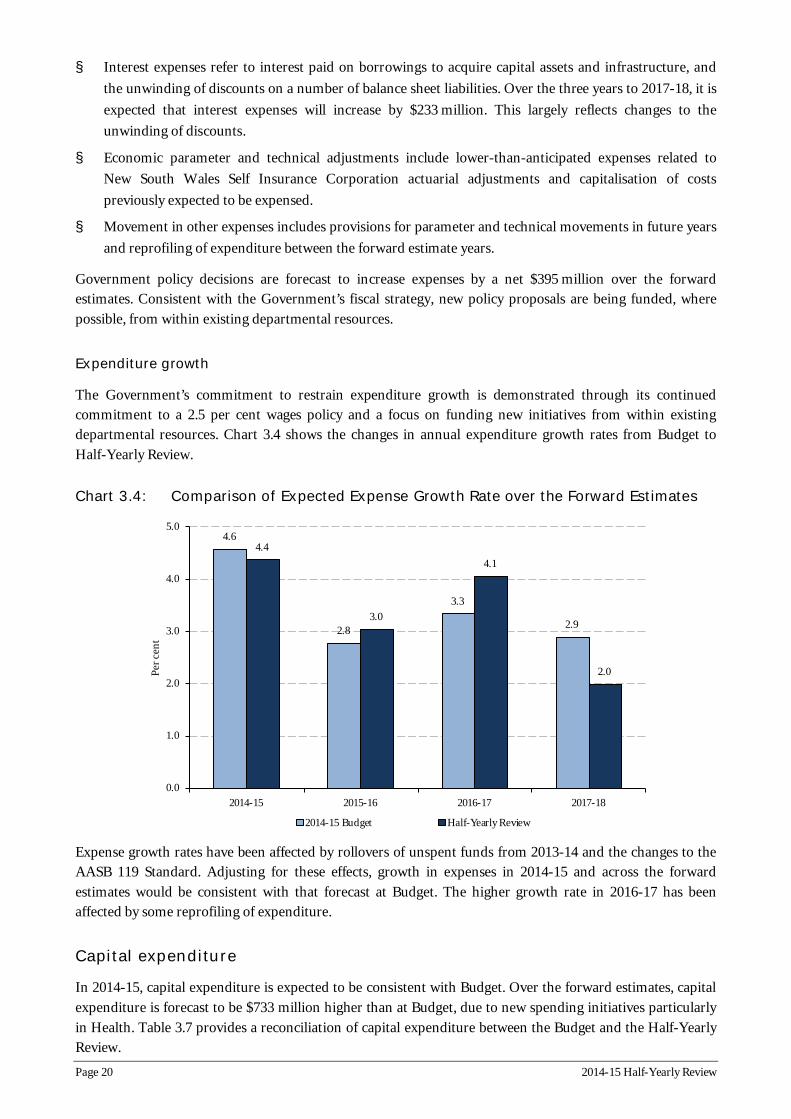
Expenditure growth
The Government’s commitment to restrain expenditure growth is demonstrated through its continued commitment to a 2.5 per cent wages policy and a focus on funding new initiatives from within existing departmental resources. Chart 3.4 shows the changes in annual expenditure growth rates from Budget to Half-Yearly Review.
Chart 3.4: Comparison of Expected Expense Growth Rate over the Forward Estimates
4.6
2.8
3.3
2.9
4.4
3.0
4.1
2.0
0.0
1.0
2.0
3.0
4.0
5.0
Per c
ent
2014-15 2015-16 2016-17 2017-18
2014-15 Budget Half-Yearly Review
Expense growth rates have been affected by rollovers of unspent funds from 2013-14 and the changes to the AASB 119 Standard. Adjusting for these effects, growth in expenses in 2014-15 and across the forward estimates would be consistent with that forecast at Budget. The higher growth rate in 2016-17 has been affected by some reprofiling of expenditure.
Capital expenditure
In 2014-15, capital expenditure is expected to be consistent with Budget. Over the forward estimates, capital expenditure is forecast to be $733 million higher than at Budget, due to new spending initiatives particularly in Health. Table 3.7 provides a reconciliation of capital expenditure between the Budget and the Half-Yearly Review.
Page 20 2014-15 Half-Yearly Review

Table 3.7: Capital Reconciliation – Budget to Half-Yearly Review
2014-15 2015-16 2016-17 2017-18 Forward Estimates
$m $m $m $m
Capital - 2014-15 Budget 10,203 9,403 9,440 9,263 Capital Changes since Budget
Policy New Capital Works 68 171 246 142
Parameter and Other Budget Variations -68 -18 96 96
Total Capital Variations since 2014-15 Budget ... 153 342 238
Capital - 2014-15 Half-Yearly Review 10,203 9,556 9,782 9,501
Capital expenditure variations for 2014-15 and over the forward estimates principally relate to Government decisions for new infrastructure projects since the Budget. In addition, changes in the receipt of Commonwealth funding have resulted in a reprofiling of capital expenditure between years. New funding provided by the Government since the Budget includes:
§ funding to support investment in hospitals, health facilities and other health services infrastructure to meet future service needs
§ initial funding to support the truncation of the heavy rail line and reunite Newcastle’s city centre with the foreshore
§ additional funding for land acquisition to connect the M2 Eastbound to NorthConnex and other associated properties for the project.
Consistent with past practice, the Half-Yearly Review does not include any proceeds associated with the proposed 49 per cent lease of NSW electricity network businesses. The proposed capital investment program (Rebuilding NSW, see Box 3.3) is also not included.
Box 3.3: Rebuilding NSW
Rebuilding NSW is the Government’s plan to invest $20 billion in new capital, funded from the lease of 49 per cent of NSW electricity networks. This capital recycling transaction will be eligible for a Commonwealth incentive payment, which is equal to 15 per cent of the proceeds which are directed toward productive infrastructure projects.
Areas of priority include public transport, urban and regional roads, water, hospitals, schools, and cultural and sporting infrastructure. Consistent with the Government’s existing commitment, 30 per cent of the $20 billion in new capital will be directed to regional projects (approximately $6 billion).
The State Infrastructure Strategy (SIS) was updated by Infrastructure NSW to take account of Rebuilding NSW proposals. The Government response to the SIS confirmed these significant priorities:
§ Urban public transport including Sydney Rapid Transit ($7 billion) and Parramatta Light Rail ($600 million)
§ Sydney urban roads ($2.4 billion), including funding for WestConnex Northern and Southern extensions and a Western Harbour Tunnel
§ Regional transport ($4.1 billion), health and education infrastructure ($2 billion), and regional water security ($1 billion)
§ $1.2 billion reserved for cultural and sporting infrastructure.
In addition to Rebuilding NSW, the Government continues to provide capital funding through the Restart NSW Fund. The objective of the fund is to promote economic growth and productivity by funding the delivery of major infrastructure projects. Restart reservations are not included in budget estimates until specific projects are approved by the Government (see Box 3.4).
2014-15 Half-Yearly Review Page 21

Box 3.4: Restart NSW
Since the Budget, the balance of the Restart NSW Fund has increased by around $2.1 billion. This includes proceeds from the sale of Macquarie Generation ($723 million) and windfall tax revenues from 2013-14 ($611 million). A balance of $8.8 billion is forecast for the fund as at 30 June 2015. The table below summarises aggregate receipts, commitments and reservations for future projects and programs presently under development.
Restart NSW (expected position as at 30 June 2015)
Total inflows $8.8 billion
Projected outflows
Total approved commitments to date (included in the Budget)
Total approved reservations to date (not yet included in the Budget)
Total outflows
$3.9 billion
$4.9 billion
$8.8 billion
Additional commitments since the Budget
The Half-Yearly Review incorporates a number of new Restart funding commitments. Funding for these commitments reflects the allocation of funds to specific projects supported by business cases. These commitments are included in the Budget aggregates and will start in 2014-15:
Project Restart commitment
Cobbora Transition Fund – further investments (regional NSW) $16 million
Water Security for Regions – initial projects (regional NSW)
Bourke Bore $2.5 million
Wilcannia Bore $1 million
Forbes Bore $2 million
Cobar Water Supply $10 million
Nimmitabel (Lake Wallace ) Dam $5.3 million
Regional Water Supply Program (regional NSW) $16.7 million
Total $53.5 million
Additional reservations since the Budget
The Government also reserves funds for projects as a place-marker for future commitments, pending further work including business cases. These reservations do not have an impact on the Budget aggregates because a final decision is required by the Government prior to commitment. The Government has also reserved funding for the following additional projects and programs:
Project Restart reservation
Support for the delivery of the State Infrastructure Strategy $2.0 billion
Additional support for tourism infrastructure $0.1 billion
Total additional reservations $2.1 billion
Page 22 2014-15 Half-Yearly Review

Risks to the fiscal position
This section updates the material fiscal risks, contingent liabilities and assets, which if realised are likely to impact on the State’s financial position and budget outcomes. The 2014-15 Half-Yearly Review and forward estimates incorporate assumptions and judgements based on the best available information at the time including economic forecasts and other assumptions. In practice, these assumptions may not eventuate and any movement will affect the revenue and expense transactions in these years.
Revenue risks
State taxes
State tax forecasts are based on an estimated relationship between taxation revenue and projected economic variables, such as employment and payroll tax. As a result, the main source of risk to the taxation estimates is the economic environment. Specific economic risks to the outlook are presented in Chapter 2: Economic Outlook.
Commonwealth grants
Commonwealth grants revenue to New South Wales comprises payments for GST revenues, National Agreements and National Partnerships. The estimates presented in this document are based upon the best available information up to 12 December 2014. New South Wales continues to prosecute the case for a fairer share of GST revenue, while emphasising the need to address vertical fiscal imbalance.
GST revenues are dependent not only upon the amount of GST collected (the pool size), but also on NSW’s share of this revenue. This is driven by the relative size of the NSW population, and the relativity calculated by the Commonwealth Grants Commission (CGC). Any change in pool size, population share or relativity presents a significant risk to the State’s financial position.
National Agreement and National Partnership funding can be highly volatile, presenting a significant risk to revenues and the Budget. Changes can arise from new programs and capital works, the termination of existing agreements, and the reprofiling of payments to the States. In the NSW Budget, a substantial reprofiling of existing funding occurred, mainly transport, of around $800 million into 2013-14, predominantly from 2014-15.
Interest income
Interest income returns are dependent on economic conditions, market returns and the amount of financial assets held. Any change in market conditions is likely to be reflected in investment performance. In addition, any rise/fall in other revenue categories (or increase/decrease in expense categories) could impact upon the State’s cash balance, and hence the amount available to be invested.
Dividend and income tax equivalent payments
Government policy requires State Owned Corporations (SOCs) to pay dividends that provide a commercially appropriate return on the Government’s investments. In addition, the State Government receives payments from SOCs that are equivalent to corporate income tax. This revenue is heavily dependent on SOCs financial performance, which in turn is dependent on economic conditions and pricing determinations from regulators.
2014-15 Half-Yearly Review Page 23

Expense risks
Employee-related expenses (including superannuation)
Employee-related expenses consist of wages and salaries and superannuation expenses. The size of the workforce and major enterprise bargaining agreements are a significant driver of this expense.
Since 2011, the Government has set wages growth through the NSW Public Sector Wages Policy. This provides for a maximum 2.5 per cent increase in salaries and wages, unless employee-related cost savings have been achieved to fully offset higher increases.
There is a risk that growth in demand for government services may exceed current projections included in the forward estimates. This can occur, for example, as a result of higher population growth or expenditure in response to unforeseen events such as natural disasters, including bushfires and floods. Contingency provisions (both recurrent expense and capital) are held to maintain existing government services in terms of their nature, availability, quantity, quality or eligibility. However, realised expenditure growth may exceed the contingency provisions factored into the estimates.
Other expenses
Other operating expenses capture the non-labour costs of providing goods and services. This includes the repair and maintenance of assets. New South Wales holds a large and diverse stock of assets. Although a significant portion of maintenance is capitalised, significant amounts are expensed in the provision of transport, health and education services. Agencies have indicated that their maintenance requirements are under review, and there is a risk that some of these assets may require enhanced or more frequent repairs and maintenance in the current year and across the forward estimates due to increased use or wear and tear.
Specific fiscal risks
National Injury Insurance Scheme
The Commonwealth Government expects the State to fund the total cost in New South Wales of a National Injury Insurance Scheme, to support people who suffer catastrophic injuries. New South Wales already provides support for people injured in motor vehicle and workplace accidents, but has not agreed to implement other streams of a National Injury Insurance Scheme.
Commonwealth schools funding
While final State allocations for the 2018 school year are still subject to negotiation, the 2014-15 Commonwealth Budget indicated that Commonwealth funding for NSW schools would be reduced to the rate of growth of the Consumer Price Index, plus an adjustment for enrolment growth.
Page 24 2014-15 Half-Yearly Review
National Health Reform
Under the National Health Reform Agreement (NHRA), most Commonwealth funding for NSW Health from 2014-15 is provided on an activity based funding (ABF) basis. The Commonwealth contribution is calculated based on the level of activity delivered by NSW Health and a National Efficient Price set by an independent administrator. The NHRA also included a guarantee of additional funding from the Commonwealth. However, the 2014-15 Commonwealth Budget indicated that the Commonwealth will no longer guarantee this funding, and that from 1 July 2017 funding will no longer be provided on an ABF basis. These announcements have significantly reduced the quantum and certainty of Commonwealth funding for NSW Health over the forward estimates period and beyond.
Methodology review of GST revenue sharing relativities
The CGC is currently reviewing the methodology for calculating GST relativities for distributing the national pool among the states and territories. The CGC 2015 Methodology Review of GST Revenue Sharing Relativities is due to be released in February 2015, along with the relativities for 2015. The final outcome of the review has the potential to affect New South Wales’s GST grant share, the magnitude of which will be unclear prior to the finalisation of relativities for 2015-16.
Loose-fill asbestos insulation
An Australian Capital Territory (ACT)-based ceiling insulation contractor, known as “Mr Fluffy,” installed loose-fill asbestos insulation in ACT and New South Wales homes. Recently, the ACT Government has announced an assistance package for affected property owners. The NSW Government is currently considering its response to affected NSW property owners.
2014-15 Half-Yearly Review Page 25

This page is intentionally left blank
Page 26 2014-15 Half-Yearly Review
Appendix A: Management Representation and Independent Assurance Practitioner’s Report
Treasury Statement in relation to the Estimated Financial Statements for the Half-Yearly Review
Scope
The Half-Yearly Review presents the Estimated Financial Statements for the general government sector. These include:
§ Statement of Significant Accounting Policies and Forecast Assumptions (Appendix B)
§ General Government Sector Operating Statement (Table C.1)
§ General Government Sector Balance Sheet (Table C.2)
§ General Government Sector Cash Flow Statement (Table C.3)
§ Derivation of ABS GFS General Government Sector Cash Surplus/(Deficit) (Table C.4)
The Statements have been prepared in accordance with the Statement of Significant Accounting Policies and Forecast Assumptions. Collectively the Statements and Statement of Significant Accounting Policies and Forecast Assumptions are termed the ‘Estimated Financial Statements’.
The Estimated Financial Statements cover the revised estimates for the year ending 30 June 2015 and the three forward years ending 30 June 2016, 2017, and 2018.
Best Available Information
The practicalities associated with preparing the Half-Yearly Review make it necessary to rule off at a point in time so that all information is internally consistent. The Estimated Financial Statements have been prepared to reflect existing operations, the impact of new Government policy decisions, and year-end projections provided by agencies based on end-October 2014 data. They have also been prepared to take into account other economic and financial data available to Treasury up to 12 December 2014.
Any estimates or assumptions made in measuring revenues, expenses, other economic flows, assets or liabilities are based on the latest information available at the time. Assumptions are detailed under the headings Material Economic and Other Assumptions and Summary of Other Key Assumptions.
Professional Judgement
The prospective nature of the Estimated Financial Statements means that it is necessary to apply professional judgement in their preparation. That judgement includes an informed assessment of the most likely economic and financial outcomes including spending and revenue profiles.
Differences between the underlying assumptions and eventual outcomes can reflect the reality of an uncertain operating environment and the impact of many variables over which the Government has little or no control.
Page 27

In my opinion, the Estimated Financial Statements have been properly prepared in accordance with the Statement of Significant Accounting Policies and Forecast Assumptions and the methodologies used to determine those assumptions are reasonable.
Philip Gaetjens Secretary NSW Treasury 12 December 2014
Page 28
Page 29

Page 30

Page 31

This page is intentionally left blank
Page 32

Appendix B: Statement of Significant Accounting Policies and Forecast Assumptions
The Half-Yearly Review presents the Estimated Financial Statements for the General Government Sector.
These comprise the General Government Sector Operating Statement (Table C.1), General Government Sector Balance Sheet (Table C.2), General Government Sector Cash Flow Statement (Table C.3) and Derivation of ABS GFS General Government Sector Cash Surplus / (Deficit) (Table C.4). These are prepared in accordance with this Statement of Significant Accounting Policies and Forecast Assumptions.
Collectively the statements and the Statement of Significant Accounting Policies and Forecast Assumptions are referred to as the ‘Estimated Financial Statements’.
The Estimated Financial Statements cover the revised budget estimates for the current year ending 30 June 2015, and estimates for the three forward years ending 30 June 2016, 2017 and 2018.
Scope
The Estimated Financial Statements are prepared for the NSW General Government Sector, which is determined in accordance with the principles and rules contained in the Australian Bureau of Statistics, Australian System of Government Finance Statistics: Concepts, Sources and Methods 2005 (cat. No. 5514) (ABS GFS Manual) as amended from time to time.
The General Government Sector comprises government agencies that are controlled and mainly financed by the State that:
§ undertake regulatory functions
§ redistribute income and wealth
§ provide or distribute goods and services on a non-market basis to individuals and the community and/or
§ provide services to general government agencies.
Basis of Preparation
The Estimated Financial Statements are prepared and presented consistent with the principles adopted in the 2014-15 Budget and based on the assumptions outlined below.
The 2014-15 Budget information included in the Estimated Financial Statements reflects the original budget tabled in Parliament on 17 June 2014.
The Estimated Financial Statements are prepared using the accrual basis of accounting which recognises the effect of transactions and events when they are forecast to occur.
The Estimated Financial Statements have been prepared to reflect existing operations, the impact of all new policy decisions taken by the New South Wales Government (where their financial effect is reliably measurable), as well as known Commonwealth Government funding revisions and known circumstances that may have a material effect on the Half-Yearly Review. The revised estimates for 2014-15 are based on actual results at 31 October 2014, and updated year-end projections provided by agencies. They have also been prepared to take into account other economic and financial data currently available to Treasury.
Estimated Financial Statements reviewed by the Auditor-General Page 33
In keeping with these principles, where the impact of a policy decision or planned event cannot be reliably measured, the impact is not reflected within the Estimated Financial Statements (e.g. due to uncertainties regarding the timing and amount of future cash flows).
Any estimates or assumptions made in measuring revenues, expenses, or other economic flows, assets or liabilities are based on the latest information available at the time, professional judgements derived from experience and other factors considered to be reasonable under the circumstances. Actual results may differ from such estimates. Key assumptions are detailed below, under the headings Material Economic and Other Assumptions and Summary of Other Key Assumptions.
Accounting Policies
Australian Accounting Standards do not include requirements or provide guidance on the preparation and presentation of prospective financial statements. However, recognition and measurement principles within Australian Accounting Standards have been applied in the presentation of the Estimated Financial Statements to the maximum extent possible.
Therefore, except for the matters set out below under Change in Accounting Policies, these Estimated Financial Statements follow the presentation and principles in the 2014-15 Budget and the accounting policies applied in the audited 2013-14 Consolidated Financial Statements of the New South Wales General Government and Total State Sectors as presented to Parliament.
The same accounting policies have been used for the subsequent forecast years. In particular, Note 1 Statement of Significant Accounting Policies includes information on the principles of consolidation, significant accounting judgements and estimates, the recognition and measurement policies for revenues, expenses, other comprehensive income, assets and liabilities.
The Estimated Financial Statements do not include the impact of business asset transactions until they are finalised. The financial impact of future planned discontinuing operations or restructuring transactions are not recognised due to the commercial-in-confidence nature of the transactions.
Change in Accounting Policies
Revised AASB 119 Employee Benefits
The State adopted the revised AASB 119 Employee Benefits (and subsequent amending standards) in 2013-14. The 2014-15 Budget incorporated the impact of the revised calculation of the superannuation interest expense, which is now based on applying the long term government bond rate to the net defined benefit liability.
The revised AASB 119 also included updated guidance on accounting for the superannuation contributions tax associated with defined benefit schemes. As a result, the net defined benefit superannuation liability was increased (grossed up) by an amount representing superannuation contribution tax payable on future contributions required to fund the deficit. This change was reflected in the audited 2013-14 Consolidated Financial Statements of the New South Wales General Government and Total State Sectors as presented to Parliament.
This change has been reflected in the revised budget figures and forward estimates resulting in higher superannuation liabilities across all years and higher defined benefit superannuation expenses in the operating statement.
Page 34 Estimated Financial Statements reviewed by the Auditor-General

For 2014-15, the change increases the net defined benefit superannuation liability by around $5.7 billion for the General Government Sector (over previous estimates) and on average around $4.4 billion across the forward estimates, which also increases the associated superannuation service cost and net interest expense (and worsens the Budget Result) by around $316 million in 2014-15, and on average around $280 million per annum across the forward estimates.
Revisions to Standards relating to Consolidations, Joint Arrangements and Associates
The State has adopted the following new and revised standards relating to consolidations, joint arrangements and associates on 1 July 2014: AASB 10 Consolidated Financial Statements; AASB 11 Joint Arrangements; AASB 12 Disclosure of Interests in Other Entities; AASB 127 Separate Financial Statements; and AASB 128 Investments in Associates and Joint Ventures.
AASB 10 introduced a revised definition of control and provided several new principles in assessing whether control exists. AASB 11 requires joint arrangements to be accounted for based on their contractual arrangements, and distinguishes between joint operations and joint ventures. AASB 12 contains the disclosure requirements associated with ‘other entities’ (i.e. subsidiaries, associates and joint ventures) that were previously located in AASB 127, 128 and 131 and Interpretation 112 and 113.
The impact of any changes to control relationships on the Estimated Financial Statements, arising from these new and revised standards, is not expected to be significant. The General Government Sector does not consolidate PTEs and PFEs that it controls on a line by line basis; and instead, recognises an equity investment in those entities and a gain or loss for changes in the carrying amount of the investment.
Definitions
Key technical terms and key fiscal aggregates used in this report are defined in Note 36 of the 2013-14 Consolidated Financial Statements of the New South Wales General Government and Total State Sectors and in the Glossary to Budget Paper No. 2.
Presentation of the Estimated Financial Statements
The Estimated Financial Statements follow the presentation requirements for General Government Sector reporting contained in AASB 1049 Whole of Government and General Government Sector Financial Reporting.
AASB 1049 harmonises Generally Accepted Accounting Principles (GAAP, i.e. Australian accounting standards) with Government Finance Statistics (GFS) principles in accordance with the GFS framework adopted by the Australian Bureau of Statistics. This occurs by requiring:
§ the statement of comprehensive income (referred to as the operating statement) to classify income and expenses as either transactions or other economic flows consistent with GFS principles, applied from a GAAP perspective.
In the operating statement:
§ the net operating balance (i.e. the Budget result) is the net result of income and expense transactions. It excludes other economic flows, which represent changes in the volume or value of assets or liabilities that do not arise from transactions with other entities and which are often outside the control of government.
§ the operating result is the same under both the harmonised GFS-GAAP and pure GAAP presentations.
Estimated Financial Statements reviewed by the Auditor-General Page 35
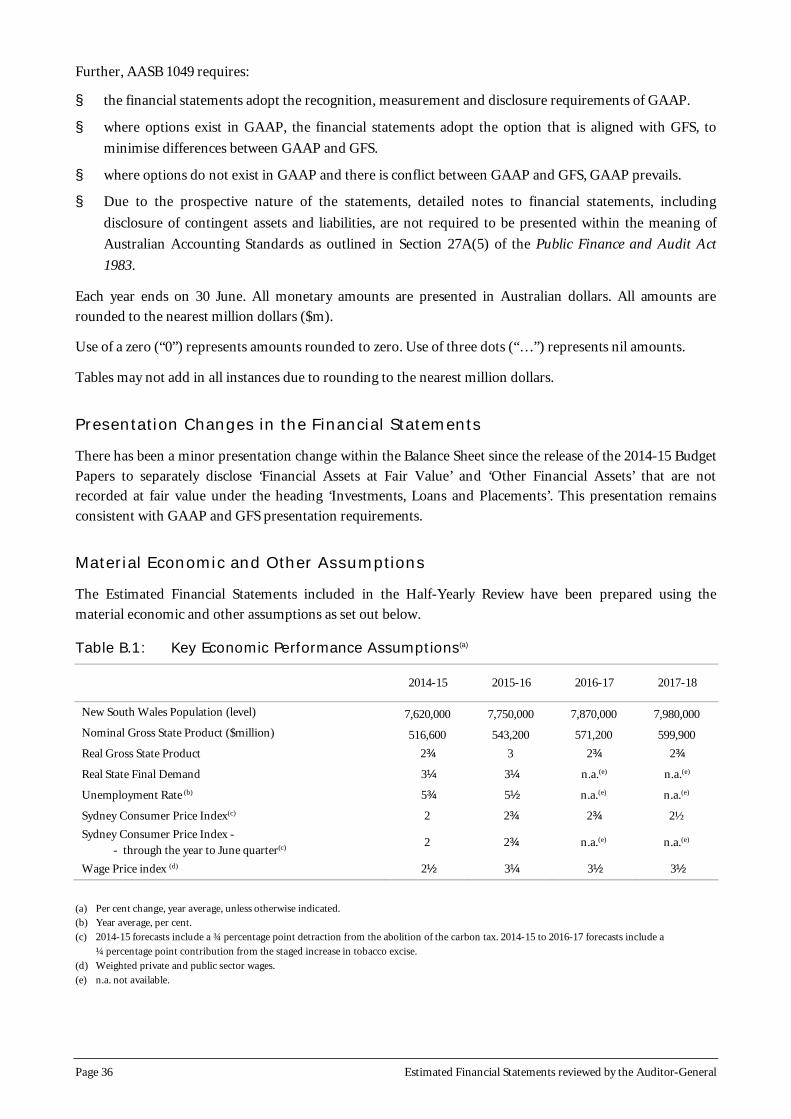
Further, AASB 1049 requires:
§ the financial statements adopt the recognition, measurement and disclosure requirements of GAAP.
§ where options exist in GAAP, the financial statements adopt the option that is aligned with GFS, to minimise differences between GAAP and GFS.
§ where options do not exist in GAAP and there is conflict between GAAP and GFS, GAAP prevails.
§ Due to the prospective nature of the statements, detailed notes to financial statements, including disclosure of contingent assets and liabilities, are not required to be presented within the meaning of Australian Accounting Standards as outlined in Section 27A(5) of the Public Finance and Audit Act 1983.
Each year ends on 30 June. All monetary amounts are presented in Australian dollars. All amounts are rounded to the nearest million dollars ($m).
Use of a zero (“0”) represents amounts rounded to zero. Use of three dots (“…”) represents nil amounts.
Tables may not add in all instances due to rounding to the nearest million dollars.
Presentation Changes in the Financial Statements
There has been a minor presentation change within the Balance Sheet since the release of the 2014-15 Budget Papers to separately disclose ‘Financial Assets at Fair Value’ and ‘Other Financial Assets’ that are not recorded at fair value under the heading ‘Investments, Loans and Placements’. This presentation remains consistent with GAAP and GFS presentation requirements.
Material Economic and Other Assumptions
The Estimated Financial Statements included in the Half-Yearly Review have been prepared using the material economic and other assumptions as set out below.
Table B.1: Key Economic Performance Assumptions(a)
2014-15 2015-16 2016-17 2017-18
New South Wales Population (level) 7,620,000 7,750,000 7,870,000 7,980,000 Nominal Gross State Product ($million) 516,600 543,200 571,200 599,900 Real Gross State Product 2¾ 3 2¾ 2¾
Real State Final Demand 3¼ 3¼ n.a.(e) n.a.(e)
Unemployment Rate (b) 5¾ 5½ n.a.(e) n.a.(e)
Sydney Consumer Price Index(c) 2 2¾ 2¾ 2½ Sydney Consumer Price Index
- through the year to June quarter(c) 2 2¾ n.a.(e) n.a.(e)
Wage Price index (d) 2½ 3¼ 3½ 3½
(a) Per cent change, year average, unless otherwise indicated. (b) Year average, per cent. (c) 2014-15 forecasts include a ¾ percentage point detraction from the abolition of the carbon tax. 2014-15 to 2016-17 forecasts include a
¼ percentage point contribution from the staged increase in tobacco excise. (d) Weighted private and public sector wages. (e) n.a. not available.
Page 36 Estimated Financial Statements reviewed by the Auditor-General
Summary of Other Key Assumptions
The following section outlines the other key assumptions used in the preparation of the Estimated Financial Statements included in the Half-Yearly Review. The summary takes into account materiality in relation to the general government sector’s overall financial position and sensitivity to changes in key economic assumptions.
Notwithstanding these key assumptions, agency finance officers apply appropriate professional judgement in determining their estimated financial information.
Revenue from Transactions
Taxation
Taxation revenue is forecast by assessing economic and other factors that influence the various taxation bases. For example for payroll tax, this involves an assessment of the outlook for employment and wages. Forecasts of government guarantee fees take into account an assessment of the level of debt of public non-financial corporations and their credit rating differential compared with the State as a whole. The forecasts of taxation revenue also involve the analysis of historical information and relationships (using econometric and other statistical methods) and consultation with relevant government agencies.
Grants Revenue
Forecast grants from the Commonwealth Government are based on the latest available information from the Commonwealth Government and projections of timing of payments at the time of preparation of the Half-Yearly Review. This takes into account the conditions, payment timetable and escalation factors relevant to each type of grant.
The Goods and Services Tax (GST) grants are forecast based on estimates of the national GST pool by the Commonwealth Government. For 2014-15, the GST forecast is based on the assessed relativity for New South Wales in 2014-15 and the Commonwealth Government’s population projections. The assessed relativity is the average of the past three annual per capita relativities (2010-11, 2011-12 and 2012-13), as published by the Commonwealth Grants Commission.
After 2014-15, the State’s share of GST is based on assessed relativity in a particular year, the Commonwealth Government’s population and GST projections. The forecast per capita annual relativities are based on the projected relative fiscal capacity of New South Wales compared to other States and Territories.
Sale of Goods and Services
Revenue from the sale of goods and services is forecast taking into account all known factors, including estimates of changes in demand for services provided or expected unit price variations based on proposed fee increases imposed by general government agencies and/or indexation.
Dividend and Income Tax Equivalents from Other Sectors
Dividend and income tax equivalent revenues are estimated by public financial and non-financial corporations based on expected profitability and the agreed dividend policy at the time of the Half-Yearly Review.
Estimated Financial Statements reviewed by the Auditor-General Page 37

Fines, Regulatory Fees and Other Revenues
Fines, regulatory fees and other revenues include estimates of fines issued by the Courts, estimated traffic infringement fines, estimated revenue from enforcement orders and regulatory fees, contributions and estimated royalty revenue for which estimates are based on assessments of coal volumes and prices and the Australian dollar exchange rate. Other revenue forecasts are adjusted for indexation where appropriate.
Expenses from Transactions
Employee Expenses
Employee expenses are forecast based on expected staffing profiles, current salaries, conditions and on-costs. Employee expenses are adjusted over the forecast period for approved wage agreements. Beyond the period of the agreements, allowance is made for further adjustments consistent with the Government’s wages policy at a net cost of 2.5 per cent per annum inclusive of scheduled increases in the superannuation guarantee levy. The forecasts for employee expenses also reflect the impact of new approved initiatives and required efficiency savings.
Superannuation Expense (and Liabilities)
Superannuation expense comprises:
§ for the defined contribution plan, the forecast accrued contribution for the period, and
§ for defined benefit plans, the forecast service cost and the net interest expense. This excludes the re-measurements (i.e. actuarial gains and losses and return on plan assets in excess of the long term government bond rate) which are classified as ‘other economic flows – other comprehensive income’.
Superannuation expenses for defined contribution plans are based on assumptions regarding future salaries and contribution rates.
Superannuation expenses for defined benefit plans are estimates based on actuarial advice applying the long term Government bond yield as at 30 June in the prior year to the opening value of net liabilities (gross superannuation liabilities less assets), less benefit payments at the mid-point of the contribution year, plus any accruing liability for the year.
Forecasts of defined benefit superannuation liabilities are based on actuarial estimates of cash flows for the various defined benefit superannuation schemes discounted using a nominal long-term Commonwealth long term Government bond yield as at 30 June. Gross liability estimates are based on a number of demographic and financial assumptions. The major financial assumptions used for the budget and forward estimates period are outlined in the table below.
Page 38 Estimated Financial Statements reviewed by the Auditor-General

Table B.2: Superannuation Assumptions – Pooled Fund / State Super Schemes
2014-15 2015-16 2016-17 2017-18 % % % %
Liability discount rate 4.04 4.55 5.06 5.32
Expected return on investments (a) 8.6 8.6 8.6 8.6
Expected salary increases(b)
- SSS and SASS members 2.50 2.50 2.50 2.50
- PSS members 2.50 2.50 2.50 2.50
Expected rate of CPI 2.5 2.5 2.5 2.5
Notes: (a) For the EISS the expected return on investments is 7.5% per annum from 2014-15 and beyond. (b) Taking the increased Superannuation Guarantee Contribution into account, total remuneration will increase by 2.5 per cent. Note that the
Federal Government’s repeal of the Mineral Resources Rent Tax and Other Measures Bill 2014 provides a further pause in the SGC rate increases until 2021.
Depreciation and Amortisation
Property, plant and equipment is depreciated (net of its residual value) over its useful life. Depreciation is generally allocated on a straight-line basis.
Depreciation is forecast on the basis of known asset carrying valuations, the expected economic life of assets, assumed new asset investment and asset sales programs. The expense is based on the assumption that there will be no change in depreciation rates over the forecast period, but includes the estimated impact of the current and future revaluation of assets over the forecast period. The depreciation expense may be impacted by future changes in useful lives, carrying value, residual value or valuation methodology.
Certain heritage assets, including original artworks and collections and heritage buildings, may not have a limited useful life because appropriate custodial and preservation policies are adopted. Such assets are not subject to depreciation. Land is not a depreciable asset.
Intangible assets with finite lives are amortised under the straight line method. Intangible assets with an indefinite life are not amortised, but tested for impairment annually.
Interest Expense
The forecasts for the interest expense are based on:
§ payments required on the current general government sector debt,
§ expected payments on any new borrowings (including any refinancing of existing borrowings) required to finance general government activities based on forward contracts for NSW Treasury Corporation bonds, and
§ the unwinding of discounts on non-employee provisions.
Other Operating Expenses
Other operating expenses mainly represent the day-to-day running costs incurred in normal operations of agencies and include the cost of supplies and services. They are forecast by applying appropriate economic parameters and known activity changes, including planned changes in the method of service delivery and application of government policy. Other operating expenses also reflect the impact of government efficiency strategies, such as efficiency dividends.
Estimated Financial Statements reviewed by the Auditor-General Page 39
Grants and Subsidies Expense
Grants and subsidy expenses generally comprise cash contributions to local government authorities and non-government organisations. For the general government sector they also include grants and subsidies paid to PTEs and PFEs. The forecast grant payments are determined taking into account current and past policy decisions, the forecast payment schedules and escalation factors relevant to each type of grant.
Other Economic Flows
Revaluations
The estimates are based on an examination and extrapolation of historical trends in the valuation of non-financial physical assets. The forward estimates include the estimated impact of revaluations of non-financial physical assets.
Superannuation Actuarial Gains / Losses
The forecast actuarial gain or loss on defined benefit superannuation is based on the revised estimates of the margin of forecast fund earnings in excess of the expected discount rate.
Net Gain on Equity Investments in Other Sector Entities
The gain or loss on equity investments in other sector entities is based on estimates of the public financial and non-financial sectors’ forward comprehensive results adjusted for transactions with owners. The underlying management estimates of future comprehensive results are based on current statements of corporate intent. Future distributions to owners are based on Treasury’s Commercial Policy Framework.
Assets
Land and Buildings, Plant and Equipment, and Infrastructure Systems
The estimates of non-financial physical assets over the forecast period are at fair value and take into account planned acquisitions, disposals and the impact of depreciation and revaluations. New investments in assets are valued at the forecast purchase price and, where appropriate, recognised progressively over the estimated construction period. The forward estimates include the estimated impact of revaluations of non-financial physical assets. These estimates are based on an examination of expected cost trends.
The Estimated Financial Statements also include provision for future capital expenditure. These include agency estimates of approved projects and future new works held within agencies, as well as a central estimate for future new works still to be approved at the agency level. The central estimate for future new works is based on historical trends.
Liabilities
Borrowings
Estimates for borrowings are based on current debt levels, amortisation of any premiums or discounts and the cash flows expected to be required to fund future government activities.
Page 40 Estimated Financial Statements reviewed by the Auditor-General

Employee Provisions
Employee provisions are forecast based on expected staffing profiles and current salaries, conditions and on-costs. For the forecast period, employee benefits are adjusted for approved wage agreements. Beyond the period of the agreements, allowance is made for further adjustments consistent with the Government’s wages policy at a net cost of 2.5 per cent per annum inclusive of scheduled increases in the superannuation guarantee levy. The forecasts for employee expenses also reflect the impact of new initiatives and required efficiency savings.
Superannuation Provisions
Refer to superannuation expense (above) for information on assumptions that also impact the measurement of the superannuation provisions.
Other Provisions
Other provisions include the State’s obligations for several insurance schemes. To estimate future claims liabilities, actuarial assumptions have been applied for future claims to be incurred, claim payments, inflation and liability discount rates. Actual liabilities may differ from estimates.
Estimated Financial Statements reviewed by the Auditor-General Page 41

This page is intentionally left blank
Page 42 Estimated Financial Statements reviewed by the Auditor-General

Appendix C: Uniform Financial Reporting
C.1 Uniform Presentation Tables
The Uniform Presentation Framework (UPF) for financial aggregates has been agreed by the Australian Loan Council. As part of the Framework, each jurisdiction is to publish a mid-year report, i.e. a half-yearly review of the budget, by the end of February each year.
The UPF tables have been prepared consistent with the 2014-15 Budget, in accordance with Australian Accounting Standard AASB 1049 Whole of Government and General Government Sector Financial Reporting. This standard adopts a harmonised GFS-GAAP reporting basis. The main differences in reporting on an AASB 1049 basis compared with a GFS basis are outlined on pages 10-4 to 10-7 of 2014-15 Budget Paper No.2 Budget Statement.
This UPF report includes operating statements, balance sheets and cash flow statements for the NSW general government sector, public non-financial corporation (PNFC) sector and non-financial public sector.
The Half-Yearly Review presents revised fiscal estimates for the current Budget year and the three following years for the general government sector. In addition, revised estimates are presented for the PNFC sector and the non-financial public sector (i.e. a consolidation of the general government sector and the PNFC sector). These revised estimates take into account fiscal and economic developments since the Budget.
Estimated Financial Statements reviewed by the Auditor-General Page 43

Table C.1: General Government Sector Operating Statement
2014-15 2014-15 2015-16 2016-17 2017-18 Budget Revised Forward Estimates
$m $m $m $m $m
Revenue from Transactions Taxation 25,489 25,923 27,256 28,304 29,840 Grants and Subsidies
Commonwealth General Purpose 16,810 16,948 17,717 18,367 18,988 Commonwealth Specific Purpose Payments 7,829 7,943 8,484 9,267 9,759
Commonwealth National Partnership Payments 2,632 2,592 2,675 3,447 2,281 Other Grants and Subsidies 1,029 1,027 1,039 987 742
Sale of Goods and Services 6,094 6,099 6,454 6,731 6,807 Interest 543 623 570 579 554 Dividend and Income Tax Equivalents from Other Sectors 2,336 2,436 1,445 1,266 1,108 Other Dividends and Distributions 370 382 426 458 484 Fines, Regulatory Fees and Other 3,981 3,886 3,975 4,154 4,379 Total Revenues from Transactions 67,113 67,858 70,041 73,559 74,942
Expenses from Transactions Employee 28,351 28,310 29,429 30,933 31,891 Superannuation
Superannuation Interest Cost 1,487 1,698 1,682 1,657 1,604 Other Superannuation 2,698 2,872 2,802 2,787 2,776
Depreciation and Amortisation 4,242 4,220 4,440 4,601 4,773 Interest 2,298 2,303 2,333 2,365 2,412 Other Property ... ... ... ... ... Other Operating 14,620 14,606 15,382 15,813 16,210 Grants and Subsidies
Current Grants and Subsidies 10,426 10,316 10,507 11,001 10,720 Capital Grants 3,274 3,261 3,064 3,308 3,518
Total Expenses from Transactions 67,396 67,586 69,640 72,463 73,903
Transactions from Discontinuing Operations ... ... ... ... ...
BUDGET RESULT - SURPLUS/(DEFICIT) [Net Operating Balance] -283 272 402 1,096 1,038
Page 44 Estimated Financial Statements reviewed by the Auditor-General

Table C.1: General Government Sector Operating Statement (cont)
2014-15 2014-15 2015-16 2016-17 2017-18 Budget Revised Forward Estimates
$m $m $m $m $m
Other Economic Flows - Included in the Operating Result Gain/(Loss) from Superannuation ... ... ... ... ... Gain/(Loss) from Other Liabilities 312 229 218 208 99 Other Net Gains/(Losses) -29 30 173 131 166 Share of Earnings from Associates (excluding Dividends) -22 -22 -19 -17 -23 Dividends from Asset Sale Proceeds 175 143 25 ... ... Deferred Income Tax from Other Sectors 145 82 108 106 108 Other -35 -35 -36 -36 -37 Discontinuing Operations - Other Economic Flows ... ... ... ... ... Other Economic Flows - Included in the Operating Result 547 428 469 391 312
Operating Result 264 700 871 1,487 1,351
Other Economic Flows - Other Comprehensive Income
Items that will not be Reclassified to the Operating Result
Superannuation Actuarial Gain/(Loss) 6,952 6,993 5,978 5,261 2,968 Deferred Tax Direct to Equity ... ... ... ... ... Revaluations 3,462 3,701 3,299 3,443 3,271 Share of Earnings from Associates from Revaluations ... ... ... ... ... Items that may be Reclassified Subsequently to the Operating Result Net Gain/(Loss) on Equity Investments in Other Sectors 6,769 7,241 7,919 7,038 5,802 Net Gain/(Loss) on Equity Investments in Other Sectors ... ... ... ... ... Net Gain/(Loss) on Financial Instruments at Fair Value ... ... ... ... ... Other -1,200 -1,269 -1,142 -984 -126 Other Economic Flows - Other Comprehensive Income 15,984 16,666 16,054 14,758 11,915
Comprehensive Result - Total Change in Net Worth 16,247 17,366 16,925 16,245 13,266
Key Fiscal Aggregates
Comprehensive Result - Total Change in Net Worth 16,247 17,366 16,925 16,245 13,266 Less: Net Other Economic Flows -16,530 -17,094 -16,523 -15,149 -12,228 Equals: Budget Result - Net Operating Balance -283 272 402 1,096 1,038
Less: Net Acquisition of Non-Financial Assets Purchases of Non-Financial Assets 10,091 10,091 9,443 9,674 9,390 Sales of Non-Financial Assets -482 -476 -529 -364 -478 Less: Depreciation -4,242 -4,220 -4,440 -4,601 -4,773 Plus : Change in Inventories 4 5 0 3 2 Plus : Other Movements in Non-Financial Assets
- Assets Acquired Using Finance Leases 113 113 113 108 110 - Other -2,049 -1,998 -2,176 -2,058 -2,263
Equals: Total Net Acquisition of Non-Financial Assets 3,434 3,515 2,412 2,762 1,988
Equals: Net Lending/(Borrowing) [Fiscal Balance] -3,717 -3,243 -2,011 -1,666 -950
OTHER AGGREGATES Capital Expenditure (a) 10,203 10,203 9,556 9,782 9,501
(a) Capital expenditure comprises purchases of non-financial assets plus assets acquired utilising finance leases.
Estimated Financial Statements reviewed by the Auditor-General Page 45

Table C.2: General Government Sector Balance Sheet
June 2015 June 2015 Budget Revised
$m $m Assets Financial Assets Cash and Cash Equivalent Assets 8,546 8,390 Receivables 6,791 7,261 Tax Equivalents Receivable 81 71 Investments, Loans and Placements
Financial Assets at Fair Value 10,399 10,536 Other Financial Assets 537 3,639
Advances Paid 1,026 1,126 Deferred Tax Equivalents Assets 5,410 4,719
Investments in Other Public Sector Entities 93,723 91,048 Investments in Other Public Sector - Held for Sale ... ... Investments in Associates 4,257 4,019 Other Financial Assets 10 10 Total Financial Assets 130,781 130,818
Non-Financial Assets Inventories 252 253 Forestry Stock and Other Biological Assets 7 7 Assets Classified as Held for Sale 146 114 Investment Properties 125 137 Property, Plant and Equipment Land and Buildings 64,392 65,756 Plant and Equipment 9,806 9,602 Infrastructure Systems 78,762 78,821 Intangibles 2,736 2,690 Other Non-Financial Assets 2,548 2,500 Total Non-Financial Assets 158,775 159,881
Equity
Total Assets 289,555 290,699
Liabilities Deposits Held 106 110 Payables 4,708 5,147 Tax Equivalent Payables 109 33 Liabilities Directly Associated with Assets Held for Sale ... ... Borrowings and Derivatives at Fair Value 8 11 Borrowings at Amortised Cost 31,993 31,954 Advances Received 765 924 Employee Provisions 13,542 14,358 Superannuation Provisions(a) 31,169 42,387 Deferred Tax Equivalent Provisions 621 504 Other Provisions 7,844 8,104 Other Liabilities 1,661 1,948
Total Liabilities 92,525 105,480
NET ASSETS 197,030 185,219
NET WORTH Accumulated Funds 37,006 27,679 Reserves 160,024 157,540
TOTAL NET WORTH 197,030 185,219
OTHER KEY AGGREGATES Net Financial Worth 38,256 25,338 Net Debt(b) 12,364 9,308 Net Financial Liabilities(c) 55,467 65,710
June 2016 June 2017 June 2018 Forward Estimates
$m $m $m
7,582 7,112 7,355 6,345 5,985 5,558
-0 0 0
10,958 11,295 11,847 3,180 2,643 2,673 1,201 1,228 1,194 4,809 4,911 5,016
98,967 106,003 111,803... ... ...
4,000 3,983 3,96010 10 11
137,053 143,170 149,416
253 256 257 7 7 7
33 53 34 137 137 137
66,783 66,898 67,0579,642 9,597 9,392
82,982 88,563 93,420 2,719 2,581 2,383 2,920 3,390 3,830
165,475 171,482 176,517
302,528 314,652 325,933
105 105 104 4,762 4,739 4,785
66 143 283 ... ... ... 9 7 6
32,319 32,713 32,836 973 908 801
14,241 14,228 14,350
37,191 32,494 29,847 525 554 550
8,248 8,481 8,843 1,946 1,891 1,872
100,384 96,262 94,277
202,144 218,389 231,655
33,507 39,394 43,711 168,637 178,995 187,944
202,144 218,389 231,655
36,669 46,907 55,138 10,485 11,455 10,679 62,299 59,096 56,665
(a) Superannuation liabilities are reported net of prepaid superannuation contribution assets. (b) Net debt comprises the sum of deposits held, borrowings and advances received, minus the sum of cash and cash equivalents, investments, loans
and placements and advances paid. (c) Net financial liabilities equals total liabilities less financial assets excluding equity investments in other public sector entities.
Page 46 Estimated Financial Statements reviewed by the Auditor-General

Table C.3: General Government Sector Cash Flow Statement
2014-15 2014-15 Budget Revised
$m $m
Cash Receipts from Operating Activities
Taxes Received 25,359 25,949 Receipts from Sales of Goods and Services 6,554 6,587 Grants and Subsidies Received 28,324 28,540 Interest Receipts 517 596 Dividends and Income Tax Equivalents 2,171 2,080 Other Receipts 6,143 6,351
69,068 70,104 Cash Payments from Operating Activities Payments for Employees -28,145 -28,206 Payments for Superannuation -3,489 -3,527 Payments for Goods and Services -16,453 -16,866 Grants and Subsidies Paid -9,449 -9,333 Interest Paid -1,688 -1,706 Other Payments -3,140 -3,343
-62,363 -62,980
Net Cash Flows from Operating Activities 6,705 7,124
Total Cash Receipts from Operating Activities
Total Cash Payments from Operating Activities
2015-16 2016-17 2017-18 Forward Estimates
$m $m $m
27,282 28,358 29,889 6,901 7,162 7,247
29,879 32,072 31,778 545 554 511
2,391 1,554 1,452 6,210 6,401 6,640
73,208 76,101 77,517
-29,806 -30,719 -31,660 -3,703 -3,880 -4,058
-17,156 -17,766 -18,048 -9,110 -9,817 -9,421 -1,711 -1,712 -1,687 -3,050 -3,112 -3,074
-64,536 -67,008 -67,948
8,672 9,094 9,569
Net Cash Flows from Investments in Non-Financial Assets
Sales of Non-Financial Assets 482 460 Purchases of Non-Financial Assets -10,069 -10,067 Net Cash Flows from Investments
in Non-Financial Assets -9,587 -9,606
529 364 478 -9,539 -9,729 -9,443
-9,010 -9,365 -8,965
Cash Flows from Investments from Financial Assets for Policy Purposes
Receipts 311 1,246 Payments -1,321 -1,416 Net Cash Flows from Investments
in Financial Assets for Policy Purposes -1,009 -171
196 193 202 -1,359 -1,088 -278
-1,163 -895 -76
Net Cash Flows from Investments in Financial Assets for Liquidity Purposes
Receipts from Sale/Maturity of Investments 260 1,289 Payments for Purchases of Investments -547 -795 Net Cash Flows from Investments in Financial Assets for Liquidity Purposes -288 494
Net Cash Flows from Investing Activities -10,884 -9,283
1,077 1,174 491 -551 -541 -553
526 633 -62
-9,647 -9,627 -9,103
Cash Flows from Financing Activities Advances Received 87 171 Advances Repaid -61 -61 Proceeds from Borrowings 1,107 1,202 Repayments of Borrowings -594 -593 Deposits Received (net) -9 -9 Other Financing (net) ... -2 Net Cash Flows from Financing Activities 529 709
Net Increase/(Decrease) in Cash Held -3,650 -1,450
77 3 3 -53 -102 -103 613 637 623
-464 -526 -824 -4 -0 -0 ... ... ...
169 12 -300
-806 -522 166
Estimated Financial Statements reviewed by the Auditor-General Page 47

Table C.3: General Government Sector Cash Flow Statement (cont)
2014-15 2014-15 2015-16 2016-17 2017-18 Budget Revised Forward Estimates
$m $m $m $m $m
Derivation of Cash Result Net Cash Flows from Operating Activities 6,705 7,124 8,672 9,094 9,569 Net Cash Flows from Investments in Non-Financial Assets -9,587 -9,606 -9,010 -9,365 -8,965
Cash Surplus/(Deficit) -2,882 -2,482 -338 -272 604
Table C.4: Derivation of ABS GFS General Government Sector Cash Surplus/(Deficit)
2014-15 2014-15 2015-16 2016-17 2017-18 Budget Revised Forward Estimates
$m $m $m $m $m
Cash Surplus/(Deficit) -2,882 -2,482 -338 -272 604 Assets Acquired under Finance Leases -113 -113 -113 -108 -110 Other Financing Arrangements(a) -21 -9 95 55 53
ABS GFS Surplus/(Deficit) -3,016 -2,604 -356 -324 546
(a) Comprises movements in payables and receivables of a capital nature.
End of Reviewed Estimated Financial Statements
Page 48 Estimated Financial Statements reviewed by the Auditor-General

Table C.5: Public Non-Financial Corporation Sector Operating Statement
2014-15 2014-15 2015-16 2016-17 2017-18 Budget Revised Forward Estimates
$m $m $m $m $m
Revenue from Transactions Taxation ... ... ... ... ... Grants and Subsidies
- Commonwealth General Purpose ... ... ... ... ... - Commonwealth Specific Purpose Payments 21 8 24 0 12
- Commonwealth National Partnership Payments ... ... ... ... ... - Other Grants and Subsidies 3,010 3,166 3,522 4,497 4,238
Sale of Goods and Services 13,396 12,385 12,669 12,752 13,123 Interest 81 103 96 111 105 Dividend and Income Tax Equivalents from Other Sectors ... ... ... ... ... Other Dividends and Distributions ... ... ... 6 ... Fines, Regulatory Fees and Other 2,882 2,938 3,013 2,929 3,173 Total Revenues from Transactions 19,390 18,600 19,323 20,295 20,652
Expenses from Transactions Employee 3,615 3,431 3,463 3,492 3,479 Superannuation
- Superannuation Interest Cost 69 90 82 73 63 - Other Superannuation 338 317 339 328 321
Depreciation and Amortisation 3,617 3,467 3,655 3,793 4,018 Interest 2,176 1,923 2,080 2,248 2,364 Income Tax Expense 534 534 378 313 316 Other Property ... ... ... ... ... Other Operating 7,150 6,624 6,502 6,313 6,216 Grants and Subsidies
- Current Grants and Subsidies 312 310 312 312 262 - Capital Grants 48 114 1 76 3
Total Expenses from Transactions 17,860 16,810 16,811 16,949 17,041
Transactions from Discontinuing Operations ... 24 ... ... ...
NET OPERATING BALANCE - SURPLUS AFTER TAX 1,530 1,814 2,512 3,347 3,611
2014-15 Half-Yearly Review Page 49

Table C.5: Public Non-Financial Corporation Sector Operating Statement (cont)
2014-15 2014-15 2015-16 2016-17 2017-18 Budget Revised Forward Estimates
$m $m $m $m $m
Other Economic Flows - Included in the Operating Result Gain/(Loss) from Superannuation ... ... ... ... ... Gain/(Loss) from Other Liabilities ... ... ... ... ... Other Net Gains/(Losses) 340 166 280 101 -1 Share of Earnings from Associates (excluding Dividends) ... ... ... ... ... Dividends from Asset Sale Proceeds ... ... ... ... ... Deferred Income Tax from Other Sectors ... ... ... ... ... Other -11 -44 -28 -19 -25 Discontinuing Operations - Other Economic Flows ... -65 ... ... ... Other Economic Flows - Included in the Operating Result 329 57 253 82 -25
Operating Result 1,859 1,871 2,765 3,429 3,586
Other Economic Flows - Other Comprehensive Income
Items that will not be Reclassified to the Operating Result Superannuation Actuarial Gains/(Loss) 752 379 593 543 310 Deferred Tax Direct to Equity -138 -41 -82 -89 -85 Revaluations 2,883 3,446 3,414 2,807 2,979 Share of Earnings from Associates from Revaluations ... ... ... ... ... Items that may be Reclassified Subsequently to the Operating Result Net Gain/(Loss) on Equity Investments in Other Sectors ... ... ... ... ... Net Gain/(Loss) on Equity Investments in Other Sectors Discontinued ... ... ... ... ... Net Gain/(Loss) on Financial Instruments at Fair Value ... -4 ... ... ... Other 1,099 159 13 12 ... Other Economic Flows - Other Comprehensive Income 4,597 3,939 3,938 3,273 3,204
Comprehensive Result - Total Change in Net Worth 6,455 5,810 6,703 6,702 6,790
Key Fiscal Aggregates
Comprehensive Result - Total Change in Net Worth 6,455 5,810 6,703 6,702 6,790 Less: Net Other Economic Flows -4,926 -3,996 -4,191 -3,356 -3,179 Equals: Net Operating Balance - Surplus After Tax 1,530 1,814 2,512 3,347 3,611
Less: Net Acquisition of Non-Financial Assets Purchases of Non-Financial Assets 4,844 4,579 5,827 5,702 5,483 Sales of Non-Financial Assets -460 -399 -653 -483 -382 Less: Depreciation -3,617 -3,467 -3,655 -3,793 -4,018 Plus : Change in Inventories 104 -51 -64 -118 -13 Plus : Other Movements in Non-Financial Assets
- Assets Acquired Using Finance Leases ... ... ... 1,570 ... - Other 2,436 2,410 2,579 2,404 2,700
Equals: Total Net Acquisition of Non-Financial Assets 3,307 3,072 4,035 5,283 3,770
Equals: Net Lending/(Borrowing) [Fiscal Balance] -1,777 -1,259 -1,523 -1,936 -159
OTHER AGGREGATES Capital Expenditure (a) 4,844 4,579 5,827 7,272 5,483 Dividends Accrued (b) 1,698 1,798 988 871 709
(a) Capital expenditure comprises purchases of non-financial assets plus assets acquired utilising finance leases. (b) Net borrowing for the PNFC sector excludes the impact of dividends accrued, and therefore does not fully reflect the sector’s call on the financial
markets.
Page 50 2014-15 Half-Yearly Review

Table C.6: Public Non-Financial Corporation Sector Balance Sheet
June 2015 June 2015 June 2016 June 2017 June 2018 Budget Revised Forward Estimates
$m $m $m $m $m Assets Financial Assets Cash and Cash Equivalent Assets 2,101 832 912 1,127 1,239 Receivables 2,101 1,967 1,978 1,976 2,023 Tax Equivalents Receivable 109 33 73 150 290 Investments, Loans and Placements
Financial Assets at Fair Value 311 268 73 104 119 Other Financial Assets 760 764 763 757 752
Advances Paid 0 0 0 0 0 Deferred Tax Equivalents Assets 617 499 521 549 546Equity Investments in Other Public Sector Entities ... ... ... ... ... Investments in Other Public Sector - Held for Sale ... ... ... ... ... Investments in Associates ... ... ... ... ... Other Financial Assets 2 2 2 2 2 Total Financial Assets 6,001 4,367 4,322 4,665 4,970 Non-Financial Assets Inventories 1,149 853 772 653 640 Forestry Stock and Other Biological Assets 708 782 782 782 782 Assets Classified as Held for Sale 48 144 60 48 32 Investment Properties 408 515 446 406 424 Property, Plant and Equipment Land and Buildings 55,615 55,000 56,954 60,159 61,992 Plant and Equipment 6,305 6,484 6,387 6,239 6,055 Infrastructure Systems 73,738 71,566 77,283 82,427 87,536 Intangibles 1,471 1,525 1,495 1,458 1,377 Other Non-Financial Assets 228 236 240 245 251 Total Non-Financial Assets 139,669 137,105 144,420 152,418 159,088 Total Assets 145,671 141,472 148,742 157,082 164,058
Liabilities Deposits Held 93 41 31 32 26 Payables 2,699 2,708 2,993 3,037 3,147 Tax Equivalent Payables 74 67 ... ... ... Liabilities Directly Associated with Assets Held for Sale 3 ... ... ... ... Borrowings and Derivatives at Fair Value 152 187 25 25 25 Borrowings at Amortised Cost 35,916 34,367 37,221 40,372 41,730 Advances Received 432 432 404 389 374 Employee Provisions 2,041 1,917 1,906 1,885 1,897 Superannuation Provisions(a) 1,930 2,342 1,822 1,328 1,044 Deferred Tax Equivalent Provisions 5,409 4,717 4,808 4,909 5,015 Other Provisions 2,519 2,570 1,683 1,436 1,059 Other Liabilities 246 173 207 198 189
Total Liabilities 51,515 49,521 51,101 53,611 54,506
NET ASSETS 94,156 91,950 97,640 103,471 109,552
NET WORTH Accumulated Funds 44,859 43,874 46,226 49,332 52,513 Reserves 49,297 48,076 51,415 54,139 57,040
TOTAL NET WORTH 94,156 91,950 97,640 103,471 109,552
OTHER KEY AGGREGATES Net Financial Worth -45,514 -45,155 -46,780 -48,947 -49,536
Net Debt(b) 33,422 33,162 35,934 38,830 40,046 Net Financial Liabilities(c) 45,514 45,155 46,780 48,947 49,536
(a) Superannuation liabilities are reported net of prepaid superannuation contribution assets. (b) Net debt comprises the sum of deposits held, borrowings and advances received, minus the sum of cash and cash equivalents, investments, loans
and placements and advances paid. (c) Net financial liabilities equals total liabilities less financial assets excluding equity investments in other public sector entities.
2014-15 Half-Yearly Review Page 51

Table C.7: Public Non-Financial Corporation Sector Cash Flow Statement
2014-15 2014-15 2015-16 2016-17 2017-18 Budget Revised Forward Estimates
$m $m $m $m $m Cash Receipts from Operating Activities Taxes Received ... ... ... ... ... Receipts from Sales of Goods and Services 13,887 13,075 13,092 12,980 13,176 Grants and Subsidies Received 3,031 3,174 3,546 4,497 4,250 Interest Receipts 79 99 90 105 99 Dividends and Income Tax Equivalents ... 5 -36 -114 -140 Other Receipts 1,960 1,886 1,904 1,933 1,954 Total Cash Receipts from Operating Activities 18,956 18,240 18,597 19,401 19,340 Cash Payments from Operating Activities Payments for Employees -3,783 -3,699 -3,641 -3,680 -3,634 Payments for Superannuation -376 -388 -348 -352 -359 Payments for Goods and Services -7,020 -7,039 -6,093 -5,993 -5,948 Grants and Subsidies Paid -312 -310 -313 -319 -265 Interest Paid -1,958 -1,894 -1,969 -2,128 -2,257 Income Tax Equivalents Paid -884 -733 -436 -299 -296 Other Payments -1,646 -1,371 -1,525 -1,462 -1,519 Total Cash Payments from Operating Activities -15,979 -15,434 -14,326 -14,233 -14,276 Net Cash Flows from Operating Activities 2,977 2,806 4,272 5,168 5,064
Net Cash Flows from Investments in Non-Financial Assets
Sales of Non-Financial Assets 460 399 653 483 382 Purchases of Non-Financial Assets -4,817 -4,550 -5,799 -5,748 -5,489 Net Cash Flows from Investments
in Non-Financial Assets -4,357 -4,151 -5,146 -5,265 -5,107
Cash Flows from Investments from Financial Assets for Policy Purposes
Receipts 5 785 ... ... ... Payments -20 -20 -15 -16 -16 Net Cash Flows from Investments
in Financial Assets for Policy Purposes -15 765 -15 -16 -16
Net Cash Flows from Investments in Financial Assets for Liquidity Purposes
Receipts from Sale/Maturity of Investments 198 161 90 53 57 Payments for Purchases of Investments -22 -22 -28 -56 -45 Net Cash Flows from Investments in Financial Assets for Liquidity Purposes 176 139 63 -3 12 Net Cash Flows from Investing Activities -4,196 -3,247 -5,099 -5,283 -5,111
Cash Flows from Financing Activities Advances Received 1,099 159 13 12 ... Advances Repaid -223 -450 -94 -31 -31 Proceeds from Borrowings 4,023 3,098 3,251 1,872 1,759 Repayments of Borrowings -1,432 -1,732 -456 -479 -499 Dividends Paid -1,308 -1,282 -1,798 -1,129 -1,055 Deposits Received (net) -8 -13 -9 0 -6 Other Financing (net) ... ... ... ... ... Net Cash Flows from Financing Activities 2,152 -220 907 246 169 Net Increase/(Decrease) in Cash Held 933 -661 80 130 122
Page 52 2014-15 Half-Yearly Review

Table C.7: Public Non-Financial Corporation Sector Cash Flow Statement (cont)
2014-15 2014-15 2015-16 2016-17 2017-18 Budget Revised Forward Estimates
$m $m $m $m $m
Derivation of Cash Result Net Cash Flows from Operating Activities 2,977 2,806 4,272 5,168 5,064 Net Cash Flows from Investments in Non-Financial Assets -4,357 -4,151 -5,146 -5,265 -5,107 Dividends Paid -1,308 -1,282 -1,798 -1,129 -1,055 Cash Surplus/(Deficit) -2,688 -2,628 -2,672 -1,226 -1,098
Table C.8: Derivation of ABS GFS Public Non-Financial Corporation Sector Cash Surplus/(Deficit)
2014-15 2014-15 2015-16 2016-17 2017-18 Budget Revised Forward Estimates
$m $m $m $m $m
Cash Surplus/(Deficit) -2,688 -2,628 -2,672 -1,226 -1,098 Assets Acquired under Finance Leases ... ... ... -1,570 ... Other Financing Arrangements(a) -26 -29 -28 46 6 ABS GFS Surplus/(Deficit) -2,714 -2,657 -2,701 -2,751 -1,092
(a) Comprises movements in payables and receivables of a capital nature.
2014-15 Half-Yearly Review Page 53
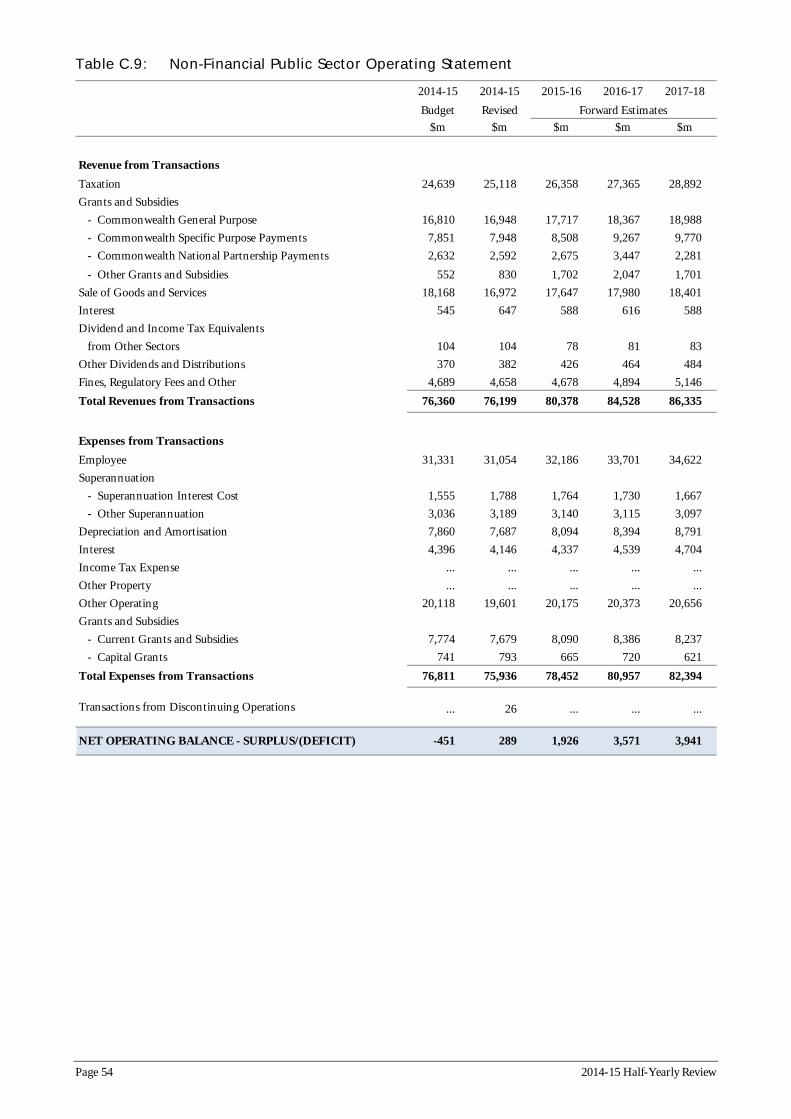
Table C.9: Non-Financial Public Sector Operating Statement
2014-15 2014-15 2015-16 2016-17 2017-18 Budget Revised Forward Estimates
$m $m $m $m $m
Revenue from Transactions Taxation 24,639 25,118 26,358 27,365 28,892 Grants and Subsidies
Commonwealth General Purpose 16,810 16,948 17,717 18,367 18,988 Commonwealth Specific Purpose Payments 7,851 7,948 8,508 9,267 9,770
Commonwealth National Partnership Payments 2,632 2,592 2,675 3,447 2,281 Other Grants and Subsidies 552 830 1,702 2,047 1,701
Sale of Goods and Services 18,168 16,972 17,647 17,980 18,401 Interest 545 647 588 616 588 Dividend and Income Tax Equivalents from Other Sectors 104 104 78 81 83 Other Dividends and Distributions 370 382 426 464 484 Fines, Regulatory Fees and Other 4,689 4,658 4,678 4,894 5,146 Total Revenues from Transactions 76,360 76,199 80,378 84,528 86,335
Expenses from Transactions Employee 31,331 31,054 32,186 33,701 34,622 Superannuation
Superannuation Interest Cost 1,555 1,788 1,764 1,730 1,667 Other Superannuation 3,036 3,189 3,140 3,115 3,097
Depreciation and Amortisation 7,860 7,687 8,094 8,394 8,791 Interest 4,396 4,146 4,337 4,539 4,704 Income Tax Expense ... ... ... ... ... Other Property ... ... ... ... ... Other Operating 20,118 19,601 20,175 20,373 20,656 Grants and Subsidies
Current Grants and Subsidies 7,774 7,679 8,090 8,386 8,237 Capital Grants 741 793 665 720 621
Total Expenses from Transactions 76,811 75,936 78,452 80,957 82,394
Transactions from Discontinuing Operations ... 26 ... ... ...
NET OPERATING BALANCE - SURPLUS/(DEFICIT) -451 289 1,926 3,571 3,941
Page 54 2014-15 Half-Yearly Review

Table C.9: Non-Financial Public Sector Operating Statement (cont)
2014-15 2014-15 2015-16 2016-17 2017-18 Budget Revised Forward Estimates
$m $m $m $m $m
Other Economic Flows - Included in the Operating Result Gain/(Loss) from Superannuation ... ... ... ... ... Gain/(Loss) from Other Liabilities 312 229 218 208 99 Other Net Gains/(Losses) 311 129 454 232 165 Share of Earnings from Associates (excluding Dividends) -22 -22 -19 -17 -23 Dividends from Asset Sale Proceeds ... ... ... ... ... Deferred Income Tax from Other Sectors ... ... ... ... ... Other -39 -37 -37 -38 -39 Discontinuing Operations - Other Economic Flows ... 1 ... ... ... Other Economic Flows - Included in the Operating Result 563 301 616 385 202
Operating Result 112 590 2,541 3,956 4,143
Other Economic Flows - Other Comprehensive Income
Items that will not be Reclassified to the Operating Result
Superannuation Actuarial Gain/(Loss) 7,705 7,372 6,570 5,804 3,278 Deferred Tax Direct to Equity ... -0 ... ... ... Revaluations 6,345 7,147 6,713 6,250 6,250 Share of Earnings from Associates from Revaluations ... ... ... ... ... Items that may be Reclassified Subsequently to the Operating Result Net Gain/(Loss) on Equity Investments in Other Sectors 2,199 3,255 2,229 1,205 -281 Net Gain/(Loss) on Equity Investments in Other Sectors Discontinued ... ... ... ... ... Net Gain/(Loss) on Financial Instruments at Fair Value ... -4 ... ... ... Other -101 -1,110 -1,129 -972 -126 Other Economic Flows - Other Comprehensive Income 16,148 16,660 14,384 12,286 9,121
Comprehensive Result - Total Change in Net Worth 16,260 17,250 16,925 16,243 13,263
Key Fiscal Aggregates
Comprehensive Result - Total Change in Net Worth 16,260 17,250 16,925 16,243 13,263 Less: Net Other Economic Flows -16,711 -16,961 -14,999 -12,671 -9,323 Equals: Net Operating Balance -451 289 1,926 3,571 3,941
Less: Net Acquisition of Non-Financial Assets Purchases of Non-Financial Assets 14,926 14,661 15,262 15,367 14,864 Sales of Non-Financial Assets -942 -874 -1,181 -847 -860 Less: Depreciation -7,860 -7,687 -8,094 -8,394 -8,791 Plus : Change in Inventories 109 -46 -64 -116 -12 Plus : Other Movements in Non-Financial Assets
- Assets Acquired Using Finance Leases 113 113 113 1,679 110 - Other 388 412 403 347 437
Equals: Total Net Acquisition of Non-Financial Assets 6,733 6,579 6,438 8,036 5,749
Equals: Net Lending/(Borrowing) [Fiscal Balance] -7,184 -6,290 -4,512 -4,465 -1,808
OTHER AGGREGATES
Capital Expenditure (a) 15,038 14,773 15,375 17,045 14,975
(a) Capital expenditure comprises purchases of non-financial assets plus assets acquired utilising finance leases.
2014-15 Half-Yearly Review Page 55

Table C.10: Non-Financial Public Sector Balance Sheet
June 2015 June 2015 June 2016 June 2017 June 2018 Budget Revised Forward Estimates
$m $m $m $m $m Assets Financial Assets Cash and Cash Equivalent Assets 10,647 9,222 8,494 8,239 8,593 Receivables 5,949 6,195 6,059 5,994 5,967 Tax Equivalents Receivable ... ... ... ... ... Investments, Loans and Placements
Financial Assets at Fair Value 10,718 10,803 11,032 11,399 11,966 Other Financial Assets 818 3,922 3,473 2,946 2,987
Advances Paid 597 697 802 839 820 Deferred Tax Equivalents Assets 1 1 1 1 1Equity Investments in Other Public Sector Entities -433 -902 1,327 2,532 2,251 Investments in Other Public Sector - Held for Sale ... ... ... ... ... Investments in Associates 4,257 4,019 4,000 3,983 3,960 Other Financial Assets 12 12 12 13 13 Total Financial Assets 32,567 33,968 35,201 35,945 36,557
Non-Financial Assets Inventories 1,401 1,106 1,025 909 897 Forestry Stock and Other Biological Assets 715 790 790 790 790 Assets Classified as Held for Sale 193 258 93 101 66 Investment Properties 534 652 583 543 561 Property, Plant and Equipment Land and Buildings 120,007 120,757 123,737 127,057 129,049 Plant and Equipment 16,111 16,086 16,029 15,836 15,447 Infrastructure Systems 152,500 150,388 160,265 170,990 180,956 Intangibles 4,207 4,215 4,213 4,039 3,761 Other Non-Financial Assets 2,762 2,713 3,137 3,614 4,059 Total Non-Financial Assets 298,430 296,964 309,873 323,878 335,583 Total Assets 330,997 330,932 345,073 359,823 372,140
Liabilities Deposits Held 200 150 137 137 131 Payables 6,584 7,027 6,883 6,936 7,090 Tax Equivalent Payables ... ... ... ... ... Liabilities Directly Associated with Assets Held for Sale 3 ... ... ... ... Borrowings and Derivatives at Fair Value 160 198 34 32 31 Borrowings at Amortised Cost 67,438 65,839 69,070 72,631 74,128 Advances Received 768 927 979 908 801 Employee Provisions 15,536 16,236 16,106 16,073 16,207 Superannuation Provisions (a) 33,099 44,729 39,013 33,822 30,891 Deferred Tax Equivalent Provisions 3 4 4 4 4 Other Provisions 8,293 8,495 8,565 8,815 9,155 Other Liabilities 1,882 2,108 2,139 2,075 2,047
Total Liabilities 133,967 145,713 142,929 141,433 140,485
NET ASSETS 197,030 185,219 202,144 218,389 231,655
NET WORTH Accumulated Funds 77,571 67,563 75,672 84,588 92,011 Reserves 119,459 117,656 126,472 133,801 139,644
TOTAL NET WORTH 197,030 185,219 202,144 218,389 231,655
OTHER KEY AGGREGATES Net Financial Worth -101,399 -111,745 -107,729 -105,489 -103,928 Net Debt (b) 45,786 42,470 46,419 50,286 50,725
Net Financial Liabilities (c) 100,967 110,842 109,056 108,020 106,178 (a) Superannuation liabilities are reported net of prepaid superannuation contribution assets. (b) Net debt comprises the sum of deposits held, borrowings and advances received, minus the sum of cash and cash equivalents, investments, loans and
placements and advances paid. (c) Net financial liabilities equals total liabilities less financial assets excluding equity investments in other public sector entities.
Page 56 2014-15 Half-Yearly Review

Table C.11: Non-Financial Public Sector Cash Flow Statement
2014-15 2014-15 Budget Revised
$m $m Cash Receipts from Operating Activities Taxes Received 24,556 25,173 Receipts from Sales of Goods and Services 19,293 18,344 Grants and Subsidies Received 27,902 28,328 Interest Receipts 532 633 Dividends and Income Tax Equivalents 81 91 Other Receipts 8,040 8,236
80,404 80,806 Cash Payments from Operating Activities Payments for Employees -31,127 -31,131 Payments for Superannuation -3,865 -3,916 Payments for Goods and Services -22,120 -22,468 Grants and Subsidies Paid -6,469 -6,368 Interest Paid -3,582 -3,538 Other Payments -4,877 -4,621
-72,039 -72,041 Net Cash Flows from Operating Activities 8,365 8,764
Total Operating Receipts
Total Operating Payments
2015-16
$m
26,422 18,699 30,552
573 103
8,088 84,438
-32,601 -4,051
-21,834 -6,640 -3,619 -4,557
-73,302 11,136
2016-17 Forward Estimates
$m
27,428 18,779 33,110
600 79
8,318 88,314
-33,544 -4,233
-22,220 -6,755 -3,781 -4,661
-75,193 13,120
2017-18
$m
28,957 19,069 32,941
554 82
8,370 89,972
-34,422 -4,417
-22,503 -6,453 -3,887 -4,723
-76,404 13,568
Cash Flows from Investments in Non-Financial Assets
Sales of Non-Financial Assets 942 859 Purchases of Non-Financial Assets -14,878 -14,607 Net Cash Flows from Investments
in Non-Financial Assets -13,936 -13,748
1,181 -15,329
-14,147
847 -15,466
-14,619
860 -14,923
-14,063
Cash Flows from Investments from Financial Assets for Policy Purposes
Receipts 94 1,486 Payments -241 -1,277 Net Cash Flows from Investments
in Financial Assets for Policy Purposes -147 209
128 -1,361
-1,234
163 -1,091
-928
171 -294
-122
Net Cash Flows from Investments in Financial Assets for Liquidity Purposes
Receipts from Sale/Maturity of Investments 424 1,416 Payments for Purchases of Investments -569 -816 Net Cash Flows from Investments in Financial Assets for Liquidity Purposes -146 599 Net Cash Flows from Investing Activities -14,229 -12,940
1,129 -578
551 -14,830
1,185 -597
588 -14,959
506 -598
-92 -14,277
Cash Flows from Financing Activities Advances Received 87 171 Advances Repaid -61 -61 Proceeds from Borrowings 5,130 4,363 Repayments of Borrowings -1,992 -2,291 Deposits Received (net) -17 -22 Other Financing (net) ... -30 Net Cash Flows from Financing Activities 3,146 2,131 Net Increase/(Decrease) in Cash Held -2,717 -2,045
77 -53
3,838 -882
-14 ...
2,967 -727
3 -102
2,509 -963
0 ...
1,447 -392
3 -103
2,383 -1,281
-6 ...
996 287
2014-15 Half-Yearly Review Page 57

Table C.11: Non-Financial Public Sector Cash Flow Statement (cont)
2014-15 2014-15 2015-16 2016-17 2017-18 Budget Revised Forward Estimates
$m $m $m $m $m
Derivation of Cash Result Net Cash Flows from Operating Activities 8,365 8,764 11,136 13,120 13,568 Net Cash Flows from Investments in Non-Financial Assets -13,936 -13,748 -14,147 -14,619 -14,063
Cash Surplus/(Deficit) -5,570 -4,984 -3,012 -1,499 -495
Table C.12: Derivation of ABS GFS Non-Financial Public Sector Cash Surplus/(Deficit)
2014-15 2014-15 2015-16 2016-17 2017-18 Budget Revised Forward Estimates
$m $m $m $m $m
Cash Surplus/(Deficit) -5,570 -4,984 -3,012 -1,499 -495 Assets Acquired under Finance Leases -113 -113 -113 -1,679 -110 Other Financing Arrangements(a) -48 -38 67 99 59 ABS GFS Surplus/(Deficit) -5,731 -5,135 -3,057 -3,078 -546
(a) Comprises movements in payables and receivables of a capital nature.
Page 58 2014-15 Half-Yearly Review

C.2 Loan Council Allocation
Table C.13 presents the Budget estimates of the State’s Loan Council Allocation (LCA) for 2014-15 and a revised estimate taking into account recent fiscal and economic developments.
Overall, the LCA for 2014-15 is estimated to be $5.9 billion. This is a reduction of $0.9 billion on the Budget estimate of $6.7 billion. The variance is within the tolerance limit of $1.6 billion set by the Loan Council. This tolerance limit is calculated as 2 per cent of cash receipts from operating activities for the non-financial public sector.
The variance is largely due to:
§ a $0.4 billion decrease in the general government cash deficit largely relating to changes in net cash flows of operating activities associated with changes in the Budget Result
§ the $0.4 billion improvement in net cash flows from investments in financial assets for policy purposes is largely related to proceeds from the sale of Macquarie Generation and Green State Power ($1.4 billion), offset by a reduction in expenses due the reclassification of the Sydney Motorway Corporation from the public non-financial corporation (PTE) to the public financial corporation (PFE) sector following the ABS determination of the entity classification for Westconnex ($1 billion).
Table C.13: Loan Council Allocation Estimates(a)
2013-14 2014-15 2014-15 Actual Budget-time Half-Yearly
Estimate Estimate $m $m $m
General Government Sector Cash Deficit/(Surplus) -1,656 2,882 2,482 Public Non-Financial Corporations Sector Cash Deficit/(Surplus) 1,875 2,688 2,628
Non-Financial Public Sector Cash Deficit/(Surplus)(b) 256 5,570 4,984 Acquisitions Under Finance Leases and Similar Arrangements(c) 1,109 160 151
Equals: ABS GFS Cash Deficit/(Surplus) 1,365 5,731 5,135 Net Cash Flows From Investments in Financial Assets For Policy
Minus: Purposes(d) 2,513 -147 209
Plus: Memorandum Items(e) -208 864 944
Loan Council Allocation -1,356 6,742 5,870
Budget Tolerance Limit - (+/- 2% Cash Receipts NFPS) 1,608
(a) Cash surplus/deficits and finance leases are displayed with the opposite sign to that under which they are reported in cash flow statements. That is, a surplus is displayed as a negative number.
(b) The non-financial public sector cash surplus/(deficit) may not directly equate to the sum of the general government and public non-financial corporation sectors’ cash deficits due to intersectoral transfers which are netted out.
(c) Finance leases and similar arrangements are shown separately as they are deducted from the AASB 1049 cash surplus to derive the ABS GFS cash surplus.
(d) Net cash flows from investments in financial assets for policy purposes are displayed with the same sign as reported in cash flow statements. (e) Memorandum items are used to adjust the ABS deficit to include in LCAs certain transactions, such as operating leases, that have many of the
characteristics of public sector borrowings but do not constitute formal borrowings. They are also used, where appropriate, to deduct from the ABS deficit certain transactions that the Loan Council has agreed should not be included in LCAs – for example, the funding of more than an employers’ emerging costs under public sector superannuation schemes, or borrowings by entities such as universities.
2014-15 Half-Yearly Review Page 59

Public private partnerships
As approved at the 1997 Loan Council Meeting, States are to report their full contingent exposure to public private partnerships (PPPs) for new contracts entered into, that have not previously been reported. Exposure is to be measured by the Government’s termination liabilities in a case of private sector default, and disclosed as a footnote to, rather than a component of, LCAs.
Information on social infrastructure PPPs and other capital expenditure which is generally reported on the State’s balance sheet is reported within the LCA.
Therefore, only new toll road PPPs, which are generally off-balance sheet, are reported below as Memo items.
Contracts expected to be entered into in 2014-15
NorthConnex
The NSW Government together with Transurban and the M7 Westlink Shareholders (the Project Sponsors) are planning to build, operate and maintain a tolled motorway linking the M1 Pacific Motorway at Wahroonga to the Hills M2 Motorway at West Pennant Hills – called NorthConnex. The proposed motorway would be a nine kilometre tunnel.
The $3 billion project, consisting of design and construction costs, project delivery and land costs, will be funded through toll charges, with a contribution from the NSW and Commonwealth Governments of up to $405 million each.
The project is being developed and assessed consistent with the Government’s Unsolicited Proposals Guide for Submission and Assessment, February 2014.
Contract execution is expected to occur by December 2014. It is expected that the tunnel would be opened to traffic in late 2019.
Expected Government Contingent Liability Nil
WestConnex Stage 1 (M4 Widening and East)
The NSW Government together with the Sydney Motorway Corporation Pty Ltd and its subsidiaries are planning to design, construct, manage and/or operate the widened M4 Motorway between Parramatta and Concord and the M4 East tunnel from Homebush Bay to Parramatta Road (together, Stage 1).
Stage 1 will be tolled and is estimated to cost $3.4 - $3.6 billion.
Contract execution for the M4 widening is expected to occur by December 2014. It is expected that the widened M4 will be opened to traffic in 2017.
Contract execution for the M4 East is expected to occur by June 2015. It is expected that the M4 East will be opened to traffic in 2019.
Expected Government Contingent Liability Nil
Page 60 2014-15 Half-Yearly Review

Appendix D: Variations on Year to Date
Revised 2014-15 Budget
The revised Budget Result expected for 2014-15 is a surplus of $272 million compared to a forecast deficit of $283 million at the time of the 2014-15 Budget.
Total revenue is estimated to be $67.9 billion, which is $745 million or 1.1 per cent higher than the Budget estimate of $67.1 billion.
Total expenses are estimated to be $67.6 billion, which is $190 million or 0.3 per cent higher than the Budget estimate of $67.4 billion.
Operating Statement (Four Months to 31 October 2014)
The Government has received higher-than-forecast taxation receipts in the four months to October 2014. This is primarily due to stamp duty from continued property market strength and the sale of Macquarie Generation. Offsetting this has been lower payroll tax from softer labour market conditions that started to emerge in June 2014.
Stronger market conditions and lower operating expenses are delivering increased dividends in the water and energy sectors respectively. Weakness in the export coal market delivered lower-than-forecast royalties.
Consistent with the Total State Sector Accounts (TSSA), superannuation costs are higher mainly due to the application of the revised AASB 119 Standard for the gross-up of superannuation liabilities for contributions tax. The remaining change is mainly due to an increase in the Superannuation Contribution Guarantee and a change in the discount rate used to determine expenses. Modest new policy decisions and the net impact of changes in the expected timing of recurrent expenses between 2013-14 and 2014-15 represent approximately 0.9 per cent change.
Balance Sheet (as at 31 October 2014)
The proceeds of the sale of Macquarie Generation and Green State Power have increased cash and lowered investment in other public sector entities respectively. Reclassification of term deposits from cash to other financial assets has increased investments, loans and placements. Year-end revaluations driven by changes in expected asset useful life from additional maintenance have increased the value of land and building assets.
Superannuation liabilities are higher as the value of reported defined benefit liabilities is affected by the discount rate used to value accrued entitlements in today’s terms and the application of AASB 119. The Government continues to be on track to fully fund superannuation liabilities by 2030.
Cash Flow Statement
The improvement in the cash position is primarily driven by asset sales and leases, and increased stamp duty.
2014-15 Half-Yearly Review Page 61

Table D.1: General Government Sector Operating Statement
4 Months to 2013-14 2014-15 31/10/2014 Actual Budget Revised Variance Variance Actual
$m $m $m $m % $m
Revenue from Transactions Taxation 24,295 25,489 25,923 433 1.7 8,163 Grants and Subsidies
Commonwealth General Purpose 15,894 16,810 16,948 138 0.8 5,586 Commonwealth Specific Purpose Payments 7,449 7,829 7,943 114 1.5 2,667 Commonwealth National Partnership Payments 3,963 2,632 2,592 -40 -1.5 228 Other Grants and Subsidies 1,026 1,029 1,027 -2 -0.2 405
Sale of Goods and Services 5,677 6,094 6,099 5 0.1 2,054 Interest 609 543 623 80 14.8 215 Dividend and Income Tax Equivalents from Other Sectors 2,260 2,336 2,436 100 4.3 790 Other Dividends and Distributions 700 370 382 11 3.0 46 Fines, Regulatory Fees and Other 4,133 3,981 3,886 -95 -2.4 1,246
Total Revenue from Transactions 66,005 67,113 67,858 745 1.1 21,400
Expenses from Transactions
Employee 27,056 28,351 28,310 -41 -0.1 9,327 Superannuation
Superannuation Interest Cost 1,762 1,487 1,698 211 14.2 574 Other Superannuation 2,694 2,698 2,872 174 6.4 943
Depreciation and Amortisation 3,954 4,242 4,220 -23 -0.5 1,361 Interest 2,249 2,298 2,303 4 0.2 725 Other Property ... ... ... ... ... ... Other Operating 14,345 14,620 14,606 -14 -0.1 4,516 Grants and Subsidies
Current Grants and Subsidies 9,644 10,426 10,316 -110 -1.1 3,595 Capital Grants 3,052 3,274 3,261 -13 -0.4 788
Total Expenses from Transactions 64,757 67,396 67,586 190 0.3 21,829
Transactions from Discontinuing Operations ... ... ... ... ... ...
BUDGET RESULT - SURPLUS/(DEFICIT) [Net Operating Result] 1,247 -283 272 555 -196.3 -429
Page 62 2014-15 Half-Yearly Review
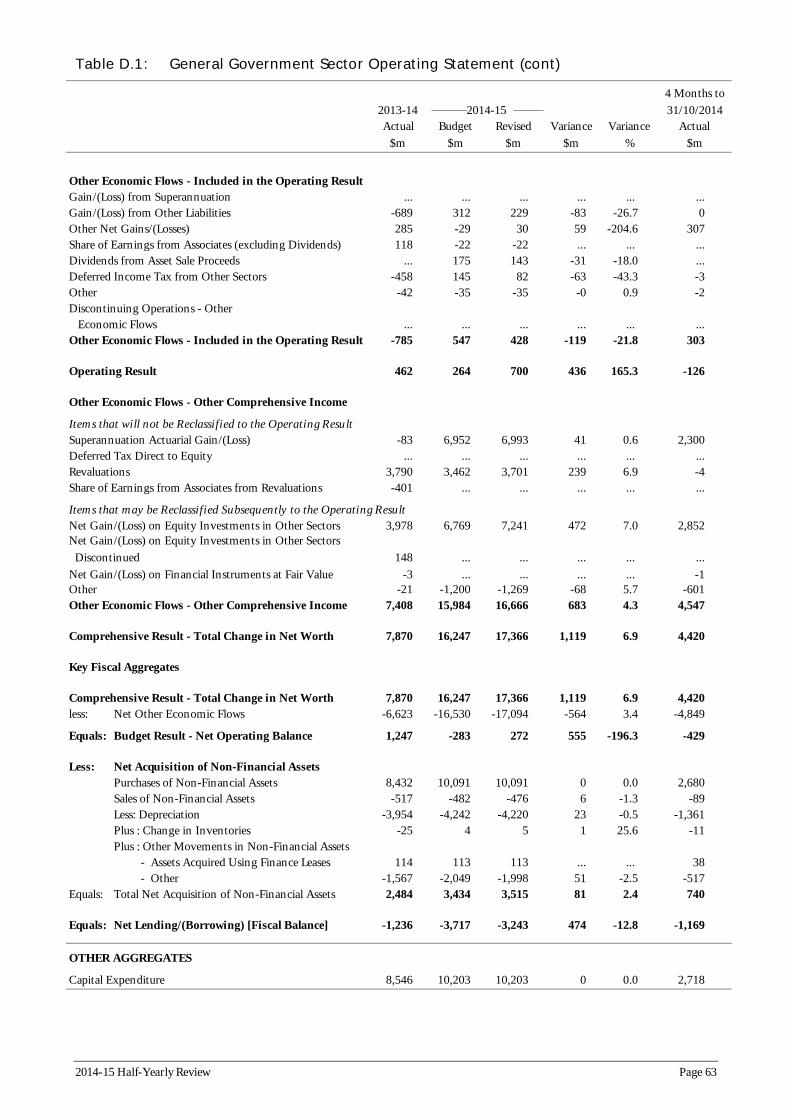
Table D.1: General Government Sector Operating Statement (cont)
4 Months to 2013-14 Actual
$m Budget Revised
$m $m
2014-15 Variance
$m Variance
%
31/10/2014 Actual
$m
Other Economic Flows - Included in the Operating Result Gain/(Loss) from Superannuation ... ... ... ... ... ... Gain/(Loss) from Other Liabilities -689 312 229 -83 -26.7 0 Other Net Gains/(Losses) 285 -29 30 59 -204.6 307 Share of Earnings from Associates (excluding Dividends) 118 -22 -22 ... ... ... Dividends from Asset Sale Proceeds ... 175 143 -31 -18.0 ... Deferred Income Tax from Other Sectors -458 145 82 -63 -43.3 -3 Other -42 -35 -35 -0 0.9 -2 Discontinuing Operations - Other Economic Flows ... ... ... ... ... ... Other Economic Flows - Included in the Operating Result -785 547 428 -119 -21.8 303
Operating Result 462 264 700 436 165.3 -126
Other Economic Flows - Other Comprehensive Income
Items that will not be Reclassified to the Operating Result Superannuation Actuarial Gain/(Loss) -83 6,952 6,993 41 0.6 2,300 Deferred Tax Direct to Equity ... ... ... ... ... ... Revaluations 3,790 3,462 3,701 239 6.9 -4 Share of Earnings from Associates from Revaluations -401 ... ... ... ... ...
Items that may be Reclassified Subsequently to the Operating Result Net Gain/(Loss) on Equity Investments in Other Sectors 3,978 6,769 7,241 472 7.0 2,852 Net Gain/(Loss) on Equity Investments in Other Sectors Discontinued 148 ... ... ... ... ... Net Gain/(Loss) on Financial Instruments at Fair Value -3 ... ... ... ... -1 Other -21 -1,200 -1,269 -68 5.7 -601 Other Economic Flows - Other Comprehensive Income 7,408 15,984 16,666 683 4.3 4,547
Comprehensive Result - Total Change in Net Worth 7,870 16,247 17,366 1,119 6.9 4,420
Key Fiscal Aggregates
Comprehensive Result - Total Change in Net Worth 7,870 16,247 17,366 1,119 6.9 4,420 less: Net Other Economic Flows -6,623 -16,530 -17,094 -564 3.4 -4,849
Equals: Budget Result - Net Operating Balance 1,247 -283 272 555 -196.3 -429
Less: Net Acquisition of Non-Financial Assets Purchases of Non-Financial Assets 8,432 10,091 10,091 0 0.0 2,680 Sales of Non-Financial Assets -517 -482 -476 6 -1.3 -89 Less: Depreciation -3,954 -4,242 -4,220 23 -0.5 -1,361 Plus : Change in Inventories -25 4 5 1 25.6 -11 Plus : Other Movements in Non-Financial Assets
- Assets Acquired Using Finance Leases 114 113 113 ... ... 38 - Other -1,567 -2,049 -1,998 51 -2.5 -517
Equals: Total Net Acquisition of Non-Financial Assets 2,484 3,434 3,515 81 2.4 740
Equals: Net Lending/(Borrowing) [Fiscal Balance] -1,236 -3,717 -3,243 474 -12.8 -1,169
OTHER AGGREGATES
Capital Expenditure 8,546 10,203 10,203 0 0.0 2,718
2014-15 Half-Yearly Review Page 63

Table D.2: General Government Sector Balance Sheet
June 2014 Actual Budget Revised
$m $m $m
June 2015
ASSETS Financial Assets Cash and Cash Equivalent Assets 9,966 8,546 8,390 Receivables 6,833 6,791 7,261 Tax Equivalents Receivable 206 81 71 Investments, Loans and Placements
Financial Assets at Fair Value 9,562 10,399 10,536 Other Financial Assets 4,607 537 3,639
Advances Paid 944 1,026 1,126 Deferred Tax Equivalents Assets 4,695 5,410 4,719
Investments in Other Public Sector Entities 84,695 93,723 91,048 Investments in Other Public Sector - Held for Sale ... ... ... Investments in Associates 4,039 4,257 4,019 Other Equity Investments 10 10 10
Total Financial Assets 125,557 130,781 130,818 Non-Financial Assets Inventories 248 252 253 Forestry Stock and Other Biological Assets 7 7 7 Assets Classified as Held for Sale 106 146 114 Investment Properties 137 125 137 Property, Plant and Equipment Land and Buildings 64,100 64,392 65,756 Plant and Equipment 9,533 9,806 9,602
74,239 78,762 78,821 Intangibles 2,356 2,736 2,690
2,061 2,548 2,500 Total Non-Financial Assets 152,790 158,775 159,881
Equity
Infrastructure Systems
Other Non-Financial Assets
TOTAL ASSETS 278,346 289,555 290,699
LIABILITIES Deposits Held 117 106 110 Payables 5,553 4,708 5,147 Tax Equivalent Payables 40 109 33 Liabilities Directly Associated with Assets Held for Sale ... ... ... Borrowings and Derivatives at Fair Value 13 8 11 Borrowings at Amortised Cost 31,028 31,993 31,954 Advances Received 791 765 924 Employee Provisions 14,435 13,542 14,358 Superannuation Provision 48,262 31,169 42,387 Deferred Tax Equivalent Provision 488 621 504 Other Provisions 7,934 7,844 8,104 Other Liabilities 1,918 1,661 1,948 TOTAL LIABILITIES 110,578 92,525 105,480
NET ASSETS 167,768 197,030 185,219
NET WORTH Accumulated Funds 20,085 37,006 27,679 Reserves 147,683 160,024 157,540
Variance Variance $m %
-156 -1.8 470 6.9 -10 -12.3
137 1.3 3,102 577.5
100 9.7 -692 -12.8
-2,675 -2.9 ... ...
-238 -5.6 -0 -3.4
37 0.0
1 0.3 0 5.5
-32 -21.8 11 9.1
1,364 2.1 -204 -2.1
60 0.1 -45 -1.7 -48 -1.9
1,107 0.7
1,144 0.4
3 3.3 440 9.3 -76 -69.6
... ... 3 36.5
-39 -0.1 158 20.7 817 6.0
11,218 36.0 -117 -18.8 261 3.3 287 17.3
12,955 14.0
-11,811 -6.0
-9,327 -25.2 -2,484 -1.6
October 2014 Actual
$m
8,406 6,179
125
10,062 5,551
863 4,647
86,841...
4,04010
126,725
235 10 99
137
64,0319,568
74,885 2,454 2,238
153,655
280,380
122 4,518
40 ...
13 31,199
854 14,471 46,316
487 7,901 2,247
108,168
172,213
22,461 149,752
TOTAL NET WORTH 167,768 197,030 185,219 -11,811 -6.0 172,213
OTHER KEY AGGREGATES Net Debt 6,869 12,364 9,308 -3,057 -24.7 7,305 Net Financial Liabilities(a) 69,716 55,467 65,710 10,243 18.5 68,284
(a) Excludes PTE/PFE equity.
Page 64 2014-15 Half-Yearly Review
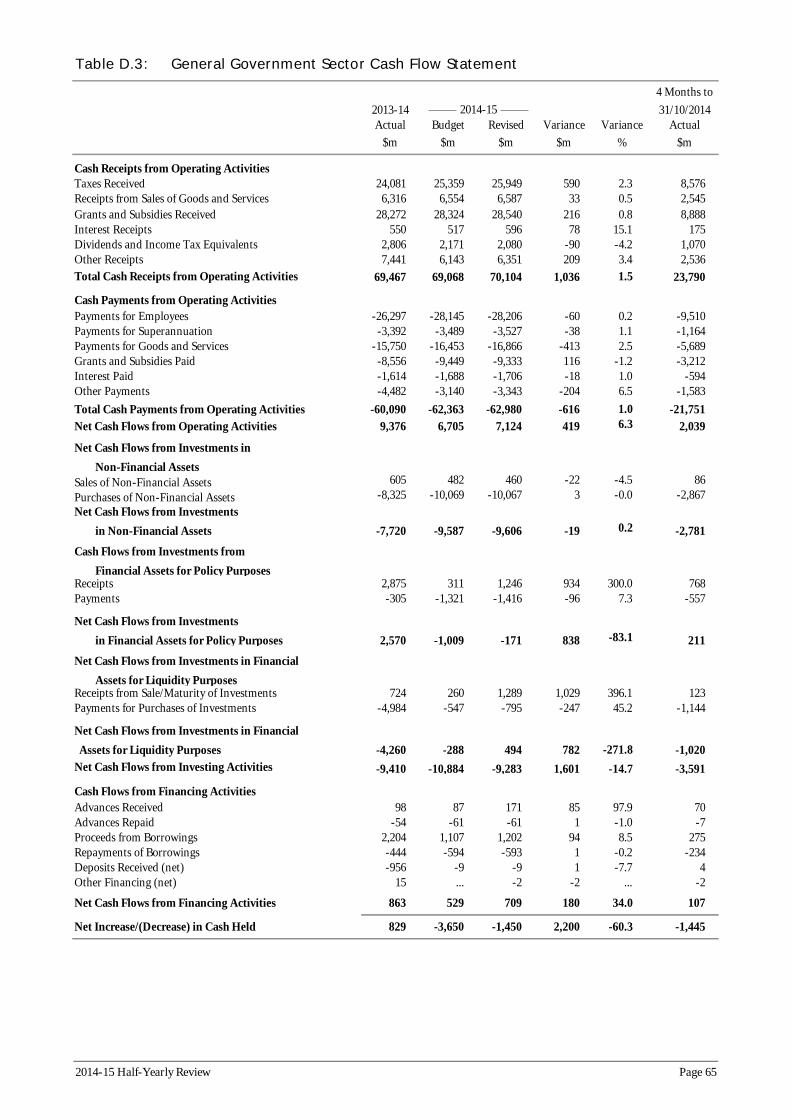
Table D.3: General Government Sector Cash Flow Statement
4 Months to 2013-14 2014-15 31/10/2014 Actual Budget Revised Variance Variance Actual
$m $m $m $m % $m
Cash Receipts from Operating Activities Taxes Received 24,081 25,359 25,949 590 2.3 8,576 Receipts from Sales of Goods and Services 6,316 6,554 6,587 33 0.5 2,545 Grants and Subsidies Received 28,272 28,324 28,540 216 0.8 8,888 Interest Receipts 550 517 596 78 15.1 175 Dividends and Income Tax Equivalents 2,806 2,171 2,080 -90 -4.2 1,070 Other Receipts 7,441 6,143 6,351 209 3.4 2,536 Total Cash Receipts from Operating Activities 69,467 69,068 70,104 1,036 1.5 23,790
Cash Payments from Operating Activities Payments for Employees -26,297 -28,145 -28,206 -60 0.2 -9,510 Payments for Superannuation -3,392 -3,489 -3,527 -38 1.1 -1,164 Payments for Goods and Services -15,750 -16,453 -16,866 -413 2.5 -5,689 Grants and Subsidies Paid -8,556 -9,449 -9,333 116 -1.2 -3,212 Interest Paid -1,614 -1,688 -1,706 -18 1.0 -594 Other Payments -4,482 -3,140 -3,343 -204 6.5 -1,583 Total Cash Payments from Operating Activities -60,090 -62,363 -62,980 -616 1.0 -21,751 Net Cash Flows from Operating Activities 9,376 6,705 7,124 419 6.3 2,039
Net Cash Flows from Investments in Non-Financial Assets
Sales of Non-Financial Assets 605 482 460 -22 -4.5 86 Purchases of Non-Financial Assets -8,325 -10,069 -10,067 3 -0.0 -2,867 Net Cash Flows from Investments
in Non-Financial Assets -7,720 -9,587 -9,606 -19 0.2 -2,781
Cash Flows from Investments from Financial Assets for Policy Purposes
Receipts 2,875 311 1,246 934 300.0 768 Payments -305 -1,321 -1,416 -96 7.3 -557
Net Cash Flows from Investments in Financial Assets for Policy Purposes 2,570 -1,009 -171 838 -83.1 211
Net Cash Flows from Investments in Financial Assets for Liquidity Purposes
Receipts from Sale/Maturity of Investments 724 260 1,289 1,029 396.1 123 Payments for Purchases of Investments -4,984 -547 -795 -247 45.2 -1,144
Net Cash Flows from Investments in Financial Assets for Liquidity Purposes -4,260 -288 494 782 -271.8 -1,020 Net Cash Flows from Investing Activities -9,410 -10,884 -9,283 1,601 -14.7 -3,591
Cash Flows from Financing Activities Advances Received 98 87 171 85 97.9 70 Advances Repaid -54 -61 -61 1 -1.0 -7 Proceeds from Borrowings 2,204 1,107 1,202 94 8.5 275 Repayments of Borrowings -444 -594 -593 1 -0.2 -234 Deposits Received (net) -956 -9 -9 1 -7.7 4 Other Financing (net) 15 ... -2 -2 ... -2
Net Cash Flows from Financing Activities 863 529 709 180 34.0 107
Net Increase/(Decrease) in Cash Held 829 -3,650 -1,450 2,200 -60.3 -1,445
2014-15 Half-Yearly Review Page 65

Table D.3: General Government Sector Cash Flow Statement (cont)
4 Months to 2013-14 2014-15 31/10/2014 Actual Budget Revised Variance Variance Actual
$m $m $m $m % $m
Derivation of Cash Result Net Cash Flows from Operating Activities 9,376 6,705 7,124 419 6.3 2,039 Net Cash Flows from Investments in Non-Financial Assets -7,720 -9,587 -9,606 -19 0.2 -2,781
Cash Surplus/(Deficit) 1,656 -2,882 -2,482 400 -13.9 -742
Derivation of ABS GFS General Government Sector Cash Surplus/(Deficit) Cash Surplus/(Deficit) 1,656 -2,882 -2,482 400 -13.9 -742 Assets Acquired under Finance Leases -114 -113 -113 ... ... -38 Other Financing Arrangements(a) -195 -21 -9 13 -58.6 190
ABS GFS Surplus/(Deficit) 1,347 -3,016 -2,604 413 -13.7 -590
(a) Comprises movements in payables and receivables of a capital nature.
Page 66 2014-15 Half-Yearly Review


![RUNO Half Yearly Reporting TEMPLATE 4.3 [LIBERIA] PROJECT ...moj.gov.lr/data/uploads/downloads/half-year... · RUNO Half Yearly Reporting TEMPLATE 4.3 [LIBERIA] PROJECT HALF YEARLY](https://img.pdfslide.net/doc/110x75/5fb2e6765197404e462e00b5/runo-half-yearly-reporting-template-43-liberia-project-mojgovlrdatauploadsdownloadshalf-year.jpg)