Embed Size (px)
Citation preview

Private and Confidential
NPA Financial Benchmarking Service for PACE
2014 Annual Financial Ratios Report
Prepared for:
Alexian Brothers - Chattanooga

NPA Financial Benchmarking Service for PACE
Page 1 of 3 Private and Confidential
2014 Annual Financial Ratios Report
Table of Contents
I. Using the Report A. Description of the Data Set and Limitations B. Report and Charts
I. Using the Report
A. Description of the Data Set and Limitations
The Data Set: The financial ratios presented in the following tables and charts were developed using audited financial statements provided to the National PACE Association by its member PACE organizations. The submitted data was evaluated for internal consistency to assure that:
Line items from each organization’s financial statements were entered into an Access database. Line items entered into the database were summed by category (i.e. Assets) and they were checked against the
comparable information on the original statements to ensure consistency. For example, the database’s calculated “Total Assets” for an organization was compared to the financial statement’s “Total Assets” to ensure accuracy.
To calculate the financial ratios, each line item entered into the database from an organization’s financial statement was assigned a code corresponding to a standardized set of line items. These standardized codes were used to compile the organizations’ results in order to calculate the ratios consistently. Financial ratio results were compiled for all participating organizations. Median ratio results were also compiled separately for the group of organizations that are stand-alone (i.e. organizations

NPA Financial Benchmarking Service for PACE
Page 2 of 3 Private and Confidential
operating PACE organizations as their primary line of business, without affiliation with a parent organization) and those that are affiliated (i.e. those that have significant other lines of business as part of the same organization that operates the PACE organization and/or those that are part of a larger parent organization). The results are reported by calendar year, based on the financial statement’s end date. If the reporting period covered by a financial statement had an end date in a given calendar year, it was assigned for reporting purposes to that calendar year. Time adjustments were not made for different end dates within the same calendar year. Limitations: The ratios reported are based on data entry and standardization of information in organizations’ financial statements. As data sources, these financial statements vary in format. Their description and categorization of specific items reflects the judgment of the accounting firms that prepared the statements. With this in mind, the ratios should be considered in light of the possible variation inherent in the sources of information used. Also, a comparison of an organization’s results to the aggregated results should consider the full range of factors that can affect financial performance such as labor conditions, participant acuity or specific local needs. B. Report and Charts Section II presents a report and charts with your organization’s results and the aggregated results of the other participating organizations. In the report, your organization’s reported values are presented in the first column to the right of the ratio description. The additional reported values on each report present a range of statistics for each ratio category to help you compare your reported ratio values to other PACE organizations.
The statistics presented on the reports and charts include:
Minimum o The lowest value reported across all the organizations
1st Quartile o 25% of the organizations reported a result that is below the 1st quartile value while 75% reported a result that is above

NPA Financial Benchmarking Service for PACE
Page 3 of 3 Private and Confidential
Median o 50% of the organizations reported a result that is below the median value and 50% reported a result that is above the
median value. The median is a measure of the central value, or typical result, reflected across all organizations. 3rd Quartile
o 75% of the organizations reported a result that is below the 3rd quartile value, while 25% reported a result above Maximum
o The highest value reported across all organizations Mean
o The average across all organizations, including reported values of zero Standard Deviation
o It measures the distribution of reported results below and above the mean. Assuming a normal distribution of results, you would expect 66% of all results to be within plus or minus one standard deviation from the mean. For example, the mean for All Revenue is $5,401 and the standard deviation is $906. We would expect 66% of all organizations to have an All Revenue result between $4,495 ($5,401 - $906) and $6,307 ($5,401 + $906). You would expect 99% of all results to be within plus or minus two standard deviations from the mean.
Observations o The number of individual organizations that contributed data that were used in the calculation of the statistical values
reported for the specific measure item. The charts after the summary table display your results and the median results for each financial ratio. These charts also indicate how the ratio was calculated and provide a description of the ratio, notes on its definition, and comments on its interpretation. The charts’ bar graphs represent the medians for all organizations, the stand-alone organizations’ group, and the affiliated organizations’ group. The charts’ lines with plot points indicate your organization’s results for the current and prior years. If a chart has no value or plot point for your organization in a given year this indicates that no information for your organization is available for that year.

PACE Financial Ratios Report
Alexian Brothers Community Services-Chattanooga
Company Code ALSE
# Org.s
2014
Chart # Ratio Description Results Min Q1 Med Q3 Max Mean SD
Audit Year
1 Operating Margin 24.81% -3324.80% -11.80% 0.71% 6.11% 100.00% -82.29% 495.61% 44
2 EBITDA Margin -165.45% -3290.82% -10.09% 2.16% 8.65% 100.00% -81.59% 490.90% 44
3 Excess Margin -170.24% -3324.80% -11.80% 0.71% 6.11% 100.00% -85.63% 495.64% 44
4 Return on Total Assets -45.27% -473.17% -32.84% 1.81% 10.98% 223.46% -15.20% 89.21% 44
5 Days Cash on Hand (4) -4.41 7.96 28.52 64.12 9999.99 284.95 1483.92 44
6 Current Ratio 288.72% -1180.46% 54.73% 142.87% 247.65% 1486.17% 173.09% 321.03% 44
7 Quick Ratio 276.06% 3.20% 40.10% 92.91% 157.30% 574.22% 122.50% 116.62% 44
8 Days A - R 78.29 0.00 4.33 17.16 29.53 306.03 25.77 46.63 43
9 Debt Service Coverage -1175.24 -4.36 0.79 12.88 9516.01 322.65 1784.74 28
10 Liabilities to Equity 5.00% -283.00% -110.00% 50.00% 123.00% 461.00% 27.70% 162.35% 43
11 DS %Total Revenue 0.00% -30.00% 0.00% 0.00% 33.50% 667.00% 53.74% 134.72% 43
12 Debt to Capitalization 0.00% 0.00% 0.00% 0.36% 2.01% 14.78% 1.86% 3.09% 44
13 Operating Expense % Pt Revenue 90.00% 0.00% 96.00% 103.00% 116.00% 3425.00% 188.21% 500.83% 43
14 Asset Turnover 26.59% -3.26% 115.89% 173.04% 392.03% 1338.75% 289.21% 284.87% 44
Thursday, October 08, 2015 Intended for the sole use and benefit of the orginization identified above

Chart 1
2012 2013 2014Median All 2.2% 2.2% 0.7%Median - 0-400. -0.4% 1.3% -3.9%Median - 400+ 3.6% 3.5% 5.3%Your Results 11.7% 23.4% 24.8%
-10.0%
-5.0%
0.0%
5.0%
10.0%
15.0%
20.0%
25.0%
30.0%
PACE Financial RatiosOperating Margin
Income (or Loss) from OperationsTotal Operating Revenue
The Operating Margin indicates the percent of operating revenues available after operating expenses are met.
Notes: * Unrealized gains on securities are excluded. * Interest earnings are classified as operating revenues, while contributions are classified as non-operating revenues. * "Total Operating Revenues" includes contractual allowances and charitable deductions.* Many Nonprofit providers have argued that low or negative margins are to be expected, and are not a problem if contributions make up the difference* However, a positive margin is vital to accumulating reserves needed to weather economic downturns and replenish capital assets such as facilities
Uses:* It is a common measure of general business health* Measures surplus or loss from an organization's core business* Lenders may feel that a low or negative margin could signal long term problems in an organization's operations/strategy* Useful to track your margin relative to other PACE Organizations

Chart 2
2012 2013 2014Median All 3.5% 6.7% 2.2%Median - 0-400 3.9% 9.0% -4.8%Median - 400+ 3.5% 5.3% 7.7%Your Results 13.6% 24.8% -165.5%
-200.0%
-150.0%
-100.0%
-50.0%
0.0%
50.0%
PACE Financial RatiosEBITDA Margin
Net Income + Interest Expense + Depreciation Expense + Amortization
Total Revenues
The EBITDA Margin indicates the percentage of cash revenues remains after cash expenses are paid.
Notes: *Non cash expenses and revenues are
excluded from this ratio. *It is a less more rigorous test of an
organization's core business strength than the Operating or Total Excess Margin ratios
*Measures whether operations has generated surplus cash or required cash from cover expenses
Uses: *An EBITDA margin of less than 0% is a
strong indicator of financial distress *A positive EBITDA margin is required to
cover principal and interest payments if the provider is considering the use of debt to finance facilities

Chart 3
2012 2013 2014Median All 2.2% 3.2% 0.7%Median - 0-400 1.5% 1.5% -5.6%Median - 400+ 2.3% 4.2% 6.1%Your Results 12.2% 23.4% -170.2%
-200.0%
-150.0%
-100.0%
-50.0%
0.0%
50.0%
PACE Financial RatiosTotal Excess Margin
Total Excess of Revenues over ExpensesTotal Revenue and Net Nonoperating
Gains/Losses
The Total Excess Margin indicates total capacity to generate excess resources.
Uses:Even though the Total Excess Margin includes non-cash items, in general a positive margin is an important indicator of a provider's long term ability to provide adequate reserves, to maintain and replace capital resources, and to provide adequate contingency funds for unforeseen financial needs.

Chart 4
2012 2013 2014Median All 3.1% 4.6% 1.8%Median - 0-400 2.3% 2.5% -7.5%Median - 400+ 4.2% 6.1% 8.7%Your Results 3.3% 12.8% -45.3%
-50.0%
-40.0%
-30.0%
-20.0%
-10.0%
0.0%
10.0%
20.0%
PACE Financial RatiosReturn on Total Assets
Net IncomeTotal Assets
Note:"Net Income" is the same as the
Total Excess of Revenues over Expenses
Uses: *A common measure of general
business health
*Measures how efficiently an organization uses its assets
*Results may differ based on developmental stage of the organization and the nature of its sponsorship. Mature organizations have more physical assets but should also have higher net income. Developmental stage organizations would have different characteristics.

Chart 5
2012 2013 2014Median All 84.16 70.00 28.52Median - 0-400 82.97 27.00 23.96Median - 400+ 84.30 102.50 47.58Your Results 1414.34 829 -4
-200.00
0.00
200.00
400.00
600.00
800.00
1000.00
1200.00
1400.00
1600.00
PACE Financial RatiosDays Cash on Hand - Unrestricted
Unrestricted Current Cash and Investments + Unrestricted non current Cash and Investments
(Operating Expenses - Depreciation -Amortization - Bad Debt Expense) / 365
Measures an organization's ability to withstand fluctuations in operating results
Note: *The asset balances used in this
calculation include Board-restricted funds, but not Trustee-held funds, restricted foundation and endowment funds, and funds restricted by the state
*Daily operating expenses include interest costs
Uses: *Measures the period of time the
organization can operate without any additional revenues

Chart 6
2012 2013 2014Median All 135.11% 123.5% 142.9%Median - 0-400 119.6% 116.3% 98.7%Median - 400+ 169.3% 124.0% 256.2%Your Results 32% 17.83% 288.72%
0.00%
50.00%
100.00%
150.00%
200.00%
250.00%
300.00%
350.00%
PACE Financial RatiosCurrent Ratio
Current AssetsCurrent Liabilities
This is a measure of an organization's liquidity, that specifically focuses on the organization's ability to meet current liabilities without drawing on long-term investments.
Notes: *Some components of current
assets are not easily converted into cash such as prepaid insurance.
Uses: *Helps creditors assess the relative
strength of an organization to make payments on its obligations

Chart 7
2012 2013 2014Median All 120.65% 105.6% 92.9%Median - 0-400 98.3% 101.9% 70.3%Median - 400+ 144.5% 114.2% 139.0%Your Results 17% 4.88% 276.06%
0.00%
50.00%
100.00%
150.00%
200.00%
250.00%
300.00%
PACE Financial RatiosQuick Ratio
A more rigorous test of liquidity than the current ratio
Notes:* Current assets such as "prepaid insurance", which are not easily converted into cash, are excluded from the quick ratio.
Uses:* Helps creditors assess the relative strength of an organization to make payments on its short term obligations which are generally due within 12 months
Unrestricted Current Cash and Investments + short held bond funds (but not -term receivables + trustee
current portion of debt service reserve(Current Payables

Chart 8
2012 2013 2014Median All 10.16 18.15 17.16Median - 0-400 9.07 14.31 13.34Median - 400+ 11.08 18.15 23.77Your Results 7.36 -0.03 78.29
-10.00
0.00
10.00
20.00
30.00
40.00
50.00
60.00
70.00
80.00
90.00
PACE Financial RatiosDays in Accounts Receivables Net Patient Receivables
(Net Patient Revenue / 365)
Comment: *A high number of days in
accounts receivable would indicate problems in collections from payor sources.
*PACE providers should typically have low days receivable due to capitated revenue streams
Uses: *A dramatic shift in this
ratio is cause for further investigation.
*Large increase in days receivable indicate internal or external distress in the revenue cycle.

Chart 9
2012 2013 2014Median All 7.53 3.15 0.79Median - 0-400 0.00 1.10 -2.80Median - 400+ 12.21 9.96 12.47Your Results 0.00 0.00 0.00
-4.00
-2.00
0.00
2.00
4.00
6.00
8.00
10.00
12.00
14.00
PACE Financial RatiosDebt Service Coverage Ratio
Total Excess of Revenues over Expenses + Interest Expense,
Depreciation & Amortization ExpenseCurrent Annual Debt Service
The Debt Service Coverage Ratio is used when looking at providers using or considering long term debt (outstanding more than 12 months)
DSCR reflects a provider's ability to fund annual debt service with cash flow from annual net cash revenues
Uses:* One of two key ratios in evaluating ability to support existing debt and to take on new debt* Non-cash revenues and expenses such as Amortization and Depreciation expense are excluded because the purpose of this ratio is to focus on operating cash flows
* A DSCR of at least 1.50x is needed to assure adequate capacity to build reserves after paying debt service

Chart 10
2012 2013 2014Median All 39% 65.0% 50.0%Median - 0-400 24.0% 79.0% 13.5%Median - 400+ 52.0% 63.0% 81.0%Your Results 5.00% 4.00% 5.00%
0%
10%
20%
30%
40%
50%
60%
70%
80%
90%
PACE Financial RatiosLiabilities to Equity Ratio
Total LiabilitiesUnrestricted Fund Balance
Measures the extent to which a provider relies on long term and short term obligations versus retained earnings and invested or donated capital
Comment: *Liabilities includes current liabilities
such as payables and long term liabilities such as debt
*Variation in the ratio may depend on the developmental stage of the organization, its affiliation status (standalone or affiliated), and relative
organizational scale (large or small.( *Larger providers with long track
records of success, or providers with strong affiliations have a better access to long term debt.
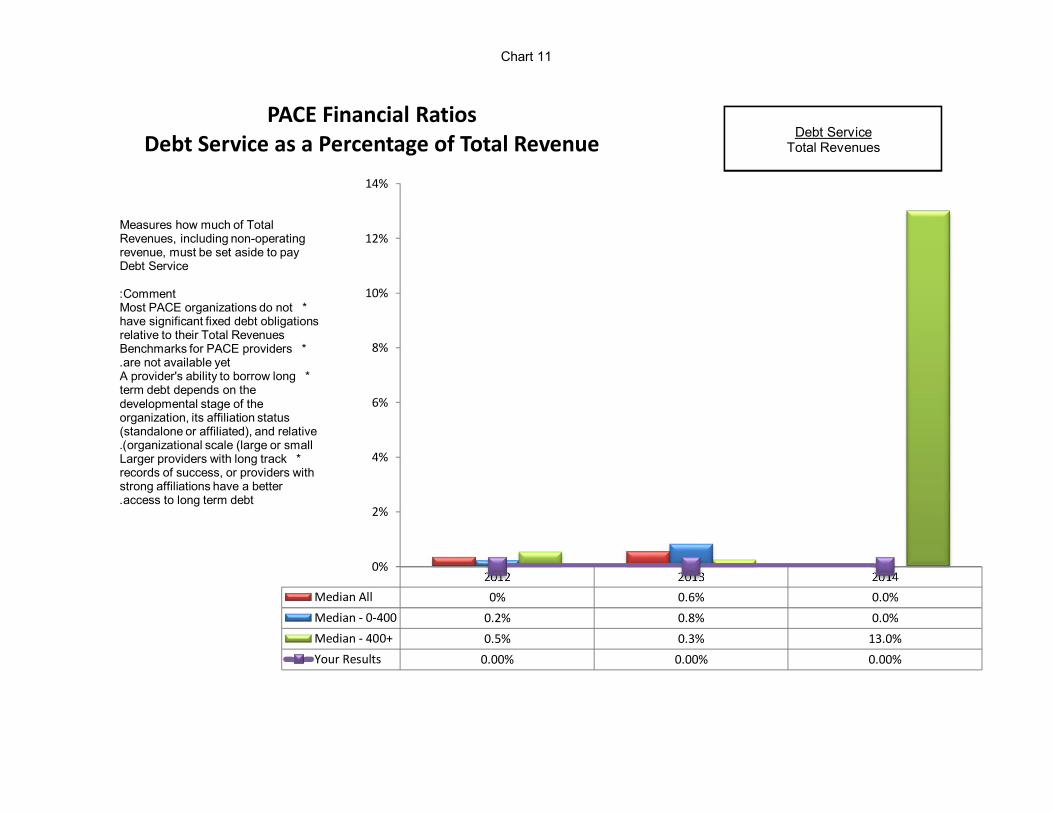
Chart 11
2012 2013 2014Median All 0% 0.6% 0.0%Median - 0-400 0.2% 0.8% 0.0%Median - 400+ 0.5% 0.3% 13.0%Your Results 0.00% 0.00% 0.00%
0%
2%
4%
6%
8%
10%
12%
14%
PACE Financial RatiosDebt Service as a Percentage of Total Revenue Debt Service
Total Revenues
Measures how much of Total Revenues, including non-operating revenue, must be set aside to pay Debt Service
Comment: *Most PACE organizations do not
have significant fixed debt obligations relative to their Total Revenues
*Benchmarks for PACE providers are not available yet.
*A provider's ability to borrow long term debt depends on the developmental stage of the organization, its affiliation status (standalone or affiliated), and relative
organizational scale (large or small.( *Larger providers with long track
records of success, or providers with strong affiliations have a better access to long term debt .

Chart 12
2012 2013 2014Median All 1% 18.0% 0.4%Median - 0-400 0.0% 31.0% 0.3%Median - 400+ 10.0% 12.5% 0.4%Your Results 0.00% 0.00% 0.00%
0%
5%
10%
15%
20%
25%
30%
35%
PACE Financial RatiosDebt to Capitalization Ratio
The Debt to Capitalization ratio measures what portion of Permanent Capital is financed by debt as opposed to equity.
Note:Permanent Capital is made up of long term debt and shareholder's equity.
Comment:
* A provider's ability to borrow long term debt depends on the developmental stage of the organization, its affiliation status (standalone or affiliated), and relative organizational scale (large or small).* Larger providers with long track records of success, or providers with strong affiliations have a better access to long term debt.

Chart 13
2012 2013 2014Median All 107% 102.5% 103.0%Median - 0-400 106.5% 103.5% 106.0%Median - 400+ 103.0% 101.0% 96.0%Your Results 89.0% 86.0% 90.0%
0%
20%
40%
60%
80%
100%
120%
PACE Financial RatiosOperating Expenses as a Percentage of Patient Revenues
Operating ExpensesNet Patient Revenues
This measure is comparable to the "Medical Loss Ratio" used by many HMO's as an indicator of financial and operational efficiency/strength.
Comment:Compared to other health care plans, PACE programs have a high ratio of operating expenses to net patient revenues, suggesting that they expend almost all their operating resources on providing patient care.

Chart 14
2012 2013 2014Median All 151% 148.0% 173.0%Median - 0-400 136.0% 108.4% 223.5%Median - 400+ 208.2% 175.3% 151.4%Your Results 27.4% 54.6% 26.6%
0%
50%
100%
150%
200%
250%
PACE Financial RatiosAsset Turnover Ratio
Total RevenueTotal Assets
The asset turnover ratio is a measure of how efficiently and effectively an organization uses its assets to generate revenues.
Comment:* The higher the asset turnover ratio, the more efficiently an organization's assets have been used. * A change in the asset turnover ratio could indicate a decrease in revenues - OR - an increase in the organizations assets (which may be a positive change)* Results may differ based on developmental stage of the organization and the nature of its sponsorship. Mature organizations have more physical assets but should also have higher net income. Developmental stage organizations would have different characteristics.