Embed Size (px)
Citation preview
2014 ANNUAL HOUSING MARKET
SURVEYDecember 4, 2014Oscar Wei, Senior Research Analyst
METHODOLOGY
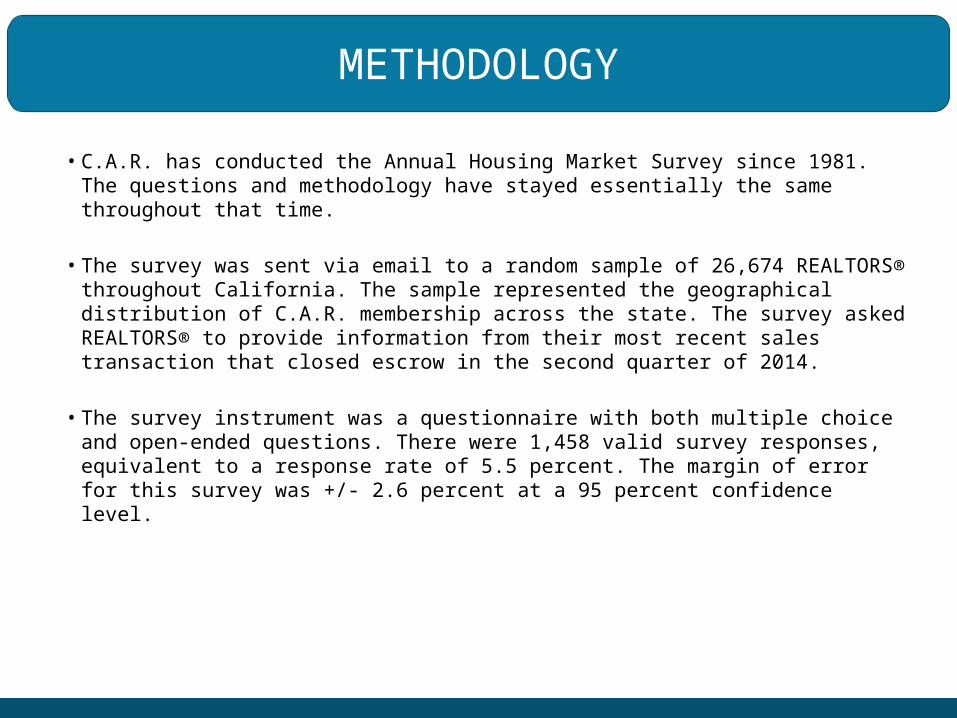
• C.A.R. has conducted the Annual Housing Market Survey since 1981. The questions and methodology have stayed essentially the same throughout that time.
• The survey was sent via email to a random sample of 26,674 REALTORS® throughout California. The sample represented the geographical distribution of C.A.R. membership across the state. The survey asked REALTORS® to provide information from their most recent sales transaction that closed escrow in the second quarter of 2014.
• The survey instrument was a questionnaire with both multiple choice and
open-ended questions. There were 1,458 valid survey responses, equivalent to a response rate of 5.5 percent. The margin of error for this survey was +/- 2.6 percent at a 95 percent confidence level.

TODAY’S MARKET
• Clearly well on the road to recovering
• Volume – A bit down, still reliant on investment sales
• Prices up sharply, but increases slowing in most markets
• Inventory remains tight
• Pent-up/unrealized demand not yet translating into sales
• Affordability challenges emerging once again…
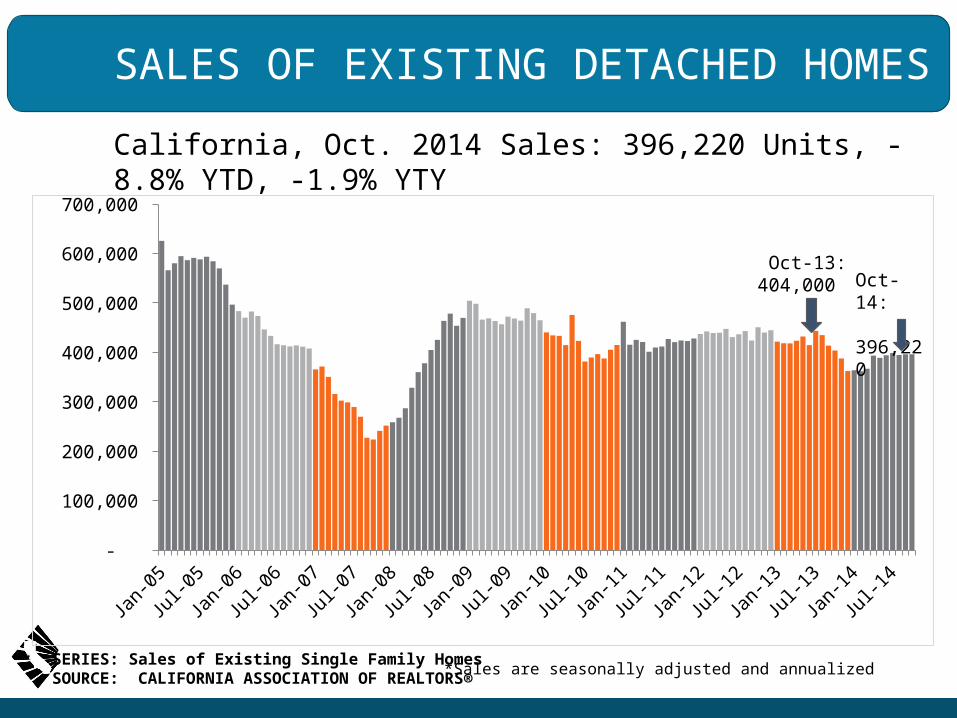
SALES OF EXISTING DETACHED HOMES
California, Oct. 2014 Sales: 396,220 Units, -8.8% YTD, -1.9% YTY
Jan-
05
Jul-0
5
Jan-
06
Jul-0
6
Jan-
07
Jul-0
7
Jan-
08
Jul-0
8
Jan-
09
Jul-0
9
Jan-
10
Jul-1
0
Jan-
11
Jul-1
1
Jan-
12
Jul-1
2
Jan-
13
Jul-1
3
Jan-
14
Jul-1
4 -
100,000
200,000
300,000
400,000
500,000
600,000
700,000
*Sales are seasonally adjusted and annualized SERIES: Sales of Existing Single Family HomesSOURCE: CALIFORNIA ASSOCIATION OF REALTORS®
Oct-14: 396,220
Oct-13:404,000

DEMAND FOR INVESTMENT & SECOND/ VACATION HOMES DROPS TO THE LOWEST SINCE 2010
0%
5%
10%
15%
20%
25%
30%
Investment/Rental PropertyVacation/Second Home
5%
15%SERIES: 2014 Housing Market SurveySOURCE: CALIFORNIA ASSOCIATION OF REALTORS®
Long Run Average: 12 %
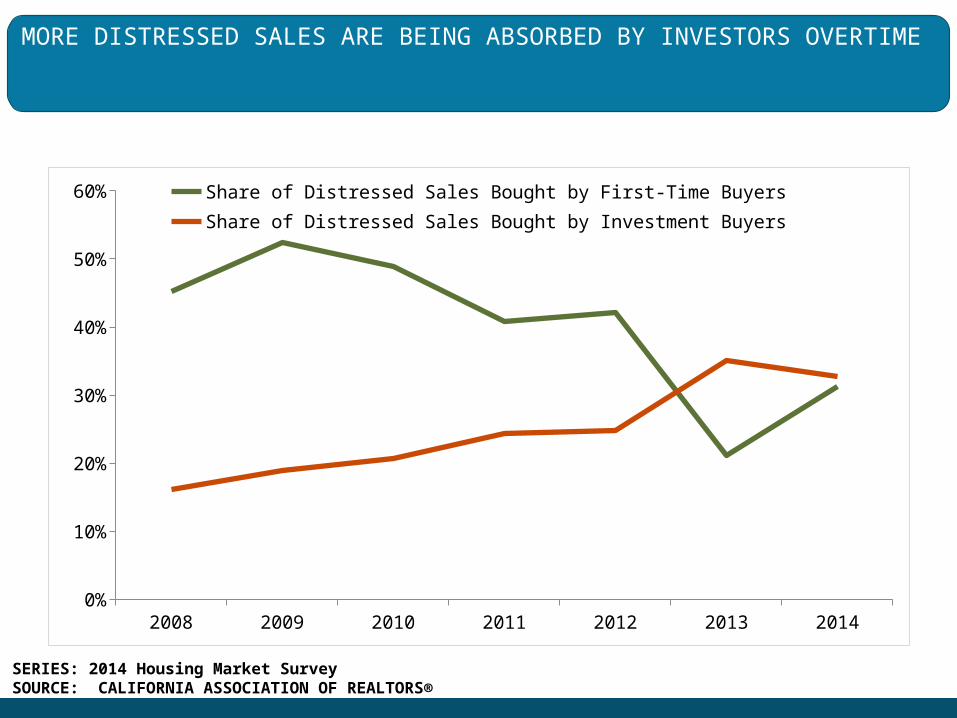
MORE DISTRESSED SALES ARE BEING ABSORBED BY INVESTORS OVERTIME
2008 2009 2010 2011 2012 2013 20140%
10%
20%
30%
40%
50%
60% Share of Distressed Sales Bought by First-Time BuyersShare of Distressed Sales Bought by Investment Buyers
SERIES: 2014 Housing Market SurveySOURCE: CALIFORNIA ASSOCIATION OF REALTORS®

EQUITY SALES VS. REO VS. SHORT SALES (2014)
Equity Sales
REO Sales
Short Sales
Share of Total Sales 93.5% 2.5% 3.6%
Median Home Price $479,000 $280,000 $277,500
Square Footage 1,700 1,500 1,400
Price / SF $294 $143 $183
Sales-to-List Price Ratio 100.0% 99.1% 100.0%
% of Sales With Multiple Offers 51.4% 82.6% 65.0%
Avg. Number of Offers 4.2 6.5 4.6
% of All Cash Sales 21.7% 21.7% 30.8%
Days on MLS 15 20 30
Days in Escrow 30 32 52
SERIES: 2014 Housing Market SurveySOURCE: CALIFORNIA ASSOCIATION OF REALTORS®

EQUITY SALES (2011 - 2014)
2011 2012 2013 2014
Share of Total Sales 58.7% 64.7% 80.8% 93.5%
Median Home Price $431,000 $448,000 $456,635 $479,000
Square Footage 1,783 1,750 1,678 1,700
Price / SF $250 $243 $270 $294
Sales-to-List Price Ratio 95.9% 97.3% 100.0% 100.0%% of Sales With Multiple Offers 35.2% 50.9% 69.0% 51.4%
Avg. Number of Offers 3.0 4.0 5.2 4.2
% of All Cash Sales 25.5% 27.3% 25.2 21.7%
Days on MLS 67 32 10 15
Days in Escrow 35 35 30 30
SERIES: 2014 Housing Market SurveySOURCE: CALIFORNIA ASSOCIATION OF REALTORS®
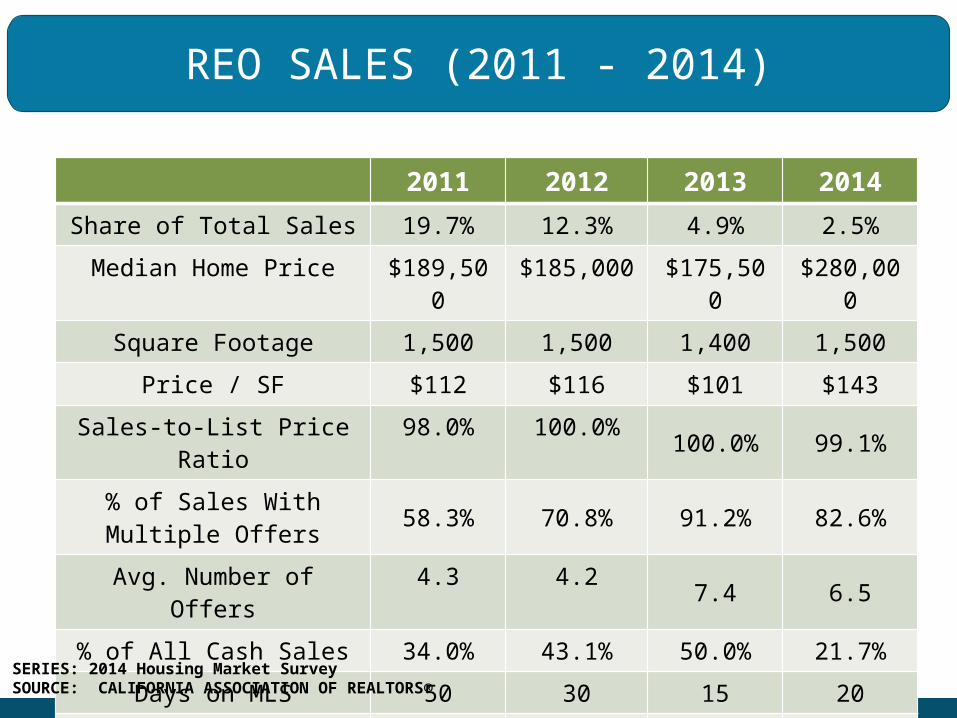
REO SALES (2011 - 2014)
2011 2012 2013 2014
Share of Total Sales 19.7% 12.3% 4.9% 2.5%
Median Home Price $189,500
$185,000 $175,500 $280,000
Square Footage 1,500 1,500 1,400 1,500
Price / SF $112 $116 $101 $143
Sales-to-List Price Ratio 98.0% 100.0% 100.0% 99.1%
% of Sales With Multiple Offers 58.3% 70.8% 91.2% 82.6%
Avg. Number of Offers 4.3 4.2 7.4 6.5
% of All Cash Sales 34.0% 43.1% 50.0% 21.7%
Days on MLS 50 30 15 20
Days in Escrow 35 45 35 32
SERIES: 2014 Housing Market SurveySOURCE: CALIFORNIA ASSOCIATION OF REALTORS®

SHORT SALES (2011 - 2014)
2011 2012 2013 2014
Share of Total Sales 20.2% 21.7% 14.0% 3.6%
Median Home Price $287,000
$235,000
$276,500 $277,500
Square Footage 1,600 1,600 1,650 1,400
Price / SF $175 $154 $146 $183
Sales-to-List Price Ratio 95.9% 99.9% 103.0% 100.0%
% of Sales With Multiple Offers 57.5% 66.1% 75.7% 65.0%
Avg. Number of Offers 3.6 4.3 7.1 4.6
% of All Cash Sales 23.3% 26.7% 35.7% 30.8%
Days on MLS 141 90 14 30
Days in Escrow 45 50 60 52
SERIES: 2014 Housing Market SurveySOURCE: CALIFORNIA ASSOCIATION OF REALTORS®

MARKET COMPETITION COOLS DOWN AFTER PEAKING IN 2013
2005
2006
2007
2008
2009
2010
2011
2012
2013
2014
0%
10%
20%
30%
40%
50%
60%
70%
80%
0
1
2
3
4
5
6
772%
53%5.7
4.3
% with Multiple Offers
SERIES: 2014 Housing Market SurveySOURCE: CALIFORNIA ASSOCIATION OF REALTORS®
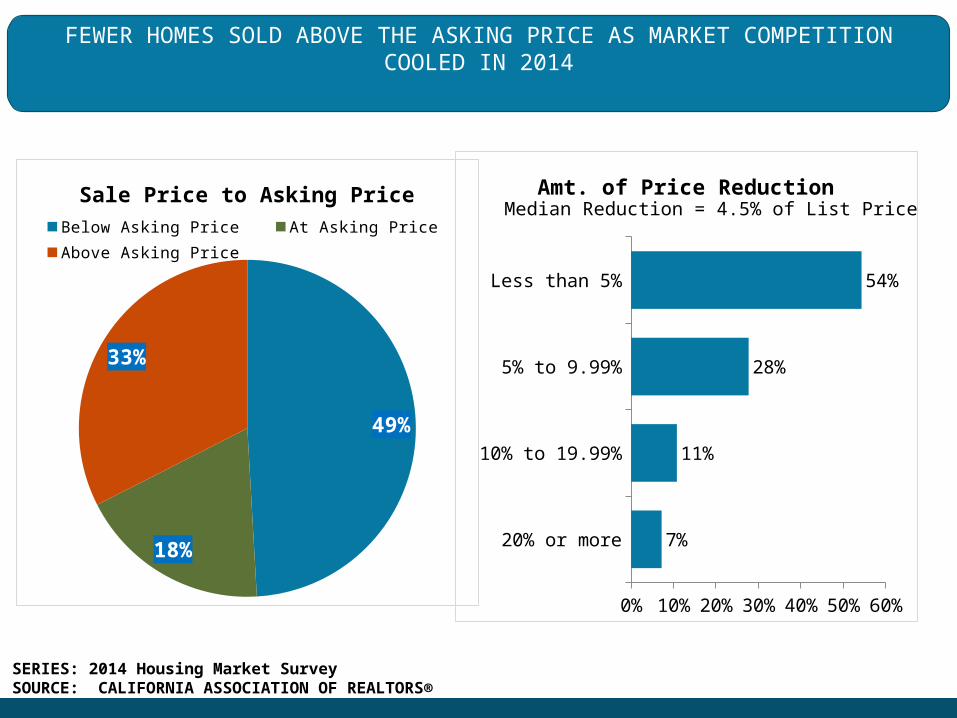
FEWER HOMES SOLD ABOVE THE ASKING PRICE AS MARKET COMPETITION COOLED IN 2014
20% or more
10% to 19.99%
5% to 9.99%
Less than 5%
0% 10%20%30%40%50%60%
7%
11%
28%
54%
Amt. of Price Reduction
49%
18%
33%
Sale Price to Asking Price
Below Asking Price At Asking Price
Above Asking Price
SERIES: 2014 Housing Market SurveySOURCE: CALIFORNIA ASSOCIATION OF REALTORS®
Median Reduction = 4.5% of List Price

2005
2006
2007
2008
2009
2010
2011
2012
2013
2014
0%
10%
20%
30%
40%
50%
60%
50%
33%
% of Sales above Asking Price
Long Run Average = 19%
FEWER HOMES SOLD ABOVE THE ASKING PRICE AS MARKET COMPETITION COOLED
IN 2014
2005
2006
2007
2008
2009
2010
2011
2012
2013
2014
0%
1%
2%
3%
4%
5%
6%
7%
8%
9%
10%
0
2
4
6
8
10
12
14
16
Med. Price Discount
Med. Weeks on MLS
0%, 2.1 weeks
Median Price Discount & Weeks on Market
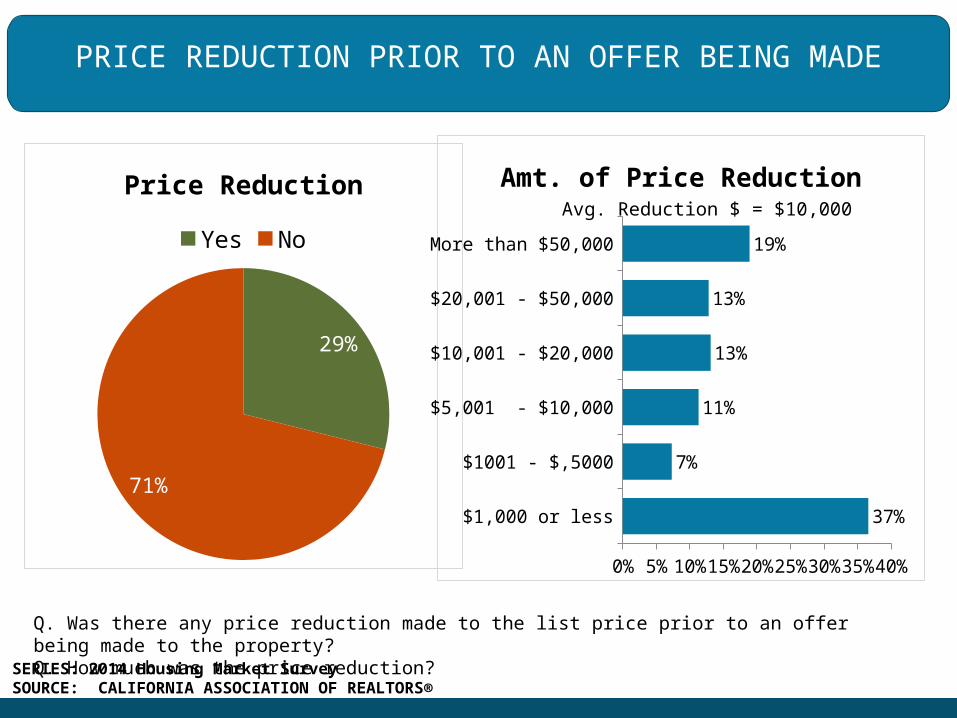
PRICE REDUCTION PRIOR TO AN OFFER BEING MADE
$1,000 or less
$1001 - $,5000
$5,001 - $10,000
$10,001 - $20,000
$20,001 - $50,000
More than $50,000
0% 10% 20% 30% 40%
37%
7%
11%
13%
13%
19%
Amt. of Price Reduction
Q. Was there any price reduction made to the list price prior to an offer being made to the property?Q. How much was the price reduction?
29%
71%
Price Reduction
Yes No
SERIES: 2014 Housing Market SurveySOURCE: CALIFORNIA ASSOCIATION OF REALTORS®
Avg. Reduction $ = $10,000
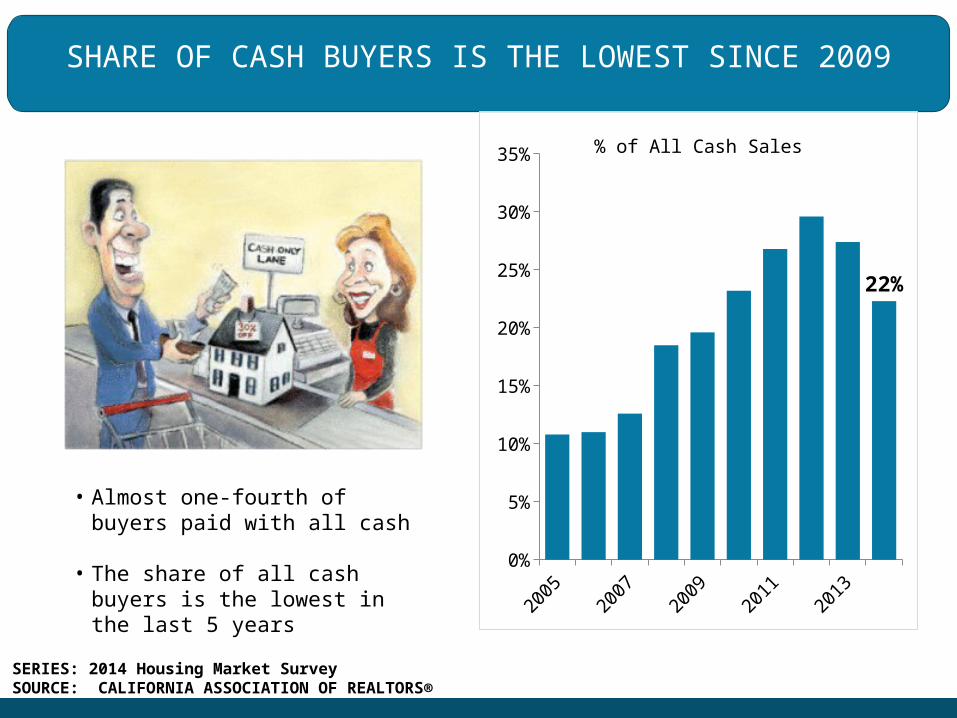
SHARE OF CASH BUYERS IS THE LOWEST SINCE 2009
2005
2006
2007
2008
2009
2010
2011
2012
2013
2014
0%
5%
10%
15%
20%
25%
30%
35%
22%
% of All Cash Sales
• Almost one-fourth of buyers paid with all cash
• The share of all cash buyers is the lowest in the last 5 years
SERIES: 2014 Housing Market SurveySOURCE: CALIFORNIA ASSOCIATION OF REALTORS®
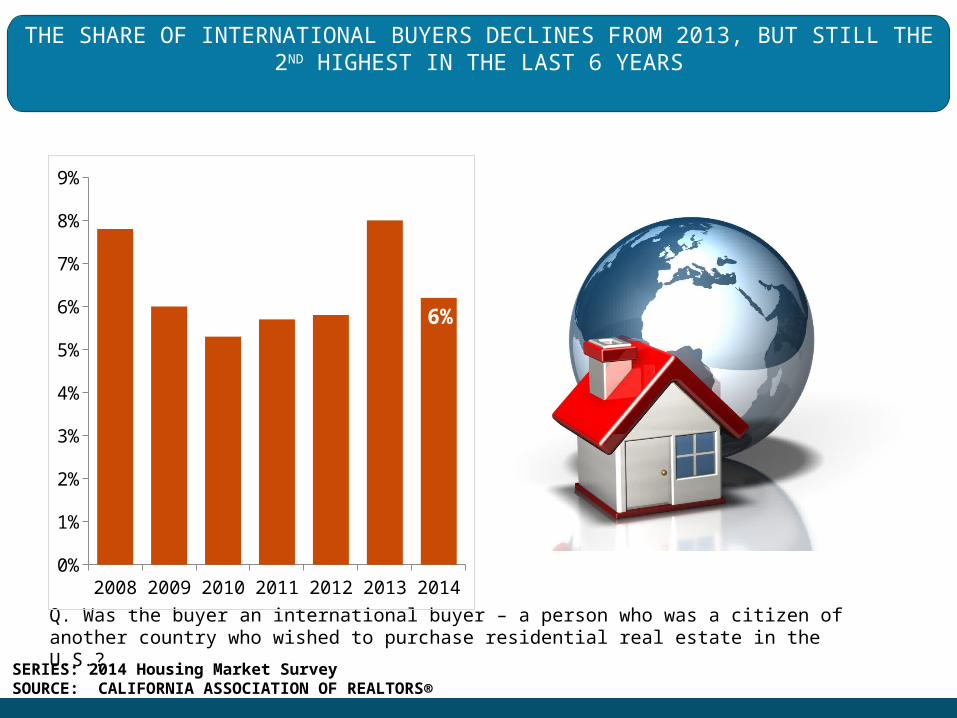
THE SHARE OF INTERNATIONAL BUYERS DECLINES FROM 2013, BUT STILL THE 2ND HIGHEST IN THE LAST 6 YEARS
Q. Was the buyer an international buyer – a person who was a citizen of another country who wished to purchase residential real estate in the U.S.?
2008 2009 2010 2011 2012 2013 20140%
1%
2%
3%
4%
5%
6%
7%
8%
9%
6%
SERIES: 2014 Housing Market SurveySOURCE: CALIFORNIA ASSOCIATION OF REALTORS®
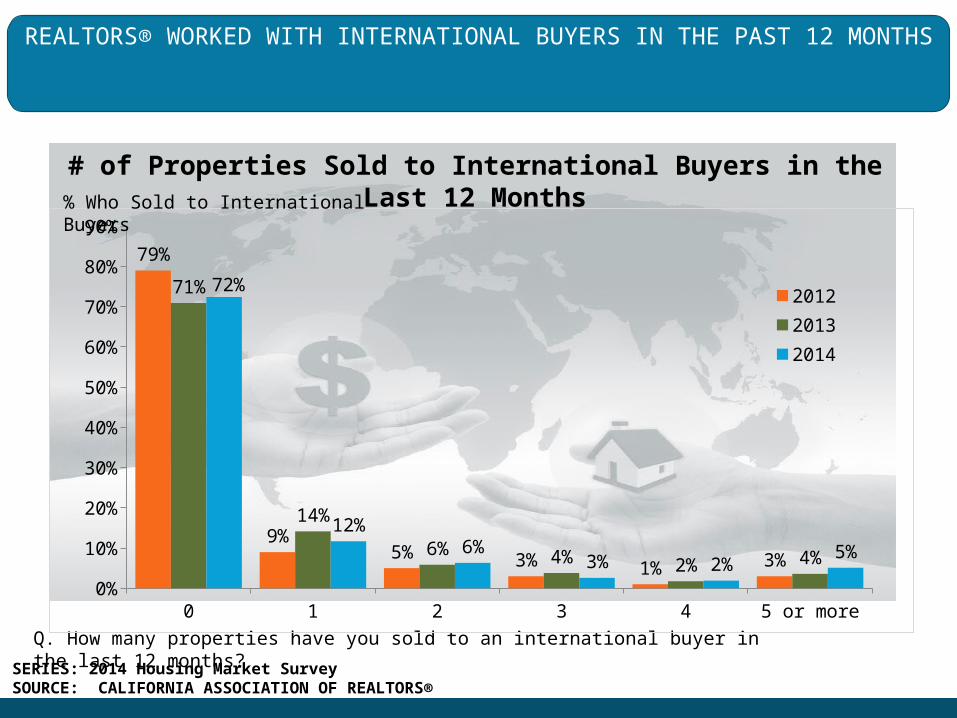
REALTORS® WORKED WITH INTERNATIONAL BUYERS IN THE PAST 12 MONTHS
Q. How many properties have you sold to an international buyer in the last 12 months?
0 1 2 3 4 5 or more0%
10%
20%
30%
40%
50%
60%
70%
80%
90%
79%
9%5% 3% 1% 3%
71%
14%
6% 4% 2% 4%
72%
12%6%
3% 2%5%
2012
2013
2014
% Who Sold to International Buyers
# of Properties Sold to International Buyers in the Last 12 Months
SERIES: 2014 Housing Market SurveySOURCE: CALIFORNIA ASSOCIATION OF REALTORS®
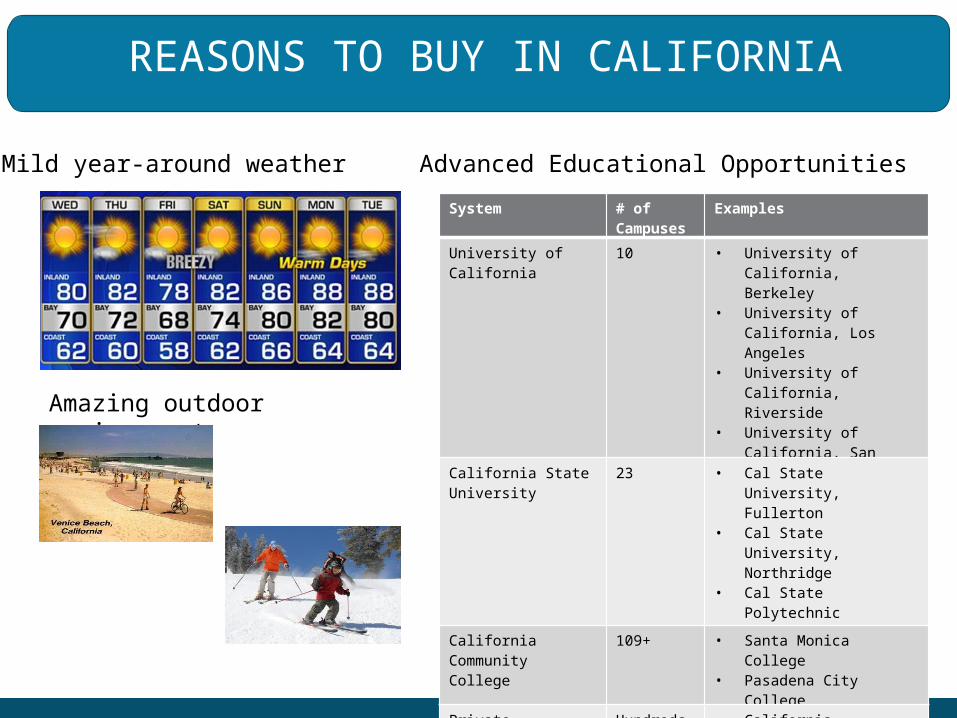
REASONS TO BUY IN CALIFORNIA
Mild year-around weather Advanced Educational Opportunities
System # of Campuses
Examples
University of California
10 • University of California, Berkeley
• University of California, Los Angeles
• University of California, Riverside
• University of California, San Diego
California State University
23 • Cal State University, Fullerton
• Cal State University, Northridge
• Cal State Polytechnic University, Pomona
California Community College
109+ • Santa Monica College• Pasadena City College
Private University Hundreds • California Institute of Technology
• Pepperdine University• Stanford University• University of Southern
California
Amazing outdoor environment
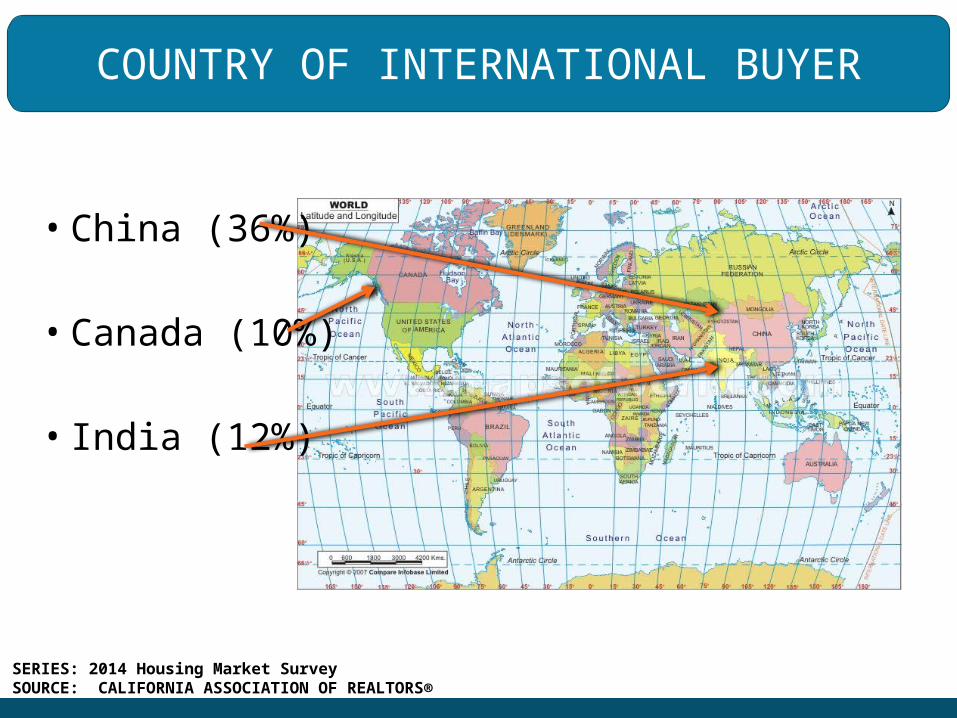
COUNTRY OF INTERNATIONAL BUYER
• China (36%)
• Canada (10%)
• India (12%)
SERIES: 2014 Housing Market SurveySOURCE: CALIFORNIA ASSOCIATION OF REALTORS®

PRICE PLATEAU AHEAD; ANNUAL GAINS SLOWINGCalifornia, Oct. 2014: $450,620, Up 5.4% YTY
SERIES: Median Price of Existing Single Family HomesSOURCE: CALIFORNIA ASSOCIATION OF REALTORS®
Oct-14: $450,620
Oct-13: $427,540
$-
$100,000
$200,000
$300,000
$400,000
$500,000
$600,000
$700,000 P: May-07$594,530
T: Feb-09$245,230-59% frompeak

INCOME REQUIRED TO BUY A MEDIAN-PRICED HOME IN CA: (PEAK VS. CURRENT)
2012 Q1 2014 Q3$0
$20,000
$40,000
$60,000
$80,000
$100,000
$56,324
$94,965• Change in minimum required income:
$38,641
• Increase in income attributed to interest rate increase: $365 (0.9% of total change)
• Increase in income attributed to price increase : $38,276 (99.1% of total change)
SERIES: Housing Affordability IndexSOURCE: CALIFORNIA ASSOCIATION OF REALTORS®
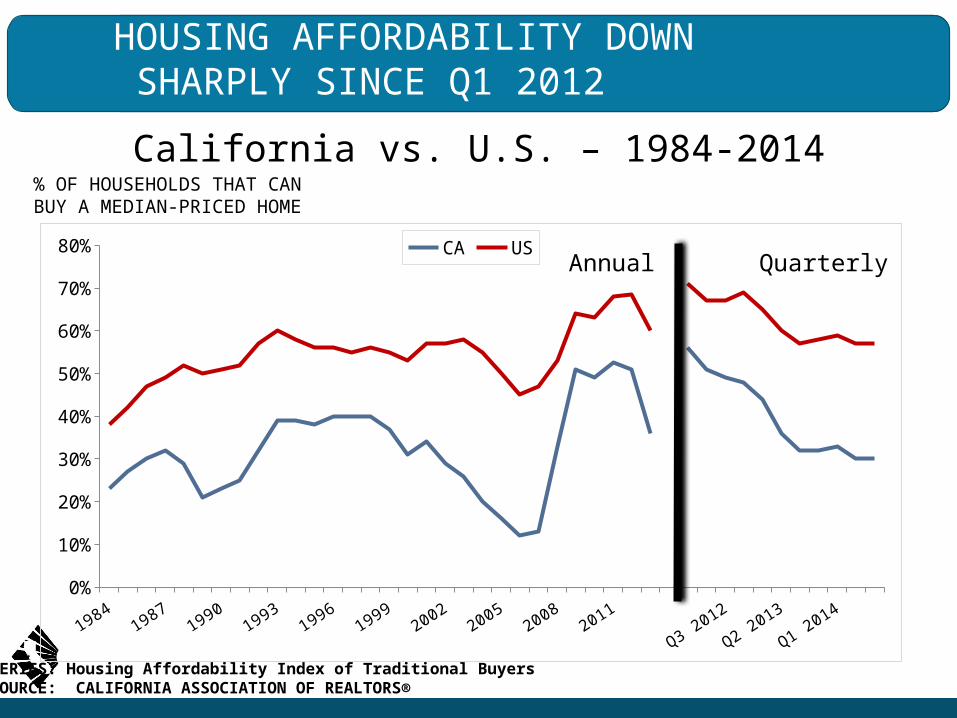
HOUSING AFFORDABILITY DOWN SHARPLY SINCE Q1 2012
% OF HOUSEHOLDS THAT CAN BUY A MEDIAN-PRICED HOME
SERIES: Housing Affordability Index of Traditional BuyersSOURCE: CALIFORNIA ASSOCIATION OF REALTORS®
19841986
19881990
19921994
19961998
20002002
20042006
20082010
2012
Q2 2012
Q4 2012
Q2 2013
Q4 2013
Q2 20140%
10%
20%
30%
40%
50%
60%
70%
80% CA US
California vs. U.S. – 1984-2014
Annual Quarterly
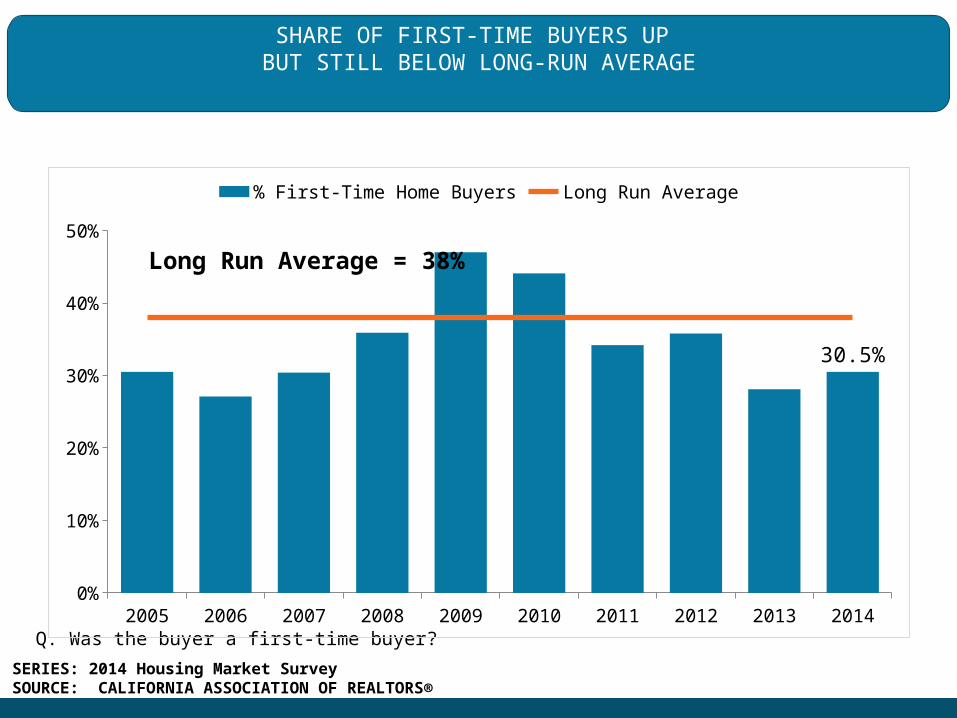
SHARE OF FIRST-TIME BUYERS UP BUT STILL BELOW LONG-RUN AVERAGE
Q. Was the buyer a first-time buyer?2005 2006 2007 2008 2009 2010 2011 2012 2013 2014
0%
10%
20%
30%
40%
50%
30.5%
% First-Time Home Buyers Long Run Average
Long Run Average = 38%
SERIES: 2014 Housing Market SurveySOURCE: CALIFORNIA ASSOCIATION OF REALTORS®

FINANCIAL CHARACTERISTICS: FIRST-TIME VS. REPEAT
SERIES: 2014 Housing Market SurveySOURCE: CALIFORNIA ASSOCIATION OF REALTORS®
First-time
BuyersRepeat Buyers All Buyers
Median Household Income $80,000 $120,000 $100,000
Median Monthly Mortgage Payment $1,477 $1,868 $1,800
Median Downpayment (in $$) $32,500 $100,000 $70,000
Median Downpayment (in % to Price)
10% 20% 19.7%
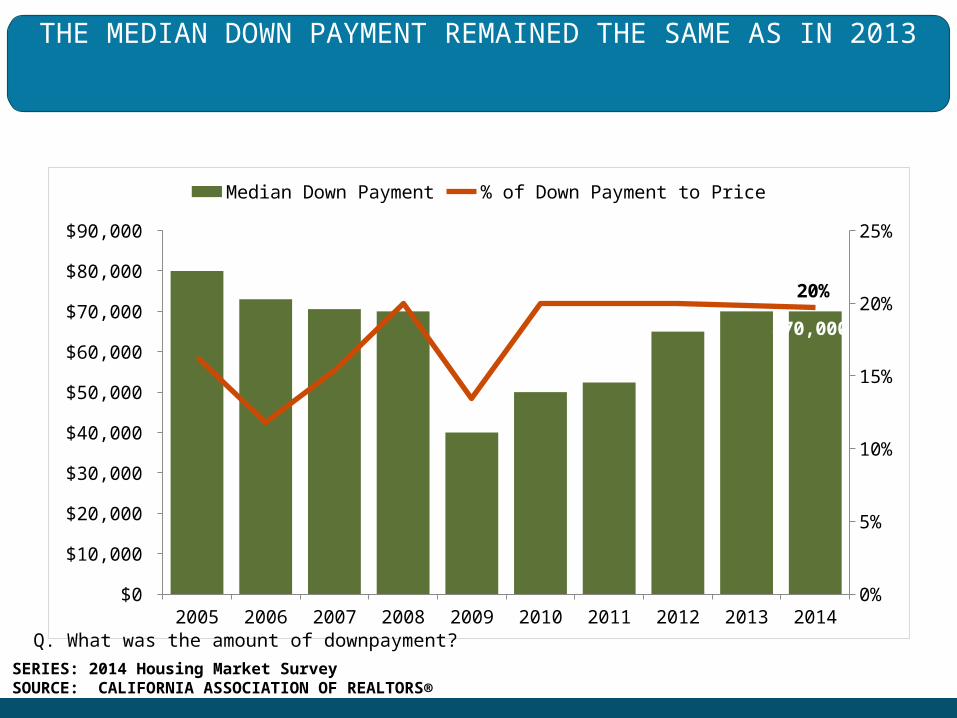
2005 2006 2007 2008 2009 2010 2011 2012 2013 2014$0
$10,000
$20,000
$30,000
$40,000
$50,000
$60,000
$70,000
$80,000
$90,000
0%
5%
10%
15%
20%
25%
$70,000
20%
Median Down Payment % of Down Payment to Price
Q. What was the amount of downpayment?
THE MEDIAN DOWN PAYMENT REMAINED THE SAME AS IN 2013
SERIES: 2014 Housing Market SurveySOURCE: CALIFORNIA ASSOCIATION OF REALTORS®

MEDIAN DOWN PAYMENTFIRST-TIME HOMEBUYERS VS. REPEAT HOMEBUYERS
Q. What was the amount of downpayment?2005 2006 2007 2008 2009 2010 2011 2012 2013 2014
$0
$20,000
$40,000
$60,000
$80,000
$100,000
$120,000
$140,000
$32,500
$100,000
First-Time Buyers Repeat Buyers
SERIES: 2014 Housing Market SurveySOURCE: CALIFORNIA ASSOCIATION OF REALTORS®

CASH SOURCE FOR DOWN PAYMENTFIRST-TIME BUYER VS. REPEAT BUYER
Q. What was the source of the cash the buyer used for a downpayment or to purchase the residence?
First-time
BuyersRepeat Buyers All Buyers
Personal saving 63.3% 50.8% 54.8%
Proceeds from sale of previous residence 0.0% 22.7% 15.6%
Borrowed or gift from relatives 15.5% 4.5% 8.1%
Sale of personal assets other than real property
1.7% 3.5% 2.9%
Inheritance 4.0% 2.9% 3.2%
Proceeds from sale or refi of another property 0.0% 4.6% 3.2%
Other 13.5% 11.0% 12.2%
SERIES: 2014 Housing Market SurveySOURCE: CALIFORNIA ASSOCIATION OF REALTORS®
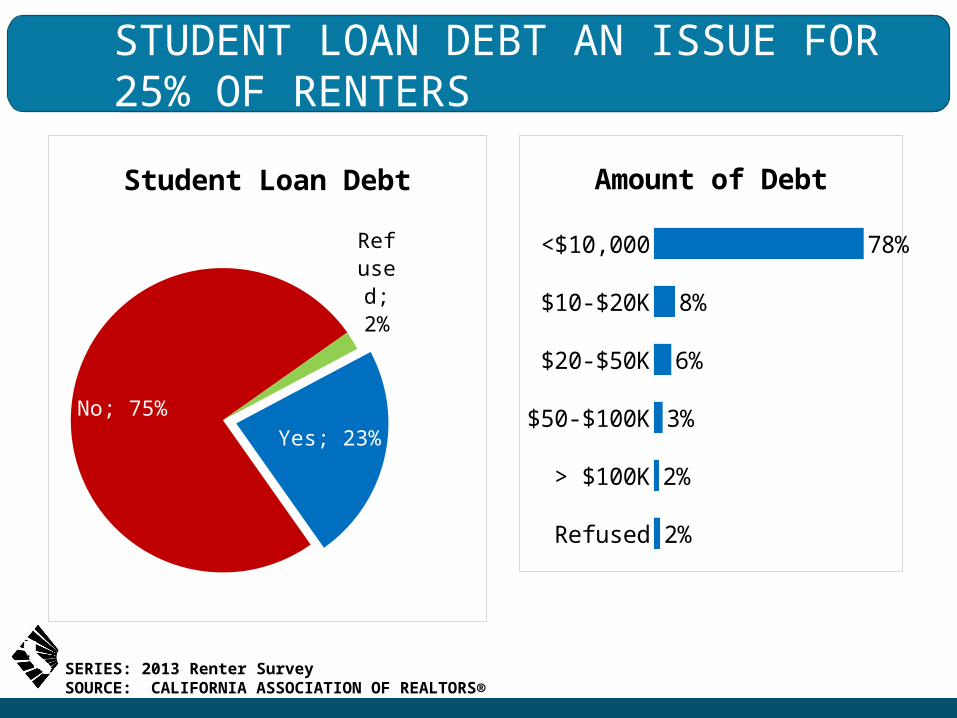
STUDENT LOAN DEBT AN ISSUE FOR 25% OF RENTERS
SERIES: 2013 Renter SurveySOURCE: CALIFORNIA ASSOCIATION OF REALTORS®
Yes; 23%
No; 75%
Re-fused; 2%
Student Loan Debt
<$10,000
$10-$20K
$20-$50K
$50-$100K
> $100K
Refused
78%
8%
6%
3%
2%
2%
Amount of Debt

STUDENT DEBT: DRAGS ON HOME SALES

RISING SHARE OF NEVER-MARRIED ADULTS
SOURCE: Pew Research Center analysis of the 1960-2000 decennial census and 2010-2012 American Community Survey
% of men and women ages 25 and older who have never been married
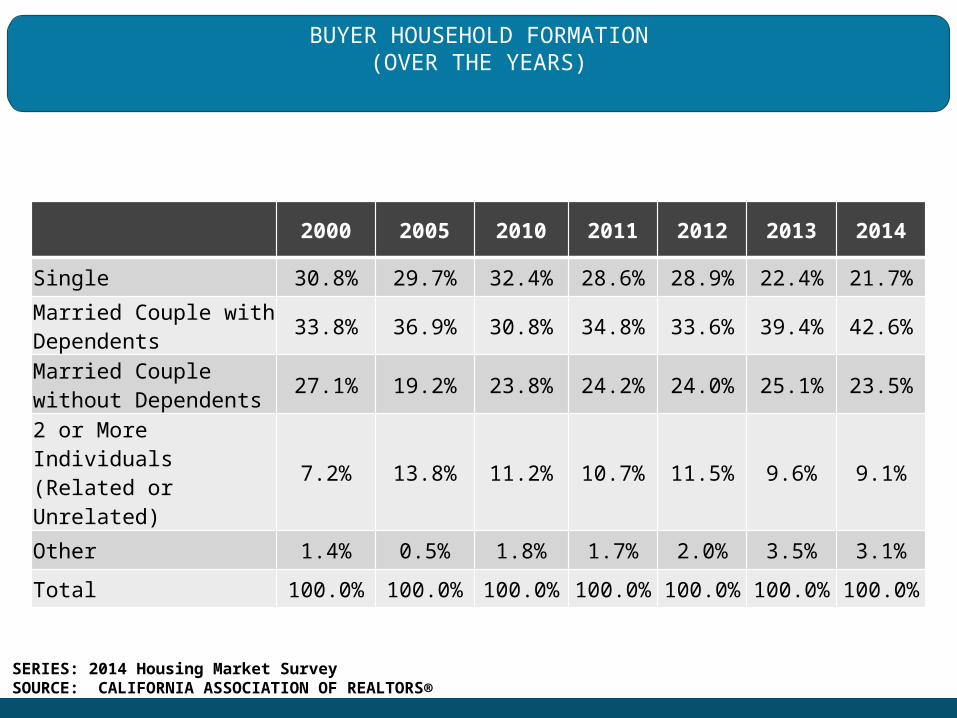
BUYER HOUSEHOLD FORMATION(OVER THE YEARS)
2000 2005 2010 2011 2012 2013 2014
Single 30.8% 29.7% 32.4% 28.6% 28.9% 22.4% 21.7%
Married Couple with Dependents 33.8% 36.9% 30.8% 34.8% 33.6% 39.4% 42.6%
Married Couple without Dependents 27.1% 19.2% 23.8% 24.2% 24.0% 25.1% 23.5%
2 or More Individuals (Related or Unrelated) 7.2% 13.8% 11.2% 10.7% 11.5% 9.6% 9.1%
Other 1.4% 0.5% 1.8% 1.7% 2.0% 3.5% 3.1%
Total 100.0% 100.0% 100.0% 100.0% 100.0% 100.0% 100.0%
SERIES: 2014 Housing Market SurveySOURCE: CALIFORNIA ASSOCIATION OF REALTORS®
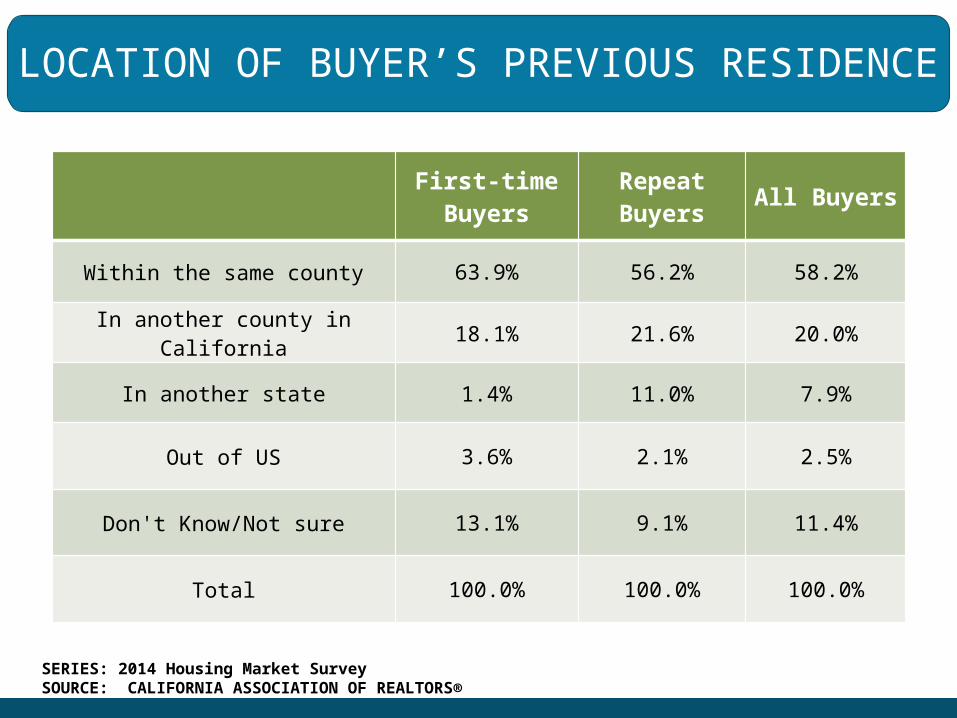
LOCATION OF BUYER’S PREVIOUS RESIDENCE
SERIES: 2014 Housing Market SurveySOURCE: CALIFORNIA ASSOCIATION OF REALTORS®
First-time
BuyersRepeat Buyers All Buyers
Within the same county 63.9% 56.2% 58.2%
In another county in California 18.1% 21.6% 20.0%
In another state 1.4% 11.0% 7.9%
Out of US 3.6% 2.1% 2.5%
Don't Know/Not sure 13.1% 9.1% 11.4%
Total 100.0% 100.0% 100.0%
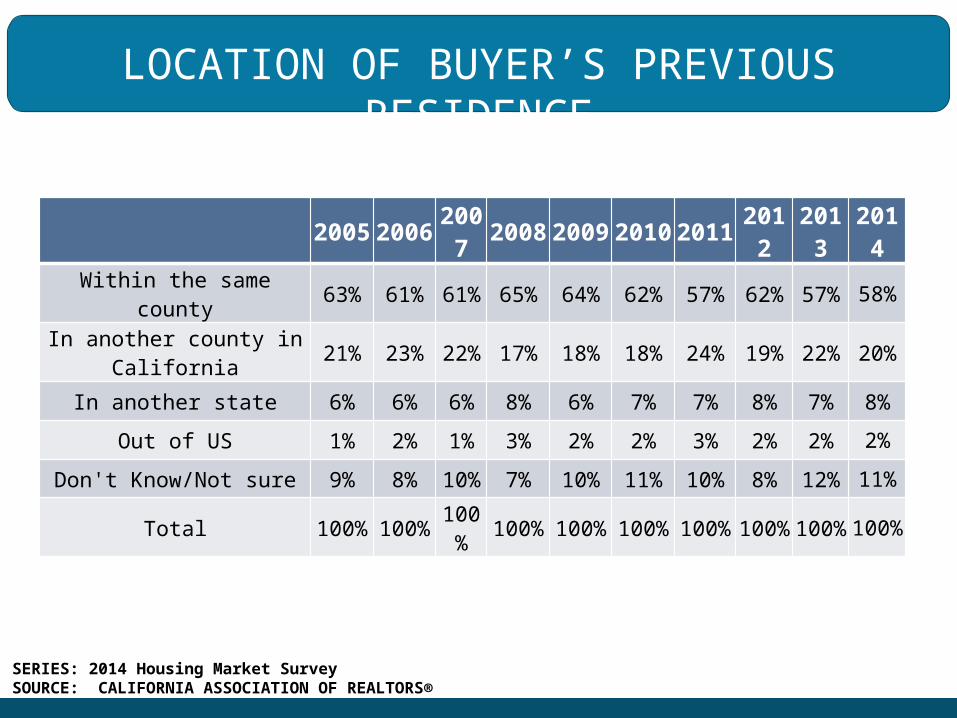
LOCATION OF BUYER’S PREVIOUS RESIDENCE
2005
2006
2007
2008
2009
2010
2011
2012
2013
2014
Within the same county 63% 61% 61% 65% 64% 62% 57% 62% 57% 58%
In another county in California 21% 23% 22% 17% 18% 18% 24% 19% 22% 20%
In another state 6% 6% 6% 8% 6% 7% 7% 8% 7% 8%
Out of US 1% 2% 1% 3% 2% 2% 3% 2% 2% 2%
Don't Know/Not sure 9% 8% 10% 7% 10% 11% 10% 8% 12% 11%
Total 100%
100%
100%
100%
100%
100%
100%
100%
100%
100%
SERIES: 2014 Housing Market SurveySOURCE: CALIFORNIA ASSOCIATION OF REALTORS®
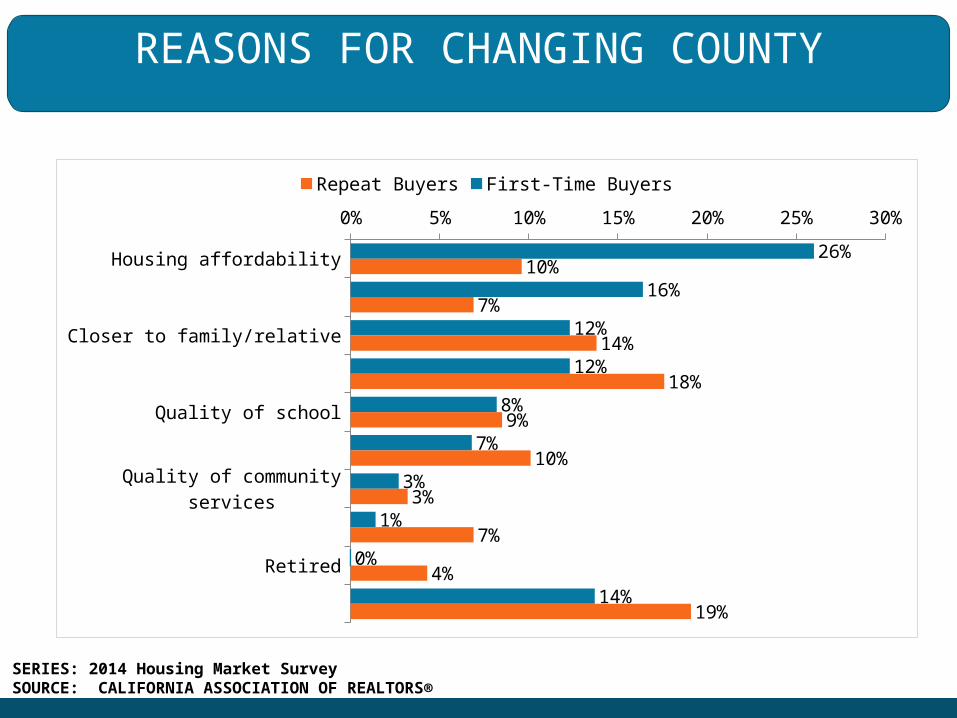
REASONS FOR CHANGING COUNTY
Housing affordability
Shorter commute to work/school
Closer to family/relative
Quality of life
Quality of school
Job change
Quality of community services
Second home
Retired
Other
0% 5% 10% 15% 20% 25% 30%
26%
16%
12%
12%
8%
7%
3%
1%
0%
14%
10%
7%
14%
18%
9%
10%
3%
7%
4%
19%
Repeat Buyers First-Time Buyers
SERIES: 2014 Housing Market SurveySOURCE: CALIFORNIA ASSOCIATION OF REALTORS®

2000 2001 2002 2003 2004 2005 2006 2007 2008 2009 2010 2011 2012 2013 20140%
10%
20%
30%
40%
50%
7.9%
11.3%
5.1%6.9%
All Hombuyers First-Time Buyers Repeat Buyers
Down Payment
PERCENT OF BUYERS WITH ZERO DOWN PAYMENT
SERIES: 2014 Housing Market SurveySOURCE: CALIFORNIA ASSOCIATION OF REALTORS®

PROPORTION OF TRANSACTIONS WITH SECOND MORTGAGES
Q. In addition to the first mortgage or assumption, was there a second mortgage?
2005 2006 2007 2008 2009 2010 2011 2012 2013 20140%
10%
20%
30%
40%
50%
4%
Percent of Home Sales with Second Mortgage
SERIES: 2014 Housing Market SurveySOURCE: CALIFORNIA ASSOCIATION OF REALTORS®

PERCENT OF BUYERS WITH SECOND MORTGAGE
2005 2006 2007 2008 2009 2010 2011 2012 2013 20140%
10%
20%
30%
40%
50%
60%
70% First-Time Buyers Repeat Buyers
SERIES: 2014 Housing Market SurveySOURCE: CALIFORNIA ASSOCIATION OF REALTORS®
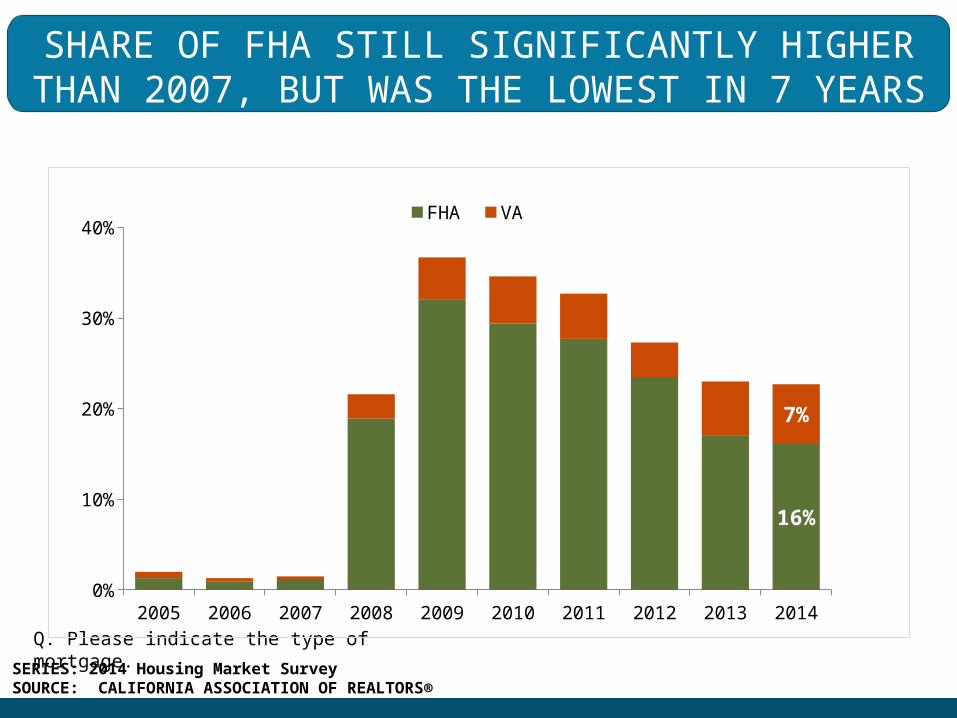
Q. Please indicate the type of mortgage.
SHARE OF FHA STILL SIGNIFICANTLY HIGHER THAN 2007, BUT WAS THE LOWEST IN 7 YEARS
(FIRST MORTGAGE)
2005 2006 2007 2008 2009 2010 2011 2012 2013 20140%
10%
20%
30%
40%
16%
7%
FHA VA
SERIES: 2014 Housing Market SurveySOURCE: CALIFORNIA ASSOCIATION OF REALTORS®
WHY DO WE CARE ABOUT LOW LEVEL OF FIRST-TIME BUYER?
• It signals a constrained flow of new households in the housing market
• Trade-up market cannot be replenished in the long run
• First-time buyers represent the main impulse that drives the state’s homeownership rate
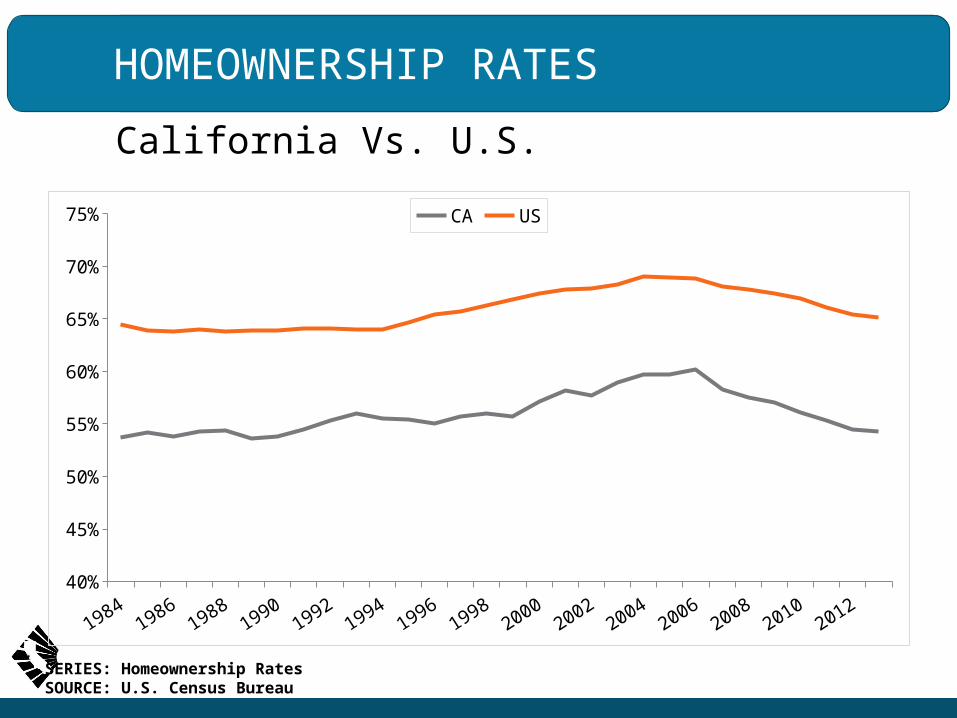
HOMEOWNERSHIP RATES
California Vs. U.S.
19841986
19881990
19921994
19961998
20002002
20042006
20082010
201240%
45%
50%
55%
60%
65%
70%
75% CA US
SERIES: Homeownership RatesSOURCE: U.S. Census Bureau
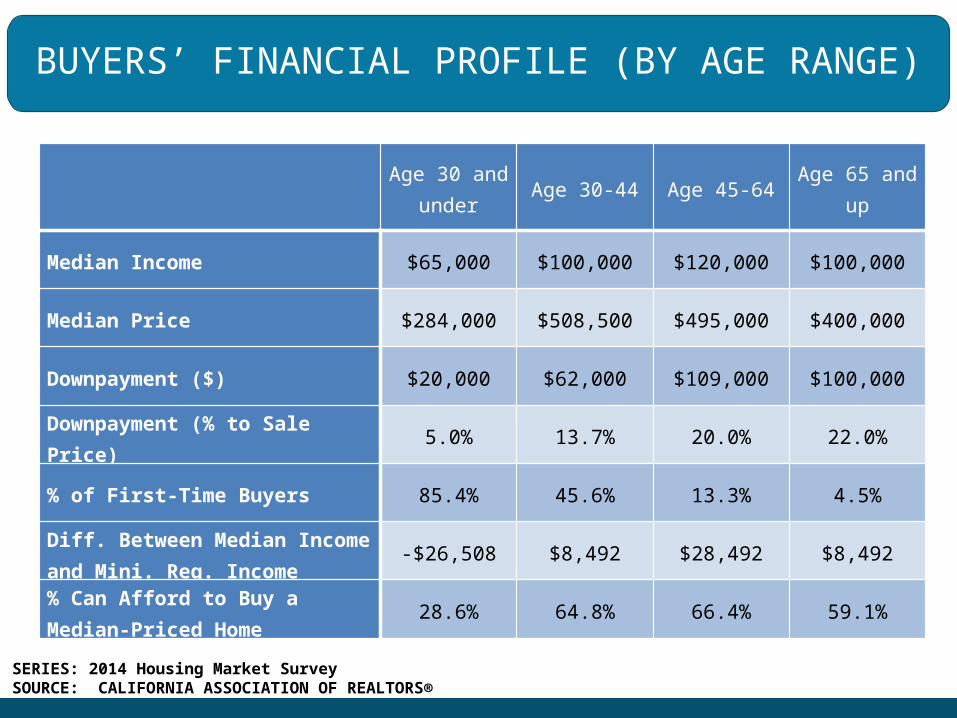
BUYERS’ FINANCIAL PROFILE (BY AGE RANGE)
SERIES: 2014 Housing Market SurveySOURCE: CALIFORNIA ASSOCIATION OF REALTORS®
Age 30 and under Age 30-44 Age 45-64 Age 65 and up
Median Income $65,000 $100,000 $120,000 $100,000
Median Price $284,000 $508,500 $495,000 $400,000
Downpayment ($) $20,000 $62,000 $109,000 $100,000
Downpayment (% to Sale Price) 5.0% 13.7% 20.0% 22.0%
% of First-Time Buyers 85.4% 45.6% 13.3% 4.5%
Diff. Between Median Income and Mini. Req. Income -$26,508 $8,492 $28,492 $8,492
% Can Afford to Buy a Median-Priced Home 28.6% 64.8% 66.4% 59.1%
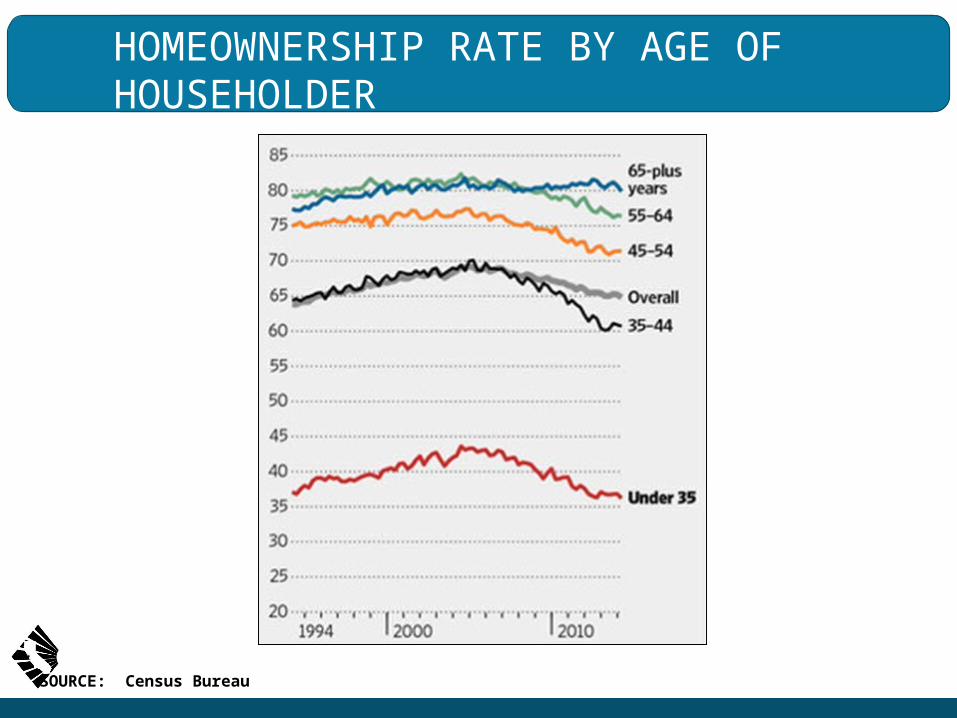
HOMEOWNERSHIP RATE BY AGE OF HOUSEHOLDER
SOURCE: Census Bureau
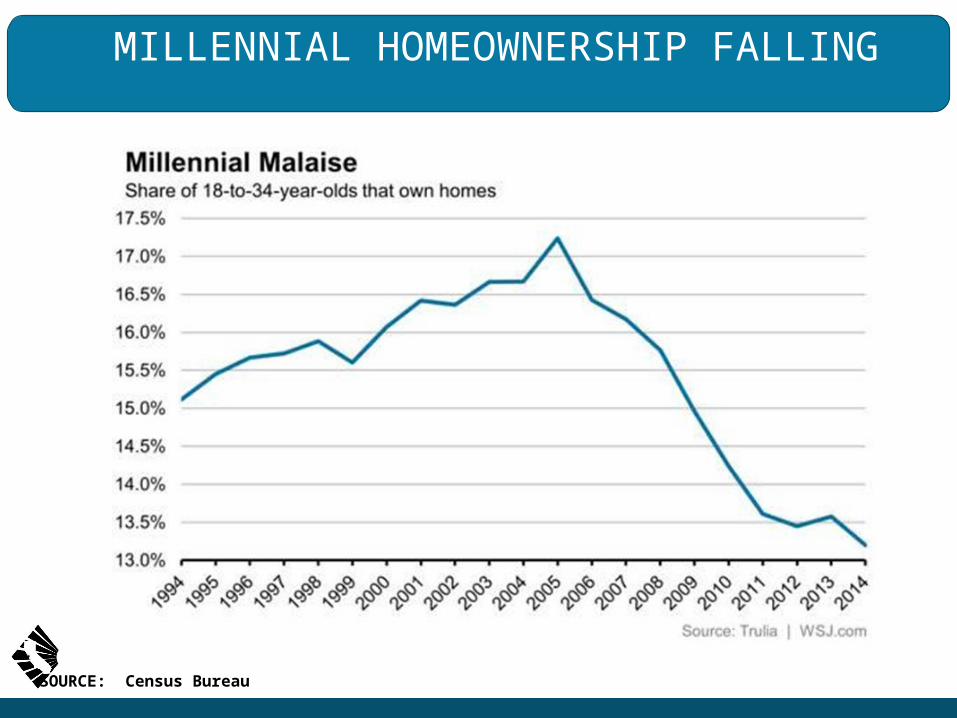
MILLENNIAL HOMEOWNERSHIP FALLING
SOURCE: Census Bureau
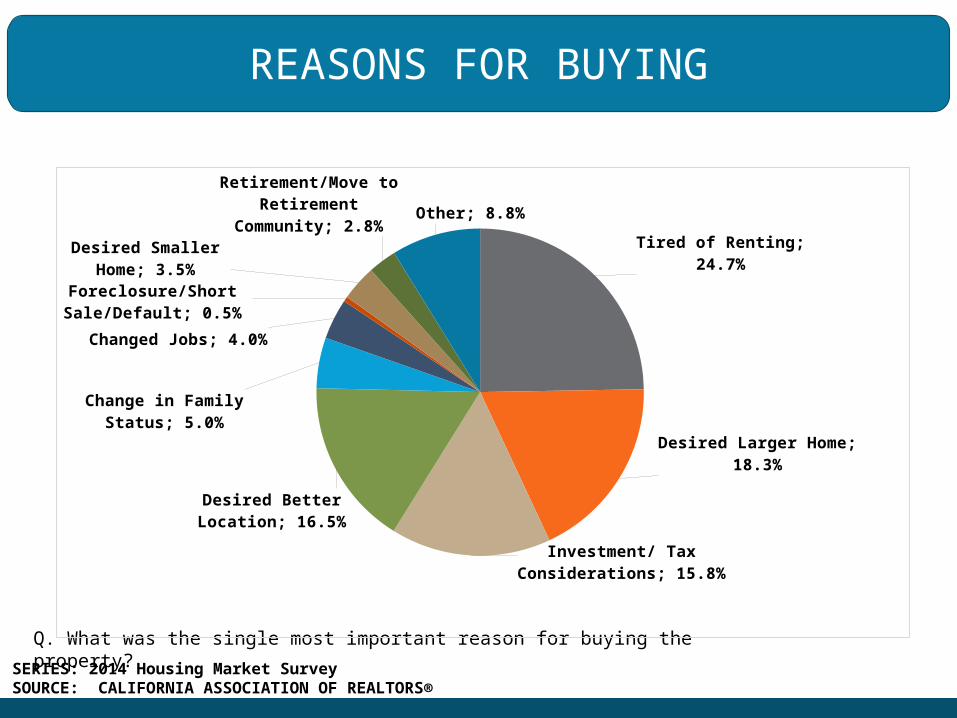
REASONS FOR BUYING
Q. What was the single most important reason for buying the property?
Tired of Renting; 24.7%
Desired Larger Home; 18.3%
Investment/ Tax Consider-ations; 15.8%
Desired Better Lo-cation; 16.5%
Change in Family Status; 5.0%
Changed Jobs; 4.0%
Foreclosure/Short Sale/Default; 0.5%
Desired Smaller Home; 3.5%
Retirement/Move to Retirement Com-
munity; 2.8%Other; 8.8%
SERIES: 2014 Housing Market SurveySOURCE: CALIFORNIA ASSOCIATION OF REALTORS®
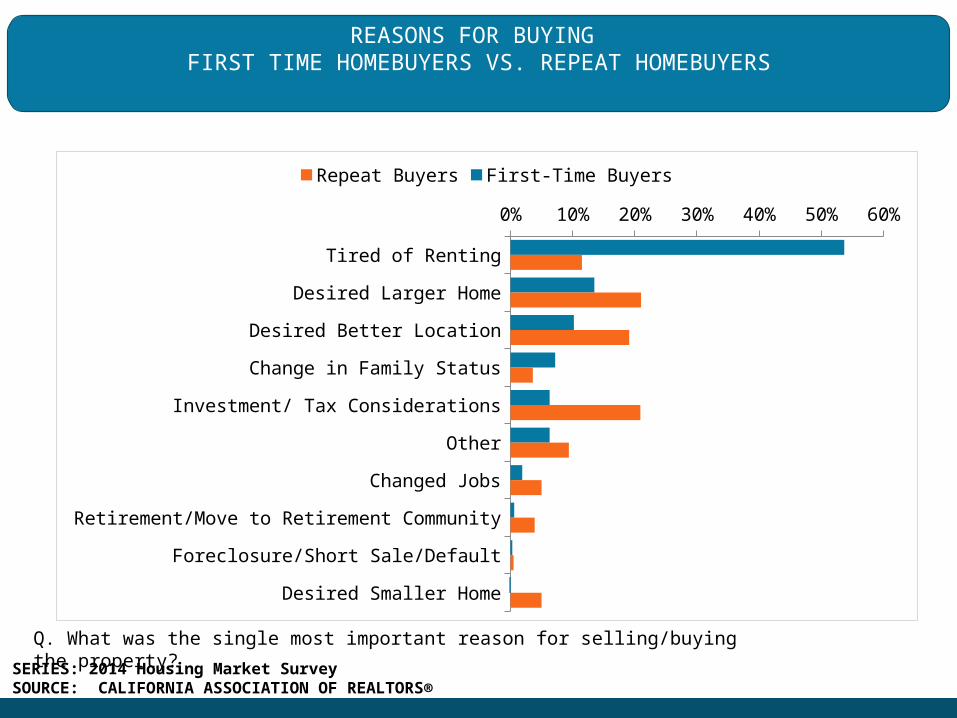
REASONS FOR BUYING FIRST TIME HOMEBUYERS VS. REPEAT HOMEBUYERS
Q. What was the single most important reason for selling/buying the property?
Tired of Renting
Desired Larger Home
Desired Better Location
Change in Family Status
Investment/ Tax Considerations
Other
Changed Jobs
Retirement/Move to Retirement Community
Foreclosure/Short Sale/Default
Desired Smaller Home
0% 10% 20% 30% 40% 50% 60%
Repeat Buyers First-Time Buyers
SERIES: 2014 Housing Market SurveySOURCE: CALIFORNIA ASSOCIATION OF REALTORS®
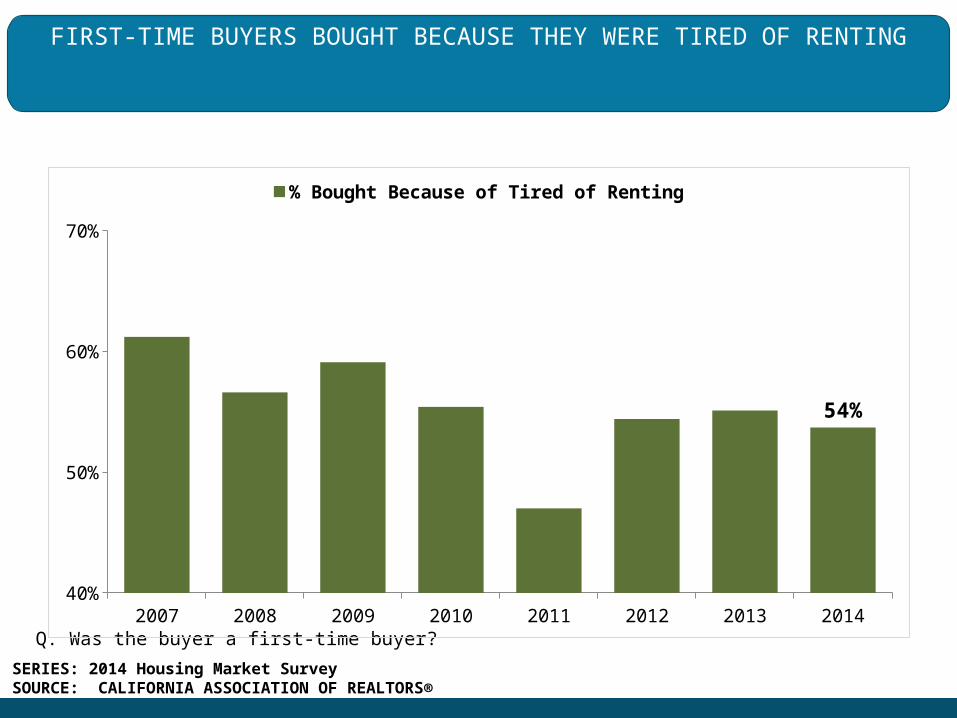
FIRST-TIME BUYERS BOUGHT BECAUSE THEY WERE TIRED OF RENTING
Q. Was the buyer a first-time buyer?2007 2008 2009 2010 2011 2012 2013 2014
40%
50%
60%
70%
54%
% Bought Because of Tired of Renting
SERIES: 2014 Housing Market SurveySOURCE: CALIFORNIA ASSOCIATION OF REALTORS®
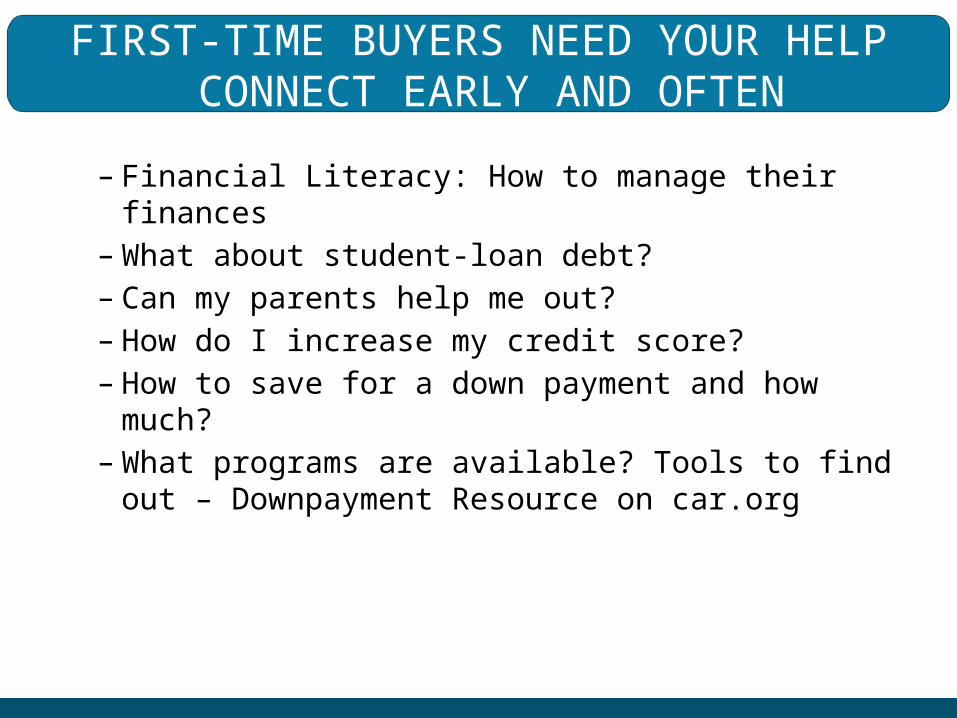
FIRST-TIME BUYERS NEED YOUR HELP CONNECT EARLY AND OFTEN
– Financial Literacy: How to manage their finances
–What about student-loan debt?– Can my parents help me out?– How do I increase my credit score?– How to save for a down payment and how
much?–What programs are available? Tools to find
out – Downpayment Resource on car.org
DOWNPAYMENT.CAR.ORG

INVENTORY IMPROVING FROM LAST YEAR Oct 2013: 3.3 Months; Oct 2014: 3.8 Months
Note: “Unsold Inventory Index” represents the number of months it would take to sell the remaining inventory for the month in question. The remaining inventory for the month is defined as the number of properties that were “Active”, “Pending”, and “Contingent” (when available) and divide the sum by the number of “Sold” properties for the month in question.
0
2
4
6
8
10
12
14
16
18
SERIES: Unsold Inventory Index of Existing Single Family HomesSOURCE: CALIFORNIA ASSOCIATION OF REALTORS®
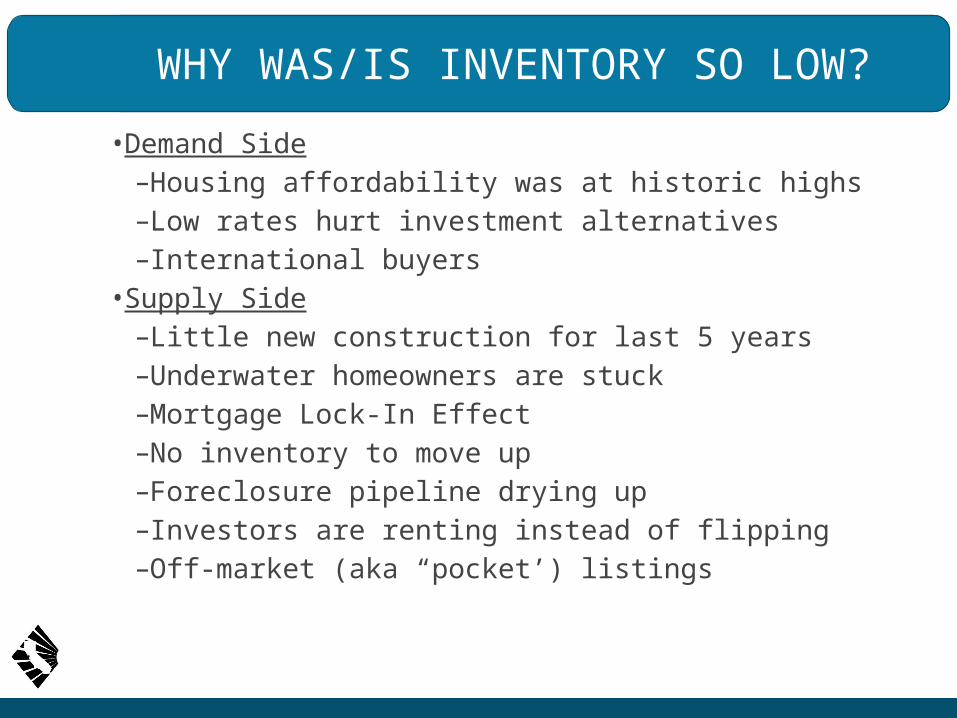
WHY WAS/IS INVENTORY SO LOW?
• Demand Side– Housing affordability was at historic highs– Low rates hurt investment alternatives– International buyers
• Supply Side– Little new construction for last 5 years– Underwater homeowners are stuck– Mortgage Lock-In Effect– No inventory to move up– Foreclosure pipeline drying up – Investors are renting instead of flipping– Off-market (aka “pocket’) listings
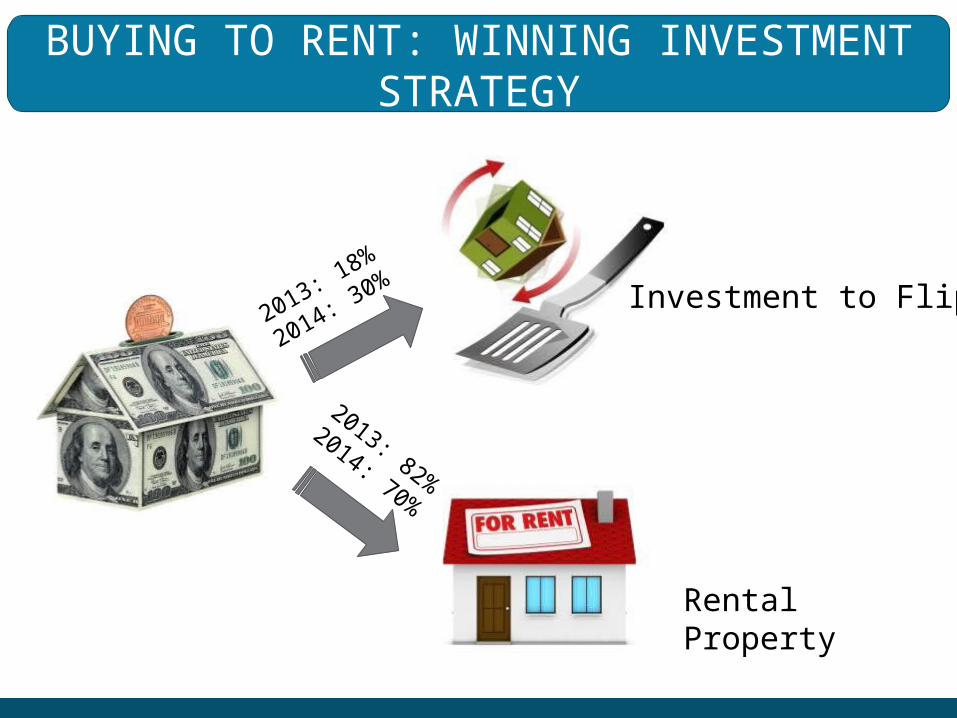
BUYING TO RENT: WINNING INVESTMENT STRATEGY
Investment to Flip
Rental Property
2013: 18%
2014: 30%
2013: 82%
2014: 70%
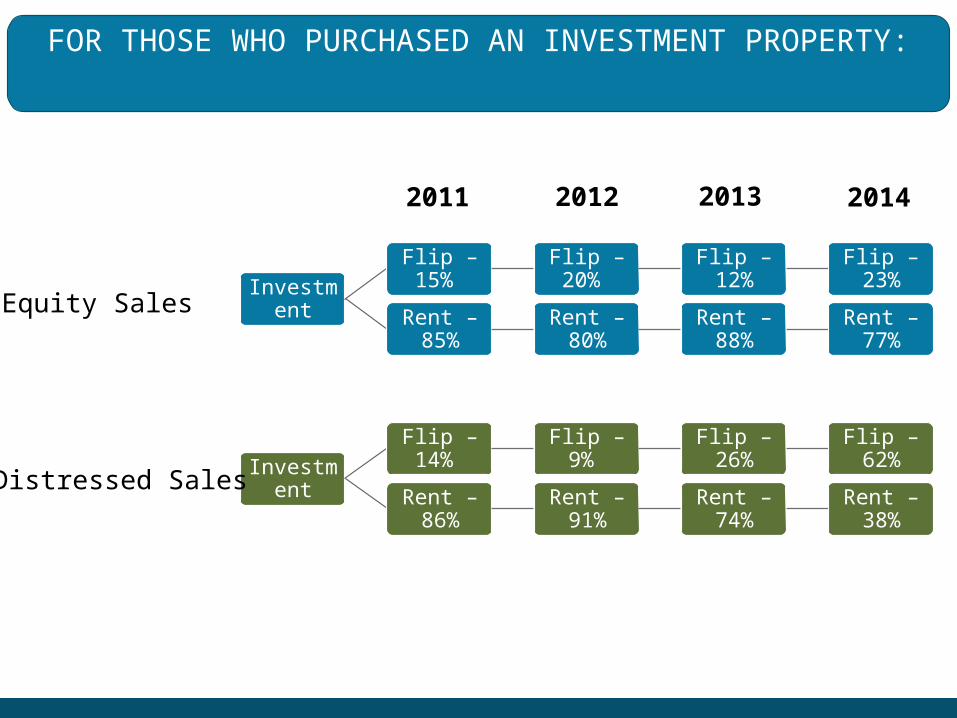
FOR THOSE WHO PURCHASED AN INVESTMENT PROPERTY:
Investment
Flip – 14% Flip – 9% Flip –
26%Flip – 62%
Rent – 86%
Rent – 91%
Rent – 74%
Rent – 38%
Distressed Sales
Investment
Flip – 15%
Flip – 20%
Flip – 12%
Flip – 23%
Rent – 85%
Rent – 80%
Rent – 88%
Rent – 77%
Equity Sales
2011 2012 2013 2014
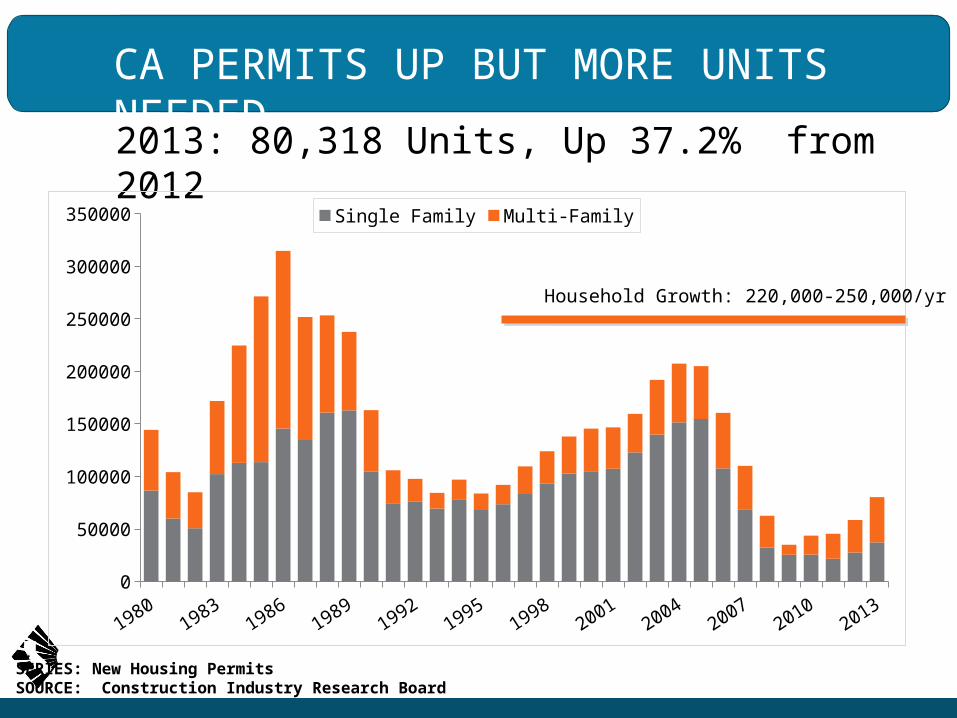
CA PERMITS UP BUT MORE UNITS NEEDED2013: 80,318 Units, Up 37.2% from 2012
SERIES: New Housing PermitsSOURCE: Construction Industry Research Board
0
50000
100000
150000
200000
250000
300000
350000 Single Family Multi-Family
Household Growth: 220,000-250,000/yr

POCKET LISTINGS
Property listed on an MLS
Property marketed before it was being listed on the MLS
Property received an accepted offer prior to it being listed on the MLS
Transaction happened on auction.com
0% 20% 40% 60% 80% 100%
96%
16%
4%
1%
SERIES: 2014 Housing Market SurveySOURCE: CALIFORNIA ASSOCIATION OF REALTORS®
2000
2001
2002
2003
2004
2005
2006
2007
2008
2009
2010
2011
2012
2013
2014
0
1
2
3
4
5
6
7
8
9
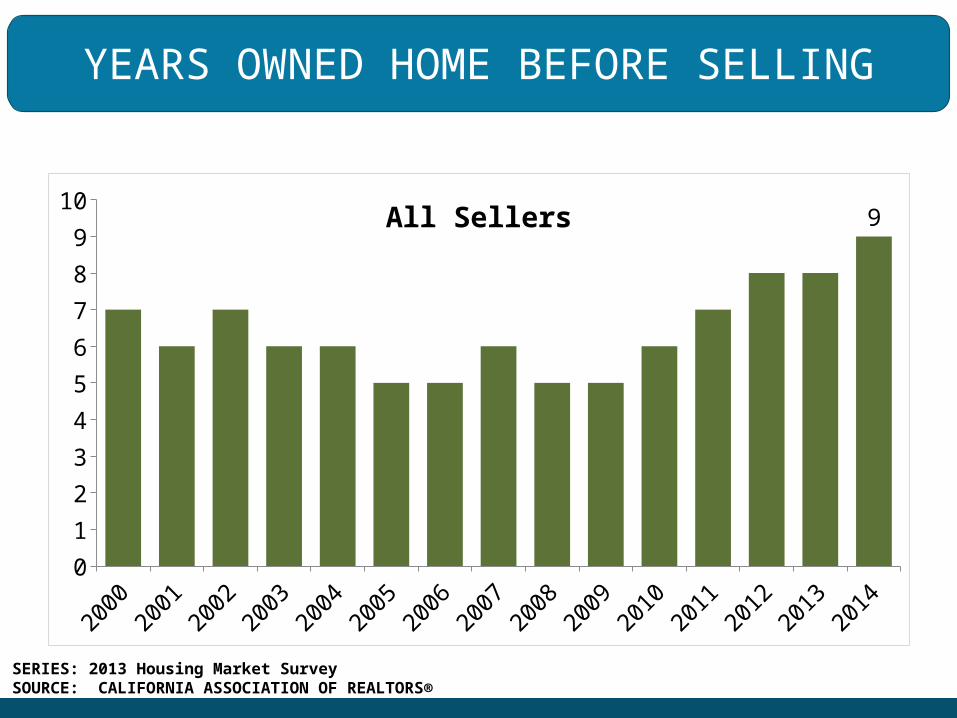
109All Sellers
YEARS OWNED HOME BEFORE SELLING
SERIES: 2013 Housing Market SurveySOURCE: CALIFORNIA ASSOCIATION OF REALTORS®

REASONS FOR SELLING
Q. What was the single most important reason for selling the property?
Foreclosure/Short Sale/De-fault; 6.2%
Change in Family Status; 13.3%
Retirement/Move to Retirement Com-
munity; 11.6%
Investment/ Tax Considerations;
10.9%Desired Better Location;
12.8%
Desired Smaller Home; 8.5%
Changed Jobs; 7.0%
Desired Larger Home; 8.4%
Other; 21.3%
SERIES: 2014 Housing Market SurveySOURCE: CALIFORNIA ASSOCIATION OF REALTORS®
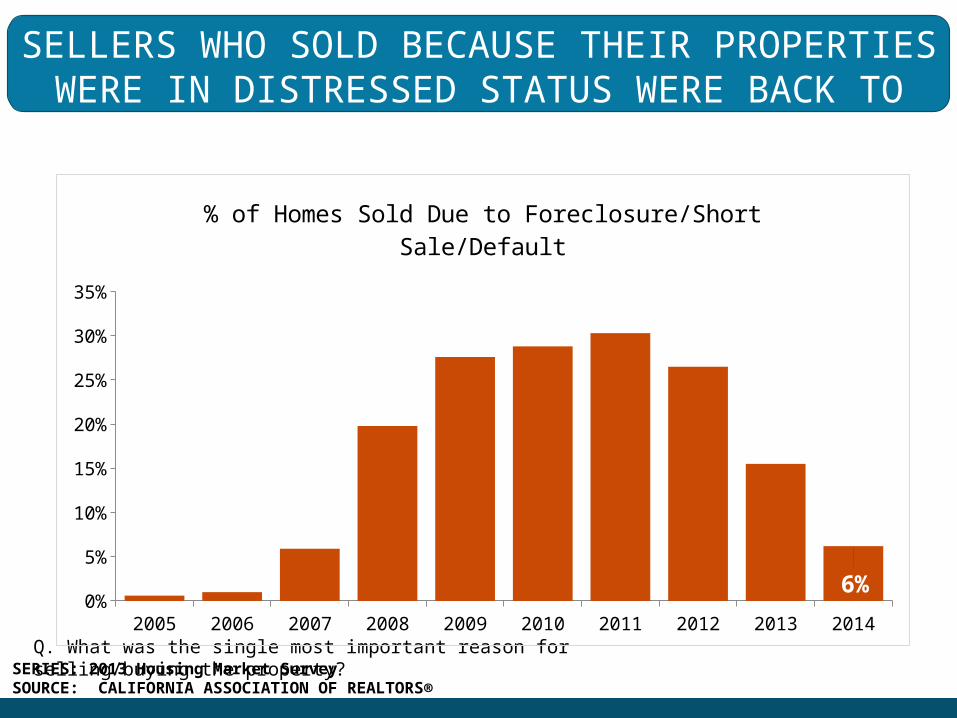
SELLERS WHO SOLD BECAUSE THEIR PROPERTIES WERE IN DISTRESSED STATUS WERE
BACK TO 2007 LEVEL
Q. What was the single most important reason for selling/buying the property?
2005 2006 2007 2008 2009 2010 2011 2012 2013 20140%
5%
10%
15%
20%
25%
30%
35%
6%
% of Homes Sold Due to Foreclosure/Short Sale/Default
SERIES: 2013 Housing Market SurveySOURCE: CALIFORNIA ASSOCIATION OF REALTORS®
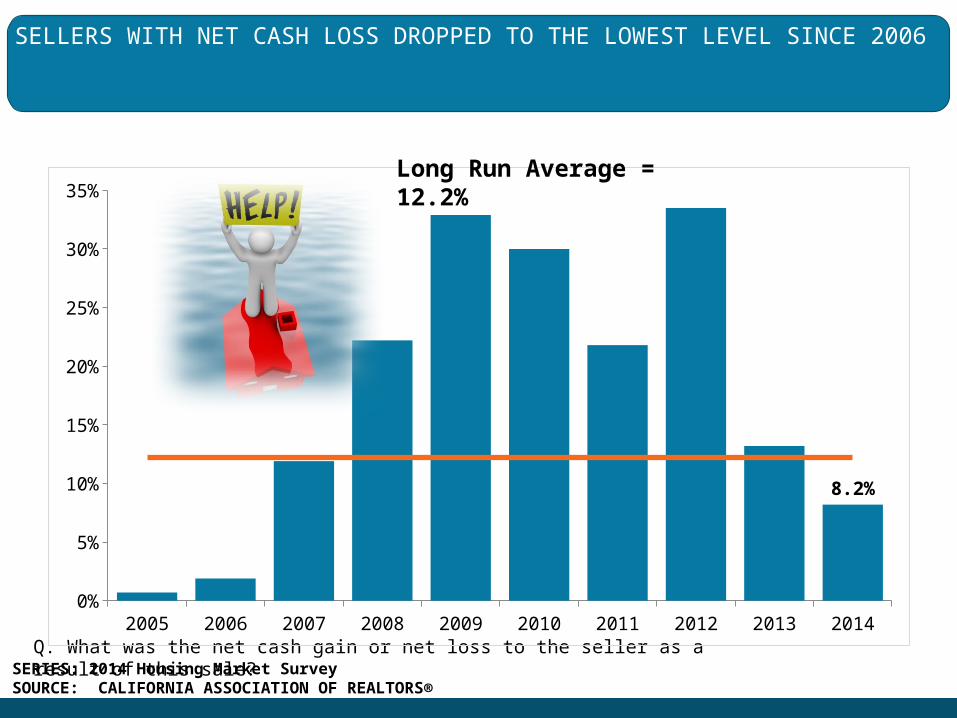
SELLERS WITH NET CASH LOSS DROPPED TO THE LOWEST LEVEL SINCE 2006
Q. What was the net cash gain or net loss to the seller as a result of this sale?
2005 2006 2007 2008 2009 2010 2011 2012 2013 20140%
5%
10%
15%
20%
25%
30%
35%
8.2%
Long Run Average = 12.2%
SERIES: 2014 Housing Market SurveySOURCE: CALIFORNIA ASSOCIATION OF REALTORS®

Q. What was the net cash gain or net loss to the seller as a result of this sale?
2005 2006 2007 2008 2009 2010 2011 2012 2013 2014$0
$50,000
$100,000
$150,000
$200,000
$250,000
$100,000
NET CASH GAIN TO SELLERS ROSE AGAIN FOR THE SECOND YEAR
SERIES: 2014 Housing Market SurveySOURCE: CALIFORNIA ASSOCIATION OF REALTORS®

NEARLY HALF OF ALL SELLERS ARE PLANNING TO BUY ANOTHER HOME AS THE MARKET RECOVERS
Q. Is the seller planning on purchasing another home?2005 2006 2007 2008 2009 2010 2011 2012 2013 2014
0%
10%
20%
30%
40%
50%
60%
70%
80%
48%
SERIES: 2014 Housing Market SurveySOURCE: CALIFORNIA ASSOCIATION OF REALTORS®
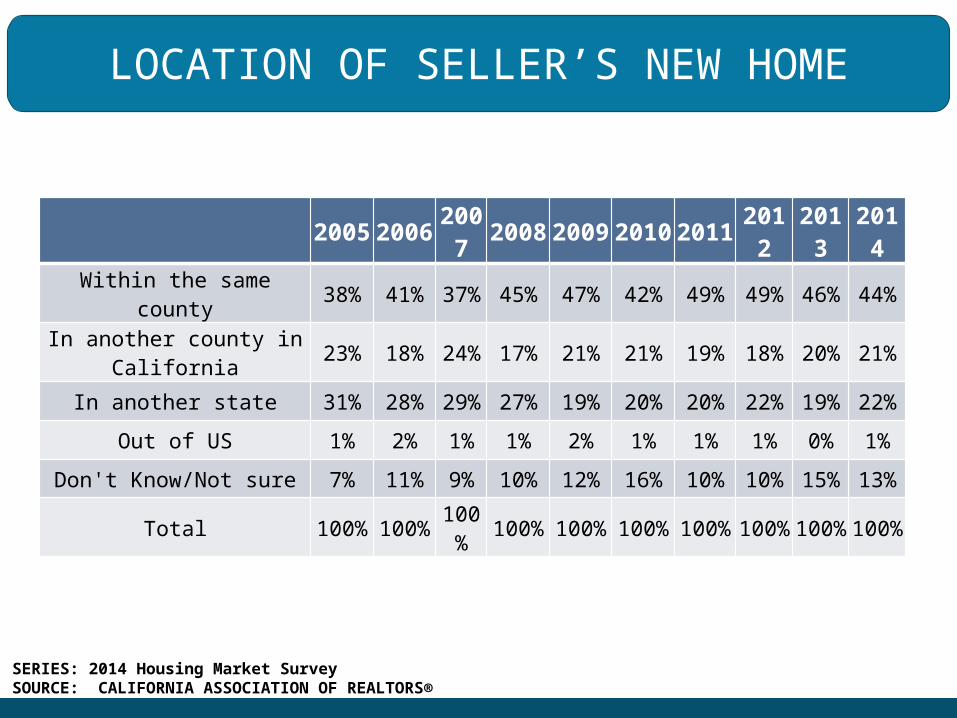
LOCATION OF SELLER’S NEW HOME
2005
2006
2007
2008
2009
2010
2011
2012
2013
2014
Within the same county 38% 41% 37% 45% 47% 42% 49% 49% 46% 44%
In another county in California 23% 18% 24% 17% 21% 21% 19% 18% 20% 21%
In another state 31% 28% 29% 27% 19% 20% 20% 22% 19% 22%
Out of US 1% 2% 1% 1% 2% 1% 1% 1% 0% 1%
Don't Know/Not sure 7% 11% 9% 10% 12% 16% 10% 10% 15% 13%
Total 100%
100%
100%
100%
100%
100%
100%
100%
100%
100%
SERIES: 2014 Housing Market SurveySOURCE: CALIFORNIA ASSOCIATION OF REALTORS®

FOR THOSE WHO DO NOT PLAN TO REPURCHASE, HERE ARE THEIR TOP REASONS:
Seller prefers to have less financial obligation
Seller owns another home
Decide to live with family/friends
Deceased
Retirement/Moved to Retirement Facility
Out of work/underemployment
Seller is a lender/bank
Lack of cash for down payment
Poor credit background
0% 5% 10% 15% 20% 25%
14%
10%
8%
7%
7%
5%
15%
9%
9%
22%
12%
7%
4%
6%
5%
7%
6%
5%
21%
16%
9%
6%
6%
5%
4%
2%
3%
2014 2013 2012
SERIES: 2014 Housing Market SurveySOURCE: CALIFORNIA ASSOCIATION OF REALTORS®
KEY TAKEAWAYS
• Sales down from 2013, but improving in recent months; investment sales still play a role
• International buyers continue to show interest in buying in CA
• Prices up sharply, but increases slowing in most markets
• Housing affordability remains a challenge, especially to first-time buyers
• Sellers are optimistic about the housing market
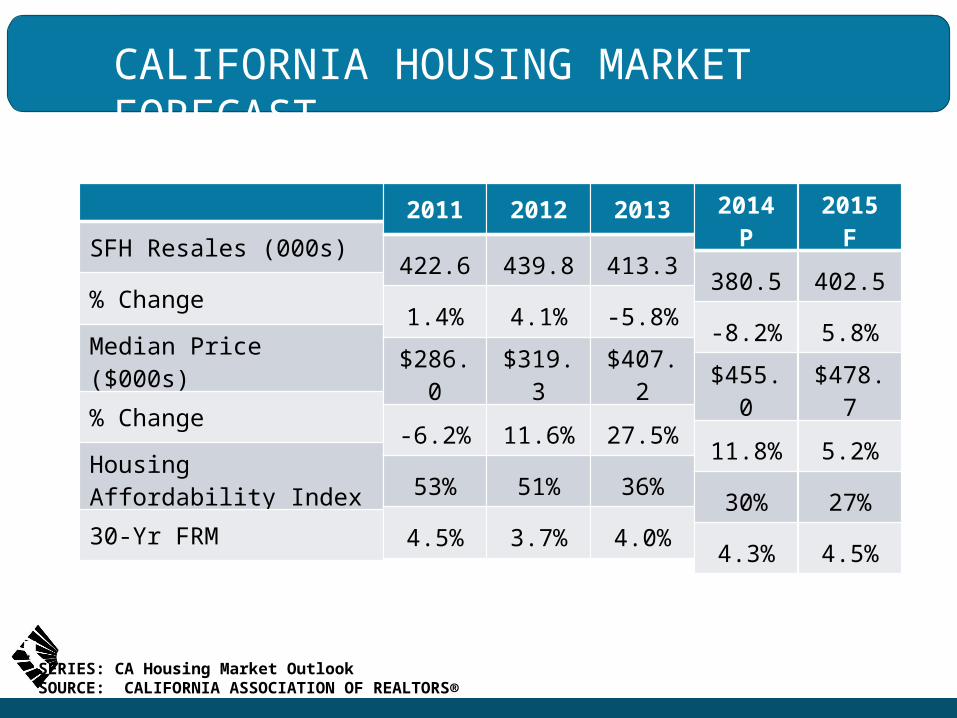
CALIFORNIA HOUSING MARKET FORECAST
SERIES: CA Housing Market OutlookSOURCE: CALIFORNIA ASSOCIATION OF REALTORS®
SFH Resales (000s)
% Change
Median Price ($000s)
% Change
Housing Affordability Index
30-Yr FRM
2011
422.6
1.4%
$286.0
-6.2%
53%
4.5%
2012
439.8
4.1%
$319.3
11.6%
51%
3.7%
2013
413.3
-5.8%
$407.2
27.5%
36%
4.0%
2014 P
380.5
-8.2%
$455.0
11.8%
30%
4.3%
2015 F
402.5
5.8%
$478.7
5.2%
27%
4.5%

•Working with International Home Buyers in California
• Thursday, January 29, 2014• 2:00 PM - 3:00 PM
• To register: WWW.CAR.ORG/MARKETDATA/VIDEOS
JOIN US FOR OUR NEXT WEBINAR…

http://www.car.org/marketdata/map
For more information:http://www.facebook.com/CARResearchgroup

Sharing the most up-to-date information about California’s housing market.
Read Research & Economics’ blog at:
HousingMatters.car.org
Housing Matters
Data Visualization. Economic Trends. Housing Affordability. Housing Trends. Market Outlook.

THANK YOU!www.car.org/marketdataFacebook: CARResearchgroupTwitter: CARResearchInfo [email protected]