Embed Size (px)
Citation preview

2014 Annual Self Monitoring Report
Reporting Period: January 1 – December 31, 2014

ii
San José-Santa Clara Regional Wastewater Facility 2014 Annual Self Monitoring Report
San José-Santa Clara Regional Wastewater Facility Annual Reports are posted on the City of San Jose website at: http://www.sanjoseca.gov/Archive.aspx?AMID=161&Type=&ADID=
The Facility NPDES permit was reissued for a new 5-year period in September. The new permit is in effect from 1 November 2014 through 31 October 2019. Because habitat in the Lower South Bay is looking better than it did 20 to 25 years ago, some requirements were relaxed in this latest edition: The Facility is no longer required to perform vegetation mapping of the downstream marshes; annual updates of the South Bay Action Plan no longer need be submitted, the frequency of acute toxicity testing was
reduced from monthly to quarterly. Other changes included removal of permit limits for heptachlor and tributyltin and addition of a new limit for Indeno (1,2,3-cd) Pyrene.
On the Cover: Northern Shovelers & Canada Geese taking a rest and refueling break in Biosolid drying bed #11 during winter season 2014/15.
Editor-in-Chief Jim Ervin Managing Editor Eric Dunlavey Data Manager Simret Yigzaw Senior Producer Ryan Mayfield Field Coordinator Bryan Frueh
Main Office:
408-635-6600 700 Los Esteros Road, San Jose, CA 94135
iii
TABLE OF CONTENTS 1. ANNUAL SELF MONITORING REPORT ................... 1
a. Facility Flows - 2014 ................................................... 4
b. Biosolids and material ................................................ 5
c. Effluent Monitoring ...................................................... 6 1) Conventional Pollutants ..................................................... 7 2) Priority Pollutants ............................................................ 11 3) Whole Effluent Toxicity .................................................... 20
2. FACILITY ANNUAL REPORT UPDATES ................. 22
a. WASTEWATER FACILITY STATUS ............................ 23 1) Master Planning/Facility Property Management .............. 23 2) General Facility Status .................................................... 24 3) Operational Assessment .................................................. 27 4) Plant Infrastructure / Asset Management ....................... 31 5) Personnel ......................................................................... 35 6) Finance ............................................................................ 36
b. O&M MANUAL UDATE ............................................... 40
c. CONTINGENCY PLAN UPDATE ................................. 40
d. PERMIT REISSUANCE - 2014 .................................... 41
3. ENVIRONMENTAL MONITORING ........................... 42
a. Avian Botulism Monitoring ........................................ 42
b. South Bay Monitoring ................................................ 42
c. Pond A18 Monitoring ................................................. 48
ATTACHMENT A - Laboratory Accreditation .............. 1
ATTACHMENT B – August 2014 TRE Report ............... 3
1
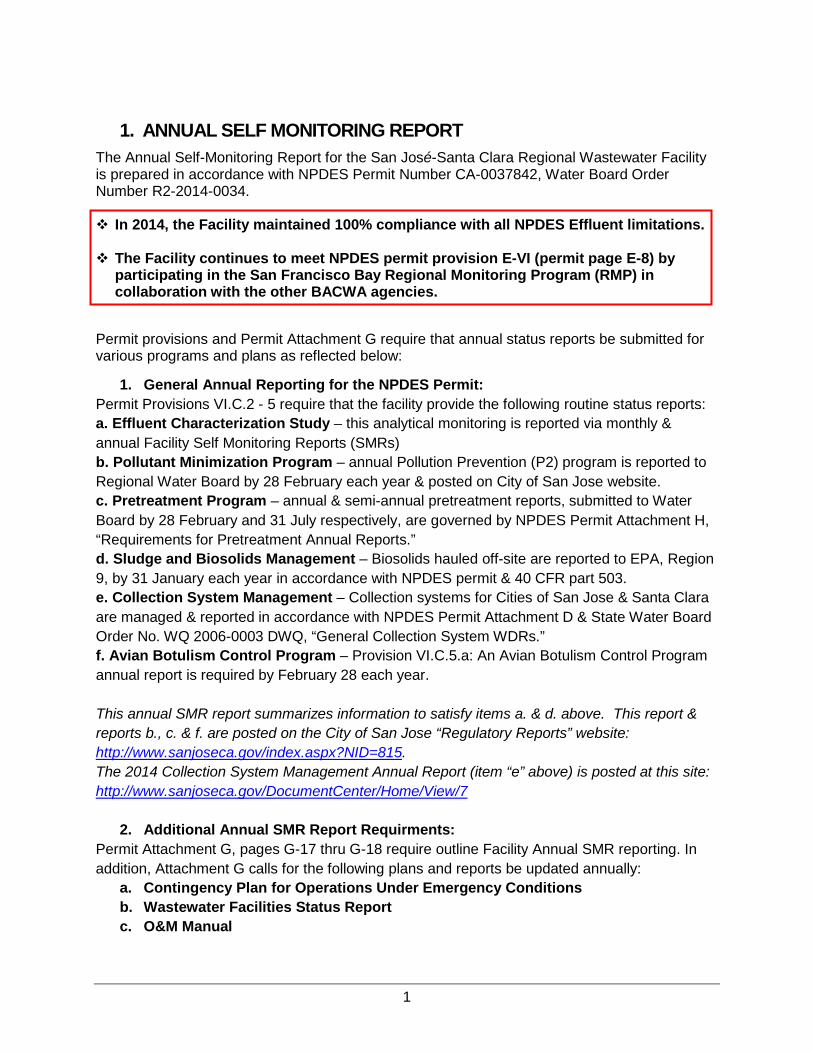
1. ANNUAL SELF MONITORING REPORT The Annual Self-Monitoring Report for the San José-Santa Clara Regional Wastewater Facility is prepared in accordance with NPDES Permit Number CA-0037842, Water Board Order Number R2-2014-0034. In 2014, the Facility maintained 100% compliance with all NPDES Effluent limitations.
The Facility continues to meet NPDES permit provision E-VI (permit page E-8) by
participating in the San Francisco Bay Regional Monitoring Program (RMP) in collaboration with the other BACWA agencies.
Permit provisions and Permit Attachment G require that annual status reports be submitted for various programs and plans as reflected below:
1. General Annual Reporting for the NPDES Permit: Permit Provisions VI.C.2 - 5 require that the facility provide the following routine status reports: a. Effluent Characterization Study – this analytical monitoring is reported via monthly & annual Facility Self Monitoring Reports (SMRs) b. Pollutant Minimization Program – annual Pollution Prevention (P2) program is reported to Regional Water Board by 28 February each year & posted on City of San Jose website. c. Pretreatment Program – annual & semi-annual pretreatment reports, submitted to Water Board by 28 February and 31 July respectively, are governed by NPDES Permit Attachment H, “Requirements for Pretreatment Annual Reports.” d. Sludge and Biosolids Management – Biosolids hauled off-site are reported to EPA, Region 9, by 31 January each year in accordance with NPDES permit & 40 CFR part 503. e. Collection System Management – Collection systems for Cities of San Jose & Santa Clara are managed & reported in accordance with NPDES Permit Attachment D & State Water Board Order No. WQ 2006-0003 DWQ, “General Collection System WDRs.” f. Avian Botulism Control Program – Provision VI.C.5.a: An Avian Botulism Control Program annual report is required by February 28 each year. This annual SMR report summarizes information to satisfy items a. & d. above. This report & reports b., c. & f. are posted on the City of San Jose “Regulatory Reports” website: http://www.sanjoseca.gov/index.aspx?NID=815. The 2014 Collection System Management Annual Report (item “e” above) is posted at this site: http://www.sanjoseca.gov/DocumentCenter/Home/View/7
2. Additional Annual SMR Report Requirments: Permit Attachment G, pages G-17 thru G-18 require outline Facility Annual SMR reporting. In addition, Attachment G calls for the following plans and reports be updated annually:
a. Contingency Plan for Operations Under Emergency Conditions b. Wastewater Facilities Status Report c. O&M Manual

2
Facility Map
Facility Storm Water Conveyance System
The treatment facility is designed to capture all spills and stormwater on site. 20 stormwater collection systems convey flows to 6 pump stations. Stormwater pump stations direct all captured water back to facility headworks for treatment. The stormwater catch basin system has capacity to contain at least several hundred thousand gallons of spilled process waters if such an event occurs.
Water Pollution Control Plant: flow routing and influent and effluent sampling stations. The wastewater treatment process consists of screening, grit removal, primary sedimentation, secondary (biological nutrient removal) treatment, secondary clarification, filtration, disinfection, and dechlorination.

3
Facility Service Area. The Facility receives wastewater from roughly 1.4 million residents and more than 17,000 commercial and industrial facilities. The City of San Jose manages the San José -Santa Clara Regional Wastewater Facility for the following Cities or agencies:
• San José, • Santa Clara, • Milpitas, • Cupertino Sanitary District, • County Sanitation Districts 2-3, and • Burbank Sanitary District, and • West Valley Sanitation District (Campbell, Los Gatos, Monte Sereno, and Saratoga)
Did water quality actually improve as population increased? Since beginning operations in November 1956, the facility underwent three major expansions or improvements. Secondary treatment was added in 1964, nitrification and filtration facilities went on-line in February 1979, and finally in 1997, the secondary and nitrification processes were hybridized into a four-stage “BNR” nutrient removal process. Despite population growth adding over a million more people to the area, the quality of water flowing from the Facility is cleaner than ever.
San Jose
Milpitas
West Valley
Cupertino
Santa Clara
SJ-SC RWF
Yes!

4
a. Facility Flows - 2014 Daily average Effluent flows for 2014 are shown in the table below. The peak average monthly effluent flow of 90.6 MGD occurred in February 2014. 2014 was a drought year marked by one exceptional 11-12 December “Storm of the Decade” that elevated the highest daily average effluent flow to 158.4 MGD, (192 MGD between 10:00 AM to 09:00 AM the following day) a volume not seen since 2011.
• Average Dry Weather Influent Flow (ADWIF) is the highest five-weekday period from June through October. The 2014 ADWIF was 108.0 MGD and occurred 14-18 July 2014.
• Average Dry Weather Effluent Flow (ADWEF) is the lowest average Effluent flow for any three consecutive months between the months of May and October. For 2014, ADWEF was 76.0 MGD and occurred during the months of July to September.
Facility Effluent continued a long-term decreasing trend. Effluent flows are equivalent to those measured in the mid 1970s.
Influent Flow
Effluent Flow (MGD) (Recent Years)
ADWIF Limit = 167 MGD
ADWEF Limit = 120 MGD
Average Low High Average ADWIF ADWEF 2012 107.2 76.4 132.3 93.6 111.4 85.3
2013 106.9 75.6 107.8 88.9 110.3 82.3
2014 101.7 57.5 158.4 84.0 108.0 76.0
0
20
40
60
80
100
120
140
160
180
Flow
(MG
D)
Daily Average Flow 2003-2014
Influent Effluent
- Peak Wet Weather Flow Design Capacity = 271 MGD - Average Dry Weather Influent Flow Design Capacity = 167 MGD - Average Dry Weather Effluent Flow Trigger = 120 MGD

5
b. Biosolids and material Roughly one million gallons per day (1 MGD) of digester effluent flows to the Residual Sludge Management (RSM) area. Digester effluent contains 2% solid material after 2 to 3 weeks of anaerobic digestion. The wet digester effluent is pumped to sludge lagoons where it consolidates for 3 to 4 years. After the consolidation phase the material is pumped to drying beds for one drying season. The dried material is hauled by truck to the adjacent Newby Island Landfill where biosolids are used as Alternate Daily Cover.
The two CAT 963 track loaders, purchased in 2013, lacked enough hydraulic power to rotate auger-heads as Biosolids reached a semi-dry state, therefore, the CATs were returned to manufacturer for not meeting contract specifications. Old “SCAT” machines were temporarily returned to service until two new FECON FTX-600 Mulching Tractors were procured in August 2014. The FECON mulchers, commonly used for forestry mulching, have the extra power to churn dried Biosolids. Because biosolids were processed using the old SCATs for several months, the concentrations of Diesel Range Organics (DRO) and Organic Range Organics (ORO) in Biosolids was again slightly elevated in 2014.
Biosolids Hauled Truck
Loads Wet Tons
Total Solids
Volatile Solids
Dry Metric Tons -DMT
2012 4723 75,570 92% 21% 62,934 2013 4057 72,882 89% 23% 58,844 2014 3131 53,405 93% 26% 45,057
Grit, Grease, and Screenings. Grit and screenings are collected near the headworks facility. Grease is floating material that is accumulated in the primary and secondary clarifiers. These materials are partially dewatered prior to being hauled to the local landfill.
Grit, Grease, & Screenings Hauled (Tons)
Grit Grease Screenings 2012 436 576 577 2013 351 591 642 2014 447 501 607
Concentrations in Biosolids (mg/kg)
2012 2013 2014
Antimony ND ND ND
Arsenic 2.6 3.3 3.0
Barium 178 210 395
Beryllium ND ND ND
Cadmium 1.3 ND 2.2
Chromium 122 42 94
(Cr STLC) 1.8 N/A 1.3
Cobalt 23 7.7 15
Copper 238 180 365
(Cu STLC) N/A N/A 6.0
Lead 17 15 31
Mercury 0.69 0.89 1.5
Molybdenum 5.1 3.9 8.2
Nickel 88 41 85
Selenium 2.4 ND 3.1
Thallium ND ND ND
Vanadium 88 32 64
Zinc 360 300 570
Cyanide 1.4 2.2 2.5
Xylene ND ND ND
DRO organics 10-22 1200 19 620
ORO organics 22-44 4830 34 3700
FECON FTX-600 Mulching Tractor with older auger-head

6
c. Effluent Monitoring Monitoring requirements from NPDES Permit Table 4 and monitoring frequency specified in Table E-3 of attachment E (Monitoring and Reporting Program) are summarized below:
Effluent Limitations (From NPDES permit Table 4) Average Monthly Effluent
Limit (AMEL) Maximum Daily Effluent
Limit (MDEL) Frequency
CBOD5 (BOD may be substituted) 10 mg/l 20 mg/l Weekly
Total Suspended Solids (TSS) 10 mg/l 20 mg/l Weekly
Oil and Grease 5 mg/l 10 mg/l Quarterly
Total Ammonia, as N 3 mg/l 8 mg/l Monthly
Copper 11 ug/l 19 ug/l Monthly Nickel 25 ug/l 33 ug/l Monthly
Cyanide, Total 5.7 ug/l 13 ug/l Monthly
Dioxin - TEQ N/A 6.3 x 10⁻⁵ ug/l *(Interim) 2 x year Indeno (1,2,3-cd) Pyrene 0.049 ug/l 0.098 ug/l Quarterly
Instantaneous Minimum Instantaneous Max
pH 6.5 8.5 Daily
Total Chlorine Residual N/A 0.0 mg/l Hourly
Turbidity N/A 10 NTU Daily
Dissolved Oxygen 5.0 mg/l N/A Daily
30-day geometric mean Enterococcus Bacteria 35 CFU 5 x Week
Mercury & PCBs Watershed Permit. The effluent limits below are established in the Mercury and PCBs Watershed Permit, Permit # CA0038849, Order No. R2-2012-0096.
Effluent Limitations for Mercury & PCBs (Mercury & PCBs, Tables 5A & 5b) AMEL ug/l MDEL ug/l Annual Mass Frequency Mercury 0.025 0.027 0.8 kg/yr Monthly PCBs 0.00039 0.00049 N/A Quarterly
Nutrient Watershed Permit. Permit # CA0038873, Order No. R2-2014-0014, requires twice per month monitoring of the following compounds: Total Kjeldahl Nitrogen, Nitrate-Nitrite, Total Phosphorus, Soluble Reactive Phosphorus, Total Nitrogen (Calculated) - no limits are established.
Annual average calculations for water quality constituents are determined from monthly average
results except for constituents measured daily or multiple times per week. Non-detected values are substituted with corresponding Method Detection Level (MDL) values.
Tables and Graphs also substitute the MDL for non-detected results.

7
1) Conventional Pollutants
The 2014 NPDES Permit established effluent limitations for Biochemical Oxygen Demand (BOD), Total Suspended Solids (TSS), BOD & TSS Percent Removal, Oil & Grease, pH, Total Chlorine Residual, Turbidity, Total Ammonia, and Enterococcus bacteria. Dissolved oxygen (DO) in the receiving water cannot fall below 5.0 mg/L due to effluent discharges.
Loads for BOD, Ammonia, and TSS are calculated by multiplying each daily concentration by the corresponding daily average flow.
pH: Effluent pH ranged from 7.1 to 8.1 standard units (S.U.). This was within the Effluent Limits of 6.5 & 8.5 S.U.
Temperature: Average Effluent temperatures for 2014 ranged from 15.0 to 25.4o C and averaged 20.7o C.
Total Chlorine Residual: The Facility uses both continuous monitoring equipment and wet chemical analysis to monitor and prevent discharge of residual chlorine. In 2014, residual chlorine was not detected in final effluent at the outfall.
Enterococcus Bacteria: The Effluent Limit for Enterococcus is 35 colonies per 100 mL as a rolling 30-day geometric mean. Effluent enterococci concentrations ranged from 1.0 to 1.1 Colony Forming Units (CFU) per 100 mL and averaged 1.0 CFU during 2014.
Oil & Grease: For 2014, Oil and Grease measurements ranged from 0.7 to 1.4 and averaged 1.0 mg/l. This was within the Effluent Limits of 5 mg/l (AMEL) and 10 mg/l (MDEL).
Dissolved Oxygen: Dissolved oxygen (DO) concentrations in Effluent were above the receiving water Water Quality Objective of 5 mg/L throughout 2014. The 3-month rolling median value for DO percent saturation ranged from 73% to 83% in 2014. DO Concentrations 2014 Min = 5.0 mg/L Low High Average 2013 Average Effluent (mg/L) 6.2 8.6 7.0 7.1 Saturation (%) 70.5 96.0 80.0 78.9
8
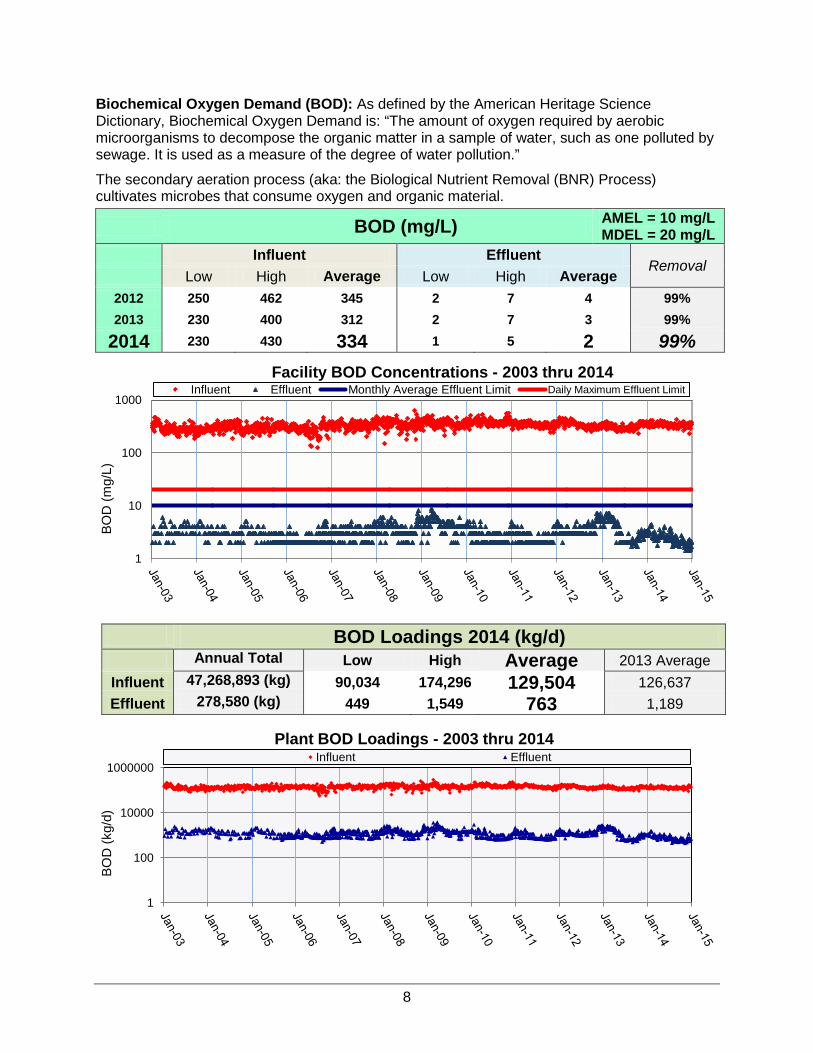
Biochemical Oxygen Demand (BOD): As defined by the American Heritage Science Dictionary, Biochemical Oxygen Demand is: “The amount of oxygen required by aerobic microorganisms to decompose the organic matter in a sample of water, such as one polluted by sewage. It is used as a measure of the degree of water pollution.”
The secondary aeration process (aka: the Biological Nutrient Removal (BNR) Process) cultivates microbes that consume oxygen and organic material.
BOD (mg/L) AMEL = 10 mg/L MDEL = 20 mg/L
Influent Effluent Removal
Low High Average Low High Average 2012 250 462 345 2 7 4 99% 2013 230 400 312 2 7 3 99%
2014 230 430 334 1 5 2 99%
BOD Loadings 2014 (kg/d) Annual Total Low High Average 2013 Average
Influent 47,268,893 (kg) 90,034 174,296 129,504 126,637 Effluent 278,580 (kg) 449 1,549 763 1,189
1
10
100
1000
BOD
(mg/
L)
Facility BOD Concentrations - 2003 thru 2014 Influent Effluent Monthly Average Effluent Limit Daily Maximum Effluent Limit
1
100
10000
1000000
BOD
(kg/
d)
Plant BOD Loadings - 2003 thru 2014 Influent Effluent

9
Total Suspended Solids (TSS): TSS is a measure of solid material suspended in water. Suspended solids settle out of the water column throughout the Facility treatment train: roughly half is removed in Primary settling tanks and another 40 to 45 percent is removed in Secondary/BNR clarifiers. The final 10 to 20 mg/L are removed by tertiary filtration. This was demonstrated in November 2006 during partial filtration by-pass while new filter influent pumps were installed. Effluent TSS and Turbidity increases at that time are shown in the graphs below.
TSS (mg/L) AMEL = 10 mg/L MDEL = 20 mg/L
Influent Effluent Removal Low High Average Low High Average 2012 228 436 286 1.0 3.1 1.7 99.4% 2013 189 364 279 0.5 3.7 1.6 99.4% 2014 181 422 292 0.3 2 1.0 99.6%
TSS Loadings 2014 (kg/d) Annual Total Low High Average 2013 Average
Influent 41,279,286 (kg) 71,065 217,005 113,094 112,722 Effluent 124,392 (kg) 103 696 341 550
0.1
1
10
100
1000
TSS
(mg/
L)
Plant TSS Concentrations - 2003 thru 2014 Influent Effluent AMEL MDEL
1
100
10000
1000000
TSS
(kg/
d)
Facility TSS Loadings 2003 thru 2014 Influent Effluent

10
Turbidity:
Turbidity 2014 (NTU) High Limit = 10 NTU
Effluent Low High Average 2013 Average 0.6 2.3 1.0 1.5
Total Ammonia: Practically all ammonia is removed. Chloramination process adds some back.
Ammonia N (mg/l) AMEL = 3 MDEL = 8
Effluent Low High Average 2012 0.2 2.5 0.7 2013 0.5 2.0 0.7 2014 0.2 1.7 0.6
Ammonia Loadings 2014 (kg/d) Annual Total Low High Average 2013 Average
Influent 4,987,041 (kg) 10,292 18,243 13,663 13,552 Effluent 68,985 (kg) 70 577 189 285
0
2
4
6
8
10
12
Turb
idity
(NTU
)
Plant Turbidity Concentrations - 2003 thru 2014 Effluent Instantaneous Maximum
1
100
10000
1000000
Amm
onia
(kg/
d)
Plant Ammonia Loadings - 2003 thru 2014 Influent Effluent

11
2) Priority Pollutants The Facility is required to perform twice per year monitoring of the 126 priority pollutants listed in NPDES permit Table C of Attachment G. Most of these are organic compounds that are never detected in effluent. The Facility has specific effluent limitations for 6 priority pollutants: Copper, Nickel, Cyanide, Dioxin, Indeno (1,2,3-cd) Pyrene, and Mercury. 10 additional metals and a few organic compounds from the priority pollutant list are typically detected at concentrations below applicable Water Quality Objectives.
a) Priority Pollutants with Effluent Limitations Copper:
Copper (ug/L) AMEL = 11 ug/L MDEL = 19 ug/L
Influent Effluent Removal
Low High Average Low High Average 2012 98 528 160 1.81 6.16 3.14 98% 2013 98 1060 148 1.99 5.52 2.94 98%
2014 98 194 127 1.77 4.08 2.36 98% *On 10/2/2013 a high copper concentration in influent was measured at 1060 ug/L. This data point was excluded from the above calculations and the removal chart. A summary of the occurrence is in the 2013 Annual Report.
1
10
100
1000
Tota
l Cop
per (µg
/L)
Total Copper Removal Performance - 2003 thru 2014
AMEL Influent Effluent MDEL

12
Nickel:
Nickel (ug/L) AMEL = 25 ug/L MDEL = 33 ug/L
Influent Effluent Removal
Low High Average Low High Average 2012 6.59 73.6 10.39 5.13 8.60 6.13 41% 2013 8.50 20.0 10.52 3.70 7.76 5.22 50%
2014 6.84 13.3 10.13 3.42 6.75 5.09 50%
Cyanide: The Facility produces a small amount of cyanide from chloramination disinfection.
Cyanide (ug/L) AMEL = 5.7 ug/L MDEL = 14 ug/L
Influent Effluent Removal Low High Average Low High Average
2012 0.4 (ND) 1.7 (DNQ) 0.7 0.6 (DNQ) 8.4 2.2
NA 2013 0.4 (ND) 3.5 (DNQ) 0.9 0.8 (ND) 2.8 1.9
2014 0.5 (ND) 2.2 (DNQ) 1.3 0.8 (ND) 2.6 1.9
1
10
100
Tota
l Nic
kel (µg
/L)
Total Nickel Removal Performance - 2003 thru 2014 AMEL MDEL Influent Effluent

13
Mercury: Mercury (ug/L) AMEL = 0.025 ug/L
Influent Effluent Annual Load Kg/yr Low High Average Low High Average
2012 0.087 0.184 0.123 0.00101 0.00275 0.00146 0.186
2013 0.076 0.136 0.108 0.00110 0.00214 0.00142 0.177
2014 0.056 0.199 0.103 0.00073 0.00170 0.00100 0.132
Individual effluent mercury concentrations and flows in 2014 Sample Date Mercury concentration (ug/L) Effluent Flow (MGD) Mercury Load (kg/day)
1/7/14 0.00138 87.4 0.00046 2/5/14 0.00143 85.1 0.00046 3/4/14 0.00123 94.4 0.00044 4/4/14 0.00106 90.8 0.00036 5/1/14 0.00170 83.2 0.00054 6/2/14 0.00120 82.3 0.00037 7/2/14 0.00090 77.3 0.00026 8/5/14 0.00073 76.0 0.00021 9/4/14 0.00074 75.5 0.00021 10/2/14 0.00081 78.0 0.00024 11/4/14 0.00088 83.2 0.00028 12/3/14 0.00101 126.1 0.00048
Dioxin-TEQ: The 2014 NPDES Permit established an interim Effluent concentration limit for Dioxin-TEQ (toxic equivalence) of 6.3 x 10⁻⁵ ug/l and a monitoring frequency of twice per year. None of the 17 dioxin congeners were detected in Facility Effluent in 2012, 2013 or 2014.
0.0001
0.001
0.01
0.1
1
10
Tota
l Mer
cury
(µg/
L)
Influent Effluent AMEL
Total Mercury Removal Performance - 2003 thru 2014

14
b) Priority Pollutant Metals
Arsenic:
Arsenic (ug/L) WQO = 36 ug/L Influent Effluent
Removal Low High Average Low High Average
2012 1.39 2.86 1.77 0.66 1.41 .091 49% 2013 1.64 2.52 2.13 0.84 1.32 1.04 51%
2014 1.98 2.99 2.37 0.90 1.49 1.16 51%
Cadmium:
Cadmium (ug/L) WQO = 7.3 ug/L Influent Effluent
Removal Low High Average Low High Average
2012 0.12 (DNQ) 0.46 0.26 0.010 (ND) 0.029 (DNQ) 0.020 92% 2013 0.18 (DNQ) 0.30 0.023 0.013 (ND) 0.026(DNQ) 0.020 92%
2014 0.06 (DNQ) 0.26 0.18 0.010 (ND) 0.020(DNQ) 0.020 91%
0.1
1
10
100
Tota
l Ars
enic
(µg/
L)
Arsenic Removal Performance - 2003 thru 2014 Influent Effluent Water Quality Objective
0.001
0.01
0.1
1
10
100
Tota
l Cad
miu
m (µ
g/L)
Cadmium Removal Performance - 2003 thru 2014 Influent Effluent Water Quality Objective

15
Total Chromium (substituted for Hexavalent Chromium): The 2014 NPDES Permit allows measurement of total chromium instead of hexavalent chromium in Facility Effluent.
Chromium (ug/L) WQO = 200 ug/L Influent Effluent
Removal Low High Average Low High Average
2012 3.60 203* 5.70 0.33 0.65 0.45 92% 2013 2.78 6.63 5.23 0.38 0.62 0.47 91%
2014 5.02 9.05 6.19 0.42 0.68 0.51 92% *A single unusually high influent concentration was detected on 26 March, 2012. Effluent concentrations were unaffected.
Selenium:
Selenium (ug/L) WQO = 5 ug/L Influent Effluent
Removal Low High Average Low High Average
2012 1.29 4.65 1.93 0.30 0.58 0.45 77% 2013 1.37 3.18 1.96 0.39 0.55 0.48 76%
2014 1.36 2.46 2.02 0.36 0.69 0.50 75%
0.1
1
10
100
1000
Tota
l Chr
omiu
m (µ
g/L)
Chromium Removal Performance - 2003 thru 2014 Influent Effluent Cr(VI) Water Quality Objective
0.1
1
10
100
Tota
l Sel
eniu
m (µ
g/L)
Total Selenium Removal Performance - 2003 thru 2014 Influent Effluent Water Quality Objective

16
Silver: Silver (ug/L) WQO = 2.2 ug/L Influent Effluent
Removal Low High Average Low High Average 2012 0.31 2.06 0.90 0.030 (ND) 0.045 (DNQ) 0.029 95% 2013 0.52 1.37 0.80 0.007 (DNQ) 0.069 (DNQ) 0.021 97%
2014 0.52 1.24 0.81 0.004 (ND) 0.030 (DNQ) 0.01 98%
Zinc:
Zinc (ug/L) WQO = 170 ug/L Influent Effluent
Removal Low High Average Low High Average
2012 153 434 183 18.0 30.3 23.1 87% 2013 144 261 182 19.0 30.8 22.1 88%
2014 163 239 184 16.9 23.0 19.0 90%
0.001
0.01
0.1
1
10
100
Tota
l Silv
er (µ
g/L)
Total Silver Removal Performance - 2003 thru 2014 Influent Effluent Water Quality Objective
1
10
100
1000
10000
Tota
l Zin
c (µ
g/L)
Total Zinc Removal Performance - 2003 thru 2014 Influent Effluent Water Quality Objective

17
Lead: Lead (ug/L) WQO = 135 ug/L Influent Effluent Removal Low High Average Low High Average
2012 1.97 18.0* 4.98* 0.11 0.89 0.27 95%* 2013 2.18 35.2 6.41 0.12 2.62 0.35 94%
2014 1.95 4.95 2.83 0.06 0.38 0.14 95% *On 3/16/12, an anomalously high lead concentration in influent was measured at 266,000 ug/L. This data point was excluded from the above calculations and the removal chart.
c) Non-Priority Metals Antimony:
Antimony (ug/L) WQO = 640 Effluent Removal Low High Average
2012 0.33 0.46 0.39 NA 2013 0.32 0.49 0.41
2014 0.32 0.49 0.40 Beryllium: Literature suggests chronic toxicity of beryllium may be as low as 5.3 ug/L.
Beryllium (ug/L) WQO = NA Effluent Removal Low High Average
2012 0.005 (ND) 0.0085 (ND) 0.005 NA 2013 0.005 (ND) 0.0100 (ND) 0.007
2014 0.005 (ND) 0.0270 (ND) 0.014 Thallium:
Thallium (ug/L) WQO = 6.3 (CTR) Effluent Removal Low High Average
2012 0.002 (ND) 0.067 (DNQ) 0.032
NA 2013 0.004 (ND) 0.700 0.147
2014 0.004 (ND) 0.36 0.096
0.1
1
10
100
1000
Tota
l Lea
d (µ
g/L)
Total Lead Removal Performance - 2003 thru 2014 Influent Effluent Water Quality Objective

18
d) Organics
Organic priority pollutants are measured semi-annually in Effluent: March and September each year. Of 113 compounds analyzed, only two were detected in Facility Effluent in 2014.
Volatile Organic Compounds (VOCs): Two VOCs were detected in Effluent in 2013. Both VOCs were well below California Toxic Rule (CTR) Water Quality Objectives (WQO).
Volatile Organic Compounds (ug/L) March 2014 September 2014 CTR WQO Chloroform 4.5 2.8 470
Dichlorobromomethane 3.0 1.4 46
Semi-Volatile Organic Compounds: No semi volatile organic compounds were detected in Facility Effluent in 2014. Legacy Pesticides: No legacy pesticides were detected in Effluent in 2014. Polynuclear Aromatic Hydrocarbons (PAHs): No PAH compounds were detected in 2014. Polychlorinated biphenyls (PCBs): In accordance with the Mercury and PCBs Watershed Permit, Permit # CA0038849, reissued as Order No. R2-2012-0096, PCBs are measured semi-annually as total aroclors using USEPA method 608 for regulatory compliance. PCBs were not detected using this method. The Facility is also required to measure total PCBs by congener using USEPA Proposed Method 1668c once per quarter for information only. Method 1668c data were collected in March, June, September, and December. PCBs congeners are analyzed and reported as the sum of a subset of 40 congeners (known as the “SFEI 40”) plus co-elutes. The SFEI 40 provided the basis for the impairment and loads assessments in the San Francisco Bay PCBs
TMDL approved by the EPA in 2010. PCBs as congeners were not quantified in March, June, and December samples in 2014. The initial effluent sample from 4 September 2014 was unusually high for lighter congeners, indicative of an airborne source. This prompted analysis of both the duplicate sample from that day, and a backup sample collected on 5 September 2014. Both duplicate and back-up sample results were DNQ or ND for all congeners. The duplicate sample was averaged with the initial sample and the sum of quantified PCBs congeners was 228.4 pg/L. Since April 2011, only three of 17 sampling events have quantified any PCBs congeners.
19
e) Nutrients
Effluent Nutrient Loadings in 2014
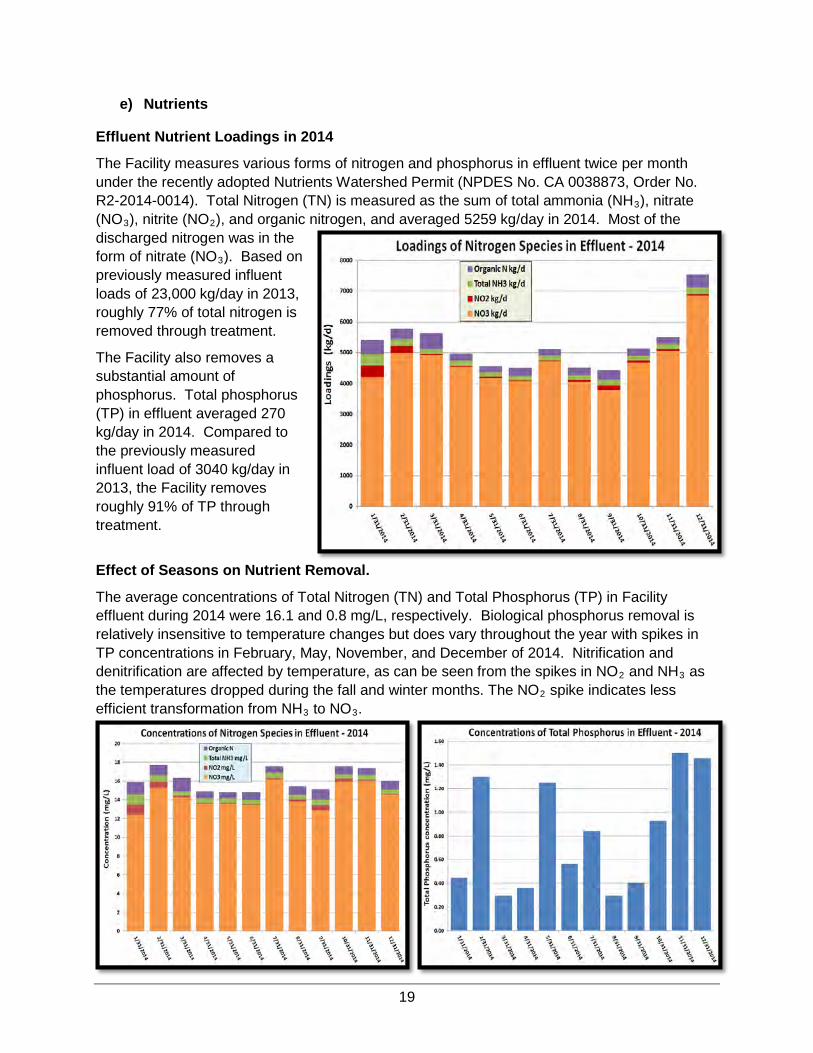
The Facility measures various forms of nitrogen and phosphorus in effluent twice per month under the recently adopted Nutrients Watershed Permit (NPDES No. CA 0038873, Order No. R2-2014-0014). Total Nitrogen (TN) is measured as the sum of total ammonia (NH3), nitrate (NO3), nitrite (NO2), and organic nitrogen, and averaged 5259 kg/day in 2014. Most of the discharged nitrogen was in the form of nitrate (NO3). Based on previously measured influent loads of 23,000 kg/day in 2013, roughly 77% of total nitrogen is removed through treatment.
The Facility also removes a substantial amount of phosphorus. Total phosphorus (TP) in effluent averaged 270 kg/day in 2014. Compared to the previously measured influent load of 3040 kg/day in 2013, the Facility removes roughly 91% of TP through treatment.
Effect of Seasons on Nutrient Removal.
The average concentrations of Total Nitrogen (TN) and Total Phosphorus (TP) in Facility effluent during 2014 were 16.1 and 0.8 mg/L, respectively. Biological phosphorus removal is relatively insensitive to temperature changes but does vary throughout the year with spikes in TP concentrations in February, May, November, and December of 2014. Nitrification and denitrification are affected by temperature, as can be seen from the spikes in NO2 and NH3 as the temperatures dropped during the fall and winter months. The NO2 spike indicates less efficient transformation from NH3 to NO3.

20
3) Whole Effluent Toxicity Acute Toxicity: The Regional Wastewater Facility once again saw no acute toxicity in its Final Effluent (FE) in 2014 using Rainbow Trout that are exposed to FE for 96 hours under flow-through conditions. No test result (n=10) had a survival rate of less than 90%, which is the more sensitive of two endpoints evaluated. The Facility has never violated Acute Toxicity limits in its 26-year history of flow-through testing. Under the Facility’s 2014 reissued NPDES Permit, acute toxicity testing will now be performed quarterly rather than monthly. Revised acute toxicity limits were issued to account for the less frequent testing schedule: a.) single-sample maximum of not less than 70% survival, and b.) 3-sample median test result of not less than 90% survival.
Chronic Toxicity: The Facility conducts monthly chronic toxicity testing using Ceriodaphnia dubia (water flea). This test has been used uninterruptedly at the Facility since the early 1990s. The test evaluates the reproduction of animals exposed to Facility FE. Chronic Toxic Units (TUc) are calculated for each test by dividing the highest concentration tested (100%) by the test IC25 (the calculated concentration at which reproduction in effluent is reduced or inhibited by 25% compared to test control animals). A TUc which is greater than one indicates a toxic effect in FE. Accelerated testing of twice per month is triggered if the 3-sample median value is greater than 1 TUc or a single sample result greater than or equal to 2 TUc.
The Facility detected a chronic toxic effect (reproductive inhibition) in Final Effluent 33 times over 21 years, 21 of these occasion occurred since 2009. In 2014, the toxic effect of recent years declined dramatically: only a single test failure in February 2014 compared to seven failures in 2013.
In late 2011, the Facility Laboratory discovered an unusual phenomenon in test animals exposed to Facility FE. On some days, the composite samples used during a 6-8 day test caused paralysis in test animals. Usually the paralysis was reversible and unless the animals were exposed to consecutive daily paralysis-inducing samples, the paralysis did not cause inhibition of reproduction which would cause the normal chronic toxicity test to fail. The Laboratory began recording paralysis observations by implementing a 0-4 numerical evaluation system, with a score of 4 representing complete paralysis.
The frequency of paralysis in FE also decreased sharply from 2013 to 2014. Severe paralysis (score of 3.1 to 4.0, on the 4-point scale) decreased from 17% of samples in 2012, to 8% in 2013, to 2% in 2014. The number of samples showing no paralysis increased from 25% in 2013 to 66% in 2014, a sudden, significant, and unanticipated change.
Ceriodaphnia
Rainbow Trout

21
Following the year’s single chronic toxicity test failure in February 2014, archived FE samples from the test were screened using paralysis monitoring to evaluate the source and nature of toxicity. Six TIE type manipulations/evaluations were performed. TIE results indicated that very rigorous clinoptilolite (zeolite) extractions could lessen or remove paralysis. A chemical compound, or combination of compounds, that sorbs to zeolite may be contributing to paralysis. Nonetheless, it was hoped that paralysis might provide a clue about periodic chronic toxicity test failures. A collaborative study was developed in early 2014 to determine the utility of tracking the paralysis-causing agent(s) upstream. Normally, it is advantageous to first determine the cause of toxicity before attempting to locate its source. However, the 24-hour paralysis evaluation procedure developed by the lab allowed for potential quick and inexpensive upstream paralysis tracking. Initially Source Control samples from industry and businesses and Influent trunk lines were monitored. These efforts were thwarted by the rather sudden disappearance of toxicity and paralysis in effluent samples and a concomitant significant lowering of paralysis in influent samples. In 2014, the Facility completed its second TRE in its 21-year history of conducting chronic toxicity testing. After October 2014, facility effluent is no longer showing any indication of chronic or even sub-chronic toxicity. TIE efforts will continue if and when the Facility again indicates chronic toxicity or paralysis in Final Effluent. After much investigation, the cause of a toxic effect appears to be a hydrophilic organic compound whose toxicity is ameliorated by a co-occurring hydrophobic organic compound. Clinoptilolite (zeolite) and other solid-phase extraction techniques appear to have some ability to ameliorate the observed toxicity/paralysis which, after October, seems to have temporarily disappeared.

22
2. FACILITY ANNUAL REPORT UPDATES
The following annual update reports are submitted in accordance with NPDES Permit Attachment G.
a. Wastewater Facilities Status Report b. Operations & Maintenance Manual (O&M Manual) Update c. Contingency Plan for Operations Under Emergency Conditions

23
a. WASTEWATER FACILITY STATUS NPDES Permit Attachment G requires annual update of Wastewater Facilities Status. This encompasses major wastewater facility operations or capital improvements over the past year. Activities that involve planning, assessing, and upgrading Facility assets are divided into six areas: 1) Master Planning/Property Management, 2) General Facility Status, 3) Operational Assessment, Infrastructure/Asset Management, Personnel, and Finance.
1) Master Planning/Facility Property Management The Plant Master Plan Environmental Impact Report (EIR) was adopted by the City Councils of San José and Santa Clara in November and December of 2013, respectively. The Master Plan is now in the implementation phase.
South Bay Shoreline Study. City staff continues to work with project sponsors of the South San Francisco Bay Shoreline Study: the US Army Corps of Engineers, the California Coastal Conservancy, and the Santa Clara Valley Water District. The study envisions a flood protection levee along the northerly boundary of the Plant’s operational area. At this time, the future levee will stretch from the Union Pacific railroad line north of Alviso to the west, cut across Artesian Slough, and follow the southern and eastern boundary of salt pond A18 before terminating in the north near the Coyote Creek bypass channel. Construction of this levee will be coordinated with Plant Master Plan.
Burrowing Owl Habitat. The Western Burrowing Owl is a State of California Species of Special Concern. In June 2013, RWF staff continued with habitat improvements for Burrowing Owls in the RWF bufferlands by expanding the managed area eastward into almost the entire 180-acre owl habitat preserve. Post-breeding season surveys indicate that owl numbers are increasing on-site. Additional surveys are planned before and after the 2015 breeding season.
Partnered Developments on Facility Bufferlands.
• Silicon Valley Advanced Water Purification Center (SVAWPC). SVAWPC, began operations on March 24, 2014, and was commissioned for full operation in June after three months of testing to demonstrate no significant toxicity in the Reverse Osmosis (RO) reject water. The joint project by Santa Clara Water District and the City of San José has been functioning at full capacity, producing up to 10 MGD of purified water for blending into the existing South Bay Water Recycling pipeline to improve the overall quality of recycled water. Wastewater produced by the SVAWPC has been meeting City influent water quality standards, and staff is currently reviewing the potential next step of reducing headwork loading and diverting the RO reject water into the final disinfection treatment stage at the serpentine channel of the wastewater facility.
• Zero Waste to Energy Development (ZWED). The ZWED facility began accepting organic waste streams from commercial establishments in December 2013. ZWED is processing waste through a dry fermentation anaerobic digestion system to generate bio-methane for conversion to electricity. The facility is preparing for a combined Phase II and III expansion, in order to begin accepting additional organic waste streams, with an approximate timeframe of 2017.

24
2) General Facility Status
a) Capital Improvement Program Semiannual Status Reports
Beginning in June 2013, the San Jose-Santa Clara Regional Wastewater Facility began publishing and posting to the City of San Jose website semiannual status reports to update the status of the CIP program. The most recent report, covering January – June 2014, and monthly status updates are posted here: http://www.sanjoseca.gov/Archive.aspx?AMID=190 or use simplified web address http://sjenvironment.org/cip
An easy way to find the reports without the web link is to google the words: “San Jose Wastewater CIP”; the top hits will take you to the San Jose website and the reports themselves in pdf format.
b) Power
The Facility generates about half of its own power from methane gas that is produced from the digesters. The digester gas is blended with a smaller portion of natural gas from PG&E and used as fuel for Engine Generators (E-1 through E-6, and EG-1 through EG-3) and the 1.4MW Fuel Cell to produce electricity. The blend gas is also used as fuel for the facility’s six Cooper-Bessemer Engine Blowers (A-1 through B-3) located in the Secondary Blower Building. The remainder of the power demand is supplied as electricity purchased off the grid from PG&E.
Generators & Fuel Cell. In 2013, all six Engine Generators and the Fuel Cell were available for use throughout the year until December.
• In December, EG-1 suffered a shorted rotor in the generator portion of the unit and was taken out of service. Vendors are being evaluated. This two to three month repair should be accomplished by mid-2015.
• The fuel cell was brought back on line in January and was operational with only short-duration gaps in service due to minor component failure.
• Contract was awarded to Anderson Pacific to construct a backup generator building with four, Tier 4I, 3 MW diesel generators. Construction began in September 2014 and the four generators are on order. The building and generators are scheduled to be complete in Fall 2016.
Blowers: The Facility’s six engine-driven blowers (Cooper-Bessemer) and eight electric blowers are all ready for use. Under most normal conditions, only two blowers each (4 total) are needed to provide low pressure air to the Secondary and Nitrification BNR aeration basins.
The three large capacity electric blowers in Building 40 are generally not used due to the high electrical cost, but each one is periodically brought on line for up to two weeks for startup testing

25
and staff training. Energizing one of these 4,000 blowers requires that two of the 2,800KW engine-generators be on-line to absorb the surge in power demand.
Energy Management and AB 32 Regulation. As a result of California law, AB 32, Cap and Trade air emission regulations came into effect on January 1st 2013. The rules require the purchase of carbon credits by any electric power plant, industrial plant, or fuel distributer who emits more than 25,000 metric tons of carbon dioxide per year. The SJ-SC Regional Wastewater Facility is one of the estimated 360 businesses in California affected by this rule. In late 2012, the facility's large gas holder failed, impacting the ability to regulate the use of digester gas, and a supply of landfill gas was no longer available. This reduced the facility's use of renewable gas from close to 90 percent, to 75-80 percent. In 2013, the RWF's emissions exceeded the threshold, with emissions of 25,029 MT CO2e. The facility purchased credits for about $300,000 per program requirements.
Facility staff have managed energy and emissions to stay below the threshold in 2014, and stayed within their operating budget. For the short term, this effort is an evolving balance of purchase of natural gas versus electricity from the grid, daily monitoring of emissions, and engine management. For the next compliance period, 2015-2017, the facility is aimed to manage to remain below the threshold, and pursue other sources of renewable energy. This will be coordinated with bringing the new cogeneration facility online.
The Facility aims to meet or exceed all regulatory targets and limits, especially those related to safety or the environment. The new air emission “Cap and Trade” regulation requires careful balancing of costs and risks to satisfy all requirements. However, wastewater facilities have no ability to stop operations or make significant adjustments to its energy requirements. The regulatory requirement that critical facilities such as the RWF should be subject to the Cap and Trade threshold should be reevaluated.

26
c) General Repairs and Replacement
The following general replacement projects were performed in 2014:
• Fire Main Replacement - Phase III. 60% of this project was completed in 2014. • Handrail Replacement - Phase V. Replacement of handrails in Secondary Area B-Side
is in progress and should be complete by Spring 2015. Handrails can only be installed while aeration tanks are empty, so this project is coordinated with overall fine bubble diffuser replacement in aeration basins in Nitrification and Secondary areas. In 2014, handrail replacement in the Secondary area was paused to maintain aeration capacity as fine bubble diffusers were replaced in Nitrification Area A from March through October. As handrail replacement is recommenced in the secondary area, basin fine bubble diffusers are replaced in those tanks as well.
• RWF Street Treatment – Phase III. Repaving of Center Street, from the Main Street intersection to Zanker Road, and First Street to Building 40, was completed in September. Street drainage was also improved.
• Building Painting: The following buildings were painted: o Digesters 11, 12, and 13 were painted at a cost of $20K each. o Four rooftop HVAC/Air Handling units were painted on the Environmental Service
Building (ESB) o The TEMPCO building was painted at a cost of $15K o In the RSM area, the truck scale and scale house, parking canopies, and two
storage buildings were painted at a cost of $60K.

27
3) Operational Assessment Facility operational status is monitored 24 hours a day by a Shift Supervisor and Computer Room Operator. The day-to-day operations are reviewed each week at a roundtable meeting of all Area Supervisors. This allows each Area Supervisor to point out changes to operational parameters and inform of potential impacts to other areas of Plant operations. Highlights of Facility operations in 2013:
a) Headworks
Facility headworks include both a new headworks area (Headworks 2 or HW2) an old headworks area (HW1) and an upstream Emergency Basin Overflow Structure (EBOS) that receives flow from the main interceptor lines. Each headworks unit consists of bar screens and grit removal chambers to capture and remove screenings and grit material.
• The newer HW2 operated from May through November in 2014. All three vortex grit classifiers continue to be run simultaneously when HW2 is in operation.
• The new Duperon Flex Rake continues to provide superior performance and reliability compared to the two traditional bar screens in HW2. A CIP project has been proposed to replace the remaining HW2 bar screens with Flex Rakes when opportunities allow.
• The newer HW2 was placed in standby and operated during the 11-12 December “Storm of the Decade.” As water level rose over the high water mark in the HW1 wet well, the excess was diverted to HW2. The HW2 bar screens were particularly useful in maintaining screening capacity as the HW1 bar screens reached capacity and had to be cleaned out.
b) Primary Clarifiers
The chopper pump that replaced one of the existing positive displacement scum pumps in 2013 provided superior performance. Over the next few years, as remaining pumps reach the end of their service life, they will be replaced with chopper pumps.
c) Digesters, Gas, & Sludge
Digester Status. There are 16 digesters that can process sewage sludge. Ten digesters, 1, 3, 9, 10, 11, 12, 13, 14, 15, and 16, are available for operations. Digesters 1 and 3 were cleaned from August through October. Exterior valves are being replaced and some lower elevation piping impacted by struvite is being removed before the two digesters are put back in service in 2015. 170 tons of screened material was collected and hauled away and 0.5 MG of water was used during the cleaning process.
HW2 bar screens: Duperon Flex Rake at left, two traditional bar screens on right.

28
• A break in a 12” sludge export line in October caused a slight delay, but otherwise the $260,000 cleaning project (cost includes lab testing and disposal costs) was completed without problems.
• Information about cost, time required, and volume of material recovered was compiled into a Maintenance SOP titled “Digester Cleaning Operations Summary (2006-2014).” This new SOP was added to the Facilty SOP library.
• Approximately 200 feet of digester gas piping was discovered to have corrosion damage that would lead to leaks. This piping was replaced in May.
• Two new “trash pumps” were installed in the Residual Sludge Management (RSM) area to pump digested sludge to the sludge lagoons at a cost of $75,000.
Digester Gas Compressors. • The Facility continues to rely upon old compressors CG-1, CG-3, and CG-4. • Contract was awarded to Anderson Pacific to construct a new digester gas compressor
building with two new compressors. Construction began June 2014. The building footing is complete. The new compressor building is scheduled to be operational in Summer 2016.
Digester Gas Holder. • The small gas holder continued to provide all digester gas storage in 2014. • The concrete slab foundation for a new 50,000 cubic foot, piston-type, dry-seal, gas
holder was poured in November 2014. The new unit will be assembled on-site in March 2015 and should be ready to accept gas by Summer.
Dissolved Air Flotation (DAF) System. DAF Tanks 11 and 12 were taken off line in March for a periodic rebuild/replacement. Chains, shafts, bearings, and sprockets were refurbished or replaced. This work will continue through mid-2015.
Work in progress on new digester gas compressor building – January 2015

29
d) Biological Nutrient Removal (BNR) The Biological Nutrient Removal (BNR) Process is carried out in two locations, historically referred to the “Secondary” and “Nitrification” areas. The two areas employ the same 4-stage BNR process and are run in parallel. Each area is in-turn divided into an “A-Side” and a “B-Side” which are physically separate to provide redundancy and protection against catastrophic failure that could damage the entire BNR process.
Secondary Area. All Secondary BNR basins were available for use in 2014. Aerobic quad tanks (quads 2 and 4) in aeration basins A-1 through A-4 and B-1 through B-4 are fitted with fine bubble diffusers. All other basins utilize less efficient, but durable, coarse bubble diffusers only.
• Fine bubble diffusers were replaced in aeration basin B-4 while the tanks were empty for handrail replacement. Fine bubble diffusers must be replaced every 3 years on average.
• Clarifiers B-4 and B-6 were sandblasted and painted by subcontractor Murphy Industrial at a cost of $123K per clarifier.
• The HVAC cooling tower at Secondary Blower Building was taken out of service for replacement. This unit services the building’s chiller unit. The $233,500 project was funded as a CIP project and partially performed by Facility Maintenance staff. The work should be completed early in 2015.
• Two overhead cranes in Secondary Blower Building A-Side broke down and required emergency repair. Preferred Aerial Crane was contracted for this $70K work which included installation of new motors for the trolley and bridge, a new wireless controller, and electrical panels and connectors to electrify the trolley rails. The hoist motor was also rebuilt.
• A new 150-hp compressor to supply high pressure (instrument air) was purchased for $77,000 and installed in late-2014. This compressor is now one of four available high pressure air compressors: one in service, one as backup, and two available if needed.
Nitrification Area. The aerobic quad tanks (quads 2 and 4) in all eight Nitrification BNR basins use fine bubble diffusers. The anaerobic quads have coarse bubble diffusers.
• Fine bubble diffusers were replaced in aerobic quads of the four A-Side aeration basins. This work put the entire Nitrification A-Side out of service from March through November 2014. Additional Secondary area aeration basins be placed in service to carry the load.

30
With the “A-Side” aeration basins out of service additional replacement work was performed to the A-side clarifiers.
• Influent valves and flow meters were replaced in clarifiers A5 and A6.
• Drain valves were replaced in aerator A7 first pass (quad 1).
• The 42-inch blower discharge valve for nitrification blower #5 was replaced between August and November. This valve had been frozen since 2008 and rendered the blower inoperable. The blower was back on line on 12 January 2015.
• Clarifiers A8, B6, and B8 were sandblasted and painted by Eurostyle at a cost of between $136K to $145K per clarifier. Clarifiers are generally rehabilitated every 10 to 15 years.
• A natural gas line in the Nitrification Building basement had become corroded and was replaced by maintenance staff.
e) Filtration & Disinfection
• Filter bed A-4, run with monomedia and steel drain plates, continues to perform as well as more expensive dual-media filters.
• Staff continues to draw recycled water to supplement process water supply (recirculated final effluent, aka “No. 3 Water”) until sufficient pump capacity is restored. In 2013, a hole was discovered in the cast iron volute (casing) of one of the two existing pumps. Decision was made to purchase and install two new 250 HP pumps along with a smaller pump to supplement Fire Loop pressure and provide low pressure (less than 4.0 GPM) process water. All three pumps will have variable frequency drives. Energy savings are expected to pay for the new pumps within 2 years. A bid package will be completed in Spring 2015.
• Two 12,500 gallon sodium hypochlorite day tanks and discharge fittings were replaced. The new tanks were in service in mid-2014.
Filter Building & Serpentine Tanks
31
4) Plant Infrastructure / Asset Management
Asset Management Group. The Asset Management Group oversees implementation of the Computerized Maintenance Management System (CMMS) and the Geographic Information System (GIS). CMMS. In June 2014, The ESD consultants MWH undertook the program for development of the Asset management Strategy. Various workshops involving the consultants and ESD/RWF staff responsible for development and implementation of the strategy were conducted. Upon completion of these workshops, a detailed report recommending direction and next steps was completed and is being reviewed.
The software vendor, Infor, has released a new version of the software (v11). The main features of this version is an improved work scheduling and planning module, enabling and ease of use of Mobile devices, and further enhancement in seamless integration between GIS and CMMS. Staff will be testing this new version and if successful, will implement the upgrade during 2015.
The CMMS system is currently tracking over 15000 vertical and linear assets and over 5000 inventory items. Preventative maintenance activities are in place for over 2,000 pieces of equipment, and are continually updated and fine tuned. Work and purchase orders are required to be generated through CMMS which allows the system to track and analyze labor and material costs. Asset tagging is being reevaluated to consider new technological advancement such as bar coding and GPS locating, in addition to testing new physical tags.
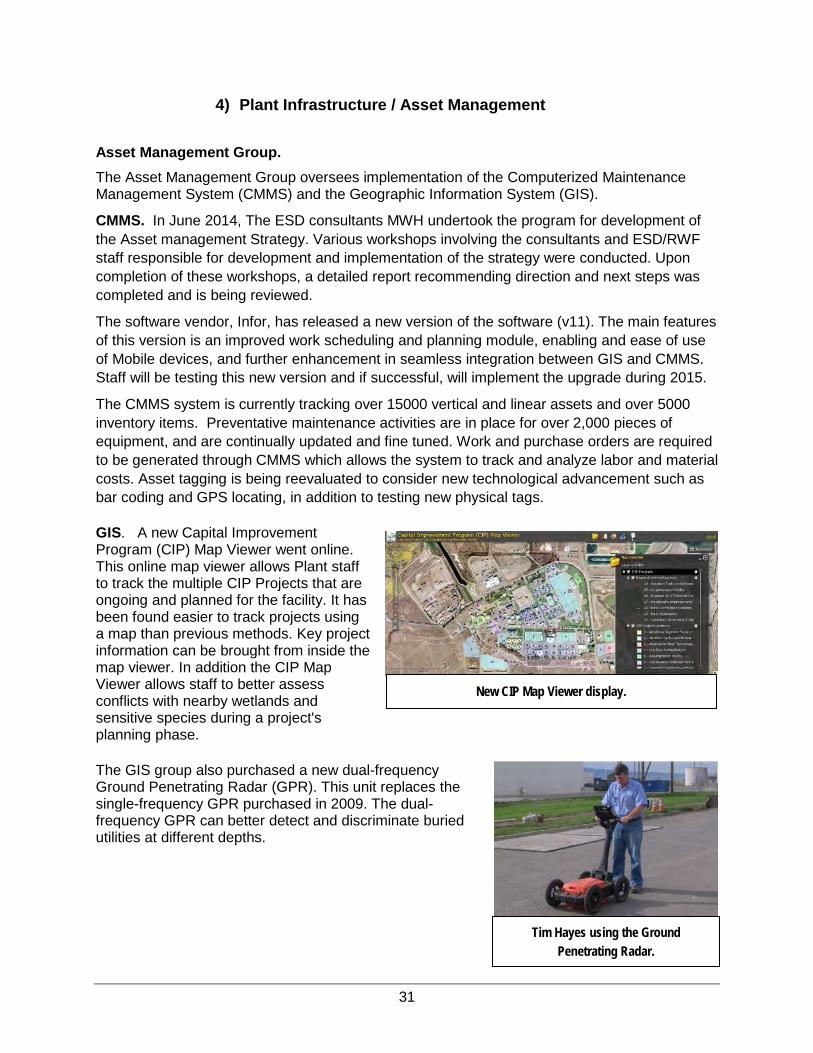
GIS. A new Capital Improvement Program (CIP) Map Viewer went online. This online map viewer allows Plant staff to track the multiple CIP Projects that are ongoing and planned for the facility. It has been found easier to track projects using a map than previous methods. Key project information can be brought from inside the map viewer. In addition the CIP Map Viewer allows staff to better assess conflicts with nearby wetlands and sensitive species during a project's planning phase.
The GIS group also purchased a new dual-frequency Ground Penetrating Radar (GPR). This unit replaces the single-frequency GPR purchased in 2009. The dual-frequency GPR can better detect and discriminate buried utilities at different depths.
New CIP Map Viewer display.
Tim Hayes using the Ground Penetrating Radar.

32
Planning for Floods and Sea Level Rise. GIS and CIP staff are coordinating an effort to survey site elevations and direct construction so that sensitive new equipment will be above the 100-year flood plain and above projected estimates of sea level rise over the design life of any new project. City of San Jose Public Works Department surveyors conducted a 20:1 Scale Mapping Project in October 2013. 109 elevation control points were established and rectified to aerial LIDAR contours derived from Digital Stereographic Image analysis. The surveyed horizontal control points augment the resulting map to provide elevations to within hundredths of an inch for land surfaces and infrastructure. This electronically searchable map is now used for all project planning. The Facility Base Flood Elevation (BFE or 100-year flood plain) is 12 feet relative to the North American Vertical Datum (NAVD88). This represents the elevation of the lowest finished floor of the property to be compliant with the local flood zone. The Plant Master Plan EIR requires that lowest floor of buildings must be above 12 ft NAVD and the buildings floodproofed design
elevation must be one foot above BFE, or 13 feet NAVD. This is the elevation at which new electrical equipment, such as Switchgears M1, M3 and M5, have been installed. New gas compressors are being installed an additional foot higher, at 14 ft NAVD. Existing blowers and generators in the Nitrification Building, Secondary Blower Building, and Building 40 are already above BFE.
100-year flood protection also protects against projected sea level rise for at least the design life of projects currently planned. Current tide predictions at Coyote Creek station 1 (Artesian Slough, station ID 941456) indicate a Mean Higher High Water (MHHW) elevation of 8.4 feet. The latest IPCC 5th Assessment Report projects rise in sea level up to 1 meter by year 2100. Adding a meter (3.28 feet) to current MHHW yields 11.68 feet. Since design life for most new structures and equipment does not extend to year 2100, the BFE of 12 feet NAVD88 provides adequate protection against sea level rise as well. City of San Jose recently initiated a flood protection study which will further define comprehensive flood protection measures for the facility.
Comparison of old (subsided) versus new elevations.

33
Process Control Systems. The Process Control team maintains the automated systems and software that monitor and report thousands of process parameters throughout the facility.
DCS Upgrade Project. In 2013 the group formally commenced installation of a major upgrade of the facility’s 20+-year-old Distributed Control System (DCS). The new replacement system is now being tested. This project is being installed in three phases:
I. Conversion to new Human Machine Interface (HMI), II. Upgrade of input/output (I/O) modules, and
III. Upgrade of controller hardware and programming.
The DCS system provides real-time sensors and controllers that allows monitoring and control over thousands of pieces of equipment 24 hours per day by a small staff of 8 to 10 shift
operators.
At the base of the system, I/O points control or monitor pumps, motors, valves, flow meters, etc. The existing computerized system expanded from 2400 hardwired points in 1990 to over 7500 hardwired points today plus an additional 520 devices connected via “comms ports” that are equivalent to an additional 15,000 points, or so. The current DCS system has grown to a point where existing wires, cabinetry, and computers can no longer accommodate all the additional bandwidth and complexity that is needed. DCS Upgrade Phase I. “HMI Conversion” is nearing final acceptance. ABB, Inc. was contracted in mid-2013 to replace or supplement the existing HMI graphics, related hardware, and old Conductor NT software with a new 800xA ABB platform. Commissioning of the 800xA system started in October 2014. The 800xA platform adds better integration, improved graphics, windows compatibility, and functions of ABB’s “aspect object technology.” The new system provides over 3500 graphic displays that operators use to monitor and control all major equipment at the facility. 50 new servers and clients have also been added at facility locations. Once connected to the new 800xA system, each new workstation can access documents, manuals, videos, and more operational data and trends. Facility staff was trained on the new system from October through December. Final acceptance of the new, enhanced DCS system is scheduled for April 2015. DCS Upgrade Phase II actually started six years ago. This involves rewiring 7500 legacy I/O points around the facility into new S800 interconnection interfaces. Even a simple device, such as the valve regulator shown below, can require wiring for up to six or more I/O points that
Where to start? Instrument Tech, Don Samuel, with a 20+ year-old electrical cabinet.
Phase I: Operator Juan Zepeda using improved graphic displays in the Control Room.

34
transmit information about the device, such as device identity, input frequency, whether analog or digital signal, alarm status, in-service status, etc. Each point is hardwired to an I/O card in the nearby electrical panel. Rewiring each I/O point takes 4.5 to 6 hours of work on average (including the time taken to design the circuitry and install conduit and cabling). All work must be performed on live equipment without interfering with Facility operations. Wiring from I/O cards in individual electrical cabinets back to one of the Facility’s 18 Distributed Control Units (DCUs) is vastly simplified with the new system. Thousands of single strand copper wires (one per point) from each cabinet have been replaced with a single, two strand, “Profibus” cable which transmits up to 1000 signals via serial communication. From each DCU, thousands of signals flow to the Facilities Computer Control Room via existing fiber optic cables.
Over the past six years, Facility staff has completed about 78% of the Phase II work. Prior to starting the project, it was estimated that the contracted cost to connect all I/O points would be in the neighborhood of $15 million. Significant cost was saved by having in-house staff start early and perform this work on regular time and overtime. DCS Upgrade Phase III. Staff will replace remaining controller hardware and related programming once the Phase I installation of new HMI hardware and software is substantially complete and operational. During this phase, remaining old wiring and circuit boards will be removed. Even the relatively newer DCI System Six panels will be removed and replaced with smaller, smarter circuit modules.
Senior Process Control Specialist, Carlos Garcia, points to an ABB Valve Regulator collecting signals from a 36” influent valve.
Cleaner cabinet: Signals from the Valve Regulator are wired as I/O points to I/O cards.
DCU Cabinet #7: DCI System Six on top; old original wiring at bottom. All will be replaced in Phase III.

35
5) Personnel 216 positions work directly under the Deputy Director of Wastewater Management to support the San José-Santa Clara Regional Wastewater Facility (formerly known as San José/Santa Clara Water Pollution Control Plant). Within this group, there were a total of 43 vacant positions as of December 31st, 2013. The vacancies include: 1 Air Conditioning Mechanic, 1 Associate Engineering Technician, 1 Division Manager, 2 Engineering Technicians, 1 Geographic Systems Specialist, 2 Industrial Electricians, 3 Instrument Control Technicians, 1 Maintenance Assistant, 1 Maintenance Superintendent, 1 Paint Supervisor, 1 Painter, 1 Process & Systems Specialist, 1 Senior Engineer, 8 Wastewater Attendants, 11 Wastewater Mechanics, 1 Wastewater Mechanical Supervisor, 2 Wastewater Operators, 2 Wastewater Operations Forepersons, and 2 Wastewater Senior Mechanics.
The Facility is supported by three principal divisions: Operations, Mechanical Maintenance, and Energy and Automation. Additional support is provided by the Planning and Development Division, the Sustainability and Compliance Division and the Facility Environmental Laboratory.
A 2014-15 operating budget action added 9 Wastewater Attendant positions to: 1) create additional points of entry into the trades job series; and 2) help obtain a qualified candidate pool for existing Wastewater Operator Trainee, Wastewater Mechanic, Industrial Painter, Instrument Control Technician, HVAC mechanics and Heavy Equipment Operator positions. Wastewater Attendants (formerly Plant Attendants) assist journey level positions by performing the entry level tasks while learning various job functions as they rotate and cross-train through the Wastewater Facility work groups. This creates more opportunity to “grow our own” and develop staff to promote into the various journey level positions throughout the Facility. One Wastewater Operations Superintendent position was also added as a Subject Matter Expert and liaison between the Facility CIP and O&M groups.
Operations Division. Facility Operations is assigned 75 positions and is responsible for the daily control of the water treatment processes. A minimum of 8 personnel are on site at all times under the oversight of a Wastewater Operations Foreperson.
Facility Maintenance Division. The Facility Maintenance Division is assigned 76 positions. It is organized in five sections:
• Corrective Maintenance section - repairs all mechanical equipment including, pumps, piping, rotating equipment, and structures.
• Preventative Maintenance section - oversees maintenance planning and scheduling. • Paint section - provides protective coatings for equipment and infrastructure.

36
• Maintenance Control Center - maintains all buildings on site and is responsible for landscaping, warehouse, and land management.
• Asset Management - develops and supports the computerized maintenance management system and geographical information services.
Energy and Automation Division. This division is assigned 57 positions and maintains the electrical infrastructure, power generation, instrumentation, and process control systems. It is organized in four sections: Electrical, Instrument Control, Power & Air, and Process Control. This Division also oversees Facility energy use and purchase of natural gas, landfill gas and electricity.
CIP Division. CIP Division is assigned 42 positions from both Environment Services Department and Public Works, including 9 vacancies. The division is comprised of six groups: Facilities, Liquids, Power & Energy, Solids, Construction Administration, and CIP Program Management.
Environmental Compliance and Safety. Regulatory compliance and land use planning is overseen by 15 members of this group under the Environmental Services Department, Sustainability and Compliance Division. These personnel are comprised of environmental and regulatory analysts who monitor, report, and handle corrective action related to the National Pollutant Discharge Elimination System (NPDES) permit, air emissions permit, and health and safety regulations.
Environmental Laboratory. The Facility’s on-site laboratory is staffed with 28 personnel: 13 laboratory chemists, biologists and technicians support wastewater operations; and the remainder of laboratory staff perform trace analytical work and client services.
6) Finance The Facility operates through a Joint Powers Agreement (JPA) under an “Agreement between San Jose and Santa Clara Respecting Sewage Treatment Plant” dated May 6, 1959. In accordance with this master agreement, the Facility is jointly owned by both cities and is administered and operated by the City of San Jose. The Facility service area includes additional tributary sanitary sewer collection agencies, including the following municipalities, sanitary sewer districts, and unincorporated County territory: San Jose, Santa Clara, Milpitas, Cupertino Sanitary District, West Valley Sanitation District, County Sanitation District Nos. 2-3, and Burbank Sanitary District. Each agency retains sole ownership and responsibility of its own sanitary sewer collection system. Through a series of additional “Master Agreements for Wastewater Treatment,” the six additional tributary collection systems hold the rights to a share of Facility treatment capacity.
Each agency prepares its revenue program annually. Rates are adopted by ordinance or resolution of the governing body of each Agency. The Agencies’ revenue programs are submitted to the City of San Jose, as the administering agency, for review to determine conformity with State Water Board revenue program guidelines.
37
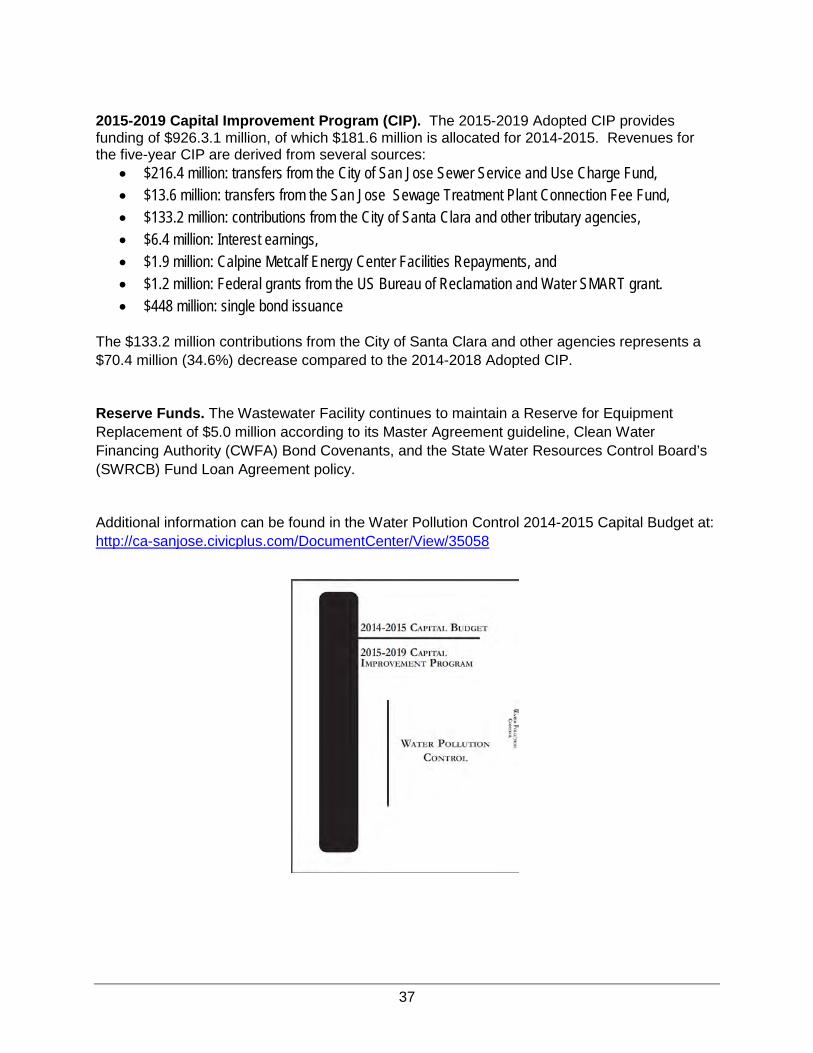
2015-2019 Capital Improvement Program (CIP). The 2015-2019 Adopted CIP provides funding of $926.3.1 million, of which $181.6 million is allocated for 2014-2015. Revenues for the five-year CIP are derived from several sources:
• $216.4 million: transfers from the City of San Jose Sewer Service and Use Charge Fund, • $13.6 million: transfers from the San Jose Sewage Treatment Plant Connection Fee Fund, • $133.2 million: contributions from the City of Santa Clara and other tributary agencies, • $6.4 million: Interest earnings, • $1.9 million: Calpine Metcalf Energy Center Facilities Repayments, and • $1.2 million: Federal grants from the US Bureau of Reclamation and Water SMART grant. • $448 million: single bond issuance
The $133.2 million contributions from the City of Santa Clara and other agencies represents a $70.4 million (34.6%) decrease compared to the 2014-2018 Adopted CIP.
Reserve Funds. The Wastewater Facility continues to maintain a Reserve for Equipment Replacement of $5.0 million according to its Master Agreement guideline, Clean Water Financing Authority (CWFA) Bond Covenants, and the State Water Resources Control Board’s (SWRCB) Fund Loan Agreement policy.
Additional information can be found in the Water Pollution Control 2014-2015 Capital Budget at: http://ca-sanjose.civicplus.com/DocumentCenter/View/35058
38
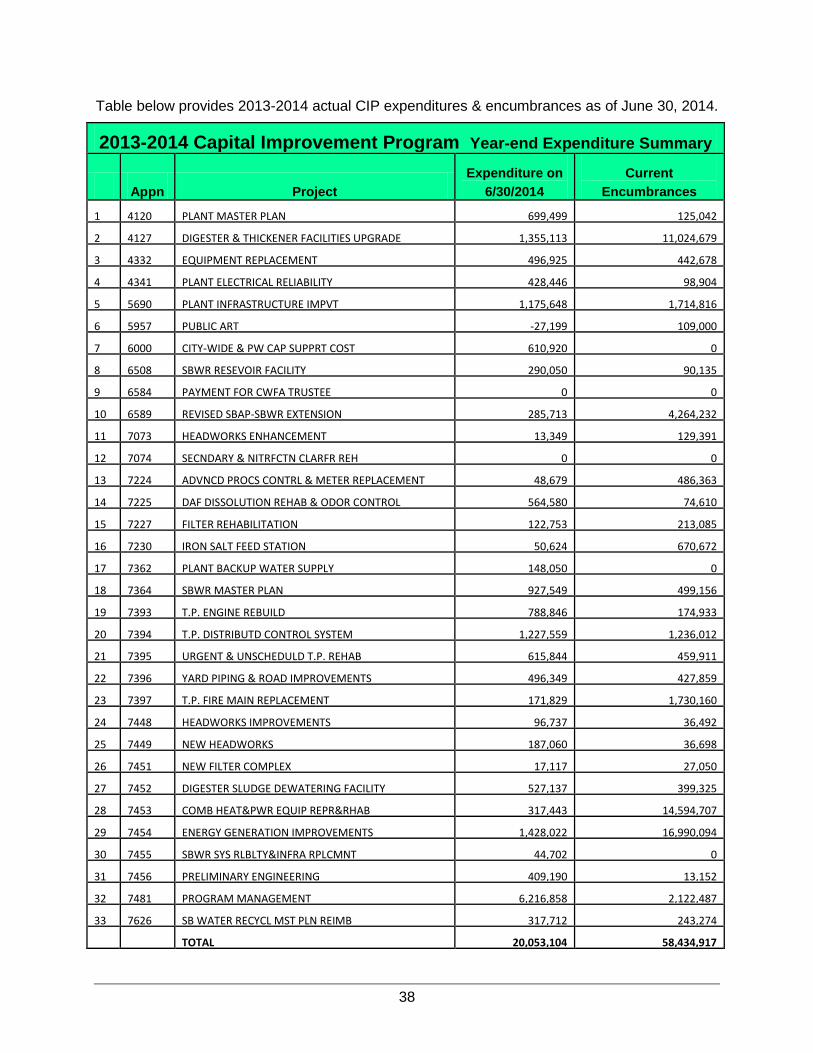
Table below provides 2013-2014 actual CIP expenditures & encumbrances as of June 30, 2014.
2013-2014 Capital Improvement Program Year-end Expenditure Summary
Appn Project Expenditure on
6/30/2014 Current
Encumbrances
1 4120 PLANT MASTER PLAN 699,499 125,042
2 4127 DIGESTER & THICKENER FACILITIES UPGRADE 1,355,113 11,024,679
3 4332 EQUIPMENT REPLACEMENT 496,925 442,678
4 4341 PLANT ELECTRICAL RELIABILITY 428,446 98,904
5 5690 PLANT INFRASTRUCTURE IMPVT 1,175,648 1,714,816
6 5957 PUBLIC ART -27,199 109,000
7 6000 CITY-WIDE & PW CAP SUPPRT COST 610,920 0
8 6508 SBWR RESEVOIR FACILITY 290,050 90,135
9 6584 PAYMENT FOR CWFA TRUSTEE 0 0
10 6589 REVISED SBAP-SBWR EXTENSION 285,713 4,264,232
11 7073 HEADWORKS ENHANCEMENT 13,349 129,391
12 7074 SECNDARY & NITRFCTN CLARFR REH 0 0
13 7224 ADVNCD PROCS CONTRL & METER REPLACEMENT 48,679 486,363
14 7225 DAF DISSOLUTION REHAB & ODOR CONTROL 564,580 74,610
15 7227 FILTER REHABILITATION 122,753 213,085
16 7230 IRON SALT FEED STATION 50,624 670,672
17 7362 PLANT BACKUP WATER SUPPLY 148,050 0
18 7364 SBWR MASTER PLAN 927,549 499,156
19 7393 T.P. ENGINE REBUILD 788,846 174,933
20 7394 T.P. DISTRIBUTD CONTROL SYSTEM 1,227,559 1,236,012
21 7395 URGENT & UNSCHEDULD T.P. REHAB 615,844 459,911
22 7396 YARD PIPING & ROAD IMPROVEMENTS 496,349 427,859
23 7397 T.P. FIRE MAIN REPLACEMENT 171,829 1,730,160
24 7448 HEADWORKS IMPROVEMENTS 96,737 36,492
25 7449 NEW HEADWORKS 187,060 36,698
26 7451 NEW FILTER COMPLEX 17,117 27,050
27 7452 DIGESTER SLUDGE DEWATERING FACILITY 527,137 399,325
28 7453 COMB HEAT&PWR EQUIP REPR&RHAB 317,443 14,594,707
29 7454 ENERGY GENERATION IMPROVEMENTS 1,428,022 16,990,094
30 7455 SBWR SYS RLBLTY&INFRA RPLCMNT 44,702 0
31 7456 PRELIMINARY ENGINEERING 409,190 13,152
32 7481 PROGRAM MANAGEMENT 6,216,858 2,122,487
33 7626 SB WATER RECYCL MST PLN REIMB 317,712 243,274
TOTAL 20,053,104 58,434,917

39
Operating and Maintenance Budget. The 2014-2015 Operating and Maintenance Budget recommended an 8.2% increase over the previous year. This increase was due to increased overhead, staffing, and non-personal costs.

40
Regulatory fees and membership dues. Permit fees and membership dues with wastewater industry organizations are a small but essential component of the overall Plant budget.
Major Permit Fees – 2013-2014 Fees Agency Amount
Permit: Annual NPDES Fee State Water Resources Control Board $525,537 Permit: Annual RMP Participation Regional Monitoring Program – SFEI $245,834 Permit: Annual Air Permit Fee Bay Area Air Quality Management District $66,448
Related Membership Dues Membership: BACWA Annual Dues Bay Area Clean Water Agencies $186,000 Membership: WERF Research Dues Water Environment Research Foundation $41,666 Membership: NACWA Annual Dues National Association of Clean Water Agencies $38,023 Membership: CASA Annual Dues California Association of Sanitation Agencies $18,720 Membership: Green Cities California Fund Local Government Sustainable Energy $10,000
b. O&M MANUAL UDATE The Facility Online O&M Manual (OLM) is posted electronically on the RWF intranet server. The manual provides a searchable reference library describing Facility processes, equipment, and operational procedures. As SOPs are approved, they are copied in the OLM and referenced to the SharePoint SOP library.
The Facility Operations Division moved additional existing SOPs to the SharePoint library and now has over 500 SOPs either drafted, approved, or pending approval. The SOPs are organized by work group or topic area: Operations, Maintenance, Electrical, Power & Air, Instrumentation, Paint Shop, Safety, HVAC, and Log-Out-Tag-Out (LOTO). A separate Maintenance O&M manual library is also in the SharePoint system with an additional 60 O&M documents posted.
c. CONTINGENCY PLAN UPDATE In 2014, sections were revised to reflect Facility staff and title changes.

41
Nine beneficial uses of Artesian Slough Wildlife Habitat (WILD) Fish Spawning (SPWN) Warm Freshwater Habitat (WARM) Cold Freshwater Habitat (COLD) Fish Migration (MIGR) Non-Contact Recreation (REC-1) Contact Recreation (REC-2) Commercial & Sport Fishing (COMM) Rare & Endangered Species (RARE)
d. PERMIT REISSUANCE - 2014 The Facility NPDES Permit was reissued for a new 5-year term commencing November 1st, 2014. A number of minor changes were made to permit provisions:
Changes in the reissued permit: Removed
• South Bay Action Plan annual updates no longer required. • Plant Reliability Report annual update requirement was deleted. • Marsh Vegetative Assessments deleted. • Effluent limits for heptachlor and tributyltin removed.
Reduced • Acute Toxicity Test frequency reduced from monthly to quarterly
Added • Receiving water monitoring at nearest Bay RMP station monthly for one year for pH,
temperature and ammonia • Effluent limit for (1,2,3-cd) Pyrene was added, and effluent limit (maximum daily) for
cyanide was tightened from 14 ug/l to 13 ug/l
The list of beneficial uses assigned to Artesian Slough, the Facility’s receiving water was modified to align with uses designated in the San Francisco Bay Basin Plan. The beneficial use of Ground Water Recharge (GWR) was removed, and two additional beneficial uses: Commercial and Sport Fishing (COMM) and Rare and Endangered Species (RARE) were added. Beneficial uses are listed in permit Table F-4.
During permit application, staff provided documentation to justify a finding of Net Environmental Benefit for facility discharge. This was also the theme of a presentation give at the permit adoption hearing on 10 September 2014.
Net Environmental Benefit according to a 1984 definition: “Demonstrate that: 1) Full and uninterrupted protection will be given to all beneficial uses which could be of the
receiving water … in the absence of point source discharges, and 2) That there will be a creation of new beneficial uses or fuller realization of existing uses
beyond that which would occur in the absence of point source discharge.”
Although information was presented to demonstrate that all nine beneficial uses are provided uninterrupted protection, and seven of the nine uses are enhanced as a result of facility discharge, Water Board did not grant a Net Environmental Benefit finding. Board members suggested that incorporation of facility flow into the design of restoration efforts is a missing piece.

42
3. ENVIRONMENTAL MONITORING
a. Avian Botulism Monitoring In accordance with Permit Provision VI.C.5.a., since 1983 the Facility has contracted with San Francisco Bay Bird Observatory (SFBBO) to monitor for avian botulism outbreaks in the vicinity of the wastewater discharge from June through November.
In 2014, no outbreaks of avian botulism were detected. A total of 33 dead birds were collected and 17 sick birds observed within the survey area of Artesian and Alviso sloughs. None of the dead or sick birds were identified as having avian botulism.
The full Avian Botulism Report is posted on the City of San Jose web site at: http://www.sanjoseca.gov/Archive.aspx?AMID=156&Type=&ADID
b. South Bay Monitoring The South Bay Monitoring program is a long-term monitoring program for surface water quality in Lower South San Francisco Bay (South of the Dumbarton Bridge). The City of San Jose has conducted ambient water quality for more than 5 decades with monitoring frequency and parameters changing as science advances our understanding of the Bay and regulatory priorities shift. The Facility has monitored the Lower South San Francisco Bay for water quality parameters (pH, Dissolved Oxygen (DO), Temperature, and Turbidity) monthly since1965. Nutrient monitoring (Ammonia, Nitrate, Nitrite, and Phosphate) was added in the mid-1970s. The data show dramatic improvements in Lower South Bay Water Quality as treatment upgrades were implemented in the 1970s and 1990s.
Below is a summary of the current South Bay Monitoring effort.
Quarterly metals, nutrients, and water chemistry. San José-Santa Clara Regional Wastewater Facility biologists perform quarterly monitoring for metals, nutrients, and water chemistry in Lower South San Francisco Bay receiving water by boat at 10 stations. Monitoring of concentrations of total and dissolved metals was added to ambient water quality monitoring in 1997 in response to concerns about ambient dissolved copper and nickel levels. This monitoring tracks seasonal and annual trends for a variety of pollutants of concern.

43
Copper Action Plan. The current NPDES permit requires implementation of additional “Copper Action Plan” tasks if the three-year rolling mean dissolved copper concentration of Lower South Bay exceeds 4.2 µg/l. Data collected by both Facility staff and the San Francisco Bay Regional Monitoring Program (RMP) show that the dissolved copper three-year rolling mean remains below the 4.2 µg/l trigger level. RMP data indicated concentrations above the trigger on one instance in 2007 but that higher concentration has not been seen since, and the three year rolling mean never exceeded the trigger. It is increasingly doubtful that the dissolved copper concentration in the Bay will ever exceed the 4.2 µg/l trigger.
Dilution Study. Kleinfelder delivered a modeled Dilution and Mixing Zone Study in April 2014. This $84,000 study updated results of the Facility’s previous dilution study performed in 1989. Since 2005, over 1000 acres of nearby former salt ponds have been opened to circulation with the Bay and Facility effluent. This subtly changed the dilution factors that were calculated 25 years ago. In addition, better modeling techniques are now used to more accurately calculate a dilution gradient as it mixes with tides. To date, a dilution factor, or credit, has not been incorporated in the facility’s NPDES permit limits. However, proposed implementation of a State Toxicity Plan or determination of future nutrient load allocations will call for evaluation of a dilution factor. The 2014 Dilution and Mixing Zone study documents a dilution gradient along the 2 mile long Artesian Slough, from nearly 100%, at the Facility discharge point, to roughly 50% effluent/Bay water, depending on stage of tide, at the confluence with Lower Coyote Creek. Facility effluent comprises around 30% of the waters for one mile upstream and down Lower Coyote Creek after the confluence. The study confirms that Facility effluent is substantially watering 850 acres of restored wetlands in Ponds A16, A17, A19, A20, and A21, along with Artesian Slough, roughly 2 miles of Lower Coyote Creek and the 856 acre circulating, though not restored, Pond A18.
Results of Dilution and Mixing Zone Study performed by Kleinfelder.

44
The Facility discharges roughly 16 mg/l of nitrogen and 3 mg/l of phosphorus. These nutrients attenuate rapidly as the water flows out into Lower South San Francisco Bay.
Nutrient Monitoring. In April 2012, Facility staff commenced monthly monitoring of nutrients in Artesian Slough and the lowest reach of Coyote Creek. The monitoring was conducted during incoming flood tides to characterize nutrients after mixing with ambient water. This receiving water data demonstrates attenuation of nutrients moving downstream from the Facility and into the Bay. Phosphate and Ammonia concentrations nearest the outfall are only slightly higher than concentrations measured in the Lower South Bay. Higher nitrate concentrations attenuate rapidly as effluent mixes and reacts with Bay water in Artesian Slough and the lower reach of Coyote Creek. Dilution accounts for at least 70% of the initial nitrate attenuation with 30% likely lost to assimilation by phytoplankton and microbes.
From July 2013 through June 2014, the nutrient monitoring procedure was modified to capture nutrient concentrations on both ebb and flood tides of the same day. This 2-hour “before and after” high tide monitoring shows the effects of tidal mixing on nutrient concentrations as they pass to the Bay. A mix of ebb and flood monitoring continues by alternating the tidal stage sampled for each single monthly monitoring event.

45
The Facility purchased an inexpensive Van Dorn sampler and a Petite Ponar sediment grab sampler in 2014. These will be used to more carefully determine where and how discharged nutrients are assimilated in the downstream receiving waters. Facility staff also participate in Bay Area-wide Nutrient Management Strategy steering committee and technical workgroup sessions to help advise and guide discussion about future NPDES permit limits for nutrients. Microbial Monitoring. Facility staff began collaborating with researchers at Stanford University who specialize in analyzing the abundance and diversity of microbial species responsible for nitrification and denitrification processes in Bay water and sediment. This collaborative investigation, conducted at no cost except for staff time, will determine the mix of nitrifying and denitrifying microbes present in Artesian Slough through sophisticated gene expression analysis done by the Stanford researchers. Nitrifying microbes are broken into two major groups: ammonia oxidizing bacteria (AOB) and ammonia oxidizing archaea (AOA). Both groups are usually present in different proportions in aquatic and marine systems. Early results from an initial sampling event indicate that the nitrifying microbes in Artesian Slough are heavily dominated by AOB with very little to no AOA present. This information will be a key component to understanding the driving processes at work in Artesian Slough that are leading to the measured attenuation of nutrient concentrations further away from the Facility discharge. Phytoplankton Monitoring. In 2014, Facility staff opened a $10,000 purchase order with BSA Environmental Services, Inc. to perform phytoplankton speciation and enumeration of surface water samples collected at 2 stations in Artesian Slough and 2 stations in Lower Coyote Creek between 2013 and 2015. This study will build baseline data to determine if the types and abundance of phytoplankton downstream of the Facility are adversely affected by the small concentrations of nitrate and phosphate nutrients that are discharged. Phytoplankton are microscopic single-celled algae and plants that serve as “primary producers” at the base of the food-chain. They take up nutrients in the water column and serve as food for the aquatic food web. Phytoplankton populations can change rapidly with weather and seasons. Under the wrong conditions, certain types of phytoplankton are known to cause toxic “blooms,” referred to as “Harmful Algal Blooms” or HABs. Literature suggests that over-abundances of cyanobacteria (bluegreen algae) or dinoflagellates could pose a problem. Analysis to date shows that the broad class of diatoms predominate phytoplankton populations in Artesian Slough and Lower Coyote Creek. As expected, Chlorophyta (green algae) forms a significant portion of the population closest to the fresh water Facility discharge. Diatom populations quickly overwhelm the phytoplankton community as Artesian Slough flows downstream to the Bay. Cyanobacteria (Chroococcus Sp.) have been seen in all sample events, albeit as small proportions of the total community composition. This should be expected since cyanobacteria are the most common phytoplankton on Earth. So far, sampling has detected neither dinoflagellates nor any diatom species that could result in toxic Harmful Algal Blooms (HABs). Over time, this inexpensive study will help determine whether Facility effluent impacts the phytoplankton community.
Typical phytoplankton species that can be found in Artesian Slough and Coyote Creek.
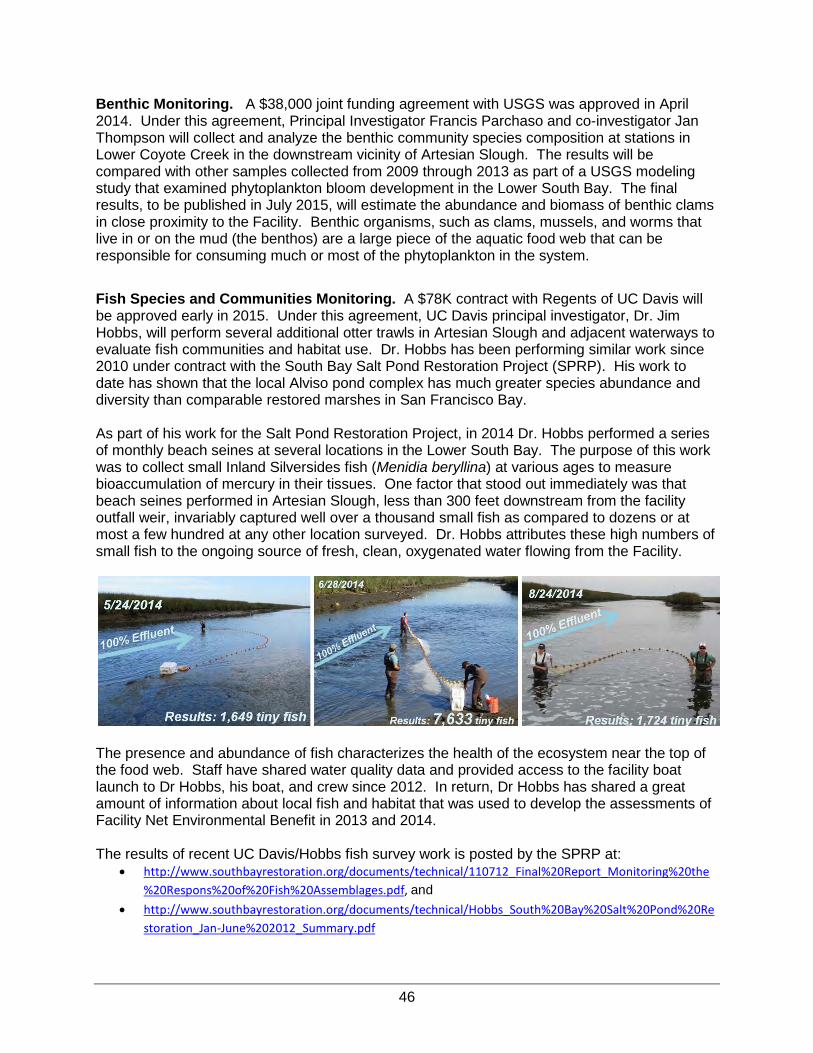
46
Benthic Monitoring. A $38,000 joint funding agreement with USGS was approved in April 2014. Under this agreement, Principal Investigator Francis Parchaso and co-investigator Jan Thompson will collect and analyze the benthic community species composition at stations in Lower Coyote Creek in the downstream vicinity of Artesian Slough. The results will be compared with other samples collected from 2009 through 2013 as part of a USGS modeling study that examined phytoplankton bloom development in the Lower South Bay. The final results, to be published in July 2015, will estimate the abundance and biomass of benthic clams in close proximity to the Facility. Benthic organisms, such as clams, mussels, and worms that live in or on the mud (the benthos) are a large piece of the aquatic food web that can be responsible for consuming much or most of the phytoplankton in the system.
Fish Species and Communities Monitoring. A $78K contract with Regents of UC Davis will be approved early in 2015. Under this agreement, UC Davis principal investigator, Dr. Jim Hobbs, will perform several additional otter trawls in Artesian Slough and adjacent waterways to evaluate fish communities and habitat use. Dr. Hobbs has been performing similar work since 2010 under contract with the South Bay Salt Pond Restoration Project (SPRP). His work to date has shown that the local Alviso pond complex has much greater species abundance and diversity than comparable restored marshes in San Francisco Bay. As part of his work for the Salt Pond Restoration Project, in 2014 Dr. Hobbs performed a series of monthly beach seines at several locations in the Lower South Bay. The purpose of this work was to collect small Inland Silversides fish (Menidia beryllina) at various ages to measure bioaccumulation of mercury in their tissues. One factor that stood out immediately was that beach seines performed in Artesian Slough, less than 300 feet downstream from the facility outfall weir, invariably captured well over a thousand small fish as compared to dozens or at most a few hundred at any other location surveyed. Dr. Hobbs attributes these high numbers of small fish to the ongoing source of fresh, clean, oxygenated water flowing from the Facility.
The presence and abundance of fish characterizes the health of the ecosystem near the top of the food web. Staff have shared water quality data and provided access to the facility boat launch to Dr Hobbs, his boat, and crew since 2012. In return, Dr Hobbs has shared a great amount of information about local fish and habitat that was used to develop the assessments of Facility Net Environmental Benefit in 2013 and 2014. The results of recent UC Davis/Hobbs fish survey work is posted by the SPRP at:
• http://www.southbayrestoration.org/documents/technical/110712_Final%20Report_Monitoring%20the%20Respons%20of%20Fish%20Assemblages.pdf, and
• http://www.southbayrestoration.org/documents/technical/Hobbs_South%20Bay%20Salt%20Pond%20Restoration_Jan-June%202012_Summary.pdf

47
Audubon Society Christmas Bird Counts. Staff continues to collaborate and provide access to Facility property to Audubon Society for bird conservation projects and studies. The local Audubon Society Christmas Bird Counts provide an annual tally of migratory birds in and adjacent to Facility property, to include Pond A18. The most recent census of marsh and salt pond birds in the local area continues to be higher than documented in any year from 1975 through 2007, albeit not matching the population “hump” of 2008-2010 that occurred just a few years after initial breaching of the six salt ponds that surround Artesian Slough. The most positive news is that Audubon Society volunteers counted 161 bird species in the Alviso Complex. This is the largest number of species counted since the record began in 1975. The counts suggest that on any given December day, 40,000 more birds representing roughly 50 more species can be sighted in the Alviso Complex then would have been seen in 1975.
Birds are the other top of the food chain indicator of the health of the ecosystem. The Audubon counts suggest that changes in habitat have supported increased bird use.
Black Crowned Night Herons in Artesian Slough – January 2015. Bufflehead & Scaups in Artesian
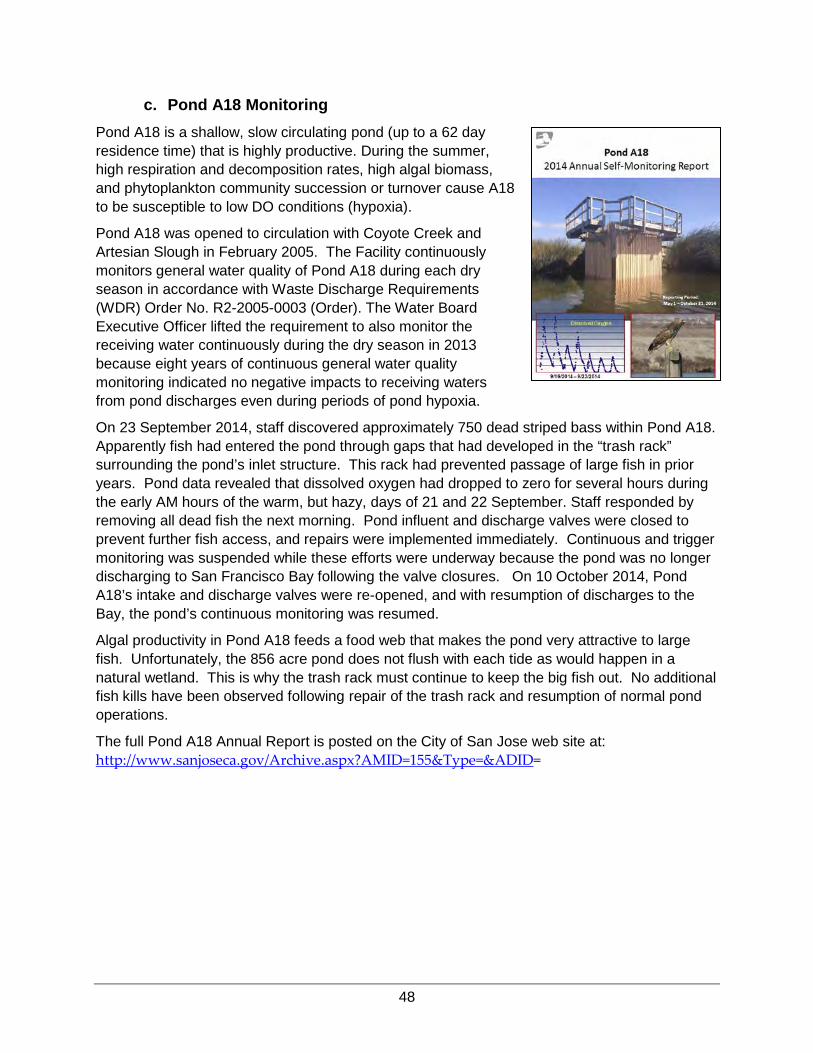
48
c. Pond A18 Monitoring Pond A18 is a shallow, slow circulating pond (up to a 62 day residence time) that is highly productive. During the summer, high respiration and decomposition rates, high algal biomass, and phytoplankton community succession or turnover cause A18 to be susceptible to low DO conditions (hypoxia).
Pond A18 was opened to circulation with Coyote Creek and Artesian Slough in February 2005. The Facility continuously monitors general water quality of Pond A18 during each dry season in accordance with Waste Discharge Requirements (WDR) Order No. R2-2005-0003 (Order). The Water Board Executive Officer lifted the requirement to also monitor the receiving water continuously during the dry season in 2013 because eight years of continuous general water quality monitoring indicated no negative impacts to receiving waters from pond discharges even during periods of pond hypoxia.
On 23 September 2014, staff discovered approximately 750 dead striped bass within Pond A18. Apparently fish had entered the pond through gaps that had developed in the “trash rack” surrounding the pond’s inlet structure. This rack had prevented passage of large fish in prior years. Pond data revealed that dissolved oxygen had dropped to zero for several hours during the early AM hours of the warm, but hazy, days of 21 and 22 September. Staff responded by removing all dead fish the next morning. Pond influent and discharge valves were closed to prevent further fish access, and repairs were implemented immediately. Continuous and trigger monitoring was suspended while these efforts were underway because the pond was no longer discharging to San Francisco Bay following the valve closures. On 10 October 2014, Pond A18’s intake and discharge valves were re-opened, and with resumption of discharges to the Bay, the pond’s continuous monitoring was resumed.
Algal productivity in Pond A18 feeds a food web that makes the pond very attractive to large fish. Unfortunately, the 856 acre pond does not flush with each tide as would happen in a natural wetland. This is why the trash rack must continue to keep the big fish out. No additional fish kills have been observed following repair of the trash rack and resumption of normal pond operations.
The full Pond A18 Annual Report is posted on the City of San Jose web site at: http://www.sanjoseca.gov/Archive.aspx?AMID=155&Type=&ADID=

49
… treated wastewater from 1.4 million people becomes an oasis before it leaves the treatment facility. Treated wastewater flows through a 2500-foot Outfall Channel before it passes over the weir and out to Artesian Slough. This is the final reaction basin if last minute dechlorination or oxygenation is ever needed. Facility operators work in and around the channel every day. Fish and wildlife congregate here, unperturbed. On a single random day: January 21st, 2015, this is what we found there:
Believe it!
Can You Believe … ?
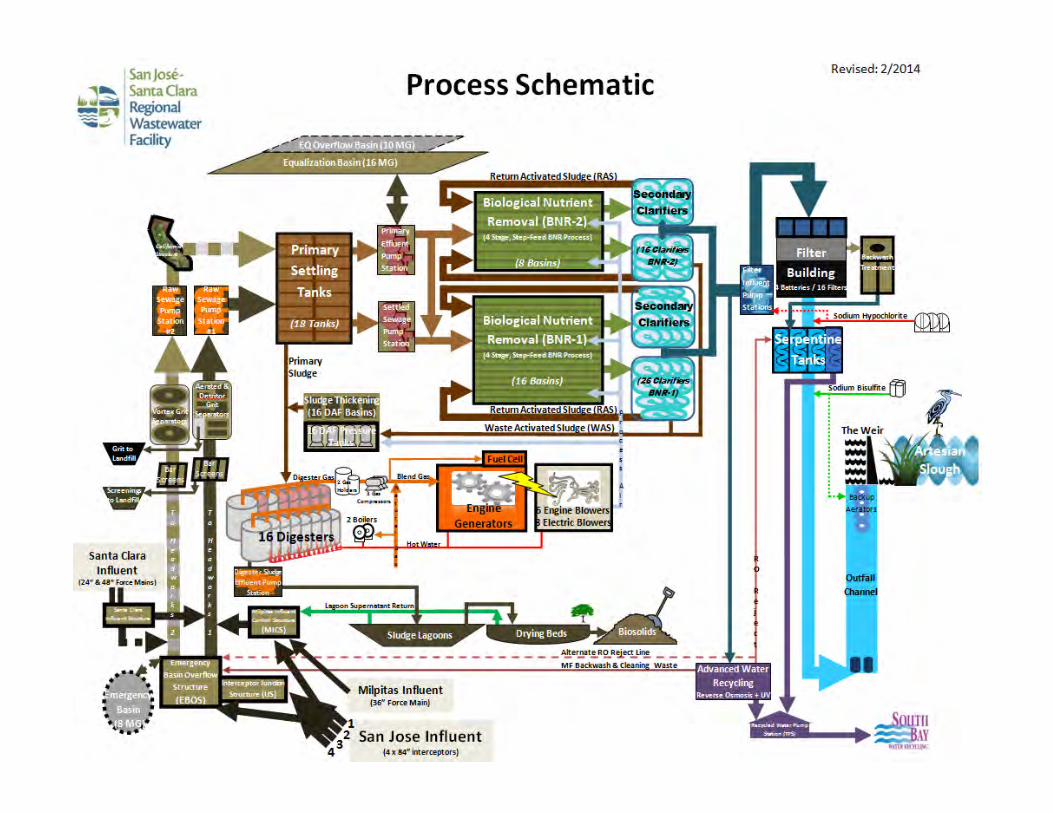

ATTACHMENT A - Laboratory Accreditation


ATTACHMENT B – August 2014 TRE Report