Embed Size (px)
Citation preview

2014 Citi Global Energy & Utilities
Conference
Boston – 14 May 2014

2 Page
Forward-looking statements
Certain statements made in this announcement may include ‘forward-looking statements’. These statements may be identified by the use of words like ‘anticipate’, ‘believe’, ‘could’, ‘estimate’, ‘expect’, ‘forecast’, ‘intend’, ‘may’, ‘might’, ‘plan’, ‘predict’, ‘project’, ‘scheduled’, ‘seek’, ‘should’, ‘will’, and similar expressions. The forward-looking statements reflect our current views and are subject to risks, uncertainties and assumptions. The principal risks and uncertainties which could impact the Group and the factors which could affect the actual results are described but not limited to those in the ‘Risk Management’ section in the Group’s Annual Report and Consolidated Financial Statements for the year ended 31 December 2013. These factors, and others which are discussed in our public announcements, are among those that may cause actual and future results and trends to differ materially from our forward-looking statements: actions by regulatory authorities or other third parties; our ability to recover costs on significant projects; the general economic conditions and competition in the markets and businesses in which we operate; our relationship with significant clients; the outcome of legal and administrative proceedings or governmental enquiries; uncertainties inherent in operating internationally; the timely delivery of vessels on order and the timely completion of vessel conversion programmes; the impact of laws and regulations; and operating hazards, including spills and environmental damage. Many of these factors are beyond our ability to control or predict. Other unknown or unpredictable factors could also have material adverse effects on our future results. Given these factors, you should not place undue reliance on the forward-looking statements.
3 Page
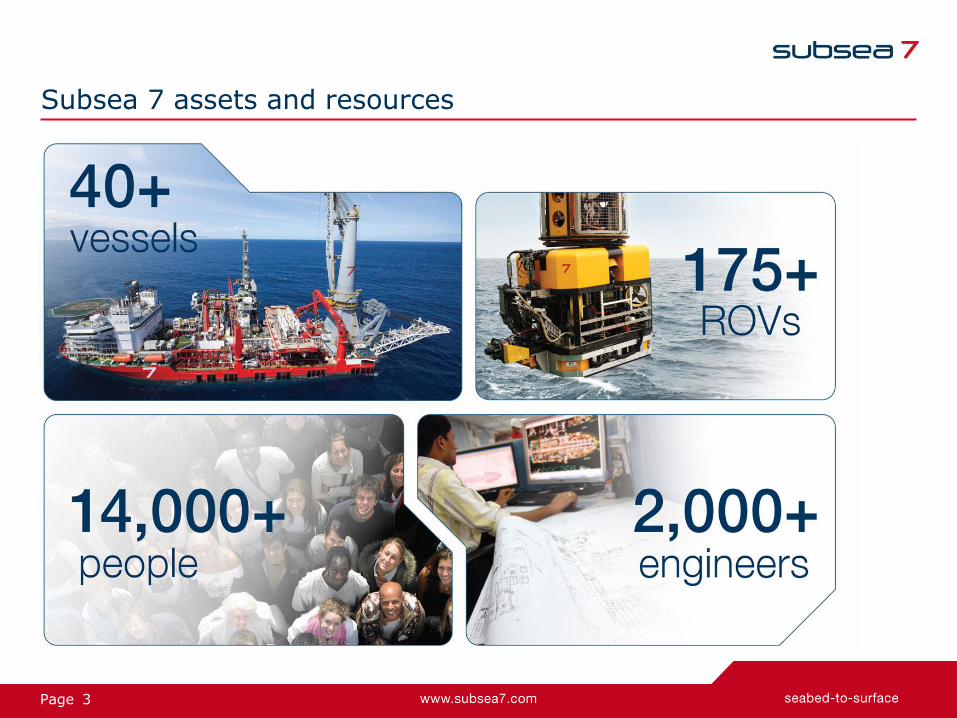
Subsea 7 assets and resources

4 Page
SURF Life-of-Field
Conventional Hook Up
Core business segments
Engineering, construction, installation and
procurement of Subsea Umbilicals, Risers and
Flowlines.
Subsea 7 targets this segment globally.
Services over the life of a field’s production, including inspection, repair and maintenance.
Subsea 7 performs this work in Europe, Africa, Gulf of Mexico and Australia and will target specific countries.
Fabrication and installation of fixed platforms
(topsides and jackets) and their associated pipelines
in non-harsh environments.
Subsea 7 targets this
segment in Africa. Entry into Mexico considered for positioning for deep water.
Addition of modules on new platforms and refurbishment of topsides of an existing platform or FPSO. Subsea 7 has traditionally only targeted this segment in Africa.

5 Page
Complementary business segments
Seaway Heavy Lifting: Engineering, construction, installation and procurement of offshore turbines and cables for wind farms. Western Europe only (at this stage).
ROV and intervention tooling support services - onboard semis, drill ships, jackups, platforms, FPSOs, anchor handling tugs and FSVs. Subsea 7 targets this work globally.
SHL JV i-Tech
Renewables
Decommissioning Heavy Lift
ROV and Intervention

6 Page
EMAS-AMC McDermott Heerema Allseas Petrofac
Global leaders in
EPIC
Regional/ players
Competitors in SURF and Life-of-Field
Subsea 7 Technip Saipem
Ocean I
nsta
ller
Sea T
rucks
Fugro
Ocean e
eri
ng
Ceona
Bib
by
Sapura
Kencana
DO
F
Cecon
Sw
iber
Local Players
Deepw
ate
r alli
ance

7 Page
CHALLENGES DEGREE
Access to capital Medium
Vessels Medium (high in ultra deep water)
Technology High (in deep water, harsh environment)
Engineering and project management processes
High
Market positioning High
Knowhow, people, track record High
Local content (Africa) High
Challenges remain high for large or technology-rich SURF projects
Competitive advantage in SURF is multi-faceted
8 Page
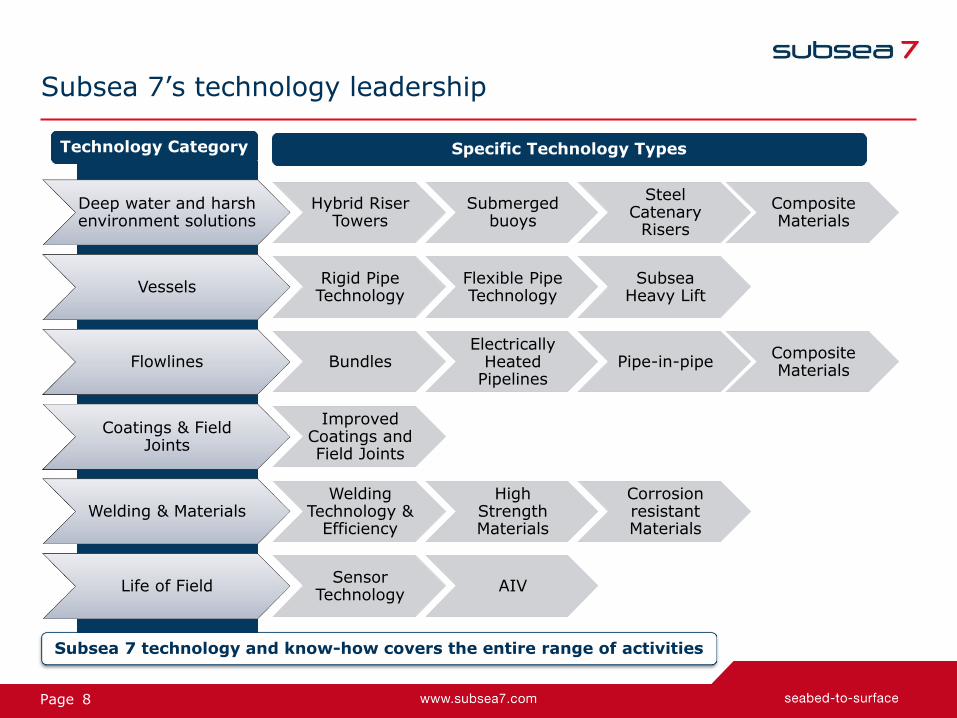
Subsea 7’s technology leadership
Deep water and harsh environment solutions
Hybrid Riser Towers
Submerged buoys
Steel Catenary
Risers
Composite Materials
Vessels Rigid Pipe Technology
Flexible Pipe Technology
Subsea Heavy Lift
Flowlines Bundles Electrically
Heated Pipelines
Pipe-in-pipe Composite Materials
Coatings & Field Joints
Improved Coatings and Field Joints
Welding & Materials Welding
Technology & Efficiency
High Strength Materials
Corrosion resistant Materials
Life of Field Sensor
Technology AIV
Technology Category Specific Technology Types
Subsea 7 technology and know-how covers the entire range of activities

9 Page
Addressing clients’ needs in a capex-constrained environment
Helping to reduce the cost of our clients’ projects
• Early engagement to define optimal technical and cost-effective options
• Technology-driven solutions
• Focus on “fit-for-purpose” engineering without compromising risk profile
• Integrated project teams of Subsea 7 and client personnel
• Optimised commercial and risk-sharing model

10 Page
Quality backlog - good spread by geography and contract mix
Backlog progression ($ billions)
≤2011 28%
2012 14%
2014 4%
2013 54%
2014 42%
2015 26%
2016+ 32%
NSC 33%
AFGOM24%
Brazil 38%
APME 5%
Backlog by Award Date Backlog by Execution Date Backlog by Territory
8.7 8.3 8.1
9.1
10.2 10.4
11.8 11.8 11.6
Q1'12 Q2'12 Q3'12 Q4'12 Q1'13 Q2'13 Q3'13 Q4'13 Q1'14

11 Page
Fleet investments to meet growth objectives: vessels under construction
Ship Vessel Type Rationale Operational
Seven Waves Pipelay Support Vessel (PLSV)
Under 5-year contract with Petrobras
2nd Quarter 2014 (commencing operations for Petrobras mid May)
Seven Sun Seven Rio Seven Cruzeiro (PLSVs 2, 3 & 4)
Under 5-year contracts with Petrobras
4th Quarter 2015 2nd Quarter 2016 4th Quarter 2016
Seven Kestrel Diving Support Vessel (DSV)
Fleet replacement investment for growing market
4th Quarter 2015
Seven Arctic Heavy Construction Vessel (HCV) 900T crane
Strategic investment; enabling for seabed compression/separation/ production module installation
1st Quarter 2016
12 Page
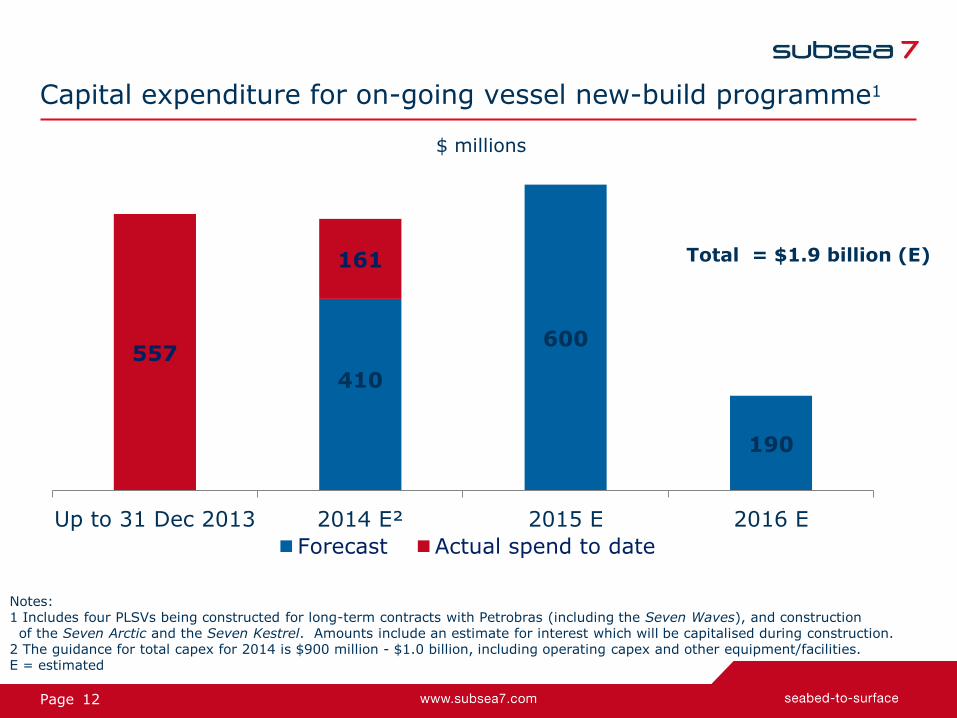
410
600
190
557
161
Up to 31 Dec 2013 2014 E² 2015 E 2016 E
Forecast Actual spend to date
$ millions
Notes: 1 Includes four PLSVs being constructed for long-term contracts with Petrobras (including the Seven Waves), and construction of the Seven Arctic and the Seven Kestrel. Amounts include an estimate for interest which will be capitalised during construction.
2 The guidance for total capex for 2014 is $900 million - $1.0 billion, including operating capex and other equipment/facilities. E = estimated
Total = $1.9 billion (E)
Capital expenditure for on-going vessel new-build programme1

13 Page
Company financial performance history
$5,477m
$6,297m $6,297m
$641m $808m
$573m
$1,003m $1,139m
$981m
12% 13%
9%
-70%
-60%
-50%
-40%
-30%
-20%
-10%
0%
10%
0.0
500.0
1,000.0
1,500.0
2,000.0
2,500.0
3,000.0
3,500.0
4,000.0
4,500.0
5,000.0
5,500.0
6,000.0
6,500.0
7,000.0
2011 (1) 2012 2013
CONSOLIDATED
Revenue NOI Adj EBITDA NOI %
(1) 2011 is based on 13 months results
14 Page
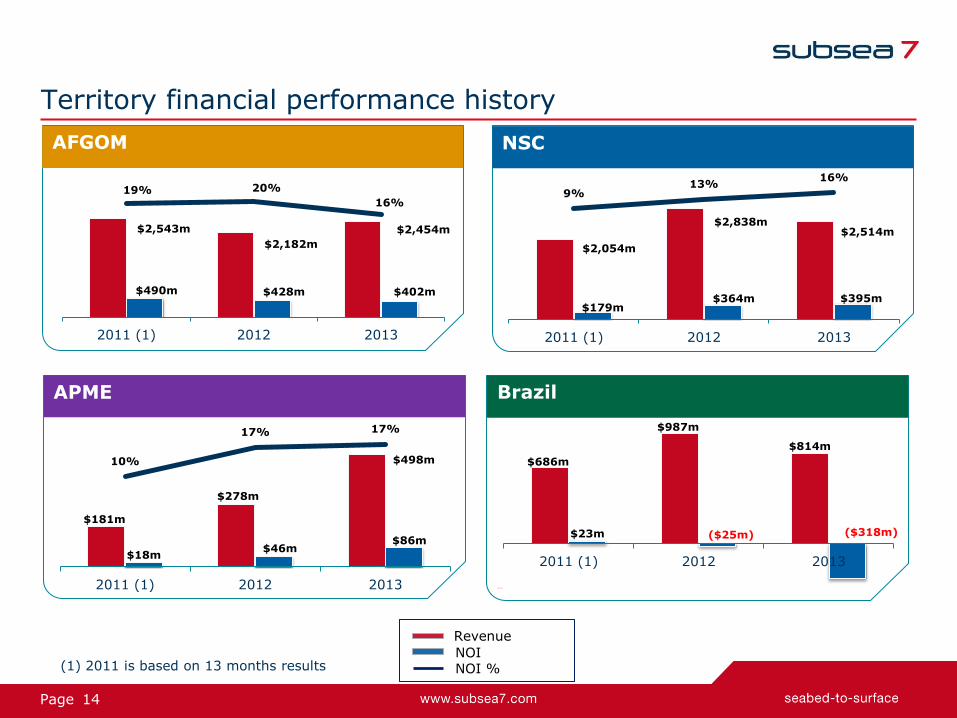
Territory financial performance history
$2,543m
$2,182m
$2,454m
$490m $428m $402m
19% 20%
16%
-10%
0%
10%
20%
0.0
500.0
1,000.0
1,500.0
2,000.0
2,500.0
3,000.0
3,500.0
2011 (1) 2012 2013
AFGOM
$181m
$278m
$498m
$18m $46m
$86m
10%
17% 17%
-10%
0%
10%
20%
0.0
50.0
100.0
150.0
200.0
250.0
300.0
350.0
400.0
450.0
500.0
550.0
600.0
2011 (1) 2012 2013
APME
$686m
$987m
$814m
$23m ($25m) ($318m)
(400.0)
100.0
600.0
2011 (1) 2012 2013
Brazil
$2,054m
$2,838m $2,514m
$179m $364m $395m
9% 13%
16%
-40%
-30%
-20%
-10%
0%
10%
20%
0.0
50.0
100.0
150.0
200.0
250.0
300.0
350.0
400.0
450.0
500.0
550.0
600.0
650.0
700.0
750.0
800.0
850.0
900.0
950.0
1,000.0
1,050.0
1,100.0
1,150.0
1,200.0
1,250.0
1,300.0
1,350.0
1,400.0
1,450.0
1,500.0
1,550.0
1,600.0
1,650.0
1,700.0
1,750.0
1,800.0
1,850.0
1,900.0
1,950.0
2,000.0
2,050.0
2,100.0
2,150.0
2,200.0
2,250.0
2,300.0
2,350.0
2,400.0
2,450.0
2,500.0
2,550.0
2,600.0
2,650.0
2,700.0
2,750.0
2,800.0
2,850.0
2,900.0
2,950.0
3,000.0
3,050.0
3,100.0
3,150.0
3,200.0
3,250.0
3,300.0
3,350.0
3,400.0
3,450.0
3,500.0
2011 (1) 2012 2013
NSC
(1) 2011 is based on 13 months results
Revenue
NOI NOI %

15 Page
Guará-Lula NE project update
• Good operational progress in late 2013 / early 2014
• All “new technology/technically difficult” steps have been completed at least once
• Three submerged buoys (BSRs) installed; fourth (and final) BSR expected to be installed in Q2
• Riser installation on-going
– Eight of 27 risers installed to date
• Oil is being produced from the first installed BSR
• The Seven Polaris and the Aker Wayfarer expected to be de-mobilised from the project in Q2 2014
• Project expected to be completed late 2014

16 Page
Brazil: PLSVs – foundation for the future
Vessel Contract/Renewal Start
Duration (years) Approximate Total Contract Value¹
(US$m)
Normand Seven Q4 13 4.8 (to Q3 2018) 400
Kommandor 3000 Q2 13 5.0 (to Q2 2018) 350
Seven Phoenix Q3 13 5.0 (to Q3 2018) 450
Seven Condor Q3 14 3.4 (to Q1 2018) 275
Seven Mar
Q4 13 3.0 (to Q4 2016) 290
Seven Seas
Q3 13 1.6 (to Q1 2015) 250
Seven Waves
Q2 14 5.0 (to Q2 2019) 500
Seven Sun, Rio and Cruzeiro Q4 15 – Q4 16 5.0 1,600
¹Values are per the date of respective award and represent approximate gross revenue

17 Page
Market overview
Tendering activity is high; however, the timing of some large contract
awards remains uncertain
• SURF: strong tendering activity in the North Sea, Africa, Gulf of Mexico and
Asia
• Life-of-Field: strong demand, particularly in the UK sector of the North Sea
• Conventional: the activity of IOCs in West Africa is expected to grow in spite
of the current lull

18 Page
2014 outlook
AFGOM
• Africa
• SURF: high tendering activity in West and East Africa; timing of
large project market awards remains uncertain
• Conventional: lack of short-term visibility on timing of IOCs’ activity
growth in Nigeria
• Gulf of Mexico
• High tendering activity for small and medium-size SURF projects
• Opportunities to extend Life-of-Field activities
APME
• Asia
• Potential for large SURF project market awards late in 2014
• Australia
• High local costs create challenges for operators, delaying new large
project market awards
19 Page
2014 outlook
Brazil
• Guará-Lula NE project: good operational progress thus far in
2014
• All four buoys to be fully installed by end of Q2
• Riser installation and other offshore operations to be completed by
late Q4
• The Seven Waves (PLSV) five-year contract to commence in Q2
• Territory financial turn-around on track, driven by cost
reductions, new organisational structure and benefits of PLSV
contract renewals
20 Page
2014 outlook
NSC
• SURF:
• High level of tendering activity; timing of large project market
awards remains somewhat uncertain
• Our technology remains a key differentiator: strong interest from
operators for our Bundle solution
• Deployment of the Seven Oceans and the Skandi Acergy outside the
North Sea tempers the Territory’s revenue growth potential
• Life-of-Field:
• Continuing strong demand for our Life-of-Field solutions driven by
the flexibility provided by our fleet and engineering resources
Joint Ventures
• Contribution from Seaway Heavy Lifting and SapuraAcergy joint
ventures expected to diminish compared to record high 2013 levels

21 Page
Financial liquidity and cash returns to shareholders
• Robust balance sheet
• Strong operational cashflow generation
• Investment grade debt metrics
• Revolving credit facility and three bilateral lines = $400 million in committed borrowing capacity (currently unused)
• Share repurchase programme continuing:
– $176 million of $200 million authorisation executed through 30 April 2014 (9.4 million shares repurchased)
• NOK 3.60 per share cash dividend proposed in respect of 2013 (payable in July 2014, subject to shareholder approval)
• Following the dividend payable in 2014, nearly $1 billion will have been returned to shareholders from cash dividends and share repurchases since the merger in 2011

22 Page
Summary
• Good start to 2014, with increased revenue, Adjusted EBITDA, net income and EPS in Q1 compared to the prior year first quarter
• Strong order backlog of $11.6 billion at end of first quarter
• Brazil turnaround on track, supported by the renewal of existing PLSV contracts, deployment of the Seven Waves in Q2 and cost reduction initiatives
• Unchanged financial guidance for the full year 2014
• No change in market fundamentals: we remain positive on the medium- and long-term market prospects
• Subsea 7 well positioned to prosper from market trends
23 Page
Appendix

24 Page
Income statement Q1 2014 – key highlights
Three months ended
In $ millions, unless otherwise indicated 31 Mar 14 31 Mar 13
Revenue 1,668 1,467
Net operating income (NOI) 166 154
Income before taxes 173 158
Taxation (36) (26)
Net income 137 132
Adjusted EBITDA1 264 241
Adjusted EBITDA margin 15.8% 16.4%
Diluted earning per share $0.41 $0.37
Weighted average number of common shares2 376.0 396.4
1 Adjusted EBITDA defined in Appendix 2 In Q1’14, the 2014 and 2017 convertible bonds were dilutive

25 Page
Overview of Q1 2014 cash flow
$ millions
Cash and cash equivalents at 31 Dec 2013 650
Net cash generated from operating activities 257 Includes decrease in net operating assets of $70m
Net cash flow used in investing activities (271) Includes capital expenditure of $288m mainly on new vessel construction programme
Net cash flow used in financing activities (73) Includes $71m on shares repurchased
Other movements (25)
Cash and cash equivalents at 31 Mar 2014 538
26 Page
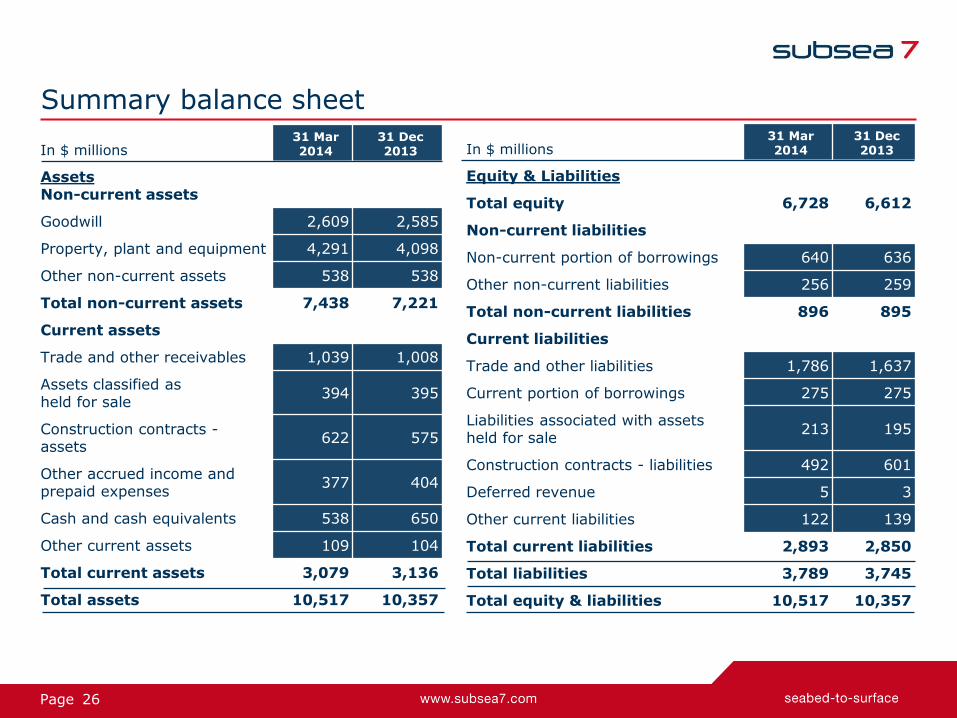
Summary balance sheet
In $ millions 31 Mar 2014
31 Dec 2013
Assets Non-current assets
Goodwill 2,609 2,585
Property, plant and equipment 4,291 4,098
Other non-current assets 538 538
Total non-current assets 7,438 7,221
Current assets
Trade and other receivables 1,039 1,008
Assets classified as held for sale
394 395
Construction contracts - assets
622 575
Other accrued income and prepaid expenses
377 404
Cash and cash equivalents 538 650
Other current assets 109 104
Total current assets 3,079 3,136
Total assets 10,517 10,357
In $ millions 31 Mar 2014
31 Dec 2013
Equity & Liabilities
Total equity 6,728 6,612
Non-current liabilities
Non-current portion of borrowings 640 636
Other non-current liabilities 256 259
Total non-current liabilities 896 895
Current liabilities
Trade and other liabilities 1,786 1,637
Current portion of borrowings 275 275
Liabilities associated with assets held for sale
213 195
Construction contracts - liabilities 492 601
Deferred revenue 5 3
Other current liabilities 122 139
Total current liabilities 2,893 2,850
Total liabilities 3,789 3,745
Total equity & liabilities 10,517 10,357

27 Page
Income statement – supplementary details
Three months ended
In $ millions 31 Mar 14 31 Mar 13
Administrative expenses (81) (76)
Share of net income of associates and joint ventures 16 16
Net operating income 166 154
Finance costs net of finance income (1) (18)
Other gains and losses 8 21
Income before taxes 173 158
Taxation (36) (26)
Net income 137 132
Net income attributable to:
Shareholders of the parent company 153 134
Non-controlling interests (16) (2)
137 132
28 Page
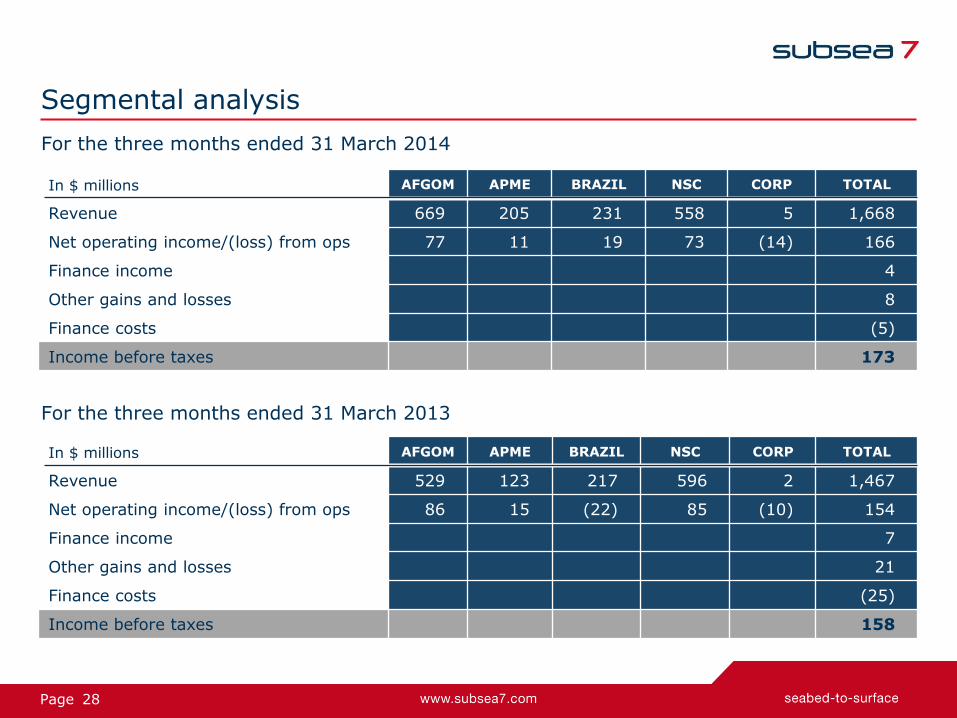
Segmental analysis
For the three months ended 31 March 2014
In $ millions AFGOM APME BRAZIL NSC CORP TOTAL
Revenue 669 205 231 558 5 1,668
Net operating income/(loss) from ops 77 11 19 73 (14) 166
Finance income 4
Other gains and losses 8
Finance costs (5)
Income before taxes 173
In $ millions AFGOM APME BRAZIL NSC CORP TOTAL
Revenue 529 123 217 596 2 1,467
Net operating income/(loss) from ops 86 15 (22) 85 (10) 154
Finance income 7
Other gains and losses 21
Finance costs (25)
Income before taxes 158
For the three months ended 31 March 2013
29 Page
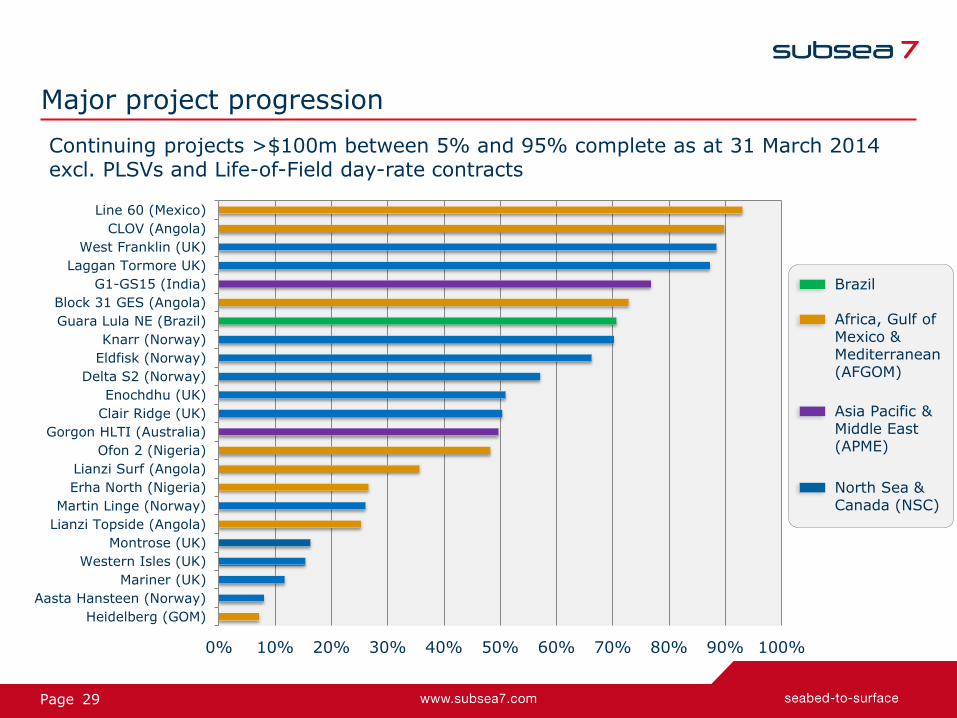
Major project progression
Continuing projects >$100m between 5% and 95% complete as at 31 March 2014 excl. PLSVs and Life-of-Field day-rate contracts
0% 10% 20% 30% 40% 50% 60% 70% 80% 90% 100%
Line 60 (Mexico)
CLOV (Angola)
West Franklin (UK)
Laggan Tormore UK)
G1-GS15 (India)
Block 31 GES (Angola)
Guara Lula NE (Brazil)
Knarr (Norway)
Eldfisk (Norway)
Delta S2 (Norway)
Enochdhu (UK)
Clair Ridge (UK)
Gorgon HLTI (Australia)
Ofon 2 (Nigeria)
Lianzi Surf (Angola)
Erha North (Nigeria)
Martin Linge (Norway)
Lianzi Topside (Angola)
Montrose (UK)
Western Isles (UK)
Mariner (UK)
Aasta Hansteen (Norway)
Heidelberg (GOM)
Brazil
Africa, Gulf of Mexico & Mediterranean (AFGOM)
Asia Pacific & Middle East (APME)
North Sea & Canada (NSC)

30 Page
2014 financial guidance
No change to previously communicated guidance (repeated below), other than lower expected effective tax rate
• Group revenue expected to increase from 2013 level
• Adjusted EBITDA expected to increase moderately from that achieved in 2013 after adding back the $355 million full life loss provision recognised on the Guará-Lula NE project
• Capex: $900 million - $1.0 billion, comprising
– $560-590 million for the six new-build vessels under construction
– $220-250 million for operating capex (existing fleet)
– $120-160 million for vessel enhancements, i-Tech ROVs, offshore equipment and onshore facilities
• Other net income related guidance
– Administrative expenses: $300-320 million
– Net finance costs: less than $10 million
– Depreciation and amortisation expense: $400-430 million
– Full year 2014 effective tax rate: 27-29% (down from 29-31%)

31 Page
Gorgon heavy lift and umbilicals - Australia
• Located 130km off the northwest coast of Western Australia
• The Gorgon project is one of the world's largest natural gas projects
• Heaviest and deepest subsea lifts in the history of Subsea 7
– 20 subsea structures and foundations (up to circa 1,000Te), 15 heavy spools (up to circa 200Te), in water depths up to 1,300m
• Installation of the Gorgon (59km) and Jansz (136km) umbilicals

32 Page
CLOV Block 17 - Angola
• Technology-rich SURF project
• High local content with Sonamet fabrication facility
• Successful deployment of the Seven Borealis to install
– 40km of pipe-in-pipe production, 60km of water injection, 32km of gas export, and 37 spools and 15 jumpers
• Two Hybrid Riser Towers and a Single Hybrid Riser at the end of the gas export line using proprietary bundle/riser technology

33 Page
Aasta Hansteen gas field - Norway
• Technology-rich SURF project
• 1,200m water depth, deepest in North Sea
• 300km off northern Norway, harsh environment
• First SCRs (x4) in the Norwegian Sea, manufactured at Vigra spoolbase
• First installation of BUTTING Bubi® mechanically lined pipe by reeling in the North Sea – using the Seven Oceans
• New permanent office set up in Tromsø, Northern Norway
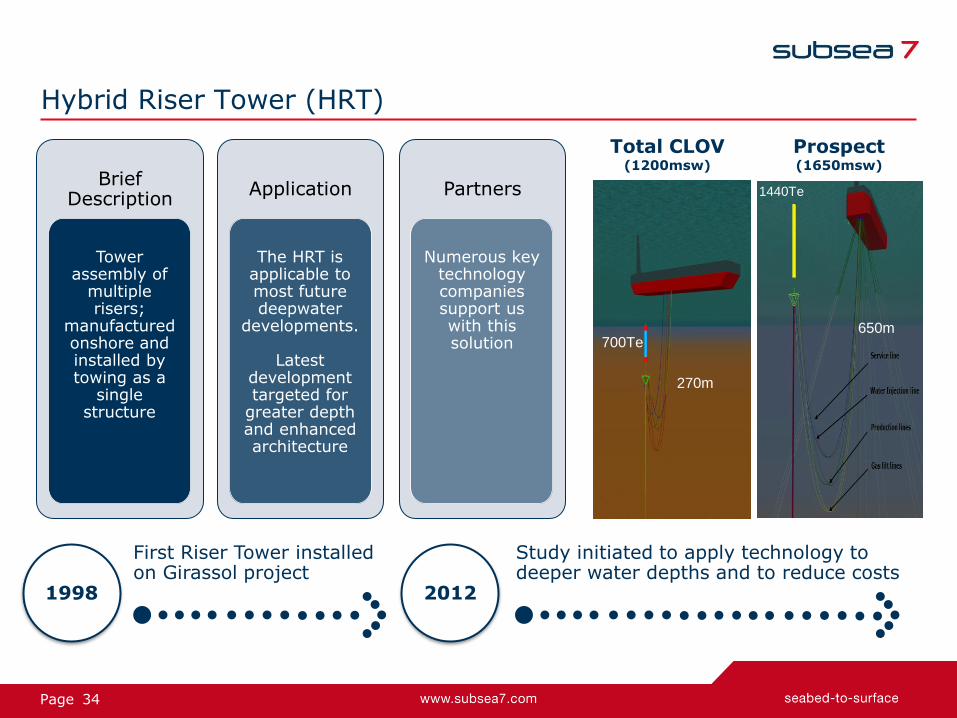
34 Page
Brief Description
Tower assembly of
multiple risers;
manufactured onshore and installed by towing as a
single structure
Hybrid Riser Tower (HRT)
700Te
270m
1440Te
650m
Total CLOV (1200msw)
Prospect (1650msw)
1998
First Riser Tower installed on Girassol project
2012
Study initiated to apply technology to deeper water depths and to reduce costs
Application
The HRT is applicable to most future deepwater
developments.
Latest development targeted for
greater depth and enhanced architecture
Partners
Numerous key technology companies support us with this solution

35 Page
Buoy Supported Riser (BSR)
Brief Description
A submerged buoy anchored to the seabed.
Steel Catenary Risers laid between
seabed and buoy and flexible
jumpers laid between buoy
and FPSO.
Application
The BSR is being installed on Guará-Lula NE project in
Brazil
Partners
Numerous technology companies
partnering us with this solution
2009
Guará-Lula NE design competition 2009
- 2012
Concept design, engineering and fabrication 2013
Installation of buoy
36 Page
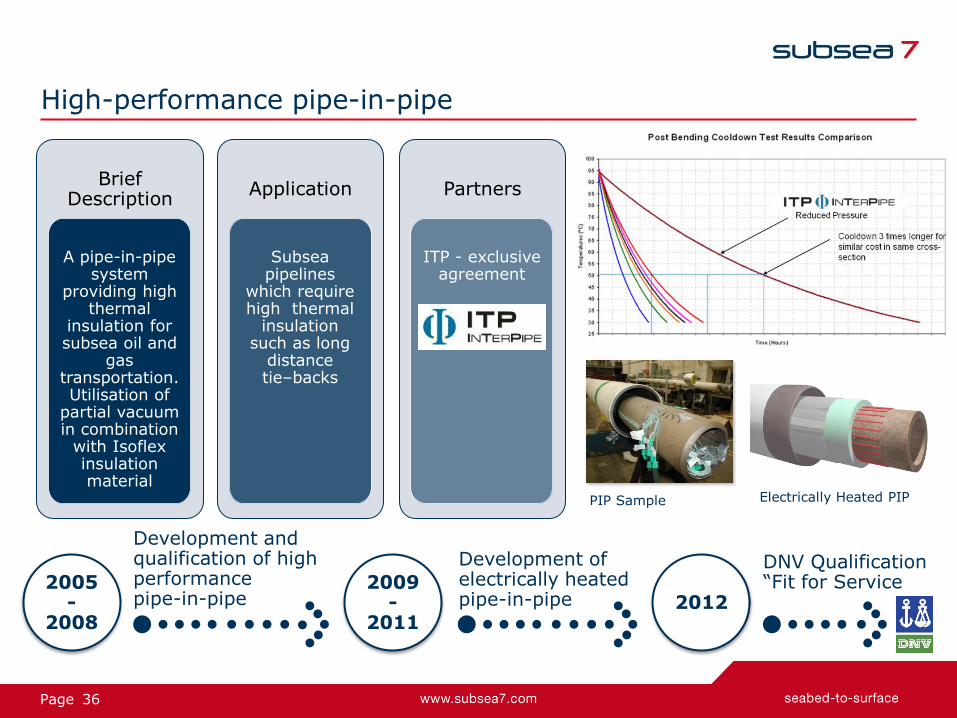
High-performance pipe-in-pipe
Swaged Field Joint PIP Sample Electrically Heated PIP
Brief Description
A pipe-in-pipe system
providing high thermal
insulation for subsea oil and
gas transportation. Utilisation of
partial vacuum in combination
with Isoflex insulation material
Application
Subsea pipelines
which require high thermal
insulation such as long
distance tie–backs
Partners
ITP - exclusive agreement
2005-
2008
Development and qualification of high performance pipe-in-pipe
2009 -
2011
Development of electrically heated pipe-in-pipe 2012
DNV Qualification “Fit for Service
37 Page
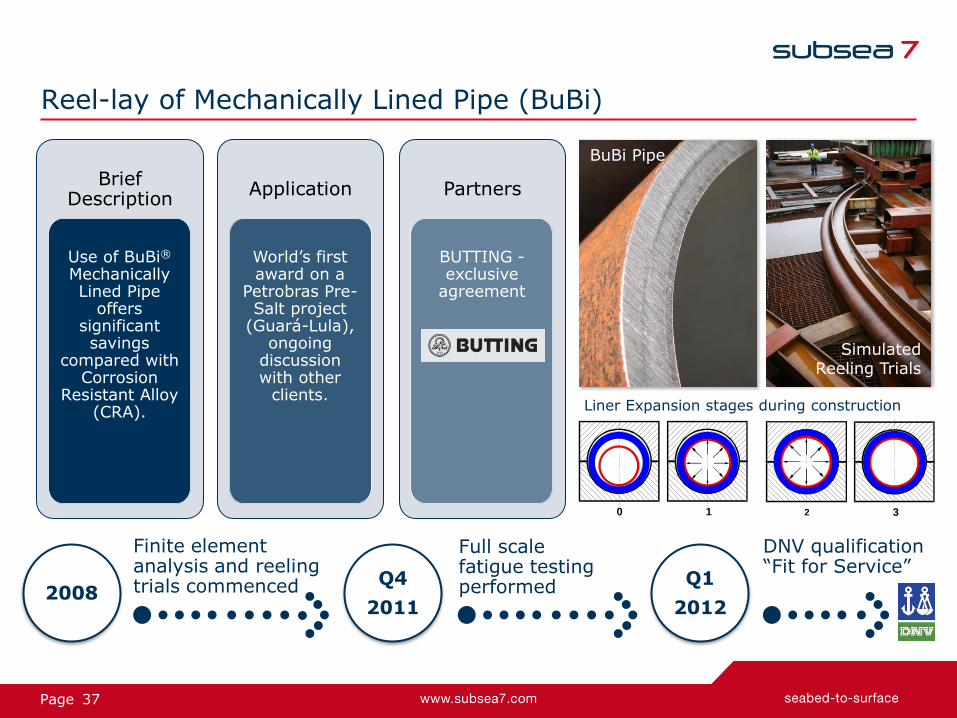
Reel-lay of Mechanically Lined Pipe (BuBi)
3 2 0 1
BuBi Pipe
Simulated Reeling Trials
Liner Expansion stages during construction
Brief Description
Use of BuBi® Mechanically Lined Pipe
offers significant savings
compared with Corrosion
Resistant Alloy (CRA).
Application
World’s first award on a
Petrobras Pre-Salt project
(Guará-Lula), ongoing
discussion with other
clients.
Partners
BUTTING - exclusive
agreement
2008
Finite element analysis and reeling trials commenced Q4
2011
Full scale fatigue testing performed
DNV qualification “Fit for Service”
Q1
2012

38 Page
Towed bundles
Brief Description
Towed integrated assembly of flowlines and
service lines/control cables etc.
contained within an outer carrier pipe. Dedicated end terminations c/w manifolds, valves etc. as
required by the project.
Application
Mainly North Sea subsea production systems tie
backs. Towed from our
fabrication facility in Wick
Scotland.
Partners
Numerous technology companies
partnering us with this solution
1978
First Bundle installed in North Sea 1995
First use of BuBi® mechanical lined pipe – BP Cyrus project 2012
Approximately 70 Bundles installed to date with over 150km BuBi pipe utilised

39 Page
Autonomous Inspection Vehicle (AIV)
Autotracker
Brief Description
A game changing inspection
system comprising an autonomous
vehicle without a tether (which
enhances manoeuvrability), has an array of navigation tools and sensors and is powered by its onboard battery
source
Application
Can be deployed from
FPSO (avoiding the
need for a separate support
vessel), or multiple
deployment from support
vessel.
Partners
Seebyte technology
2007 -
2010
Early technology and feasibility evaluations
2010 -
2011
AIV development program started
2012-
2013
Complete offshore trials and Mk1 ready for use

40 Page
Spoolbases
Our operational facilities
Fabrication Yards

41 Page
Rigid pipelay/heavy lift assets
1 Owned and operated by a joint venture
1
1
1

42 Page
Diving Support Vessels
1 Formerly Seven Havila
1
43 Page
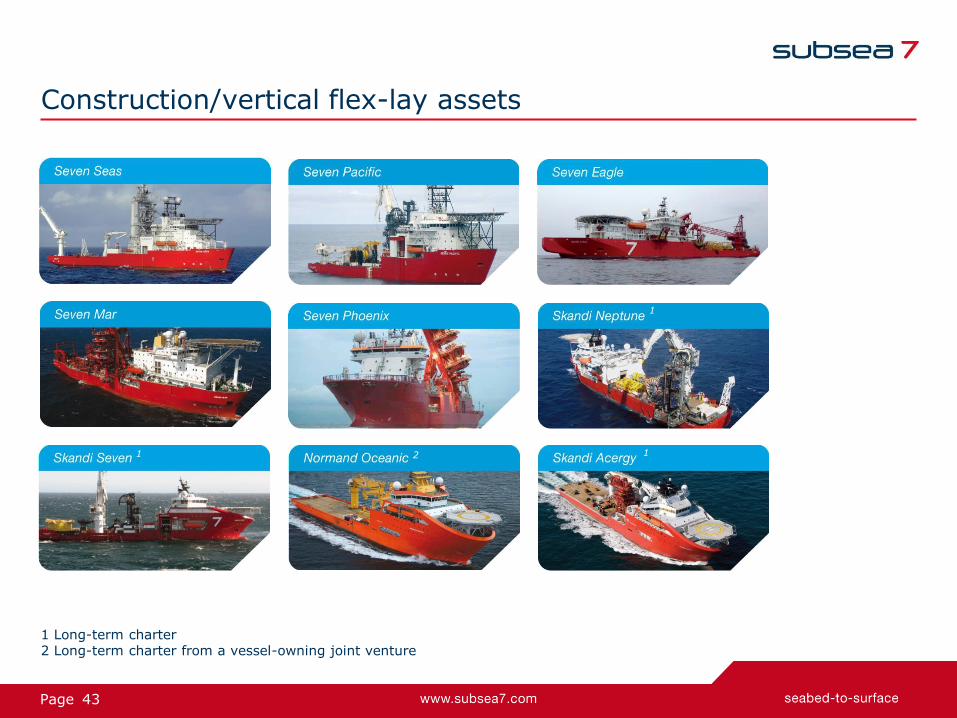
Construction/vertical flex-lay assets
1 Long-term charter 2 Long-term charter from a vessel-owning joint venture
1
1
1 2

44 Page
Construction/horizontal flex-lay assets
1 2
2
1 Formerly the Seven Sisters 2 Long-term charter

45 Page
Life-of-Field/Light Construction Vessels
2
1 2
2 2 3
1 Long-term charter from a vessel-owning joint venture 2 Long-term charter 3 Call-out contract
46 Page
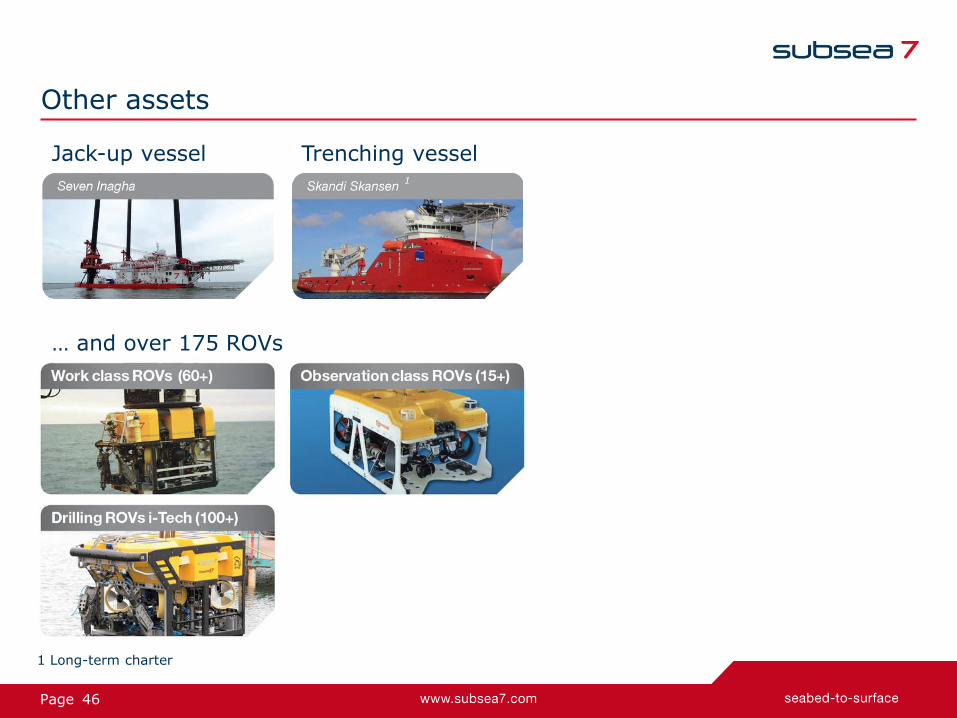
Other assets
Jack-up vessel Trenching vessel
… and over 175 ROVs
1
1 Long-term charter
47 Page
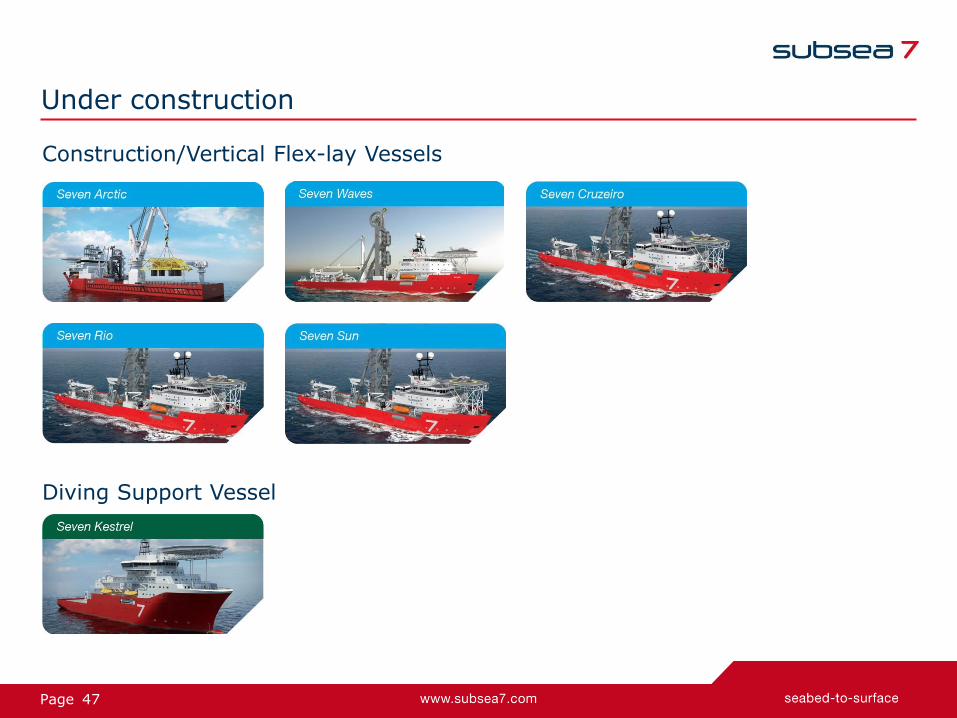
Under construction
Construction/Vertical Flex-lay Vessels
Diving Support Vessel

48 Page
Vessel Divestments from 2011 to the end of Q1 2014
Sep 2011 Jun 2011
Jan 2013
Jan 2013
Feb 2013
Aug 2013
Aug 2011
LOF / Light Construction:
DSV:
Construction / Horizontal Flex-lay:
Rigid Pipelay / Construction:

49 Page
Terminated Long Term Vessel Charters from 2011 to the end of Q1 2014
May 2011
Jan 2014 Dec 2012 Jan 2014
Mar 2014
DSV:
LOF / Light Construction:

50 Page