Embed Size (px)
Citation preview
2014 Directive 054 Performance Presentation
Cliffdale Scheme Approval No. 11034K
September 23, 2014
Attendees Field
• Brett Wootton Exploitation
• Gary Shaner Geology
• Jason Augustin Operations
• Duilio Raffa Reservoir
• Vince Parsons Environmental / Regulatory
Presenters
1

Agenda – Subsurface
1. Overview
2. Geology / Geoscience
3. Drilling and Completions
4. Artificial Lift
5. Instrumentation
6. Scheme Performance
7. Future Plans
2

Agenda – Surface
1. Facilities
2. Measurement and Reporting
3. Water Source and Usage
4. Water and Waste Disposal and Landfill Waste
5. Sulphur Production
6. Environmental Issues
7. Compliance Statement
8. Future Plans
3
Subsurface
Overview
5
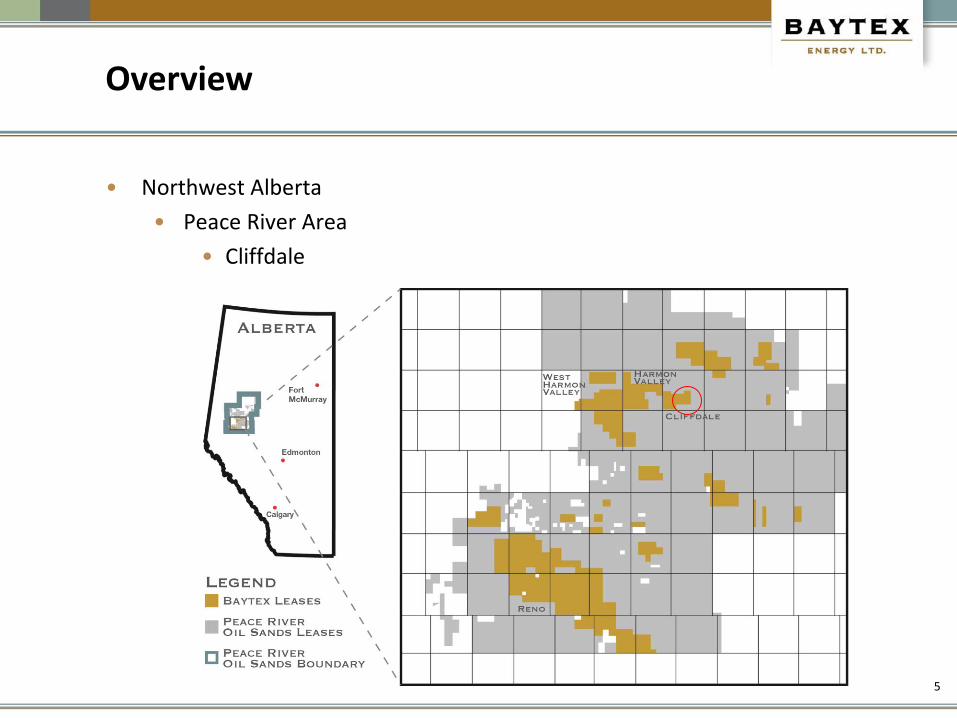
• Northwest Alberta
• Peace River Area
• Cliffdale
Overview
6
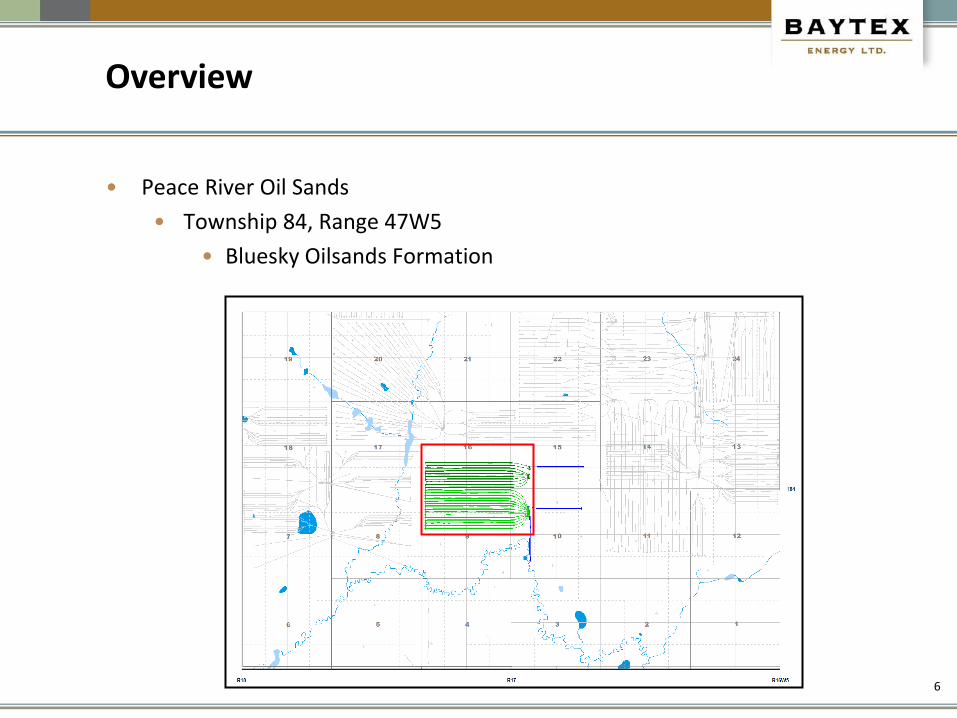
• Peace River Oil Sands
• Township 84, Range 47W5
• Bluesky Oilsands Formation
7
• Horizontal well cyclic steam stimulation (CSS) is used to recover bitumen from the Bluesky formation in the Peace River oil sands.
• In the CSS process, steam is injected into the oil sands formation to reduce bitumen viscosity.
• Initially, each well is produced on primary (cold) production to create voidage for the first steam slug.
• Cliffdale CSS then starts with rapid, short-duration steam cycles to accelerate injectivity for subsequent cycles.
• Maximum bottom-hole injection pressure is 10,800 kPag.
Overview

2) Geology and Geoscience
9
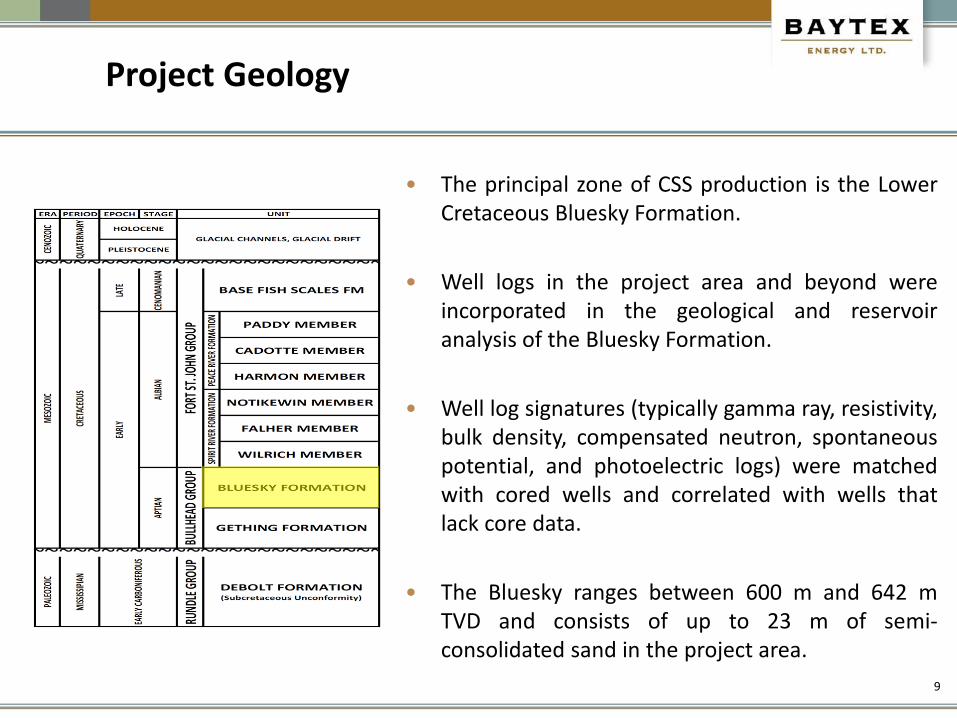
• The principal zone of CSS production is the Lower Cretaceous Bluesky Formation.
• Well logs in the project area and beyond were incorporated in the geological and reservoir analysis of the Bluesky Formation.
• Well log signatures (typically gamma ray, resistivity, bulk density, compensated neutron, spontaneous potential, and photoelectric logs) were matched with cored wells and correlated with wells that lack core data.
• The Bluesky ranges between 600 m and 642 m TVD and consists of up to 23 m of semi-consolidated sand in the project area.
Project Geology
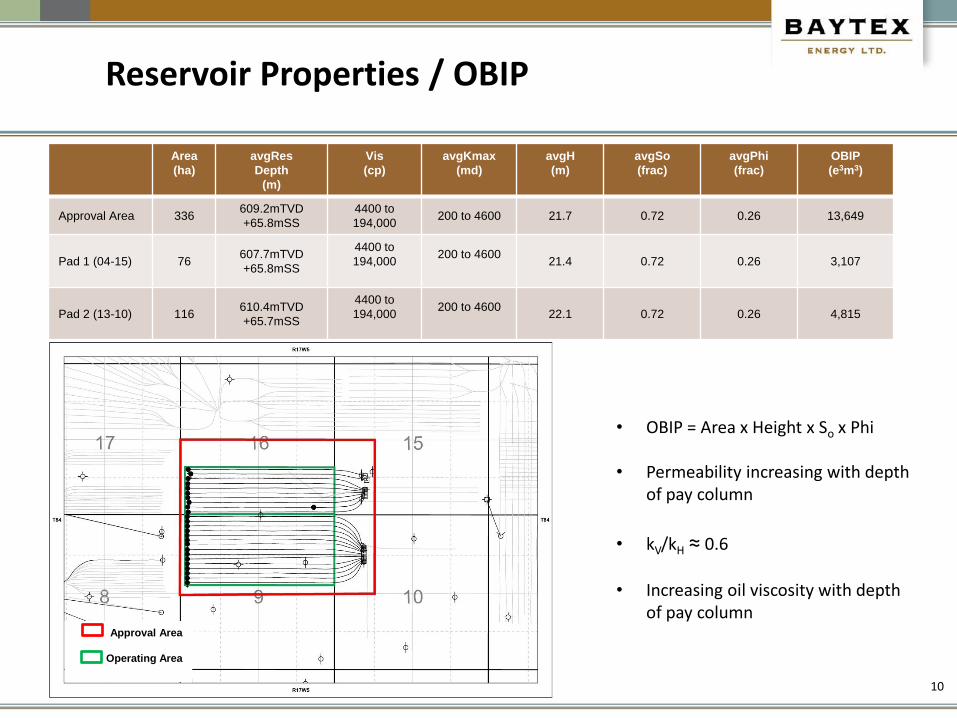
Reservoir Properties / OBIP
10
• OBIP = Area x Height x So x Phi
• Permeability increasing with depth of pay column
• kV/kH ≈ 0.6
• Increasing oil viscosity with depth
of pay column Approval Area
Operating Area
Area
(ha)
avgRes
Depth
(m)
Vis
(cp)
avgKmax
(md)
avgH
(m)
avgSo
(frac)
avgPhi
(frac)
OBIP
(e3m3)
Approval Area 336 609.2mTVD
+65.8mSS
4400 to
194,000 200 to 4600 21.7 0.72 0.26 13,649
Pad 1 (04-15) 76 607.7mTVD
+65.8mSS
4400 to
194,000
200 to 4600
21.4 0.72 0.26 3,107
Pad 2 (13-10) 116 610.4mTVD
+65.7mSS
4400 to
194,000
200 to 4600
22.1 0.72 0.26 4,815
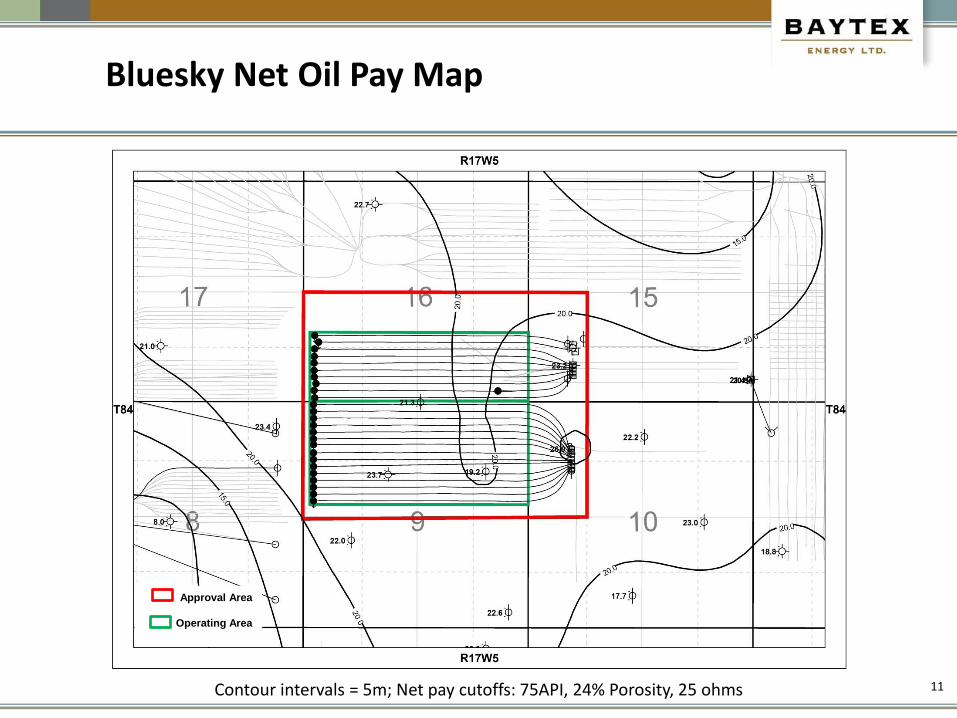
Bluesky Net Oil Pay Map
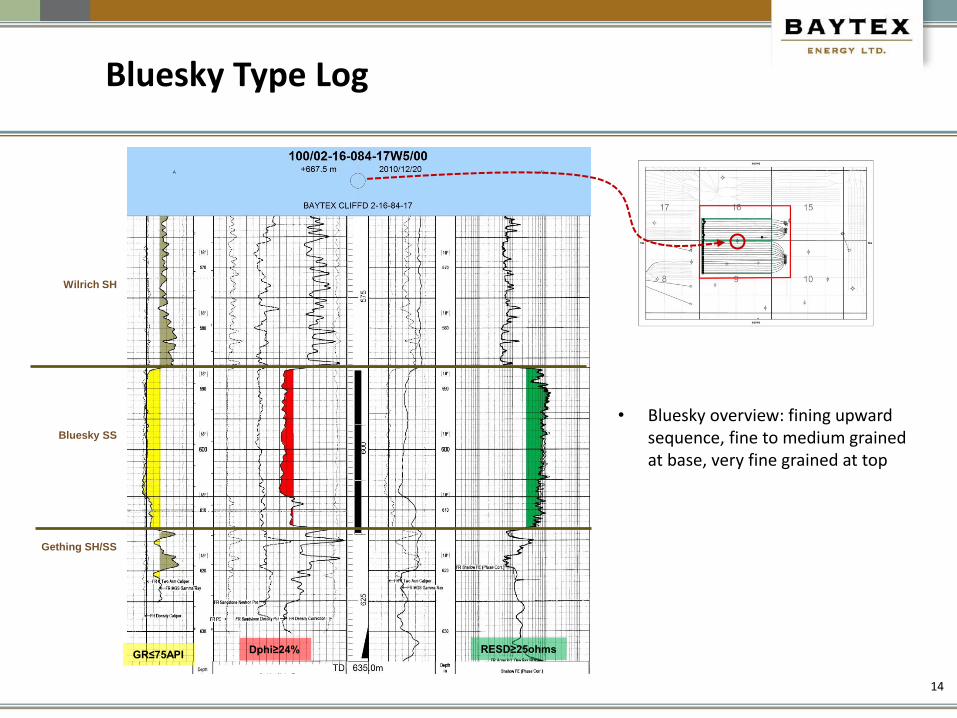
Contour intervals = 5m; Net pay cutoffs: 75API, 24% Porosity, 25 ohms 11
Approval Area
Operating Area
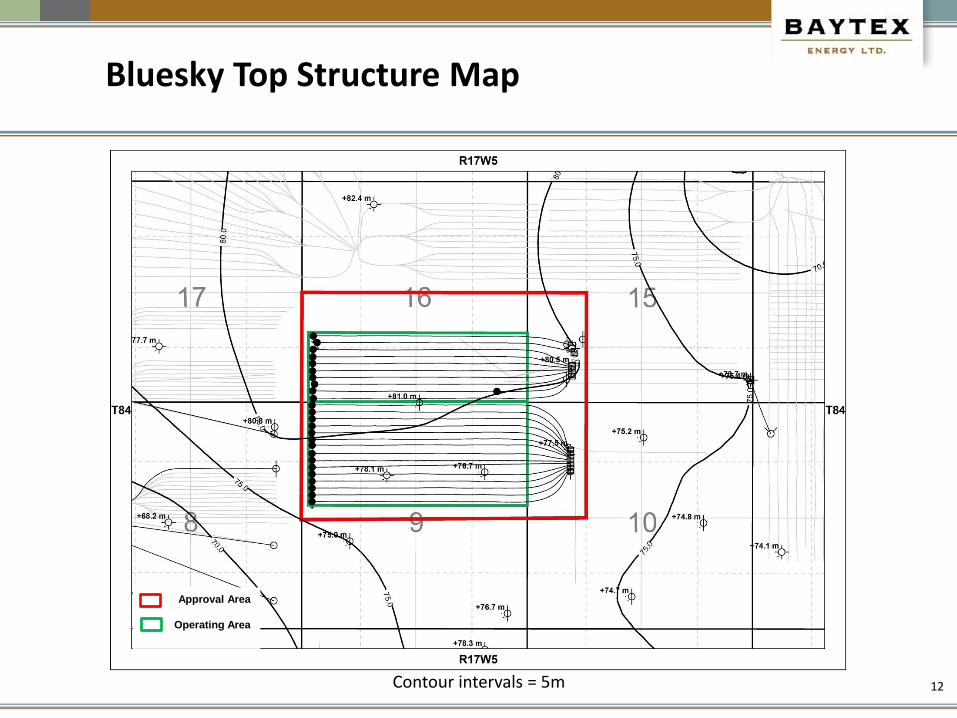
Bluesky Top Structure Map
Contour intervals = 5m 12
Approval Area
Operating Area
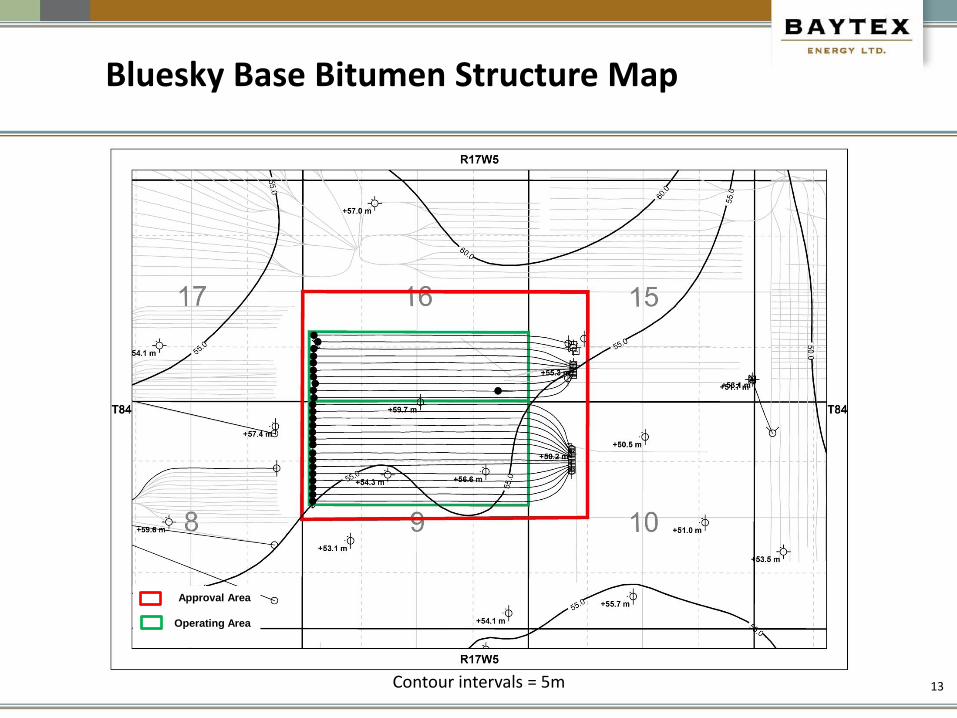
13
Approval Area
Operating Area
Bluesky Base Bitumen Structure Map
Contour intervals = 5m
14
Bluesky SS
Wilrich SH
Gething SH/SS
• Bluesky overview: fining upward sequence, fine to medium grained at base, very fine grained at top
GR≤75API Dphi≥24% RESD≥25ohms
Bluesky Type Log
15
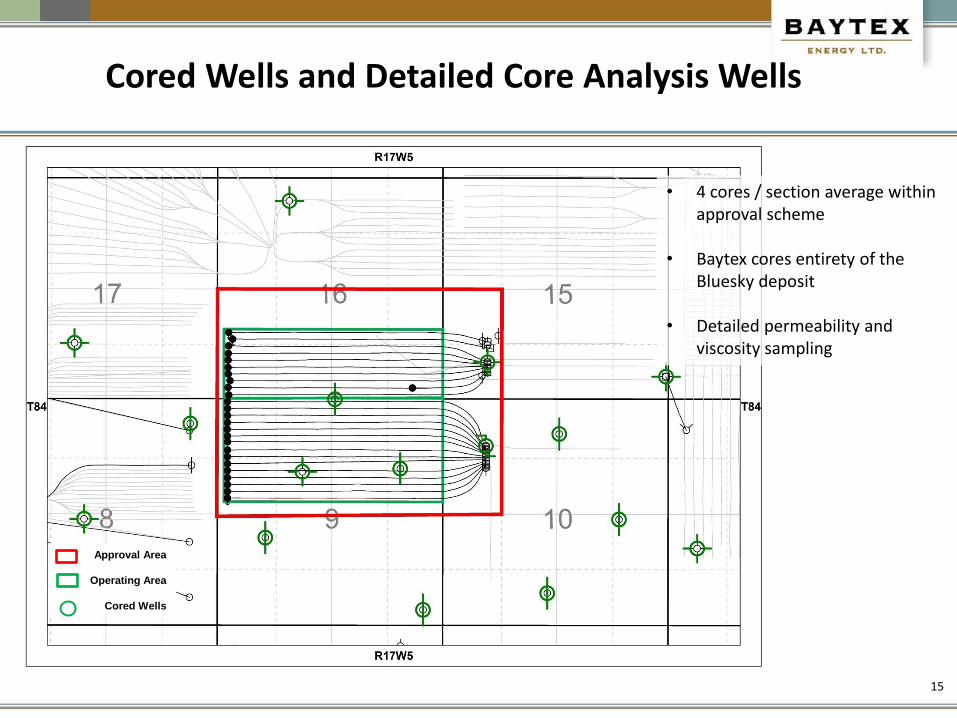
• 4 cores / section average within approval scheme
• Baytex cores entirety of the Bluesky deposit
• Detailed permeability and viscosity sampling
Approval Area
Operating Area
Cored Wells
Cored Wells and Detailed Core Analysis Wells
16
• 4 cores / section average
within approval scheme
• Baytex cores entirety of the
Bluesky deposit
• Detailed permeability and
viscosity sampling
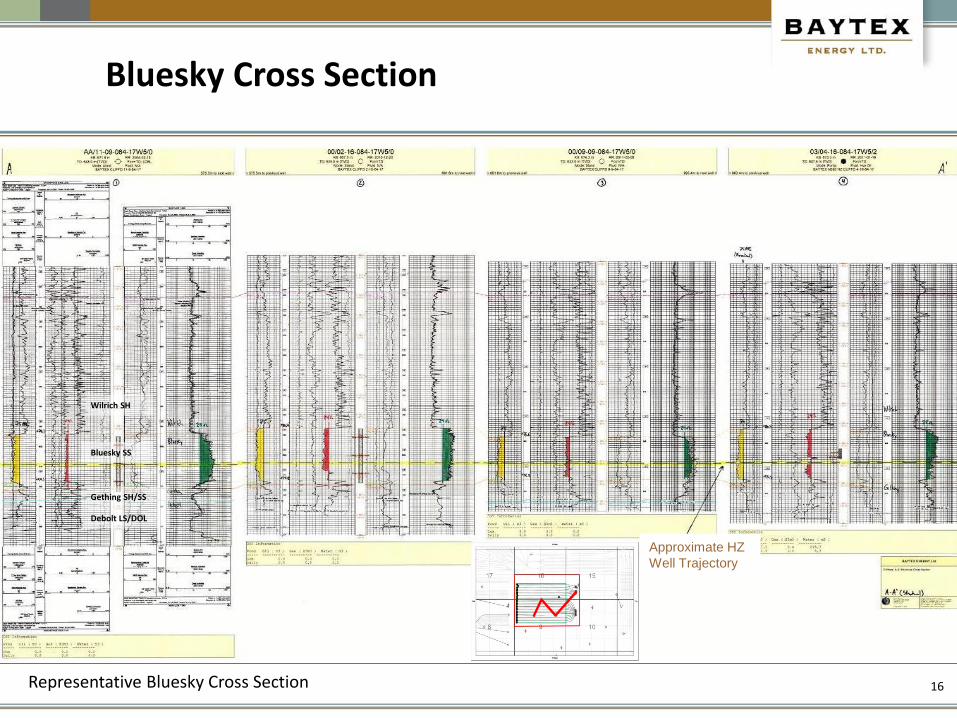
Representative Bluesky Cross Section
Wilrich SH
Bluesky SS
Gething SH/SS
Debolt LS/DOL
Bluesky Cross Section
Approximate HZ
Well Trajectory
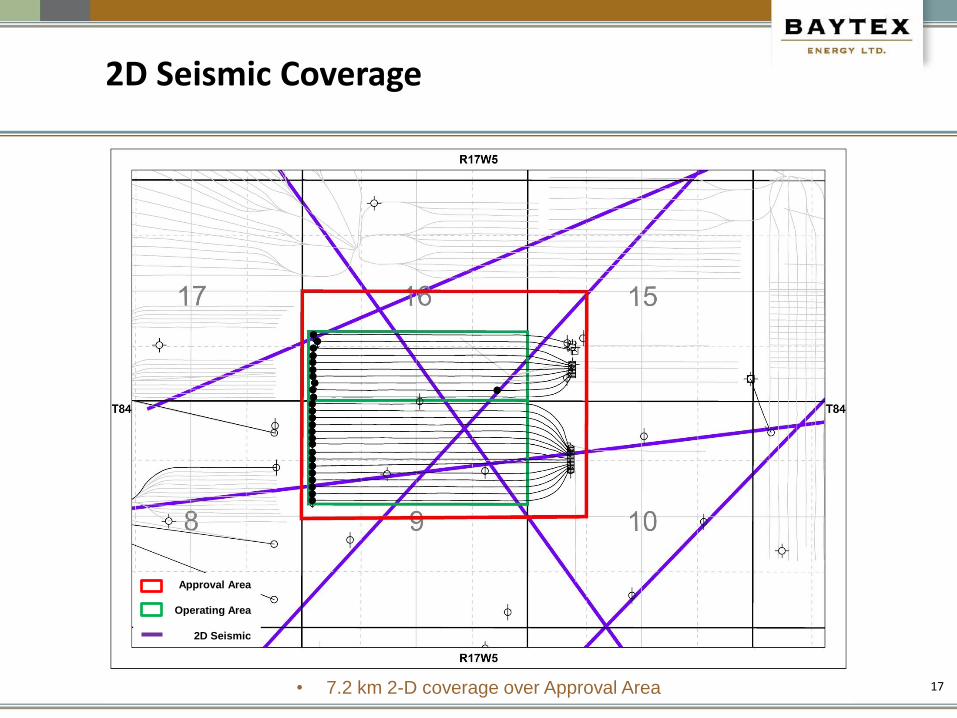
17 • 7.2 km 2-D coverage over Approval Area
Approval Area
Operating Area
2D Seismic
2D Seismic Coverage
• The Bluesky caprock is the Wilrich Shale. The Wilrich is a marine shale unit that blankets the area, covering up to 200 km2. Locally, this shale unit is in excess of 65 m thick.
• Baytex completed mini-frac testing in March 2010 at 100/01-18-084-17W5 to determine the Wilrich Shale and Bluesky formation fracture pressures.
• Fracture pressures were determined using fracture gradients which were calculated using the closure pressure after each mini-frac.
• Based on these gradients, the fracture pressures are as follows:
• Wilrich Shale: 13,000 kPag (22.6 kPag/m @ 575 m to mid-point perforations)
• Bluesky: 12,000 kPag (20.0 kPag/m @ 600 m to mid-point perforations)
• Maximum bottom-hole injection pressure is limited to 90% of Bluesky reservoir fracture – 10,800 kPag.
• Thermal operations will be conducted in a manner that will not compromise caprock integrity.
Geomechanics
18

3) Drilling and Completions
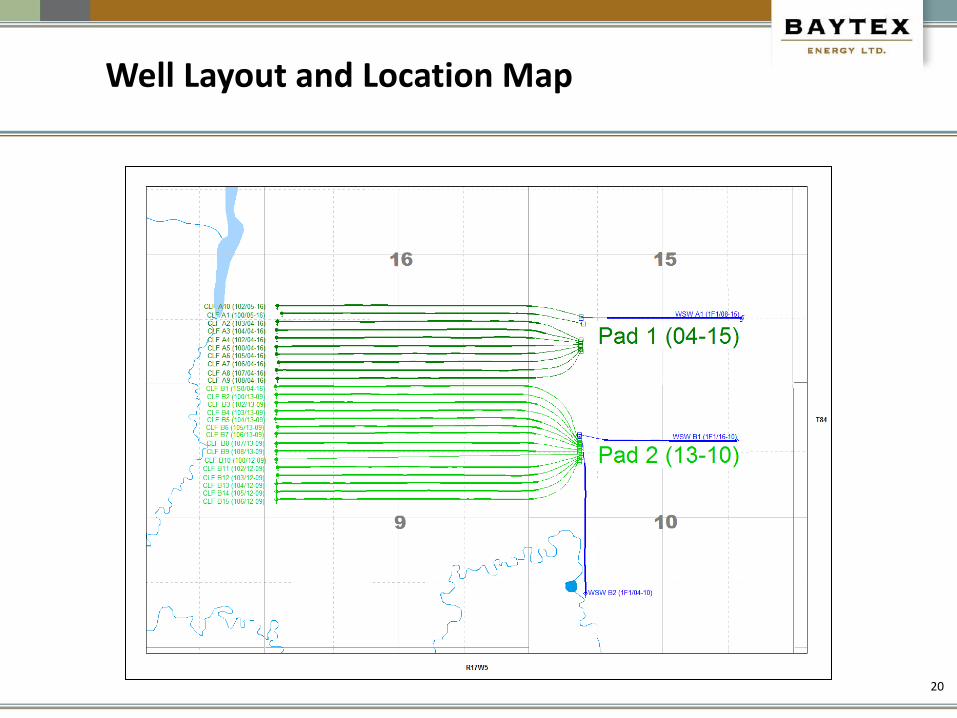
Well Layout and Location Map
20
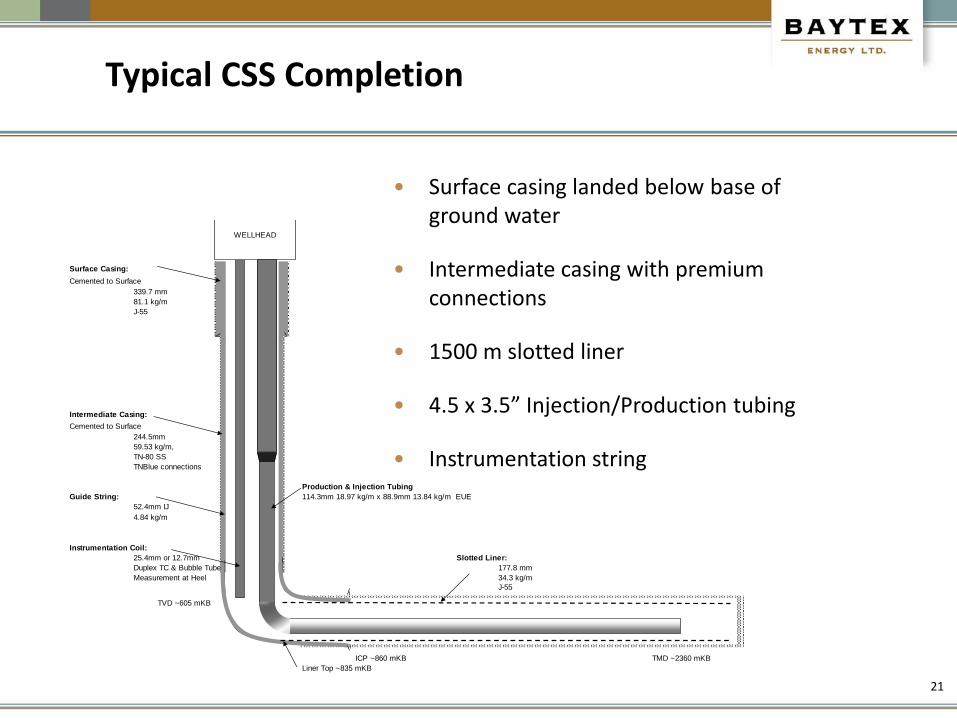
Typical CSS Completion
21
Surface Casing:
Cemented to Surface
339.7 mm
81.1 kg/m
J-55
Intermediate Casing:
Cemented to Surface
244.5mm
59.53 kg/m,
TN-80 SS
TNBlue connections
Production & Injection Tubing
Guide String: 114.3mm 18.97 kg/m x 88.9mm 13.84 kg/m EUE
52.4mm IJ
4.84 kg/m
Instrumentation Coil:
25.4mm or 12.7mm Slotted Liner:
Duplex TC & Bubble Tube 177.8 mm
Measurement at Heel 34.3 kg/m
J-55
ICP ~860 mKB TMD ~2360 mKB
Liner Top ~835 mKB
TVD ~605 mKB
WELLHEAD
• Surface casing landed below base of ground water
• Intermediate casing with premium connections
• 1500 m slotted liner
• 4.5 x 3.5” Injection/Production tubing
• Instrumentation string
4) Artificial Lift
• Progressive cavity pumps for primary production
• Rod insert pumps for thermal operations
• Conventional and hydraulic pump jacks
• Ampscot 1280-305-240
• Weatherford VSH2
• 2.5” and 3.25” rod insert pumps
• Max lift capacity 120 - 280 m3/d
• No temperature limitations
• No issues with artificial lift system
Artificial Lift
23
5) Instrumentation
Instrumentation In Wells
• Typical installation
• Bubble tube for injection/production bottom hole pressure monitoring
• Duplex thermocouples at heel
25

6) Scheme Performance
Background
Cliffdale:
• Pad 1 (04-15), operating 9 CSS wells, 1 well temporarily converted back to primary.
• 108/04-16 has been temporarily reconfigured with PCP pump
• Objective is to establish thermal conformance along the horizontal section of 1S0/04-16
• Inter-well communication with has been observed between the two aforementioned wellbores
• Pad 2 (13-10), operating 3 CSS wells, 12 primary wells that will be converted to CSS.
27
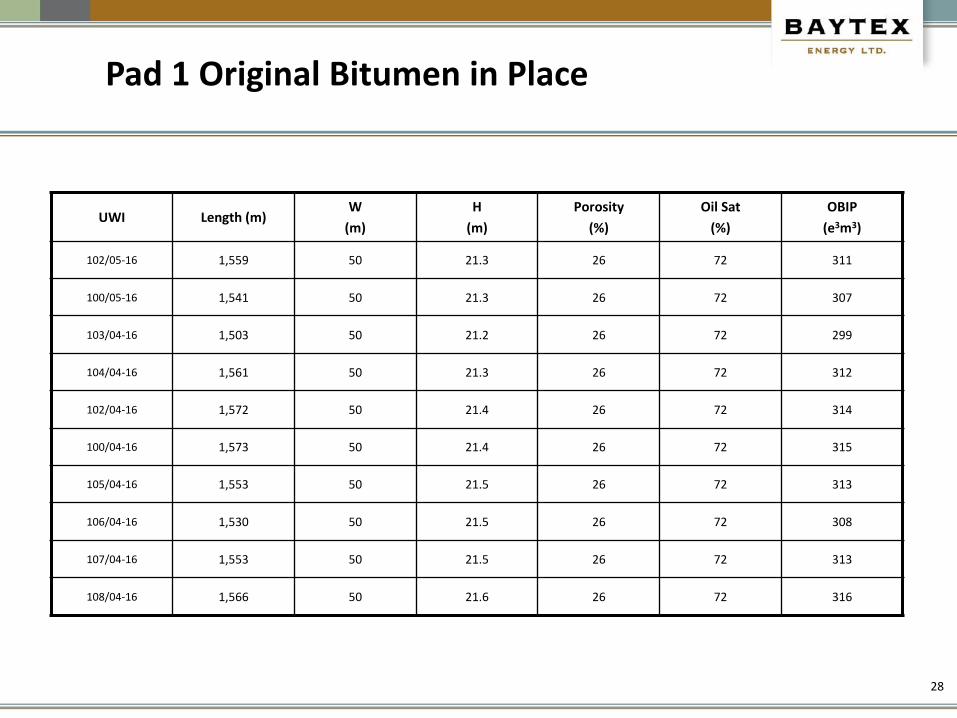
Pad 1 Original Bitumen in Place
UWI Length (m) W
(m)
H
(m)
Porosity
(%)
Oil Sat
(%)
OBIP
(e3m3)
102/05-16 1,559 50 21.3 26 72 311
100/05-16 1,541 50 21.3 26 72 307
103/04-16 1,503 50 21.2 26 72 299
104/04-16 1,561 50 21.3 26 72 312
102/04-16 1,572 50 21.4 26 72 314
100/04-16 1,573 50 21.4 26 72 315
105/04-16 1,553 50 21.5 26 72 313
106/04-16 1,530 50 21.5 26 72 308
107/04-16 1,553 50 21.5 26 72 313
108/04-16 1,566 50 21.6 26 72 316
28
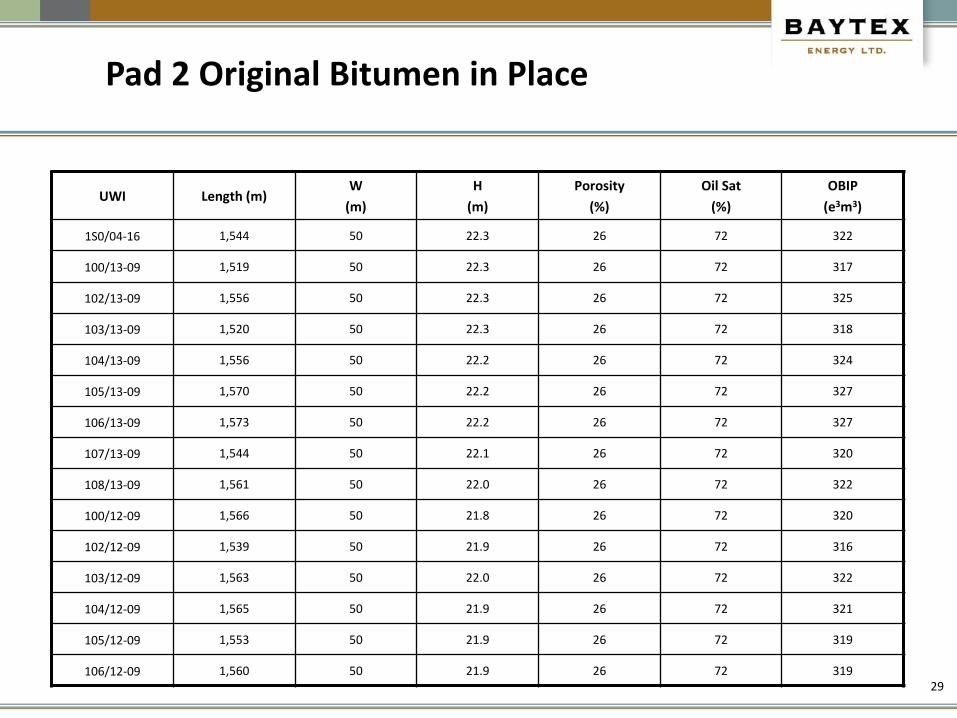
Pad 2 Original Bitumen in Place
UWI Length (m) W
(m)
H
(m)
Porosity
(%)
Oil Sat
(%)
OBIP
(e3m3)
1S0/04-16 1,544 50 22.3 26 72 322
100/13-09 1,519 50 22.3 26 72 317
102/13-09 1,556 50 22.3 26 72 325
103/13-09 1,520 50 22.3 26 72 318
104/13-09 1,556 50 22.2 26 72 324
105/13-09 1,570 50 22.2 26 72 327
106/13-09 1,573 50 22.2 26 72 327
107/13-09 1,544 50 22.1 26 72 320
108/13-09 1,561 50 22.0 26 72 322
100/12-09 1,566 50 21.8 26 72 320
102/12-09 1,539 50 21.9 26 72 316
103/12-09 1,563 50 22.0 26 72 322
104/12-09 1,565 50 21.9 26 72 321
105/12-09 1,553 50 21.9 26 72 319
106/12-09 1,560 50 21.9 26 72 319 29
Strategy and Forecasting
CSS Strategy:
• Start with a period of primary production to create voidage
• Perform multiple, short steam cycles to accelerate injectivity for subsequent cycles and maximize conformance
• Lengthen steam cycles to steady state target of ~250-300 m3/d for ~3 months (est. 22,500 m3)
CSS Forecasting:
• Utilize the early cycles of 100/05-16-084-17W5 as an analogue for the rest of the wells0
30
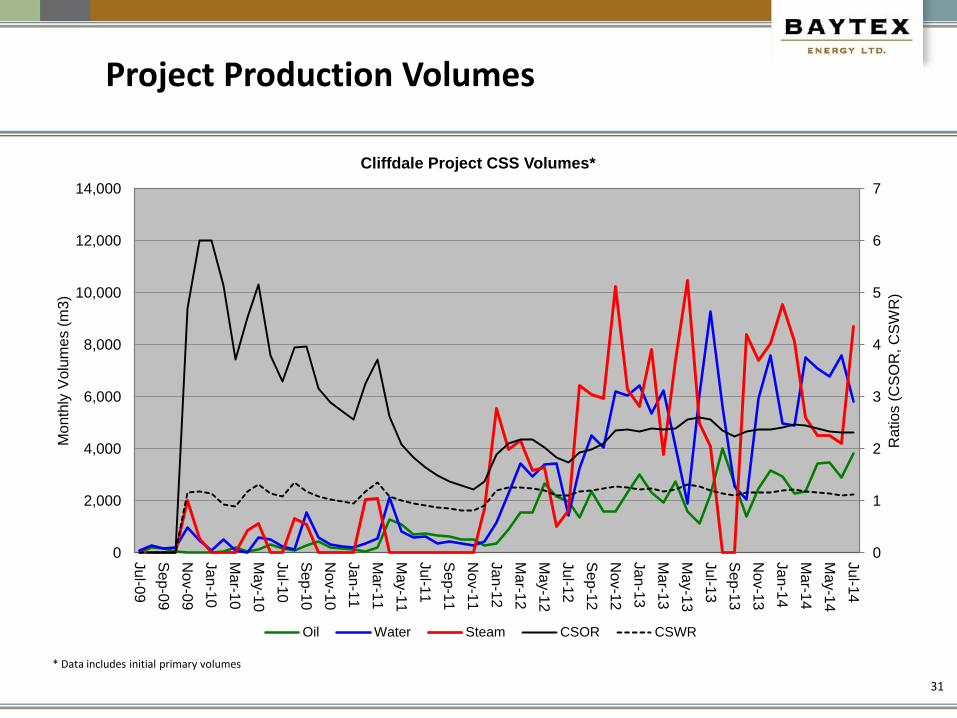
Project Production Volumes
* Data includes initial primary volumes
31
0
1
2
3
4
5
6
7
0
2,000
4,000
6,000
8,000
10,000
12,000
14,000
Jul-0
9
Sep-0
9
Nov-0
9
Jan-1
0
Mar-1
0
May-1
0
Jul-1
0
Se
p-1
0
Nov-1
0
Jan-1
1
Mar-1
1
May-1
1
Jul-1
1
Sep-1
1
Nov-1
1
Jan-1
2
Mar-1
2
May-1
2
Jul-1
2
Sep-1
2
Nov-1
2
Jan-1
3
Mar-1
3
May-1
3
Jul-1
3
Sep-1
3
Nov-1
3
Jan-1
4
Mar-1
4
May-1
4
Jul-1
4
Ratios (
CS
OR
, C
SW
R)
Month
ly V
olu
mes (
m3)
Cliffdale Project CSS Volumes*
Oil Water Steam CSOR CSWR
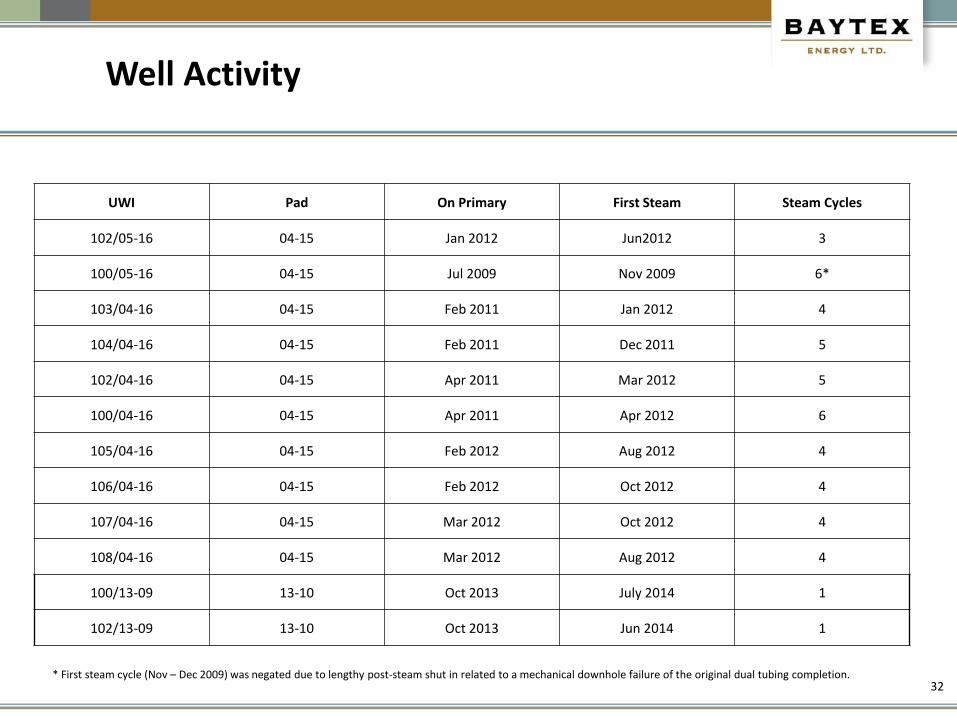
Well Activity
32 * First steam cycle (Nov – Dec 2009) was negated due to lengthy post-steam shut in related to a mechanical downhole failure of the original dual tubing completion.
UWI Pad On Primary First Steam Steam Cycles
102/05-16 04-15 Jan 2012 Jun2012 3
100/05-16 04-15 Jul 2009 Nov 2009 6*
103/04-16 04-15 Feb 2011 Jan 2012 4
104/04-16 04-15 Feb 2011 Dec 2011 5
102/04-16 04-15 Apr 2011 Mar 2012 5
100/04-16 04-15 Apr 2011 Apr 2012 6
105/04-16 04-15 Feb 2012 Aug 2012 4
106/04-16 04-15 Feb 2012 Oct 2012 4
107/04-16 04-15 Mar 2012 Oct 2012 4
108/04-16 04-15 Mar 2012 Aug 2012 4
100/13-09 13-10 Oct 2013 July 2014 1
102/13-09 13-10 Oct 2013 Jun 2014 1
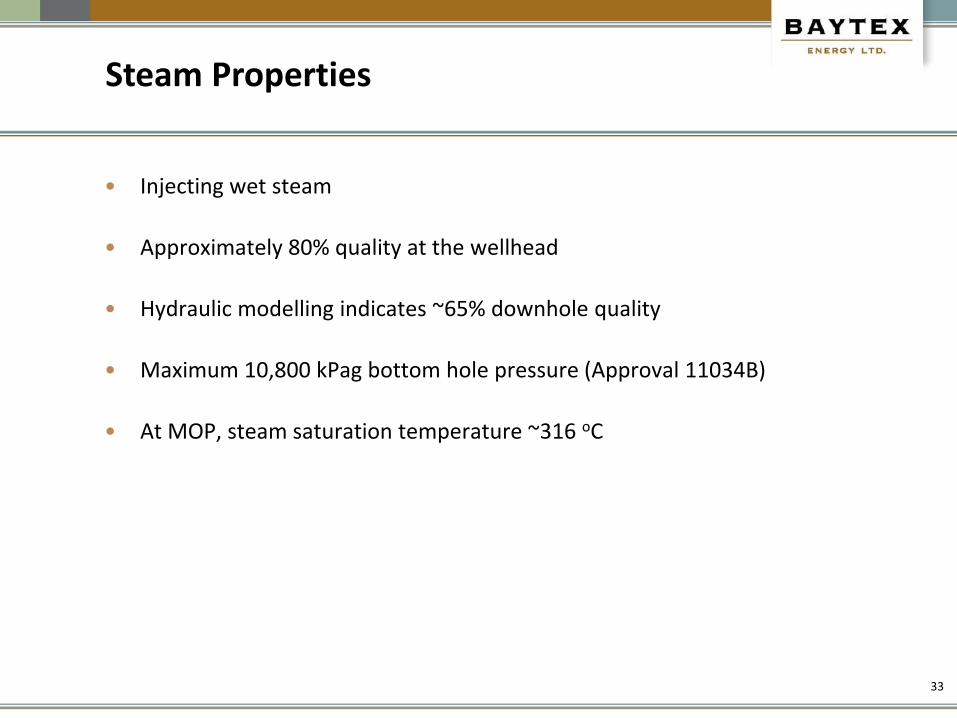
Steam Properties
• Injecting wet steam
• Approximately 80% quality at the wellhead
• Hydraulic modelling indicates ~65% downhole quality
• Maximum 10,800 kPag bottom hole pressure (Approval 11034B)
• At MOP, steam saturation temperature ~316 oC
33
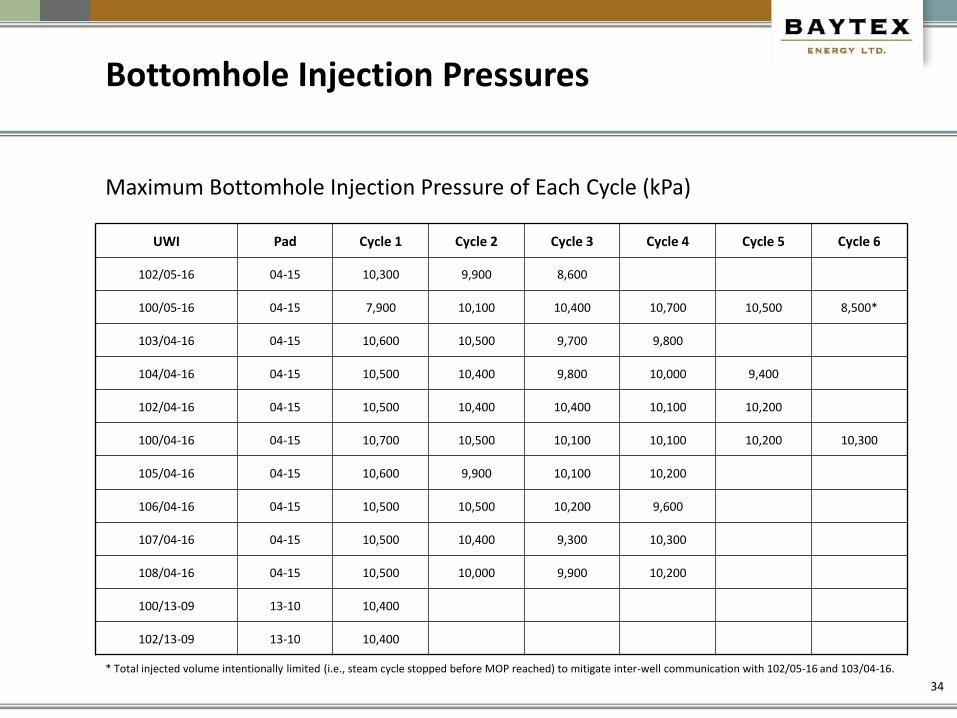
Bottomhole Injection Pressures
Maximum Bottomhole Injection Pressure of Each Cycle (kPa)
34
UWI Pad Cycle 1 Cycle 2 Cycle 3 Cycle 4 Cycle 5 Cycle 6
102/05-16 04-15 10,300 9,900 8,600
100/05-16 04-15 7,900 10,100 10,400 10,700 10,500 8,500*
103/04-16 04-15 10,600 10,500 9,700 9,800
104/04-16 04-15 10,500 10,400 9,800 10,000 9,400
102/04-16 04-15 10,500 10,400 10,400 10,100 10,200
100/04-16 04-15 10,700 10,500 10,100 10,100 10,200 10,300
105/04-16 04-15 10,600 9,900 10,100 10,200
106/04-16 04-15 10,500 10,500 10,200 9,600
107/04-16 04-15 10,500 10,400 9,300 10,300
108/04-16 04-15 10,500 10,000 9,900 10,200
100/13-09 13-10 10,400
102/13-09 13-10 10,400
* Total injected volume intentionally limited (i.e., steam cycle stopped before MOP reached) to mitigate inter-well communication with 102/05-16 and 103/04-16.
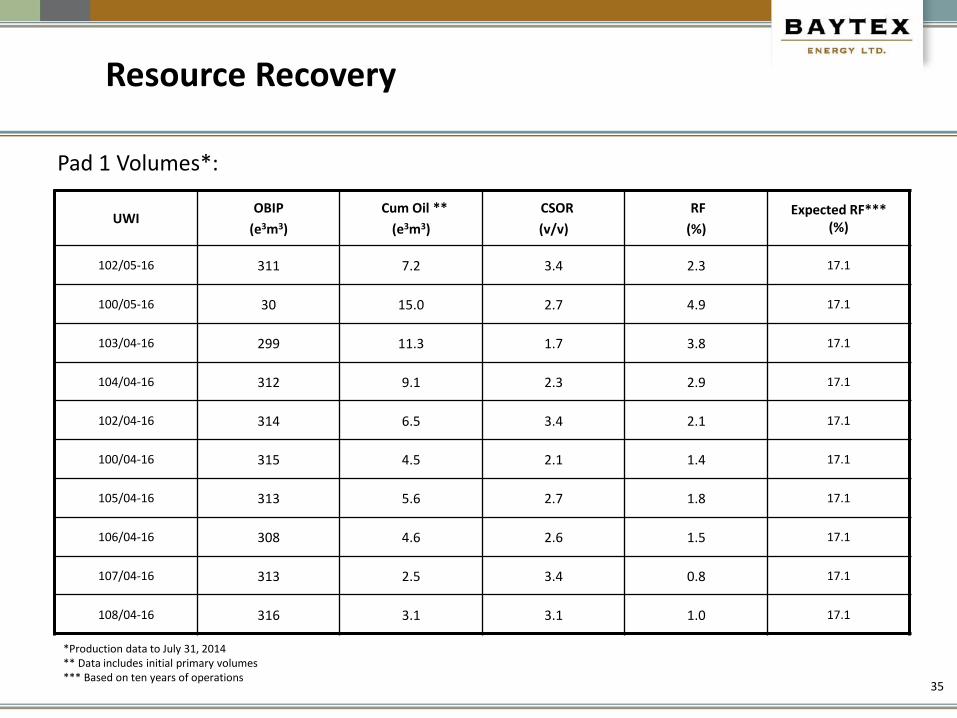
Pad 1 Volumes*:
UWI OBIP
(e3m3)
Cum Oil **
(e3m3)
CSOR
(v/v)
RF
(%)
Expected RF*** (%)
102/05-16 311 7.2 3.4 2.3 17.1
100/05-16 30 15.0 2.7 4.9 17.1
103/04-16 299 11.3 1.7 3.8 17.1
104/04-16 312 9.1 2.3 2.9 17.1
102/04-16 314 6.5 3.4 2.1 17.1
100/04-16 315 4.5 2.1 1.4 17.1
105/04-16 313 5.6 2.7 1.8 17.1
106/04-16 308 4.6 2.6 1.5 17.1
107/04-16 313 2.5 3.4 0.8 17.1
108/04-16 316 3.1 3.1 1.0 17.1
*Production data to July 31, 2014 ** Data includes initial primary volumes *** Based on ten years of operations
35
Resource Recovery
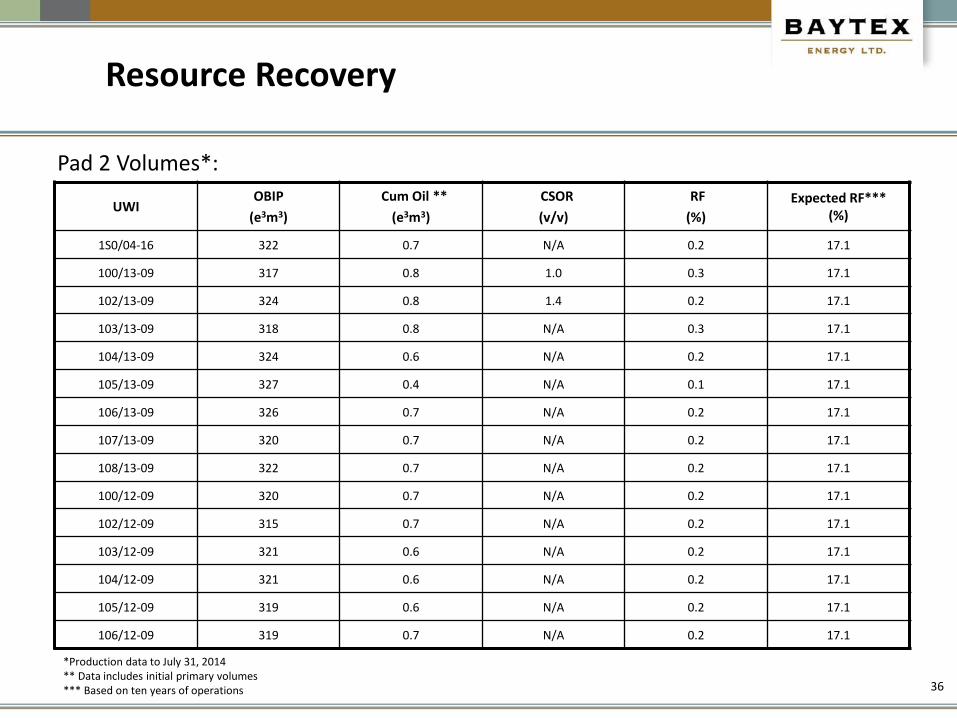
Pad 2 Volumes*:
36
UWI OBIP
(e3m3)
Cum Oil **
(e3m3)
CSOR
(v/v)
RF
(%)
Expected RF*** (%)
1S0/04-16 322 0.7 N/A 0.2 17.1
100/13-09 317 0.8 1.0 0.3 17.1
102/13-09 324 0.8 1.4 0.2 17.1
103/13-09 318 0.8 N/A 0.3 17.1
104/13-09 324 0.6 N/A 0.2 17.1
105/13-09 327 0.4 N/A 0.1 17.1
106/13-09 326 0.7 N/A 0.2 17.1
107/13-09 320 0.7 N/A 0.2 17.1
108/13-09 322 0.7 N/A 0.2 17.1
100/12-09 320 0.7 N/A 0.2 17.1
102/12-09 315 0.7 N/A 0.2 17.1
103/12-09 321 0.6 N/A 0.2 17.1
104/12-09 321 0.6 N/A 0.2 17.1
105/12-09 319 0.6 N/A 0.2 17.1
106/12-09 319 0.7 N/A 0.2 17.1
Resource Recovery
*Production data to July 31, 2014 ** Data includes initial primary volumes *** Based on ten years of operations
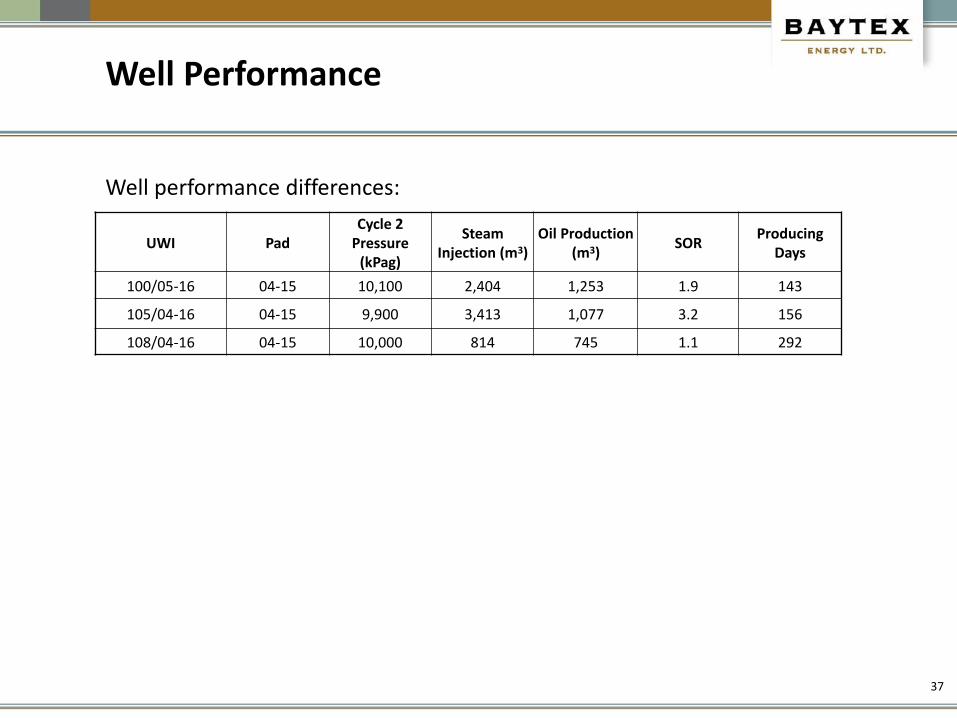
Well performance differences:
37
UWI Pad Cycle 2
Pressure (kPag)
Steam Injection (m3)
Oil Production (m3)
SOR Producing
Days
100/05-16 04-15 10,100 2,404 1,253 1.9 143
105/04-16 04-15 9,900 3,413 1,077 3.2 156
108/04-16 04-15 10,000 814 745 1.1 292
Well Performance
38
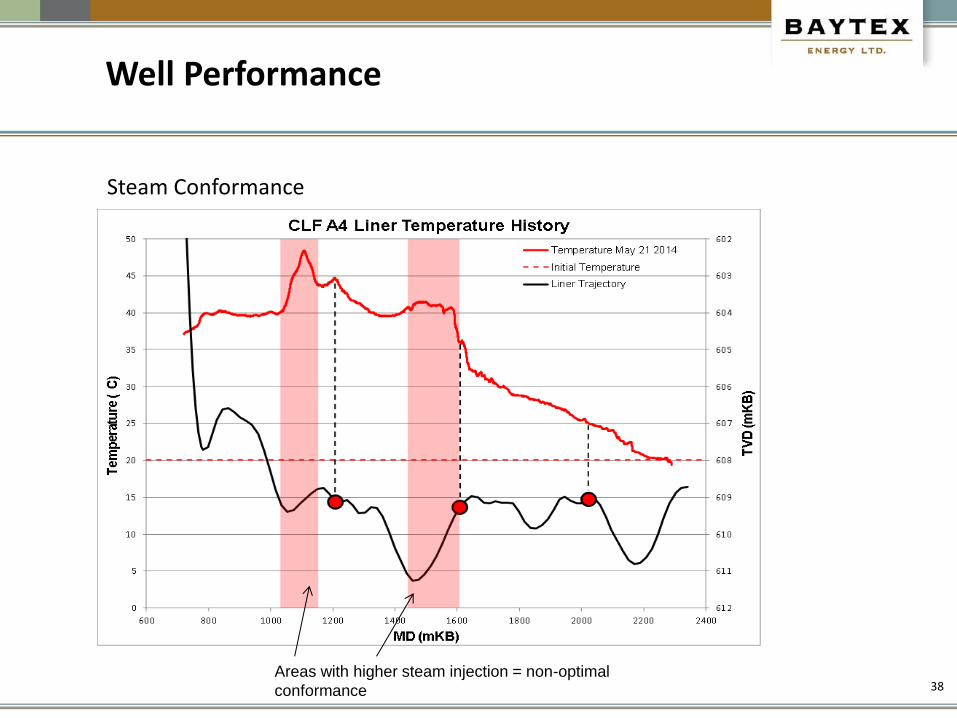
Steam Conformance
Areas with higher steam injection = non-optimal
conformance
Well Performance
39
Initiative being implemented to improve thermal conformance: • Multi-Port Injection String
• In an effort to improve longitudinal steam conformance and mitigate inter-well communication between horizontal CSS wells, a completion technique based on closed-end tubing with a linear distribution of ~30 variably sized limited-entry perforations has been implemented in the following wells:
• 102/13-09 (May 2014) • 102/04-16 (June 2014) • 104/04-16 (July 2014) • 103/04-16 (July 2014) • 100/13-09 (July 2014) • 103/13-09 (August 2014)
Steam Conformance (cont.)
Well Performance
40
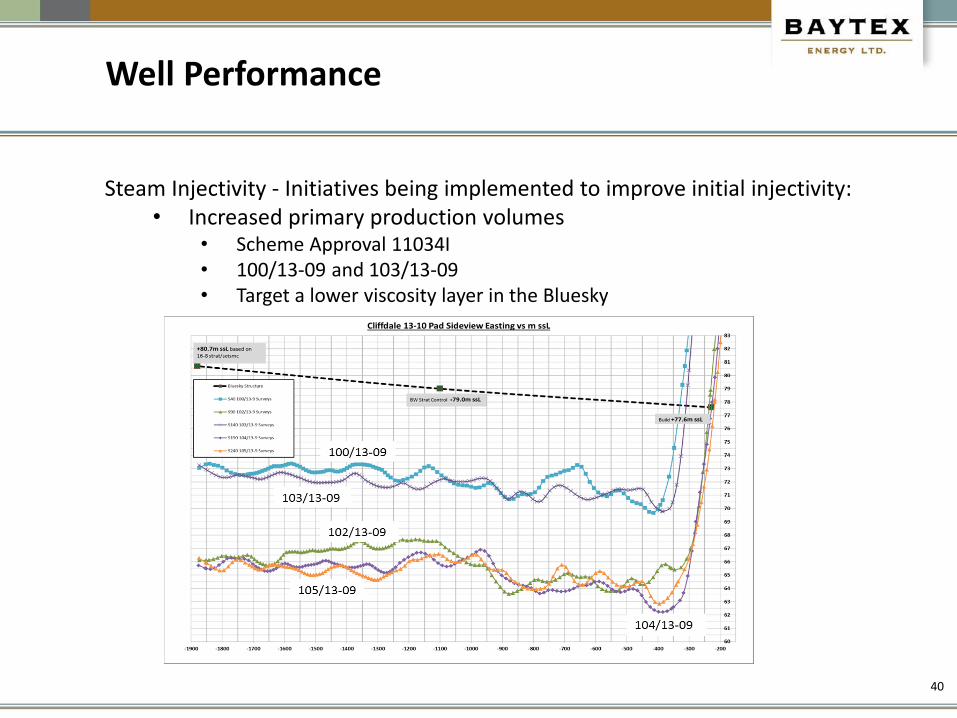
Steam Injectivity - Initiatives being implemented to improve initial injectivity: • Increased primary production volumes
• Scheme Approval 11034I • 100/13-09 and 103/13-09 • Target a lower viscosity layer in the Bluesky
Well Performance
41
Steam Injectivity - Initiatives being implemented to improve initial injectivity
Well Performance
• Solvent soak • Scheme Approval 11034K • Stimulate near-wellbore zone with a small volume of diluent • 150 m3 of diesel was injected into 103/13-09 August 2014 • Injected volumes reported in PETRINEX as load fluid
Surface Casing:
Cemented to Surface
339.7 mm
81.1 kg/m
J-55
Landed 177 mKB
Intermediate Casing:
Cemented to Surface
244.5mm
59.53 kg/m,
TN-80 SS
TNBlue connections
Landed 872 mKB
Production & Injection Tubing
Guide String: 3.5" EUE
52.4mm IJ 13.84 kg/m
4.84 kg/m Landed 927.7 mKB
Blank Liner:
Instrumentation Coil: 177.8 mm
25.4mm CT 34.3 kg/m
Duplex TC & Bubble Tube J-55
755 mKB (597 m TVD) Landed 1,004 mKB
Measurement at Heel Open-Hole 1,004 - 2,379 mKB
ICP 872 mKB TMD 2,379 mKB
Liner Top 859 mKB
TVD 609.5 mKB
WELLHEAD
42
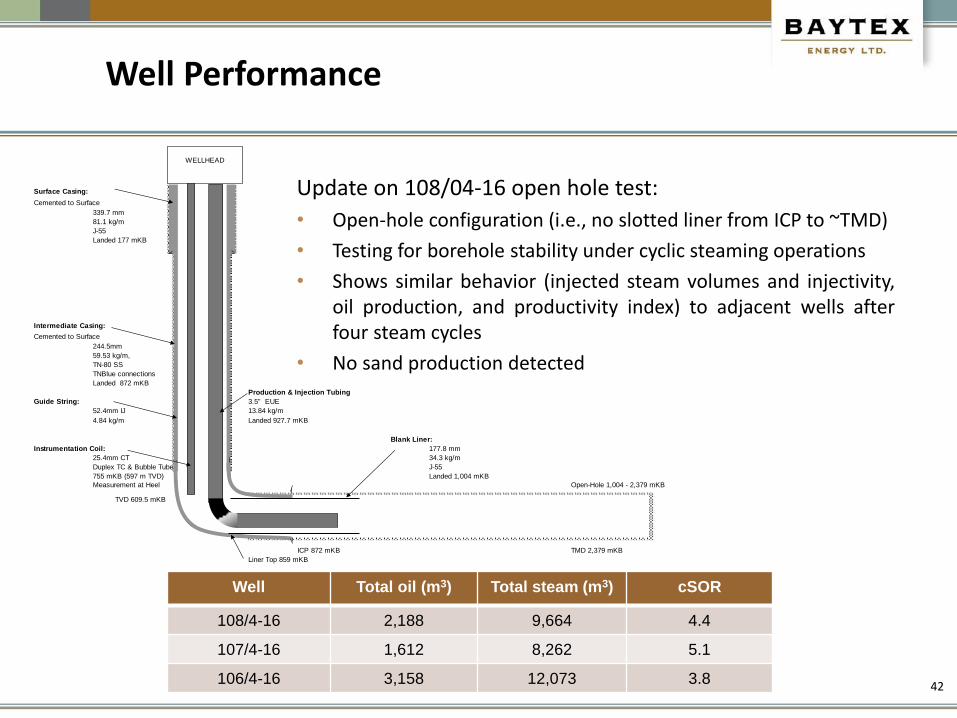
Well Total oil (m3) Total steam (m3) cSOR
108/4-16 2,188 9,664 4.4
107/4-16 1,612 8,262 5.1
106/4-16 3,158 12,073 3.8
Update on 108/04-16 open hole test:
• Open-hole configuration (i.e., no slotted liner from ICP to ~TMD)
• Testing for borehole stability under cyclic steaming operations
• Shows similar behavior (injected steam volumes and injectivity, oil production, and productivity index) to adjacent wells after four steam cycles
• No sand production detected
Well Performance
7) Future Plans
Future Plans
44
Dual String Completions - Under Evaluation • Ability to inject and produce without having to re-complete the wells. • Lower operating costs • Lower heat losses • Higher efficiency
Surface
1) Facilities
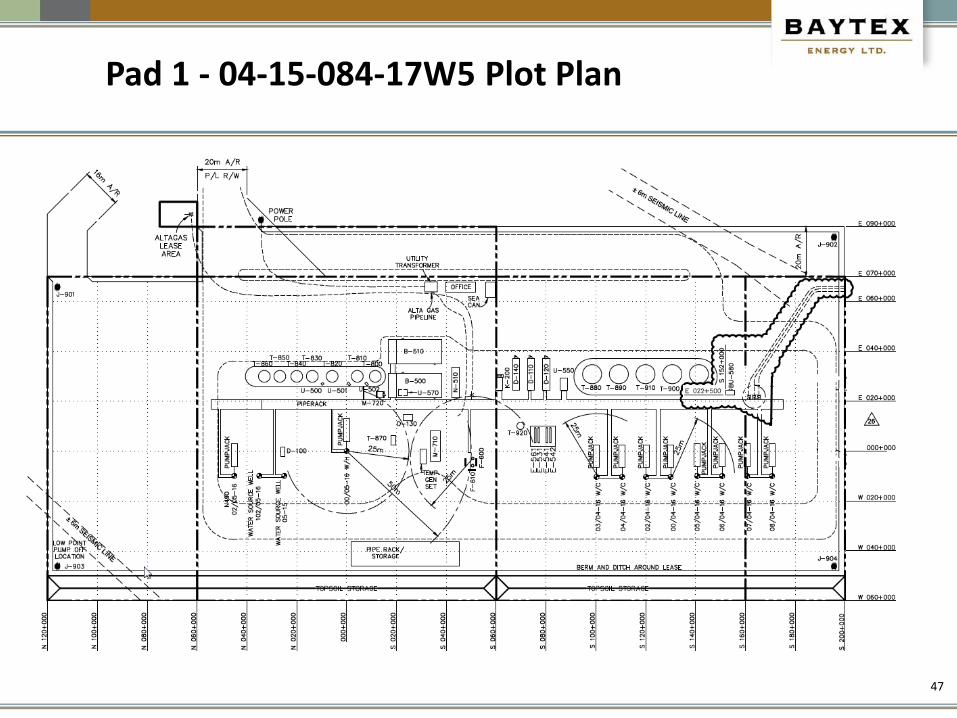
Pad 1 - 04-15-084-17W5 Plot Plan
47
48
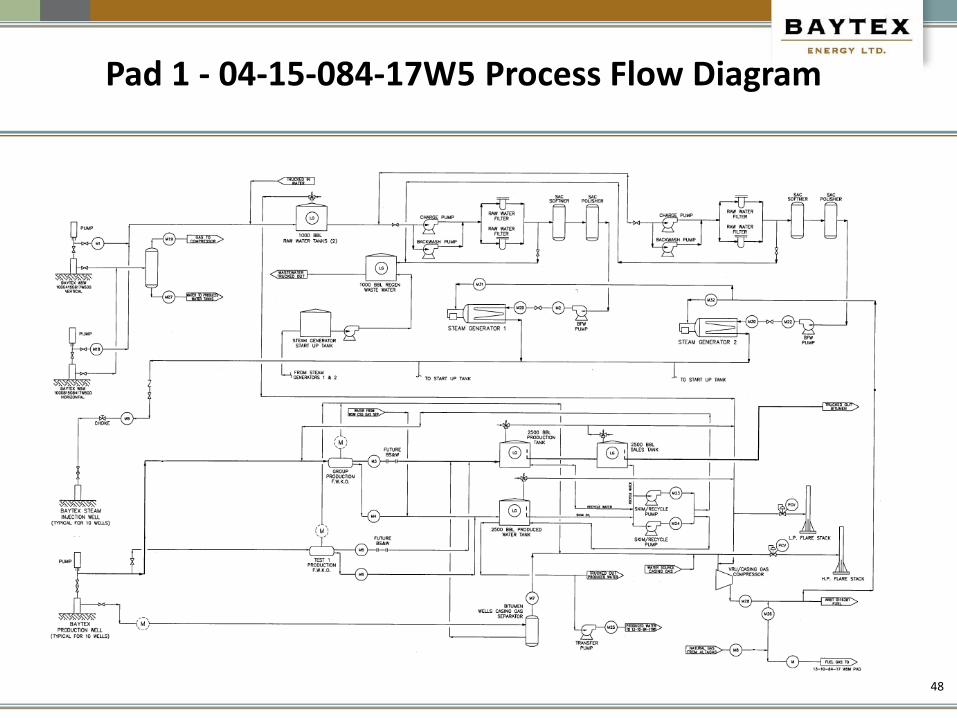
Pad 1 - 04-15-084-17W5 Process Flow Diagram

49
Pad 2 – 13-10-084-17W5 Plot Plan
50
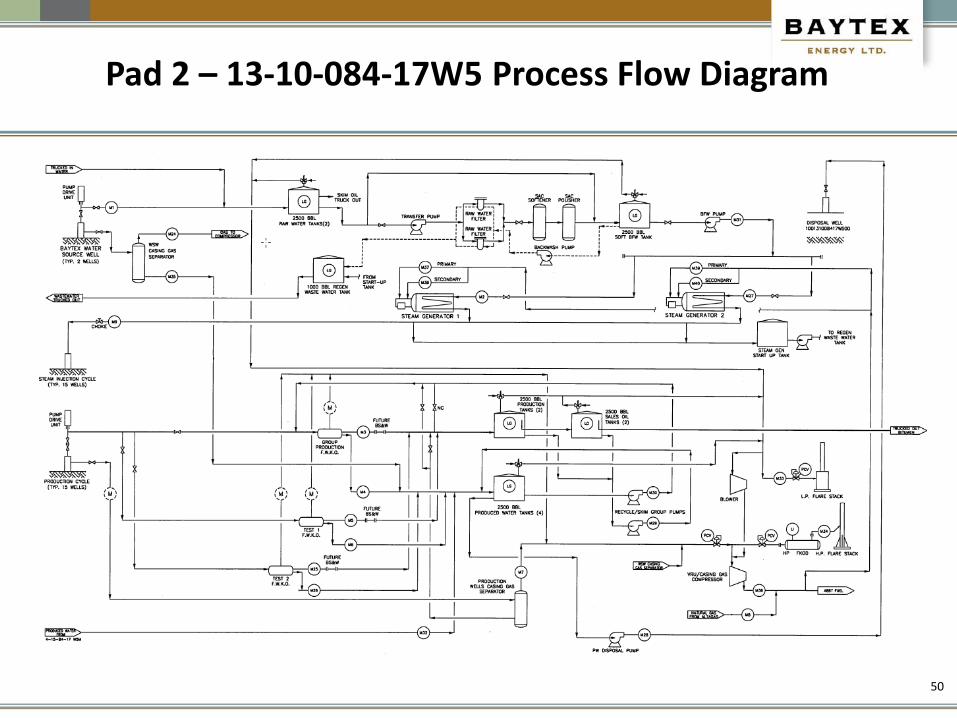
Pad 2 – 13-10-084-17W5 Process Flow Diagram
2) Facility Performance
Facility Performance
52
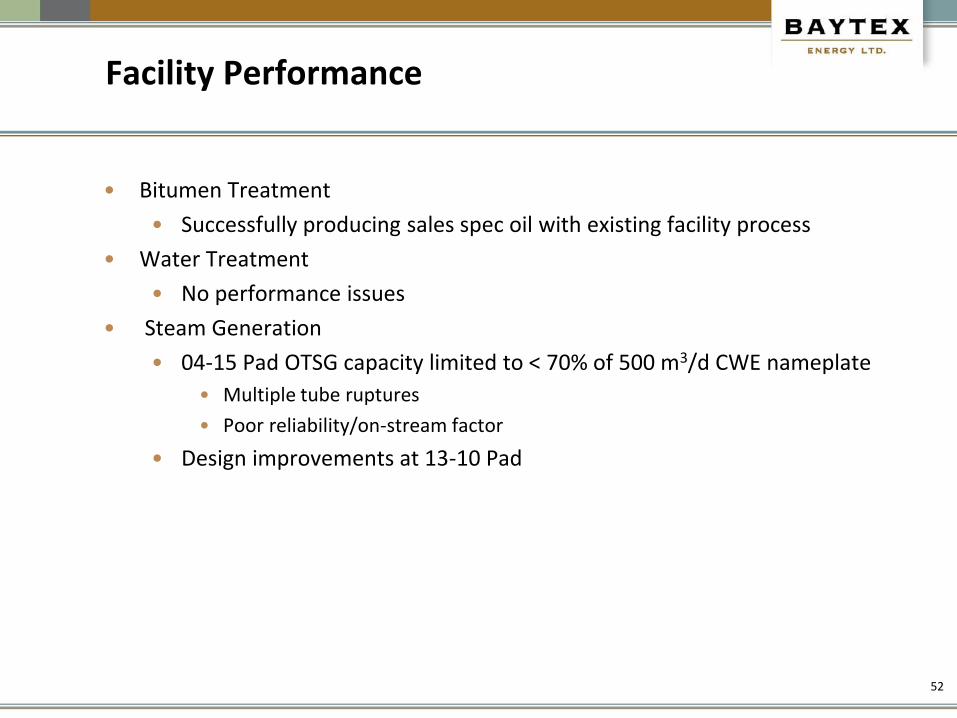
• Bitumen Treatment
• Successfully producing sales spec oil with existing facility process
• Water Treatment
• No performance issues
• Steam Generation
• 04-15 Pad OTSG capacity limited to < 70% of 500 m3/d CWE nameplate
• Multiple tube ruptures
• Poor reliability/on-stream factor
• Design improvements at 13-10 Pad
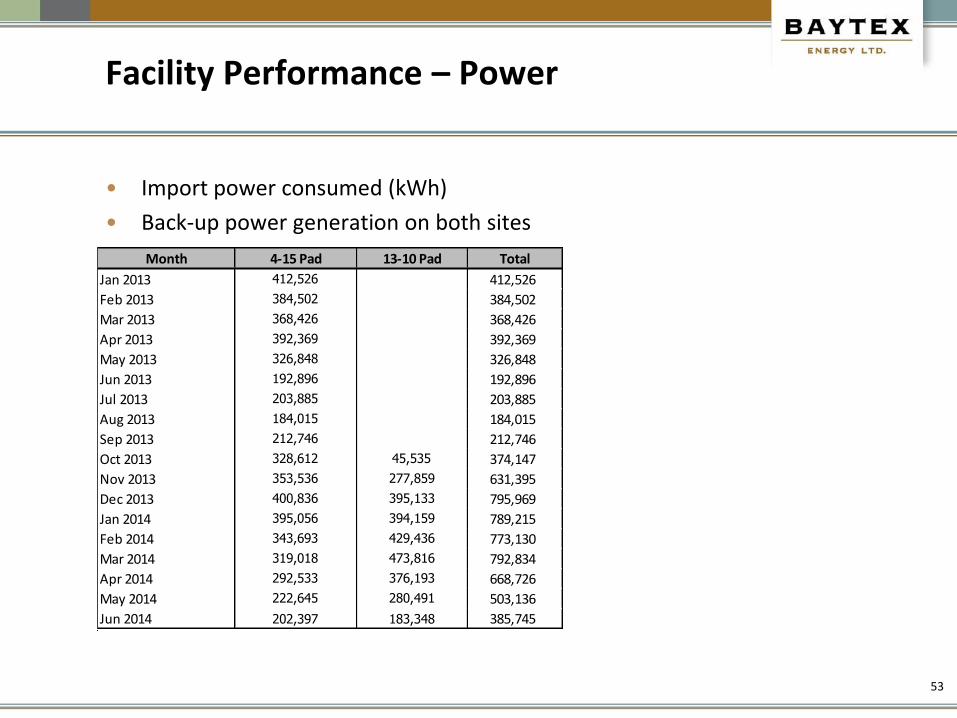
Facility Performance – Power
53
• Import power consumed (kWh)
• Back-up power generation on both sites
Month 4-15 Pad 13-10 Pad Total
Jan 2013 412,526 412,526
Feb 2013 384,502 384,502
Mar 2013 368,426 368,426
Apr 2013 392,369 392,369
May 2013 326,848 326,848
Jun 2013 192,896 192,896
Jul 2013 203,885 203,885
Aug 2013 184,015 184,015
Sep 2013 212,746 212,746
Oct 2013 328,612 45,535 374,147
Nov 2013 353,536 277,859 631,395
Dec 2013 400,836 395,133 795,969
Jan 2014 395,056 394,159 789,215
Feb 2014 343,693 429,436 773,130
Mar 2014 319,018 473,816 792,834
Apr 2014 292,533 376,193 668,726
May 2014 222,645 280,491 503,136
Jun 2014 202,397 183,348 385,745
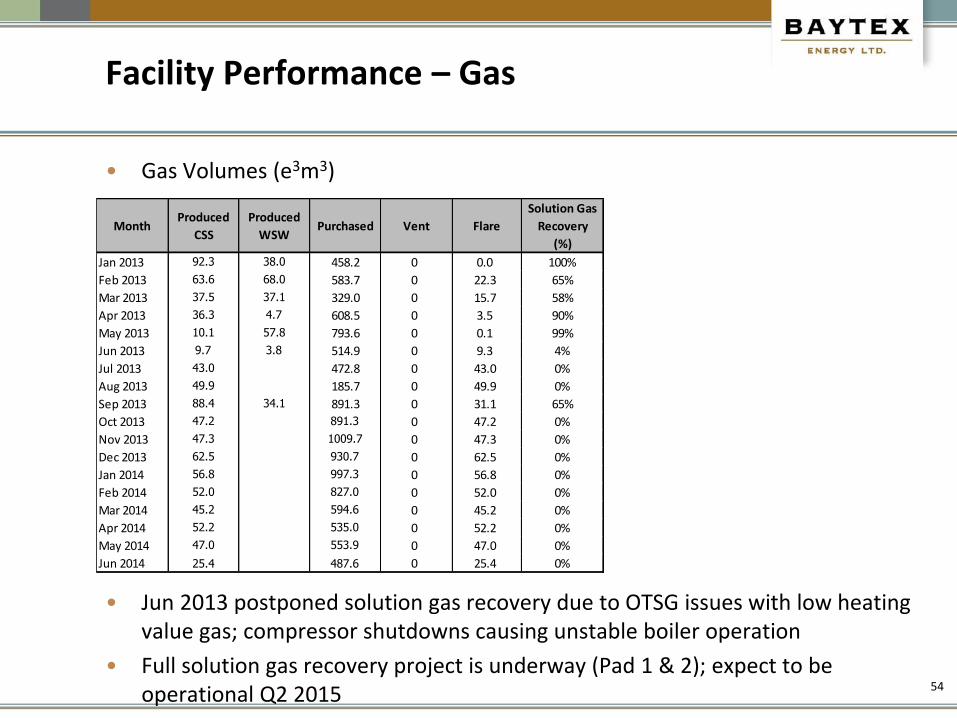
Facility Performance – Gas
54
• Gas Volumes (e3m3)
Month
Produced
CSS
Produced
WSWPurchased Vent Flare
Solution Gas
Recovery
(%)
Jan 2013 92.3 38.0 458.2 0 0.0 100%
Feb 2013 63.6 68.0 583.7 0 22.3 65%
Mar 2013 37.5 37.1 329.0 0 15.7 58%
Apr 2013 36.3 4.7 608.5 0 3.5 90%
May 2013 10.1 57.8 793.6 0 0.1 99%
Jun 2013 9.7 3.8 514.9 0 9.3 4%
Jul 2013 43.0 472.8 0 43.0 0%
Aug 2013 49.9 185.7 0 49.9 0%
Sep 2013 88.4 34.1 891.3 0 31.1 65%
Oct 2013 47.2 891.3 0 47.2 0%
Nov 2013 47.3 1009.7 0 47.3 0%
Dec 2013 62.5 930.7 0 62.5 0%
Jan 2014 56.8 997.3 0 56.8 0%
Feb 2014 52.0 827.0 0 52.0 0%
Mar 2014 45.2 594.6 0 45.2 0%
Apr 2014 52.2 535.0 0 52.2 0%
May 2014 47.0 553.9 0 47.0 0%
Jun 2014 25.4 487.6 0 25.4 0%
• Jun 2013 postponed solution gas recovery due to OTSG issues with low heating value gas; compressor shutdowns causing unstable boiler operation
• Full solution gas recovery project is underway (Pad 1 & 2); expect to be operational Q2 2015
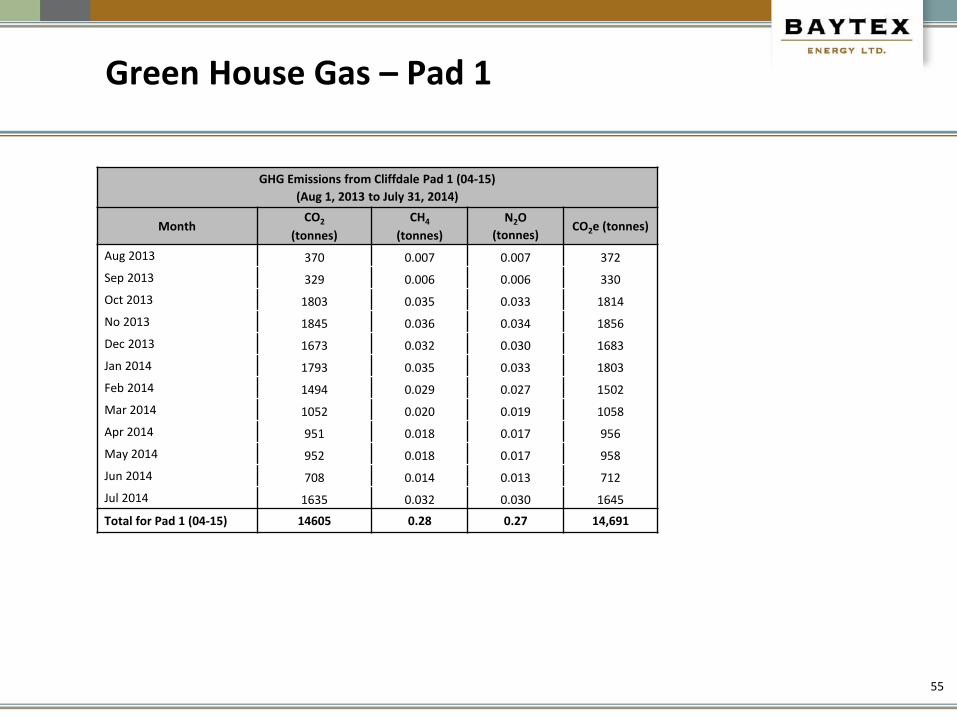
Green House Gas – Pad 1
55
GHG Emissions from Cliffdale Pad 1 (04-15)
(Aug 1, 2013 to July 31, 2014)
Month CO2
(tonnes)
CH4
(tonnes)
N2O
(tonnes) CO2e (tonnes)
Aug 2013 370 0.007 0.007 372
Sep 2013 329 0.006 0.006 330
Oct 2013 1803 0.035 0.033 1814
No 2013 1845 0.036 0.034 1856
Dec 2013 1673 0.032 0.030 1683
Jan 2014 1793 0.035 0.033 1803
Feb 2014 1494 0.029 0.027 1502
Mar 2014 1052 0.020 0.019 1058
Apr 2014 951 0.018 0.017 956
May 2014 952 0.018 0.017 958
Jun 2014 708 0.014 0.013 712
Jul 2014 1635 0.032 0.030 1645
Total for Pad 1 (04-15) 14605 0.28 0.27 14,691
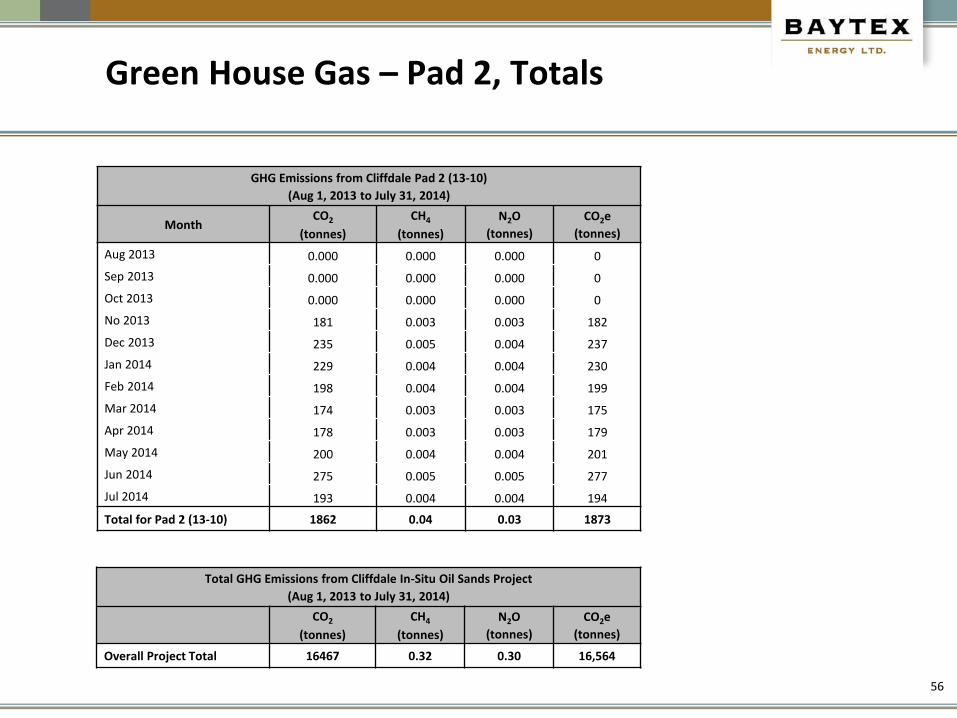
Green House Gas – Pad 2, Totals
56
GHG Emissions from Cliffdale Pad 2 (13-10)
(Aug 1, 2013 to July 31, 2014)
Month CO2
(tonnes)
CH4
(tonnes)
N2O
(tonnes)
CO2e
(tonnes)
Aug 2013 0.000 0.000 0.000 0
Sep 2013 0.000 0.000 0.000 0
Oct 2013 0.000 0.000 0.000 0
No 2013 181 0.003 0.003 182
Dec 2013 235 0.005 0.004 237
Jan 2014 229 0.004 0.004 230
Feb 2014 198 0.004 0.004 199
Mar 2014 174 0.003 0.003 175
Apr 2014 178 0.003 0.003 179
May 2014 200 0.004 0.004 201
Jun 2014 275 0.005 0.005 277
Jul 2014 193 0.004 0.004 194
Total for Pad 2 (13-10) 1862 0.04 0.03 1873
Total GHG Emissions from Cliffdale In-Situ Oil Sands Project
(Aug 1, 2013 to July 31, 2014)
CO2
(tonnes)
CH4
(tonnes)
N2O
(tonnes)
CO2e
(tonnes)
Overall Project Total 16467 0.32 0.30 16,564
3) Measurement and Reporting
Measurement and Reporting
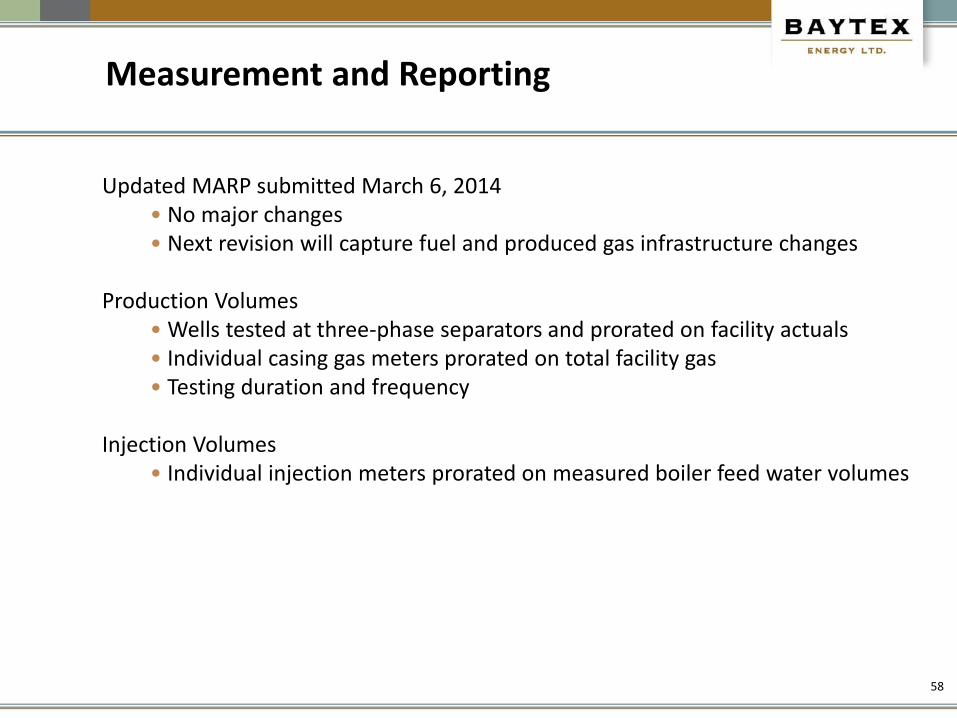
Updated MARP submitted March 6, 2014 • No major changes • Next revision will capture fuel and produced gas infrastructure changes
Production Volumes • Wells tested at three-phase separators and prorated on facility actuals • Individual casing gas meters prorated on total facility gas • Testing duration and frequency
Injection Volumes
• Individual injection meters prorated on measured boiler feed water volumes
58
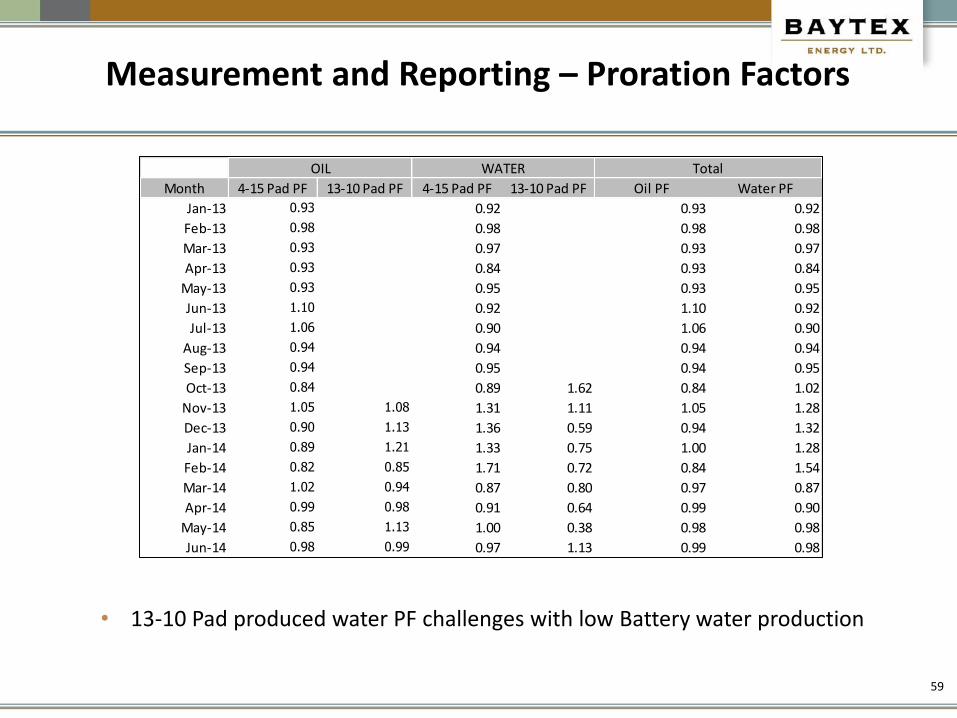
Measurement and Reporting – Proration Factors
59
• 13-10 Pad produced water PF challenges with low Battery water production
Month 4-15 Pad PF 13-10 Pad PF 4-15 Pad PF 13-10 Pad PF Oil PF Water PF
Jan-13 0.93 0.92 0.93 0.92
Feb-13 0.98 0.98 0.98 0.98
Mar-13 0.93 0.97 0.93 0.97
Apr-13 0.93 0.84 0.93 0.84
May-13 0.93 0.95 0.93 0.95
Jun-13 1.10 0.92 1.10 0.92
Jul-13 1.06 0.90 1.06 0.90
Aug-13 0.94 0.94 0.94 0.94
Sep-13 0.94 0.95 0.94 0.95
Oct-13 0.84 0.89 1.62 0.84 1.02
Nov-13 1.05 1.08 1.31 1.11 1.05 1.28
Dec-13 0.90 1.13 1.36 0.59 0.94 1.32
Jan-14 0.89 1.21 1.33 0.75 1.00 1.28
Feb-14 0.82 0.85 1.71 0.72 0.84 1.54
Mar-14 1.02 0.94 0.87 0.80 0.97 0.87
Apr-14 0.99 0.98 0.91 0.64 0.99 0.90
May-14 0.85 1.13 1.00 0.38 0.98 0.98
Jun-14 0.98 0.99 0.97 1.13 0.99 0.98
OIL WATER Total
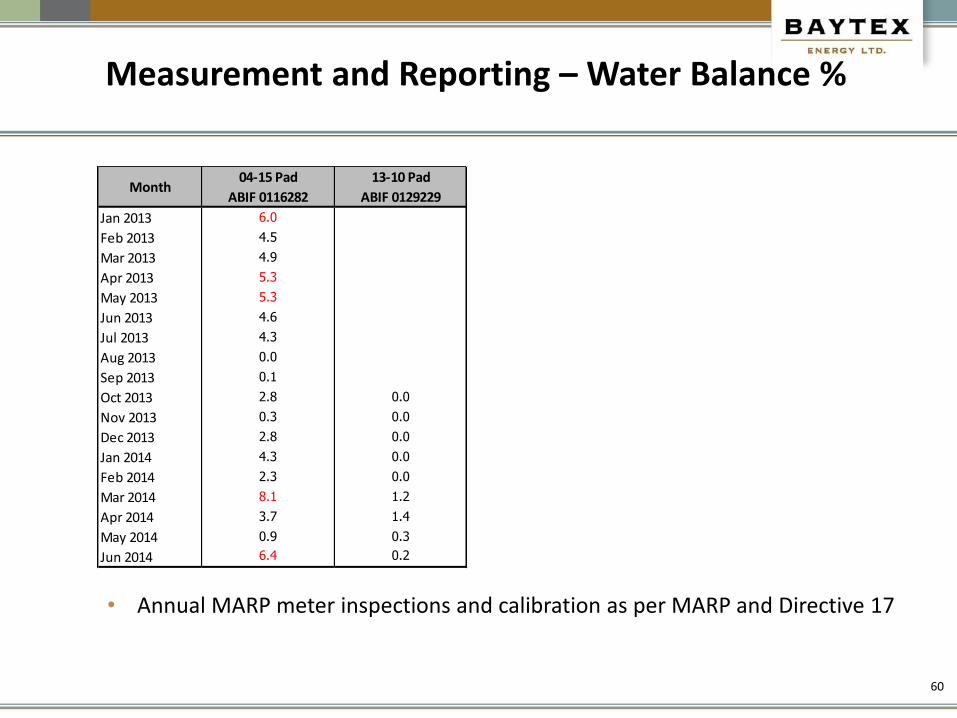
Measurement and Reporting – Water Balance %
60
04-15 Pad 13-10 Pad
ABIF 0116282 ABIF 0129229
Jan 2013 6.0
Feb 2013 4.5
Mar 2013 4.9
Apr 2013 5.3
May 2013 5.3
Jun 2013 4.6
Jul 2013 4.3
Aug 2013 0.0
Sep 2013 0.1
Oct 2013 2.8 0.0
Nov 2013 0.3 0.0
Dec 2013 2.8 0.0
Jan 2014 4.3 0.0
Feb 2014 2.3 0.0
Mar 2014 8.1 1.2
Apr 2014 3.7 1.4
May 2014 0.9 0.3
Jun 2014 6.4 0.2
Month
• Annual MARP meter inspections and calibration as per MARP and Directive 17
4) Water Production and Usage
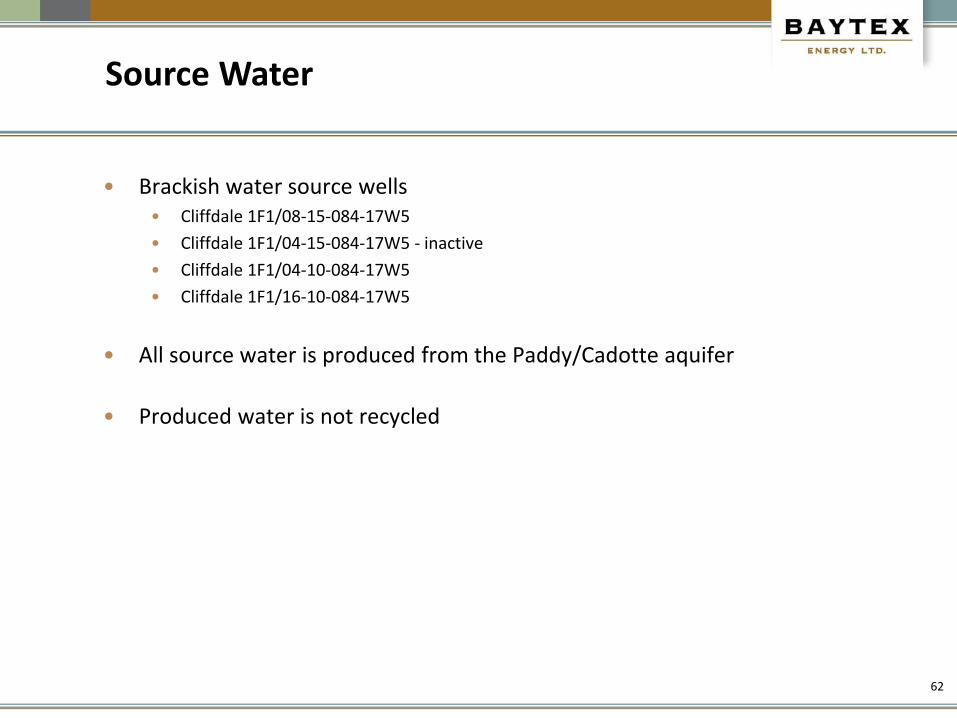
Source Water
• Brackish water source wells • Cliffdale 1F1/08-15-084-17W5
• Cliffdale 1F1/04-15-084-17W5 - inactive
• Cliffdale 1F1/04-10-084-17W5
• Cliffdale 1F1/16-10-084-17W5
• All source water is produced from the Paddy/Cadotte aquifer
• Produced water is not recycled
62
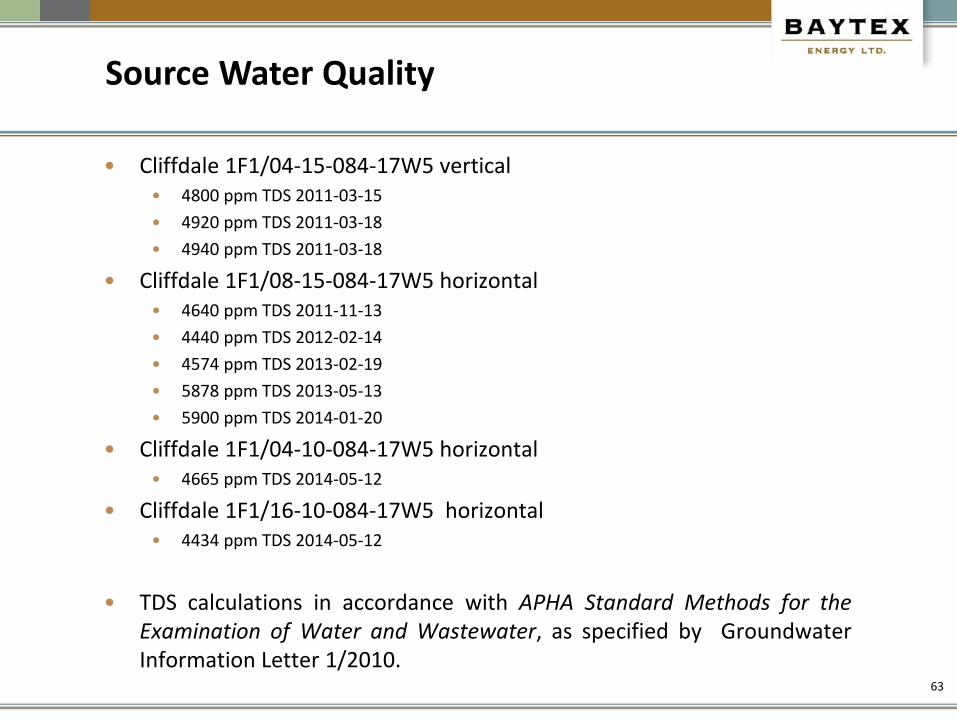
• Cliffdale 1F1/04-15-084-17W5 vertical • 4800 ppm TDS 2011-03-15
• 4920 ppm TDS 2011-03-18
• 4940 ppm TDS 2011-03-18
• Cliffdale 1F1/08-15-084-17W5 horizontal • 4640 ppm TDS 2011-11-13
• 4440 ppm TDS 2012-02-14
• 4574 ppm TDS 2013-02-19
• 5878 ppm TDS 2013-05-13
• 5900 ppm TDS 2014-01-20
• Cliffdale 1F1/04-10-084-17W5 horizontal • 4665 ppm TDS 2014-05-12
• Cliffdale 1F1/16-10-084-17W5 horizontal • 4434 ppm TDS 2014-05-12
• TDS calculations in accordance with APHA Standard Methods for the Examination of Water and Wastewater, as specified by Groundwater Information Letter 1/2010.
63
Source Water Quality
64
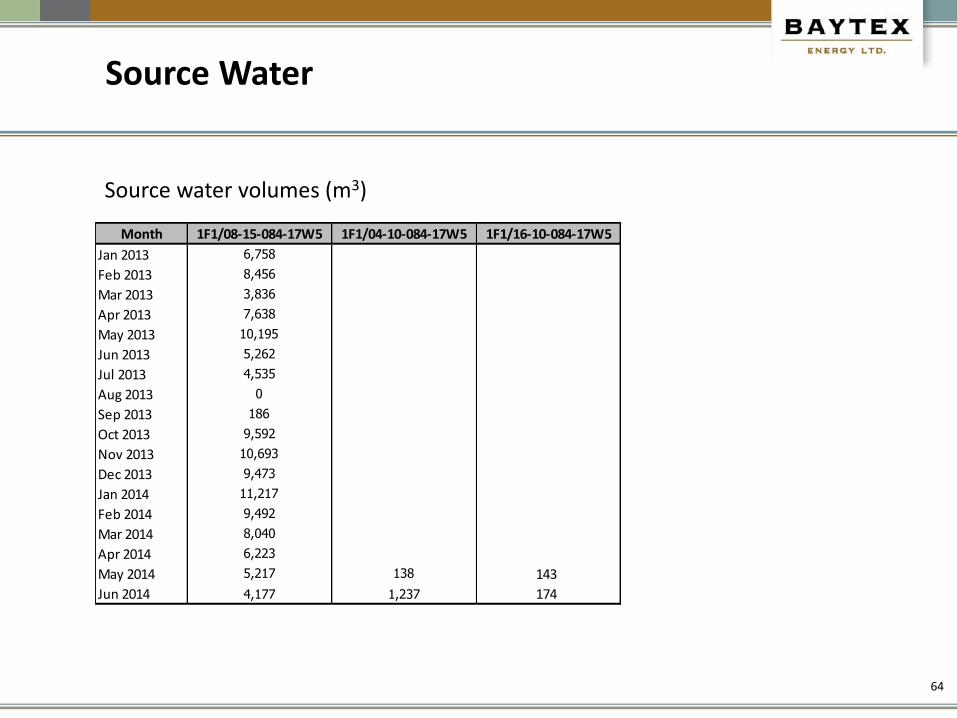
Month 1F1/08-15-084-17W5 1F1/04-10-084-17W5 1F1/16-10-084-17W5
Jan 2013 6,758
Feb 2013 8,456
Mar 2013 3,836
Apr 2013 7,638
May 2013 10,195
Jun 2013 5,262
Jul 2013 4,535
Aug 2013 0
Sep 2013 186
Oct 2013 9,592
Nov 2013 10,693
Dec 2013 9,473
Jan 2014 11,217
Feb 2014 9,492
Mar 2014 8,040
Apr 2014 6,223
May 2014 5,217 138 143
Jun 2014 4,177 1,237 174
Source water volumes (m3)e
Source Water
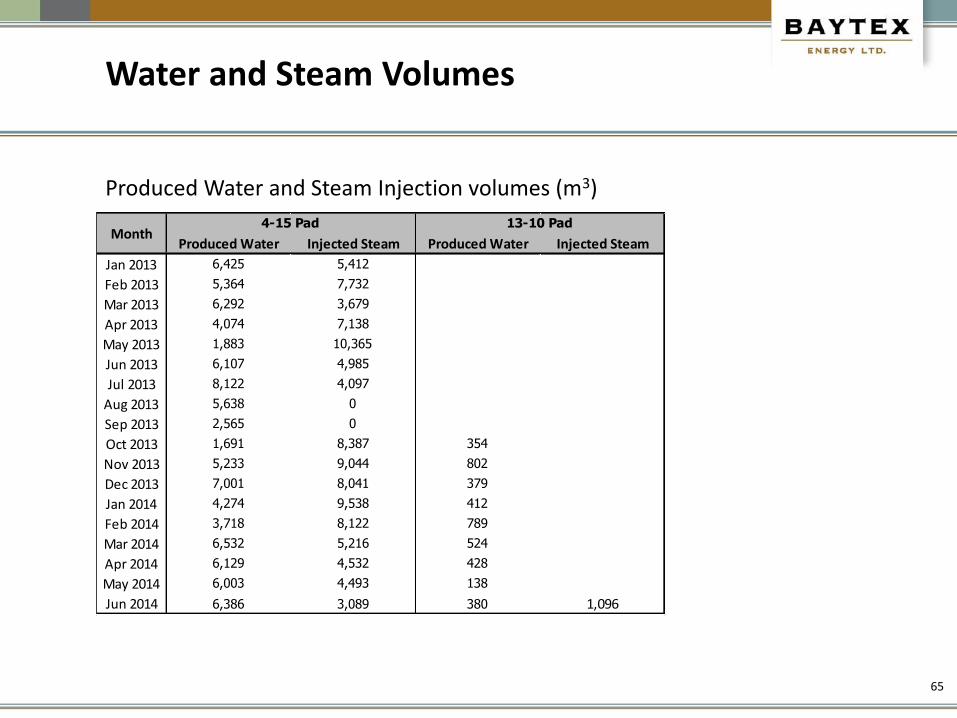
Water and Steam Volumes
65
Produced Water and Steam Injection volumes (m3)e
Produced Water Injected Steam Produced Water Injected Steam
Jan 2013 6,425 5,412
Feb 2013 5,364 7,732
Mar 2013 6,292 3,679
Apr 2013 4,074 7,138
May 2013 1,883 10,365
Jun 2013 6,107 4,985
Jul 2013 8,122 4,097
Aug 2013 5,638 0
Sep 2013 2,565 0
Oct 2013 1,691 8,387 354
Nov 2013 5,233 9,044 802
Dec 2013 7,001 8,041 379
Jan 2014 4,274 9,538 412
Feb 2014 3,718 8,122 789
Mar 2014 6,532 5,216 524
Apr 2014 6,129 4,532 428
May 2014 6,003 4,493 138
Jun 2014 6,386 3,089 380 1,096
Month4-15 Pad 13-10 Pad
• Baytex Cliffdale 100/13-10-084-17W5 • Disposing into the Leduc formation
• ABIF 0129229
• Approval 12154 – Commissioned Oct 2013
• Oct 2013 – Jun 2013 disposal volume 65,375 m3 (Cliffdale 49,482 m3)
• Injection Pressure ~6,500 kPa, Injection Temp 55 – 65 oC
• Baytex Harmon Valley 04-29 (100/06-29-084-18W5/02) • Disposing into the Leduc formation
• ABIF 0095084
• Approval 11254
• Injection Pressure 9,500 kPag, Injection Temp 50 – 55 oC
• Tervita Peace River (12-24-085-19W5) • ABIF 0096042
• Tervita Peace River WP (12-24-085-19W5) • ABWP 0090327
• Murphy 4-22 (04-22-084-18 W5) • ABIF 0127947
Water and Waste Disposal
66
Disposal Volumes
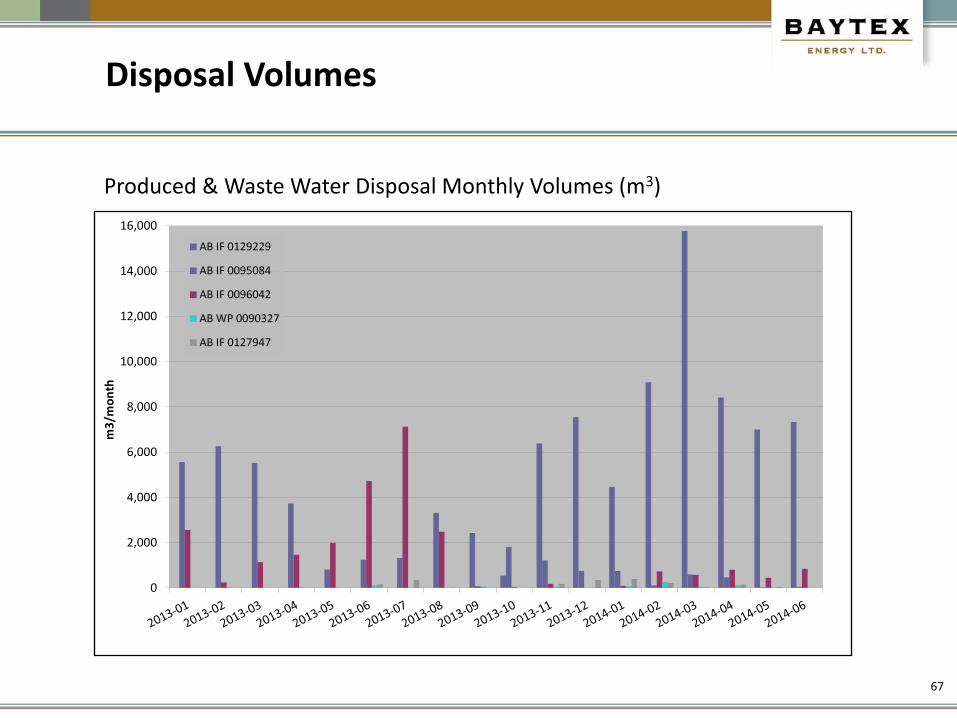
Produced & Waste Water Disposal Monthly Volumes (m3)
67
0
2,000
4,000
6,000
8,000
10,000
12,000
14,000
16,000
m3
/mo
nth
AB IF 0129229
AB IF 0095084
AB IF 0096042
AB WP 0090327
AB IF 0127947
5) Sulphur Production
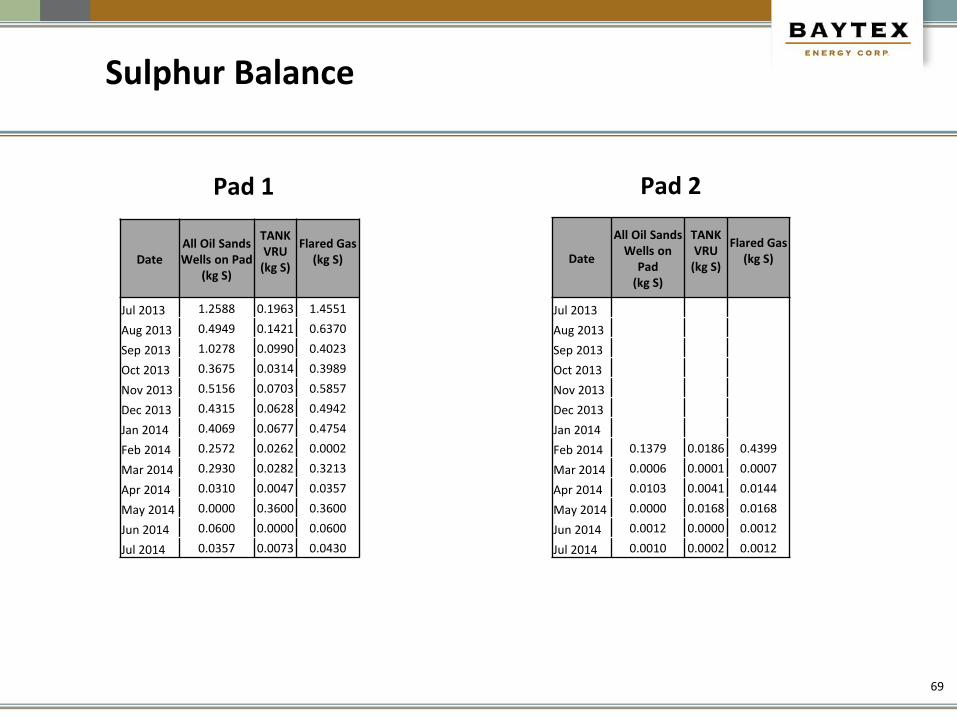
Sulphur Balance
Pad 1
Date All Oil Sands Wells on Pad
(kg S)
TANK VRU
(kg S)
Flared Gas (kg S)
Jul 2013 1.2588 0.1963 1.4551
Aug 2013 0.4949 0.1421 0.6370
Sep 2013 1.0278 0.0990 0.4023
Oct 2013 0.3675 0.0314 0.3989
Nov 2013 0.5156 0.0703 0.5857
Dec 2013 0.4315 0.0628 0.4942
Jan 2014 0.4069 0.0677 0.4754
Feb 2014 0.2572 0.0262 0.0002
Mar 2014 0.2930 0.0282 0.3213
Apr 2014 0.0310 0.0047 0.0357
May 2014 0.0000 0.3600 0.3600
Jun 2014 0.0600 0.0000 0.0600
Jul 2014 0.0357 0.0073 0.0430
Date
All Oil Sands Wells on
Pad (kg S)
TANK VRU
(kg S)
Flared Gas (kg S)
Jul 2013
Aug 2013
Sep 2013
Oct 2013
Nov 2013
Dec 2013
Jan 2014
Feb 2014 0.1379 0.0186 0.4399
Mar 2014 0.0006 0.0001 0.0007
Apr 2014 0.0103 0.0041 0.0144
May 2014 0.0000 0.0168 0.0168
Jun 2014 0.0012 0.0000 0.0012
Jul 2014 0.0010 0.0002 0.0012
69
Pad 2
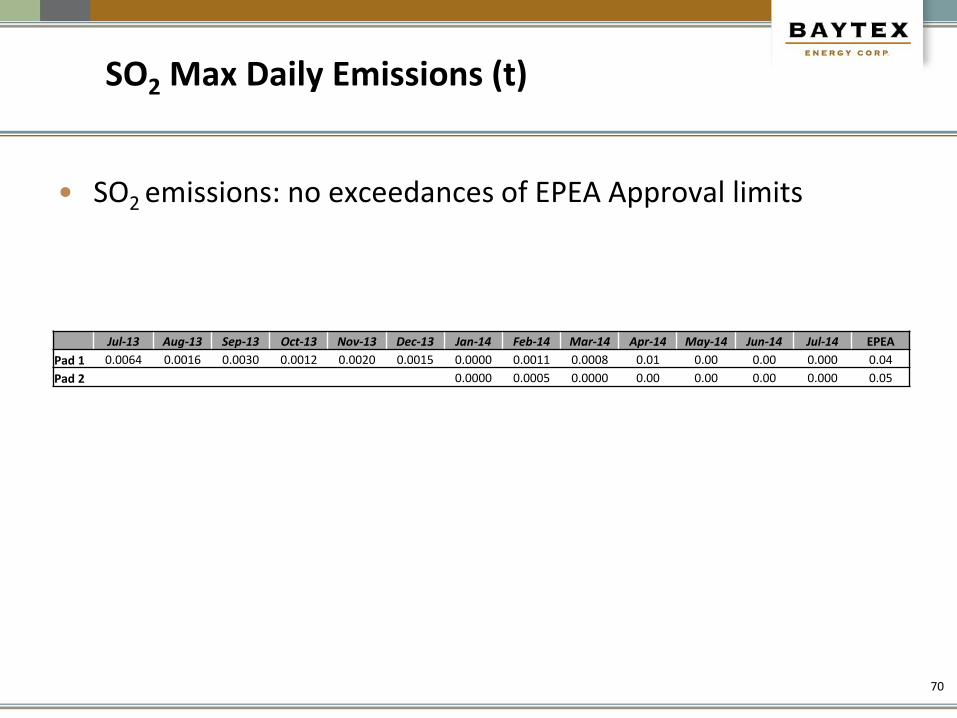
SO2 Max Daily Emissions (t)
• SO2 emissions: no exceedances of EPEA Approval limits
Jul-13 Aug-13 Sep-13 Oct-13 Nov-13 Dec-13 Jan-14 Feb-14 Mar-14 Apr-14 May-14 Jun-14 Jul-14 EPEA
Pad 1 0.0064 0.0016 0.0030 0.0012 0.0020 0.0015 0.0000 0.0011 0.0008 0.01 0.00 0.00 0.000 0.04
Pad 2 0.0000 0.0005 0.0000 0.00 0.00 0.00 0.000 0.05
70
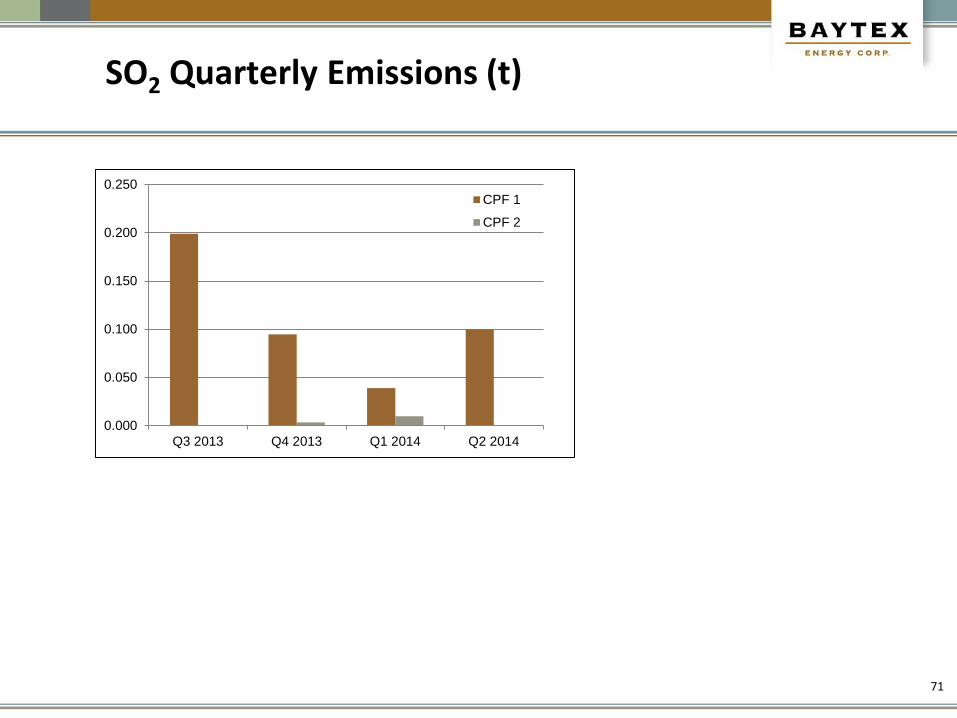
SO2 Quarterly Emissions (t)
0.000
0.050
0.100
0.150
0.200
0.250
Q3 2013 Q4 2013 Q1 2014 Q2 2014
CPF 1
CPF 2
71
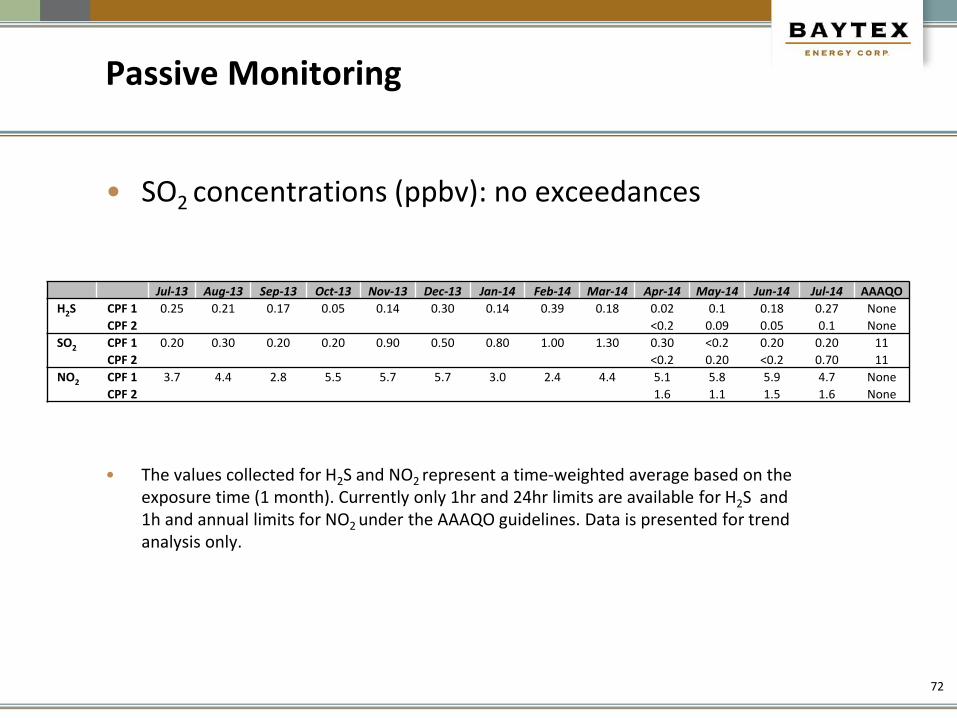
Passive Monitoring
• The values collected for H2S and NO2 represent a time-weighted average based on the exposure time (1 month). Currently only 1hr and 24hr limits are available for H2S and 1h and annual limits for NO2 under the AAAQO guidelines. Data is presented for trend analysis only.
Jul-13 Aug-13 Sep-13 Oct-13 Nov-13 Dec-13 Jan-14 Feb-14 Mar-14 Apr-14 May-14 Jun-14 Jul-14 AAAQO
H2S CPF 1 0.25 0.21 0.17 0.05 0.14 0.30 0.14 0.39 0.18 0.02 0.1 0.18 0.27 None
CPF 2 <0.2 0.09 0.05 0.1 None
SO2 CPF 1 0.20 0.30 0.20 0.20 0.90 0.50 0.80 1.00 1.30 0.30 <0.2 0.20 0.20 11
CPF 2 <0.2 0.20 <0.2 0.70 11
NO2 CPF 1 3.7 4.4 2.8 5.5 5.7 5.7 3.0 2.4 4.4 5.1 5.8 5.9 4.7 None
CPF 2 1.6 1.1 1.5 1.6 None
72
• SO2 concentrations (ppbv): no exceedances

6) Environmental
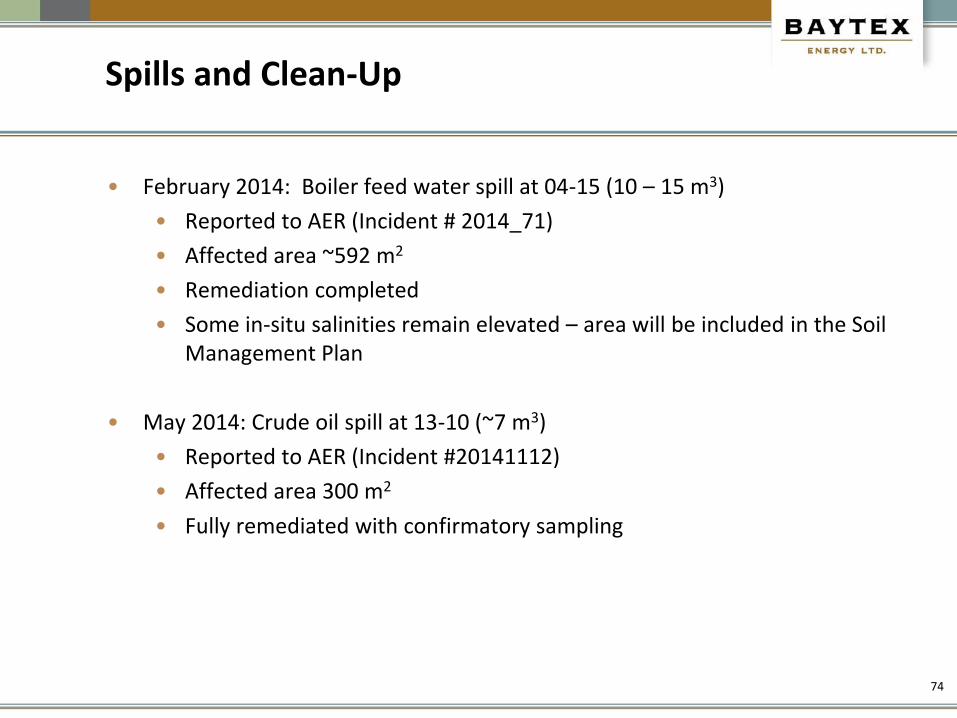
Spills and Clean-Up
• February 2014: Boiler feed water spill at 04-15 (10 – 15 m3)
• Reported to AER (Incident # 2014_71)
• Affected area ~592 m2
• Remediation completed
• Some in-situ salinities remain elevated – area will be included in the Soil Management Plan
• May 2014: Crude oil spill at 13-10 (~7 m3)
• Reported to AER (Incident #20141112)
• Affected area 300 m2
• Fully remediated with confirmatory sampling
74
Groundwater Monitoring Program
Progress and Results:
• Groundwater Monitoring Network installed October 2013 (04-15) and February 2014 (13-10)
• Monitoring Network includes 19 monitoring wells at Pads 1 and 2:
• 11 surficial/water table, 2 inter-till aquifer, and 6 basal aquifer.
• Baseline Monitoring at Pad 1 completed in 5 events between October 2013 and March 2014
• Baseline Monitoring at Pad 2 completed in 5 events between February 2014 and June 2014
• Water levels & temperature in inter-till & basal aquifer continuously monitored at Pads 1 & 2
• Groundwater temperatures stable +/- 0.2 oC (inter-till and basal aquifers)
75
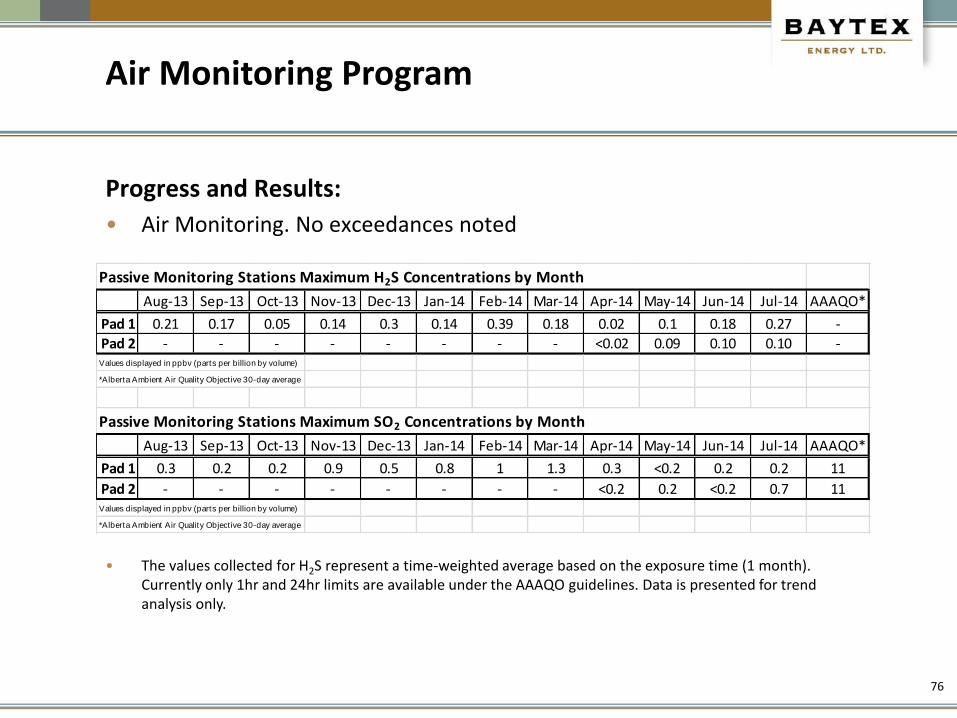
Air Monitoring Program
Progress and Results:
• Air Monitoring. No exceedances noted
76
Aug-13 Sep-13 Oct-13 Nov-13 Dec-13 Jan-14 Feb-14 Mar-14 Apr-14 May-14 Jun-14 Jul-14 AAAQO*
Pad 1 0.21 0.17 0.05 0.14 0.3 0.14 0.39 0.18 0.02 0.1 0.18 0.27 -
Pad 2 - - - - - - - - <0.02 0.09 0.10 0.10 -Values displayed in ppbv (parts per billion by volume)
*Alberta Ambient Air Quality Object ive 30-day average
Aug-13 Sep-13 Oct-13 Nov-13 Dec-13 Jan-14 Feb-14 Mar-14 Apr-14 May-14 Jun-14 Jul-14 AAAQO*
Pad 1 0.3 0.2 0.2 0.9 0.5 0.8 1 1.3 0.3 <0.2 0.2 0.2 11
Pad 2 - - - - - - - - <0.2 0.2 <0.2 0.7 11Values displayed in ppbv (parts per billion by volume)
*Alberta Ambient Air Quality Object ive 30-day average
Passive Monitoring Stations Maximum H2S Concentrations by Month
Passive Monitoring Stations Maximum SO2 Concentrations by Month
• The values collected for H2S represent a time-weighted average based on the exposure time (1 month). Currently only 1hr and 24hr limits are available under the AAAQO guidelines. Data is presented for trend analysis only.
Soil Monitoring Program
Progress and Results:
• Operational Soil Monitoring Program at Pad 1 completed September 2013
• Baseline Soil Monitoring Program at Pad 2 completed September 2013
• Results reported to ESRD/AER in January 2014
• Naturally acidic soils with occasional elevated Sodium Adsorption Ratios characterized
• Metals and Petroleum hydrocarbons were below Alberta Tier 1 criteria, except one F2 and F3 exceedance resultant of naturally organic deposits.
77
NOX
NOx EPEA Limit Exceedance:
• October 2013: A manual stack survey was conducted on the 04-15 A510 7.3 MW Steam Generator exhaust stack . All compliance parameters were within the Approval limits, except for the NOx mass emission value which exceeded 0.68 kg/h (measured 0.863 kg/h)
• Exceedance was reported in AESRD Contravention No. 277475. Baytex is currently operating the A510 unit at a reduced load (<60%) while performance and the NOx contravention is being addressed
• December 2013 – Source Emission Survey which included a RATA was conducted on the B-500 7.3 MW Steam Generator exhaust stack. All compliance parameters were found to be within the Approval limits
• September 2014 – Manual stack survey currently under way
78
7) Compliance
Compliance
• To the best of our knowledge, the Baytex Cliffdale CSS Thermal Project is currently in compliance with all conditions of its approvals and associated regulatory requirements.
80

Regulatory Summary
Amendments:
• May 2014: Amended EPEA requirements for groundwater monitoring at pad 2. Baseline monitoring requirements were reduced prior to first steam
• June 2014: Amendment to allow test diluent injection in well 102/13-09-084-17W5 at 13-10 (Scheme Approval # 11034J)
• August 2014: Amendment to allow test diluent injection in well 103/13-09-084-17W5 at 13-10 (Scheme Approval # 11034K)
• September 2014: Amendment to make minor equipment changes to the 13-10 facility to accommodate new pipeline tie-ins (currently under AER review)
Voluntary Self Disclosure:
• September 2013: Voluntary Self Disclosure for exceeding D56 licensed flare rate (04-15 BT) - Resolved
• October 2013: Voluntary Self Disclosure for exceeding D81 Section 4.1 monthly facility water imbalance by 5% for three consecutive months (04-15 IF) - Resolved
81
8) Future Plans
Future Plans
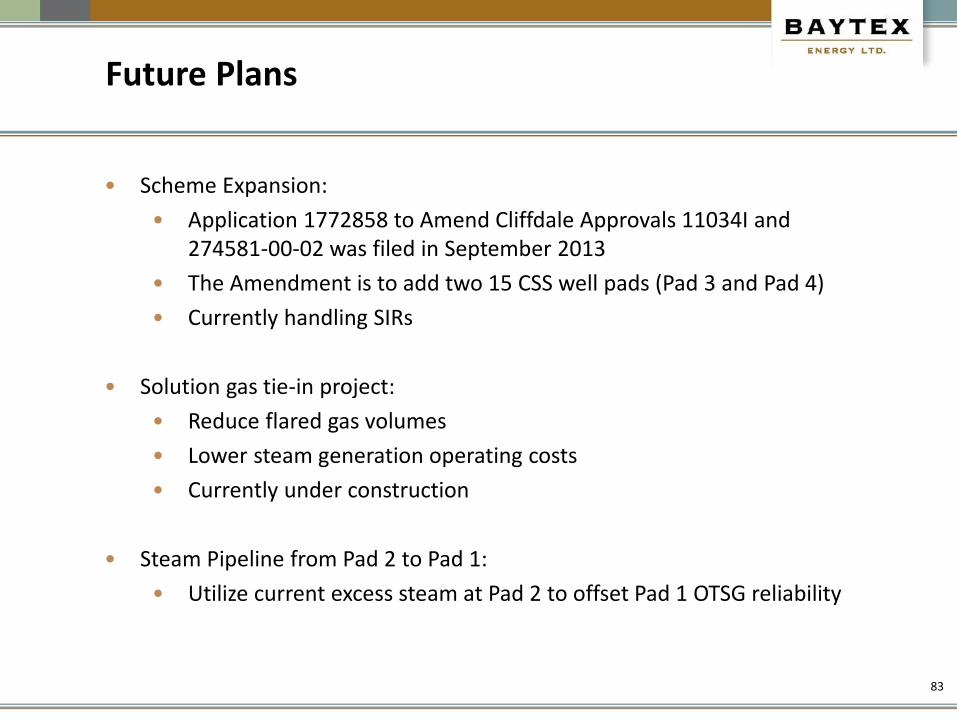
• Scheme Expansion:
• Application 1772858 to Amend Cliffdale Approvals 11034I and 274581-00-02 was filed in September 2013
• The Amendment is to add two 15 CSS well pads (Pad 3 and Pad 4)
• Currently handling SIRs
• Solution gas tie-in project:
• Reduce flared gas volumes
• Lower steam generation operating costs
• Currently under construction
• Steam Pipeline from Pad 2 to Pad 1:
• Utilize current excess steam at Pad 2 to offset Pad 1 OTSG reliability
83
Future Plans
84
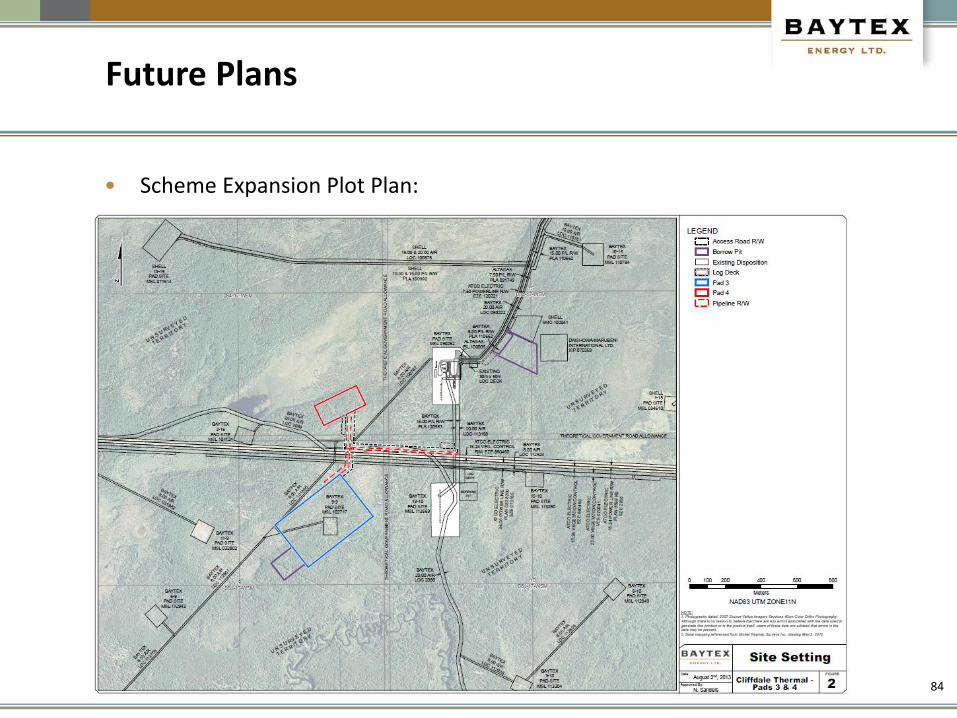
• Scheme Expansion Plot Plan:
85
Forward-Looking Statements
In the interest of providing interested parties with information regarding Baytex, including management's assessment of Baytex's future plans and operations, certain statements made by the presenter
and contained in these presentation materials (collectively, this "presentation") are "forward-looking statements" within the meaning of the United States Private Securities Litigation Reform Act of 1995
and "forward-looking information" within the meaning of applicable Canadian securities legislation (collectively, "forward-looking statements"). The forward-looking statements contained in this
presentation speak only as of the date of this presentation and are expressly qualified by this cautionary statement. The information contained in this presentation does not purport to be all-inclusive or to
contain all information that potential investors may require.
Specifically, this presentation contains forward-looking statements relating to, but not limited to: our business strategies, plans and objectives; and our Cliffdale Cyclic Steam Stimulation Project, including
development and operational plans, completion strategies, our assessment of the performance of the project, our interpretation of geology, project life, original bitumen in place volumes and expected
recovery factors. In addition, information and statements relating to reserves are deemed to be forward-looking statements, as they involve implied assessment, based on certain estimates and
assumptions, that the reserves described exist in quantities predicted or estimated, and that the reserves can be profitably produced in the future.
Cash dividends on our common shares are paid at the discretion of our Board of Directors and can fluctuate. In establishing the level of cash dividends, the Board of Directors considers all factors that it
deems relevant, including, without limitation, the outlook for commodity prices, our operational execution, the amount of funds from operations and capital expenditures and our prevailing financial
circumstances at the time. Although Baytex believes that the expectations and assumptions upon which the forward-looking statements are based are reasonable, undue reliance should not be placed on
the forward-looking statements because Baytex can give no assurance that they will prove to be correct.
These forward-looking statements are based on certain key assumptions regarding, among other things: our ability to execute and realize on the anticipated benefits of the acquisition of the Eagle Ford
assets; petroleum and natural gas prices and pricing differentials between light, medium and heavy gravity crude oils; well production rates and reserve volumes; our ability to add production and
reserves through our exploration and development activities; capital expenditure levels; the receipt, in a timely manner, of regulatory and other required approvals for our operating activities; the
availability and cost of labour and other industry services; the amount of future cash dividends that we intend to pay; interest and foreign exchange rates; the continuance of existing and, in certain
circumstances, proposed tax and royalty regimes; our ability to develop our crude oil and natural gas properties in the manner currently contemplated; and current or, where applicable, proposed
assumed industry conditions, laws and regulations will continue in effect or as anticipated. Readers are cautioned that such assumptions, although considered reasonable by us at the time of
preparation, may prove to be incorrect.
Actual results achieved will vary from the information provided herein as a result of numerous known and unknown risks and uncertainties and other factors. Such factors include, but are not limited to:
failure to realize the anticipated benefits of the acquisition of the Eagle Ford assets; declines in oil and natural gas prices; risks related to the accessibility, availability, proximity and capacity of gathering,
processing and pipeline systems; variations in interest rates and foreign exchange rates; risks associated with our hedging activities; uncertainties in the credit markets may restrict the availability of credit
or increase the cost of borrowing; refinancing risk for existing debt and debt service costs; a downgrade of our credit ratings; the cost of developing and operating our assets; risks associated with the
exploitation of our properties and our ability to acquire reserves; changes in government regulations that affect the oil and gas industry; changes in income tax or other laws or government incentive
programs; uncertainties associated with estimating petroleum and natural gas reserves; risks associated with acquiring, developing and exploring for oil and natural gas and other aspects of our
operations; risks associated with large projects or expansion of our activities; risks related to heavy oil projects; changes in environmental, health and safety regulations; the implementation of strategies
for reducing greenhouse gases; depletion of our reserves; risks associated with the ownership of our securities, including the discretionary nature of dividend payments and changes in market-based
factors; risks for United States and other non-resident shareholders, including the ability to enforce civil remedies, differing practices for reporting reserves and production, additional taxation applicable to
non-residents and foreign exchange risk; and other factors, many of which are beyond our control. These risk factors are discussed in Baytex's Annual Information Form, Annual Report on Form 40-F
and Management's Discussion and Analysis for the year ended December 31, 2013, as filed with Canadian securities regulatory authorities and the U.S. Securities and Exchange Commission.
Advisory

86
Readers are cautioned that the foregoing list of risk factors is not exhaustive. New risk factors emerge from time to time, and it is not possible for management to predict all of such factors and to assess in
advance the impact of each such factor on our business or the extent to which any factor, or combination of factors, may cause actual results to differ materially from those contained in any forward-looking
statements.
The above summary of assumptions and risks related to forward-looking statements in this presentation has been provided in order to provide potential investors with a more complete perspective of our
current and future operations and as such information may be not appropriate for other purposes. There is no representation by Baytex that actual results achieved will be the same in whole or in part as
those referenced in the forward-looking statements and Baytex does not undertake any obligation to update publicly or to revise any of the included forward-looking statements, whether as a result of new
information, future events or otherwise, except as may be required by applicable securities law.
Oil and Gas Information
The determination of oil and gas reserves involves the preparation of estimates that have an inherent degree of associated uncertainty. Categories of proved and probable reserves have been established
to reflect the level of these uncertainties and to provide an indication of the probability of recovery. The estimation and classification of reserves requires the application of professional judgment combined
with geological and engineering knowledge to assess whether or not specific reserves classification criteria have been satisfied. Knowledge of concepts, including uncertainty and risk, probability and
statistics, and deterministic and probabilistic estimation methods, is required to properly use and apply reserves definitions.
The recovery and reserves estimates described herein are estimates only and there is no guarantee that the estimated reserves will be recovered. Actual reserves and future production from such reserves
may be greater or less than the estimates provided herein. The estimates of reserves for individual properties may not reflect the same confidence level as estimates of reserves for all properties, due to
the effects of aggregation. For complete NI 51-101 reserves disclosure, please see our Annual Information Form for the year end December 31, 2013 dated March 25, 2014.
When converting volumes of natural gas to oil equivalent amounts, Baytex has adopted a conversion factor of six million cubic feet of natural gas being equivalent to one barrel of oil, which is based on an
energy equivalency conversion method primarily applicable at the burner tip and does not represent a value equivalency at the wellhead. Oil equivalent amounts may be misleading, particularly if used in
isolation.
Advisory (Cont.)

Suite 2800, Centennial Place 520 – 3rd Avenue S.W. Calgary, Alberta T2P 0R3
T: (587) 952-3000 1-800-524-5521
www.baytexenergy.com