Embed Size (px)
Citation preview
2014 FARM BILL DECISION TOOLS
Decision Tools • Accessible from farmbill.unl.edu
• 500 draws of price and yield– Better way than single one price
spreadsheets• Illinois
http://fsa.usapas.com/
• Texas A&M https://decisionaid.afpc.tamu.edu/
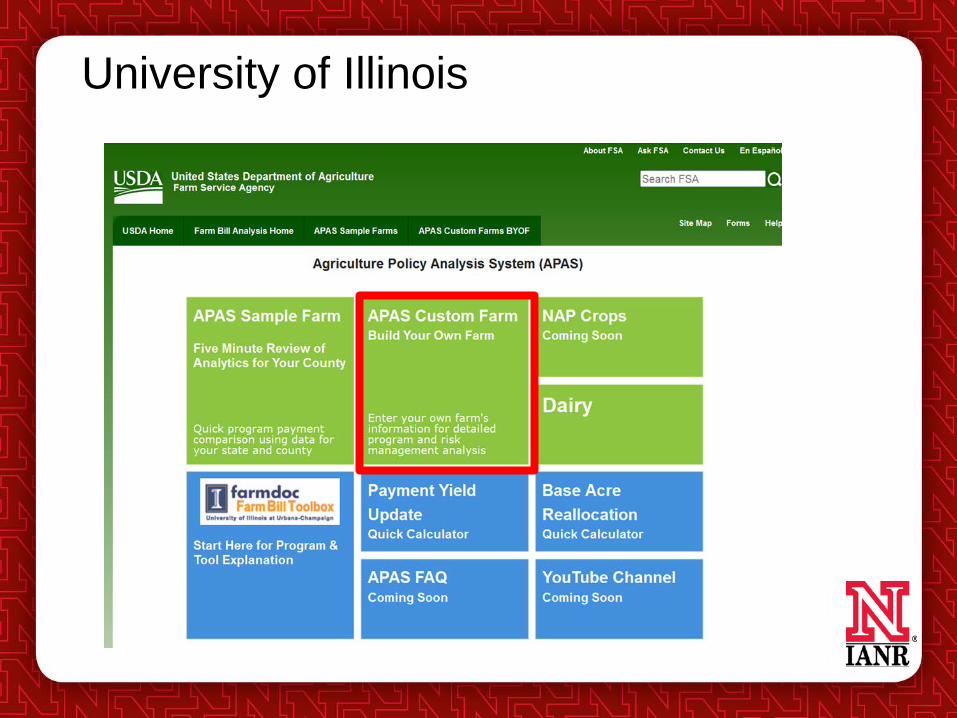
University of Illinois
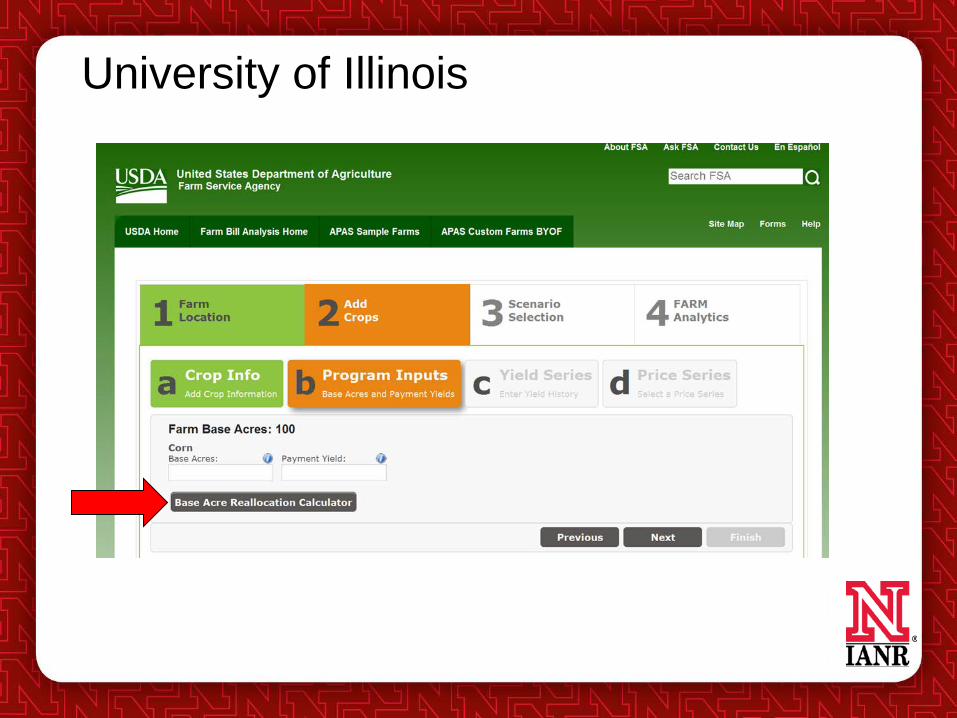
University of Illinois
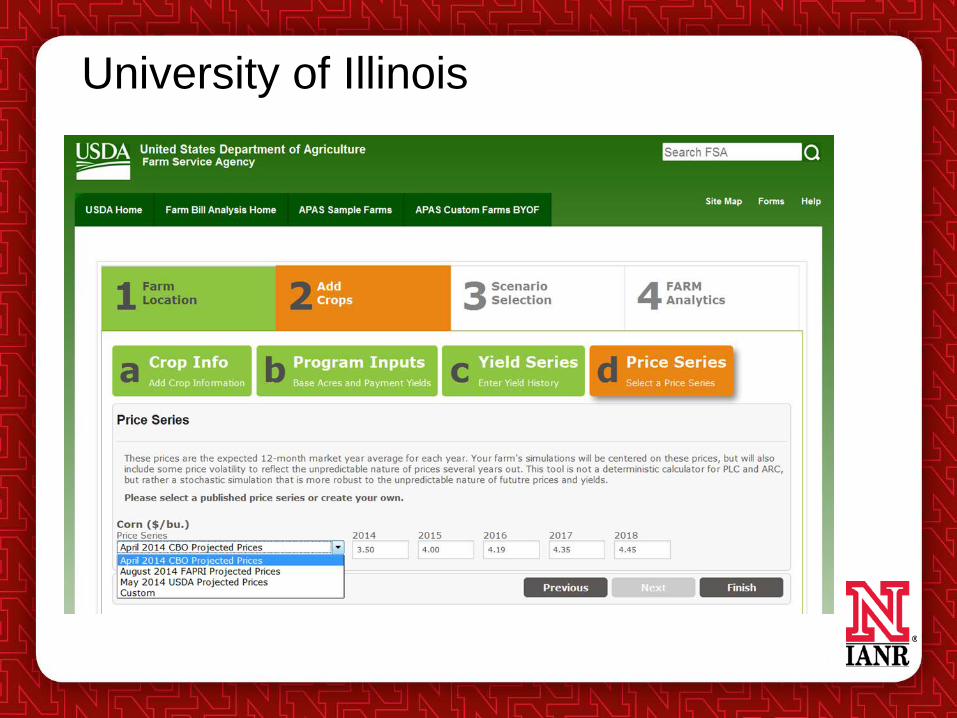
University of Illinois
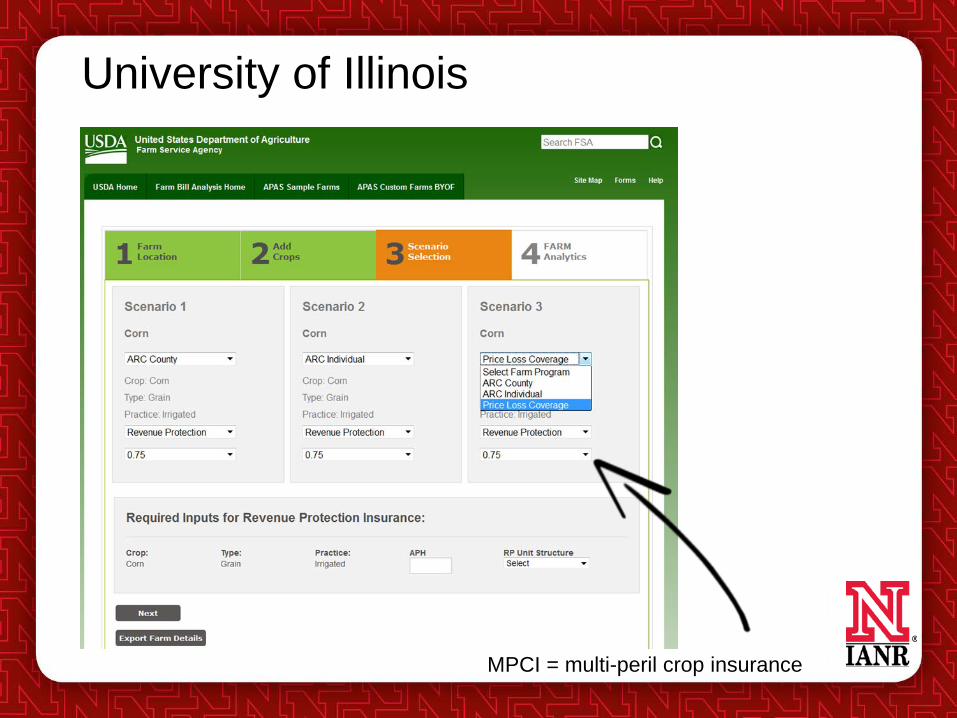
University of Illinois
MPCI = multi-peril crop insurance
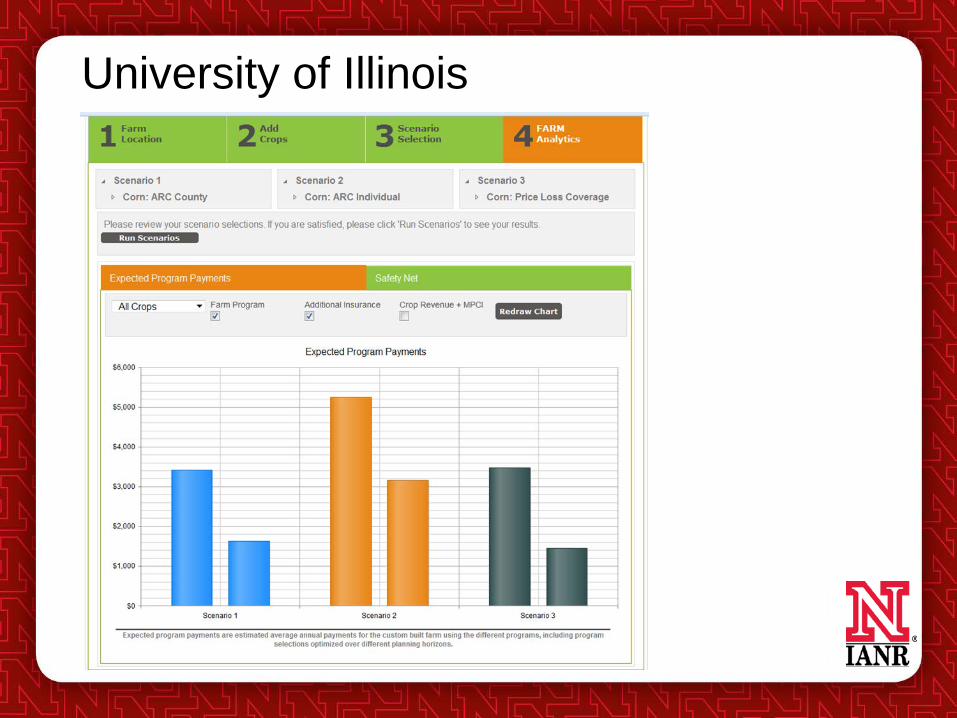
University of Illinois
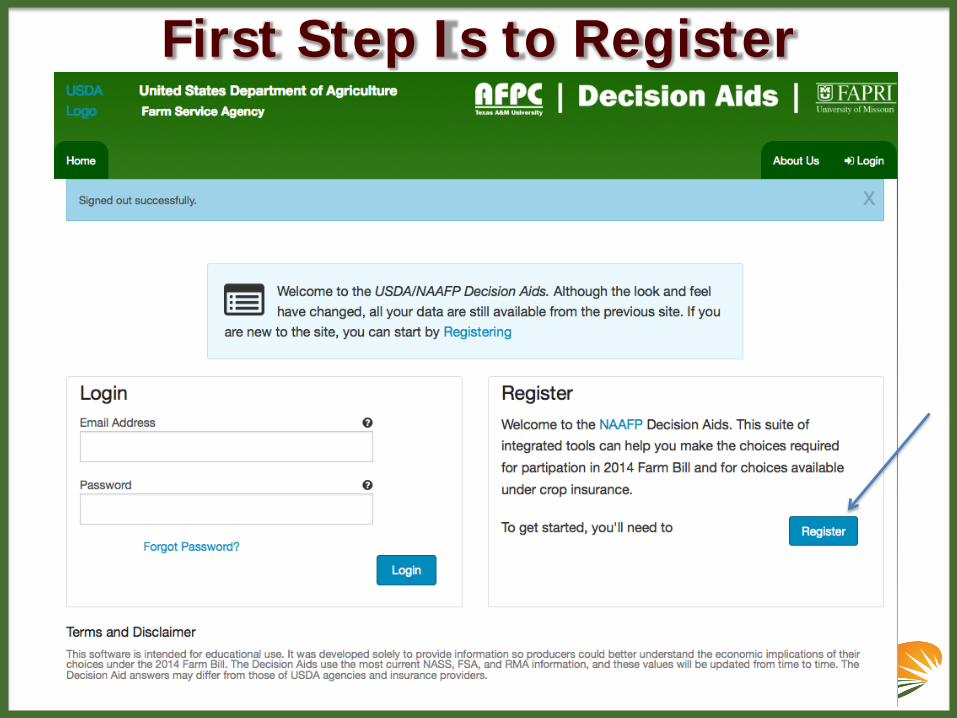
First Step Is to Register
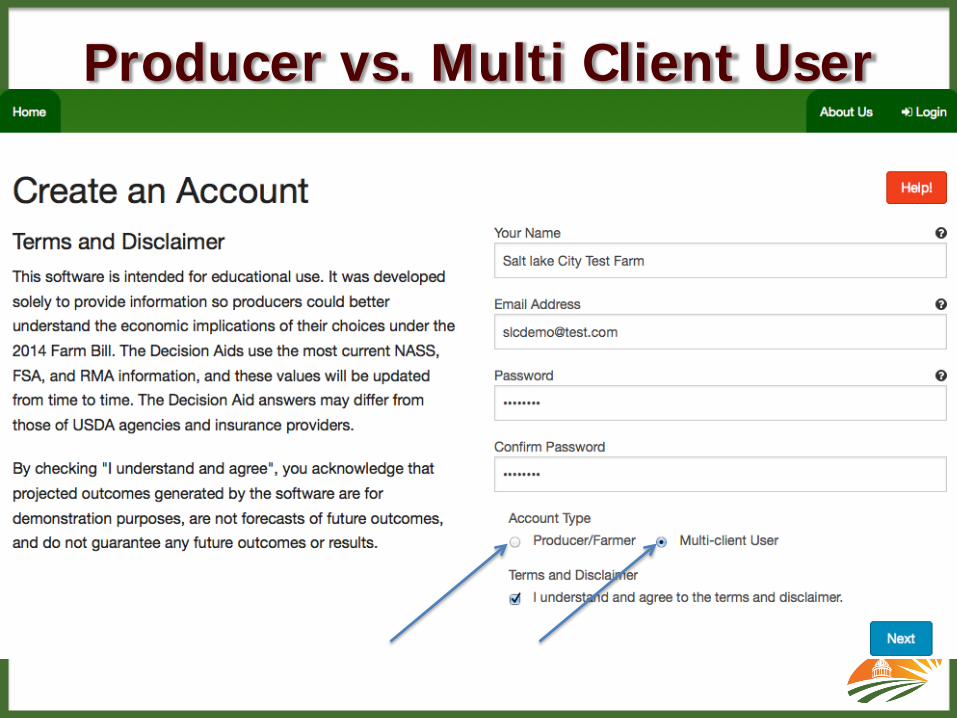
Producer vs. Multi Client User
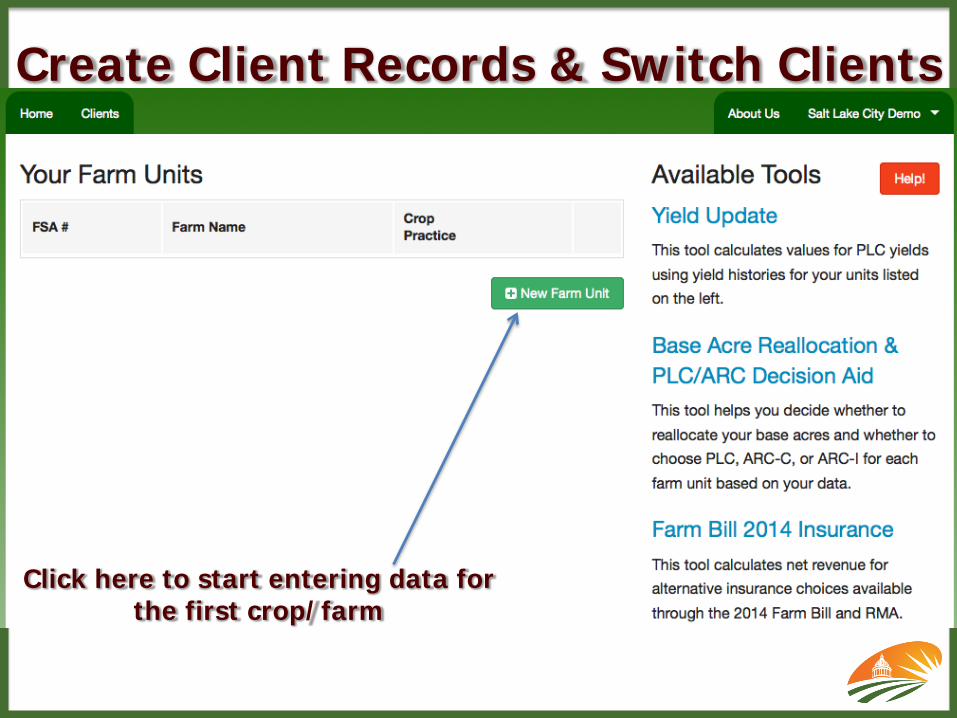
Create Client Records & Switch Clients
Click here to start entering data for the first crop/farm
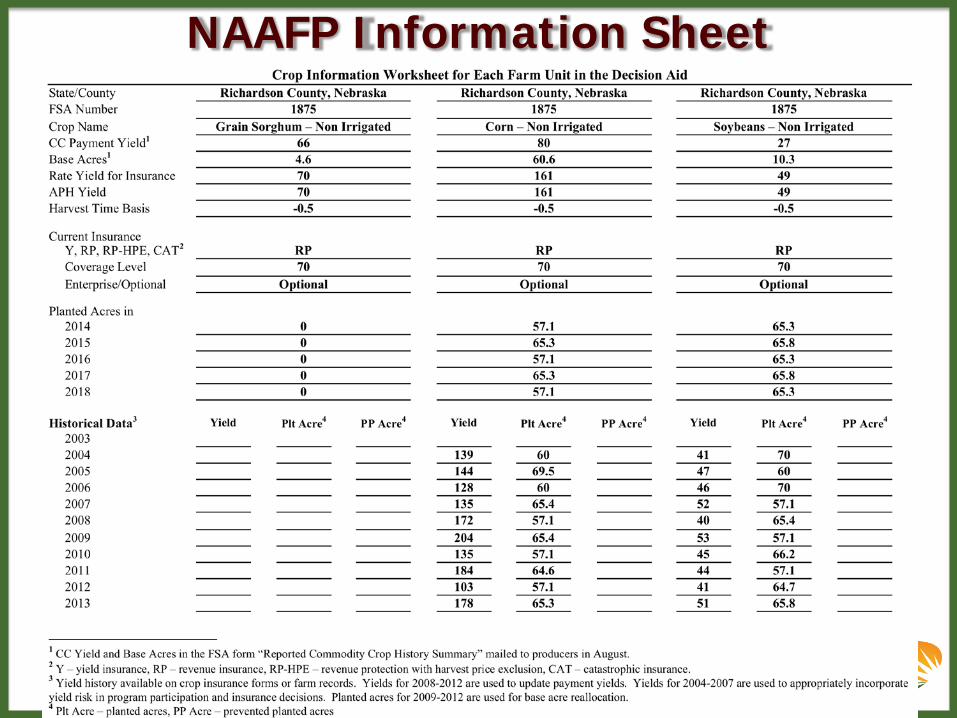
NAAFP Information Sheet
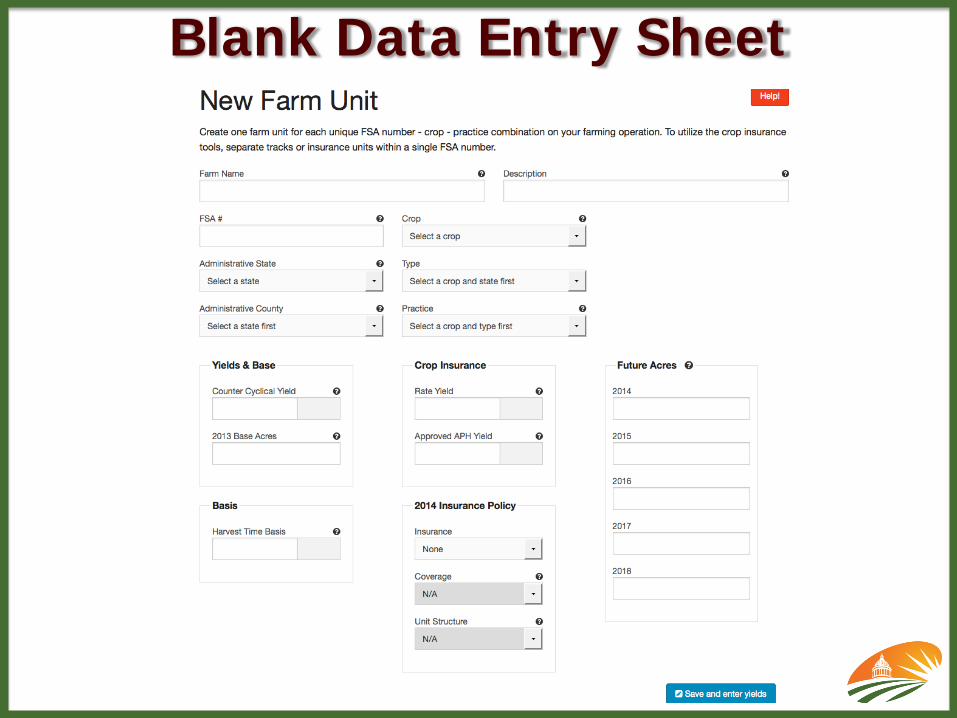
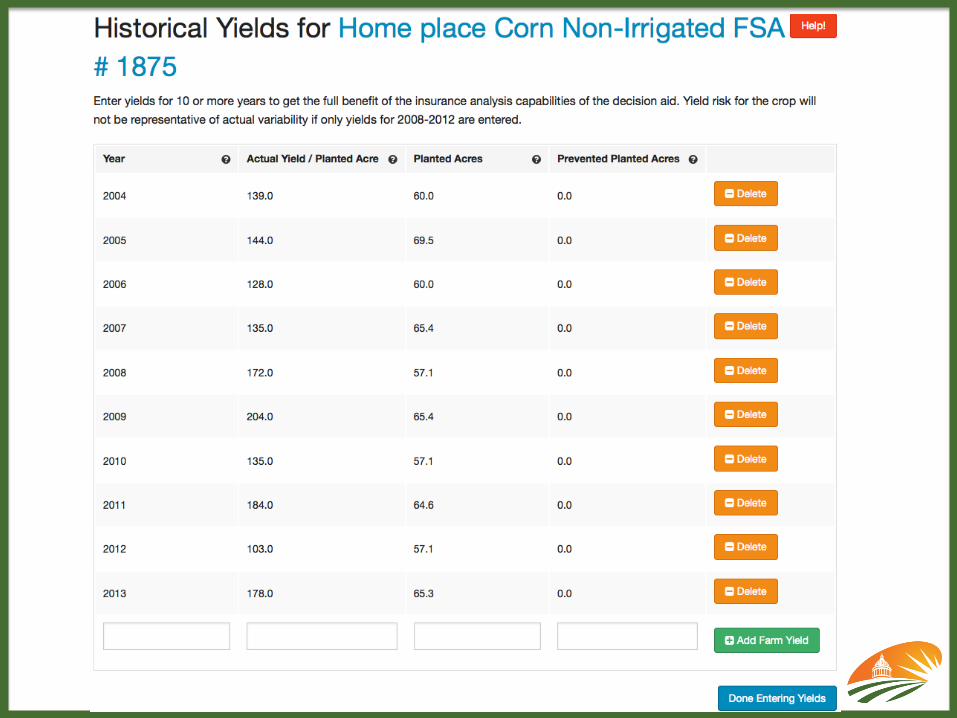
Blank Data Entry Sheet
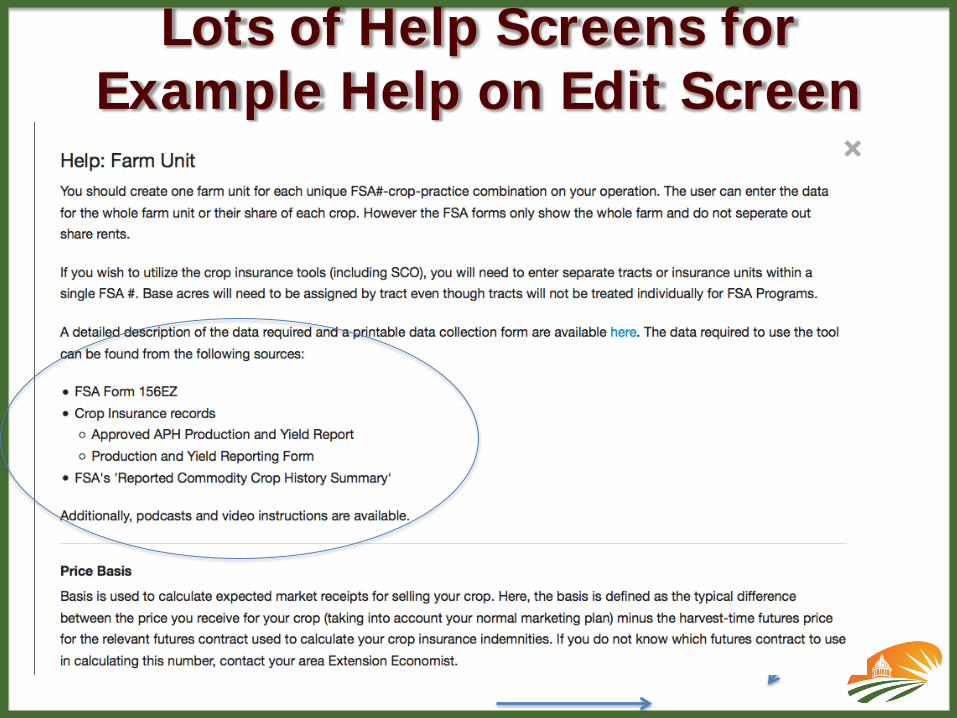
Lots of Help Screens for Example Help on Edit Screen
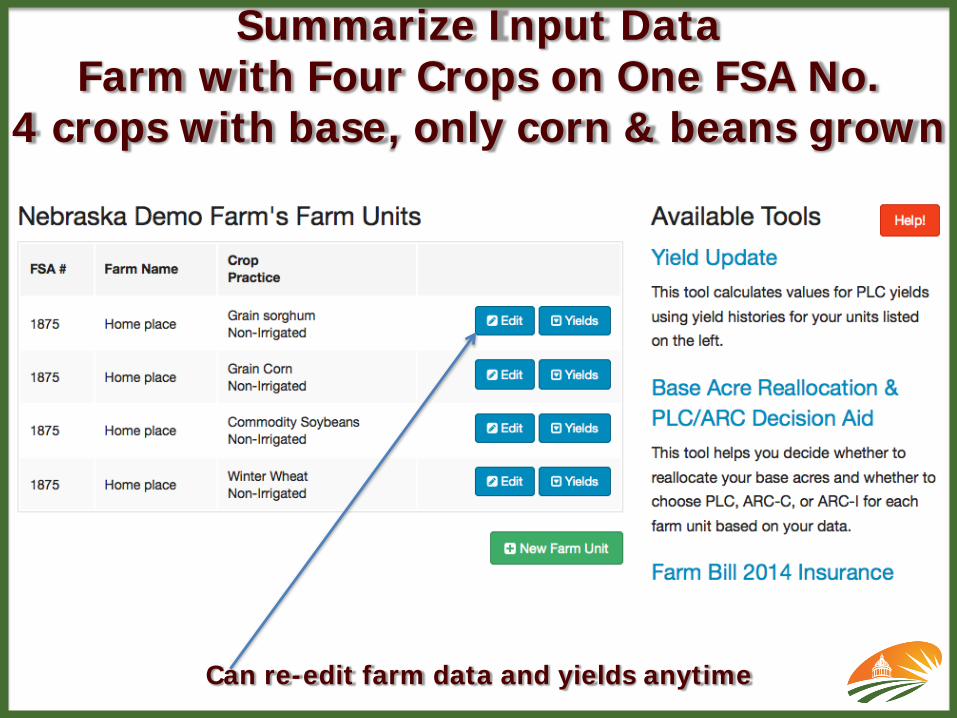
Summarize Input DataFarm with Four Crops on One FSA No.
4 crops with base, only corn & beans grown
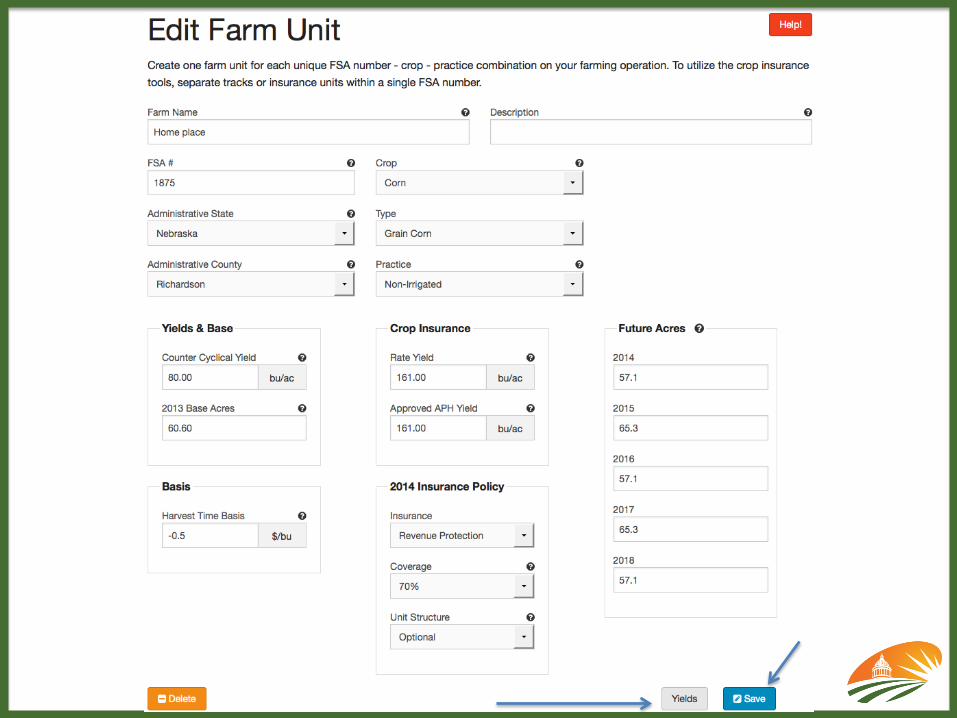
Can re-edit farm data and yields anytime
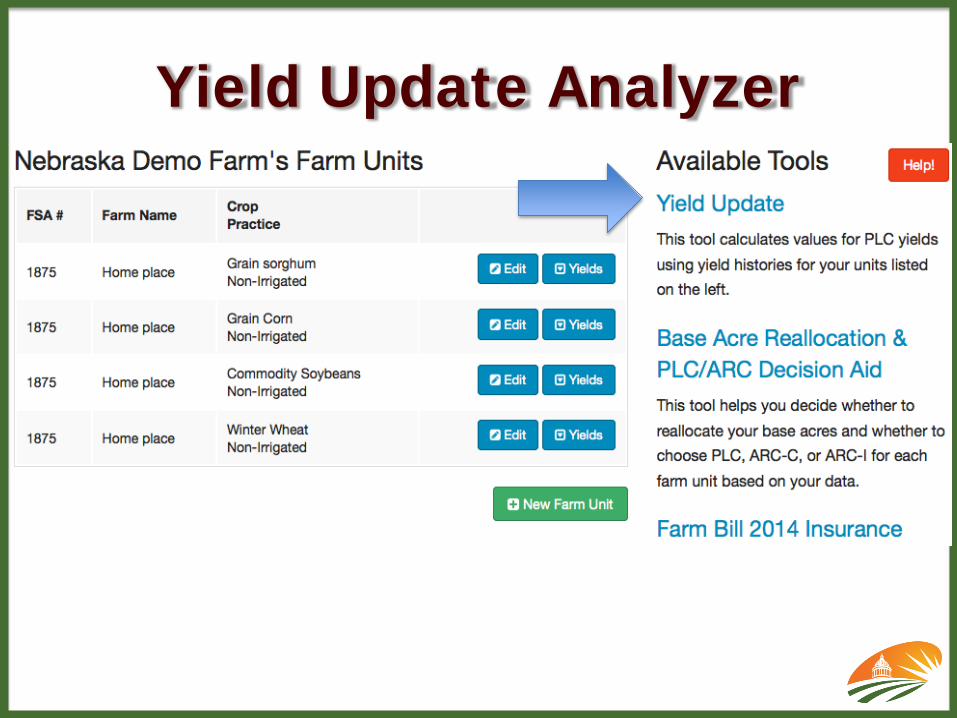
Yield Update Analyzer
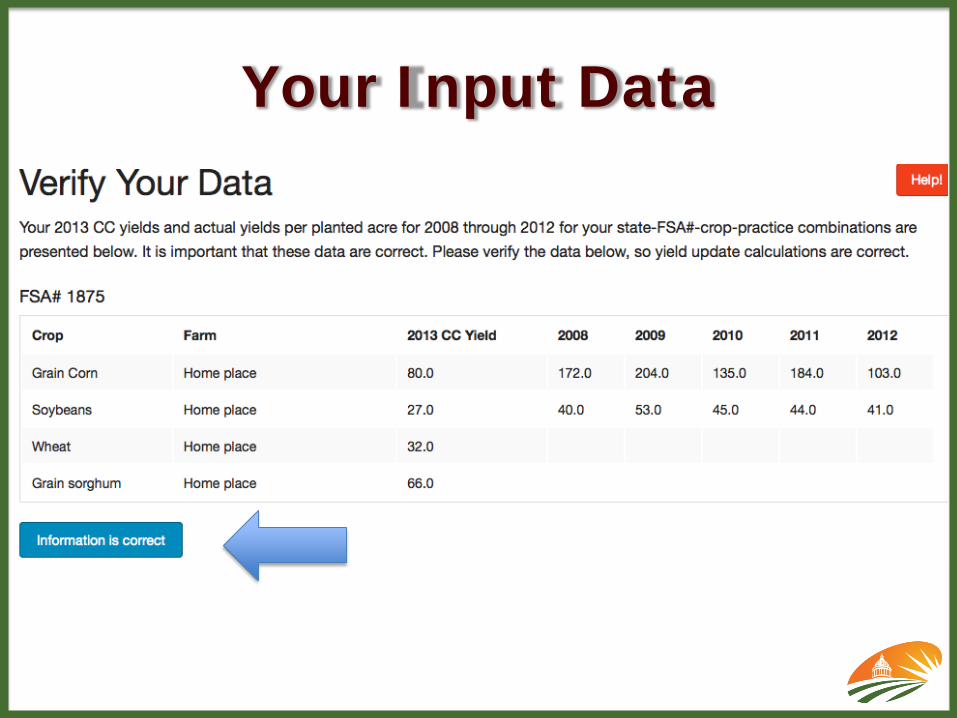
Your Input Data
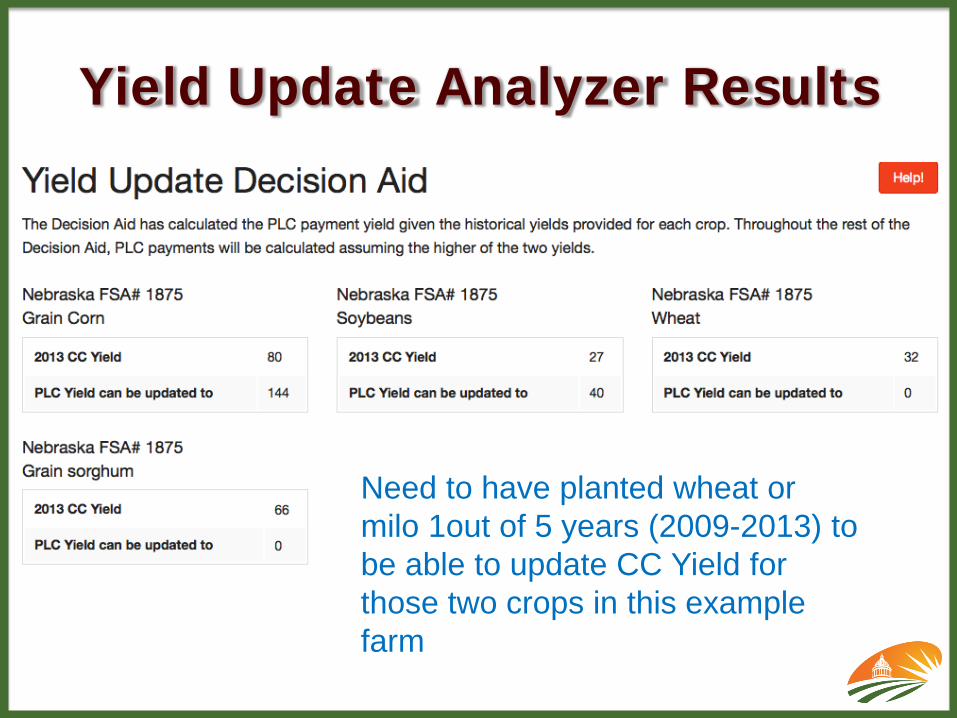
Yield Update Analyzer Results
Need to have planted wheat or milo 1out of 5 years (2009-2013) to be able to update CC Yield for those two crops in this example farm
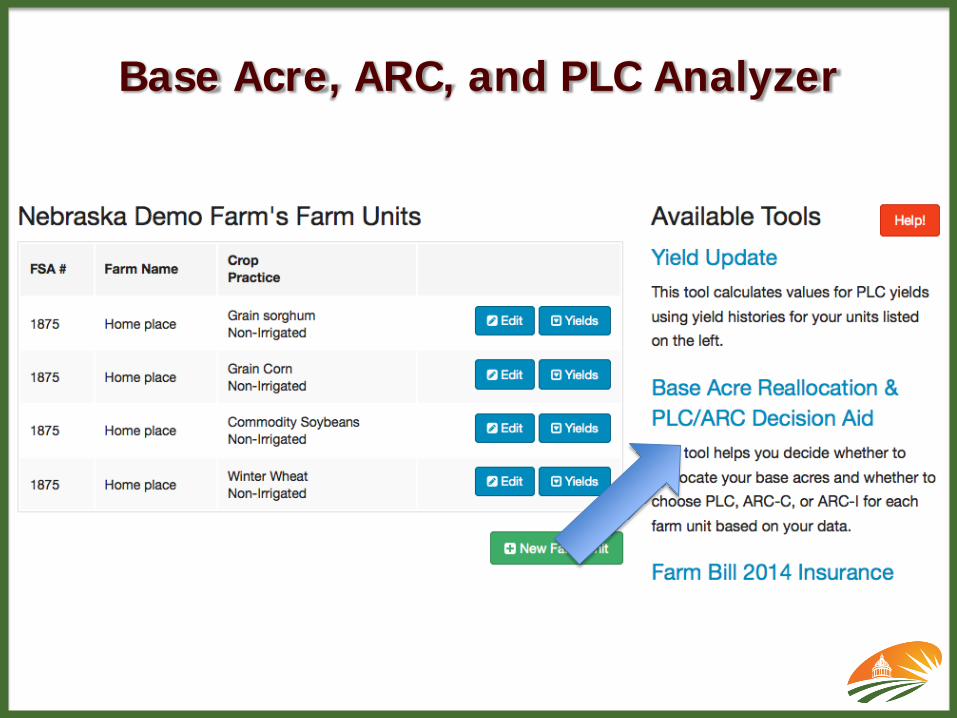
Base Acre, ARC, and PLC Analyzer
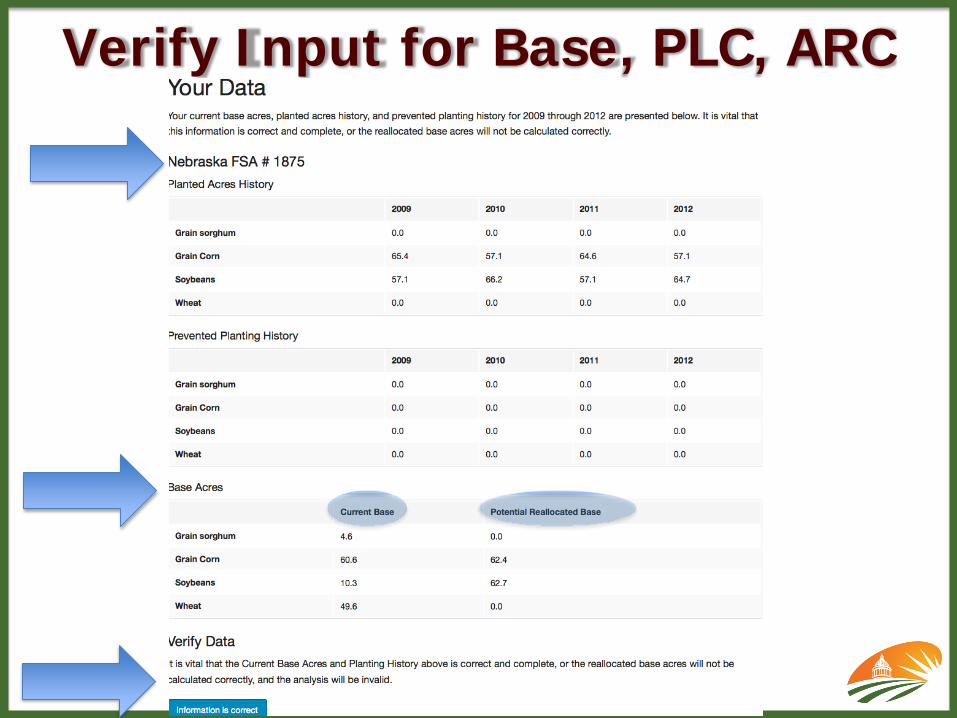
Verify Input for Base, PLC, ARC
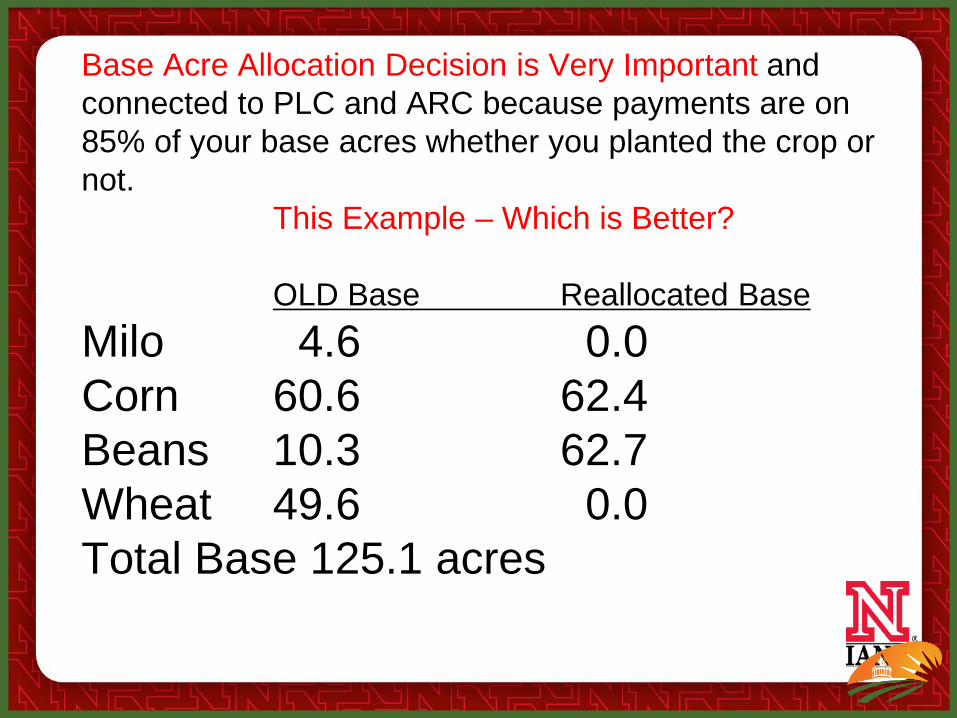
Base Acre Allocation Decision is Very Important and connected to PLC and ARC because payments are on 85% of your base acres whether you planted the crop or not.
This Example – Which is Better?
OLD Base Reallocated BaseMilo 4.6 0.0Corn 60.6 62.4Beans 10.3 62.7Wheat 49.6 0.0Total Base 125.1 acres
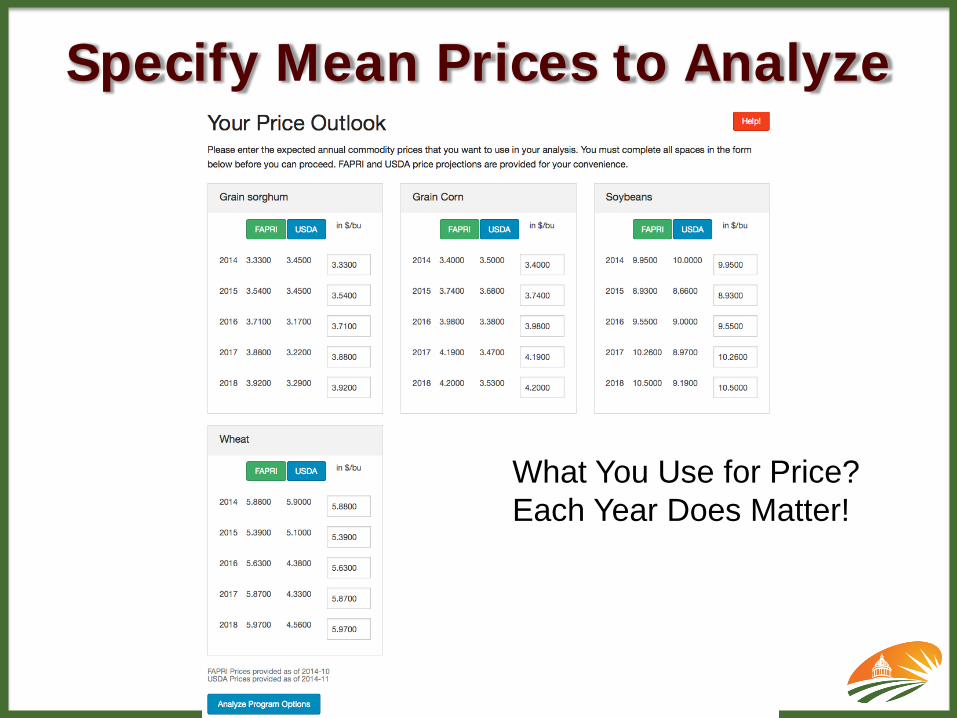
Specify Mean Prices to Analyze
What You Use for Price? Each Year Does Matter!

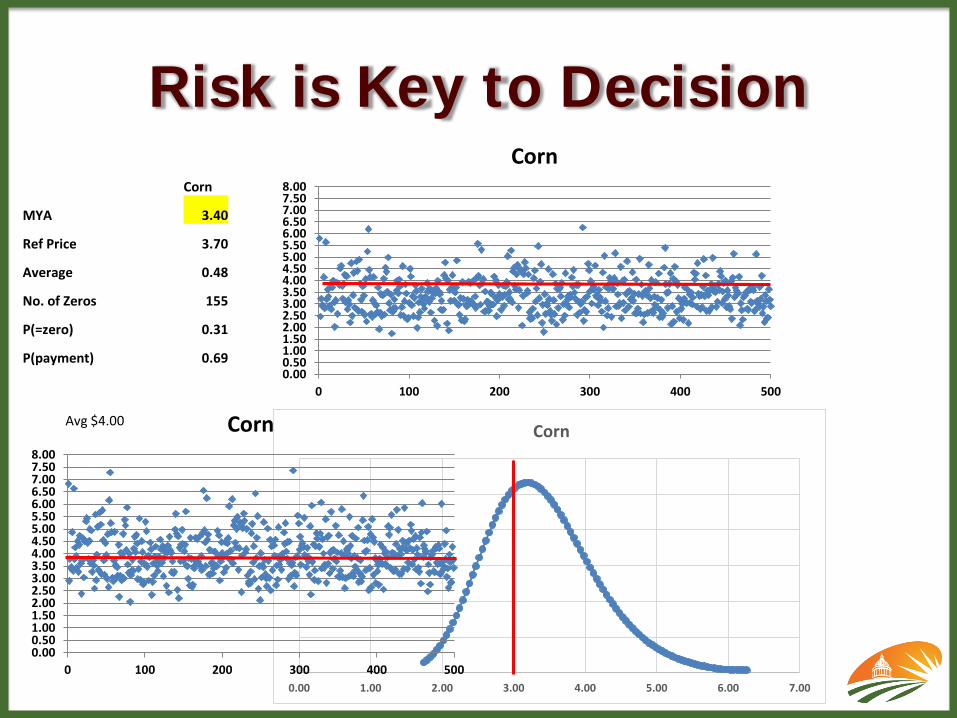
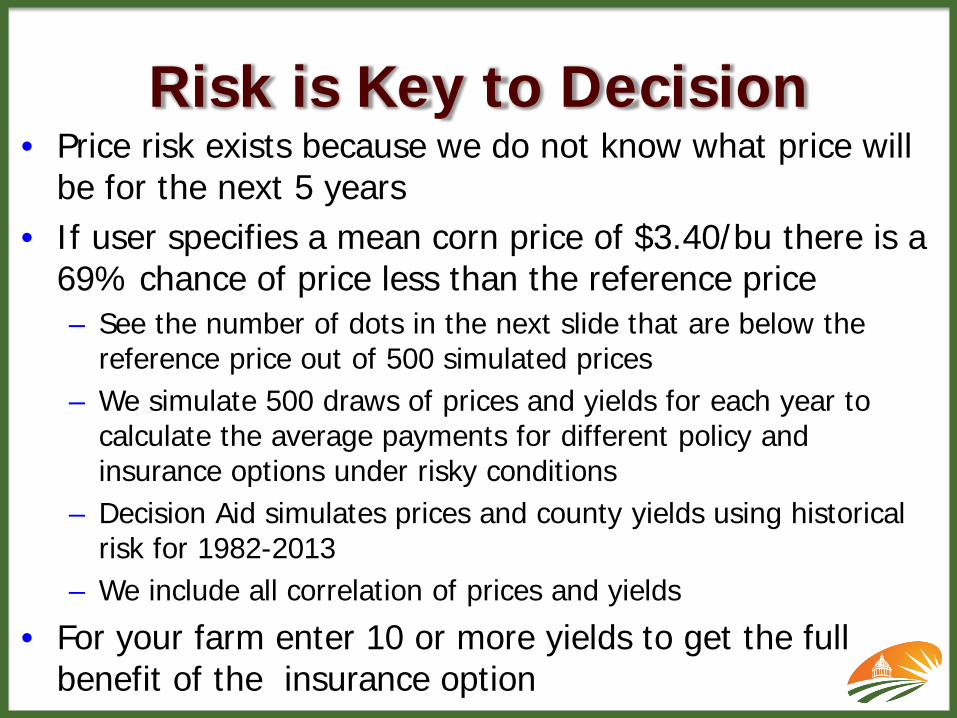
Risk is Key to Decision• Price risk exists because we do not know what price will
be for the next 5 years• If user specifies a mean corn price of $3.40/bu there is a
69% chance of price less than the reference price– See the number of dots in the next slide that are below the
reference price out of 500 simulated prices– We simulate 500 draws of prices and yields for each year to
calculate the average payments for different policy and insurance options under risky conditions
– Decision Aid simulates prices and county yields using historical risk for 1982-2013
– We include all correlation of prices and yields
• For your farm enter 10 or more yields to get the full benefit of the insurance option
Risk is Key to Decision
0.000.501.001.502.002.503.003.504.004.505.005.506.006.507.007.508.00
0 100 200 300 400 500
Corn
0.00 1.00 2.00 3.00 4.00 5.00 6.00 7.00
Corn
Corn
MYA 3.40
Ref Price 3.70
Average 0.48
No. of Zeros 155
P(=zero) 0.31
P(payment) 0.69
0.000.501.001.502.002.503.003.504.004.505.005.506.006.507.007.508.00
0 100 200 300 400 500
CornAvg $4.00
Risk is Key to Decision
0.00
2.00
4.00
6.00
8.00
10.00
12.00
0 50 100 150 200 250 300 350 400 450 500
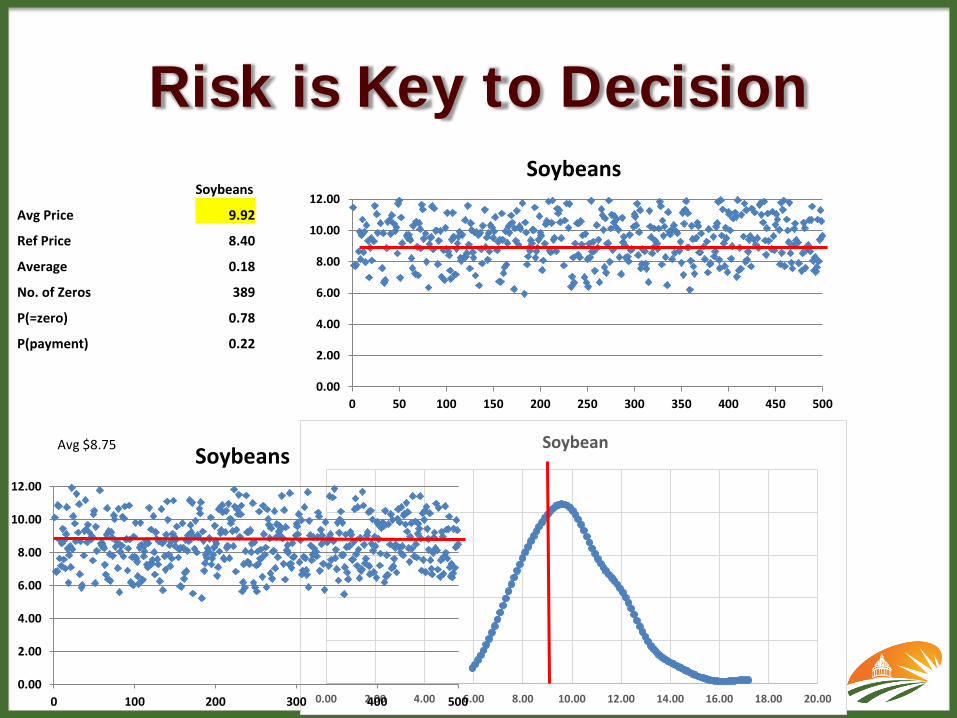
Soybeans
0.00 2.00 4.00 6.00 8.00 10.00 12.00 14.00 16.00 18.00 20.00
Soybean
Soybeans
Avg Price 9.92
Ref Price 8.40
Average 0.18
No. of Zeros 389
P(=zero) 0.78
P(payment) 0.22
0.00
2.00
4.00
6.00
8.00
10.00
12.00
0 100 200 300 400 500
SoybeansAvg $8.75
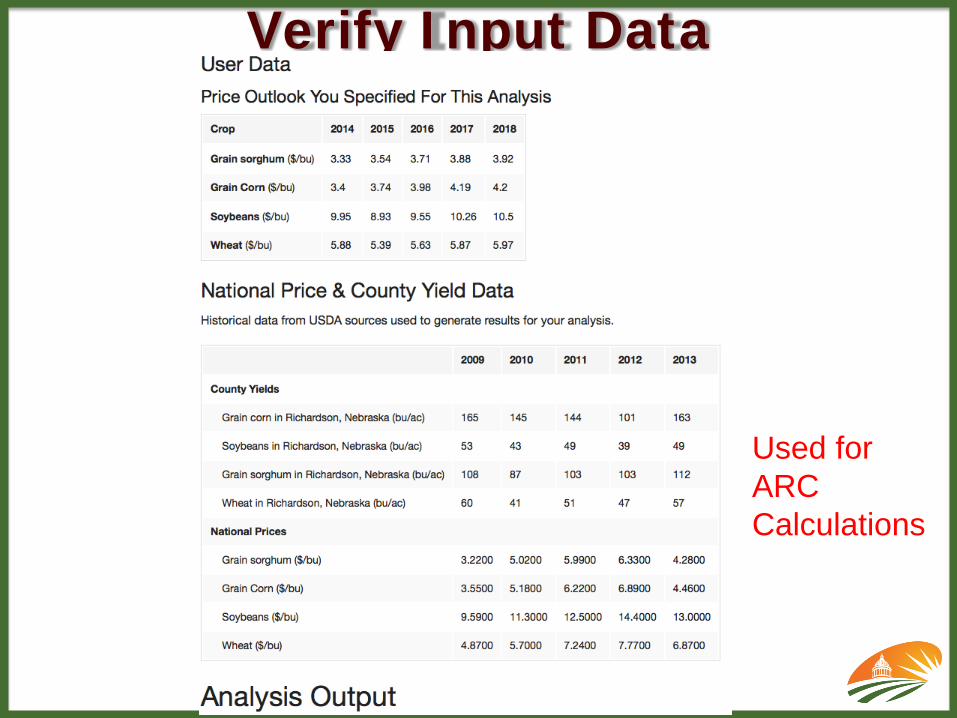
Verify Input Data
Used for ARC Calculations
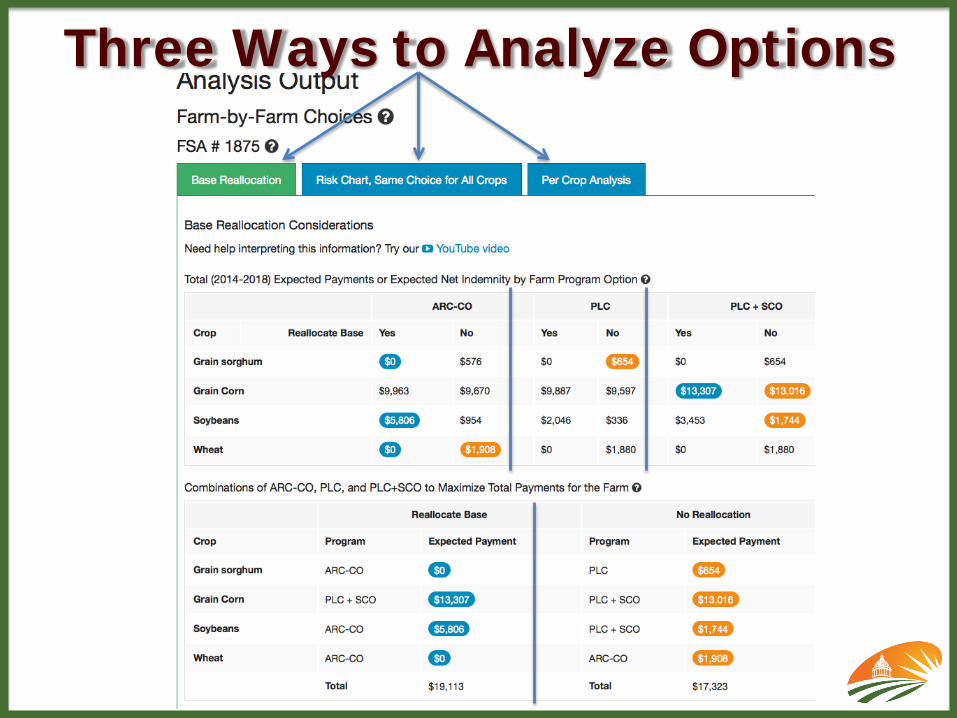
Three Ways to Analyze Options
Details for each Crop
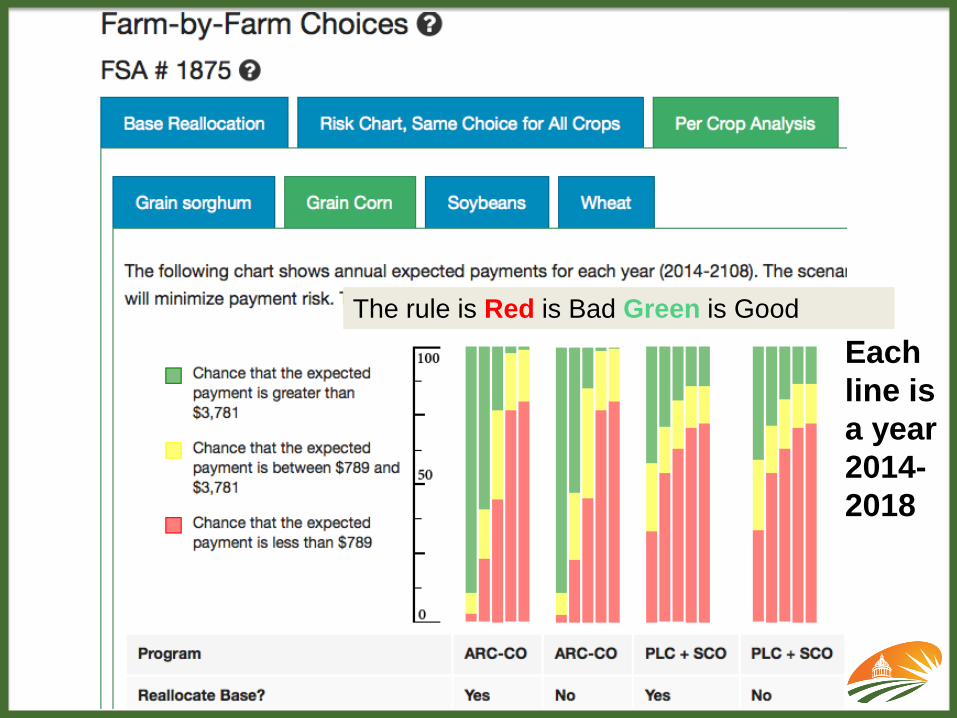
Each line is a year 2014-2018
The rule is Red is Bad Green is Good
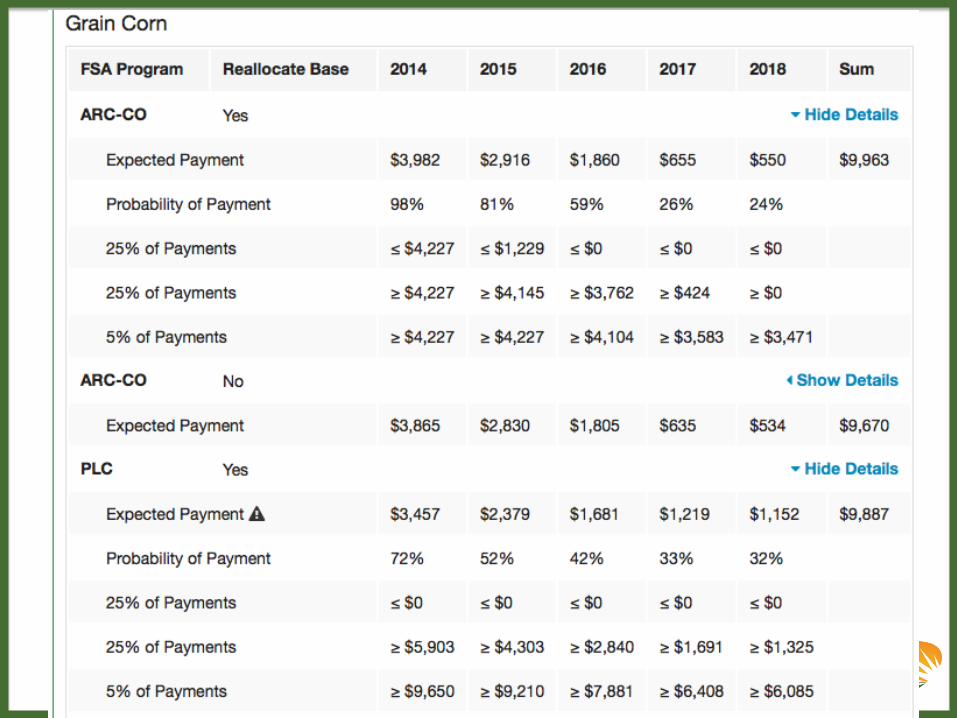
Details for each Crop
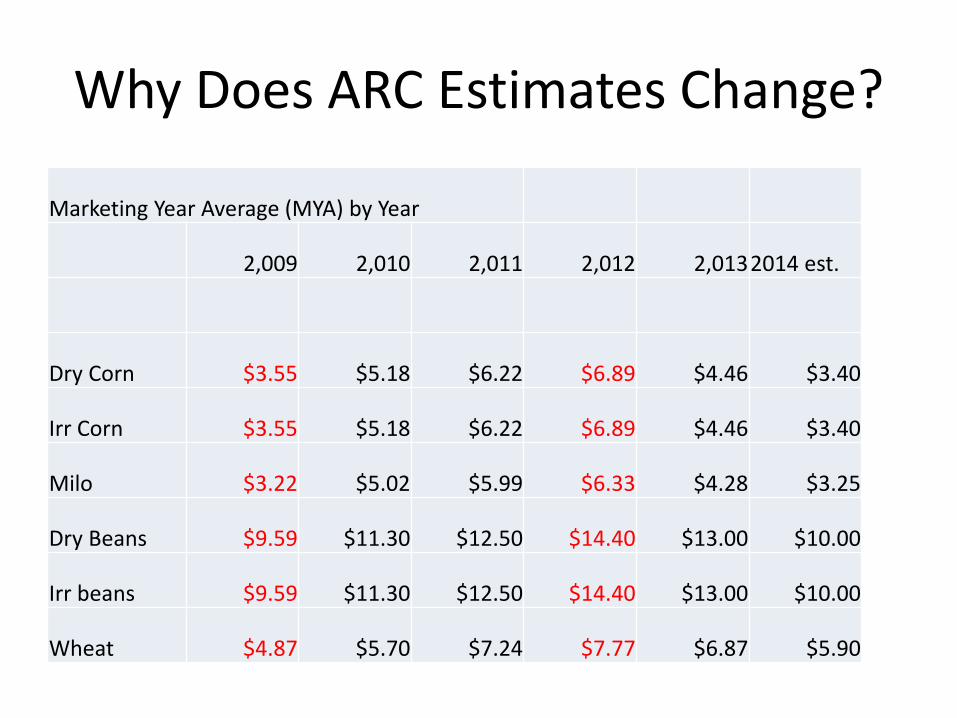
Why Does ARC Estimates Change?
Marketing Year Average (MYA) by Year
2,009 2,010 2,011 2,012 2,0132014 est.
Dry Corn $3.55 $5.18 $6.22 $6.89 $4.46 $3.40
Irr Corn $3.55 $5.18 $6.22 $6.89 $4.46 $3.40
Milo $3.22 $5.02 $5.99 $6.33 $4.28 $3.25
Dry Beans $9.59 $11.30 $12.50 $14.40 $13.00 $10.00
Irr beans $9.59 $11.30 $12.50 $14.40 $13.00 $10.00
Wheat $4.87 $5.70 $7.24 $7.77 $6.87 $5.90
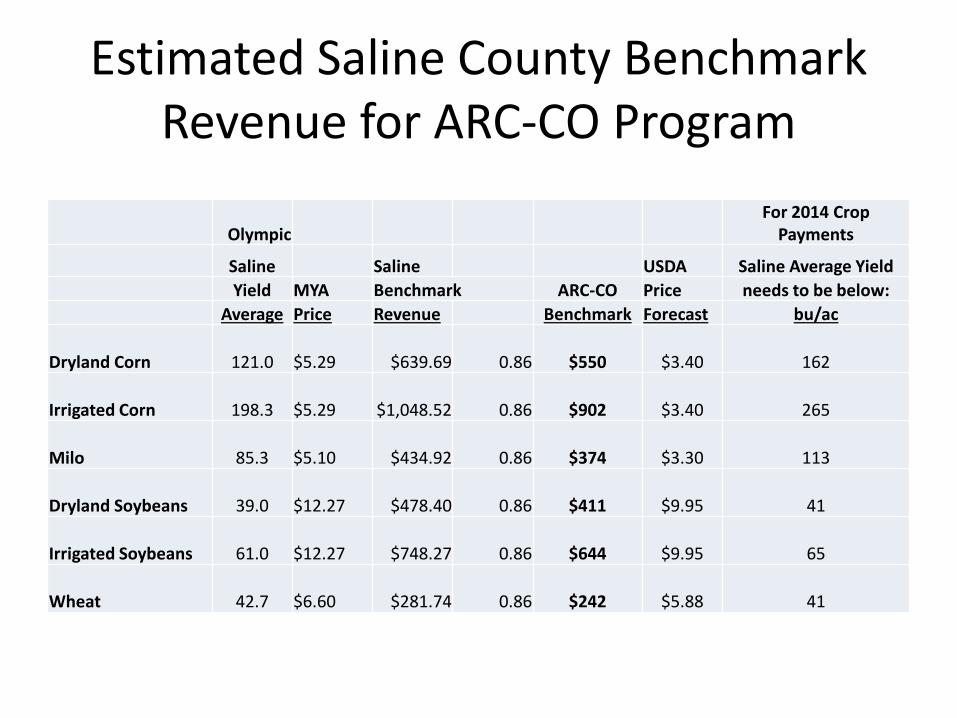
Estimated Saline County Benchmark Revenue for ARC-CO Program
OlympicFor 2014 Crop
Payments
Saline Saline USDA Saline Average YieldYield MYA Benchmark ARC-CO Price needs to be below:
Average Price Revenue Benchmark Forecast bu/ac
Dryland Corn 121.0 $5.29 $639.69 0.86 $550 $3.40 162
Irrigated Corn 198.3 $5.29 $1,048.52 0.86 $902 $3.40 265
Milo 85.3 $5.10 $434.92 0.86 $374 $3.30 113
Dryland Soybeans 39.0 $12.27 $478.40 0.86 $411 $9.95 41
Irrigated Soybeans 61.0 $12.27 $748.27 0.86 $644 $9.95 65
Wheat 42.7 $6.60 $281.74 0.86 $242 $5.88 41
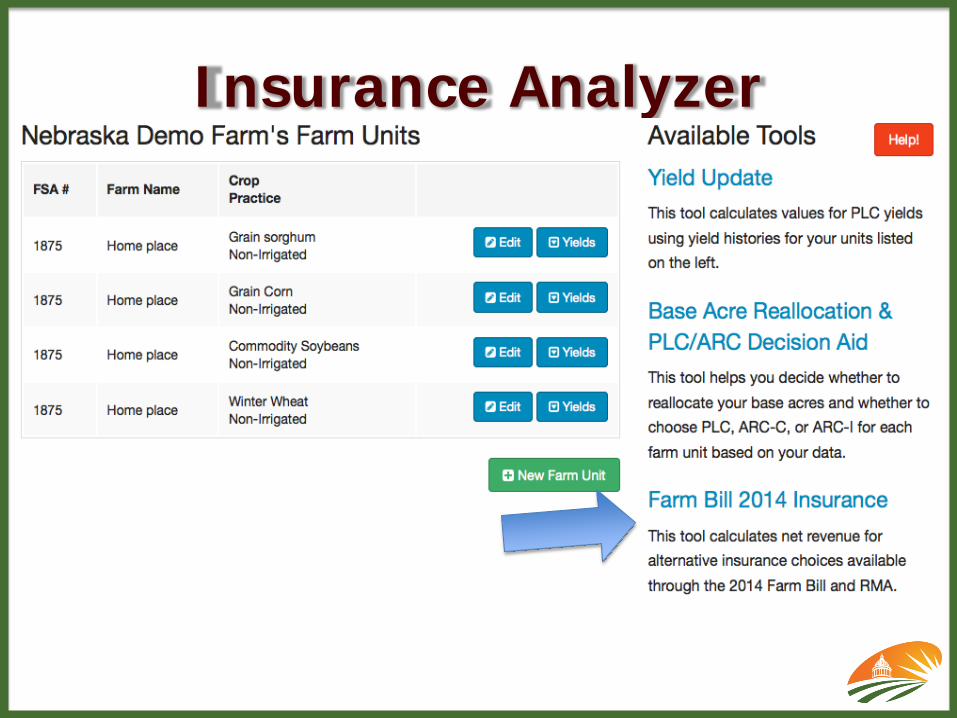
Insurance Analyzer
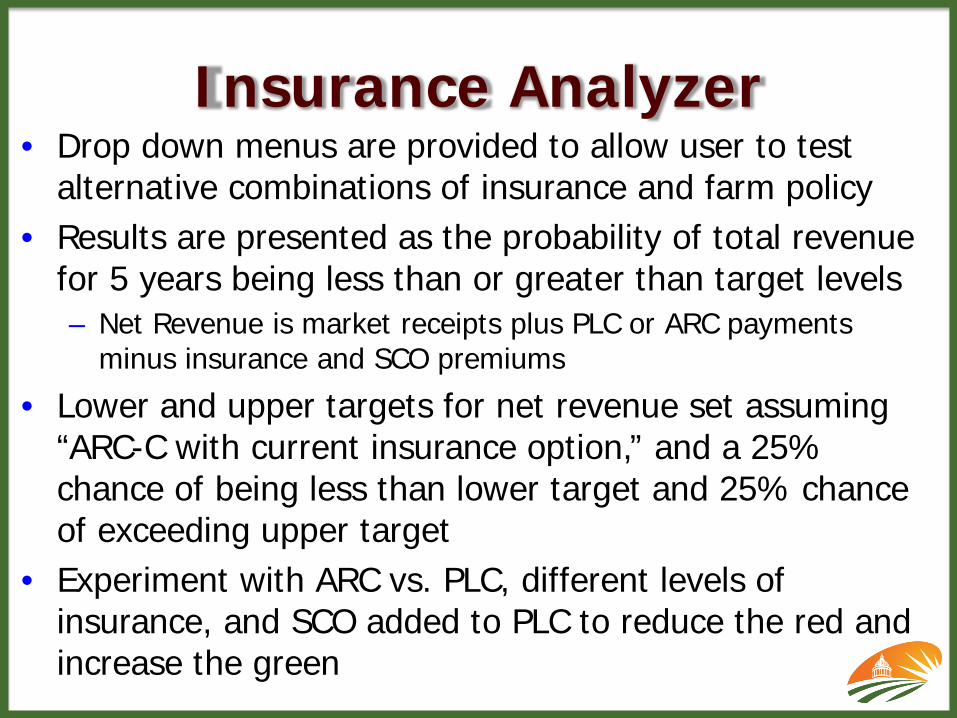
Insurance Analyzer• Drop down menus are provided to allow user to test
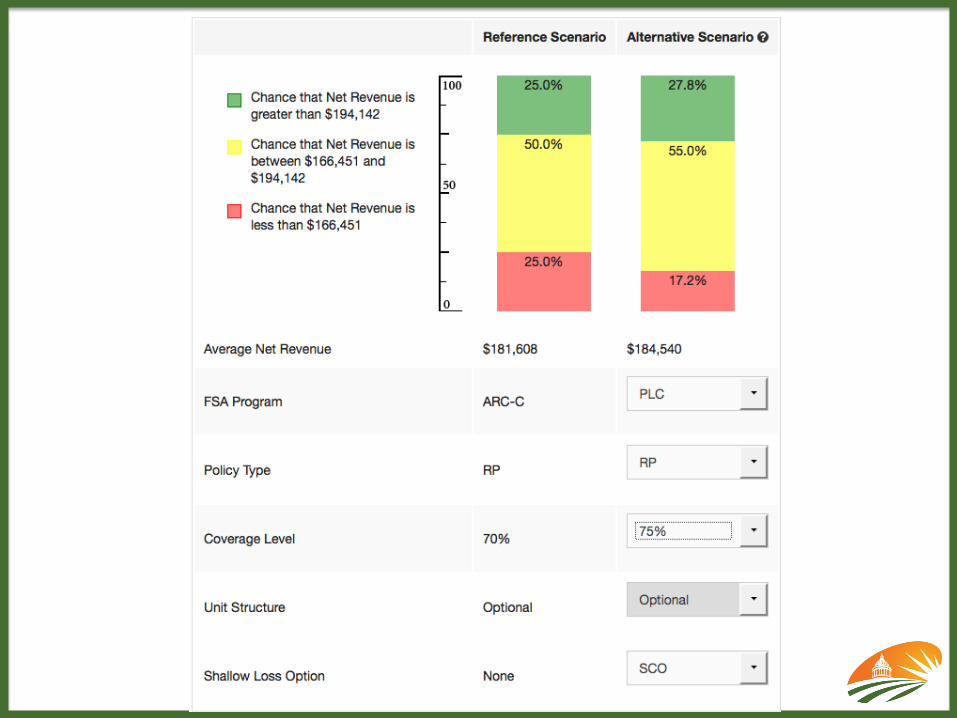
alternative combinations of insurance and farm policy• Results are presented as the probability of total revenue
for 5 years being less than or greater than target levels– Net Revenue is market receipts plus PLC or ARC payments
minus insurance and SCO premiums
• Lower and upper targets for net revenue set assuming “ARC-C with current insurance option,” and a 25% chance of being less than lower target and 25% chance of exceeding upper target
• Experiment with ARC vs. PLC, different levels of insurance, and SCO added to PLC to reduce the red and increase the green
Risk is Key to Decision• Price risk exists because we do not know what price will
be for the next 5 years• If user specifies a mean corn price of $3.40/bu there is a
69% chance of price less than the reference price– See the number of dots in the next slide that are below the
reference price out of 500 simulated prices– We simulate 500 draws of prices and yields for each year to
calculate the average payments for different policy and insurance options under risky conditions
– Decision Aid simulates prices and county yields using historical risk for 1982-2013
– We include all correlation of prices and yields
• For your farm enter 10 or more yields to get the full benefit of the insurance option
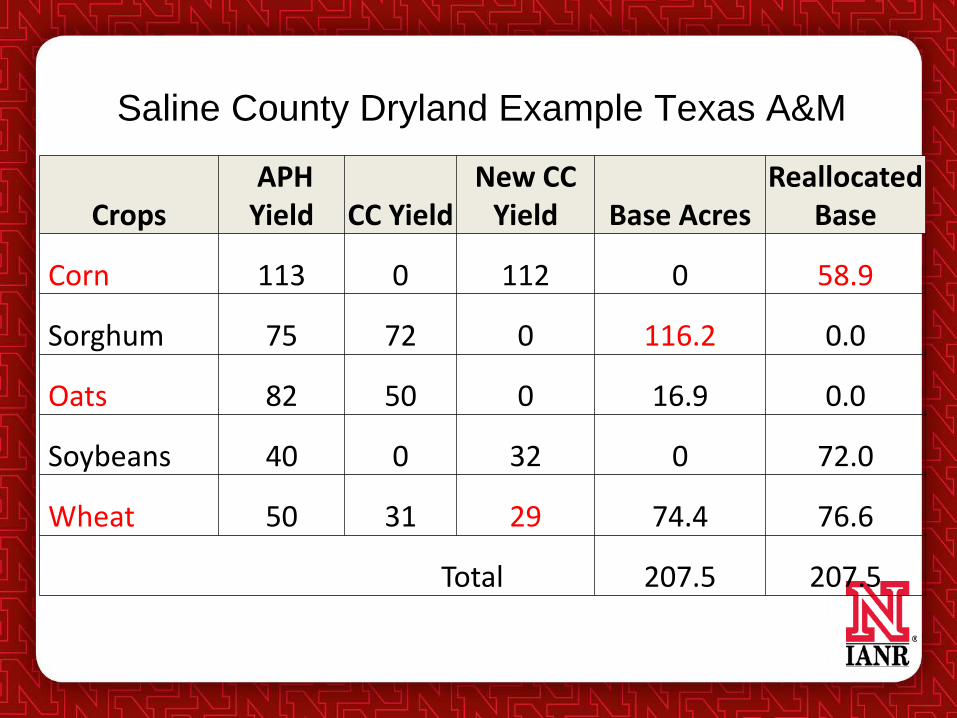
Saline County Dryland Example Texas A&M
CropsAPH
Yield CC YieldNew CC
Yield Base AcresReallocated
Base
Corn 113 0 112 0 58.9
Sorghum 75 72 0 116.2 0.0
Oats 82 50 0 16.9 0.0
Soybeans 40 0 32 0 72.0
Wheat 50 31 29 74.4 76.6
Total 207.5 207.5
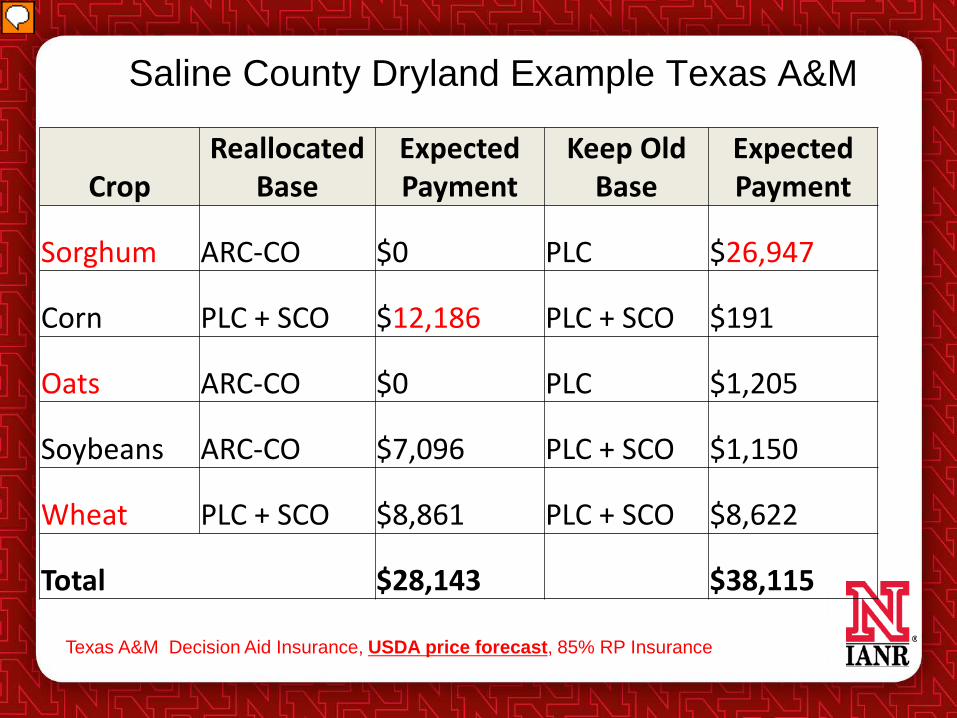
Saline County Dryland Example Texas A&M
Texas A&M Decision Aid Insurance, USDA price forecast, 85% RP Insurance
CropReallocated
BaseExpected Payment
Keep Old Base
Expected Payment
Sorghum ARC-CO $0 PLC $26,947
Corn PLC + SCO $12,186 PLC + SCO $191
Oats ARC-CO $0 PLC $1,205
Soybeans ARC-CO $7,096 PLC + SCO $1,150
Wheat PLC + SCO $8,861 PLC + SCO $8,622
Total $28,143 $38,115
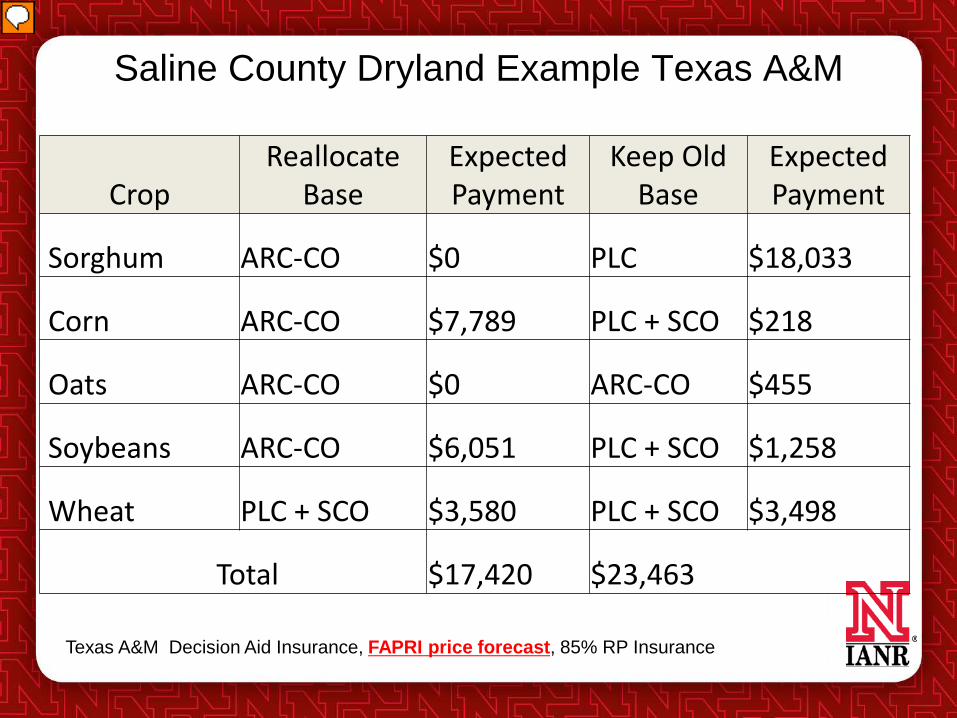
Saline County Dryland Example Texas A&M
CropReallocate
BaseExpected Payment
Keep Old Base
Expected Payment
Sorghum ARC-CO $0 PLC $18,033
Corn ARC-CO $7,789 PLC + SCO $218
Oats ARC-CO $0 ARC-CO $455
Soybeans ARC-CO $6,051 PLC + SCO $1,258
Wheat PLC + SCO $3,580 PLC + SCO $3,498
Total $17,420 $23,463
Texas A&M Decision Aid Insurance, FAPRI price forecast, 85% RP Insurance
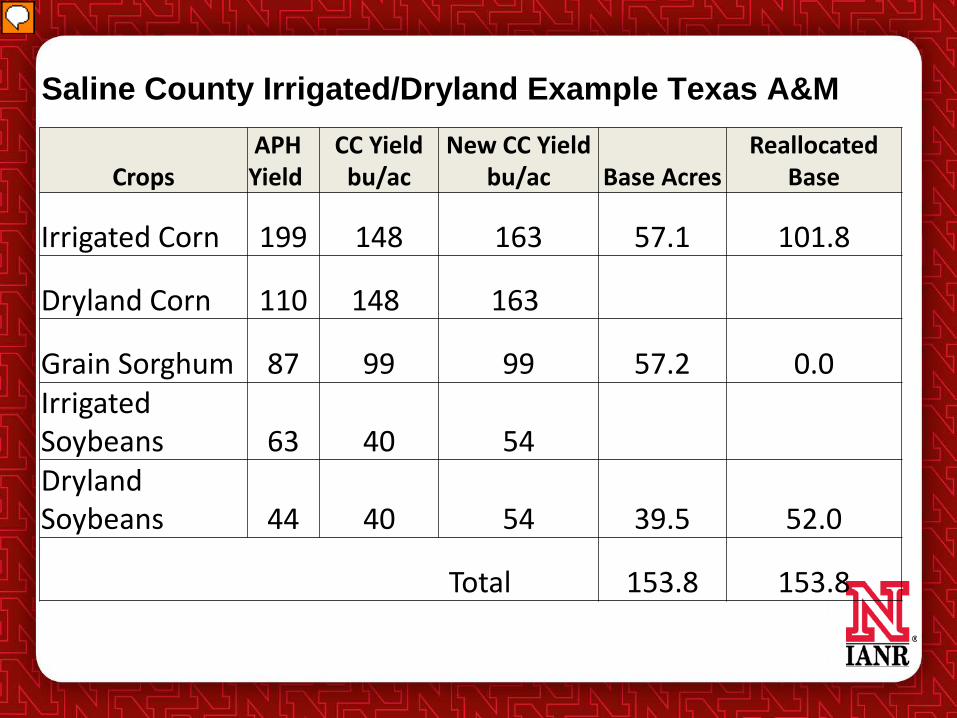
Saline County Irrigated/Dryland Example Texas A&M
CropsAPH Yield
CC Yield bu/ac
New CC Yield bu/ac Base Acres
Reallocated Base
Irrigated Corn 199 148 163 57.1 101.8
Dryland Corn 110 148 163
Grain Sorghum 87 99 99 57.2 0.0Irrigated Soybeans 63 40 54DrylandSoybeans 44 40 54 39.5 52.0
Total 153.8 153.8
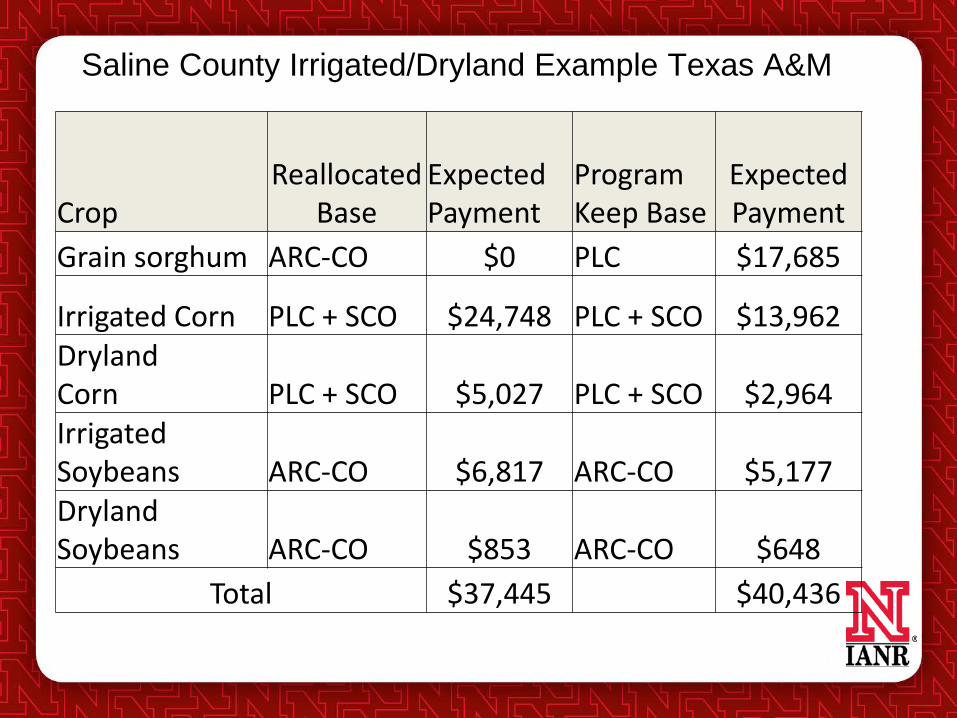
Saline County Irrigated/Dryland Example Texas A&M
CropReallocated
BaseExpected Payment
Program Keep Base
Expected Payment
Grain sorghum ARC-CO $0 PLC $17,685
Irrigated Corn PLC + SCO $24,748 PLC + SCO $13,962 DrylandCorn PLC + SCO $5,027 PLC + SCO $2,964 Irrigated Soybeans ARC-CO $6,817 ARC-CO $5,177 DrylandSoybeans ARC-CO $853 ARC-CO $648
Total $37,445 $40,436
Saline County Dryland Example
Saline County Dryland Example
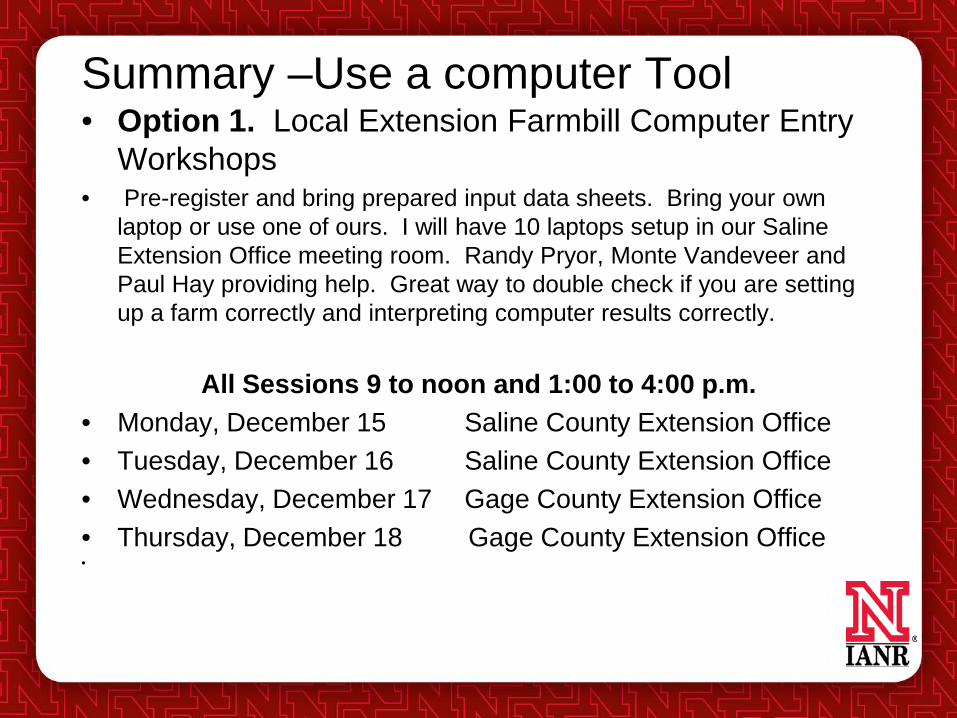
Summary –Use a computer Tool• Option 1. Local Extension Farmbill Computer Entry
Workshops• Pre-register and bring prepared input data sheets. Bring your own
laptop or use one of ours. I will have 10 laptops setup in our Saline Extension Office meeting room. Randy Pryor, Monte Vandeveer and Paul Hay providing help. Great way to double check if you are setting up a farm correctly and interpreting computer results correctly.
All Sessions 9 to noon and 1:00 to 4:00 p.m.• Monday, December 15 Saline County Extension Office • Tuesday, December 16 Saline County Extension Office• Wednesday, December 17 Gage County Extension Office• Thursday, December 18 Gage County Extension Office •

• Option 2. January 14, 2015 9:00 a.mat the UNL Innovation Campus Facility (Old Nebraska Fairgrounds near Bob Devaney complex) Pre-registration details coming soon.
• Dr. James Richardson, from Texas A&M agreed to teach this Hands On session. Bring your own laptop/ipad.
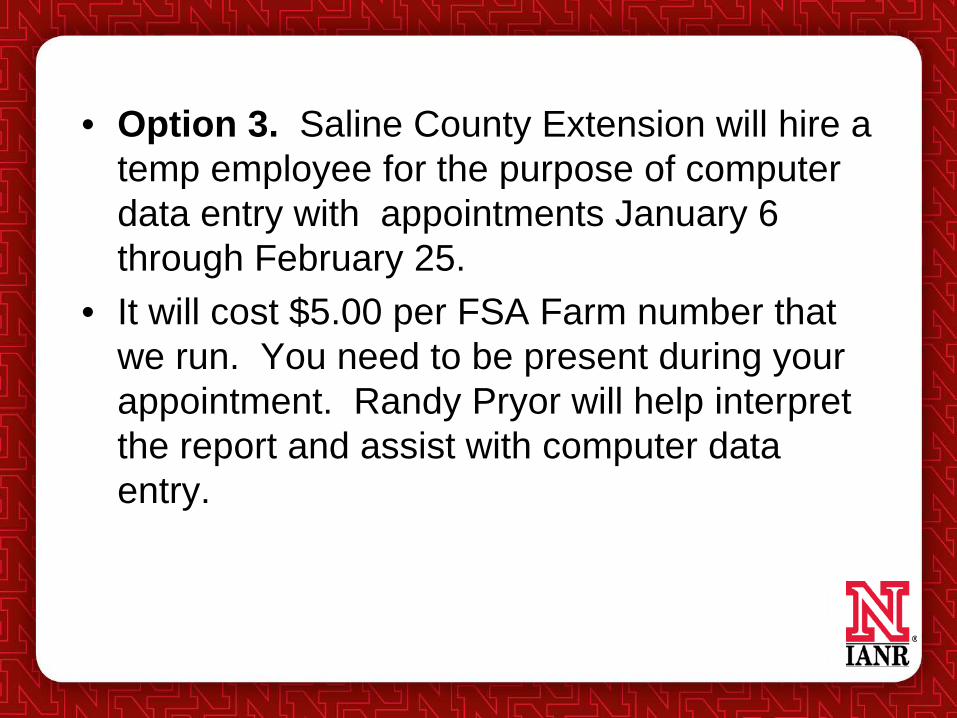
• Option 3. Saline County Extension will hire a temp employee for the purpose of computer data entry with appointments January 6through February 25.
• It will cost $5.00 per FSA Farm number that we run. You need to be present during your appointment. Randy Pryor will help interpret the report and assist with computer data entry.