Embed Size (px)
Citation preview

2014 Fourth Quarter and Full Year Earnings
Call Presentation
March 10, 2015

Earnings Call Q4 & Full Year 2014 Presentation
Safe Harbor Statement
2
Certain statements and information included in this presentation constitute "forward-looking information" within the meaning of applicable Canadian securities legislation and "forward-looking statements" within the meaning of Section 27A of the Securities Act of 1933, as amended, and Section 21E of the Securities Exchange Act of 1934, as amended (collectively, "forward-looking statements"), which are made in reliance upon the protections provided by such legislation for forward-looking statements. All statements other than statements of historical facts included in this presentation, including statements regarding the Company's revenue from new products, the Company's upcoming dividend payment, the update on the South Carolina Project, including the annualized expected cash savings and timing, the Company's expected capital expenditures for 2015, certain high return projects identified, the Company's expected manufacturing cost reductions for 2015, and the Company's 2015 first quarter, first half and full year outlook, as well as the 2015 manufacturing cost reductions, 2015 income taxes and 2015 capital expenditures, may constitute forward-looking statements. These forward-looking statements are based on current beliefs, assumptions, expectations, estimates, forecasts and projections made by the Company's management. Words such as "may," "will," "should," "expect," "continue," "intend," "estimate," "anticipate," "plan," "foresee," "believe," or "seek" or the negatives of these terms or variations of them or similar terminology are intended to identify such forward-looking statements. Although the Company believes that the expectations reflected in these forward-looking statements are reasonable, these statements, by their nature, involve risks and uncertainties and are not guarantees of future performance. Such statements are also subject to assumptions concerning, among other things: business conditions and growth or declines in the Company's industry, the Company's customers' industries and the general economy; the anticipated benefits from the Company's manufacturing facility closures and other restructuring efforts; the quality, and market reception, of the Company's products; the Company's anticipated business strategies; risks and costs inherent in litigation; the Company’s ability to maintain and improve quality and customer service; anticipated trends in the Company's business; anticipated cash flows from the Company’s operations; availability of funds under the Company’s Credit Facility; and the Company's ability to continue to control costs. The Company can give no assurance that these statements and expectations will prove to have been correct. Actual outcomes and results may, and often do, differ from what is expressed, implied or projected in such forward-looking statements, and such differences may be material. Readers are cautioned not to place undue reliance on any forward-looking statement.
For additional information regarding important factors that could cause actual results to differ materially from those expressed in these forward-looking statements and other risks and uncertainties, and the assumptions underlying the forward-looking statements, you are encouraged to read "Item 3. Key Information - Risk Factors," "Item 5. Operating and Financial Review and Prospects (Management's Discussion & Analysis)" and statements located elsewhere in the Company's annual report on Form 20-F for the year ended December 31, 2013 and the other statements and factors contained in the Company's filings with the Canadian securities regulators and the US Securities and Exchange Commission. Each of these forward-looking statements speaks only as of the date of this presentation. The Company will not update these statements unless applicable securities laws require it to do so.
This presentation contains certain non-GAAP financial measures as defined under applicable securities legislation, including Adjusted EBITDA, Adjusted EBITDA as a Percentage of Revenue, Adjusted Net Earnings, Adjusted Earnings per Share, Operating Profit Before Manufacturing Closures and Manufacturing Closure Costs and Other. The Company believes such non-GAAP financial measures improve the transparency of the Company’s disclosures, and improves the period-to-period comparability of the Company’s results from its core business operations. As required by applicable securities legislation, the Company has provided definitions of these non-GAAP measures contained in this presentation, as well as a reconciliation of each of them to the most directly comparable GAAP measure, on its website at http://www.intertapepolymer.com under “Investor Relations” and “Financial Presentations”. You are encouraged to review the related GAAP financial measures and the reconciliation of non-GAAP measures to their most directly comparable GAAP measures set forth on the website and should consider non-GAAP measures only as a supplement to, not as a substitute for or as a superior measure to, measures of financial performance prepared in accordance with GAAP.

Earnings Call Q4 & Full Year 2014 Presentation
• Revenue of $200.8 million, an increase of 4.8%– Sales volume increased approximately 5% primarily driven by carton sealing tape and
woven products in agro-environmental and building & construction markets– Average selling price, including the impact of product mix, was steady
• Gross margin decreased to 18.0% from 19.8%– An unfavourable product mix – South Carolina Duplicate Overhead Costs of approximately $1.6 million– Partially offset by:
• net manufacturing cost reductions• increase in the spread between selling prices and higher raw material costs
• Adjusted EBITDA of $20.6 million, a decrease of 14.0% – Higher SG&A expenses– Lower gross profit
Q4 2014 Highlights (as compared to Q4 2013)
3

Earnings Call Q4 & Full Year 2014 Presentation
Revenue Analysis
4
(In millions of US dollars)

Earnings Call Q4 & Full Year 2014 Presentation
New Products
5
Note:• New products include all products introduced over the previous five years
• New Products as a % of Total Revenue– Total 2014 ~18%– Total 2013 ~18%– Total 2012 >15%– Total 2011 >10%
• Beyond 2014, short to medium-term goal is approximately 20% of total revenue from new products

Earnings Call Q4 & Full Year 2014 Presentation
Update on South Carolina Project
6
Project Status
• Duct tape
– Ahead of schedule to cease parallel production beginning in early April 2015– Represents approximately half of the annualized expected cash savings of at least $13 million
• Masking tape
– On schedule to complete move to Blythewood towards the end Q2 2015– Represents approximately half of the annualized expected cash savings of at least $13 million
• Flatback tape
– Paper coating machinery move to Marysville beginning in late March 2015– On schedule to cease parallel production in Q2 2015– Minimal savings expected once moved to Marysville
• Stencil
– Operations to remain in Columbia through the end of 2015– Minimal incremental cost to remain in Columbia, and little savings expected once moved to
Blythewood

Earnings Call Q4 & Full Year 2014 Presentation
2015 Capital Expenditures
7
Expected 2015 Capital Expenditures of $32 to $37 million
• Includes annual maintenance budget of $12 to $15 million
Key High Return Projects Identified Across Our Major Categories:
– Tapes: Water Activated line improvements for additional capacity and
efficiency
– Films: Shrink and Stretch line improvements for increased capacity, efficiency,
and new product offerings
– Woven: line improvements for new product offerings and increased efficiency
• Projects expected to be completed in 2015 and into 2016 with returns expected to
be in excess of a minimum hurdle rate of 15%

Earnings Call Q4 & Full Year 2014 Presentation
Capital Expenditures
8
(In millions of US dollars)
Expected range

Earnings Call Q4 & Full Year 2014 Presentation
Manufacturing Cost Reductions (1)
9
(1) Approximate values
Expected range
(In millions of US dollars)

Earnings Call Q4 & Full Year 2014 Presentation
Share Repurchase and Dividend Announcements
10
• Share Repurchases– Under current NCIB can repurchase up to 2,000,000 common shares in the twelve-
month period ending July 9, 2015– Repurchased 597,500 common shares at an average price of CDN$14.35 – Total purchase price of $7.8 million
• Dividends– Total dividends paid in 2014 increased 67% to $24.3 million or $0.40 per share– Annualized dividend increased 50% in 2014 to $0.48 per share– Declared a dividend of $0.12 per common share payable on March 31, 2015

Earnings Call Q4 & Full Year 2014 Presentation
Summary Q4 2014 Results
11

Earnings Call Q4 & Full Year 2014 Presentation
Summary Full Year 2014 Results
12

Earnings Call Q4 & Full Year 2014 Presentation
Adjusted EBITDA Q4 2014 over Q4 2013
13
(In millions of US dollars)

Earnings Call Q4 & Full Year 2014 Presentation
Adjusted EBITDA Q4 2014 over Q3 2014
14
(In millions of US dollars)

Earnings Call Q4 & Full Year 2014 Presentation
Adjusted EBITDA Full Year 2014 over Full Year 2013
15
(In millions of US dollars)

Earnings Call Q4 & Full Year 2014 Presentation
Summary Q4 2014 Results
16

Earnings Call Q4 & Full Year 2014 Presentation
Total Debt
17
Total Debt to TTM Adjusted EBITDA

Earnings Call Q4 & Full Year 2014 Presentation
Outlook
18
• Q1 2015 revenue lower than Q1 2014 primarily due to decline in resin and crude oil prices:
– temporary impact from the de-stocking of inventory by our customers – decline in average selling price mainly in film products
• Q1 2015 gross margin and adjusted EBITDA lower than Q1 2014 due to the factors mentioned above, as well as South Carolina Duplicate Overhead Costs
• South Carolina Duplicate Overhead Costs of ~$2.3 million in Q1 2015 (~$0.7 million non-cash charges and will not affect adjusted EBITDA)
• South Carolina Duplicate Overhead Costs are expected to total ~$3.7 million in the first half of 2015
Earnings Call Q4 & Full Year 2014 Presentation
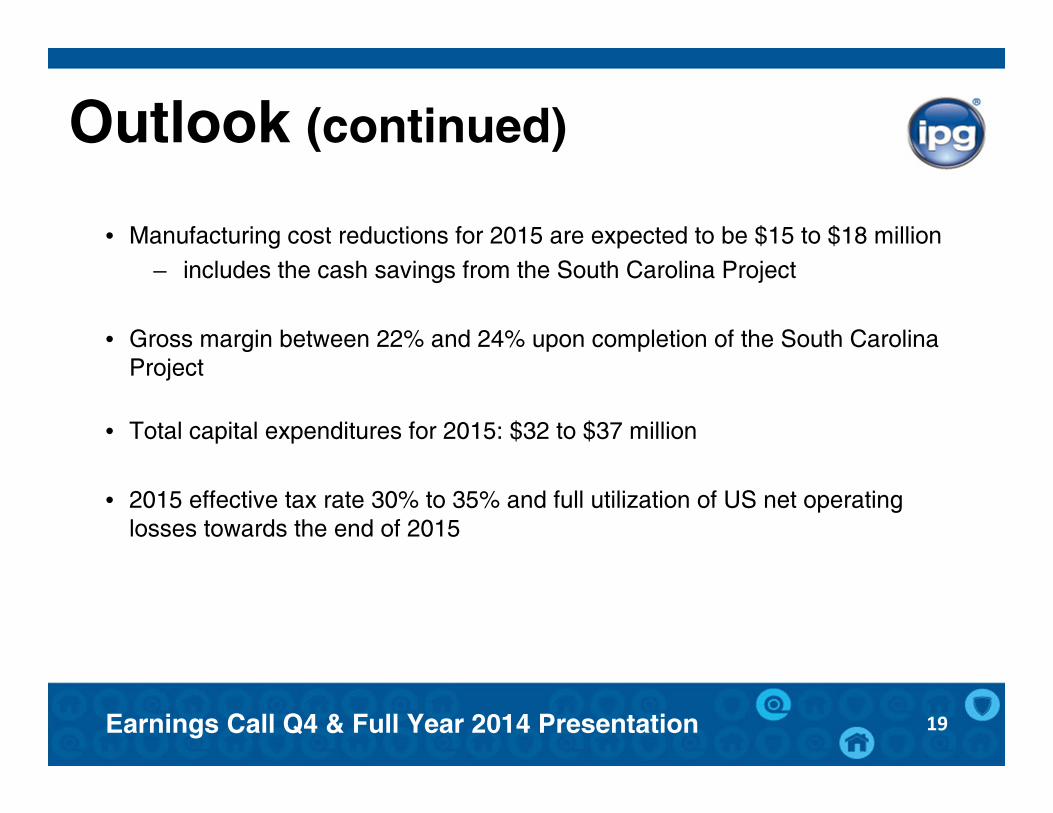
Outlook (continued)
19
• Manufacturing cost reductions for 2015 are expected to be $15 to $18 million– includes the cash savings from the South Carolina Project
• Gross margin between 22% and 24% upon completion of the South Carolina Project
• Total capital expenditures for 2015: $32 to $37 million
• 2015 effective tax rate 30% to 35% and full utilization of US net operating losses towards the end of 2015

Earnings Call Q4 & Full Year 2014 Presentation 20
Industrial Packaging
Marine & Composites
Building & ConstructionHVAC
Geo Membrane AerospaceStructured FabricsAutomotive Aftermarket