Embed Size (px)
Citation preview
2014 GSCMI Case CompetitionTeam MECE Presentation
Yejin Lee| Bumsun RyuSaya Lee| Ryan Seongjin Shin

Agenda (Yejin)
• Problem Statement• Recommendation• Analysis• Implementation / Risk Mitigation• Evaluation of Alternatives• Conclusion

Premium Freight Frequency
Problem Statement (Yejin)
Short-Term
Inventory Level
Build Supply Network
Long-Term
Problem Statement
Recommendation Analysis Implementatio
n & Risk
Evaluation of
AlternativeConclusion
• Unbalanced performance between the west and the east• High premium freight frequency• High overall inventory level
Key Issues?
Sustains the Growth
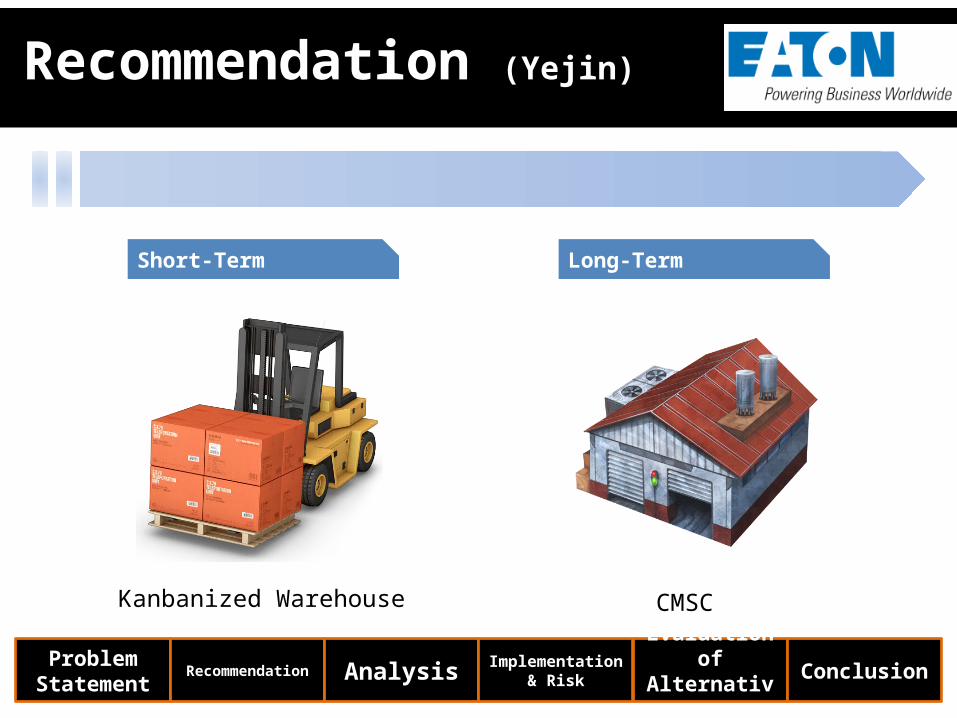
Recommendation (Yejin)
Short-Term Long-Term
Kanbanized Warehouse CMSC
Problem Statement
Recommendation Analysis Implementatio
n & Risk
Evaluation of
AlternativeConclusion
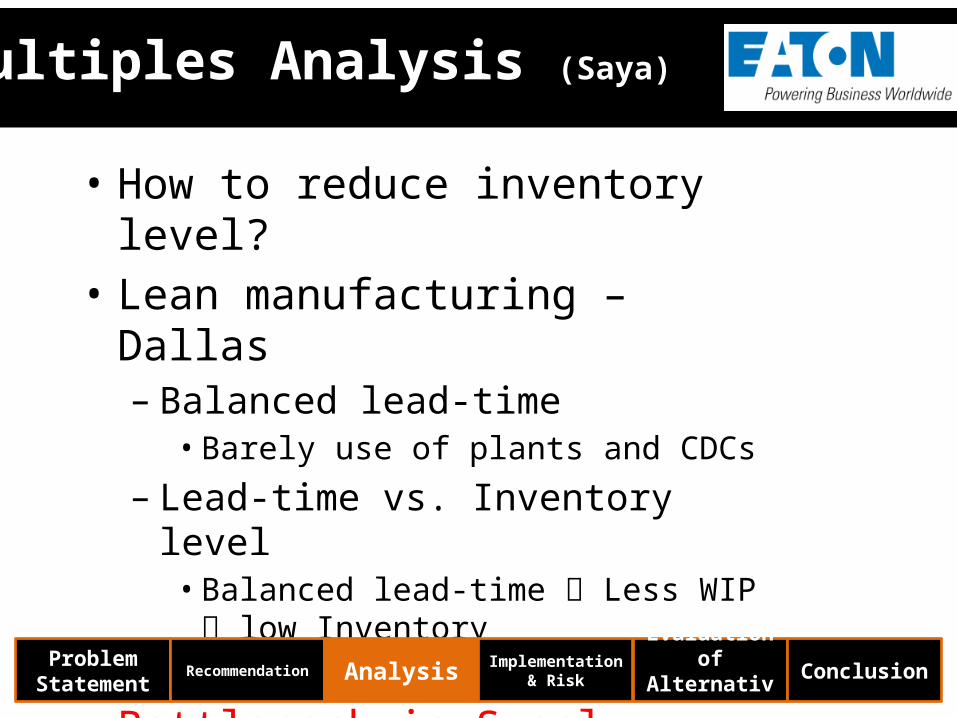
Multiples Analysis (Saya)
• How to reduce inventory level?• Lean manufacturing – Dallas– Balanced lead-time• Barely use of plants and CDCs
– Lead-time vs. Inventory level• Balanced lead-time Less WIP
low Inventory No bottleneck
• Bottleneck in Supply Chain
Problem Statement
Recommendation Analysis Implementatio
n & Risk
Evaluation of
AlternativeConclusion
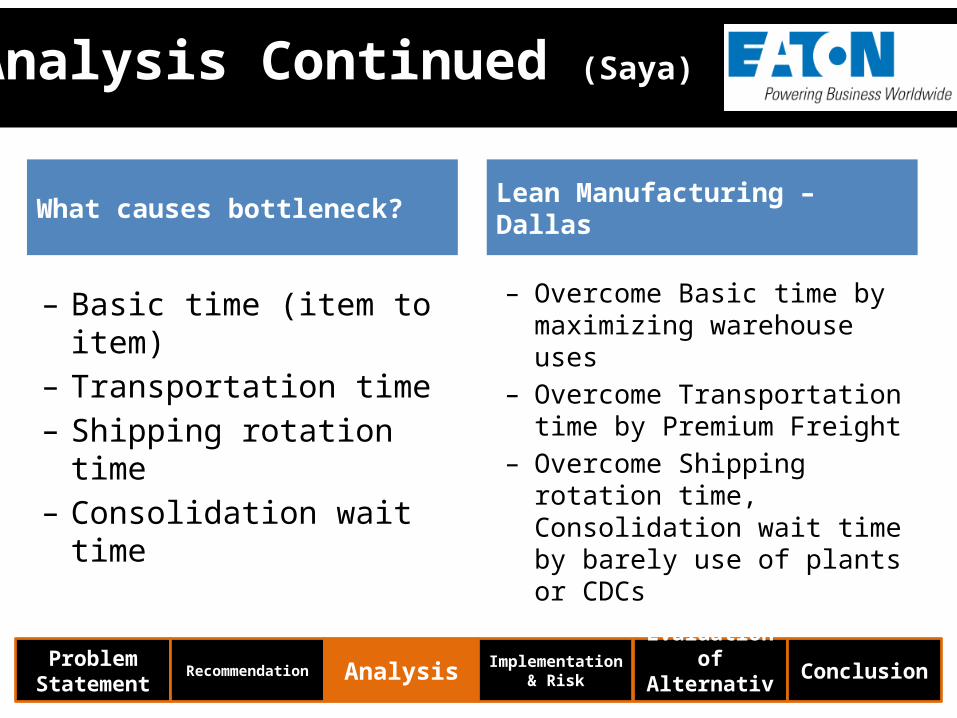
Analysis Continued (Saya)
– Basic time (item to item)
– Transportation time– Shipping rotation time– Consolidation wait time
Problem Statement
Recommendation Analysis Implementatio
n & Risk
Evaluation of
AlternativeConclusion
What causes bottleneck?Lean Manufacturing – Dallas
– Overcome Basic time by maximizing warehouse uses
– Overcome Transportation time by Premium Freight
– Overcome Shipping rotation time, Consolidation wait time by barely use of plants or CDCs
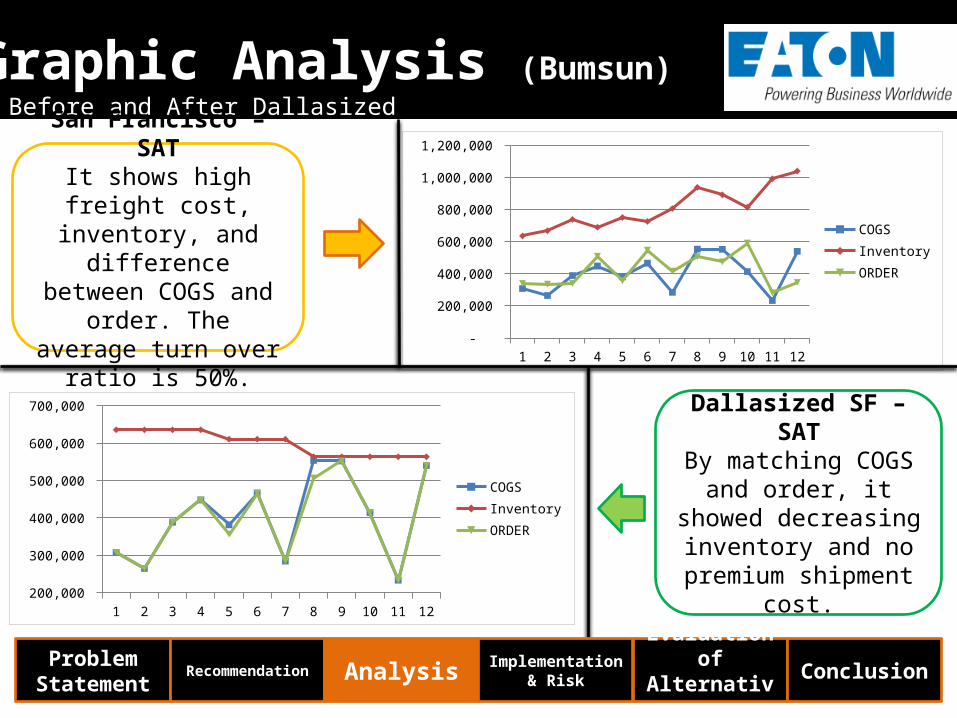
Graphic Analysis (Bumsun)Before and After Dallasized
1 2 3 4 5 6 7 8 9 10 11 12 -
200,000
400,000
600,000
800,000
1,000,000
1,200,000
COGSInventoryORDER
San Francisco – SAT
It shows high freight cost, inventory, and difference between
COGS and order. The average turn over
ratio is 50%.
Problem Statement
Recommendation Analysis Implementatio
n & Risk
Evaluation of
AlternativeConclusion
1 2 3 4 5 6 7 8 9 10 11 12 200,000
300,000
400,000
500,000
600,000
700,000
COGSInventoryORDER
Dallasized SF – SAT
By matching COGS and order, it
showed decreasing inventory and no
premium shipment cost.
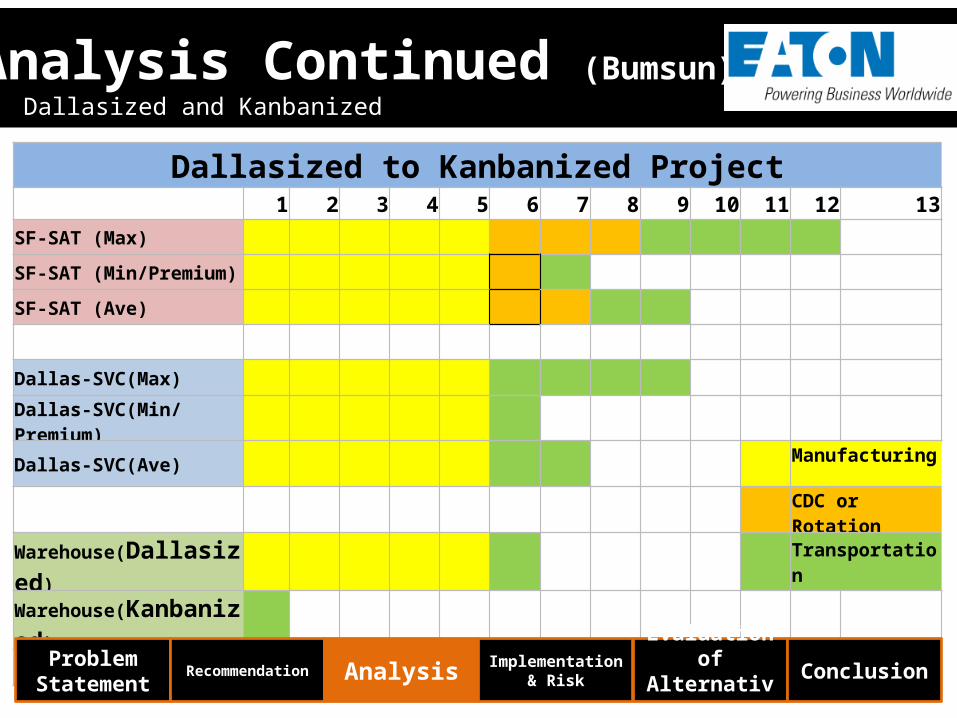
Analysis Continued (Bumsun)
Dallasized to Kanbanized Project1 2 3 4 5 6 7 8 9 10 11 12 13
SF-SAT (Max)
SF-SAT (Min/Premium)
SF-SAT (Ave)
Dallas-SVC(Max)
Dallas-SVC(Min/Premium)
Dallas-SVC(Ave) Manufacturing
CDC or Rotation
Warehouse(Dallasized) Transportation
Warehouse(Kanbanized)
Dallasized and Kanbanized
Problem Statement
Recommendation Analysis Implementatio
n & Risk
Evaluation of
AlternativeConclusion
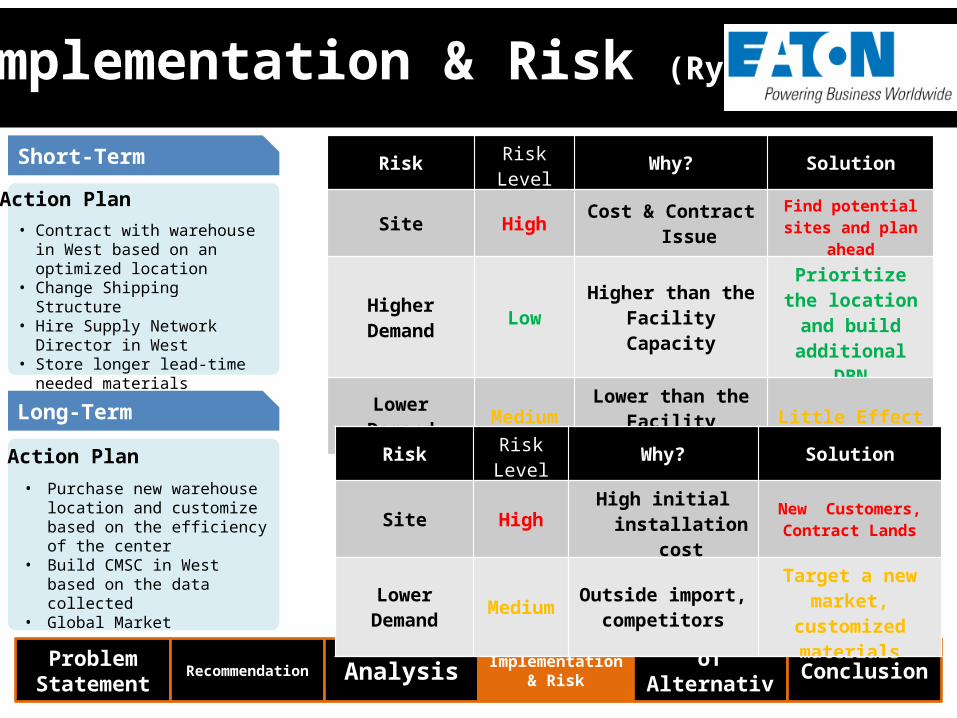
Implementation & Risk (Ryan)
Problem Statement
Recommendation Analysis Implementatio
n & Risk
Evaluation of
AlternativeConclusion
Short-Term
Long-Term
Action Plan• Contract with warehouse in
West based on an optimized location
• Change Shipping Structure• Hire Supply Network
Director in West• Store longer lead-time
needed materials
Action Plan
• Purchase new warehouse location and customize based on the efficiency of the center
• Build CMSC in West based on the data collected
• Global Market
Risk Risk Level Why? Solution
Site High Cost & Contract Issue Find potential sites and plan ahead
Higher Demand Low Higher than the Facility Capacity
Prioritize the location and build
additional DBN
Lower Demand Medium Lower than the Facility Capacity Little Effect
Risk Risk Level Why? Solution
Site High High initial installation cost
New Customers, Contract Lands
Lower Demand Medium Outside import, competitors
Target a new market, customized materials

Evaluation of Alternative(Ryan)
Criteria
Options
CAPA Mobility Cost (Initial, Long-term)
New CMSC 1 3 3
Warehouse 2 1 2
New DBN 3 2 1
Problem Statement
Recommendation Analysis Implementatio
n & Risk
Evaluation of
AlternativeConclusion

Conclusion (Ryan)
• Build a warehouse
•Dallasization & Kabanization
Recommendation
• Build an optimized location for the warehouse• Purchase new warehouse on the efficiency of the center• Build CMSC in West based on the data collected• Build CMSC for further market
Implementation
• Collect more data to build or buy any additional needed
• Target Global market
• Compliance with DOE terms necessaryStrategic Approach
• Site of warehouse related issues
•Demand Uncertainty
• Competitors
• No experience with mass productionPotential Risks
Problem Statement
Recommendation Analysis Implementatio
n & Risk
Evaluation of
AlternativeConclusion

Financial ResultQ
&A
Appendix

Key Assumption
• Manufacturing process and ability are similar across all CMSC.
• CMSC is focused on customization orders that leads Advanced Purchase items.
• The amount of order in dollar matches the COGS within 10% distribution due to Dallasizing (Slide 7).
• Manufacturing process takes 5 days and same for all parts (Slide 8).
• *Premium Shipment Frequency & Total Order Amount is Equally Weighted (Appendix)
• *Premium Order / Total Order = Average Above 7.5% Considered (Appendix)

Location Optimization
"Minisum" Straight Line Method
San Fransisco Los Angles Portland Seattle Texas Chicago
Xi -122.166871 -118.27425 -122.740489 -122.16687 -96.2086 -88.0715
Yi 47.585089 34.140765 45.395185 47.585089 31.42434 41.92453
Wi 18.98% 20.83% 10.88% 10.76% 24.29% 14.26%
XiWi -23.19317751 -24.6339286 -13.35023538 -13.1473382 -23.36612 -12.56062
YiWi 9.033950094 7.11077174 4.937542696 5.121005834 7.6320063 5.9792136
Optimal Location X* -110.2514
Y* 39.81449
PremiumShip Frequency (Month) Percentage Total Order Amount ($) Percentage Weighted Percentage
San Fransisco 12 22.018% 1,208,252 15.951% 18.98%
Los Angles 11 20.183% 1,626,431.94 21.472% 20.83%
Portland 9 16.514% 396,898 5.240% 10.88%
Seattle 9 16.514% 379,474 5.010% 10.76%
Texas 6.5 11.927% 2,775,890 36.647% 24.29%
Chicago 7 12.844% 1,187,675.15 15.680% 14.26%
Sum 54.5 7,574,621 100.00%
Based on the Minisum Analysis, Results are 39°81‘44.9"N -110°25‘14“W