Embed Size (px)
Citation preview
2014 Inyo 0-5 Family Data for Review
Strengthening Families to Benefit Kids
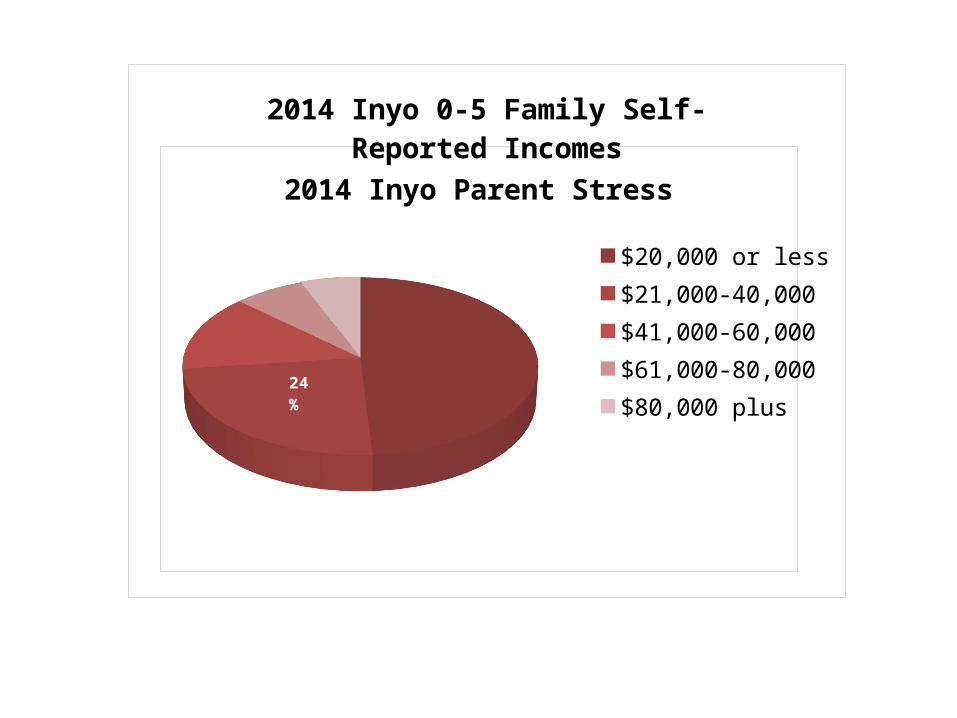
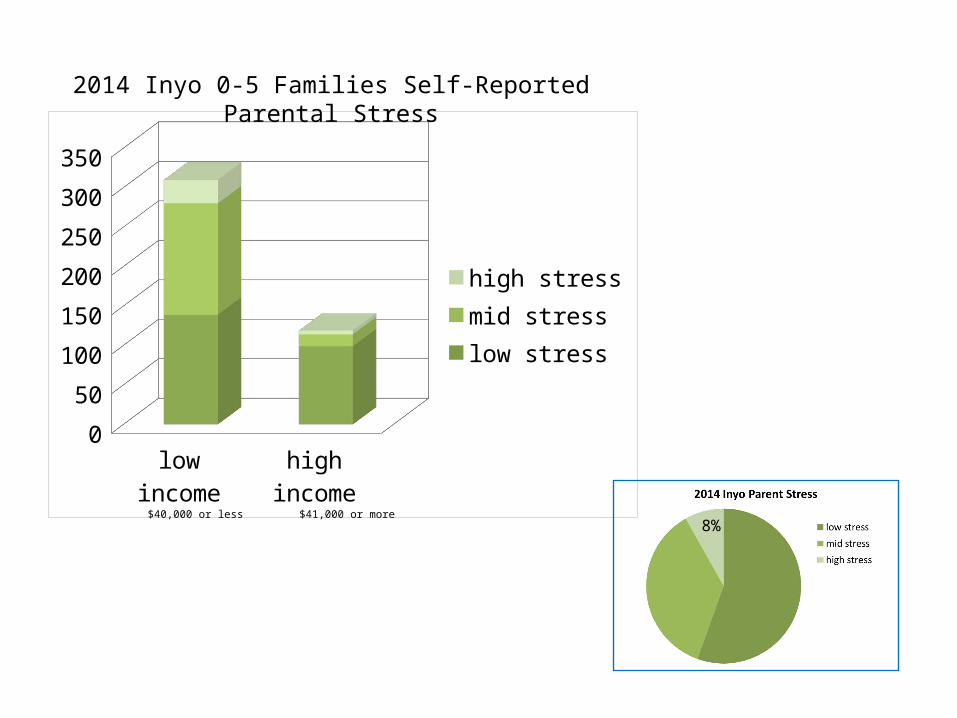
2014 Inyo Parent Stress
2014 Inyo 0-5 Family Self- Reported Incomes
$20,000 or less$21,000-40,000$41,000-60,000$61,000-80,000$80,000 plus24%
49%
7%
14%
6%
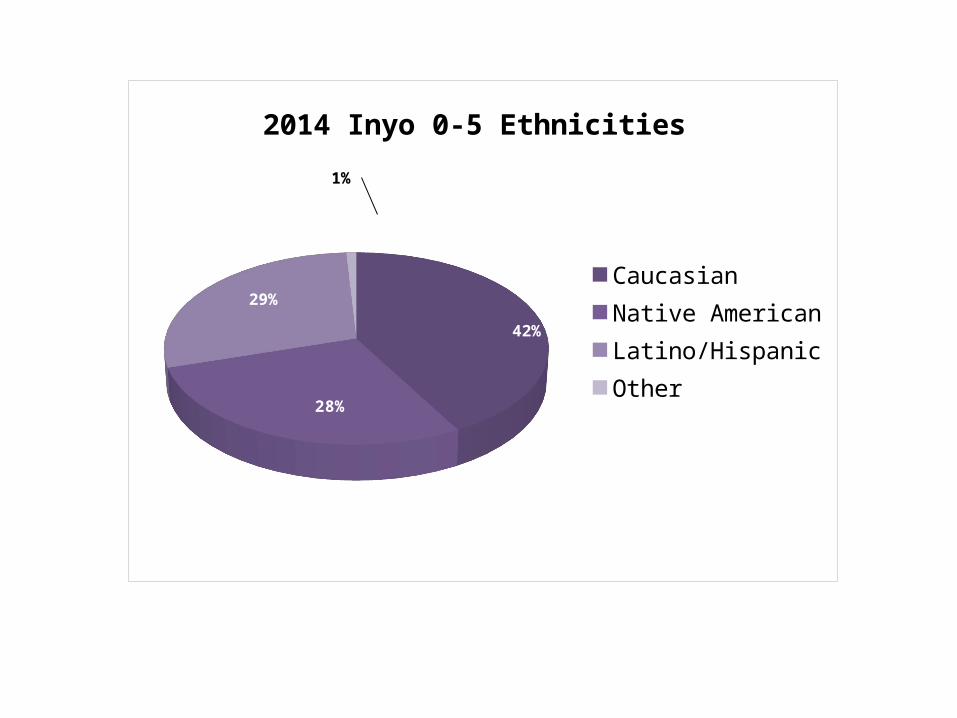
2014 Inyo 0-5 Ethnicities
CaucasianNative AmericanLatino/HispanicOther
28%
42%
29%
1%
low income high income0
50
100
150
200
250
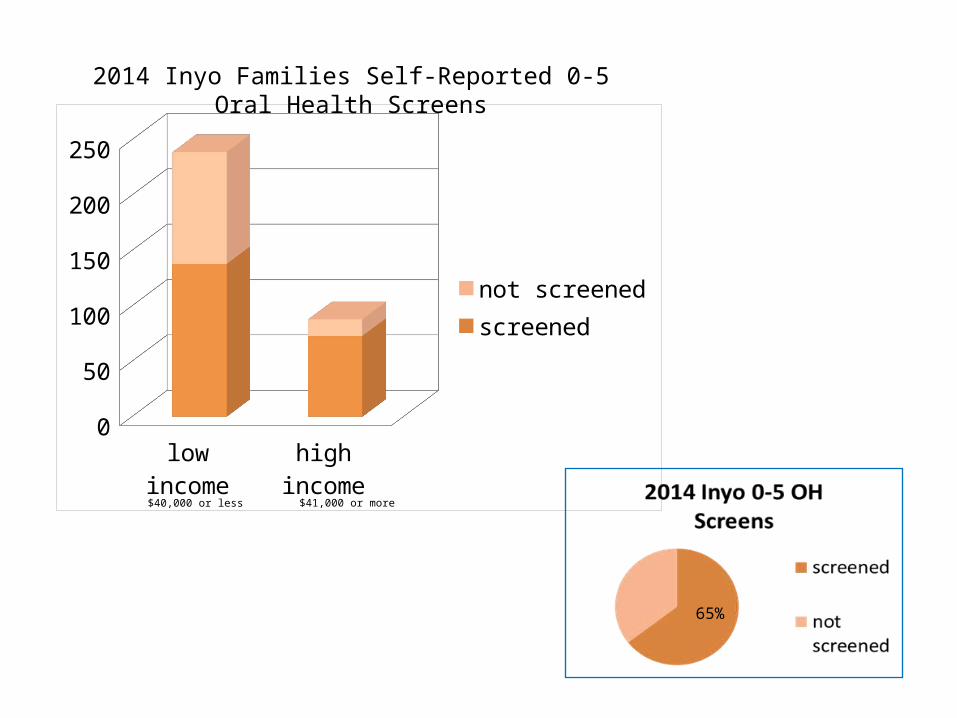
not screenedscreened
2014 Inyo Families Self-Reported 0-5 Oral Health Screens
65%
$41,000 or more$40,000 or less
Low Income High Income0
50
100
150
200
250
300
350
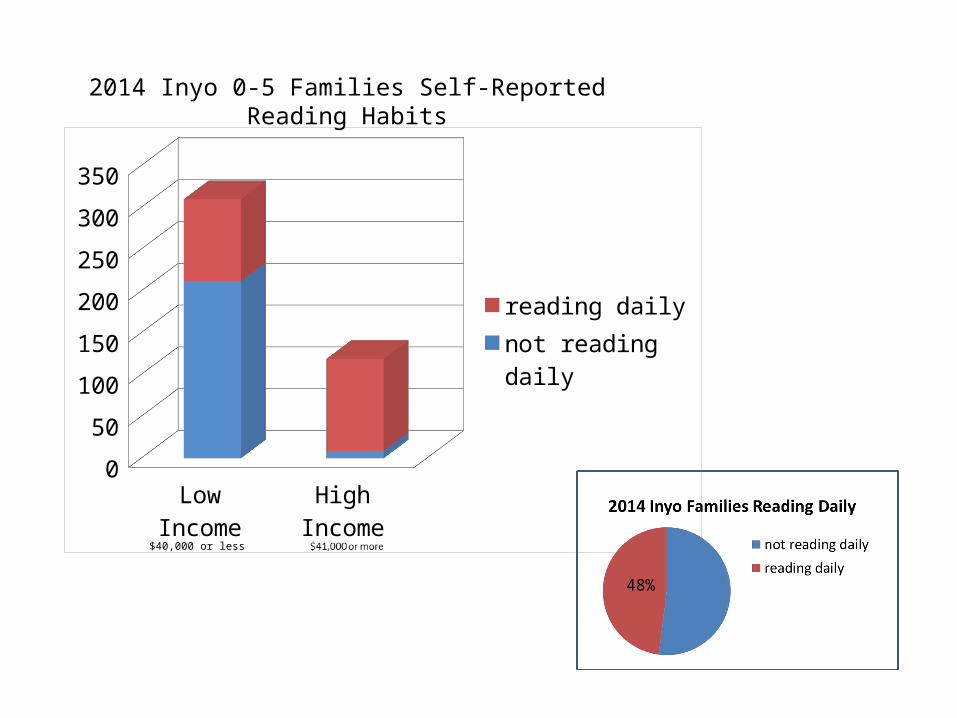
reading dailynot reading daily
2014 Inyo 0-5 Families Self-Reported Reading Habits
48%
$40,000 or less
Low Income High Income0
50
100
150
200
250
300
350
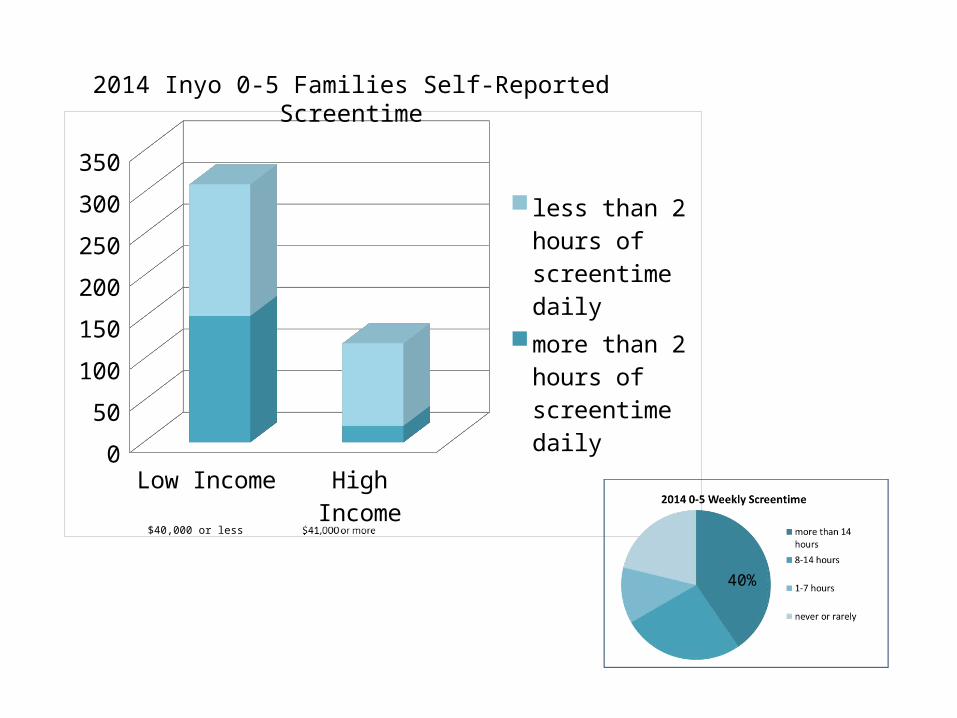
less than 2 hours of screentime dailymore than 2 hours of screentime daily
2014 Inyo 0-5 Families Self-Reported Screentime
40%
$40,000 or less
low income high income0
50
100
150
200
250
300
350
high stressmid stresslow stress
2014 Inyo 0-5 Families Self-Reported Parental Stress
8%$40,000 or less $41,000 or more
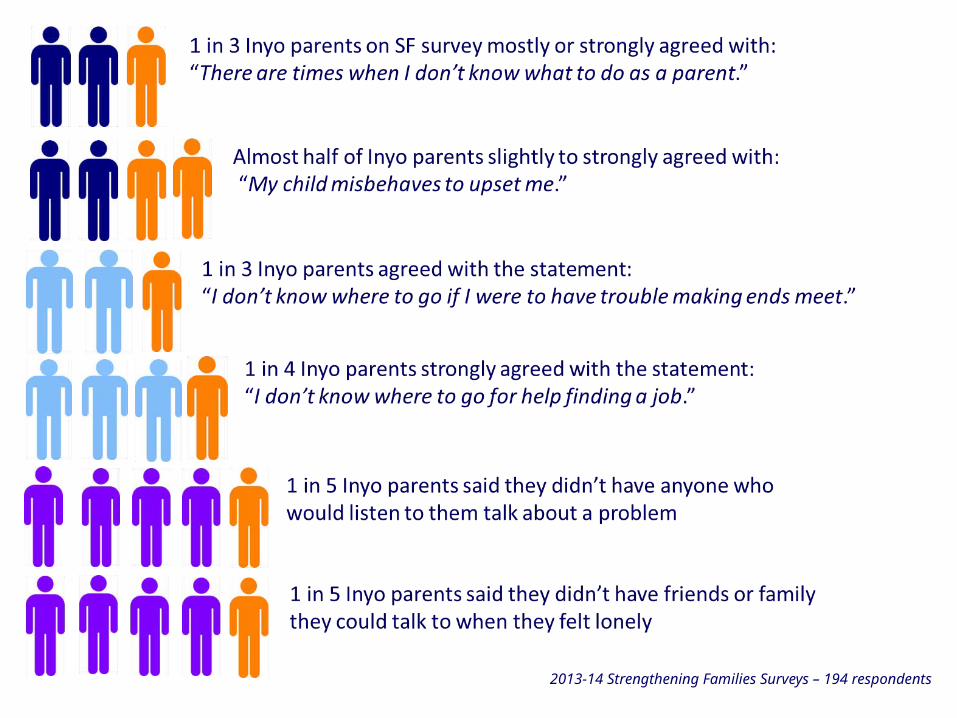
2013-14 Strengthening Families Surveys – 194 respondents
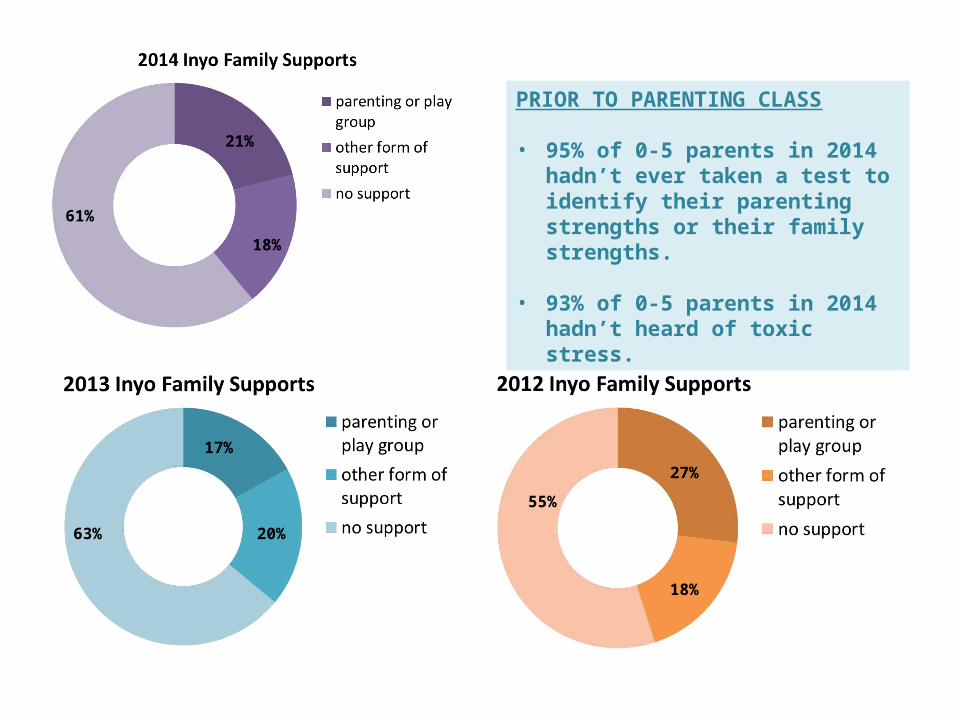
55%
18%
27%
17%
20%63%
18%
21%
61%
PRIOR TO PARENTING CLASS
• 95% of 0-5 parents in 2014 hadn’t ever taken a test to identify their parenting strengths or their family strengths.
• 93% of 0-5 parents in 2014 hadn’t heard of toxic stress.
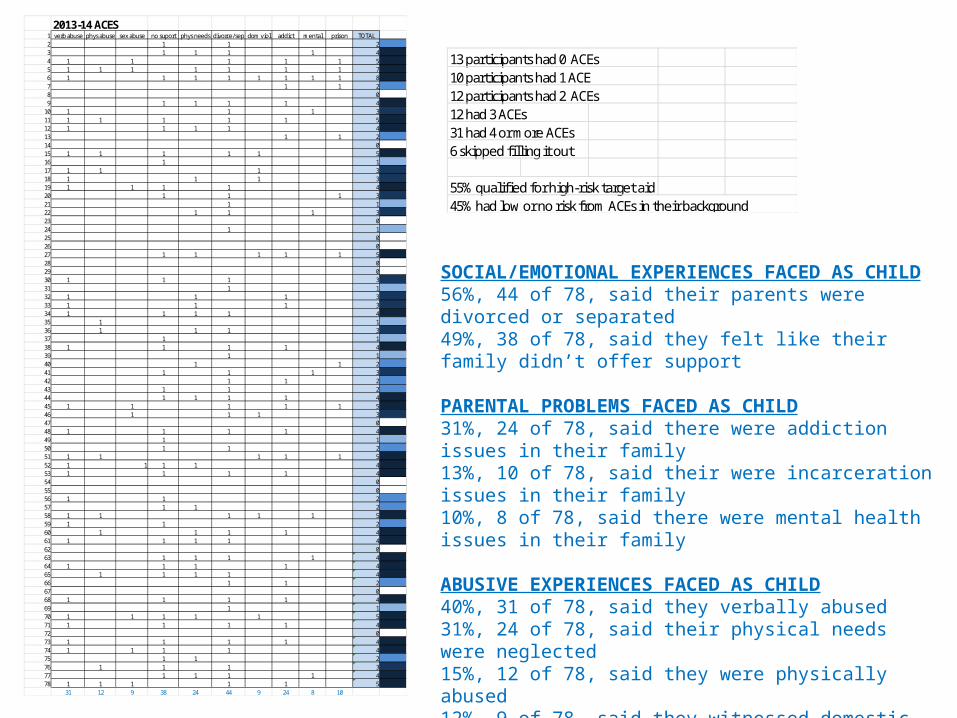
2013-14 ACES1 verb abuse phys abuse sex abuse no suport phys needs divorce/sep dom viol addict mental prison TOTAL2 1 1 23 1 1 1 1 44 1 1 1 1 1 55 1 1 1 1 1 1 1 76 1 1 1 1 1 1 1 1 87 1 1 28 09 1 1 1 1 4
10 1 1 1 311 1 1 1 1 1 512 1 1 1 1 413 1 1 214 015 1 1 1 1 1 516 1 117 1 1 1 318 1 1 1 319 1 1 1 1 420 1 1 1 321 1 122 1 1 1 323 024 1 125 026 027 1 1 1 1 1 528 029 030 1 1 1 331 1 132 1 1 1 333 1 1 1 334 1 1 1 1 435 1 136 1 1 1 337 1 138 1 1 1 1 439 1 140 1 1 241 1 1 1 342 1 1 243 1 1 244 1 1 1 1 445 1 1 1 1 1 546 1 1 1 347 048 1 1 1 1 449 1 150 1 1 251 1 1 1 1 1 552 1 1 1 1 453 1 1 1 1 454 055 056 1 1 257 1 1 258 1 1 1 1 1 559 1 1 260 1 1 1 1 461 1 1 1 1 462 063 1 1 1 1 464 1 1 1 1 465 1 1 1 1 466 1 1 267 068 1 1 1 1 469 1 170 1 1 1 1 1 571 1 1 1 1 472 073 1 1 1 1 474 1 1 1 1 475 1 1 276 1 1 1 377 1 1 1 1 478 1 1 1 1 1 5
31 12 9 38 24 44 9 24 8 10
13 participants had 0 ACEs10 participants had 1 ACE12 participants had 2 ACEs12 had 3 ACEs31 had 4 or more ACEs6 skipped filling it out
55% qualified for high-risk target aid45% had low or no risk from ACEs in their background
SOCIAL/EMOTIONAL EXPERIENCES FACED AS CHILD56%, 44 of 78, said their parents were divorced or separated49%, 38 of 78, said they felt like their family didn’t offer support
PARENTAL PROBLEMS FACED AS CHILD31%, 24 of 78, said there were addiction issues in their family13%, 10 of 78, said their were incarceration issues in their family10%, 8 of 78, said there were mental health issues in their family
ABUSIVE EXPERIENCES FACED AS CHILD40%, 31 of 78, said they verbally abused31%, 24 of 78, said their physical needs were neglected15%, 12 of 78, said they were physically abused12%, 9 of 78, said they witnessed domestic violence12%, 9 of 78, said they were sexually abused