Embed Size (px)
Citation preview

2014 IT Salary Survey: Application DevelopmentResearch Findings
© 2014 Property of UBM Tech; All Rights Reserved

The 1,117 IT staffers and 889 IT managers with primary job function of application development in our survey continue to demand compensation solidly above that of the typical IT pro. Pay increases remain at about the rate of inflation.
App dev staffers earn a median of $102,000 in total compensation, and managers earn $137,000. Other data points:
>> Application development staffers report a median total compensation rise of 1.5%, and managers an increase of 2.3%.
>> 65% of developer staff and 67% of managers are satisfied or very satisfied with their jobs overall, including compensation, benefits, and other factors.
>> Nine out of 10 developers feel secure or very secure in their jobs, with only 11% of staffers and 10% of managers saying they feel insecure.
>> Only about two in five staffers and one in four managers in the development field have had more than two jobs during the last 10 years.
>> Men earn far more than women, particularly on the staff level. Male staffers earn $104,000 in median total compensation, while female staffers make $89,000; it’s $137,000 for male managers versus $133,000 for female managers.
Respondent breakdown: 43% work for organizations with 5,000 or more employees; 26% have over 20,000.
Want more? Visit InformationWeek Reports
Executive Summary
v

Median salary: App dev staff vs. managers
© 2014 Property of UBM Tech; All Rights Reserved

Median compensation trends
© 2014 Property of UBM Tech; All Rights Reserved

Base salary changes: Staff vs. management
© 2014 Property of UBM Tech; All Rights Reserved

Compensation changes
© 2014 Property of UBM Tech; All Rights Reserved

Salary trends: QA vs. developers vs. engineers
© 2014 Property of UBM Tech; All Rights Reserved

Compensation trends: QA vs. developers vs. engineers
© 2014 Property of UBM Tech; All Rights Reserved

Salary changes: QA vs. developers vs. engineers
© 2014 Property of UBM Tech; All Rights Reserved

Compensation changes: QA vs. developers vs. engineers
© 2014 Property of UBM Tech; All Rights Reserved

Compensation: Male vs. female
© 2014 Property of UBM Tech; All Rights Reserved

Compensation: Male vs. female, staff vs. manager
© 2014 Property of UBM Tech; All Rights Reserved

Salary based on company revenue
© 2014 Property of UBM Tech; All Rights Reserved

Salary changes over time
© 2014 Property of UBM Tech; All Rights Reserved

Bonuses are the norm
© 2014 Property of UBM Tech; All Rights Reserved

Performance drives bonuses
© 2014 Property of UBM Tech; All Rights Reserved

Non-IT experience: Staff vs. management
© 2014 Property of UBM Tech; All Rights Reserved

About 1/5 have worked in ops
© 2014 Property of UBM Tech; All Rights Reserved

Most focus on IT functions
© 2014 Property of UBM Tech; All Rights Reserved

Staff non-IT duties
© 2014 Property of UBM Tech; All Rights Reserved

Management non-IT duties
© 2014 Property of UBM Tech; All Rights Reserved

Key skills: Staff vs. management
© 2014 Property of UBM Tech; All Rights Reserved

Highest staff salaries: Pacific
© 2014 Property of UBM Tech; All Rights Reserved

Regional salary changes: Staff
© 2014 Property of UBM Tech; All Rights Reserved

Highest management salaries: Pacific
© 2014 Property of UBM Tech; All Rights Reserved

Regional salary changes: Management
© 2014 Property of UBM Tech; All Rights Reserved

Top perks: Health insurance, 401(k) match
© 2014 Property of UBM Tech; All Rights Reserved

Wanted: tech-specific training
© 2014 Property of UBM Tech; All Rights Reserved

Continuing education
© 2014 Property of UBM Tech; All Rights Reserved

Management pay more for training
© 2014 Property of UBM Tech; All Rights Reserved

Staff: Base pay is most important
© 2014 Property of UBM Tech; All Rights Reserved

Managers: Base pay is most important
© 2014 Property of UBM Tech; All Rights Reserved

© 2014 Property of UBM Tech; All Rights Reserved

19- 20 years in IT
© 2014 Property of UBM Tech; All Rights Reserved

7-8 years at present company
© 2014 Property of UBM Tech; All Rights Reserved

Loyalty: Few hop jobs
© 2014 Property of UBM Tech; All Rights Reserved

Compensation satisfaction: Staff vs. management
© 2014 Property of UBM Tech; All Rights Reserved

Compensation satisfaction over time: Staff
© 2014 Property of UBM Tech; All Rights Reserved

Compensation satisfaction over time: Management
© 2014 Property of UBM Tech; All Rights Reserved

Job satisfaction: Staff vs. management
© 2014 Property of UBM Tech; All Rights Reserved

Job satisfaction over time: Staff
© 2014 Property of UBM Tech; All Rights Reserved

Job satisfaction over time: Management
© 2014 Property of UBM Tech; All Rights Reserved

Most are challenged
© 2014 Property of UBM Tech; All Rights Reserved
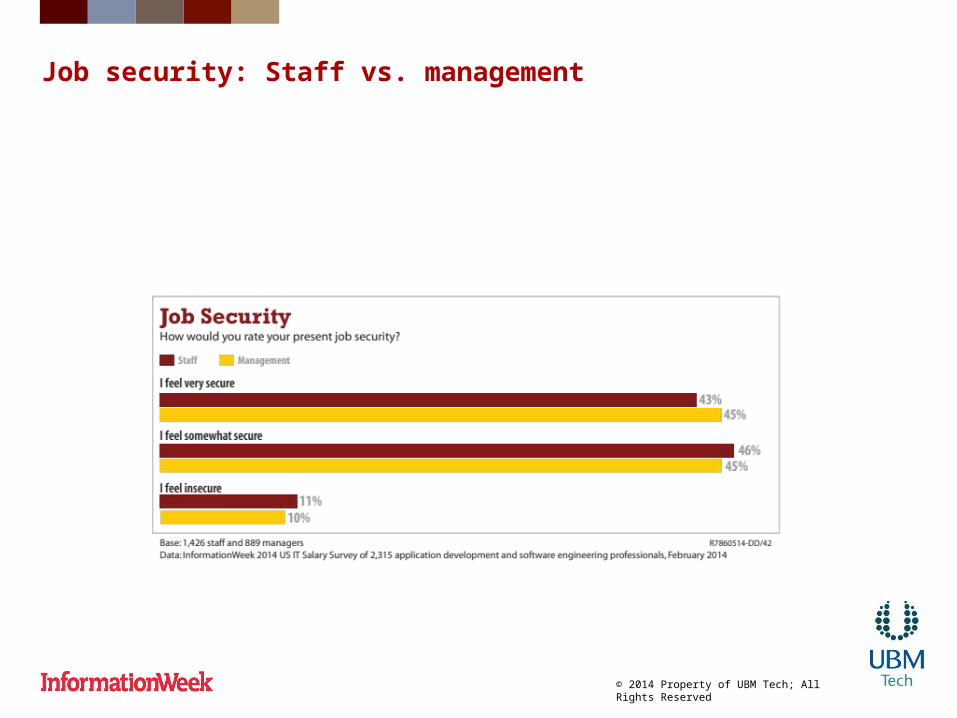
Job security: Staff vs. management
© 2014 Property of UBM Tech; All Rights Reserved

Job security over time: Staff
© 2014 Property of UBM Tech; All Rights Reserved

Job security over time: Management
© 2014 Property of UBM Tech; All Rights Reserved

IT as a career: Staff vs. management
© 2014 Property of UBM Tech; All Rights Reserved

IT career path trend: Staff
© 2014 Property of UBM Tech; All Rights Reserved

IT career path trend: Management
© 2014 Property of UBM Tech; All Rights Reserved

Job security: Staff vs. management
© 2014 Property of UBM Tech; All Rights Reserved

Biggest event in last year: Raises
© 2014 Property of UBM Tech; All Rights Reserved

Most employers outsource some IT jobs
© 2014 Property of UBM Tech; All Rights Reserved

Outsourcing hits job availability, morale
© 2014 Property of UBM Tech; All Rights Reserved

Outsourcing affects few personally
© 2014 Property of UBM Tech; All Rights Reserved

Most aren’t looking for a new job
© 2014 Property of UBM Tech; All Rights Reserved

Those looking want more money
© 2014 Property of UBM Tech; All Rights Reserved

Job satisfaction matters
© 2014 Property of UBM Tech; All Rights Reserved

Types of testing
© 2014 Property of UBM Tech; All Rights Reserved

Types of toolsets used
© 2014 Property of UBM Tech; All Rights Reserved

Life cycle management tools
© 2014 Property of UBM Tech; All Rights Reserved
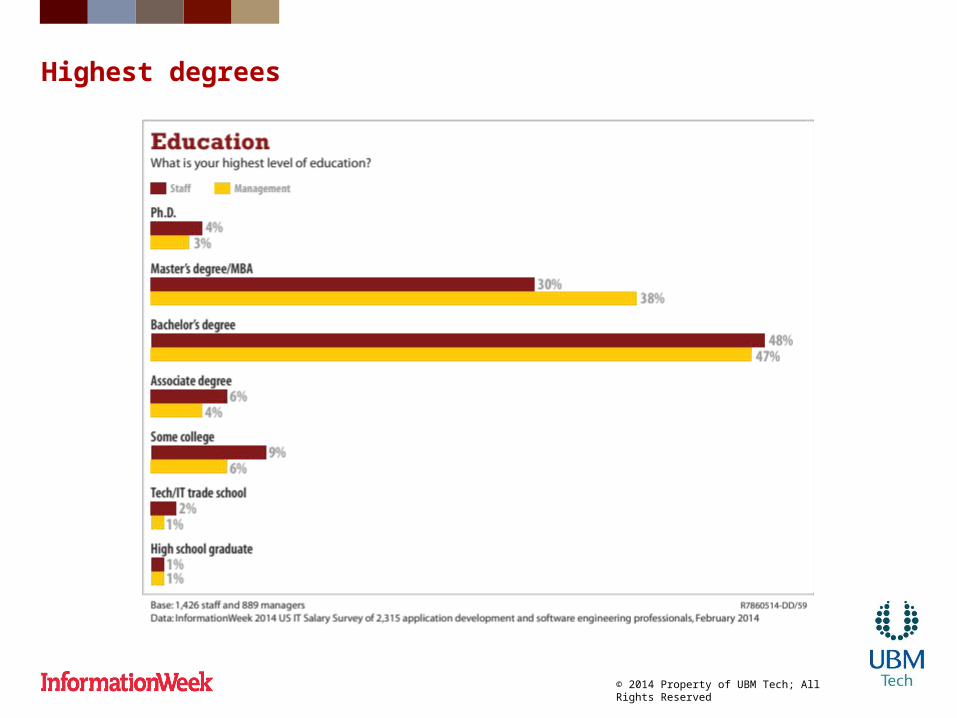
Highest degrees
© 2014 Property of UBM Tech; All Rights Reserved

Mostly males
© 2014 Property of UBM Tech; All Rights Reserved

Management trends older
© 2014 Property of UBM Tech; All Rights Reserved

Most have revenue over $100 million
© 2014 Property of UBM Tech; All Rights Reserved

A quarter have more than 20,000 employees
© 2014 Property of UBM Tech; All Rights Reserved

Variety of industries represented
© 2014 Property of UBM Tech; All Rights Reserved

Research SynopsisSurvey Name InformationWeek 2014 US IT Salary Survey: Application Development
Survey Date February 2014
Region United States
Number of Respondents 2,315 application development and software engineering professionals, composed of 1,426 staffers and 889 managers with a job function of application development or a job title of QA/software test engineer/analyst, software engineer, or software developer
Purpose To track IT salary and compensation trends from the perspective of those on the front lines, InformationWeek conducts an annual US IT Salary Survey. Now in its 17th year, it’s the largest employee-based IT salary survey in the country. This year, 11,662 full-time IT professionals completed the Web-based survey. The goal of this trendable study is to measure various aspects of compensation, benefits, and job satisfaction. This report focuses on the 2,315 application development and software engineering professionals who participated in the survey.
Methodology The survey was designed by InformationWeek and fielded online. The survey was promoted in InformationWeek’s daily and weekly newsletters. In addition, email invitations with an embedded link to the survey were sent to qualified IT professionals from UBM Tech databases. The survey was fielded from November 2013 to February 2014.
The information within this report is based on responses from 2,315 application development and software engineering professionals. Unemployed and part-time workers were excluded from these results, as were respondents from outside the United States. This report uses median rather than mean or average figures for salary and percentage salary changes to eliminate distortions caused by extremes at the high and low ends of the responses.
Want more? Visit InformationWeek Reports
© 2014 Property of UBM Tech; All Rights Reserved