Embed Size (px)
Citation preview
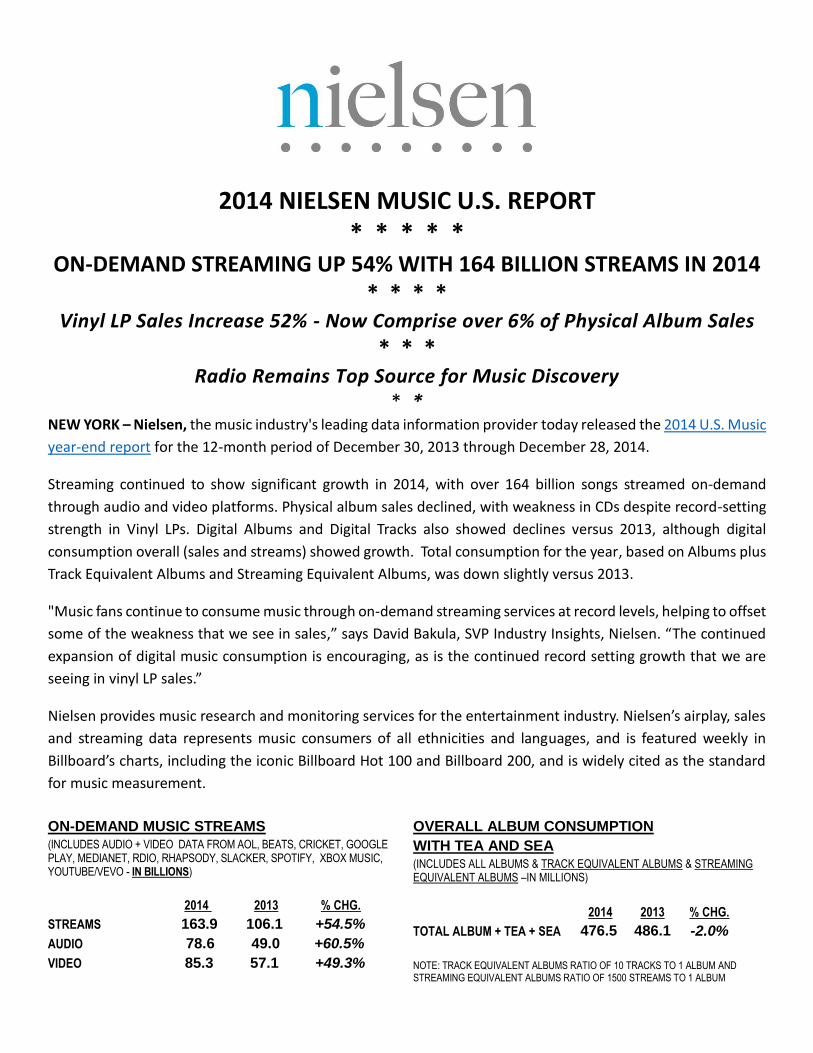
2014 NIELSEN MUSIC U.S. REPORT * * * * *
ON-DEMAND STREAMING UP 54% WITH 164 BILLION STREAMS IN 2014 * * * *
Vinyl LP Sales Increase 52% - Now Comprise over 6% of Physical Album Sales
* * * Radio Remains Top Source for Music Discovery
* * NEW YORK – Nielsen, the music industry's leading data information provider today released the 2014 U.S. Music
year-end report for the 12-month period of December 30, 2013 through December 28, 2014.
Streaming continued to show significant growth in 2014, with over 164 billion songs streamed on-demand
through audio and video platforms. Physical album sales declined, with weakness in CDs despite record-setting
strength in Vinyl LPs. Digital Albums and Digital Tracks also showed declines versus 2013, although digital
consumption overall (sales and streams) showed growth. Total consumption for the year, based on Albums plus
Track Equivalent Albums and Streaming Equivalent Albums, was down slightly versus 2013.
"Music fans continue to consume music through on-demand streaming services at record levels, helping to offset
some of the weakness that we see in sales,” says David Bakula, SVP Industry Insights, Nielsen. “The continued
expansion of digital music consumption is encouraging, as is the continued record setting growth that we are
seeing in vinyl LP sales.”
Nielsen provides music research and monitoring services for the entertainment industry. Nielsen’s airplay, sales
and streaming data represents music consumers of all ethnicities and languages, and is featured weekly in
Billboard’s charts, including the iconic Billboard Hot 100 and Billboard 200, and is widely cited as the standard
for music measurement.
ON-DEMAND MUSIC STREAMS
(INCLUDES AUDIO + VIDEO DATA FROM AOL, BEATS, CRICKET, GOOGLE PLAY, MEDIANET, RDIO, RHAPSODY, SLACKER, SPOTIFY, XBOX MUSIC, YOUTUBE/VEVO - IN BILLIONS)
2014 2013 % CHG.
STREAMS 163.9 106.1 +54.5%
AUDIO 78.6 49.0 +60.5%
VIDEO 85.3 57.1 +49.3%
OVERALL ALBUM CONSUMPTION
WITH TEA AND SEA
(INCLUDES ALL ALBUMS & TRACK EQUIVALENT ALBUMS & STREAMING EQUIVALENT ALBUMS –IN MILLIONS)
2014 2013 % CHG.
TOTAL ALBUM + TEA + SEA 476.5 486.1 -2.0%
NOTE: TRACK EQUIVALENT ALBUMS RATIO OF 10 TRACKS TO 1 ALBUM AND STREAMING EQUIVALENT ALBUMS RATIO OF 1500 STREAMS TO 1 ALBUM

TOTAL ALBUM SALES
(INCLUDES CD, CASSETTE, VINYL , & DIGITAL ALBUMS – IN MILLIONS)
2014 2013 % CHG.
TOTAL UNITS 257.0 289.4 -11.2%
CD 140.8 165.4 -14.9%
DIGITAL 106.5 117.6 -9.4% LP/VINYL 9.2 6.1 +51.8%
DIGITAL TRACK SALES
(IN MILLIONS)
2014 2013 % CHG.
TOTAL UNITS 1,102.5 1,259.3 -12.5%
PHYSICAL ALBUM SALES BY STORE TYPE
(INCLUDES CDS, CASSETTES, VINYL LPS – IN MILLIONS)
2014 2013 % CHG.
CHAIN 31.0 39.1 -20.6%
INDEPENDENT 18.2 18.3 -0.5%
MASS MERCHANT 62.9 77.9 -19.3% NON-TRADITIONAL 38.5 36.5 +5.2%
(NON-TRADITIONAL INCLUDES INTERNET, VENUE, DIRECT-TO-CONSUMER AND OTHER NON-TRADITIONAL RETAIL OUTLETS)
TOTAL DIGITAL MUSIC CONSUMPTION
(DIGITAL ALBUMS + TRACK EQUIVALENT ALBUMS + STREAMING
EQUIVALENT ALBUMS – IN MILLIONS)
2014 2013 % CHG.
TOTAL UNITS 326.0 314.2 +3.7%
CURRENT AND CATALOG SALES (CATALOG IS DEFINED AS OVER 18 MONTHS SINCE RELEASE
IN MILLIONS)
OVERALL ALBUMS
2014 2013 % CHG.
CURRENT 130.5 151.7 -14.0%
CATALOG 126.5 137.7 -8.1%
PHYSICAL ALBUMS
2014 2013 % CHG.
CURRENT 77.6 89.5 -13.3%
CATALOG 73.0 82.4 -11.4%
DIGITAL ALBUMS
2014 2013 % CHG.
CURRENT 52.9 62.3 -15.1%
CATALOG 53.6 55.3 -3.1%
DIGITAL TRACKS
2014 2013 % CHG.
CURRENT 532.9 593.8 -10.3%
CATALOG 569.6 665.6 -14.4%
GENRE BREAKDOWN – TOTAL CONSUMPTION (SELECTED TOP GENRES – ALBUMS + TRACK EQUIVALENT ALBUMS + STREAMING EQUIVALENT ALBUMS)
Genre % of Format Total
% of Total
Consumption Albums Tracks Streams
CHILDREN 1.0% 1.5% 0.3% 0.4%
CHRISTIAN/GOSPEL 3.1% 3.6% 2.8% 1.6% CLASSICAL 1.4% 2.1% 0.5% 0.3% COUNTRY 11.2% 11.8% 12.0% 6.4%
DANCE/ELECTRONIC (EDM)
3.4% 2.0% 4.6% 6.8%
HOLIDAY/SEASONAL 2.6% 3.6% 0.9% 1.1%
JAZZ 1.4% 2.0% 0.6% 0.3% LATIN 2.6% 2.4% 1.8% 5.0% POP 14.9% 10.8% 21.1% 21.1%
R&B/HIP-HOP 17.2% 13.9% 19.1% 28.5% ROCK 29.0% 33.2% 21.3% 24.7%
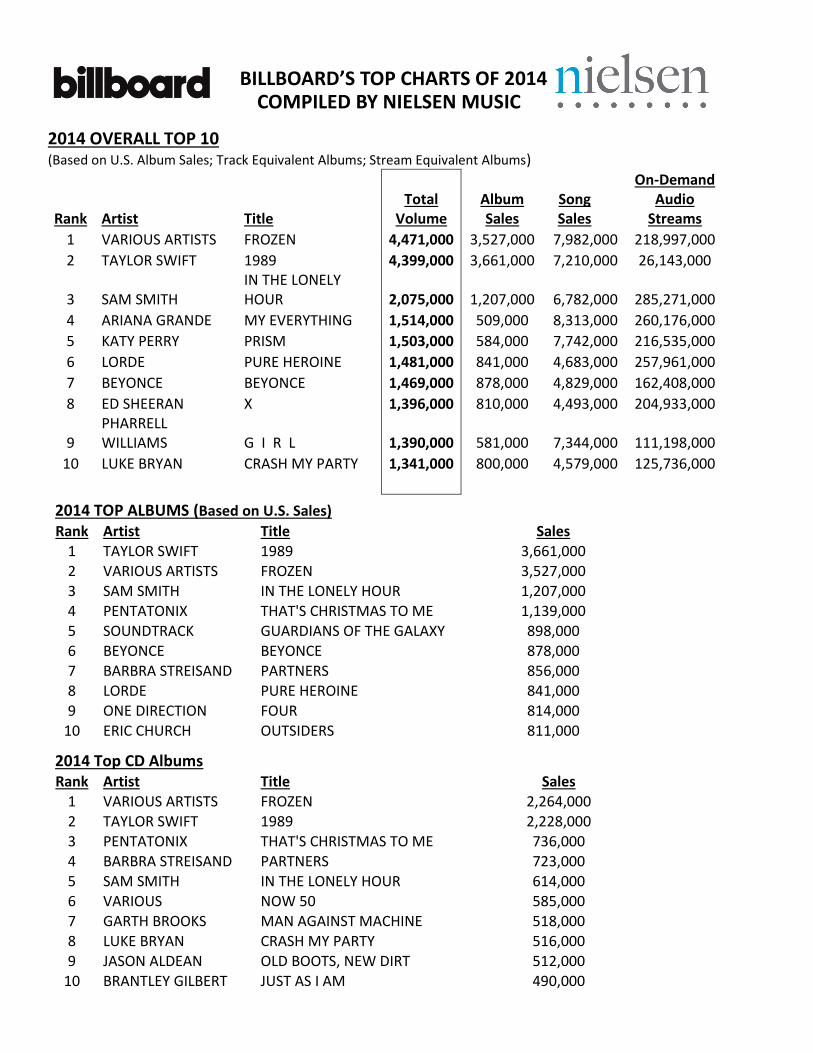
BILLBOARD’S TOP CHARTS OF 2014 COMPILED BY NIELSEN MUSIC
2014 OVERALL TOP 10 (Based on U.S. Album Sales; Track Equivalent Albums; Stream Equivalent Albums)
Rank Artist Title Total
Volume Album Sales
Song Sales
On-Demand Audio
Streams
1 VARIOUS ARTISTS FROZEN 4,471,000 3,527,000 7,982,000 218,997,000
2 TAYLOR SWIFT 1989 4,399,000 3,661,000 7,210,000 26,143,000
3 SAM SMITH IN THE LONELY HOUR 2,075,000 1,207,000 6,782,000 285,271,000
4 ARIANA GRANDE MY EVERYTHING 1,514,000 509,000 8,313,000 260,176,000
5 KATY PERRY PRISM 1,503,000 584,000 7,742,000 216,535,000
6 LORDE PURE HEROINE 1,481,000 841,000 4,683,000 257,961,000
7 BEYONCE BEYONCE 1,469,000 878,000 4,829,000 162,408,000
8 ED SHEERAN X 1,396,000 810,000 4,493,000 204,933,000
9 PHARRELL WILLIAMS G I R L 1,390,000 581,000 7,344,000 111,198,000
10 LUKE BRYAN CRASH MY PARTY 1,341,000 800,000 4,579,000 125,736,000
2014 TOP ALBUMS (Based on U.S. Sales) Rank Artist Title Sales
1 TAYLOR SWIFT 1989 3,661,000 2 VARIOUS ARTISTS FROZEN 3,527,000 3 SAM SMITH IN THE LONELY HOUR 1,207,000 4 PENTATONIX THAT'S CHRISTMAS TO ME 1,139,000 5 SOUNDTRACK GUARDIANS OF THE GALAXY 898,000 6 BEYONCE BEYONCE 878,000 7 BARBRA STREISAND PARTNERS 856,000 8 LORDE PURE HEROINE 841,000 9 ONE DIRECTION FOUR 814,000
10 ERIC CHURCH OUTSIDERS 811,000
2014 Top CD Albums Rank Artist Title Sales
1 VARIOUS ARTISTS FROZEN 2,264,000 2 TAYLOR SWIFT 1989 2,228,000 3 PENTATONIX THAT'S CHRISTMAS TO ME 736,000 4 BARBRA STREISAND PARTNERS 723,000 5 SAM SMITH IN THE LONELY HOUR 614,000 6 VARIOUS NOW 50 585,000 7 GARTH BROOKS MAN AGAINST MACHINE 518,000
8 LUKE BRYAN CRASH MY PARTY 516,000 9 JASON ALDEAN OLD BOOTS, NEW DIRT 512,000
10 BRANTLEY GILBERT JUST AS I AM 490,000

2014 Top Digital Albums Rank Artist Title Sales
1 TAYLOR SWIFT 1989 1,409,000 2 VARIOUS ARTISTS FROZEN 1,261,000 3 SAM SMITH IN THE LONELY HOUR 573,000 4 SOUNDTRACK GUARDIANS OF THE GALAXY 556,000 5 ED SHEERAN X 455,000 6 LORDE PURE HEROINE 437,000 7 COLDPLAY GHOST STORIES 425,000 8 BEYONCE BEYONCE 422,000
9 PENTATONIX THAT'S CHRISTMAS TO ME 403,000 10 J. COLE 2014 FOREST HILLS DRIVE 366,000
2014 Top LP Vinyl Albums
Rank Artist Title Sales 1 JACK WHITE LAZARETTO 86,700 2 ARCTIC MONKEYS AM 58,700 3 LANA DEL REY BORN TO DIE 42,100 4 BEATLES ABBEY ROAD 38,200
5 BOB MARLEY & THE WAILERS LEGEND 37,800
6 BLACK KEYS TURN BLUE 34,200 7 BEATLES SGT. PEPPER'S LONELY HEARTS CL 33,600 8 LANA DEL REY ULTRAVIOLENCE 31,800 9 MILES DAVIS KIND OF BLUE 31,700
10 AMY WINEHOUSE BACK TO BLACK 27,800
2014 Digital Songs
Rank Artist Title Sales 1 PHARRELL WILLIAMS HAPPY 6,455,000 2 JOHN LEGEND ALL OF ME 4,674,000 3 KATY PERRY FEAT. JUICY J DARK HORSE 4,430,000 4 MEGHAN TRAINOR ALL ABOUT THAT BASS 4,357,000
5 IGGY AZALEA FEAT. CHARLI XCX FANCY 3,974,000
6 JASON DERULO FEAT. 2 CHAINZ TALK DIRTY 3,959,000
7 DJ SNAKE & LIL JON TURN DOWN FOR WHAT 3,449,000 8 TAYLOR SWIFT SHAKE IT OFF 3,431,000
9 IDINA MENZEL LET IT GO 3,370,000 10 SAM SMITH STAY WITH ME 3,340,000
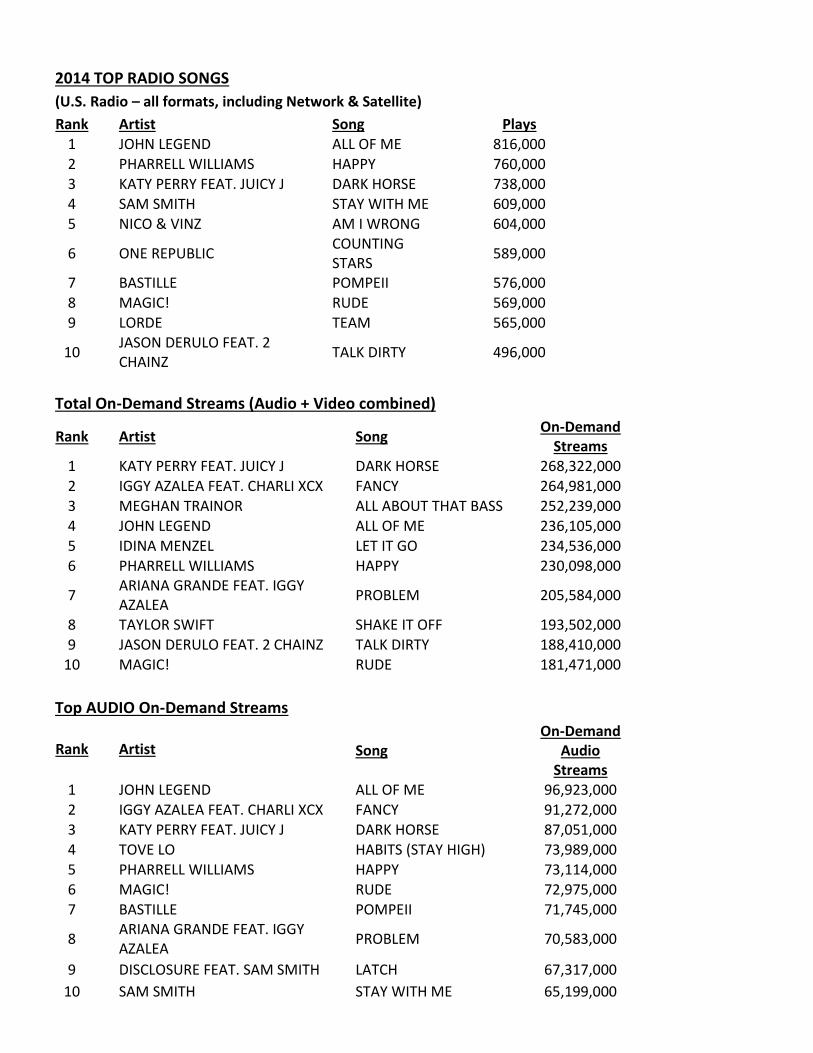
2014 TOP RADIO SONGS
(U.S. Radio – all formats, including Network & Satellite)
Rank Artist Song Plays 1 JOHN LEGEND ALL OF ME 816,000 2 PHARRELL WILLIAMS HAPPY 760,000 3 KATY PERRY FEAT. JUICY J DARK HORSE 738,000 4 SAM SMITH STAY WITH ME 609,000 5 NICO & VINZ AM I WRONG 604,000
6
ONE REPUBLIC COUNTING STARS
589,000
7 BASTILLE POMPEII 576,000 8 MAGIC! RUDE 569,000
9 LORDE TEAM 565,000
10
JASON DERULO FEAT. 2 CHAINZ
TALK DIRTY 496,000
Total On-Demand Streams (Audio + Video combined)
Rank
Artist Song On-Demand
Streams 1 KATY PERRY FEAT. JUICY J DARK HORSE 268,322,000 2 IGGY AZALEA FEAT. CHARLI XCX FANCY 264,981,000 3 MEGHAN TRAINOR ALL ABOUT THAT BASS 252,239,000
4 JOHN LEGEND ALL OF ME 236,105,000 5 IDINA MENZEL LET IT GO 234,536,000 6 PHARRELL WILLIAMS HAPPY 230,098,000
7
ARIANA GRANDE FEAT. IGGY AZALEA
PROBLEM 205,584,000
8 TAYLOR SWIFT SHAKE IT OFF 193,502,000 9 JASON DERULO FEAT. 2 CHAINZ TALK DIRTY 188,410,000
10 MAGIC! RUDE 181,471,000
Top AUDIO On-Demand Streams
Rank
Artist Song On-Demand
Audio Streams
1 JOHN LEGEND ALL OF ME 96,923,000 2 IGGY AZALEA FEAT. CHARLI XCX FANCY 91,272,000 3 KATY PERRY FEAT. JUICY J DARK HORSE 87,051,000 4 TOVE LO HABITS (STAY HIGH) 73,989,000 5 PHARRELL WILLIAMS HAPPY 73,114,000 6 MAGIC! RUDE 72,975,000 7 BASTILLE POMPEII 71,745,000
8
ARIANA GRANDE FEAT. IGGY AZALEA
PROBLEM 70,583,000
9 DISCLOSURE FEAT. SAM SMITH LATCH 67,317,000
10 SAM SMITH STAY WITH ME 65,199,000

Top VIDEO On-Demand Streams
Rank
Artist Song On-Demand
Video Streams 1 MEGHAN TRAINOR ALL ABOUT THAT BASS 188,749,000 2 IDINA MENZEL LET IT GO 183,918,000 3 KATY PERRY FEAT. JUICY J DARK HORSE 181,270,000 4 IGGY AZALEA FEAT. CHARLI XCX FANCY 173,709,000 5 TAYLOR SWIFT SHAKE IT OFF 167,360,000 6 PSY GANGNAM STYLE 166,043,000 7 PHARRELL WILLIAMS HAPPY 156,984,000 8 NICKI MINAJ ANACONDA 143,183,000 9 JOHN LEGEND ALL OF ME 139,182,000
10
ARIANA GRANDE FEAT. IGGY AZALEA
PROBLEM 135,001,000
NIELSEN MUSIC 2014 YEAR-END HIGHLIGHTS AND ANALYSIS
On-Demand Streaming grew 54.5% over 2013, with Audio On-Demand (+60.5%) and Video On-Demand
Streaming (+49.3%) both experiencing significant increases.
The soundtrack to the movie Frozen ranked #1 for overall consumption this year (Album Sales + Track
Equivalent Albums + Streaming Equivalent Albums) with over 4.47 million album equivalent units.
Taylor Swift/1989 ranked second with 4.40 million units.
Taylor Swift had the best-selling album of the year with 3.66 million sales for her album 1989. The
album also had the best debut week of the year and the biggest opening week for an album since 2002
with nearly 1.3 million albums sold in the first week. 1989 also had the second biggest digital album
sales week in history. In its debut week, 1989 comprised a full 22% of all album sales for the week.
2014 had two albums that sold over 3.5 million units during the calendar year (Taylor Swift’s 1989 and
the Frozen Soundtrack) – this is the first time since 2005 that two albums have sold over 3.5 million
albums in a calendar year.
o While the top two albums this year performed significantly better than last year’s top two
albums, 2014 saw just four albums surpass 1 million units, compared to 13 last year. The top 10
albums in 2014 were virtually flat versus 2013, thanks to the strength of Taylor Swift and
Frozen.
Vinyl LPs had another record-breaking year, with 9.2 million sales, surpassing last year’s record of 6.1
million units. This is the ninth consecutive year of growth for Vinyl sales. Vinyl now comprises over 6%
of physical album sales.
o 27 Vinyl LPs sold over 20,000 units in 2014, up from the 11 Vinyl LPs to reach that level in 2013.
o 94 Vinyl LPs sold over 10,000 units in 2014, up from the 46 Vinyl LPs to reach that level in 2013.
o Rock is still the dominant genre for Vinyl LPs, with 71% of Vinyl LPs being classified as Rock.

The Independent store strata outperformed other brick & mortar retailers, with album sales virtually
flat against last year. The strength was led by Vinyl LPs, which were up 35% at Independent stores.
o The Independent store strata had a record setting year with Vinyl LP sales, with 5.2M Vinyl LPs
sold, making up 57 percent of all Vinyl sales.
Genres performed differently across the different types of consumption, showing how different music
fans prefer to access their favorite music.
o Rock is the dominant genre for album sales (over 33% of albums) and of total consumption
(29%). However, on a track sales basis, Pop (21.1%) is nearly as big as Rock (21.3%). R&B/Hip-
Hop is the dominant genre for Streaming (28.5%) followed by Rock (24.7%) and Pop (21.1%).
o Country consumers still prefer Albums (11.8%) and Track Downloads (12.0%) over Streams
(6.4%)
o Pop music consumers are buying individual hit songs much more than albums. While 21% of
digital track sales are in the Pop genre, only 10.8% of album sales are Pop.
o Some genres, particularly R&B/Hip-Hop, EDM and Latin perform particularly well in Streaming.
While R&B/Hip-Hop only comprises 13.9% of Album sales, it makes up 28.5% of
Streaming.
Electronic/Dance (EDM) only makes up 2% of album sales, but makes up nearly 7% of
Streaming, making the genre a bigger share of Streaming than Country.
Latin music also performs particularly well at Streaming, with 5% of Streaming coming
from Latin music, while just 2.4% of album sales are Latin.
NIELSEN MUSIC: OVERVIEW OF MUSIC CONSUMPTION IN 2014
Music consumption has changed, but America's appetite for music remains as strong as ever.
Changes in how fans are consuming music defined the 2014 music landscape.
Streaming music is surging.
Smartphone/mobile usage for music listening grew (as did smartphone and tablet ownership).
Radio continued to be the number-one source of music discovery.
Americans still love music, and are listening all the time
93% of the U.S. population listens to music, spending more than 25 hours each week listening to their
favorite songs.
When surveyed about their activities in the past year, 75% of respondents said they actively chose to
listen to music, even ahead of watching television at 73%.
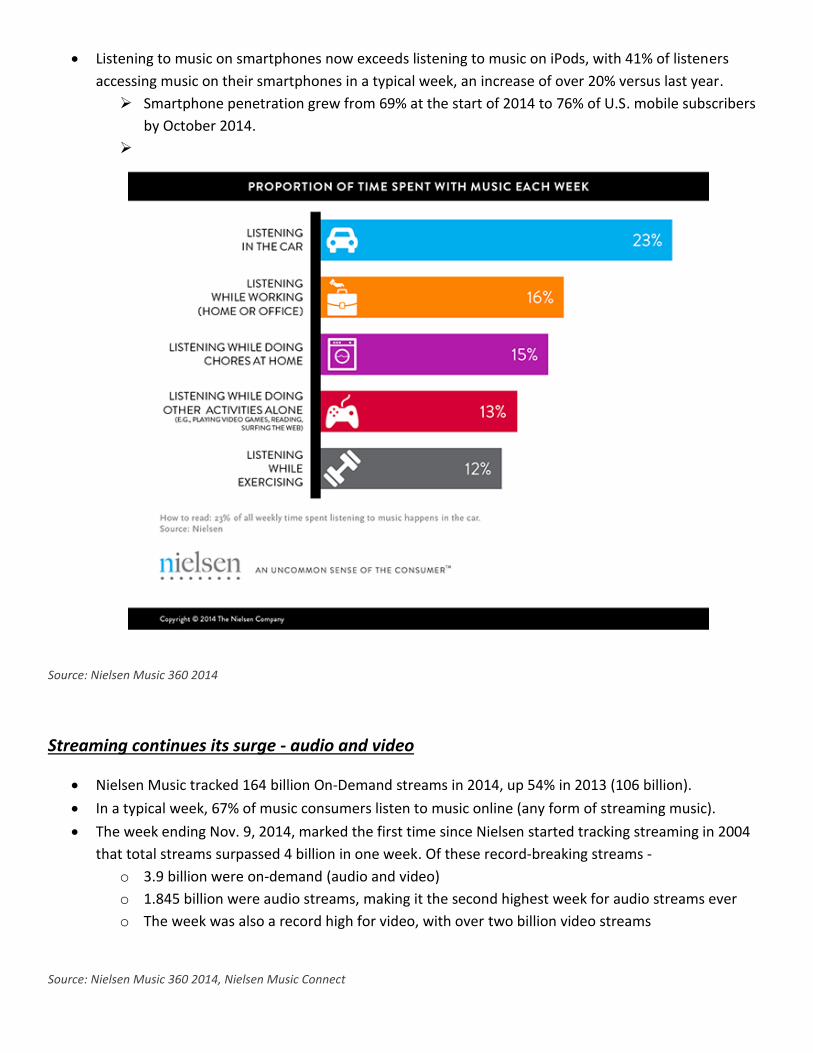
Nearly 25% of all music listening happens in the car; listening at work or while doing chores at home
each account for around 15% of our weekly time spent with music.
Listening to music on smartphones now exceeds listening to music on iPods, with 41% of listeners
accessing music on their smartphones in a typical week, an increase of over 20% versus last year.
Smartphone penetration grew from 69% at the start of 2014 to 76% of U.S. mobile subscribers
by October 2014.
Source: Nielsen Music 360 2014
Streaming continues its surge - audio and video
Nielsen Music tracked 164 billion On-Demand streams in 2014, up 54% in 2013 (106 billion).
In a typical week, 67% of music consumers listen to music online (any form of streaming music).
The week ending Nov. 9, 2014, marked the first time since Nielsen started tracking streaming in 2004
that total streams surpassed 4 billion in one week. Of these record-breaking streams -
o 3.9 billion were on-demand (audio and video)
o 1.845 billion were audio streams, making it the second highest week for audio streams ever
o The week was also a record high for video, with over two billion video streams
Source: Nielsen Music 360 2014, Nielsen Music Connect

Radio Remains Top Source for Music Discovery, With Pop and Country Leading the Way
Radio remains the top method of music discovery, and its local nature makes it an integral part of the daily
lives of hundreds of millions of consumers in markets large and small. 51% of consumers use radio to discover
new music.
59% of music listeners use a combination of over-the-air AM/FM radio and online radio streams to
hear music
243 million U.S. consumers (aged 12 and over) tune in each week to radio. That’s 91.3% of the national
population tuning in across more than 250 local markets.
Across the 48 Nielsen portable people meter (PPM) markets, Pop Contemporary Hit Radio (CHR) and
Country were the leading music formats amongst all listeners in 2014, followed by Adult Contemporary
(AC), Hot AC and Classic Hits.
Country radio grew significantly with 18-to-34-year-old audiences through the first half of the year,
peaking in June with its all-time best audience share, before ending the year on a downtrend. For the
year, Country ranked second across the Nielsen PPM markets.
Hot AC increased its share of audience, moving from fifth to third this year among audiences aged 18
to 34. 2014 marked the best year ever for the format.
The chart below breaks down the national listening landscape for the top 10 most popular radio formats of
2014 for the 18-34 audience in Nielsen’s PPM markets.
Source: Nielsen Audio

Consumers might not be buying as many CDs, but they are still spending on music
On average, consumers spend $109 annually on music activity.
On average, live music events account for just over half of total music activity spending.
Festivals are gaining steam: 32 million people attend at least one festival a year (12%).
o Festival-goers spend more than typical music listeners on all forms of music overall (e.g. digital
purchases, streaming, other live events, etc.).
Source: Nielsen Music 360 2014, Nielsen Music Audience Insights: Festivals
Music on Television
Just a few years ago, televised award shows were in a ratings tailspin. Fast forward to 2014, and the advent of
social media, and it is a very different story.
In 2014, music award shows reached a television audience of 115 million viewers and sparked 47
million comments on Twitter.
The 2014 Grammy Awards show averaged 28.5 million viewers, up slightly from last year and the
second largest audience in 21 years.
The most-tweeted minute of the 2014 Grammy Awards was during the Kendrick Lamar/Imagine
Dragons performance which garnered 143k Tweets at 9:50pm EST on January 26, 2014.
The 2014 Billboard Music Awards Show averaged 10.5 million viewers, an increase of 13% from the
previous year.
The Country Music Awards show saw an increase in the number of teens (up 12 percent from 2013)
and kids (up 14 percent) tuning into the broadcast, likely buoyed by performances from Ariana Grande
and Meghan Trainor.
TV Music Award Show viewers in general are heavily female, with the most highly concentrated
segment of viewers between the ages of 18-24.
Audience engagement is higher for award shows than other programming; over 15% higher than
newscasts and 40% higher than sports.
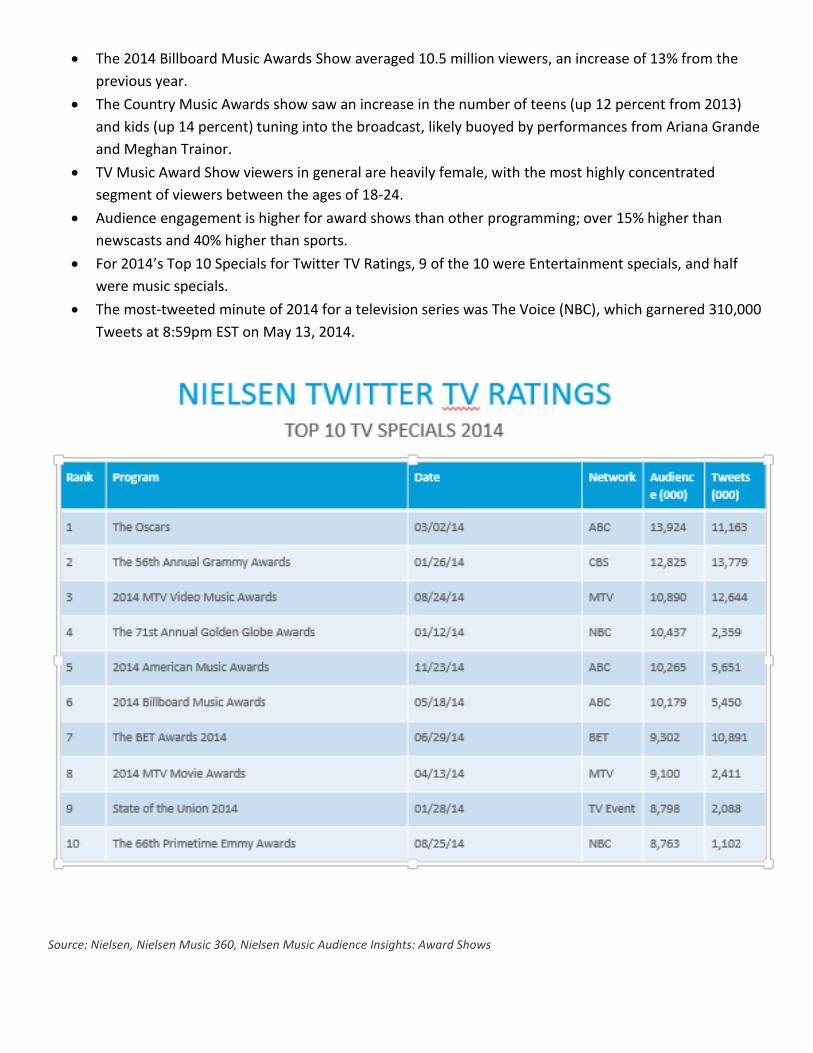
For 2014’s Top 10 Specials for Twitter TV Ratings, 9 of the 10 were Entertainment specials, and half
were music specials.
The most-tweeted minute of 2014 for a television series was The Voice (NBC), which garnered 310,000
Tweets at 8:59pm EST on May 13, 2014.
Source: Nielsen, Nielsen Music 360, Nielsen Music Audience Insights: Award Shows
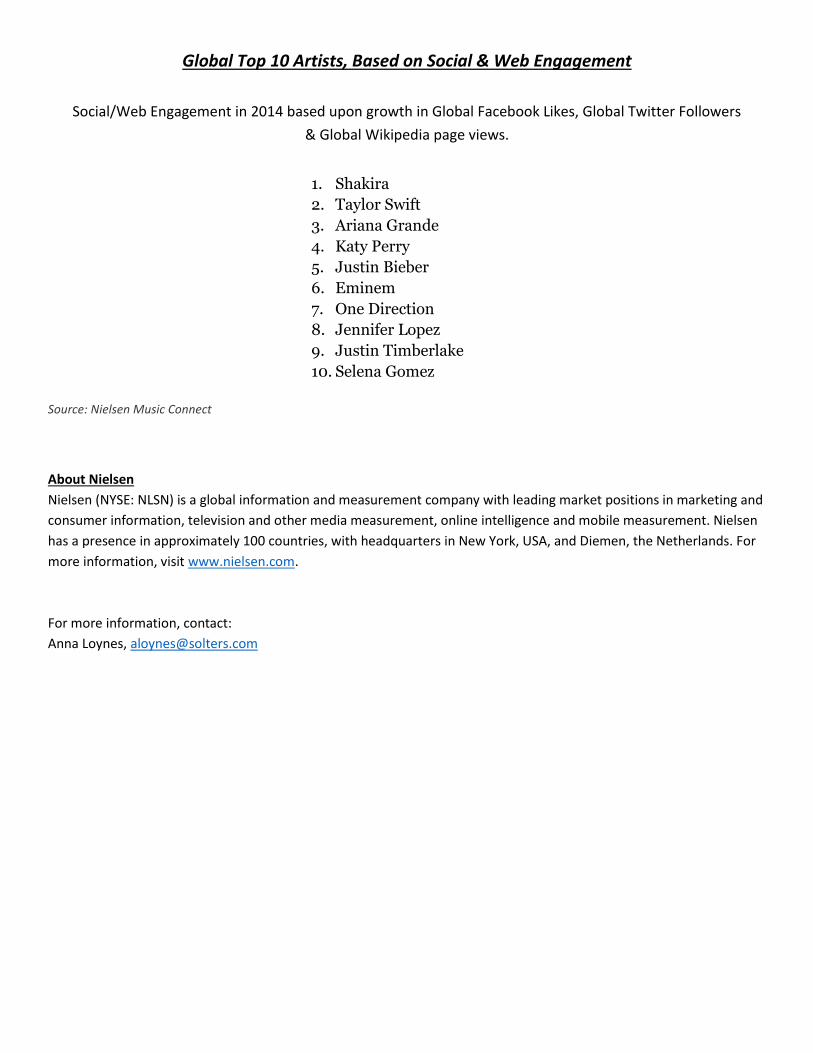
Global Top 10 Artists, Based on Social & Web Engagement
Social/Web Engagement in 2014 based upon growth in Global Facebook Likes, Global Twitter Followers
& Global Wikipedia page views.
1. Shakira
2. Taylor Swift
3. Ariana Grande
4. Katy Perry
5. Justin Bieber
6. Eminem
7. One Direction
8. Jennifer Lopez
9. Justin Timberlake
10. Selena Gomez
Source: Nielsen Music Connect
About Nielsen
Nielsen (NYSE: NLSN) is a global information and measurement company with leading market positions in marketing and
consumer information, television and other media measurement, online intelligence and mobile measurement. Nielsen
has a presence in approximately 100 countries, with headquarters in New York, USA, and Diemen, the Netherlands. For
more information, visit www.nielsen.com.
For more information, contact:
Anna Loynes, [email protected]


![[Critica] Apple's Weakness](https://img.pdfslide.net/doc/110x75/54b2dc494a7959d10e8b456b/critica-apples-weakness.jpg)