Embed Size (px)
Citation preview

8/10/2019 2014 Overview of Land Markets Survey
http://slidepdf.com/reader/full/2014-overview-of-land-markets-survey 1/36
Overview of Land Markets Survey Conducted byNAR Research for the
REALTORS® Land Institute
Lawrence Yun, Senior Vice President & Chief EconomistJed Smith, Managing Director, Quantitative Research
Gay Cororaton, Research EconomistAugust 2014

8/10/2019 2014 Overview of Land Markets Survey
http://slidepdf.com/reader/full/2014-overview-of-land-markets-survey 2/36
Survey Conducted July 9 – July 31, 2014
• REALTORS® Land Institute Survey. – Surveyed 1,000 members plus
approximately 9,500 non-members. – 629 responses.
• 542 respondents providedinformation on membership:
o 63 percent from RLI;o 80 percent are NAR members;o 13 percent are CCIM members;o 35 percent have other memberships
(e.g., ABR, ALC, ASFMRA, CIPS, CRB,CRS, CRE, GRI, SIOR, TAR, ULI,Society of American Foresters )
•
Characteristics about the salepertain to the most recent land saletransaction of the respondent.
63%
80%
13%
35%
0%
10%
20%
30%
40%
50%
60%
70%
80%
90%
RLI NAR CCIM Other
P e r c e n t o
f r e s p o n
d e n t s
Professional Membership, As Percent of RespondentsWill not sum to 100 percent, because respondents could identify more than one
membership

8/10/2019 2014 Overview of Land Markets Survey
http://slidepdf.com/reader/full/2014-overview-of-land-markets-survey 3/36

8/10/2019 2014 Overview of Land Markets Survey
http://slidepdf.com/reader/full/2014-overview-of-land-markets-survey 4/36
Highlights of the NAR-RLI Land Business Survey
• Regions 3 (KY, TN, NC SC, GA, AL, MS, FL) and 4 ( KS,MO, AR, LA, OK, TX) accounted for approximately 69percent of respondents.
• Major practice areas: Agricultural (69 percent ofrespondents), and Recreation (59 percent ofrespondents).
• Transaction and price growth, past year: 4 percent.• Individuals/families: 58 percent of buyers.•
Days on market varied-- from 60 days for irrigatedagricultural land to 237 days for commercial land.• Financing: on average, 31 percent of the transaction
is financed.

8/10/2019 2014 Overview of Land Markets Survey
http://slidepdf.com/reader/full/2014-overview-of-land-markets-survey 5/36
RLI Regions 3 and 4: Locations of Much of Activity
11%13%
30%
26%
15%
5%
0%
5%
10%
15%
20%
25%
30%
35%
1 2 3 4 5 6RLI Region
Location of Land Most Recently Sold(Percent Distribution of Land)
15%
19%
35% 34%
19%
7%
0%
5%
10%
15%
20%25%
30%
35%
40%
1 2 3 4 5 6RLI Region
Region Where Respondents Are Located(Percent of Respondents)*
*Will not sum to 100% because respondent can identify more than onestate.

8/10/2019 2014 Overview of Land Markets Survey
http://slidepdf.com/reader/full/2014-overview-of-land-markets-survey 6/36
Agriculture and Recreation: Leading Practice Areas
69%
33%
41%
59%
43% 45%
15%
0%
10%
20%
30%
40%
50%
60%
70%
80%
Agricultural Timber Ranch Recreation Development Commercial Other
P e r c e n t o
f r e s p o n
d e n t s
Type of Land on Which Practice Focuses(Percent of Respondents)*
*Will not sum up to 100% because respondent can identify more than one type of practice.

8/10/2019 2014 Overview of Land Markets Survey
http://slidepdf.com/reader/full/2014-overview-of-land-markets-survey 7/36
Land Sales

8/10/2019 2014 Overview of Land Markets Survey
http://slidepdf.com/reader/full/2014-overview-of-land-markets-survey 8/36
Type of Seller in the Most Recent Land Sales*
72%
23%
7%
0%
10%
20%
30%
40%50%
60%
70%
80%
Individual/Family Corporate/Partnership Foreign and Other Sellers
May not sum to 100%. Respondent can check more than one type.

8/10/2019 2014 Overview of Land Markets Survey
http://slidepdf.com/reader/full/2014-overview-of-land-markets-survey 9/36
Price Growth, Past 12 Months (July 2013-2014)Median Price Change: 4 Percent;
Mean Price Change: 4 Percent
0%
10%
20%
30%
40%
50%
60%
less than -10%
-10% to 0% 0% to 5% 5% to 10% 10% to 15% over 15%
P e r c e n t
d i s t r i b u t i o n o
f r e s p o n s e s ,
b y t y p e
Price Change, In Percent
Percent Price Change Over Past 12 Months(Percent Distribution, By Type of Land)
AgriculturalTimber
Ranch
Recreation
Development
Commercial
Other

8/10/2019 2014 Overview of Land Markets Survey
http://slidepdf.com/reader/full/2014-overview-of-land-markets-survey 10/36
Sales Growth, Past 12 Months (July 2013-2014)Median Percent Sales Growth: 4 PercentMean Percent Sales Growth: 4 Percent
0%
10%
20%
30%
40%
50%
60%
less than -10%
-10% to 0% 0% to 5% 5% to 10% 10% to 15% over 15%
P e r c e n t
d i s t r i b u t i o n o
f r e s p o n s e s
Sales Change, in Percent
Percent Change in Sales Over Past 12 Months(Percent Distribution, By Type of Land)
Agricultural
Timber
Ranch
Recreation
Development
CommercialOther

8/10/2019 2014 Overview of Land Markets Survey
http://slidepdf.com/reader/full/2014-overview-of-land-markets-survey 11/36
Agriculture and Recreation46 Percent of Most Recent Sales Transactions
10%
15%
11%13%
21%
13%
10%8%
0%
5%
10%
15%
20%
25%
P e r c e n t
d i s t r i b u t i o n o
f r e s p o n s e s
Type of Land Most Recently Sold by Respondent

8/10/2019 2014 Overview of Land Markets Survey
http://slidepdf.com/reader/full/2014-overview-of-land-markets-survey 12/36
Types of Land Most Recently Sold by Region*Percent of Sales Transactions
21%
65%
12%20%
27%
13%
3%
28%
30%25%
21%
15%
22%
23% 21%25%
3%
17%
8% 13%13%
10%12% 10% 4%
8% 3% 8% 9% 9%
0%
10%
20%
30%
40%
50%
60%
70%
80%
90%
100%
1 2 3 4 5
Other
Commercial
Development
Recreation
Timber/Ranch
Agri
*Not enough observations to analyze Region 6

8/10/2019 2014 Overview of Land Markets Survey
http://slidepdf.com/reader/full/2014-overview-of-land-markets-survey 13/36
Median Acres of Most Recent Land SaleVariation by Region and Land Type
160
117
202
294
81
17 523
81
0
50
100
150
200
250
300
350
Median Acres for Most Recent LandSales, By Type of Land
44
98
82
104
129
6481
0
20
40
60
80
100
120
140
Median Acres for Most Recent LandSales, By Region

8/10/2019 2014 Overview of Land Markets Survey
http://slidepdf.com/reader/full/2014-overview-of-land-markets-survey 14/36
Irrigated Land Transactions44 Percent in Region 5; 14 Percent Overall
• Pricing for AgriculturalLand: $5,600 per acre.
• Price varies widely forirrigated land vs. non-
irrigated. – Irrigated--Very expensive in
California and Iowa. – Irrigated--Less Expensive
elsewhere•
Accordingly, prices are notbroken out on followingslides for irrigated vs. non-irrigated land.

8/10/2019 2014 Overview of Land Markets Survey
http://slidepdf.com/reader/full/2014-overview-of-land-markets-survey 15/36
Median Price of Most Recent Land TransactionVariation by Region and Land Type

8/10/2019 2014 Overview of Land Markets Survey
http://slidepdf.com/reader/full/2014-overview-of-land-markets-survey 16/36
Mineral RightsConveyed in 60 Percent of Most Recent Land Sale Transactions
Yes60%
No26%
Not applicable14%
8/10/2019 2014 Overview of Land Markets Survey
http://slidepdf.com/reader/full/2014-overview-of-land-markets-survey 17/36
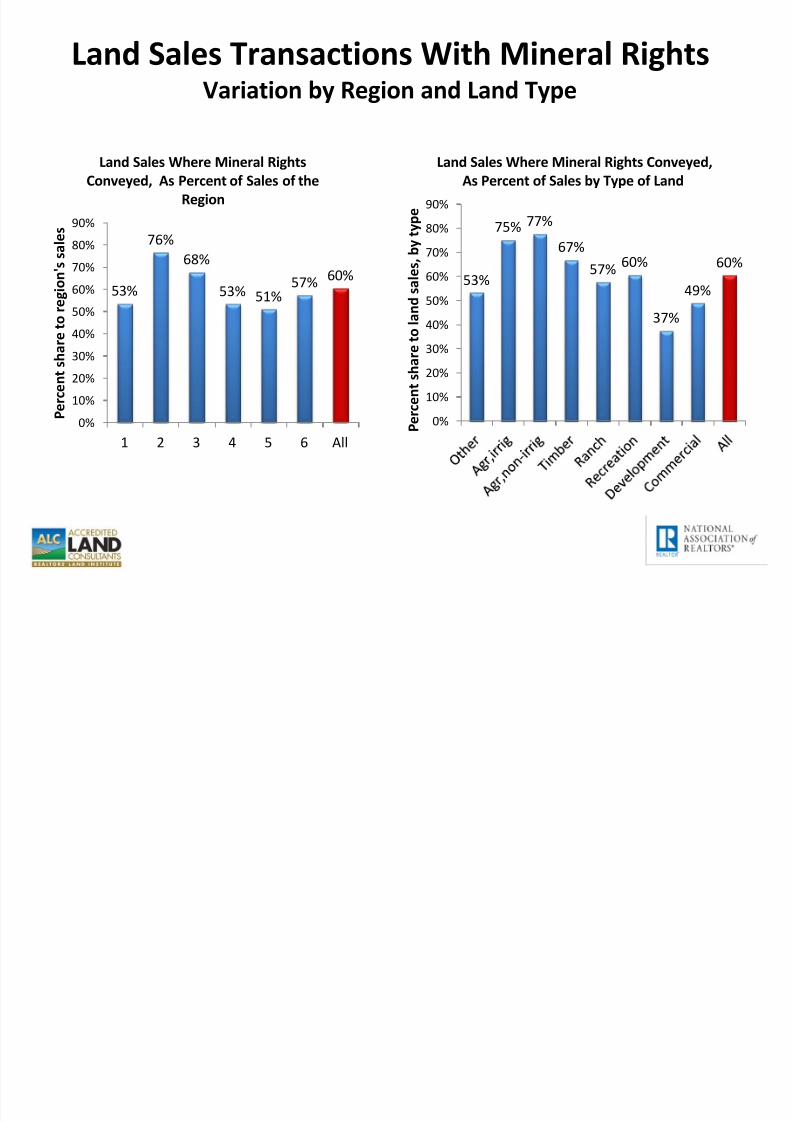
Land Sales Transactions With Mineral RightsVariation by Region and Land Type
53%
75% 77%
67%
57% 60%
37%
49%
60%
0%
10%
20%
30%
40%
50%60%
70%
80%
90%
P e r c e n t s h a r e t o
l a n d s a l e s ,
b y t y p e
Land Sales Where Mineral Rights Conveyed,As Percent of Sales by Type of Land
53%
76%68%
53% 51%57% 60%
0%
10%
20%
30%
40%
50%
60%
70%
80%
90%
1 2 3 4 5 6 All P e r c e n t s h a r e t o r e g i o n
' s s a l e s
Land Sales Where Mineral RightsConveyed, As Percent of Sales of the
Region

8/10/2019 2014 Overview of Land Markets Survey
http://slidepdf.com/reader/full/2014-overview-of-land-markets-survey 18/36
Type of Land Most Recently SoldIndividual/Family
Other9%
Agr,irrig10%
Agr,non-irrig18%
Timber11%
Ranch15%
Recreation22%
Development8%
Commercial7%

8/10/2019 2014 Overview of Land Markets Survey
http://slidepdf.com/reader/full/2014-overview-of-land-markets-survey 19/36
Type of Land Most Recently SoldCorporations/Partnerships
Other5%
Agr,irrig6%
Agr,non-irrig5%
Timber17%
Ranch12%
Recreation17%
Development24%
Commercial14%

8/10/2019 2014 Overview of Land Markets Survey
http://slidepdf.com/reader/full/2014-overview-of-land-markets-survey 20/36
Individual and Corporate Sellers:Majority from Regions 3 and 4
11%
15%
26%29%
16%
4%
10%
5%
40%
22%
15%
8%
0%
5%10%
15%
20%
25%
30%35%
40%
45%
1 2 3 4 5 6
Distribution of Individual/Family and Corporation/Partnership SellersAcross Regions*
Indiv/Family Corporation/Partnership
* Not enough samples for Foreign and Other Sellers

8/10/2019 2014 Overview of Land Markets Survey
http://slidepdf.com/reader/full/2014-overview-of-land-markets-survey 21/36
Purchases

8/10/2019 2014 Overview of Land Markets Survey
http://slidepdf.com/reader/full/2014-overview-of-land-markets-survey 22/36
Individuals/Families: The Major Buyers
58%
17%
10%
17%13%
0%
10%
20%
30%
40%
50%
60%
70%
P e r c e n t o
f r e s p o n
d e n t s
Type of Buyer in Most Recent Land Sale Transaction*
*Will not sum to 100% because respondent can choose more than one type.

8/10/2019 2014 Overview of Land Markets Survey
http://slidepdf.com/reader/full/2014-overview-of-land-markets-survey 23/36
Major Types of Land TransactionsIndividual/Family Buyers: Recreation and Agriculture
Other12% Agr,irrig
8%
Agr,non-irrig16%
Timber9%
Ranch17%
Recreation31%
Development
5%
Commercial2%

8/10/2019 2014 Overview of Land Markets Survey
http://slidepdf.com/reader/full/2014-overview-of-land-markets-survey 24/36
Major Types of Land TransactionsCorporations/Partnerships: Commercial and Development
Other3%
Agr,irrig4%Agr,non-irrig
10%
Timber17%
Ranch6%
Recreation4%
Developmen
t30%
Commercial26%
Type of Land Bought by Corporate Buyers

8/10/2019 2014 Overview of Land Markets Survey
http://slidepdf.com/reader/full/2014-overview-of-land-markets-survey 25/36
Major Types of Land TransactionsExpansion Farmers: Agriculture
Other2%
Agr,irrig
30%
Agr,non-
irrig55%
Ranch13%
Type of Land Bought by Expansion Farmers

8/10/2019 2014 Overview of Land Markets Survey
http://slidepdf.com/reader/full/2014-overview-of-land-markets-survey 26/36
Major Types of Land TransactionsInvestors: Diversified
Other6% Agr,irrig
8%
Agr,non-irrig13%
Timber20%Ranch
9%
Recreation
13%
Development
17%
Commercial14%
Type of Land Bought by Investors

8/10/2019 2014 Overview of Land Markets Survey
http://slidepdf.com/reader/full/2014-overview-of-land-markets-survey 27/36
Regional PurchasesIndividual/Family Buyers
Corporations/Partnerships
10%
13%
28% 27%
16%
6%
0%
5%
10%
15%
20%
25%
30%
1 2 3 4 5 6
P e r c e n t a g e s h a r e t o t o t a l
Distribution Across Regions WhereIndividual/Family Buyers Bought
Land
11%
14%
31%
26%
11%
6%
0%
5%
10%
15%
20%
25%
30%
35%
1 2 3 4 5 6
P e r c e n t a g e s h a r e t o t o t a l
Distribution Across Regions WhereCorporations / Partnership Buyers
Bought Land

8/10/2019 2014 Overview of Land Markets Survey
http://slidepdf.com/reader/full/2014-overview-of-land-markets-survey 28/36
Regional PurchasesExpansion Farmers
Investors
13%
35%
5%
28%
15%
5%
0%
5%
10%
15%
20%
25%
30%
35%
40%
1 2 3 4 5 6
P e r c e n t a g e s h a r e t o t o t a l
Distribution Across Regions WhereExpansion Farmers Bought Land
10%
14%
37%
26%
10%
3%
0%
5%
10%
15%
20%
25%
30%
35%
40%
1 2 3 4 5 6
P e r c e n t a g e s h a r e t o t o t a l
Distribution Across Regions WhereInvestors Bought Land

8/10/2019 2014 Overview of Land Markets Survey
http://slidepdf.com/reader/full/2014-overview-of-land-markets-survey 29/36
Market Details

8/10/2019 2014 Overview of Land Markets Survey
http://slidepdf.com/reader/full/2014-overview-of-land-markets-survey 30/36
Median Days on Market,By Region and Type of Land
180
6073
120153 150
123
237
120
0
50
100
150
200
250
D a y s o n M a r k e t
Median Days on Market of Most RecentLand Sales, By Type of Land
194
60
150
120
200
111 120
0
50
100
150
200
250
1 2 3 4 5 6 All
D a y s o n M a r k e t
Median Days on Market of Most RecentLand Sales, By Region

8/10/2019 2014 Overview of Land Markets Survey
http://slidepdf.com/reader/full/2014-overview-of-land-markets-survey 31/36
Transaction Financing
On Average, 31 Percent of the Land Value is Financed
23%
31% 31%
38%
24%
31%
0%5%
10%
15%
20%
25%
30%
35%
40%
1 2 3 4 5 P e r c e n t o
f t h e
l a n d t r a n s a c t i o n v a l u e t h a t w a s
f i n a n c e
d
Average Percent of the the Value of the Transaction Thas WasFinanced, By Region*
*Not enough observations for Region 6.

8/10/2019 2014 Overview of Land Markets Survey
http://slidepdf.com/reader/full/2014-overview-of-land-markets-survey 32/36
Transaction Financing by Type of Land
31% 30%
33%
21%
38%
32% 31%
28%31%
0%
5%
10%
15%
20%
25%
30%
35%
40%
45%
P e r c e n t o
f t h e
l a n d t r a n s a c t i o n v a l u e t h a t w a s
f i n a n c e d

8/10/2019 2014 Overview of Land Markets Survey
http://slidepdf.com/reader/full/2014-overview-of-land-markets-survey 33/36
Major Conclusions
• Most Prevalent Type of Land by Buyer – Individual buyers -> agriculture, recreation – Corp/partnerships-> development , commercial – Expansion farmers-> agriculture – Investors-> diversified across types of land – 1031 Exchange –> agriculture, ranch – Foreign buyers –> ranch, recreation – Others -> development
• Most Prevalent Type of Land By Region: – Region 1: development, recreation – Region 2: agriculture – Region 3: timber/ranch, recreation, – Region 4: Timber/ranch, agriculture, recreation – Region 5: agriculture, timber/ranch

8/10/2019 2014 Overview of Land Markets Survey
http://slidepdf.com/reader/full/2014-overview-of-land-markets-survey 34/36
Major ConclusionsPrice, Financing, and Market Growth
• Median Price: $5,125 per acre with Great Variability – Agri, irrigated: $6,000 ; Agri, non-irrigated: $5,500 – Timber:$2,075 ; Ranch: $4,150 – Recreation: $3,000; Development: $40,000 – Commercial $96,875 ; Other: $9,125
• Median Number of Acres in Transaction: 81 with GreatVariability
– Agri, irrigated: 160; Agri, non-irrigated: 117 – Timber: 202; Ranch: 294 – Recreation: 81; Development: 17 – Commercial: 5 ; Other: 23

8/10/2019 2014 Overview of Land Markets Survey
http://slidepdf.com/reader/full/2014-overview-of-land-markets-survey 35/36
Major ConclusionsPrice, Financing, and Market Growth
• Median days On Market: 120 days with GreatVariability.
– Agri,irrig: 60 ; Agri,non-irrig: 73 –
Timber: 120; Ranch: 153 – Recreation: 150; Development: 123 – Commercial: 237 ; Other: 180
• Irrigated land: 14 percent of most recent sales.• Mineral rights: Conveyed in 60 percent of sales.

8/10/2019 2014 Overview of Land Markets Survey
http://slidepdf.com/reader/full/2014-overview-of-land-markets-survey 36/36
Major ConclusionsPrice, Financing, and Market Growth
• On average, 31 percent of Transaction Value isfinanced.
• Market Growth Over Past Year. – Median prices have changed typically at 0 to 5
percent. – Sales have changed typically also at 0 to 5
percent.