Embed Size (px)
Citation preview
September, 2014
2014 Oyster Stock
Assessment Report of the Public Oyster Areas of Louisiana
Seed Grounds and Seed Reservations
Oyster Data Report Series No. 20 2014
Table of Contents
Statewide Overview ...............................................................................................................ii
Public Oyster Area Map.........................................................................................................x
Coastal Study Area 1 North (east of MS River and north of MRGO) ...................................1-1
Coastal Study Area 1 South (east of MS River and south of MRGO) ..................................2-1
Coastal Study Area 3 (Barataria basin) ..................................................................................3-1
Coastal Study Area 5 (Terrebonne basin) ..............................................................................5-1
Coastal Study Area 6 (Vermilion/Atchafalaya basin) ...........................................................6-1
Coastal Study Area 7 (Calcasieu and Sabine Lakes) .............................................................7-1
Dermo (Perkinsus marinus) Summary and Analysis .............................................................8-1
2014 Oyster Stock Assessment Report Page ii
Statewide Overview - 2014 Oyster Stock Assessment ______________________________________________________________________________
Introduction
The oyster resource in Louisiana is one of the largest and most valuable in the nation. Its value
is derived from both the economic benefits it provides to the state and the ecological benefits it
provides to the estuarine environment. Due to Louisiana’s vast coastal wetland area, ample
habitat exists where oysters thrive under a variety of environmental conditions. The Department
of Wildlife and Fisheries (LDWF) is charged with managing the oyster resource on the public
grounds by closely monitoring the size and health of oysters on nearly 1.7 million acres of public
water bottoms (see map on page xiii). Oyster management on these public grounds includes
activities such as setting oyster seasons, monitoring harvest levels, and habitat enhancement (i.e.
cultch planting, reef building) projects.
Typically, the oyster industry utilizes the public oyster grounds as a source of seed oysters (< 3”)
for transplant to private leases. The public grounds also yield a supply of sack-sized oysters (
3”) and these oysters may be taken directly to market. The manner in which both the public
grounds and private leases are utilized in combination helps to keep Louisiana’s industry as a
national leader in oyster production with annual value typically in excess of $35 million worth of
dockside sales.
Oysters also play an important ecological role in the estuarine ecosystem. Oyster reefs provide
the majority of hard substrate required by other sessile invertebrate species such as barnacles,
bryozoans, tunicates, and anemones. Reefs are also utilized as shelter and forage habitat for
many species of crabs, worms, fish, and meiofauna. Estuarine water quality can be enhanced by
the filter-feeding activities of oysters, and reefs can also play a role in stabilizing shorelines.
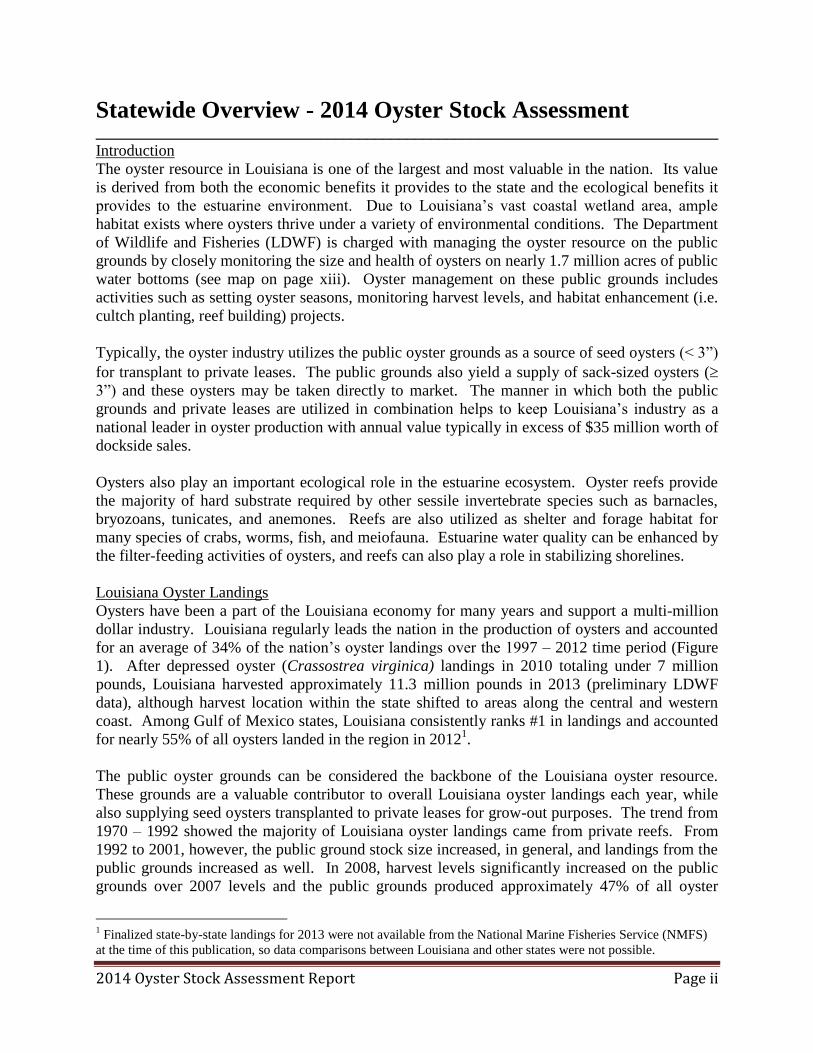
Louisiana Oyster Landings
Oysters have been a part of the Louisiana economy for many years and support a multi-million
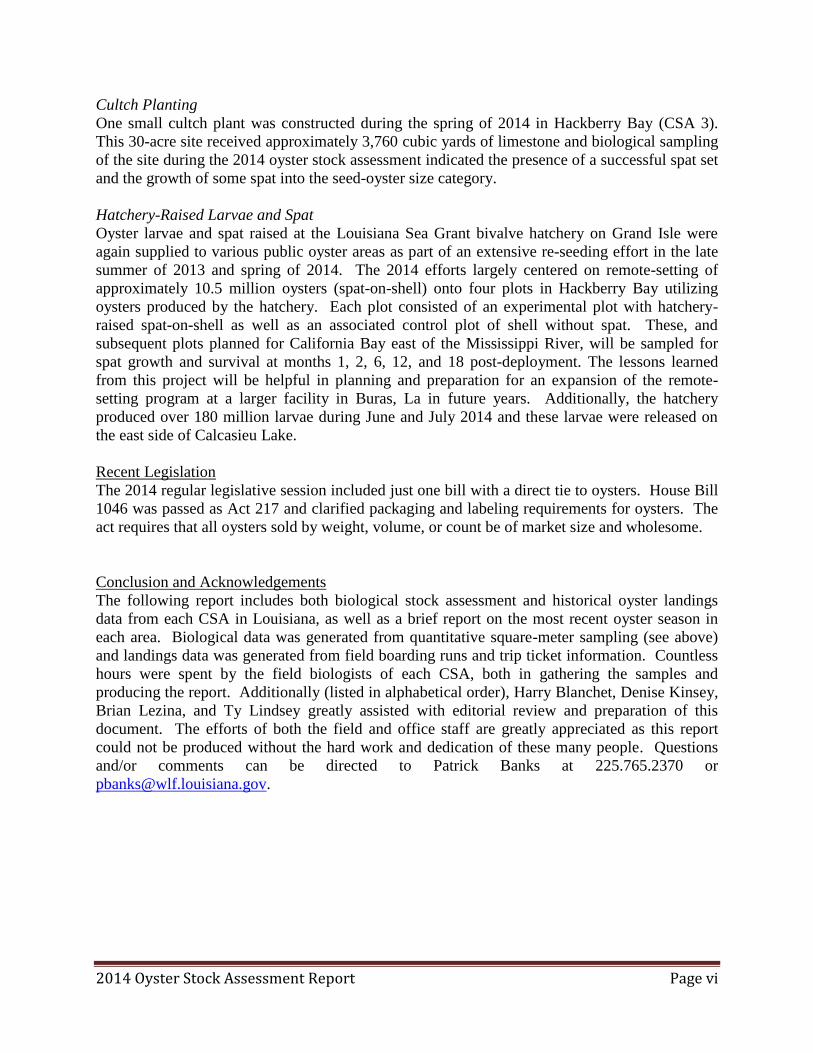
dollar industry. Louisiana regularly leads the nation in the production of oysters and accounted
for an average of 34% of the nation’s oyster landings over the 1997 – 2012 time period (Figure
1). After depressed oyster (Crassostrea virginica) landings in 2010 totaling under 7 million
pounds, Louisiana harvested approximately 11.3 million pounds in 2013 (preliminary LDWF
data), although harvest location within the state shifted to areas along the central and western
coast. Among Gulf of Mexico states, Louisiana consistently ranks #1 in landings and accounted
for nearly 55% of all oysters landed in the region in 20121.
The public oyster grounds can be considered the backbone of the Louisiana oyster resource.
These grounds are a valuable contributor to overall Louisiana oyster landings each year, while
also supplying seed oysters transplanted to private leases for grow-out purposes. The trend from
1970 – 1992 showed the majority of Louisiana oyster landings came from private reefs. From
1992 to 2001, however, the public ground stock size increased, in general, and landings from the
public grounds increased as well. In 2008, harvest levels significantly increased on the public
grounds over 2007 levels and the public grounds produced approximately 47% of all oyster
1 Finalized state-by-state landings for 2013 were not available from the National Marine Fisheries Service (NMFS)
at the time of this publication, so data comparisons between Louisiana and other states were not possible.
2014 Oyster Stock Assessment Report Page iii
landings for the calendar year. This reliance on the public grounds reversed during the 2009-
2013 time period and preliminary harvest data showed that over 90% of all oysters landed in
Louisiana came from private leases in 2013 (Figure 2).
Statewide Oyster Stock Assessment Overview
Methods
During the summer, LDWF biologists from each Coastal Study Area (CSA) of the Fisheries
Division perform quantitative evaluation of the oyster resource on the public oyster areas (Figure
3). This biological evaluation includes using SCUBA to collect oyster samples from within a
square meter frame from multiple locations (sample stations) in each public oyster ground. At
each station, five replicate square-meter samples are collected and data is combined to produce
average numbers of spat, seed, and sack oysters per station. Rather than using five square-meter
samples at each of the newly constructed cultch plants (2012 & 2013), 20 random ¼ meter-
square samples were collected. Spat are young oysters measuring one to 24 millimeters (mm) in
length. Seed oysters measure 25 to 74 mm and sack (= market-size) measure 75 mm and above.
The numbers of oysters per station is then multiplied by the associated reef acreage to obtain an
estimate of the total oysters present on the reefs. Oyster mortality estimates are also generated
by dividing the total number of recently dead animals by the total number of animals (both live
and dead) collected. Sampling undertaken as part of the annual stock assessment plays a
valuable role in predicting the success of the upcoming oyster season, which generally opens in
early September and runs through April of the following year (although the season may be
closed or delayed if biological concerns or enforcement problems are encountered). This stock
size information is used to make recommendations to the Wildlife and Fisheries Commission for
the setting of the oyster season.
A total of 106 sample stations were visited by LDWF biologists during the 2014 assessment and
620 individual samples were gathered. Information gathered from sampling is divided into the
respective CSAs and data are presented by CSA. Coastal Study Area 1 South holds the most
sample stations (33) while CSA 5 East holds the fewest (3). A higher density of sampling occurs
in the Black Bay (CSA 1 South) and Sister Lake (CSA 5 West) areas due to their high level of
oyster production in past years and increased historical importance to the oyster industry.
During the 2014 assessment, six of the 106 stations were located on newly-constructed cultch
plants.
Annual Stock Size
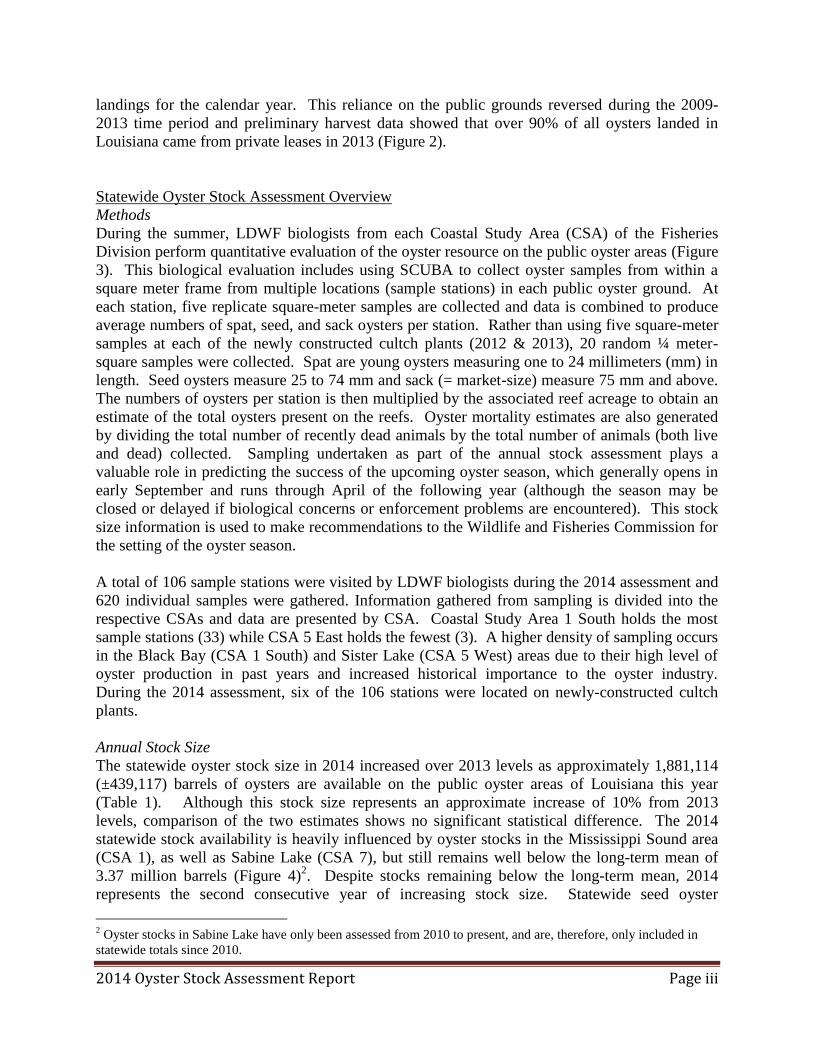
The statewide oyster stock size in 2014 increased over 2013 levels as approximately 1,881,114
(±439,117) barrels of oysters are available on the public oyster areas of Louisiana this year
(Table 1). Although this stock size represents an approximate increase of 10% from 2013
levels, comparison of the two estimates shows no significant statistical difference. The 2014
statewide stock availability is heavily influenced by oyster stocks in the Mississippi Sound area
(CSA 1), as well as Sabine Lake (CSA 7), but still remains well below the long-term mean of
3.37 million barrels (Figure 4)2. Despite stocks remaining below the long-term mean, 2014
represents the second consecutive year of increasing stock size. Statewide seed oyster
2 Oyster stocks in Sabine Lake have only been assessed from 2010 to present, and are, therefore, only included in
statewide totals since 2010.
2014 Oyster Stock Assessment Report Page iv
availability remained nearly unchanged, showing a small 5.3% increase over 2013 levels, while
market-size availability increased over 16% (Figure 5).
As indicated above, positive signs were noted in CSA 1-North where an approximate 31%
increase in oyster stocks was estimated from biological sampling. This increase was driven
largely by significant
gains in market oyster
stocks which rose
520% over 2013
levels to 153,520
(±72,683) barrels.
The largest
contributor to the
market oyster
increase is the 2011
Mississippi Sound
(Round Island) cultch
plant (291 acres).
Reefs in this area
continued to show
strong production of
seed oysters as well with over 438,000 barrels estimated during the 2014 stock assessment
sampling (+2.8% over 2013 levels).
Oyster production on public grounds in CSA 1-South continue to exist far below long term
averages as reefs were only sparsely populated with oysters again in 2014. While an uptick of
approximately 201% in market-size oysters was encountered during 2014, the estimated stock
size of this oyster size class was only 55,991 (±29,938) barrels. Seed stock in this area fell
sharply by nearly 90% to 29,442 (±10,515) barrels. The largest contributor to the seed oyster
decline was the Wreck station where over 100,000 barrels of seed were found during the 2013
assessment and zero were located in 2014.
Public oyster resource trends west of the Mississippi River in the Barataria-Terrebonne estuary
are largely driven by oyster availability in two public oyster seed reservations – Hackberry Bay
and Sister Lake. The Hackberry Bay Public Oyster Seed Reservation (CSA 3) in the Barataria
basin showed significant differences in oyster stock levels in 2014 as seed increased over 111%
to 34,924 (±13,490) barrels, yet market-size oysters decreased nearly 70% to 1,783 (±1,104)
barrels. The increase in seed was driven by seed production on the 2012 and 2014 cultch plants
that combined to hold over 31,000 barrels of the total seed stock estimated in the bay.
Oyster stocks in the Sister Lake Public Oyster Seed Reservation in 2014 rose significantly over
levels estimated in 2013. Seed oysters increased to over 900% to 269,893 (±24,167) barrels
while market-size oysters dropped slightly (-9%) to 33,563 (±4,921) barrels. The successful
harvest season during October 2013 in Sister Lake may have played a role in the small decrease
in market-oyster stocks as the commercial oyster industry harvested an estimated 86,804 sacks of
oysters from the lake during the 10-day season. The large increase in seed oyster stocks was
Table 1. Estimated Statewide oyster stock size on the public oyster
areas of Louisiana. CSA denotes Coastal Study Area. Percentage
columns (%) indicate percent of statewide total. Data in barrels and 1
barrel = 2 sacks.
CSA Seed Seed % Sack Sack % Total Total %
1N 438,016 42.5% 153,520 18.1% 591,536 31.4%
1S 29,442 2.9% 55,991 6.6% 85,433 4.5%
3 34,924 3.4% 1,783 0.2% 36,707 2.0%
5E 2,154 0.2% 255 0.0% 2,409 0.1%
5W 274,853 26.6% 36,835 4.3% 311,688 16.6%
7 252,009 24.4% 601,332 70.8% 853,341 45.4%
Total 1,031,398 849,716 1,881,114
2014 Oyster Stock Assessment Report Page v
driven by the 2012 cultch plant where approximately 95% of the seed oysters in Sister Lake were
found.
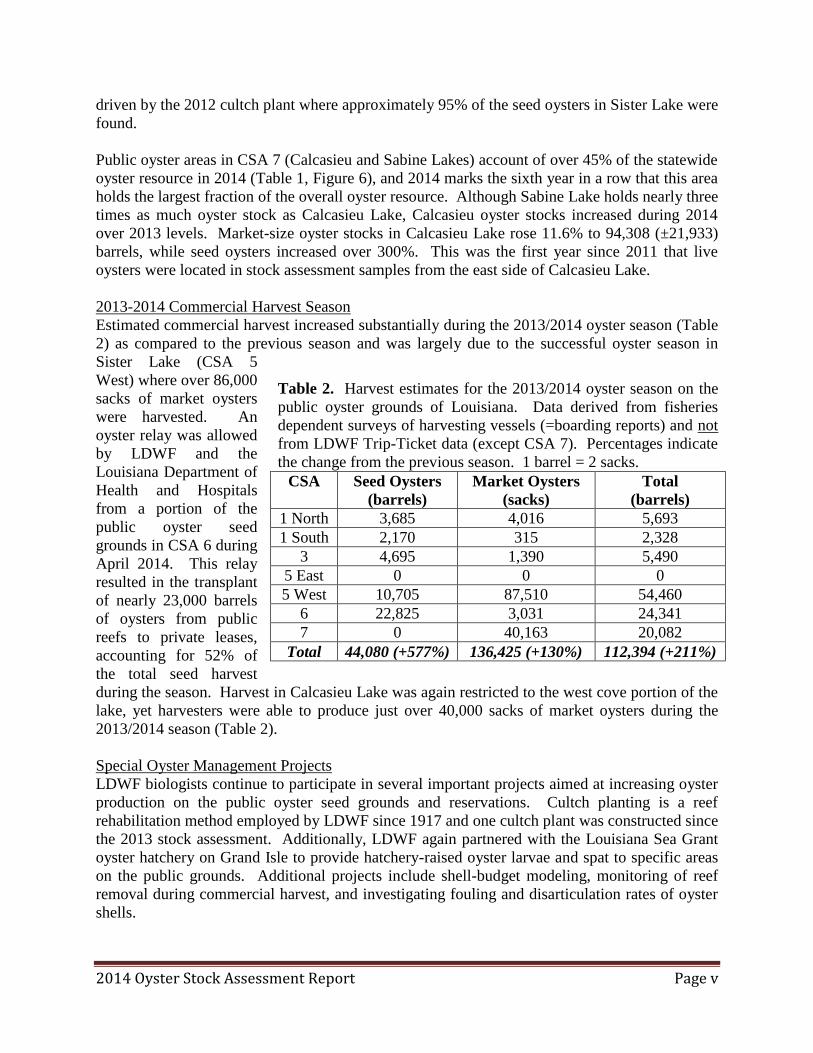
Public oyster areas in CSA 7 (Calcasieu and Sabine Lakes) account of over 45% of the statewide
oyster resource in 2014 (Table 1, Figure 6), and 2014 marks the sixth year in a row that this area
holds the largest fraction of the overall oyster resource. Although Sabine Lake holds nearly three
times as much oyster stock as Calcasieu Lake, Calcasieu oyster stocks increased during 2014
over 2013 levels. Market-size oyster stocks in Calcasieu Lake rose 11.6% to 94,308 (±21,933)
barrels, while seed oysters increased over 300%. This was the first year since 2011 that live
oysters were located in stock assessment samples from the east side of Calcasieu Lake.
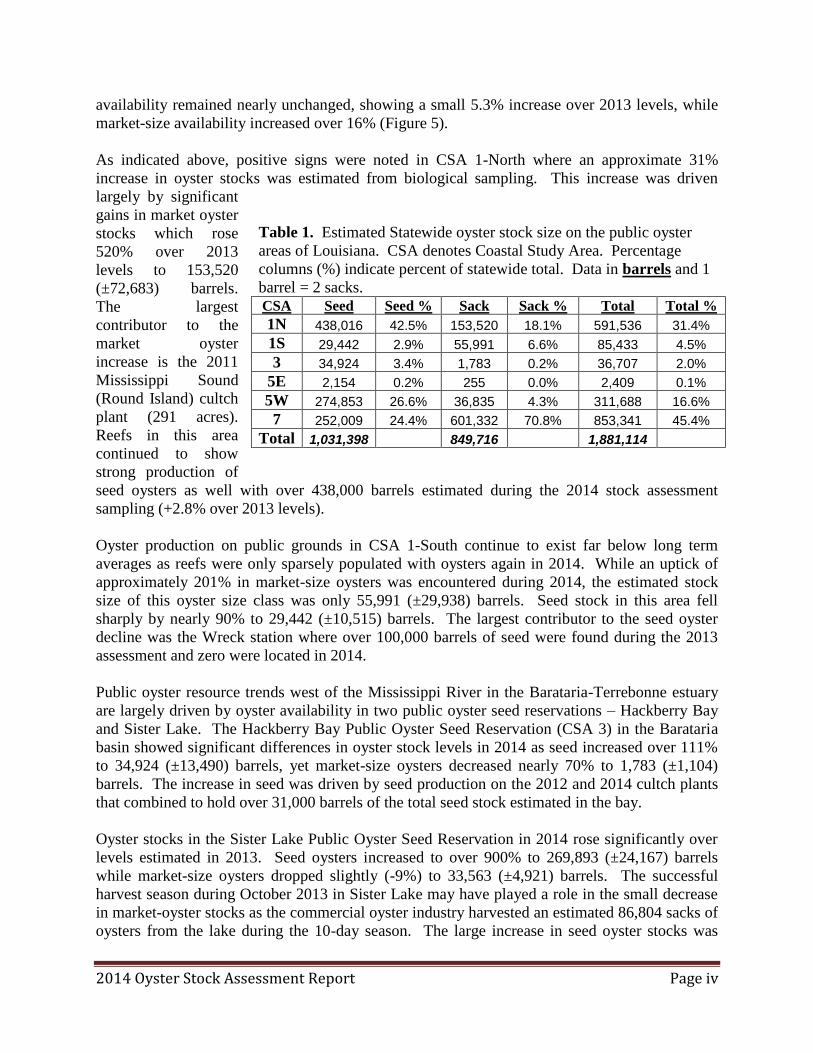
2013-2014 Commercial Harvest Season
Estimated commercial harvest increased substantially during the 2013/2014 oyster season (Table
2) as compared to the previous season and was largely due to the successful oyster season in
Sister Lake (CSA 5
West) where over 86,000
sacks of market oysters
were harvested. An
oyster relay was allowed
by LDWF and the
Louisiana Department of
Health and Hospitals
from a portion of the
public oyster seed
grounds in CSA 6 during
April 2014. This relay
resulted in the transplant
of nearly 23,000 barrels
of oysters from public
reefs to private leases,
accounting for 52% of
the total seed harvest
during the season. Harvest in Calcasieu Lake was again restricted to the west cove portion of the
lake, yet harvesters were able to produce just over 40,000 sacks of market oysters during the
2013/2014 season (Table 2).
Special Oyster Management Projects
LDWF biologists continue to participate in several important projects aimed at increasing oyster
production on the public oyster seed grounds and reservations. Cultch planting is a reef
rehabilitation method employed by LDWF since 1917 and one cultch plant was constructed since
the 2013 stock assessment. Additionally, LDWF again partnered with the Louisiana Sea Grant
oyster hatchery on Grand Isle to provide hatchery-raised oyster larvae and spat to specific areas
on the public grounds. Additional projects include shell-budget modeling, monitoring of reef
removal during commercial harvest, and investigating fouling and disarticulation rates of oyster
shells.
Table 2. Harvest estimates for the 2013/2014 oyster season on the
public oyster grounds of Louisiana. Data derived from fisheries
dependent surveys of harvesting vessels (=boarding reports) and not
from LDWF Trip-Ticket data (except CSA 7). Percentages indicate
the change from the previous season. 1 barrel = 2 sacks.
CSA Seed Oysters
(barrels)
Market Oysters
(sacks)
Total
(barrels)
1 North 3,685 4,016 5,693
1 South 2,170 315 2,328
3 4,695 1,390 5,490
5 East 0 0 0
5 West 10,705 87,510 54,460
6 22,825 3,031 24,341
7 0 40,163 20,082
Total 44,080 (+577%) 136,425 (+130%) 112,394 (+211%)
2014 Oyster Stock Assessment Report Page vi
Cultch Planting
One small cultch plant was constructed during the spring of 2014 in Hackberry Bay (CSA 3).
This 30-acre site received approximately 3,760 cubic yards of limestone and biological sampling
of the site during the 2014 oyster stock assessment indicated the presence of a successful spat set
and the growth of some spat into the seed-oyster size category.
Hatchery-Raised Larvae and Spat
Oyster larvae and spat raised at the Louisiana Sea Grant bivalve hatchery on Grand Isle were
again supplied to various public oyster areas as part of an extensive re-seeding effort in the late
summer of 2013 and spring of 2014. The 2014 efforts largely centered on remote-setting of
approximately 10.5 million oysters (spat-on-shell) onto four plots in Hackberry Bay utilizing
oysters produced by the hatchery. Each plot consisted of an experimental plot with hatchery-
raised spat-on-shell as well as an associated control plot of shell without spat. These, and
subsequent plots planned for California Bay east of the Mississippi River, will be sampled for
spat growth and survival at months 1, 2, 6, 12, and 18 post-deployment. The lessons learned
from this project will be helpful in planning and preparation for an expansion of the remote-
setting program at a larger facility in Buras, La in future years. Additionally, the hatchery
produced over 180 million larvae during June and July 2014 and these larvae were released on
the east side of Calcasieu Lake.
Recent Legislation
The 2014 regular legislative session included just one bill with a direct tie to oysters. House Bill
1046 was passed as Act 217 and clarified packaging and labeling requirements for oysters. The
act requires that all oysters sold by weight, volume, or count be of market size and wholesome.
Conclusion and Acknowledgements
The following report includes both biological stock assessment and historical oyster landings
data from each CSA in Louisiana, as well as a brief report on the most recent oyster season in
each area. Biological data was generated from quantitative square-meter sampling (see above)
and landings data was generated from field boarding runs and trip ticket information. Countless
hours were spent by the field biologists of each CSA, both in gathering the samples and
producing the report. Additionally (listed in alphabetical order), Harry Blanchet, Denise Kinsey,
Brian Lezina, and Ty Lindsey greatly assisted with editorial review and preparation of this
document. The efforts of both the field and office staff are greatly appreciated as this report
could not be produced without the hard work and dedication of these many people. Questions
and/or comments can be directed to Patrick Banks at 225.765.2370 or
2014 Oyster Stock Assessment Report Page vii
Louisiana 34%
Texas 14%
Florida 6%
Mississippi 6%
Alabama 1%
Remainder of U.S. 39%
Figure 1. Percentage contribution to average annual landings of all oysters in the United
States over the time period of 1997 through 2012. Data provided by National Marine Fisheries
Service (NMFS).
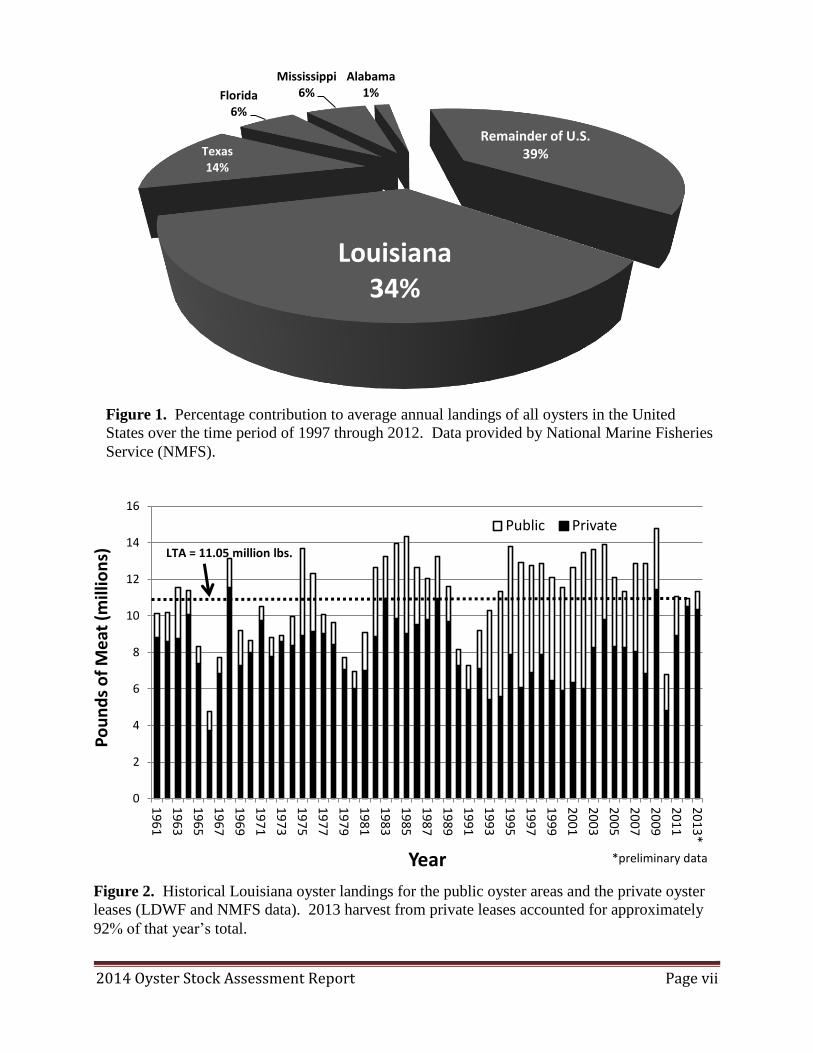
Figure 2. Historical Louisiana oyster landings for the public oyster areas and the private oyster
leases (LDWF and NMFS data). 2013 harvest from private leases accounted for approximately
92% of that year’s total.
0
2
4
6
8
10
12
14
16
19
61
19
63
19
65
19
67
19
69
19
71
19
73
19
75
19
77
19
79
19
81
19
83
19
85
19
87
19
89
19
91
19
93
19
95
19
97
19
99
20
01
20
03
20
05
20
07
20
09
20
11
20
13
* P
ou
nd
s o
f M
eat
(m
illio
ns)
Year
Public Private
LTA = 11.05 million lbs.
*preliminary data
2014 Oyster Stock Assessment Report Page viii
0
1
2
3
4
5
6
7
8
9
1982
1983
1984
1985
1986
1987
1988
1989
1990
1991
1992
1993
1994
1995
1996
1997
1998
1999
2000
2001
2002
2003
2004
2005
2006
2007
2008
2009
2010*
2011*
2012*
2013*
2014* B
arr
els
of
Oys
ters
Ava
ila
ble
(m
illi
on
s)
Year
Seed & Sack Combined
Long-Term Avg
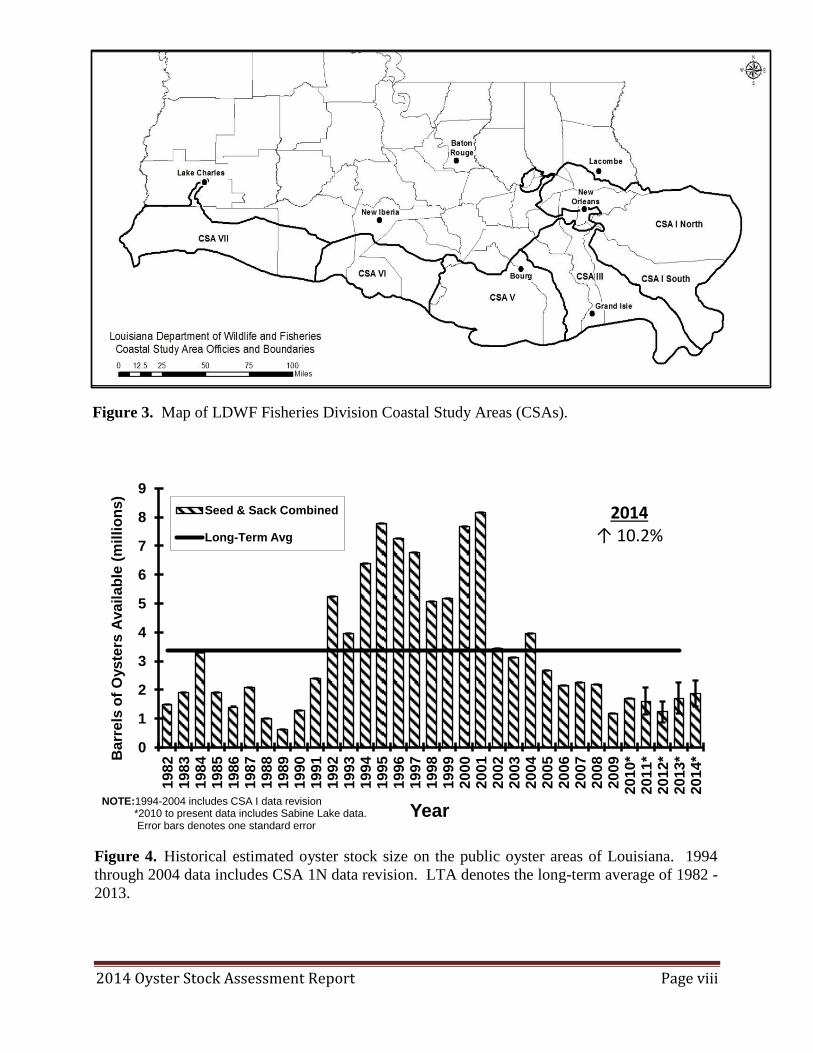
NOTE:1994-2004 includes CSA I data revision *2010 to present data includes Sabine Lake data. Error bars denotes one standard error
2014 ↑ 10.2%
Figure 3. Map of LDWF Fisheries Division Coastal Study Areas (CSAs).
Figure 4. Historical estimated oyster stock size on the public oyster areas of Louisiana. 1994
through 2004 data includes CSA 1N data revision. LTA denotes the long-term average of 1982 -
2013.
2014 Oyster Stock Assessment Report Page ix
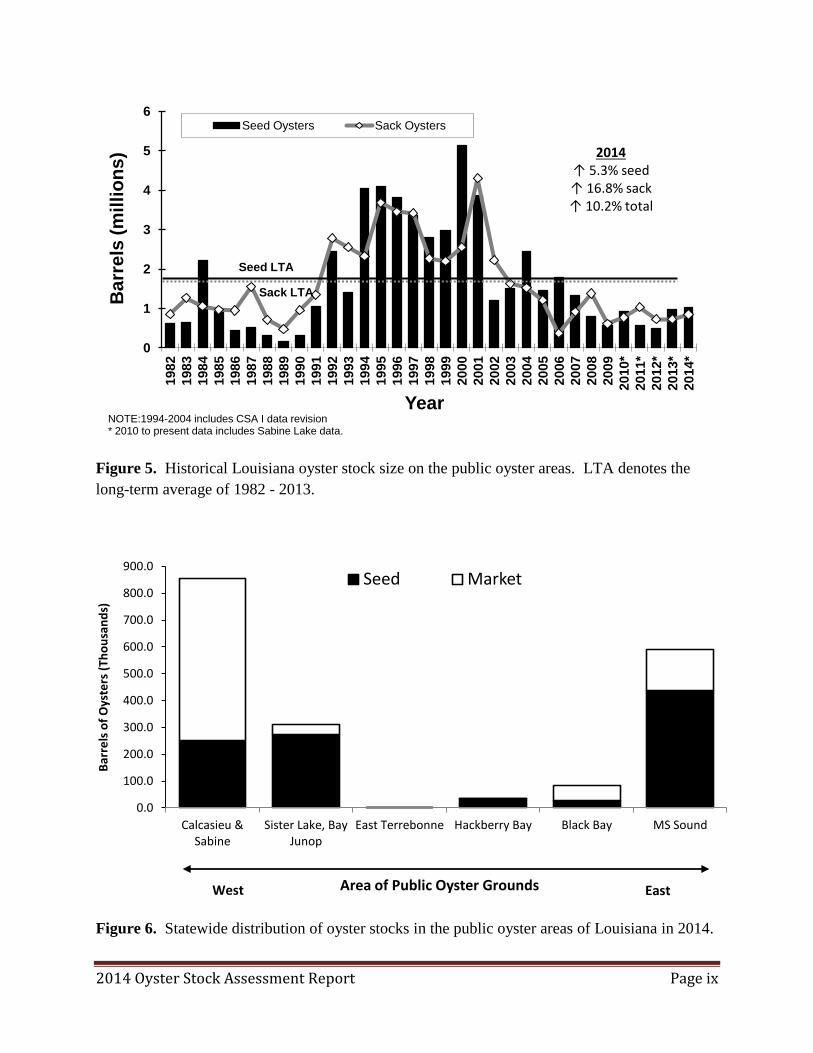
Figure 5. Historical Louisiana oyster stock size on the public oyster areas. LTA denotes the
long-term average of 1982 - 2013.
0
1
2
3
4
5
6
1982
1983
1984
1985
1986
1987
1988
1989
1990
1991
1992
1993
1994
1995
1996
1997
1998
1999
2000
2001
2002
2003
2004
2005
2006
2007
2008
2009
2010*
2011*
2012*
2013*
2014*
Ba
rre
ls (
mil
lio
ns
)
Year
Seed Oysters Sack Oysters
NOTE:1994-2004 includes CSA I data revision * 2010 to present data includes Sabine Lake data.
Seed LTA
Sack LTA
2014 ↑ 5.3% seed ↑ 16.8% sack ↑ 10.2% total
Figure 6. Statewide distribution of oyster stocks in the public oyster areas of Louisiana in 2014.
0.0
100.0
200.0
300.0
400.0
500.0
600.0
700.0
800.0
900.0
Calcasieu & Sabine
Sister Lake, Bay Junop
East Terrebonne Hackberry Bay Black Bay MS Sound
Bar
rels
of
Oys
ters
(Th
ou
san
ds)
Area of Public Oyster Grounds
Seed Market
East West
2014 Oyster Stock Assessment Report Page x
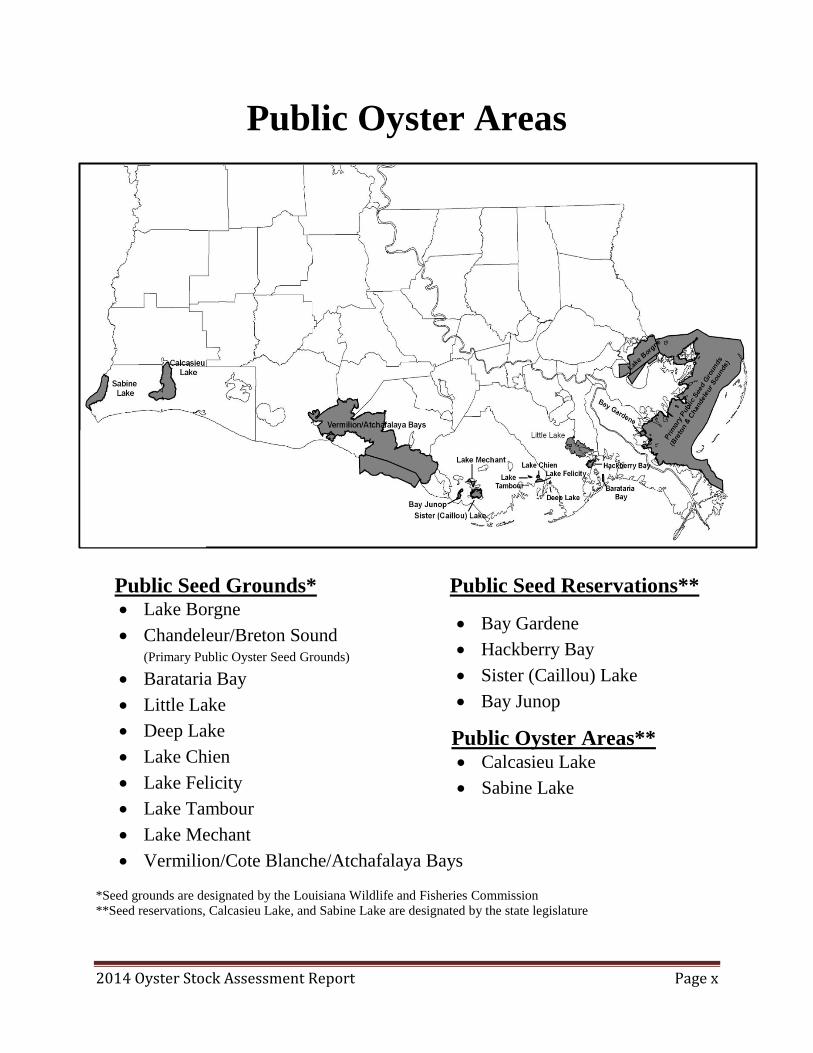
Public Oyster Areas
Public Seed Grounds* Public Seed Reservations** Lake Borgne
Chandeleur/Breton Sound (Primary Public Oyster Seed Grounds)
Barataria Bay
Little Lake
Deep Lake
Lake Chien
Lake Felicity
Lake Tambour
Lake Mechant
Vermilion/Cote Blanche/Atchafalaya Bays
*Seed grounds are designated by the Louisiana Wildlife and Fisheries Commission
**Seed reservations, Calcasieu Lake, and Sabine Lake are designated by the state legislature
Bay Gardene
Hackberry Bay
Sister (Caillou) Lake
Bay Junop
Public Oyster Areas** Calcasieu Lake
Sabine Lake

This page intentionally left blank.
2014 Oyster Stock Assessment – CSA 1 North Page 1-1
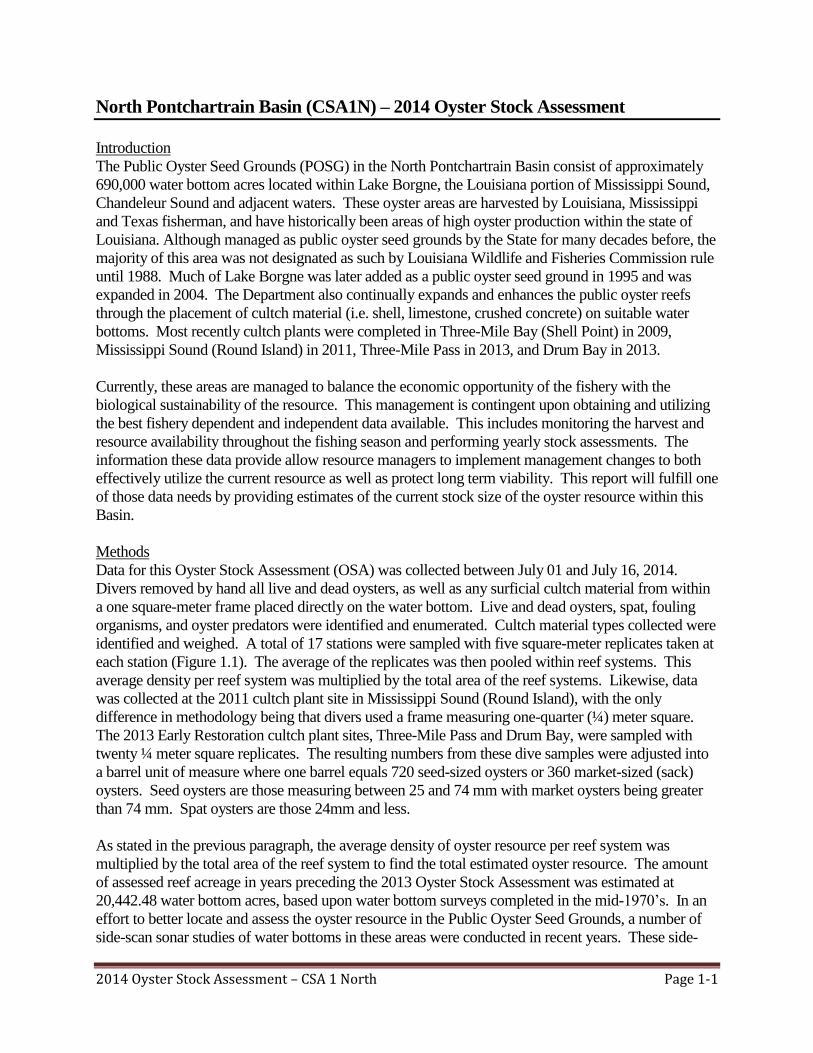
North Pontchartrain Basin (CSA1N) – 2014 Oyster Stock Assessment
Introduction
The Public Oyster Seed Grounds (POSG) in the North Pontchartrain Basin consist of approximately
690,000 water bottom acres located within Lake Borgne, the Louisiana portion of Mississippi Sound,
Chandeleur Sound and adjacent waters. These oyster areas are harvested by Louisiana, Mississippi
and Texas fisherman, and have historically been areas of high oyster production within the state of
Louisiana. Although managed as public oyster seed grounds by the State for many decades before, the
majority of this area was not designated as such by Louisiana Wildlife and Fisheries Commission rule
until 1988. Much of Lake Borgne was later added as a public oyster seed ground in 1995 and was
expanded in 2004. The Department also continually expands and enhances the public oyster reefs
through the placement of cultch material (i.e. shell, limestone, crushed concrete) on suitable water
bottoms. Most recently cultch plants were completed in Three-Mile Bay (Shell Point) in 2009,
Mississippi Sound (Round Island) in 2011, Three-Mile Pass in 2013, and Drum Bay in 2013.
Currently, these areas are managed to balance the economic opportunity of the fishery with the
biological sustainability of the resource. This management is contingent upon obtaining and utilizing
the best fishery dependent and independent data available. This includes monitoring the harvest and
resource availability throughout the fishing season and performing yearly stock assessments. The
information these data provide allow resource managers to implement management changes to both
effectively utilize the current resource as well as protect long term viability. This report will fulfill one
of those data needs by providing estimates of the current stock size of the oyster resource within this
Basin.
Methods
Data for this Oyster Stock Assessment (OSA) was collected between July 01 and July 16, 2014.
Divers removed by hand all live and dead oysters, as well as any surficial cultch material from within
a one square-meter frame placed directly on the water bottom. Live and dead oysters, spat, fouling
organisms, and oyster predators were identified and enumerated. Cultch material types collected were
identified and weighed. A total of 17 stations were sampled with five square-meter replicates taken at
each station (Figure 1.1). The average of the replicates was then pooled within reef systems. This
average density per reef system was multiplied by the total area of the reef systems. Likewise, data
was collected at the 2011 cultch plant site in Mississippi Sound (Round Island), with the only
difference in methodology being that divers used a frame measuring one-quarter (¼) meter square.
The 2013 Early Restoration cultch plant sites, Three-Mile Pass and Drum Bay, were sampled with
twenty ¼ meter square replicates. The resulting numbers from these dive samples were adjusted into
a barrel unit of measure where one barrel equals 720 seed-sized oysters or 360 market-sized (sack)
oysters. Seed oysters are those measuring between 25 and 74 mm with market oysters being greater
than 74 mm. Spat oysters are those 24mm and less.
As stated in the previous paragraph, the average density of oyster resource per reef system was
multiplied by the total area of the reef system to find the total estimated oyster resource. The amount
of assessed reef acreage in years preceding the 2013 Oyster Stock Assessment was estimated at
20,442.48 water bottom acres, based upon water bottom surveys completed in the mid-1970’s. In an
effort to better locate and assess the oyster resource in the Public Oyster Seed Grounds, a number of
side-scan sonar studies of water bottoms in these areas were conducted in recent years. These side-
2014 Oyster Stock Assessment – CSA 1 North Page 1-2
scan studies coupled with historic reef and cultch plant information resulted in a more up-to-date and
realistic designation of productive water bottoms for use in the annual Oyster Stock Assessment
(Table 1.1).
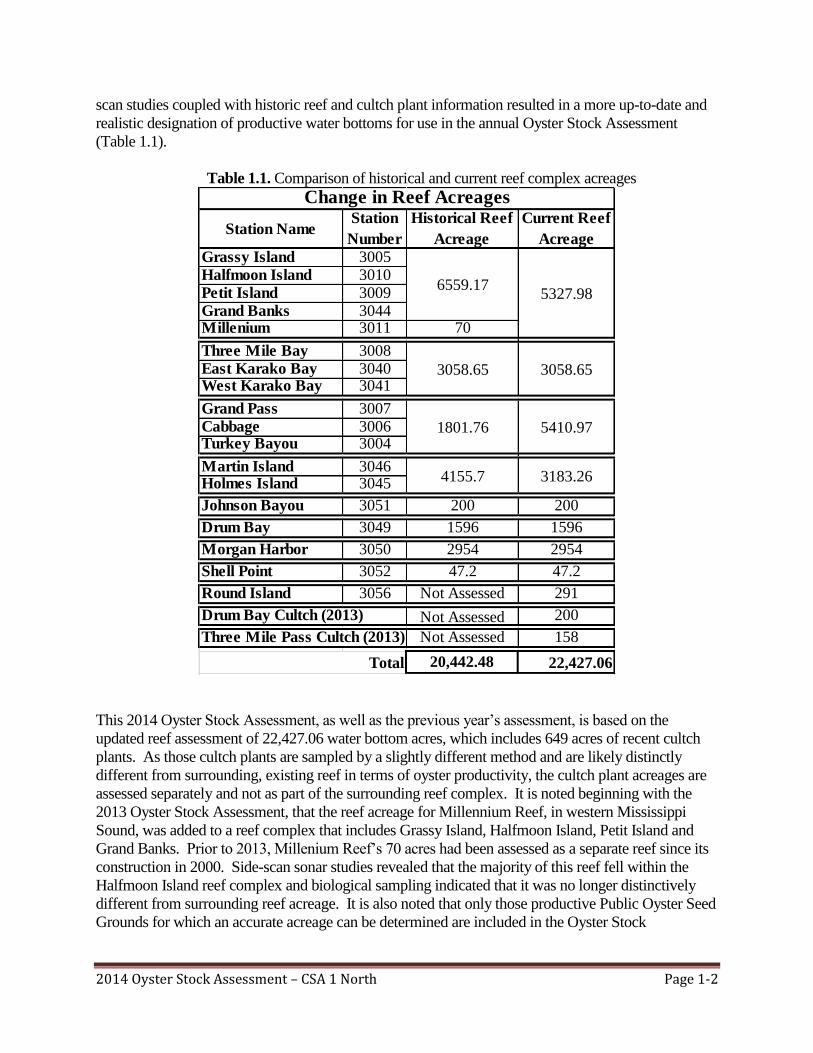
Table 1.1. Comparison of historical and current reef complex acreages
This 2014 Oyster Stock Assessment, as well as the previous year’s assessment, is based on the
updated reef assessment of 22,427.06 water bottom acres, which includes 649 acres of recent cultch
plants. As those cultch plants are sampled by a slightly different method and are likely distinctly
different from surrounding, existing reef in terms of oyster productivity, the cultch plant acreages are
assessed separately and not as part of the surrounding reef complex. It is noted beginning with the
2013 Oyster Stock Assessment, that the reef acreage for Millennium Reef, in western Mississippi
Sound, was added to a reef complex that includes Grassy Island, Halfmoon Island, Petit Island and
Grand Banks. Prior to 2013, Millenium Reef’s 70 acres had been assessed as a separate reef since its
construction in 2000. Side-scan sonar studies revealed that the majority of this reef fell within the
Halfmoon Island reef complex and biological sampling indicated that it was no longer distinctively
different from surrounding reef acreage. It is also noted that only those productive Public Oyster Seed
Grounds for which an accurate acreage can be determined are included in the Oyster Stock
Grassy Island 3005Halfmoon Island 3010Petit Island 3009Grand Banks 3044Millenium 3011 70
Three Mile Bay 3008East Karako Bay 3040West Karako Bay 3041
Grand Pass 3007Cabbage 3006Turkey Bayou 3004
Martin Island 3046Holmes Island 3045
Johnson Bayou 3051 200 200
Drum Bay 3049 1596 1596
Morgan Harbor 3050 2954 2954
Shell Point 3052 47.2 47.2
Round Island 3056 Not Assessed 291
Not Assessed 200
Not Assessed 158
20,442.48 22,427.06Total
Drum Bay Cultch (2013)
Three Mile Pass Cultch (2013)
4155.7 3183.26
Change in Reef AcreagesHistorical Reef
Acreage
6559.17
3058.65
1801.76 5410.97
3058.65
5327.98
Current Reef
AcreageStation Name
Station
Number
2014 Oyster Stock Assessment – CSA 1 North Page 1-3
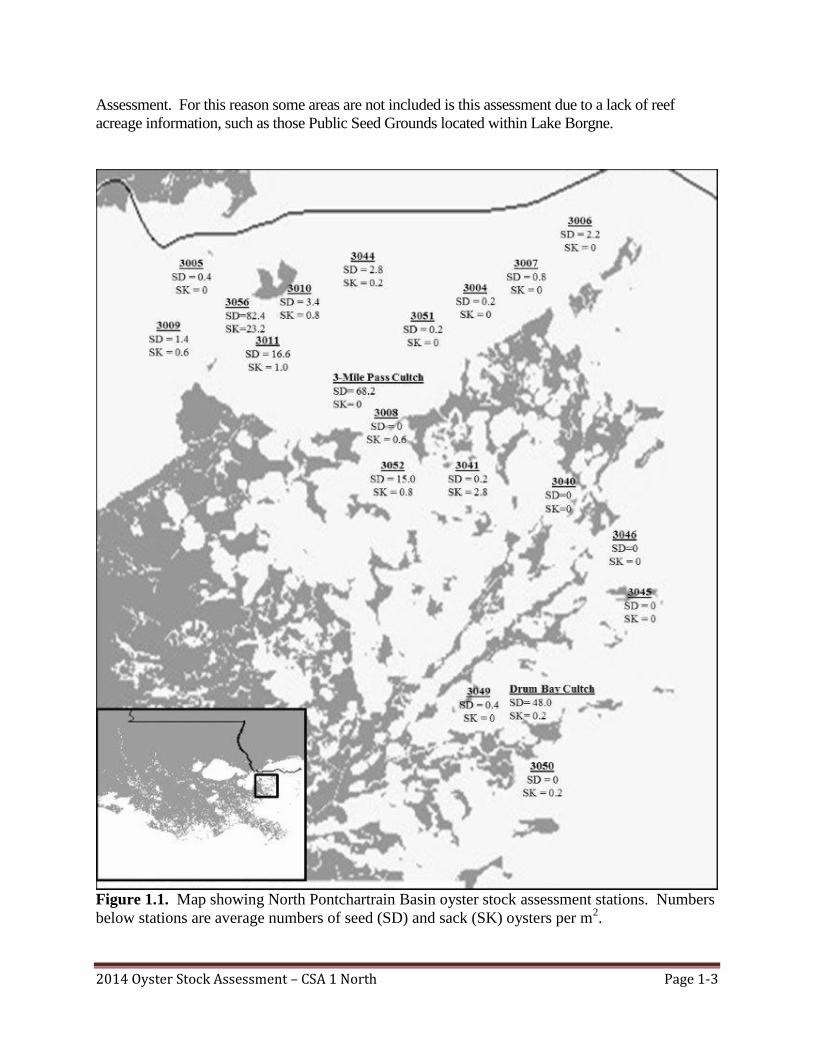
Assessment. For this reason some areas are not included is this assessment due to a lack of reef
acreage information, such as those Public Seed Grounds located within Lake Borgne.
Figure 1.1. Map showing North Pontchartrain Basin oyster stock assessment stations. Numbers
below stations are average numbers of seed (SD) and sack (SK) oysters per m2.
2014 Oyster Stock Assessment – CSA 1 North Page 1-4
Results and Discussion
Seed and Sack Stock
The current stock size is estimated at 438,016 barrels (bbls) of seed-size oysters and 153,520 bbls of
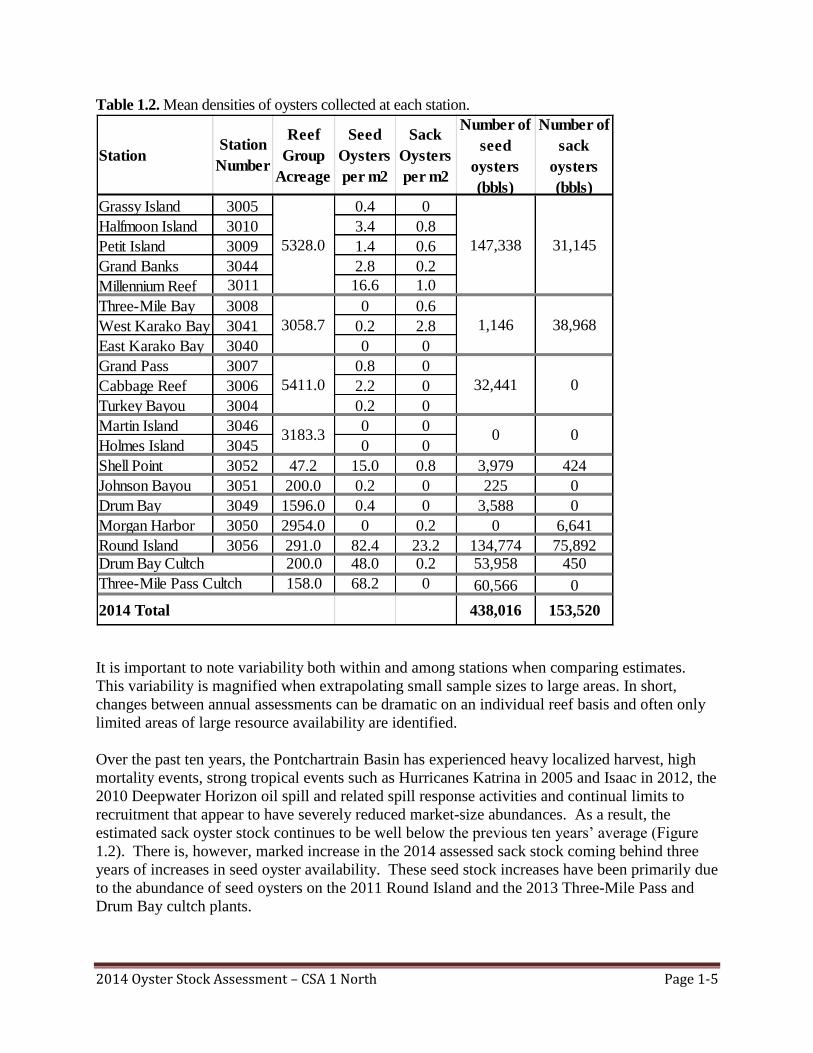
market-size (sack) oysters, for a total of 591,536 bbls of overall stock (Figure 1.2). Compared to
2013, there was a 2.8% increase in the seed-size estimate and a 520.2% increase in the sack-size
estimate. This year’s assessed seed stock is up 39.7% over the previous ten years’ average, while
assessed sack stock is down 30.6% from the previous ten years’ average. This year’s sack stock
estimate is, however, the highest recorded since 2009. Total assessed oyster stock for 2014 is up
31.3% from 2013, and is 10.6% above the previous ten years’ average. It is important to note that
this year’s stock estimate is largely driven by the oyster densities observed on the Round Island
cultch plant in Mississippi Sound, which accounted for an estimated 75,892 bbls (49%) of sack
oysters, and an estimated 134, 774 bbls (31%) of seed oysters. Stock size estimated for the Three-
Mile Pass cultch plant in Mississippi Sound is 60,566 bbls of seed oysters. Stock size estimated for
the cultch plant in Drum Bay is 53,958 bbls of seed oysters and 450 bbls of sack oysters. Oyster
density and abundance were not evenly distributed among areas (Table 1.2). The highest density
estimates of seed stock were found at the three recently established cultch plants. Aside from
these, Millenium Reef and Shell Point showed the highest seed oyster densities among harvested
reefs. The highest density estimates of sack oysters were found at the Round Island, West
Karako, and Millenium sites. Highest overall abundances of seed and sack oysters combined
were at Round Island and the Halfmoon Island reef complex including Grassy Island, Halfmoon
Island, Petit Island, Grand Banks and Millenium Reef (Figure 1.1, Table 1.2).
2014 Oyster Stock Assessment – CSA 1 North Page 1-5
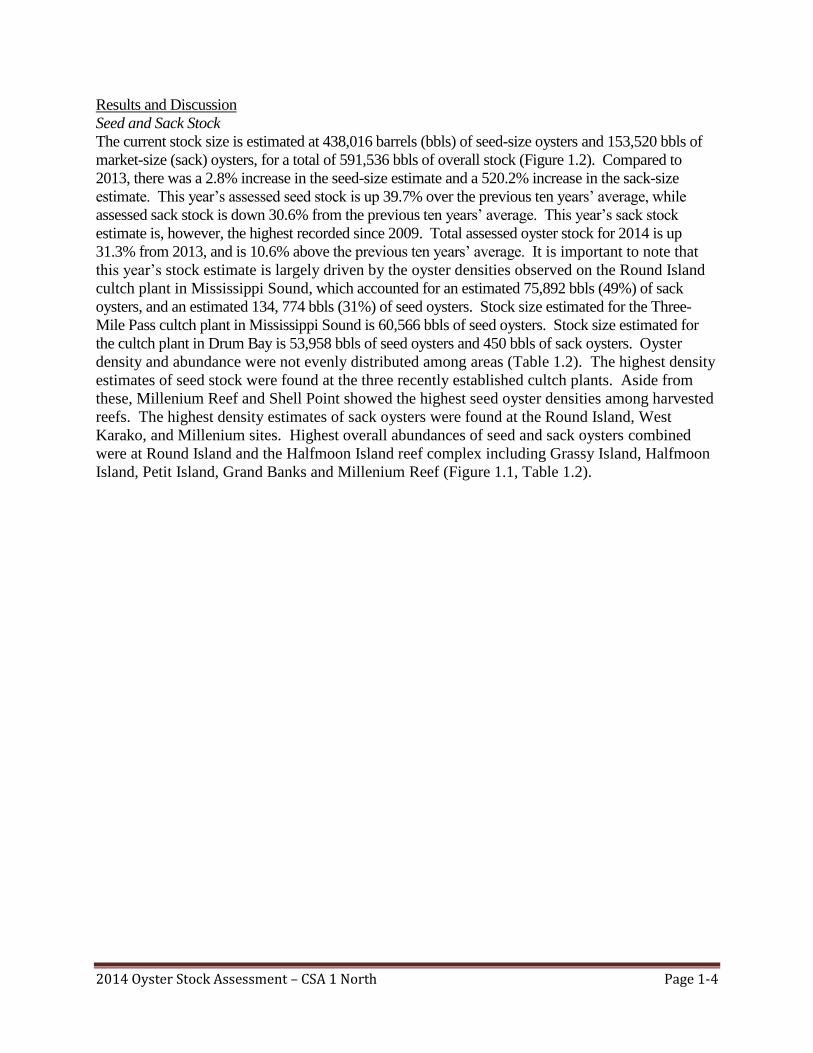
Table 1.2. Mean densities of oysters collected at each station.
It is important to note variability both within and among stations when comparing estimates.
This variability is magnified when extrapolating small sample sizes to large areas. In short,
changes between annual assessments can be dramatic on an individual reef basis and often only
limited areas of large resource availability are identified.
Over the past ten years, the Pontchartrain Basin has experienced heavy localized harvest, high
mortality events, strong tropical events such as Hurricanes Katrina in 2005 and Isaac in 2012, the
2010 Deepwater Horizon oil spill and related spill response activities and continual limits to
recruitment that appear to have severely reduced market-size abundances. As a result, the
estimated sack oyster stock continues to be well below the previous ten years’ average (Figure
1.2). There is, however, marked increase in the 2014 assessed sack stock coming behind three
years of increases in seed oyster availability. These seed stock increases have been primarily due
to the abundance of seed oysters on the 2011 Round Island and the 2013 Three-Mile Pass and
Drum Bay cultch plants.
StationStation
Number
Reef
Group
Acreage
Seed
Oysters
per m2
Sack
Oysters
per m2
Number of
seed
oysters
(bbls)
Number of
sack
oysters
(bbls)
Grassy Island 3005 0.4 0
Halfmoon Island 3010 3.4 0.8
Petit Island 3009 1.4 0.6
Grand Banks 3044 2.8 0.2
Millennium Reef 3011 16.6 1.0
Three-Mile Bay 3008 0 0.6
West Karako Bay 3041 0.2 2.8
East Karako Bay 3040 0 0
Grand Pass 3007 0.8 0
Cabbage Reef 3006 2.2 0
Turkey Bayou 3004 0.2 0
Martin Island 3046 0 0
Holmes Island 3045 0 0
Shell Point 3052 47.2 15.0 0.8 3,979 424
Johnson Bayou 3051 200.0 0.2 0 225 0
Drum Bay 3049 1596.0 0.4 0 3,588 0
Morgan Harbor 3050 2954.0 0 0.2 0 6,641
Round Island 3056 291.0 82.4 23.2 134,774 75,892200.0 48.0 0.2 53,958 450
158.0 68.2 0 60,566 0
438,016 153,5202014 Total
Three-Mile Pass Cultch
5328.0 147,338 31,145
3058.7 1,146 38,968
5411.0 32,441 0
3183.3 0 0
Drum Bay Cultch
2014 Oyster Stock Assessment – CSA 1 North Page 1-6
Figure 1.2. Current and historical Stock Assessment (seed and sack oysters) values. Horizontal lines
represent the previous ten-years’ seed and sack averages.
Spat Production
Live spat were observed at 8 of the 20 sites sampled during this assessment. At these sites, mean
densities ranged from 0.2 to 3.8 individuals per m2 with the maximum value occurring at the Three-
Mile Pass cultch plant. Occurrence of spat oysters was once again down substantially from the
previous year’s assessment. Overall, spat densities were low with the exception of Millenium Reef,
Cabbage Reef and the Three-Mile Pass cultch plant. Based on previous years’ data, annual square-
meter samples may occur between seasonal spawning events in some areas. It is important to note
that spat numbers are biased by the amount of substrate collected in a given sample. However, this
continues an observed lack of spat set over several of the reef areas during the spring spawning events.
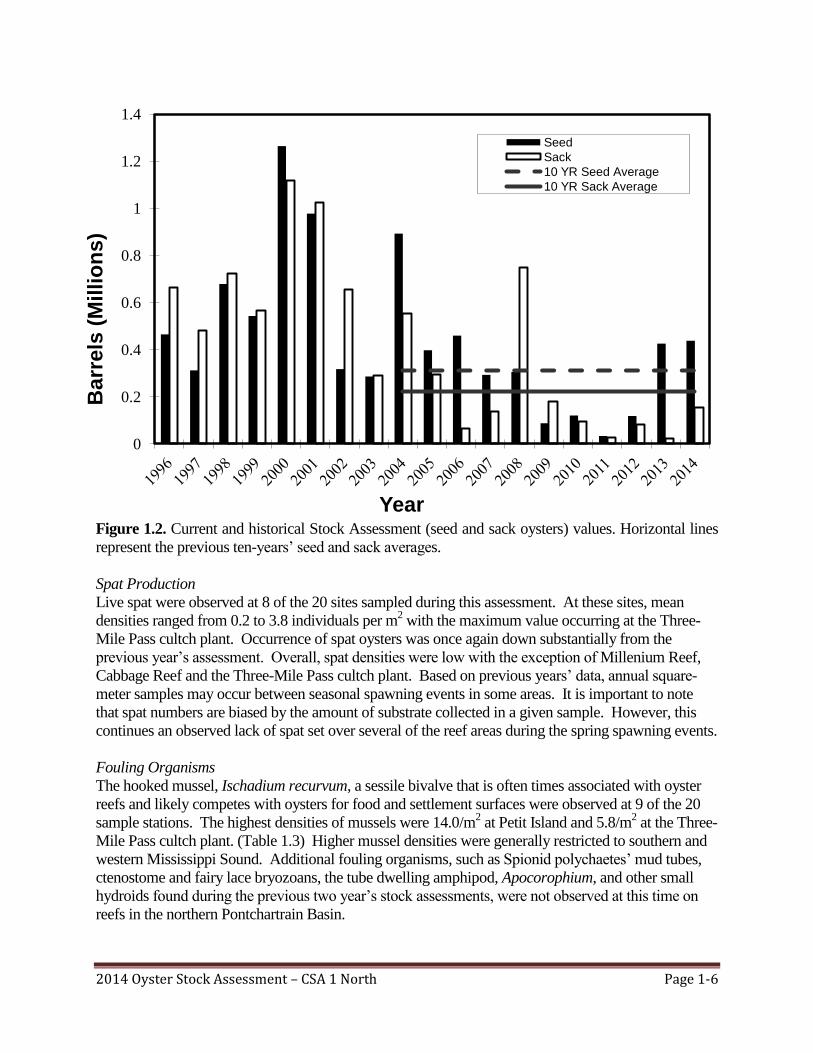
Fouling Organisms
The hooked mussel, Ischadium recurvum, a sessile bivalve that is often times associated with oyster
reefs and likely competes with oysters for food and settlement surfaces were observed at 9 of the 20
sample stations. The highest densities of mussels were 14.0/m2 at Petit Island and 5.8/m
2 at the Three-
Mile Pass cultch plant. (Table 1.3) Higher mussel densities were generally restricted to southern and
western Mississippi Sound. Additional fouling organisms, such as Spionid polychaetes’ mud tubes,
ctenostome and fairy lace bryozoans, the tube dwelling amphipod, Apocorophium, and other small
hydroids found during the previous two year’s stock assessments, were not observed at this time on
reefs in the northern Pontchartrain Basin.
0
0.2
0.4
0.6
0.8
1
1.2
1.4 B
arr
els
(M
illio
ns)
Year
Seed
Sack
10 YR Seed Average
10 YR Sack Average
2014 Oyster Stock Assessment – CSA 1 North Page 1-7
Table 1.3. Mean density of the hooked mussel, Ischadium recurvum, and the southern oyster
drill, Stramonita haemastoma, at each station.
Station I. recurvum
density/(m2)
S. haemastoma density/(m2)
Grassy Island 0 0
Petit Island 14.0 0
Halfmoon Island 5 0
Grand Banks 0 0
Millenium Reef 0 0
Three-Mile Bay 1.2 0
East Karako Bay 0 0
West Karako Bay 0 0
Grand Pass 0 0
Turkey Bayou 1.8 0
Cabbage Reef 0 0
Johnson Bayou 0.2 0
Shell Point 4.2 0
Drum Bay 0 0
Morgan Harbor 0 0
Martin Island 0 0
Holmes Island 0 0
Round Island 3.2 0
Drum Bay Cultch 0.2 0
3-Mile Pass Cultch 5.8 0
Oyster Predators and Disease
The southern oyster drill (Stramonita haemastoma) is a predatory marine gastropod known to prey on
oysters and other sessile animals using a small tooth-like scraping organ called a radula to bore a hole
through the oyster shell. No oyster drills were collected during this year’s sampling event, nor were
any oyster drill egg casings observed. No stone crabs, Menippe adinia, or blue crabs, Callinectes spp.,
were collected in the square meter samples. Other Xanthid crabs were noted in the samples that
contained shell for substrate.
Dermo, Perkinsus marinus, a protozoan parasite that infects live oyster tissue, is known to cause
extensive oyster mortalities especially under high salinity and water temperature conditions. Oyster
tissue samples to be tested for presence of this parasite were collected at two sites in North
Pontchartrain Basin, Cabbage Reef and Three-Mile Bay. Results of the Dermo tests are presented in
another section of this report.
2014 Oyster Stock Assessment – CSA 1 North Page 1-8
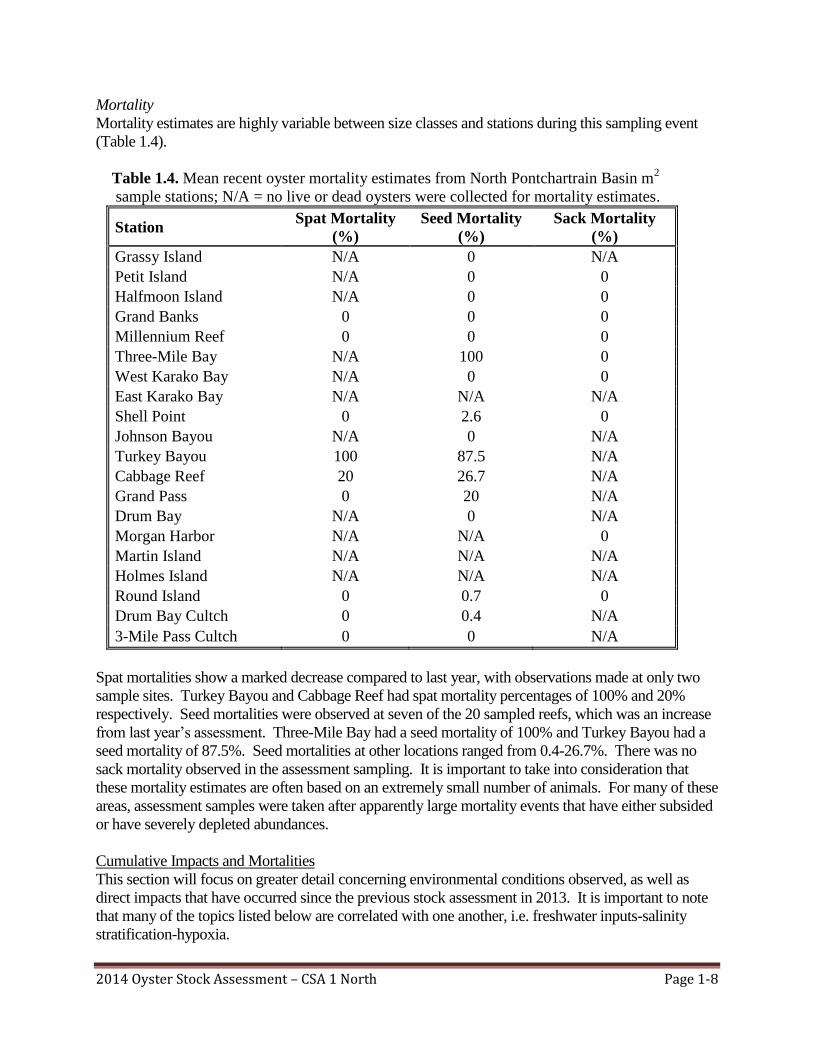
Mortality
Mortality estimates are highly variable between size classes and stations during this sampling event
(Table 1.4).
Table 1.4. Mean recent oyster mortality estimates from North Pontchartrain Basin m2
sample stations; N/A = no live or dead oysters were collected for mortality estimates.
Station Spat Mortality
(%)
Seed Mortality
(%)
Sack Mortality
(%)
Grassy Island N/A 0 N/A
Petit Island N/A 0 0
Halfmoon Island N/A 0 0
Grand Banks 0 0 0
Millennium Reef 0 0 0
Three-Mile Bay N/A 100 0
West Karako Bay N/A 0 0
East Karako Bay N/A N/A N/A
Shell Point 0 2.6 0
Johnson Bayou N/A 0 N/A
Turkey Bayou 100 87.5 N/A
Cabbage Reef 20 26.7 N/A
Grand Pass 0 20 N/A
Drum Bay N/A 0 N/A
Morgan Harbor N/A N/A 0
Martin Island N/A N/A N/A
Holmes Island N/A N/A N/A
Round Island 0 0.7 0
Drum Bay Cultch 0 0.4 N/A
3-Mile Pass Cultch 0 0 N/A
Spat mortalities show a marked decrease compared to last year, with observations made at only two
sample sites. Turkey Bayou and Cabbage Reef had spat mortality percentages of 100% and 20%
respectively. Seed mortalities were observed at seven of the 20 sampled reefs, which was an increase
from last year’s assessment. Three-Mile Bay had a seed mortality of 100% and Turkey Bayou had a
seed mortality of 87.5%. Seed mortalities at other locations ranged from 0.4-26.7%. There was no
sack mortality observed in the assessment sampling. It is important to take into consideration that
these mortality estimates are often based on an extremely small number of animals. For many of these
areas, assessment samples were taken after apparently large mortality events that have either subsided
or have severely depleted abundances.
Cumulative Impacts and Mortalities
This section will focus on greater detail concerning environmental conditions observed, as well as
direct impacts that have occurred since the previous stock assessment in 2013. It is important to note
that many of the topics listed below are correlated with one another, i.e. freshwater inputs-salinity
stratification-hypoxia.
2014 Oyster Stock Assessment – CSA 1 North Page 1-9
Deepwater Horizon Oil Spill and Related Response Actions
The 2010 Deepwater Horizon oil spill released millions of barrels of oil into the Gulf of Mexico
affecting the Louisiana coastline. In direct response to the oil spill, in an effort to keep incoming oil
from the Gulf out of Louisiana’s sensitive marshes and estuaries, freshwater was released from
diversions and siphons along the Mississippi River. The impacts of oil and freshwater diversions on
oyster health and habitat continue to be of concern. Assessments on the direct and indirect impacts to
Louisiana’s environment, including oysters and oyster habitat, from oil and response actions are
ongoing through the Deepwater Horizon Natural Resource Damage Assessment (NRDA).
Tropical and Climatic Events
There were no significant tropical systems impacting the public oyster seed grounds in the
Pontchartrain Basin during this assessment period. The area has experienced monthly rainfall
amounts well above the average for the months of February through June of 2014.
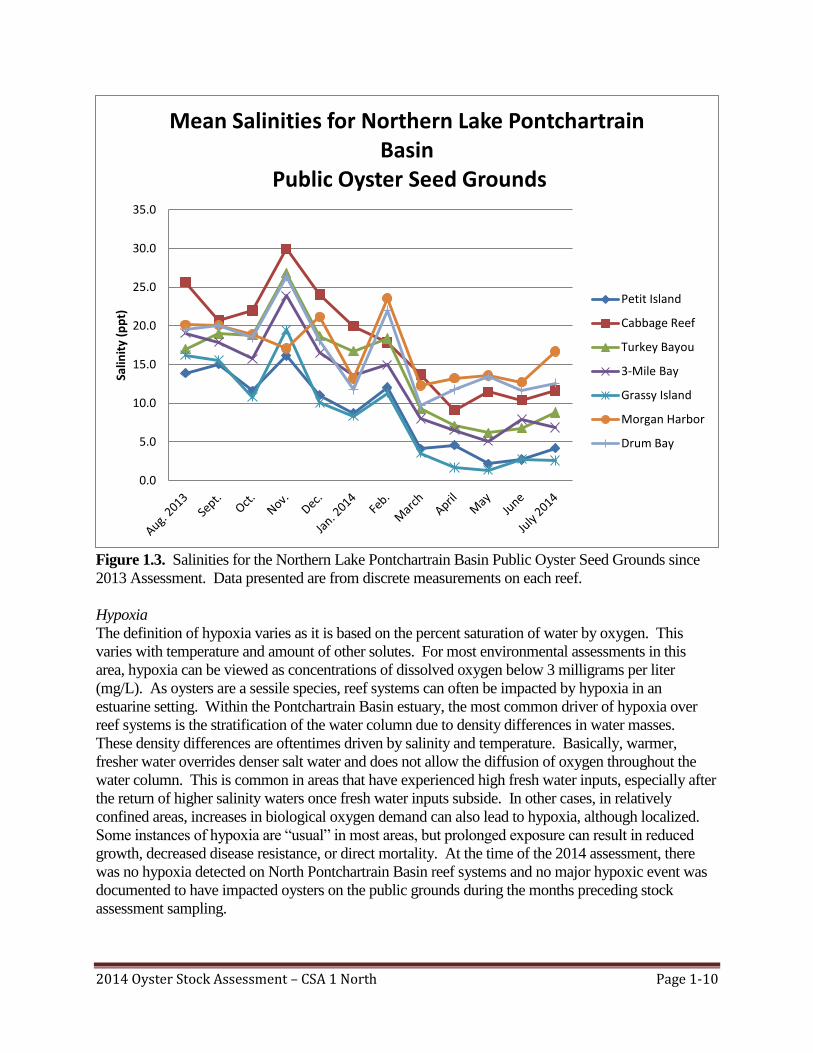
The Pearl River system provided a large volume of fresh water into the western Mississippi Sound
during the months of February through June 2014. This event depressed the salinities on the reef
systems in the Mississippi Sound. The salinities at Grassy Island and Petit Island were consistently
less than 5 parts per thousand (ppt) for the months of March through July 2014 (Figure 1.3).
Freshets
The Pearl River system had a much higher than normal discharge rate in the winter and spring months
of 2014. The POSG in western Mississippi Sound are impacted by this higher discharge rate. This is
evidenced by salinities being recorded as low as 1.4ppt at Grassy Island and 2.2ppt at Petit Island
during the month of May. These two reefs experienced salinities below 5ppt for the months of March
through July 2014. Although these values are discrete measurements, similar low salinity values were
also collected by non-related observations, as well as data derived from continuous salinity recorders
within the area.
While freshets often provide benefits to the reef system, either by reducing disease or predation, or by
enhancing cultch opportunities via the empty shells of recently dead oysters, there are often other
cumulative impacts that may affect recovery from any one event. The impacts and subsequent
recovery are also modified by not only the magnitude of a freshet, but perhaps also by the duration
and timing.
2014 Oyster Stock Assessment – CSA 1 North Page 1-10
Figure 1.3. Salinities for the Northern Lake Pontchartrain Basin Public Oyster Seed Grounds since
2013 Assessment. Data presented are from discrete measurements on each reef.
Hypoxia
The definition of hypoxia varies as it is based on the percent saturation of water by oxygen. This
varies with temperature and amount of other solutes. For most environmental assessments in this
area, hypoxia can be viewed as concentrations of dissolved oxygen below 3 milligrams per liter
(mg/L). As oysters are a sessile species, reef systems can often be impacted by hypoxia in an
estuarine setting. Within the Pontchartrain Basin estuary, the most common driver of hypoxia over
reef systems is the stratification of the water column due to density differences in water masses.
These density differences are oftentimes driven by salinity and temperature. Basically, warmer,
fresher water overrides denser salt water and does not allow the diffusion of oxygen throughout the
water column. This is common in areas that have experienced high fresh water inputs, especially after
the return of higher salinity waters once fresh water inputs subside. In other cases, in relatively
confined areas, increases in biological oxygen demand can also lead to hypoxia, although localized.
Some instances of hypoxia are “usual” in most areas, but prolonged exposure can result in reduced
growth, decreased disease resistance, or direct mortality. At the time of the 2014 assessment, there
was no hypoxia detected on North Pontchartrain Basin reef systems and no major hypoxic event was
documented to have impacted oysters on the public grounds during the months preceding stock
assessment sampling.
0.0
5.0
10.0
15.0
20.0
25.0
30.0
35.0
Salin
ity
(pp
t)
Mean Salinities for Northern Lake Pontchartrain Basin
Public Oyster Seed Grounds
Petit Island
Cabbage Reef
Turkey Bayou
3-Mile Bay
Grassy Island
Morgan Harbor
Drum Bay
2014 Oyster Stock Assessment – CSA 1 North Page 1-11
Sedimentation/Subsidence
Sedimentation can affect the reef either through direct mortality (burial) or through reduced growth
and reproduction (both production and clean places for larval attachment). During the 2014
assessment, divers noted on many reefs, especially in the Mississippi Sound and Three-Mile Bay areas
(with the exception of the 2013 cultch plant in Mississippi Sound), that much of the cultch had a
covering of silt or was completely buried. Both of these conditions can limit the amount of suitable
substrate available for larval settlement.
Subsidence of the reefs is usually balanced by reef accretion or growth. If no appreciable shell is
added over a period of time, the reefs, especially those in less than optimal environments, will subside
to the point of shell burial. The lowering of the reef profile also subjects associated organisms to more
frequent hypoxia events as well as changing the local water flow and sedimentation process.
Cultch Condition
Any successful spat set is dependent upon clean, stable cultch for larval attachment. Aside from recent
cultch plants, the condition of the cultch and live oyster shell within the North Pontchartrain Basin
continually appears to be poor. As noted above, many areas are buried or covered with a layer of silt.
On some reefs, the addition of shell has become so infrequent that the cultch on hand is being
transformed into small “hash” particles that may not provide optimal substrate for larval attachment.
2013/2014 Oyster Season Summary
Several tools are used by research personnel to estimate harvest and associated activities by the
commercial oyster industry during the harvest season.
Harvest estimates are obtained by monitoring the users and by obtaining fishery dependent data.
Fishermen are contacted while fishing and asked to provide estimates of current and past catch and
effort as well as an estimate of future effort. This data is obtained weekly during the oyster season and
is used to estimate harvest in a particular reef complex. Harvest data is also obtained via the trip ticket
system in place for this fishery. However, trip ticket data is consolidated by geographic region and is
considered preliminary until well after the season concludes, and provides a limited resolution.
Fishery independent methods are used to obtain the health and condition of the resource both prior to
and during the final stages of the fishing season. Techniques used in these assessments are oyster
dredging and visual census. It is important to note that both fishery dependent and independent
sources are subject to several large biases and should be used in conjunction to provide a better
estimate of the available resource.
The season within the North Pontchartrain Basin oyster seed grounds opened on October 15, 2013 and
closed on April 30, 2014. During this time period, the total harvest estimates for the grounds, as
determined by harvest surveys (boarding reports) were 3,685 barrels of seed-sized oysters and 4,016
sacks of market-sized oysters for a combined total of 5,693 barrels of oysters. This represents a 32.4%
increase over the 2012/2013 harvest of 4,300 bbls. When 2013/2014 harvest estimates within stock-
assessed areas are compared with the 2013 stock assessments, there was an estimated utilization of
0.9% of the seed resource, 8.1% of the sack resource, and 1.3% utilization overall. In a general spatial
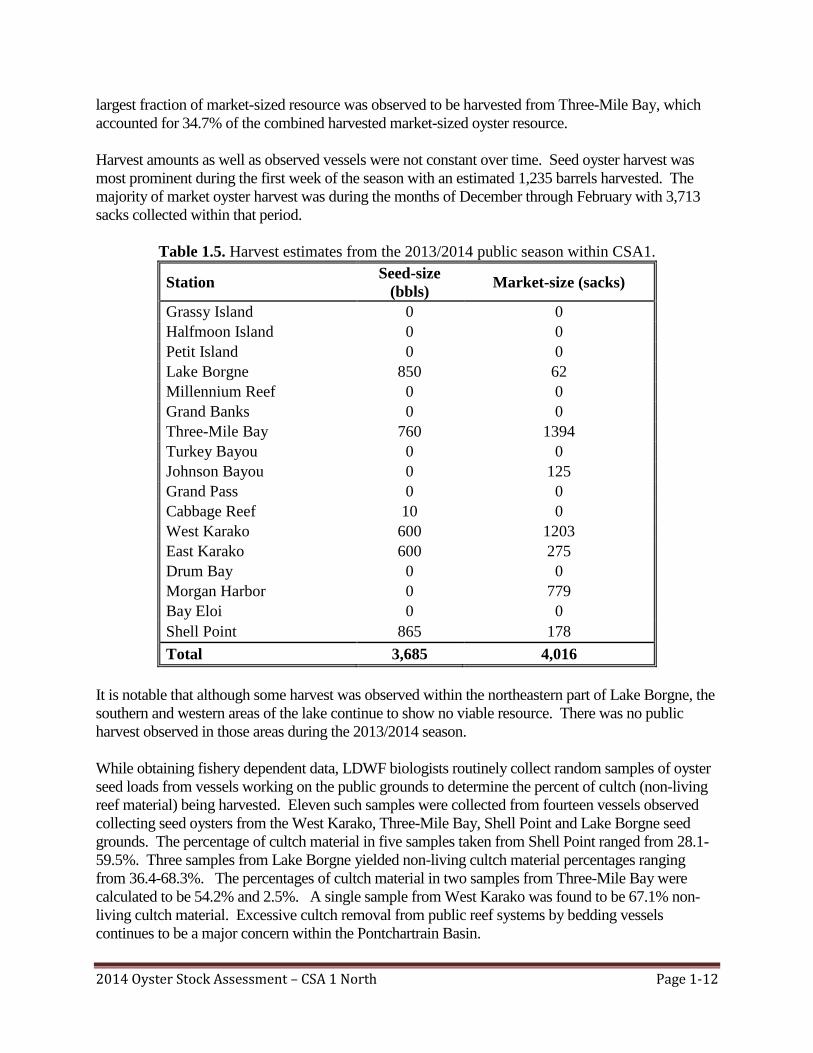
context, this harvest was variable throughout the Basin (Table 1.5). The largest fraction of observed
seed harvest was from Shell Point, as 23.5% of the total seed harvest occurred on this reef. The
2014 Oyster Stock Assessment – CSA 1 North Page 1-12
largest fraction of market-sized resource was observed to be harvested from Three-Mile Bay, which
accounted for 34.7% of the combined harvested market-sized oyster resource.
Harvest amounts as well as observed vessels were not constant over time. Seed oyster harvest was
most prominent during the first week of the season with an estimated 1,235 barrels harvested. The
majority of market oyster harvest was during the months of December through February with 3,713
sacks collected within that period.
Table 1.5. Harvest estimates from the 2013/2014 public season within CSA1.
Station Seed-size
(bbls) Market-size (sacks)
Grassy Island 0 0
Halfmoon Island 0 0
Petit Island 0 0
Lake Borgne 850 62
Millennium Reef 0 0
Grand Banks 0 0
Three-Mile Bay 760 1394
Turkey Bayou 0 0
Johnson Bayou 0 125
Grand Pass 0 0
Cabbage Reef 10 0
West Karako 600 1203
East Karako 600 275
Drum Bay 0 0
Morgan Harbor 0 779
Bay Eloi 0 0
Shell Point 865 178
Total 3,685 4,016
It is notable that although some harvest was observed within the northeastern part of Lake Borgne, the
southern and western areas of the lake continue to show no viable resource. There was no public
harvest observed in those areas during the 2013/2014 season.
While obtaining fishery dependent data, LDWF biologists routinely collect random samples of oyster
seed loads from vessels working on the public grounds to determine the percent of cultch (non-living
reef material) being harvested. Eleven such samples were collected from fourteen vessels observed
collecting seed oysters from the West Karako, Three-Mile Bay, Shell Point and Lake Borgne seed
grounds. The percentage of cultch material in five samples taken from Shell Point ranged from 28.1-
59.5%. Three samples from Lake Borgne yielded non-living cultch material percentages ranging
from 36.4-68.3%. The percentages of cultch material in two samples from Three-Mile Bay were
calculated to be 54.2% and 2.5%. A single sample from West Karako was found to be 67.1% non-
living cultch material. Excessive cultch removal from public reef systems by bedding vessels
continues to be a major concern within the Pontchartrain Basin.
2014 Oyster Stock Assessment Report – CSA 1 South Page 2-1
South Pontchartrain Basin (CSA 1S) - 2014 Oyster Stock Assessment
Introduction
The public oyster seed grounds in the South Pontchartrain Basin (formerly Coastal Study Area 2)
consist of approximately 300,000 water bottom acres located from the Mississippi River Gulf
Outlet (MRGO) southward to South Pass in the Mississippi River delta, and eastward from the
eastern extent of private leases east of the Mississippi River to the Breton National Wildlife
Refuge. These seed grounds include Bay Gardene Public Oyster Seed Reservation, as well as
areas designated as “sack harvest only” in Lake Fortuna, Lake Machias, and Bay Long.
Historically, this area has provided seed- and market-sized oysters for oyster fishermen from
Louisiana, Mississippi and Texas. Hydrology in the area is influenced at high Mississippi River
stages by discharge through gaps in the Mississippi River levee south of Pointe a la Hache, such
as the Bohemia spillway and Mardi Gras Pass; discharge from the Caernarvon and Bayou
Lamoque fresh water diversion structures; and main-stem river distributaries in the southern
portion of the Basin.
The Department of Wildlife and Fisheries continually expands and enhances the public oyster
reefs through the placement of cultch material (i.e. shell, limestone, crushed concrete) on suitable
water bottoms. Numerous cultch plants have been constructed throughout this Basin since 1917,
including sites in Bay Gardene and Black Bay. Most recently cultch plants were completed near
Stone Island in 2009 and California Bay in 2011, as well as in Bay Crabe and Lake Fortuna in
2012 as part of the Deepwater Horizon Oil Spill Natural Resource Damage Assessment (NRDA)
Early Restoration - Louisiana Oyster Cultch Project.
Currently, this area is managed to balance the economic opportunity of the fishery with the
biological sustainability of the resource. This management is contingent upon obtaining and
utilizing the best fishery dependent and independent data available. This includes monitoring the
harvest and resource availability throughout the fishing season and performing yearly stock
assessments. The information these data provide allow resource managers to implement
management changes to both effectively utilize the current resource as well as protect long term
viability. This report will fulfill one of those data needs by providing estimates of the current
stock size of the oyster resource within this Basin.
Methods
Data was collected between July 01 and July 16, 2014. Divers removed by hand all live and
dead oysters, as well as any surficial cultch material from within a one square-meter frame
randomly placed on the water bottom. Live and dead oysters, spat, fouling organisms, and oyster
predators were identified and enumerated. A total of 30 stations were sampled with five square-
meter replicates taken at each station (Figure 2.1). The average of the replicates was then pooled
2014 Oyster Stock Assessment Report – CSA 1 South Page 2-2
within reef systems. This average density per reef system was multiplied by the total area of the
reef systems. Likewise, data was collected at the 2011 California Bay cultch plant, with the only
difference in methods being that divers used a frame measuring ¼ meter square. The NRDA
Early Restoration cultch plants in Bay Crabe and Lake Fortuna were each sampled with twenty ¼
meter square replicates. The resulting numbers were adjusted into a barrel unit of measure where
one barrel equals 720 seed-sized oysters or 360 market-sized (sack) oysters. Seed oysters are
those measuring between 25 and 74 mm with market oysters being greater than 74 mm. Spat
oysters are those 24mm and less.
2014 Oyster Stock Assessment Report – CSA 1 South Page 2-3
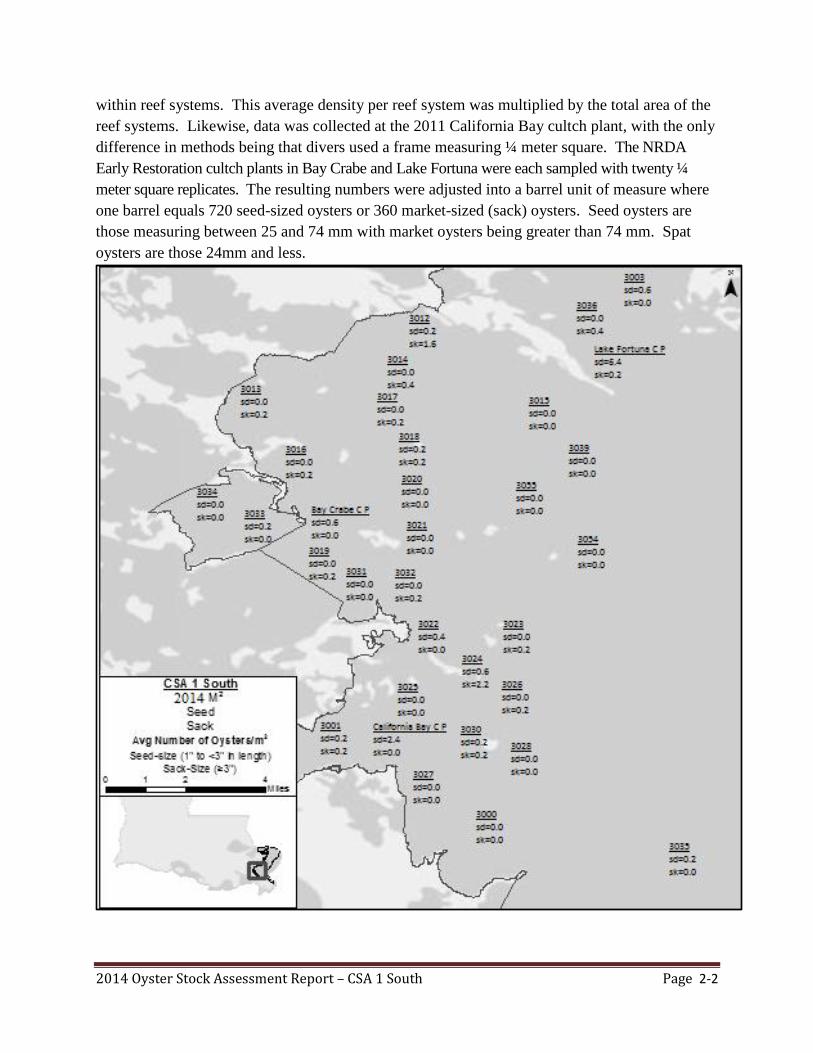
Figure 2.1. Map showing stock assessment sample stations within Coastal Study Area 1-South.
Station numbers are in bold and data below indicate the average number of seed (SD) and sack
(SK) oysters collected per sample at that station.
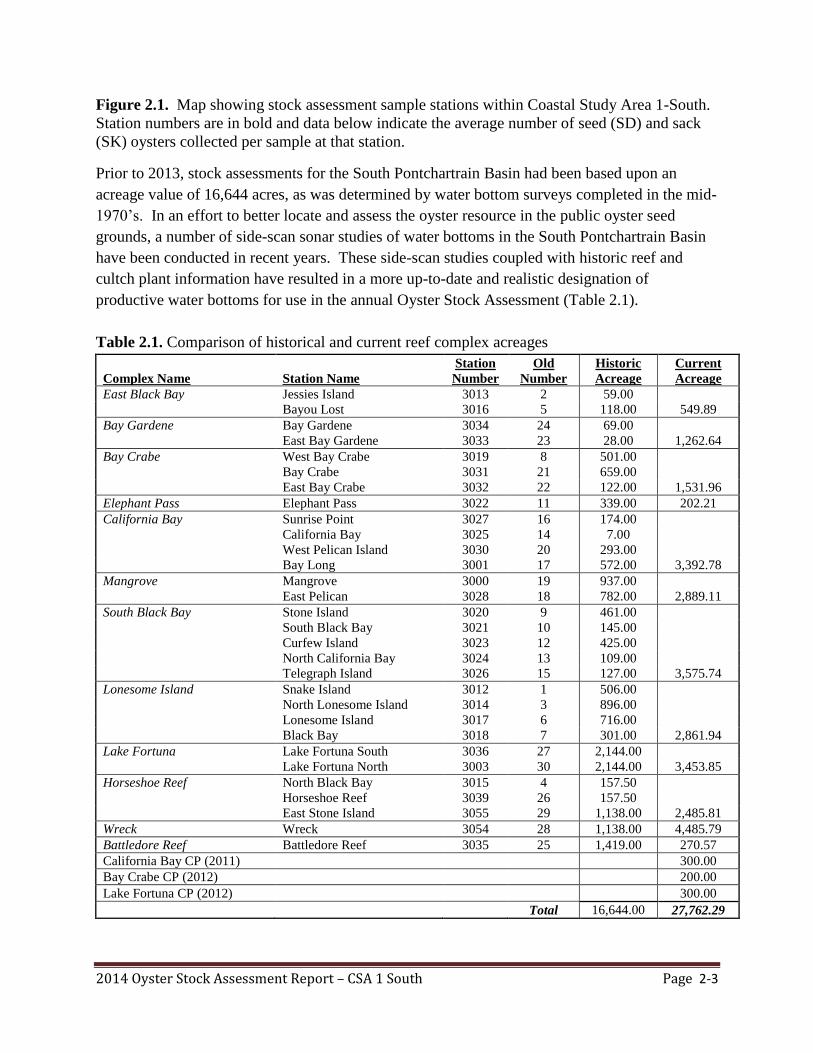
Prior to 2013, stock assessments for the South Pontchartrain Basin had been based upon an
acreage value of 16,644 acres, as was determined by water bottom surveys completed in the mid-
1970’s. In an effort to better locate and assess the oyster resource in the public oyster seed
grounds, a number of side-scan sonar studies of water bottoms in the South Pontchartrain Basin
have been conducted in recent years. These side-scan studies coupled with historic reef and
cultch plant information have resulted in a more up-to-date and realistic designation of
productive water bottoms for use in the annual Oyster Stock Assessment (Table 2.1).
Table 2.1. Comparison of historical and current reef complex acreages
Complex Name Station Name
Station
Number
Old
Number
Historic
Acreage
Current
Acreage
East Black Bay Jessies Island 3013 2 59.00
Bayou Lost 3016 5 118.00 549.89
Bay Gardene Bay Gardene 3034 24 69.00
East Bay Gardene 3033 23 28.00 1,262.64
Bay Crabe West Bay Crabe 3019 8 501.00
Bay Crabe 3031 21 659.00
East Bay Crabe 3032 22 122.00 1,531.96
Elephant Pass Elephant Pass 3022 11 339.00 202.21
California Bay Sunrise Point 3027 16 174.00
California Bay 3025 14 7.00
West Pelican Island 3030 20 293.00
Bay Long 3001 17 572.00 3,392.78
Mangrove Mangrove 3000 19 937.00
East Pelican 3028 18 782.00 2,889.11
South Black Bay Stone Island 3020 9 461.00
South Black Bay 3021 10 145.00
Curfew Island 3023 12 425.00
North California Bay 3024 13 109.00
Telegraph Island 3026 15 127.00 3,575.74
Lonesome Island Snake Island 3012 1 506.00
North Lonesome Island 3014 3 896.00
Lonesome Island 3017 6 716.00
Black Bay 3018 7 301.00 2,861.94
Lake Fortuna Lake Fortuna South 3036 27 2,144.00
Lake Fortuna North 3003 30 2,144.00 3,453.85
Horseshoe Reef North Black Bay 3015 4 157.50
Horseshoe Reef 3039 26 157.50
East Stone Island 3055 29 1,138.00 2,485.81
Wreck Wreck 3054 28 1,138.00 4,485.79
Battledore Reef Battledore Reef 3035 25 1,419.00 270.57
California Bay CP (2011) 300.00
Bay Crabe CP (2012) 200.00
Lake Fortuna CP (2012) 300.00
Total 16,644.00 27,762.29
2014 Oyster Stock Assessment Report – CSA 1 South Page 2-4
The 2014 Oyster Stock Assessment, as well as the previous year’s assessment, is based on the
updated reef acreage of 26,962.29 water bottom acres. This stock assessment further includes
800 acres of recent cultch plants bringing the total assessed acreage to 27,762.29. As those
cultch plants are sampled by a slightly different method and are likely distinctly different from
surrounding, existing reef in terms of oyster productivity, the cultch plant acreages are assessed
separately and not as part of the surrounding reef system. Additionally, beginning with the 2013
Stock Assessment, oyster reefs within the South Pontchartrain Basin, each of which was
previously represented by one of thirty square-meter sample stations, were grouped into reef
complexes. The reefs placed within a reef complex were those closely related in regards to
location, hydrology, oyster productivity, and response to environmental stressors. A total of
twelve reef complexes were designated, each with 1 to 5 representative square-meter sample
stations (Figure 2.2). An additional 1,524 acres of oyster habitat (reef and scattered shell) was
identified by the recent water bottom assessments, but is not included in the annual stock
assessment acreage, as it was felt that no current oyster sampling station adequately described
this acreage.
2014 Oyster Stock Assessment Report – CSA 1 South Page 2-5
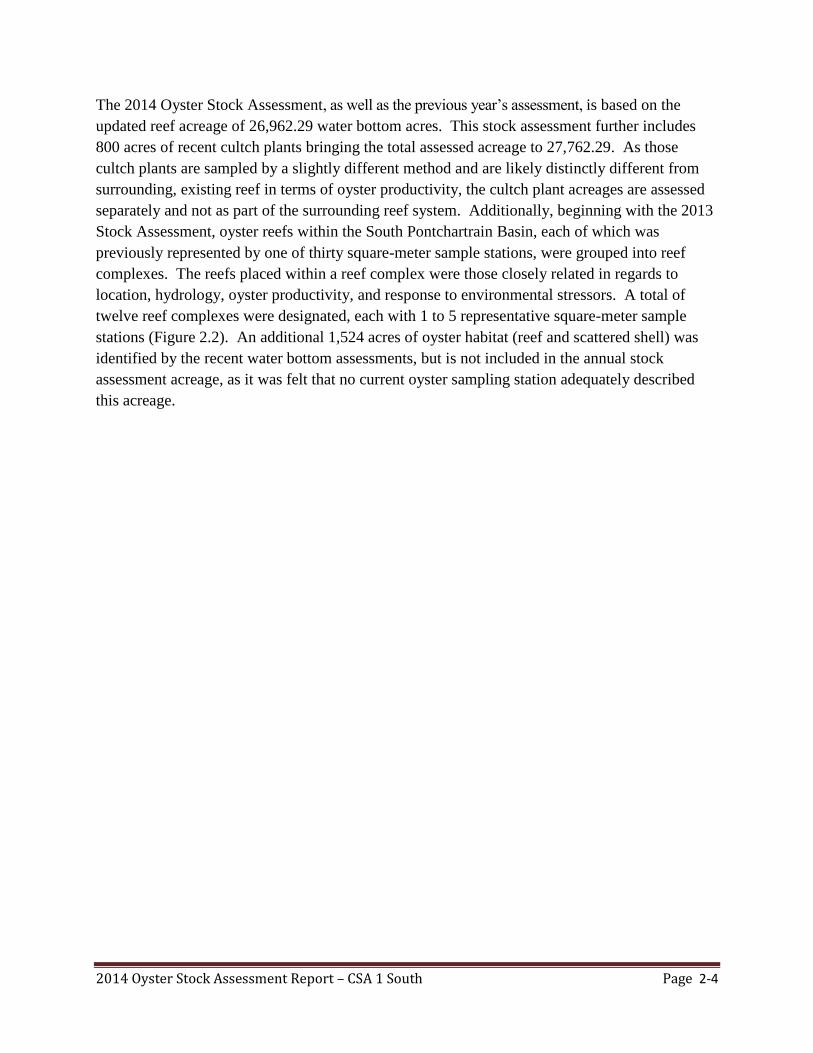
Figure 2.2. Reef complex designations in Coastal Study Area 1-South based on recent water
bottom assessments (side-scan sonar).
Results and Discussion
Seed and Sack Stock
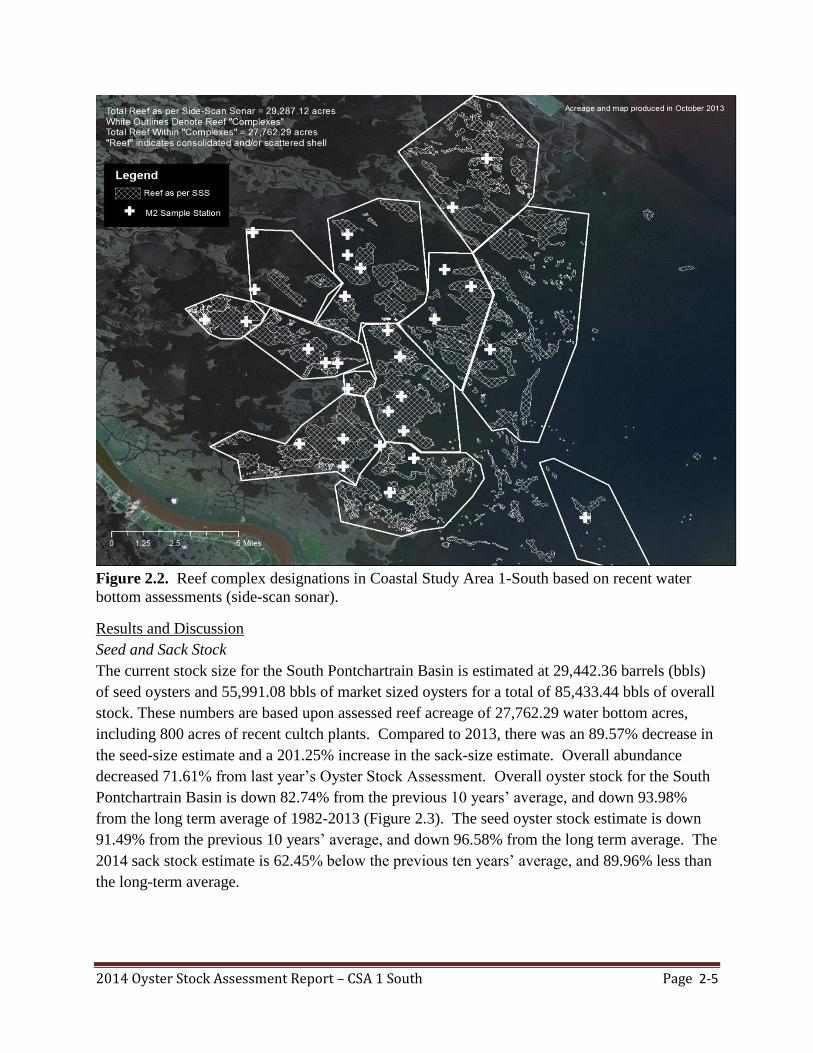
The current stock size for the South Pontchartrain Basin is estimated at 29,442.36 barrels (bbls)
of seed oysters and 55,991.08 bbls of market sized oysters for a total of 85,433.44 bbls of overall
stock. These numbers are based upon assessed reef acreage of 27,762.29 water bottom acres,
including 800 acres of recent cultch plants. Compared to 2013, there was an 89.57% decrease in
the seed-size estimate and a 201.25% increase in the sack-size estimate. Overall abundance
decreased 71.61% from last year’s Oyster Stock Assessment. Overall oyster stock for the South
Pontchartrain Basin is down 82.74% from the previous 10 years’ average, and down 93.98%
from the long term average of 1982-2013 (Figure 2.3). The seed oyster stock estimate is down
91.49% from the previous 10 years’ average, and down 96.58% from the long term average. The
2014 sack stock estimate is 62.45% below the previous ten years’ average, and 89.96% less than
the long-term average.
2014 Oyster Stock Assessment Report – CSA 1 South Page 2-6
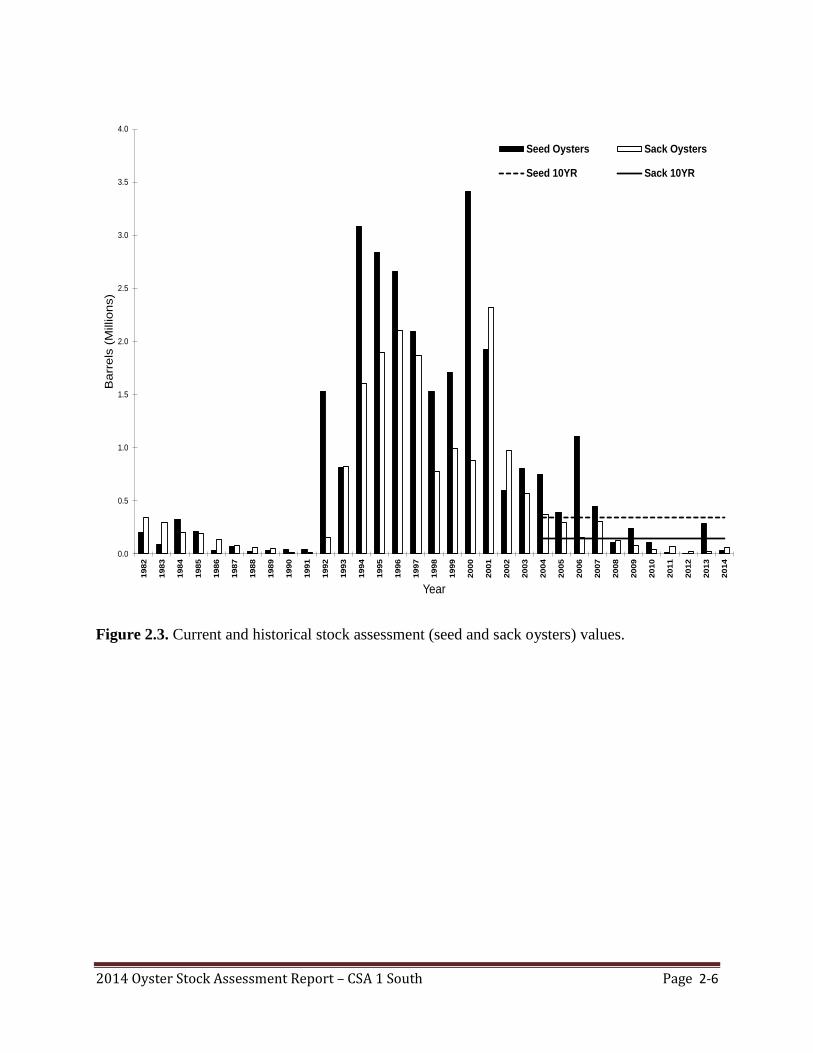
Figure 2.3. Current and historical stock assessment (seed and sack oysters) values.
0.0
0.5
1.0
1.5
2.0
2.5
3.0
3.5
4.0
1982
1983
1984
1985
1986
1987
1988
1989
1990
1991
1992
1993
1994
1995
1996
1997
1998
1999
2000
2001
2002
2003
2004
2005
2006
2007
2008
2009
2010
2011
2012
2013
2014
Ba
rre
ls (
Millio
ns)
Year
Seed Oysters Sack Oysters
Seed 10YR Sack 10YR
2014 Oyster Stock Assessment Report – CSA 1 South Page 2-7
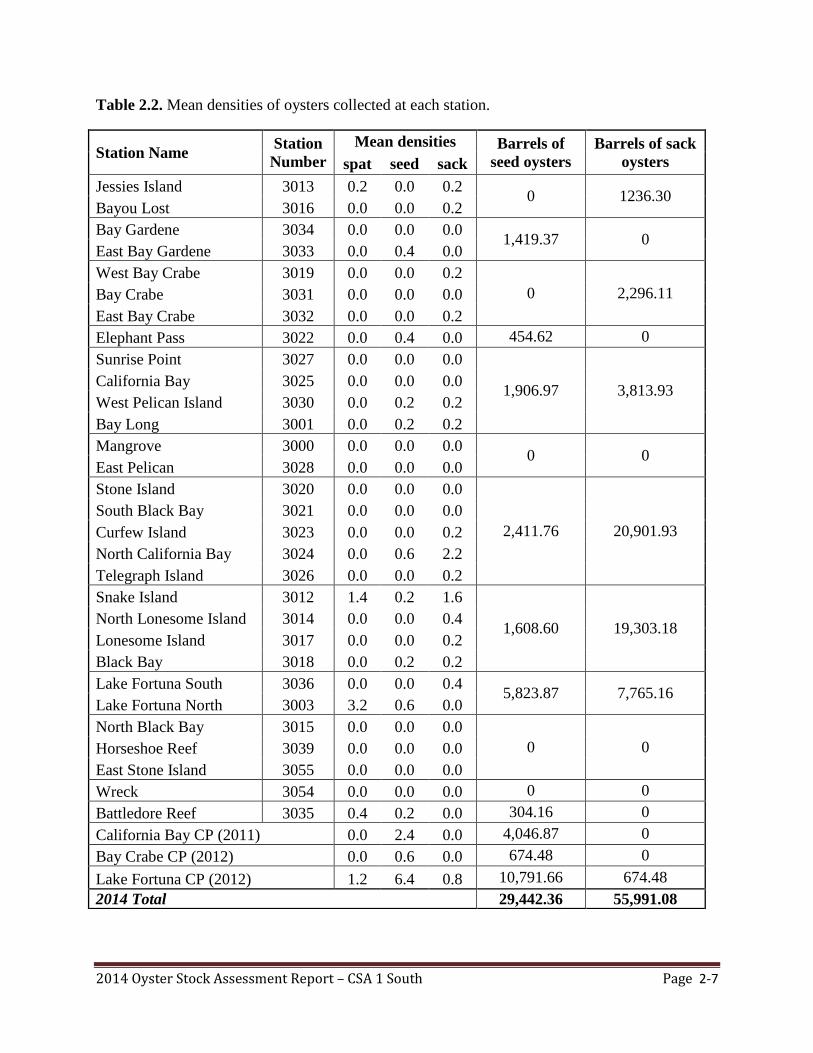
Table 2.2. Mean densities of oysters collected at each station.
Station Name Station
Number
Mean densities Barrels of
seed oysters
Barrels of sack
oysters spat seed sack
Jessies Island 3013 0.2 0.0 0.2 0 1236.30
Bayou Lost 3016 0.0 0.0 0.2
Bay Gardene 3034 0.0 0.0 0.0 1,419.37 0
East Bay Gardene 3033 0.0 0.4 0.0
West Bay Crabe 3019 0.0 0.0 0.2
0 2,296.11 Bay Crabe 3031 0.0 0.0 0.0
East Bay Crabe 3032 0.0 0.0 0.2
Elephant Pass 3022 0.0 0.4 0.0 454.62 0
Sunrise Point 3027 0.0 0.0 0.0
1,906.97 3,813.93 California Bay 3025 0.0 0.0 0.0
West Pelican Island 3030 0.0 0.2 0.2
Bay Long 3001 0.0 0.2 0.2
Mangrove 3000 0.0 0.0 0.0 0 0
East Pelican 3028 0.0 0.0 0.0
Stone Island 3020 0.0 0.0 0.0
2,411.76 20,901.93
South Black Bay 3021 0.0 0.0 0.0
Curfew Island 3023 0.0 0.0 0.2
North California Bay 3024 0.0 0.6 2.2
Telegraph Island 3026 0.0 0.0 0.2
Snake Island 3012 1.4 0.2 1.6
1,608.60 19,303.18 North Lonesome Island 3014 0.0 0.0 0.4
Lonesome Island 3017 0.0 0.0 0.2
Black Bay 3018 0.0 0.2 0.2
Lake Fortuna South 3036 0.0 0.0 0.4 5,823.87 7,765.16
Lake Fortuna North 3003 3.2 0.6 0.0
North Black Bay 3015 0.0 0.0 0.0
0 0 Horseshoe Reef 3039 0.0 0.0 0.0
East Stone Island 3055 0.0 0.0 0.0
Wreck 3054 0.0 0.0 0.0 0 0
Battledore Reef 3035 0.4 0.2 0.0 304.16 0
California Bay CP (2011) 0.0 2.4 0.0 4,046.87 0
Bay Crabe CP (2012) 0.0 0.6 0.0 674.48 0
Lake Fortuna CP (2012) 1.2 6.4 0.8 10,791.66 674.48
2014 Total 29,442.36 55,991.08
2014 Oyster Stock Assessment Report – CSA 1 South Page 2-8
Oyster density and abundance was not evenly distributed among areas (Figure 2.1, Table 2.2).
The highest density estimates of seed stock were found at the three recently established cultch
plants, where estimated seed stock ranged from 0.6/m2 at the Bay Crabe cultch plant to 6.4/m
2 at
the Lake Fortuna cultch plant. Among harvested reefs, North California Bay and North Lake
Fortuna showed the highest seed oyster densities with an estimated 0.6 seed oysters per square-
meter. Highest abundance of seed stock was observed within the Lake Fortuna reef complex,
which includes the North and South Lake Fortuna sample sites, as well as the Lake Fortuna
cultch plant. Nearly 60% of estimated available seed oyster stock was found to be in this area,
which has historically been designated as sacking only and is not available for bedding. The
highest average density of sack-sized oysters was located at the North California Bay and Snake
Island sample sites. The highest total abundance of sack oysters was found at the South Black
Bay Reef complex, which includes the Stone Island, South Black Bay, Curfew Island, Telegraph
Island and North California Bay stations.
Spat Production
Live spat were observed at just 5 of the 33 stations sampled during this assessment. Spat
densities observed during this Oyster Stock Assessment ranged from 0 to 3.2/m2. Although
these assessment events may occur outside of the peak spawning period, it is evident that there
has been only minimal spat catch on these reefs. This marks a continuation of poor spat catches
within this Basin.
Mortality
Recent spat mortalities were observed at three sites during this assessment. Jessie’s Island had a
spat oyster mortality value of 80%, and Horseshoe Reef had 100% spat mortality with a single
recent dead spat oyster observed. There was 14.3% recent mortality of spat oysters at the Lake
Fortuna cultch plant. There was recent seed mortality observed at three of the 33 sample
stations. Jessie’s Island had 100% seed oyster mortality and Snake Island had seed oyster
mortality of 50%. The Lake Fortuna cultch plant was observed to have 8.6% recent mortality of
seed oysters. There was no recent sack-sized oyster mortality observed during this assessment.
Fouling Organisms
Hooked mussels (Ischadium recurvum) are a sessile bivalve that is oftentimes associated with
oyster reefs and compete with oysters for food and settlement surfaces. During this assessment
hooked mussels were present at 31 of the 33 stations sampled and ranged in density from 0.1 to
2,248.2 individuals / m2 (Table 2.3). Overall, hooked mussel density has increased over the
previous assessment with the largest increase in density observed at the West Pelican Island and
North Lonesome Island sample sites. Increases in hooked mussel density were observed at
twenty of the 33 stations. There were however notable large decreases in hooked mussel
densities at Bay Gardene and Mangrove Point. Additionally, Spionid polychaete mud tubes,
2014 Oyster Stock Assessment Report – CSA 1 South Page 2-9
ctenostome and fairy lace bryozoans, the tube dwelling amphipod, Apocorophium, and other
small hydroids continue to be found on live oysters and the exposed shell in the assessment area,
as was noted in the 2012 and 2013 Oyster Stock Assessments.
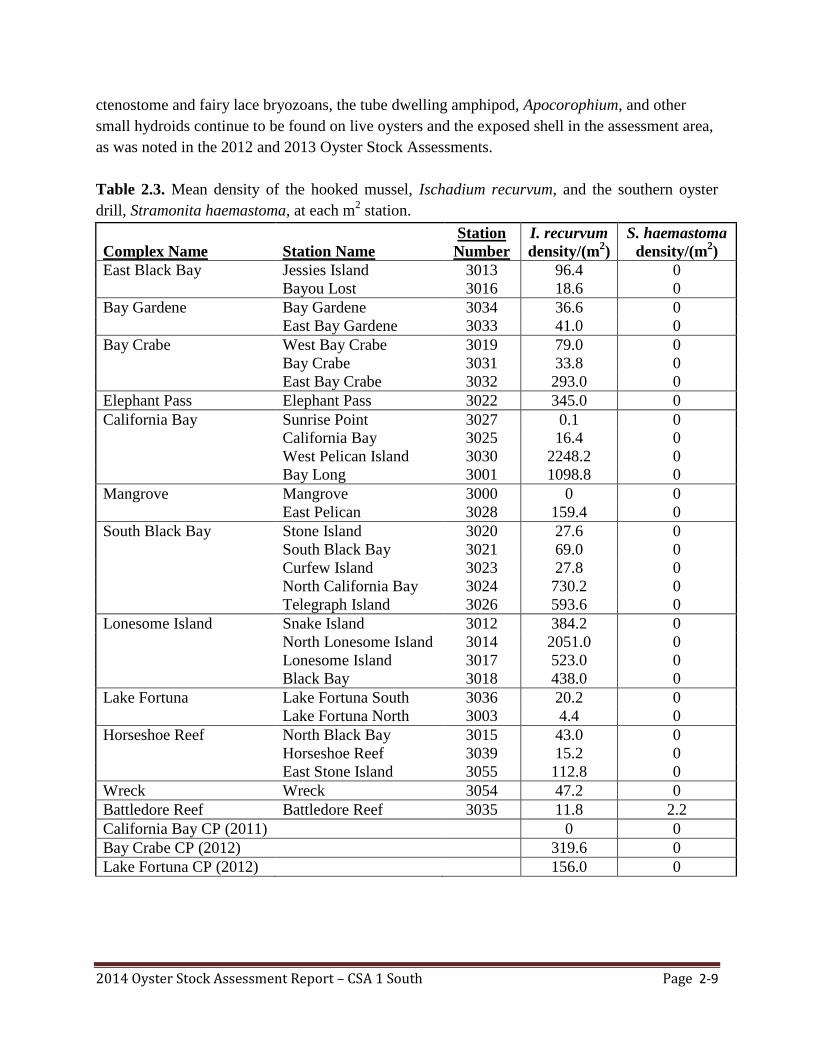
Table 2.3. Mean density of the hooked mussel, Ischadium recurvum, and the southern oyster
drill, Stramonita haemastoma, at each m2 station.
Complex Name Station Name
Station
Number
I. recurvum
density/(m2)
S. haemastoma
density/(m2)
East Black Bay Jessies Island 3013 96.4 0
Bayou Lost 3016 18.6 0
Bay Gardene Bay Gardene 3034 36.6 0
East Bay Gardene 3033 41.0 0
Bay Crabe West Bay Crabe 3019 79.0 0
Bay Crabe 3031 33.8 0
East Bay Crabe 3032 293.0 0
Elephant Pass Elephant Pass 3022 345.0 0
California Bay Sunrise Point 3027 0.1 0
California Bay 3025 16.4 0
West Pelican Island 3030 2248.2 0
Bay Long 3001 1098.8 0
Mangrove Mangrove 3000 0 0
East Pelican 3028 159.4 0
South Black Bay Stone Island 3020 27.6 0
South Black Bay 3021 69.0 0
Curfew Island 3023 27.8 0
North California Bay 3024 730.2 0
Telegraph Island 3026 593.6 0
Lonesome Island Snake Island 3012 384.2 0
North Lonesome Island 3014 2051.0 0
Lonesome Island 3017 523.0 0
Black Bay 3018 438.0 0
Lake Fortuna Lake Fortuna South 3036 20.2 0
Lake Fortuna North 3003 4.4 0
Horseshoe Reef North Black Bay 3015 43.0 0
Horseshoe Reef 3039 15.2 0
East Stone Island 3055 112.8 0
Wreck Wreck 3054 47.2 0
Battledore Reef Battledore Reef 3035 11.8 2.2
California Bay CP (2011) 0 0
Bay Crabe CP (2012) 319.6 0
Lake Fortuna CP (2012) 156.0 0
2014 Oyster Stock Assessment Report – CSA 1 South Page 2-10
Oyster Predators/Disease
The southern oyster drill (Stramonita haemastoma) is a predatory marine gastropod known to
prey on oysters and other sessile animals using a small tooth-like scraping organ called a radula
to bore a hole through the oyster shell. Snails and egg cases were found at only the Battledore
Reef sample site. Recent extended periods of low salinity may have limited snail abundance in
the area. Three stone crabs (Mennipe adinia), and no blue crabs (Callinectes sapidus) were
observed in the samples.
Perkinsus marinus (= Dermo), a protozoan parasite that infects oyster tissue, is known to cause
extensive oyster mortalities especially under high salinity and high water temperature conditions.
Dermo samples were attempted at 7 stations throughout the area. Results of the Dermo tests are
presented in another section of this report.
Tropical and Climatic Events
There were no significant tropical systems impacting the public oyster seed grounds in the
Pontchartrain Basin during this assessment period. The area did experience monthly rainfall amounts
well above the average for the months of February through June of 2014. Much of these elevated
rainfall amounts were associated with the passages of cold fronts well into late spring.
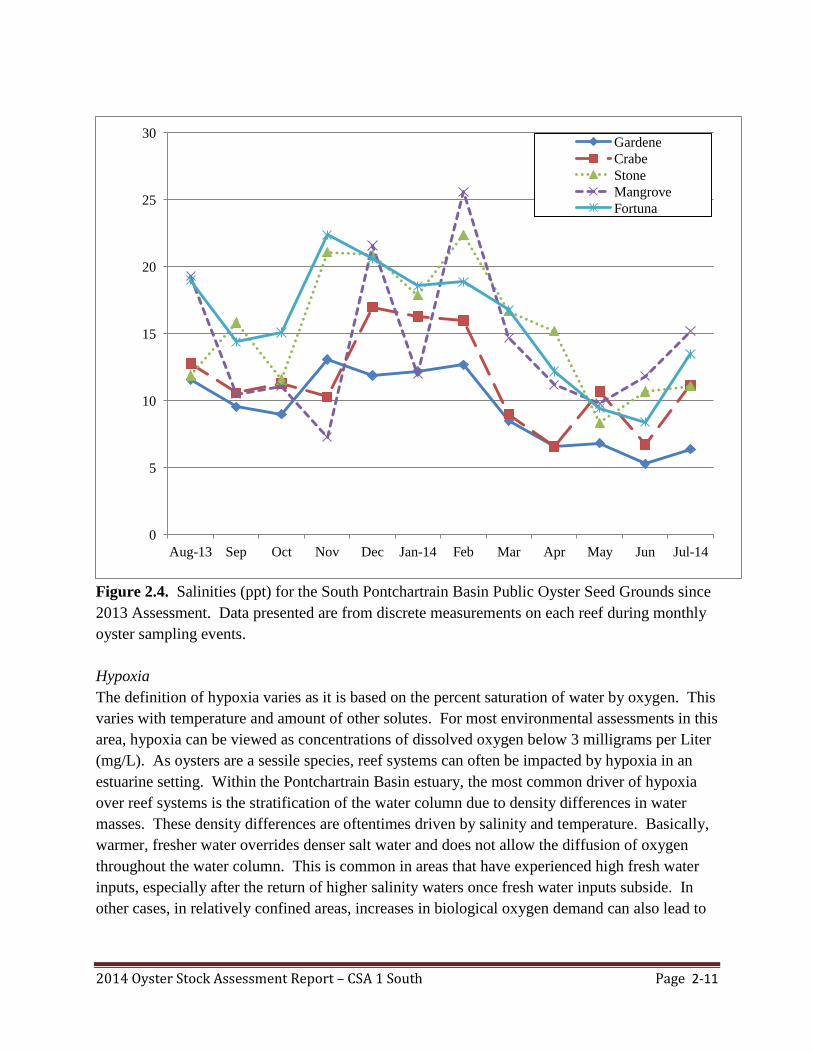
The majority of the input of freshwater to the Basin was from discharge through fresh water
diversion structures and through gaps in the levee south of Pointe a la Hache, as well as main-
stem distributaries during high Mississippi River stages. Salinities across the entire Basin were
consistently at or above 5 parts per thousand (ppt) throughout most of the assessment year
(Figure 2.4). There was a notable decrease in salinity across most of the Basin between the
months of March and June 2014. During this period, salinities at East Bay Gardene and East
Bay Crabe fell to 5.3 and 6.6ppt respectively.
Deepwater Horizon Oil Spill and Related Response Actions
The Deepwater Horizon oil spill released millions of barrels of oil into the Gulf of Mexico affecting
the Louisiana coastline. In direct response to the oil spill, in an effort to keep incoming oil from the
Gulf out of Louisiana’s sensitive marshes and estuaries, freshwater was released from diversions and
siphons along the Mississippi River. The impacts of oil and freshwater diversions on oyster health
and habitat continue to be of concern. Assessments on the direct and indirect impacts to Louisiana’s
environment, including oysters and oyster habitat, from oil and response actions are ongoing through
the Deepwater Horizon Natural Resource Damage Assessment (NRDA).
2014 Oyster Stock Assessment Report – CSA 1 South Page 2-11
Figure 2.4. Salinities (ppt) for the South Pontchartrain Basin Public Oyster Seed Grounds since
2013 Assessment. Data presented are from discrete measurements on each reef during monthly
oyster sampling events.
Hypoxia
The definition of hypoxia varies as it is based on the percent saturation of water by oxygen. This
varies with temperature and amount of other solutes. For most environmental assessments in this
area, hypoxia can be viewed as concentrations of dissolved oxygen below 3 milligrams per Liter
(mg/L). As oysters are a sessile species, reef systems can often be impacted by hypoxia in an
estuarine setting. Within the Pontchartrain Basin estuary, the most common driver of hypoxia
over reef systems is the stratification of the water column due to density differences in water
masses. These density differences are oftentimes driven by salinity and temperature. Basically,
warmer, fresher water overrides denser salt water and does not allow the diffusion of oxygen
throughout the water column. This is common in areas that have experienced high fresh water
inputs, especially after the return of higher salinity waters once fresh water inputs subside. In
other cases, in relatively confined areas, increases in biological oxygen demand can also lead to
0
5
10
15
20
25
30
Aug-13 Sep Oct Nov Dec Jan-14 Feb Mar Apr May Jun Jul-14
Gardene
Crabe
Stone
Mangrove
Fortuna
2014 Oyster Stock Assessment Report – CSA 1 South Page 2-12
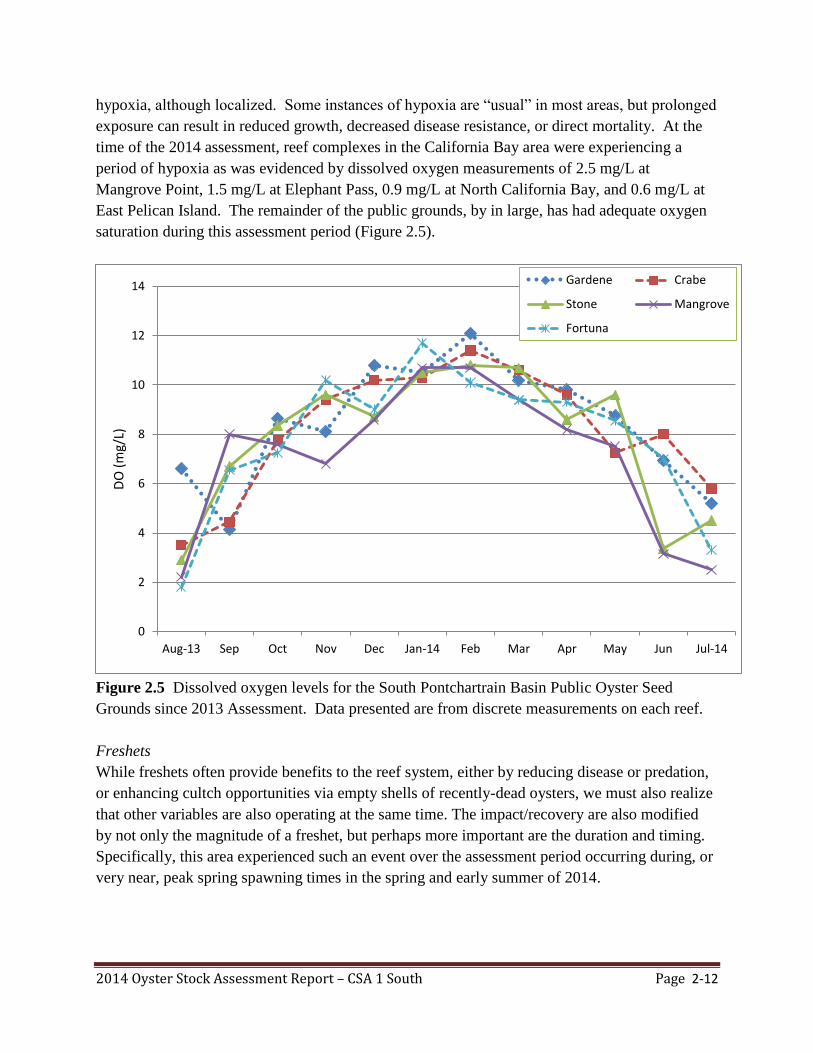
hypoxia, although localized. Some instances of hypoxia are “usual” in most areas, but prolonged
exposure can result in reduced growth, decreased disease resistance, or direct mortality. At the
time of the 2014 assessment, reef complexes in the California Bay area were experiencing a
period of hypoxia as was evidenced by dissolved oxygen measurements of 2.5 mg/L at
Mangrove Point, 1.5 mg/L at Elephant Pass, 0.9 mg/L at North California Bay, and 0.6 mg/L at
East Pelican Island. The remainder of the public grounds, by in large, has had adequate oxygen
saturation during this assessment period (Figure 2.5).
Figure 2.5 Dissolved oxygen levels for the South Pontchartrain Basin Public Oyster Seed
Grounds since 2013 Assessment. Data presented are from discrete measurements on each reef.
Freshets
While freshets often provide benefits to the reef system, either by reducing disease or predation,
or enhancing cultch opportunities via empty shells of recently-dead oysters, we must also realize
that other variables are also operating at the same time. The impact/recovery are also modified
by not only the magnitude of a freshet, but perhaps more important are the duration and timing.
Specifically, this area experienced such an event over the assessment period occurring during, or
very near, peak spring spawning times in the spring and early summer of 2014.
0
2
4
6
8
10
12
14
Aug-13 Sep Oct Nov Dec Jan-14 Feb Mar Apr May Jun Jul-14
DO
(m
g/L)
Gardene Crabe
Stone Mangrove
Fortuna
2014 Oyster Stock Assessment Report – CSA 1 South Page 2-13
Sedimentation/Subsidence
Sedimentation can affect the reef either through direct mortality (burial) or through reduced
growth and reproduction (both production and clean places for larval attachment). During the
2014 assessment, divers noted on several reefs that some of the cultch had a covering of silt and
still others had buried cultch. Both of these conditions are known to limit the amount of suitable
substrate available for larval settlement.
Subsidence of the reefs is usually balanced by reef accretion or growth. If no appreciable shell is
added over a period of time, the reefs, especially those in less than optimal environments, will
subside to the point of shell burial. The lowering of the reef profile also subjects associated
organisms to more frequent hypoxia events as well as changing the local water flow and
sedimentation processes.
Cultch Condition
Any successful spat set is dependent upon clean, stable cultch for larval attachment. The
condition of the cultch and live oyster shell within the South Pontchartrain Basin currently
appears to be poor. As noted above, many areas are buried or covered with a layer of silt. On
some reefs within the Basin, the cultch is nearly completely covered by fouling organisms such
as hooked mussels (Ischadium recurvum), Spionid polychaete mud tubes, ctenostome and fairy
lace bryozoans, the tube dwelling amphipod, Apocorophium, and small hydroids, all of which
can pose hindrance to larval oyster settlement. In other areas, the addition of shell to a reef has
become so infrequent that the cultch on hand is being transformed into small “hash” particles
that provide minimal substrate for larval attachment.
2013/2014 Oyster Season Summary
The 2013/2014 oyster season on the South Pontchartrain Basin public oyster seed grounds
opened on October 15, 2013 and closed on April 30, 2014. The Bay Gardene seed reservation,
as well as the recent cultch plants at California Bay, Bay Crabe and Lake Fortuna remained
closed to harvest throughout the 2013/2014 oyster season.
Harvest Monitoring Methods
Harvest totals for the 2013/2014 season were estimated by obtaining fisheries dependent data
from the monitoring of users. “Boarding Surveys” were conducted weekly during the season.
LDWF Biologists survey the entire area observing fishermen, recording locations, and making
harvest estimates for each vessel for that day. This estimate is projected over the amount of
“fishable days” (winds less than 25 mph) for the week and a total harvest of seed and market
oysters for the week is made. Vessels collecting seed are often boarded to determine if excessive
amounts of cultch (non-living reef material) are being removed from area reefs. Harvest data is
also obtained via the trip ticket system in place for this fishery. However, this data is
2014 Oyster Stock Assessment Report – CSA 1 South Page 2-14
consolidated by geographic region and is considered preliminary until well after the season
concludes, and provide a limited spatial resolution.
Harvest Results and Discussion
Harvest totals for 2013/2014 were estimated at 315 sacks of market oysters and 2,170 barrels of
seed oysters. When harvest estimates within stock-assessed areas are compared with the 2013
stock assessment, there was an estimated utilization of 0.8% of the sack resource and 0.8% of the
seed resource. Harvest amounts as well as observed vessels were not constant over time. Sack
harvest effort was primarily in the Black Bay area, with a majority of harvest effort observed in
the Lonesome Island Reef Complex. Lesser amounts of sack harvest were recorded at Jessie’s
Island and Lake Fortuna. Seed harvest during this assessment period also occurred primarily in
the Lonesome Island Complex and to a lesser extent in the South Black Bay Complex.
While obtaining fishery dependent data, LDWF biologists collected random samples of loads
from vessels harvesting seed oysters on the public grounds to check the percent of cultch (non-
living reef material) being harvested. Samples were collected from four of the seven vessels
observed collecting seed oysters from during the 2013/2014 oyster season. Two samples from
the Lonesome Island reef complex yielded 92.6% and 76.6% non-living cultch material. The
percentages of cultch material in two samples taken from the South Black Bay reef complex
were measured to be 83.5% and 87.6% non-living cultch material. This marks a continuation of
excessive cultch removal from public reef systems by bedding vessels on a percentage basis,
although total cultch removal during the 2013/2014 season was relatively low due to the low
amount of overall harvest pressure. However, the loss of adequate cultch material continues to
be a major concern for public seed grounds within the Pontchartrain Basin.
2014 Oyster Stock Assessment Report – CSA 3 Page 3-1
Coastal Study Area (CSA) 3 – 2014 Oyster Stock Assessment
Introduction
Coastal Study Area (CSA) 3 consists of three public oyster areas distributed generally in a north-
south direction within the Barataria Bay estuary: 1) Little Lake Public Oyster Seed Grounds
(POSG), 2) Hackberry Bay Public Oyster Seed Reservation (POSR), and 3) Barataria Bay Public
Oyster Seed Grounds (POSG). Hackberry Bay is the oldest of the three as it was designated by
the Louisiana Legislature as a public oyster seed reservation in 1944. Barataria Bay was
designated by the Louisiana Wildlife and Fisheries Commission (LWFC) as a public oyster seed
ground in 2000, and Little Lake was designated by the LWFC in 2007. Historically, CSA 3 has
monitored three sampling sites for annual oyster stock assessment, all in Hackberry Bay.
Sampling has expanded in recent years, however, with the addition of the Barataria Bay POSG,
and the addition of newly constructed oyster reefs in Hackberry Bay.
Hackberry Bay (Jefferson/Lafourche Parishes) is a 4,402 acre mesohaline embayment with a
primarily soft silt and clay bottom, of which only 14.7 acres is naturally occurring reef material.
The three historical sampling sites within Hackberry Bay are the upper, middle, and lower
Hackberry sampling sites. The middle Hackberry site is the only site located over existing
natural reef, while the upper and lower sites are over former cultch plants placed on top of
historical reefs. The upper Hackberry sampling site was the result of a 1994 cultch plant using
federal disaster funds from Hurricane Andrew in 1992. The upper site had also been the location
of cultch plants in 1943 (140 acres), 1945 (70 acres), 1946 (92 acres) and 1981 (67 acres). The
1994 cultch site was comprised of six different sections of substrate including: crushed concrete,
shucked shell, reef shell, clam shell, Kentucky limestone and Bahamian limestone totaling 145
acres. The lower Hackberry sampling site is on a reef that was part of a 450 acre 1973 cultch
plant. Since very little natural reef exists in the Hackberry Bay POSR, production is highly
dependent upon and reflective of when and where cultch plants are placed in the bay. It is
unknown how much, if any, cultch material from the 1994 and earlier cultch plants remains
exposed above the surface of the mud. Therefore, the acreage of these cultch plants is not
factored into the annual oyster stock assessment.
Since 2004, five reef rehabilitation projects (cultch plants) have occurred in Hackberry Bay and
one in Barataria Bay. In Hackberry Bay, two cultch plants were constructed in 2004 totaling 35
acres and one in 2008 totaling 50 acres. In 2004, a 40-acre cultch plant was constructed in the
Barataria Bay Public Oyster Seed Ground.
In May 2012, utilizing funds from the Deepwater Horizon Oil Spill NRDA Early Restoration
Louisiana Cultch Project, 26,086 cubic yards of limestone were placed on approximately 200
acres in the northwest portion of Hackberry Bay. Additionally, a 30-acre cultch plant was
constructed in May 2014 in the northeastern portion of Hackberry Bay utilizing 3,572 cubic
yards of limestone rock. These recent cultch plants have increased the estimated reef acreage on
the Hackberry Bay POSR from 99.7 to 329.7 acres.
2014 Oyster Stock Assessment Report – CSA 3 Page 3-2
The Barataria Bay POSG was designated as a public oyster ground in response to possible
changes in the salinity regime of the estuary stemming from the Davis Pond Freshwater
Diversion project. Davis Pond is a Mississippi River diversion project that aims to reintroduce
freshwater and nutrients into the Barataria Bay estuary. As this new coastal restoration project
was anticipated to reduce salinities in the estuary, LDWF felt that an additional public oyster
seed ground farther down-estuary couldbe productive during years with high freshwater input.
The only known existing reef in the Barataria Bay POSG is a 40-acre cultch plant constructed in
2004. The reef is comprised of 7,536 cubic yards of crushed concrete. The Barataria Bay cultch
plant was constructed in between May 2004 and is located in the northeast section of the
Barataria Bay POSG. It is vulnerable to predators such as oyster drills and the protozoan parasite
Perkinsus marinus - (Dermo) during periods of higher salinities. Consistent production is not
expected until salinity regimes in the basin change due to natural forces or coastal restoration
efforts.
On February 1, 2007 the Wildlife and Fisheries Commission created the Little Lake POSG.
Previously, this area had been utilized as a temporary natural reef area, and was once covered
with private oyster leases. These leases all fell within the Davis Pond freshwater diversion
impact area and were either purchased or moved by the state and federal government prior to the
opening of the Davis Pond diversion. The Davis Pond diversion has not been consistently
utilized to its maximum capacity since it first opened in 2002, and environmental conditions
during some years have allowed oysters to continue to exist in Little Lake. Therefore, the LWFC
designated this area a public oyster ground so that oysters could be harvested and reefs could be
actively managed by LDWF. The location of the Little Lake POSG makes it vulnerable to
depressed salinities from rainfall, inflow from the Intracoastal Waterway, and discharge from the
Davis Pond freshwater diversion. Reduced salinities from increased freshwater input can have a
negative impact on oyster survival and availability. However, when higher salinities exist, the
Little Lake POSG has provided the oyster industry with additional seed and sack oysters in the
Barataria basin.
Materials and Methods
Quantitative samples used in this assessment were collected by CSA 3 biologists on 1-10 July
and on 14 August, 2014. Samples were obtained using a one square-meter (m2) frame placed
randomly on the bottom over reef at each sampling location. Using SCUBA, all live and dead
oysters, as well as shell, in the upper portion (exposed) of the substrate were removed from the
area within the frame. Live and dead oysters, fouling organisms, and oyster predators were
identified and enumerated. All oysters were measured (mm) and placed into 5 millimeter work
groups and further classified by size as spat (0-24mm), seed (25-74mm), and sack oyster (75mm
and greater), then weighed in 10 gram increments. Seven stations were visited (Figure 3.1) with
five replicate square meter samples taken at each location. The recent cultch plants in Hackberry
Bay (2012 and 2014) were quantitatively sampled using replicate ¼ m2 quadrats. Twenty
random samples were collected on the 2012 cultch plant and five were collected on the 2014
2014 Oyster Stock Assessment Report – CSA 3 Page 3-3
cultch plant. The average of all replicates at each station was used, in combination with reef
acreage, to estimate the current oyster availability for CSA 3.
The Little Lake POSG was not sampled due to a lack of available reef acreage information.
Results and Discussion
Seed and Sack Stock
Stock for the Hackberry Bay POSR, including the productive cultch plants, is estimated at
34,924 barrels (bbls) of seed size oysters and 1,783 bbls of market size oysters for a total of
36,707 bbls of overall stock. Seed were present at all stations, except for the 2004 Barataria Bay
Cultch Plant. There was an overall 112% increase in seed availability from 2013. Seed
availability is up 379% above the past 10 year average (34,924 vs. 7,285), and 137% above the
long term average from 1976-2013 (34,924 vs. 14,722). Sack oysters were present at all stations
with the exception of the Upper Hackberry Bay cultch plant, the 2014 Hackberry Bay cultch
plant, and the Barataria Bay 2004 cultch plant. The Hackberry Bay 2012 cultch plant also had
fewer sack oysters available compared to 2013 (0.2/m2 vs. 0.8/m
2) with Middle Hackberry Bay
cultch plant having the highest density at 3/m2 (Figure 3.2). Including the Hackberry Bay 2012
and 2014 cultch plants, sack stock was down 47% from 2013, 5% below the past 10 year average
of 3,309.4, and 60% below the long term average of 7,848 (1976-2013) (Table 3.1, Figure 3.3).
Combined stock showed an overall 70% increase over 2013, and 259% above the 10 year
average of 10,595, while also being 69% above the long term combined stock average (38,056
vs. 22,570). Some of the combined stock increase may be attributable to an increase in seed
oysters at the Hackberry Bay 2012 Cultch Plant. There was an average density of 25.4 seed
oysters per meter squared at the 2012 Cultch Plant; although there was a 75% decline in
abundance of sack oysters versus 2013. The monthly average size of seed and sack oysters, from
combined dredge and square meter samples, was 2.3 inches, ranging from 1.7 to 2.81 inches
(Figure 3.4 and 3.5). The overall average size from July 2013 to July 2014 was 2.29 inches
(Figure 3.5). No live seed or sack oysters were observed in the Barataria Bay (POSG) (Figure
3.1, Table 3.1). Market-size oyster availability has not been documented on the Barataria Bay
(POSG) since it was created in 2004. The July 2014 monthly average catch-per-unit-effort
(CPUE) for both seed and sack oysters, as well as combined total, was lower than July 2013
(Figure 3.6).
Spat Production
Unlike the total catch of 29 spat seen in 2013, there were 77 total spat collected in 2014. Despite
the increase in spat during the 2014 sampling event, spat abundance was well below the long
term average since 1976 of 9.1 spat/square meter (2014 = 2.48 spat/square meter). The highest
numbers were found at the 2004 North Cultch Plant with 32 of the 77 total spat coming from that
reef. One spat was collected on the Barataria Bay POSG in 2014. Since inception, the only
stock assessments on the Barataria Bay POSG with a record of spat were in 2005 (8 spat per m2),
2009 (53.5 spat per m2), 2010 (5.2 spat per m
2), and 2013 (2.6 spat per m
2).
2014 Oyster Stock Assessment Report – CSA 3 Page 3-4
Fouling Organisms
The hooked mussel (Ischadium recurvum) is a reef-associated benthic bivalve species that
competes with oysters for food and settlement surfaces. Hooked mussels were present at all
sampling stations except in Barataria Bay POSG and the 2008 Cultch Plant. Highest densities
were again observed at the Middle Hackberry Bay station (Table 3.2). The average number of
hooked mussels observed in the Hackberry Bay POSR was 28.5/m2, reduced from last year’s
average of 100/m2. The Middle Hackberry Bay site accounted for most of the overall decrease
with only 102 mussels per square meter in 2014 versus the 646 mussels per square meter in
2013. Monthly average salinities in Hackberry Bay were below the long term average (LTA)
since November 2013 prior to square meter sampling (Figure 3.7). The average salinity for
Hackberry Bay POSR in June 2014 was 8ppt. still below the long term average salinity for June
of 10ppt.
Mortality
Recent spat mortality at each station on the Hackberry Bay POSR ranged from 0 to 33% with an
overall average of 10.5%, slightly below the 11.2 % overall average in 2013. Recent seed oyster
mortality at each station ranged from 0 to 10.6% averaging 4.3%. There was no recent mortality
in sack-size oysters at 0% and a combined overall spat, and seed mortality of 5.0% (Table 3.2).
No live or recently dead spat, seed, or market size oysters were observed on the Barataria Bay
POSG.
Additional sources of oyster mortality data available since the 2013 oyster stock assessment are
the monthly dredge samples. Dredge samples revealed an overall monthly mortality of 4.6%
between July 2013 and June 2014 (Figure 3.8). This is similar to the 4.7% overall monthly
mortality observed during the same period prior to the 2013 stock assessment sampling. No
tropical systems have affected the study area since Hurricane Isaac in 2012.
Oyster Predators
The southern oyster drill (Stramonita haemastoma) is a predatory marine snail that feeds on
oysters and other sessile organisms using a radula (a small tooth-like rasping organ) to bore a
hole through the shell. During the 2013 stock assessment no snails were observed at any of the
sampling stations. During sampling for the 2014 stock assessment only one oyster drill was
sampled from the Barataria Bay POSG. Since 2009 only 19 oyster drills have been sampled
during dredge and square meter sampling and most of those have come from the Barataria Bay
POSG. Mortalities of oyster drills have been reported from Mississippi Sound when salinities
fell below 8-10 parts per thousand (ppt), therefore, the absence of oyster drills from 2014
samples is most likely due to the low overall average salinities throughout the basin beginning in
November of 2013 (Figure 3.9).
2014 Oyster Stock Assessment Report – CSA 3 Page 3-5
Tropical and Climatic Events
The United States Army Corps of Engineers (USACE) Tarbert gauge recorded Mississippi River
discharge from January 2013 through June 2014 as below the long term average (1961-2010) of
665,000 cubic feet per second (cfs), and reaching a peak discharge for 2014 at 643,000 cfs in
April. Discharge levels remained above the average in June at 582,000 cfs prior to our sampling
effort in July 2014 (Figure 3.9).
The United States Geologic Survey (USGS) constant data recorder, located near the Davis Pond
diversion structure, recorded a monthly average rise above the long term monthly average of
1831 cfs in January 2013. This coincided with the rise in discharge of the Mississippi River and
reached 376,610 cfs on the Davis Pond gauge, but subsequently began to fall the next month.
Average monthly discharge rates were below the long term average (2003 to 2010) from
September 2013 through June 2014 (Figure 3.10).
Hackberry Bay POSR salinities from January 2013 to June 2014 averaged 9.2 parts per thousand
(ppt) with a range of 4.3 to 13.6 ppt (Figures 3.7, 3.9, & 3.10). The average salinity for June
2014 was 8.8 ppt which remained slightly below the 1996 to 2012 June long term monthly
average of 10 ppt. With the exception of the month of May 2014, monthly average salinities for
Hackberry Bay POSR have been below the long term monthly average since November 2013.
Salinities in the Barataria Bay POSG from January 2013 to June 2014 averaged 18.3 ppt with a
range of 11.8 to 26.9 ppt (Figure 3.9 and 3.10). Salinities in the Little Lake POSG from January
2013 to June 2014 averaged 4.1 ppt with a range of 1.2 to 8.5 ppt (Figure 3.9 and 3.10).
Deepwater Horizon Oil Spill and Related Response Actions
The Deepwater Horizon oil spill released millions of barrels of oil into the Gulf of Mexico affecting
the Louisiana coastline. In direct response to the oil spill, in an effort to keep incoming oil from the
Gulf out of Louisiana’s sensitive marshes and estuaries, freshwater was released from diversions and
siphons along the Mississippi River. The impacts of oil and freshwater diversions on oyster health
and habitat continue to be of concern. Assessments on the direct and indirect impacts to Louisiana’s
environment, including oysters and oyster habitat, from oil and response actions are ongoing through
the Deepwater Horizon Natural Resource Damage Assessment (NRDA).
2013/2014 Oyster Season Summary
The Little Lake POSG and Barataria Bay POSG opened on September 4th
, 2013 and closed on
April 30th
, 2014. The opening of the 2013/2014 public seed/sack harvest season in the
Hackberry Bay POSR occurred on October 15th
, 2014 with the exception of the 2012 Cultch
Plant in Hackberry Bay which remained closed to harvest. The Hackberry Bay seed grounds
remained open for 5 days closing on October 20, 2014. Total harvest from public grounds in
CSA 3 during the 2013-2014 season was estimated at 2,490 bbls of seed oysters from Little Lake
POSG and 2,205 bbls of seed oysters from Hackberry Bay POSR. Hackberry Bay POSR seed
harvest constituted a 13.4% utilization of the estimated available resource (as determined by
2014 Oyster Stock Assessment Report – CSA 3 Page 3-6
2013 stock assessment). There were 1,390 sacks of market oysters harvested, resulting in an
11.8% utilization of available market oysters (Figure 3.11). Using the Sustainable Oyster
Shellstock (SOS) budget model for Hackberry Bay, the 2013-2014 harvest season should provide
a theoretical sustainable harvest threshold of 675 barrels of seed. The 2,205 barrels of seed
harvested was 327% of that threshold. The SOS model for Hackberry Bay also provided an
estimated sustainable harvest threshold of 1,085 sacks of market oysters, and the 1,390 sacks
harvested during the open season represented 128% of the model threshold. As harvest exceeded
the model thresholds, it was expected that reef shell mass would be reduced during this year’s
stock assessment. This expectation held true as grams/m2 of cultch in Hackberry Bay was
greatly reduced in 2014 as compared to 2013.
The removal of reef material from public reefs during seed-oyster harvest has long been a
concern to LDWF biologists as the practice threatens the long-term sustainability of the oyster
resource on the public grounds. To assess the amount of reef material being removed, LDWF
biologists collected three random one-cubic foot samples from each harvest vessel, when
available. In each sample, any material having live seed or sack oysters was separated from
material without live oysters. Large clusters were culled. The percentage of cultch removed was
calculated by dividing the weight of the material without seed or sack oysters by the total weight
of the material contained in the cubic foot container. Data from the three samples were averaged
to obtain a percent cultch estimate for each vessel.
Eleven vessels were boarded and samples taken to determine the percent of non living reef
material removed from the reefs. The range of non-living reef material per vessel was 1.9 to
56%. The overall average of cultch removed per vessel was 27.4%.
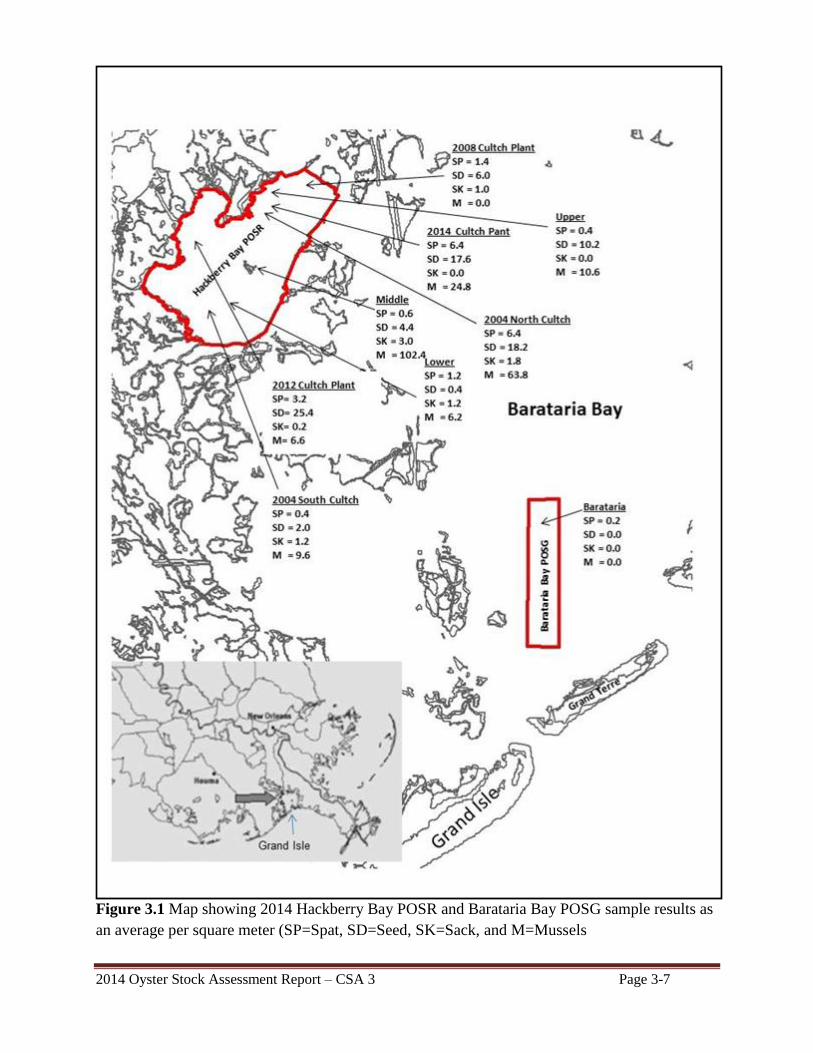
2014 Oyster Stock Assessment Report – CSA 3 Page 3-7
Figure 3.1 Map showing 2014 Hackberry Bay POSR and Barataria Bay POSG sample results as
an average per square meter (SP=Spat, SD=Seed, SK=Sack, and M=Mussels
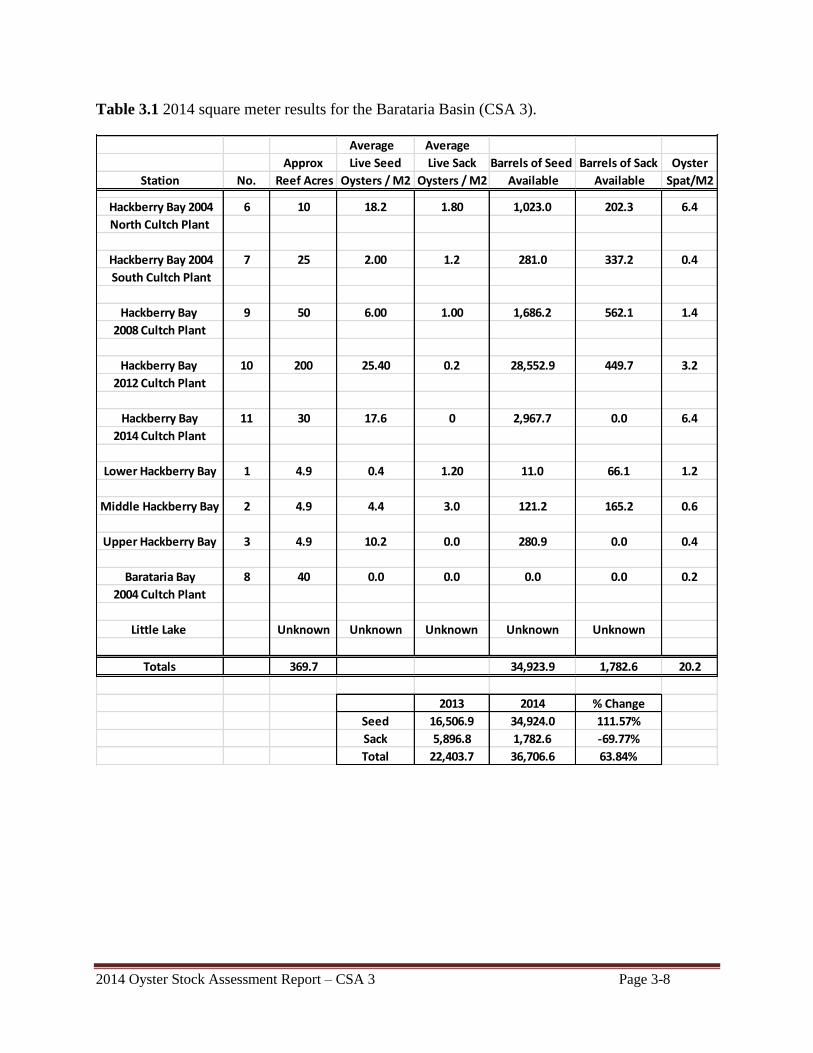
2014 Oyster Stock Assessment Report – CSA 3 Page 3-8
Table 3.1 2014 square meter results for the Barataria Basin (CSA 3).
Average Average
Approx Live Seed Live Sack Barrels of Seed Barrels of Sack Oyster
Station No. Reef Acres Oysters / M2 Oysters / M2 Available Available Spat/M2
Hackberry Bay 2004 6 10 18.2 1.80 1,023.0 202.3 6.4
North Cultch Plant
Hackberry Bay 2004 7 25 2.00 1.2 281.0 337.2 0.4
South Cultch Plant
Hackberry Bay 9 50 6.00 1.00 1,686.2 562.1 1.4
2008 Cultch Plant
Hackberry Bay 10 200 25.40 0.2 28,552.9 449.7 3.2
2012 Cultch Plant
Hackberry Bay 11 30 17.6 0 2,967.7 0.0 6.4
2014 Cultch Plant
Lower Hackberry Bay 1 4.9 0.4 1.20 11.0 66.1 1.2
Middle Hackberry Bay 2 4.9 4.4 3.0 121.2 165.2 0.6
Upper Hackberry Bay 3 4.9 10.2 0.0 280.9 0.0 0.4
Barataria Bay 8 40 0.0 0.0 0.0 0.0 0.2
2004 Cultch Plant
Little Lake Unknown Unknown Unknown Unknown Unknown
Totals 369.7 34,923.9 1,782.6 20.2
2013 2014 % Change
Seed 16,506.9 34,924.0 111.57%
Sack 5,896.8 1,782.6 -69.77%
Total 22,403.7 36,706.6 63.84%
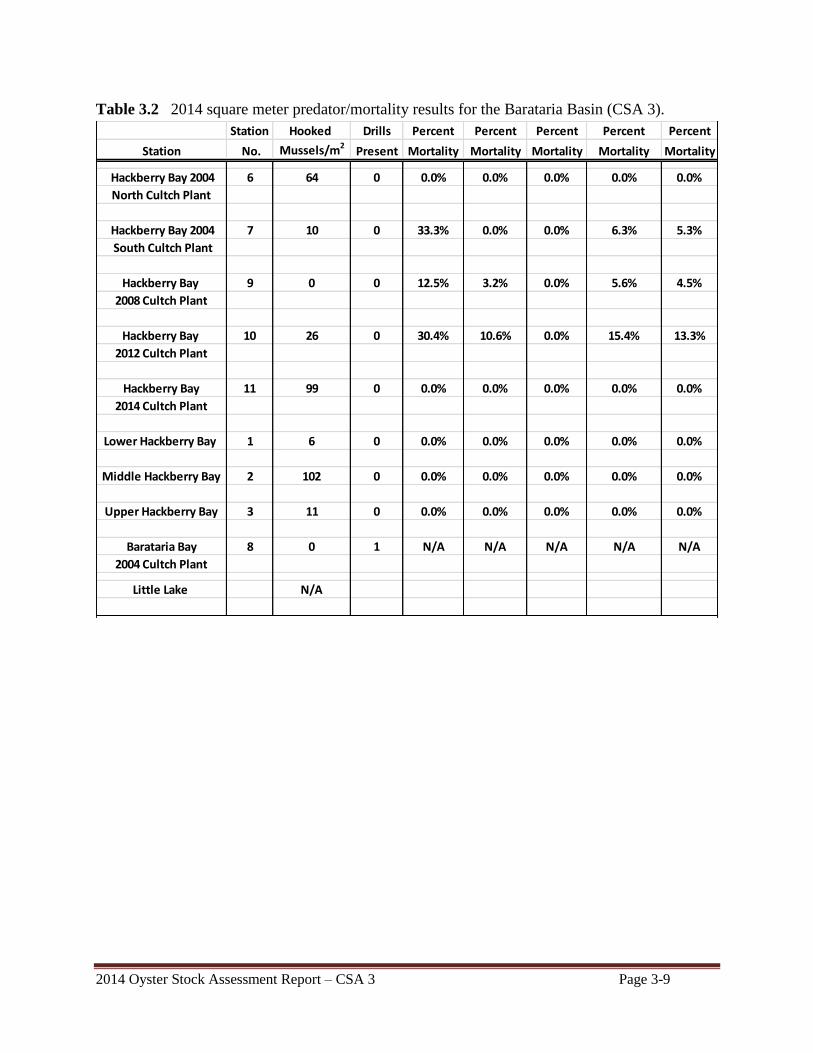
2014 Oyster Stock Assessment Report – CSA 3 Page 3-9
Table 3.2 2014 square meter predator/mortality results for the Barataria Basin (CSA 3).
Station Hooked Drills Percent Percent Percent Percent Percent
Station No. Mussels/m2Present Mortality Mortality Mortality Mortality Mortality
Hackberry Bay 2004 6 64 0 0.0% 0.0% 0.0% 0.0% 0.0%
North Cultch Plant
Hackberry Bay 2004 7 10 0 33.3% 0.0% 0.0% 6.3% 5.3%
South Cultch Plant
Hackberry Bay 9 0 0 12.5% 3.2% 0.0% 5.6% 4.5%
2008 Cultch Plant
Hackberry Bay 10 26 0 30.4% 10.6% 0.0% 15.4% 13.3%
2012 Cultch Plant
Hackberry Bay 11 99 0 0.0% 0.0% 0.0% 0.0% 0.0%
2014 Cultch Plant
Lower Hackberry Bay 1 6 0 0.0% 0.0% 0.0% 0.0% 0.0%
Middle Hackberry Bay 2 102 0 0.0% 0.0% 0.0% 0.0% 0.0%
Upper Hackberry Bay 3 11 0 0.0% 0.0% 0.0% 0.0% 0.0%
Barataria Bay 8 0 1 N/A N/A N/A N/A N/A
2004 Cultch Plant
Little Lake N/A
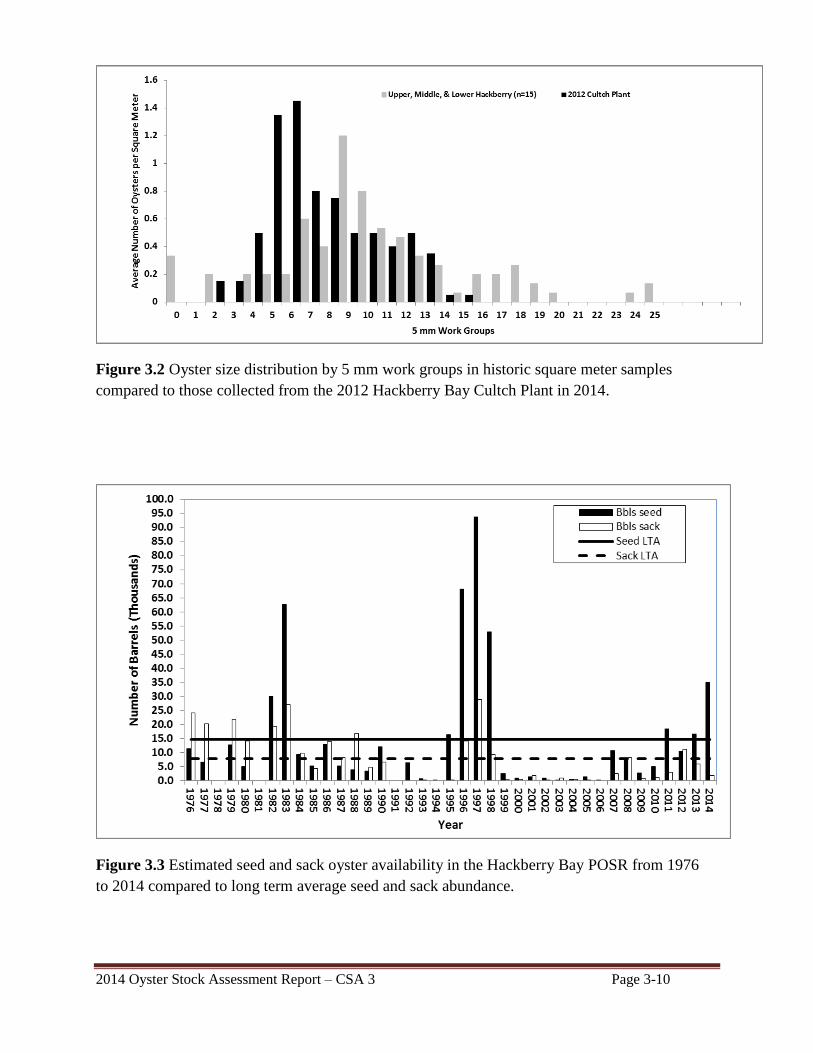
2014 Oyster Stock Assessment Report – CSA 3 Page 3-10
Figure 3.2 Oyster size distribution by 5 mm work groups in historic square meter samples
compared to those collected from the 2012 Hackberry Bay Cultch Plant in 2014.
Figure 3.3 Estimated seed and sack oyster availability in the Hackberry Bay POSR from 1976
to 2014 compared to long term average seed and sack abundance.
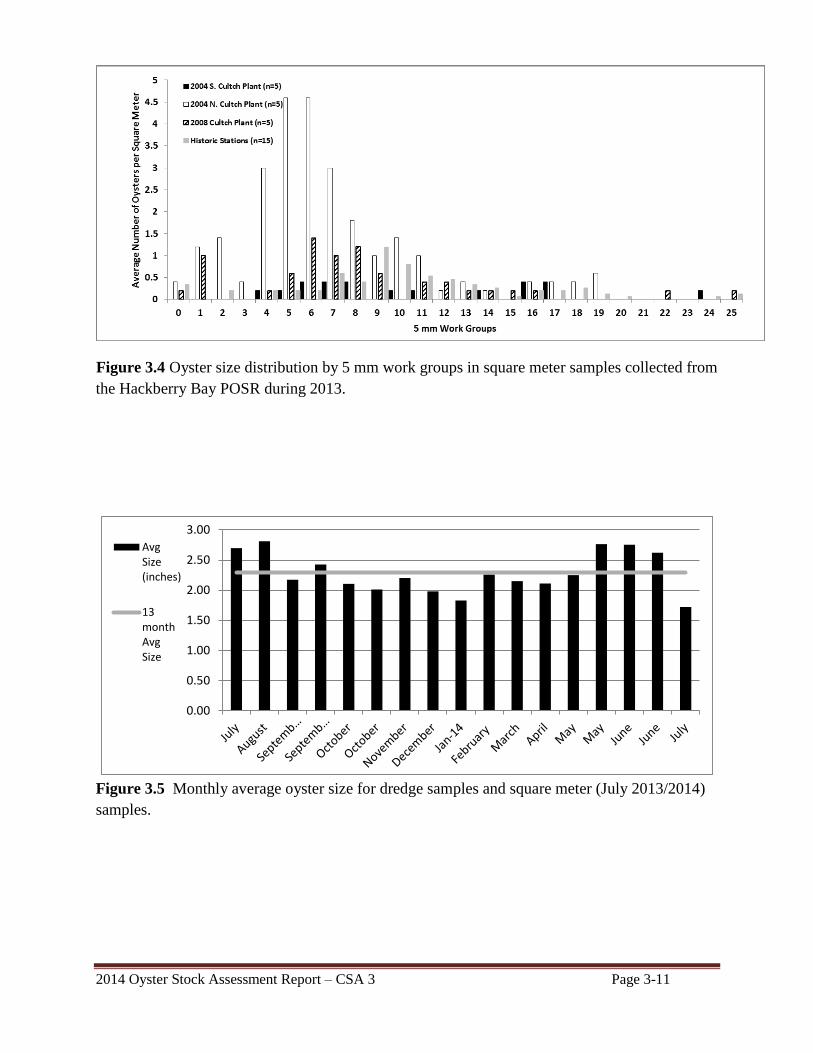
2014 Oyster Stock Assessment Report – CSA 3 Page 3-11
Figure 3.4 Oyster size distribution by 5 mm work groups in square meter samples collected from
the Hackberry Bay POSR during 2013.
0.00
0.50
1.00
1.50
2.00
2.50
3.00
AvgSize(inches)
13monthAvgSize
Figure 3.5 Monthly average oyster size for dredge samples and square meter (July 2013/2014)
samples.
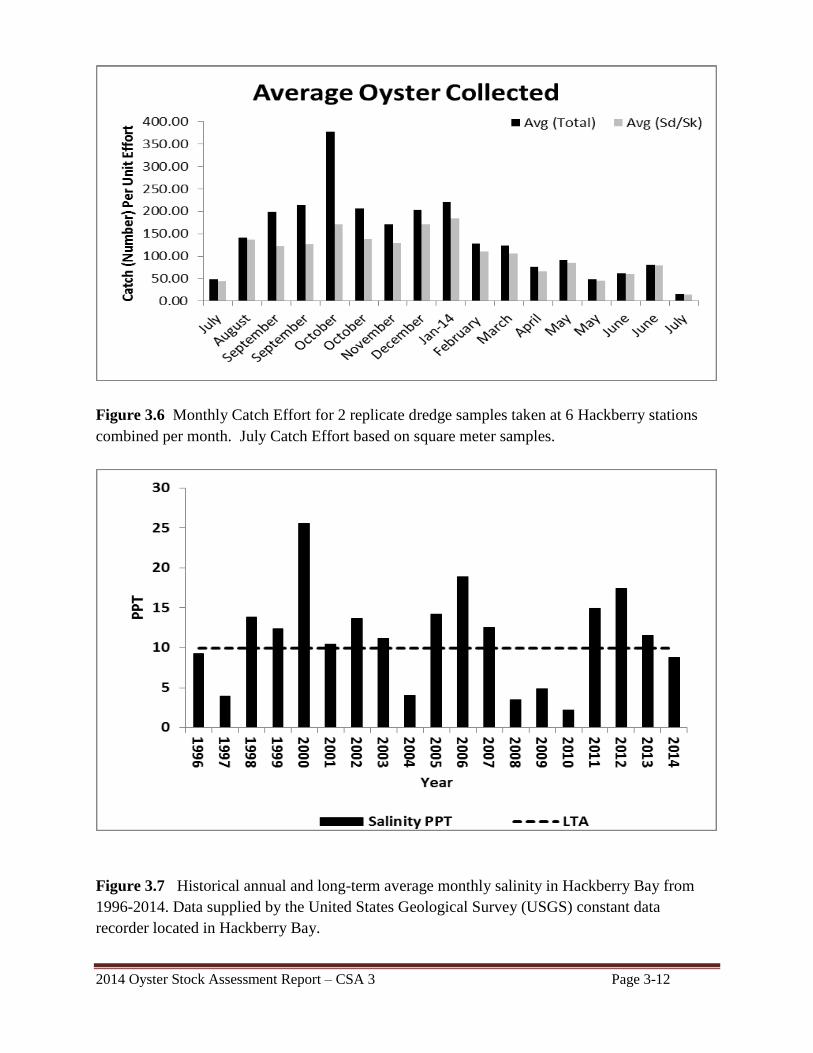
2014 Oyster Stock Assessment Report – CSA 3 Page 3-12
Figure 3.6 Monthly Catch Effort for 2 replicate dredge samples taken at 6 Hackberry stations
combined per month. July Catch Effort based on square meter samples.
Figure 3.7 Historical annual and long-term average monthly salinity in Hackberry Bay from
1996-2014. Data supplied by the United States Geological Survey (USGS) constant data
recorder located in Hackberry Bay.
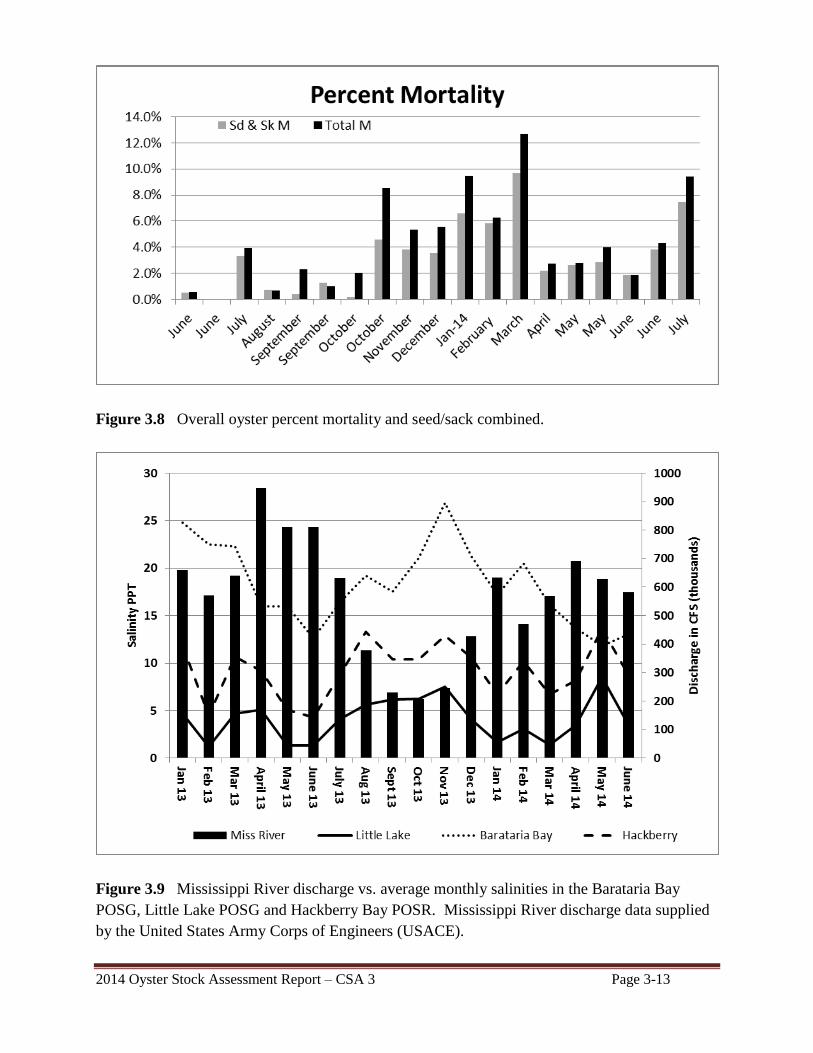
2014 Oyster Stock Assessment Report – CSA 3 Page 3-13
Figure 3.8 Overall oyster percent mortality and seed/sack combined.
Figure 3.9 Mississippi River discharge vs. average monthly salinities in the Barataria Bay
POSG, Little Lake POSG and Hackberry Bay POSR. Mississippi River discharge data supplied
by the United States Army Corps of Engineers (USACE).
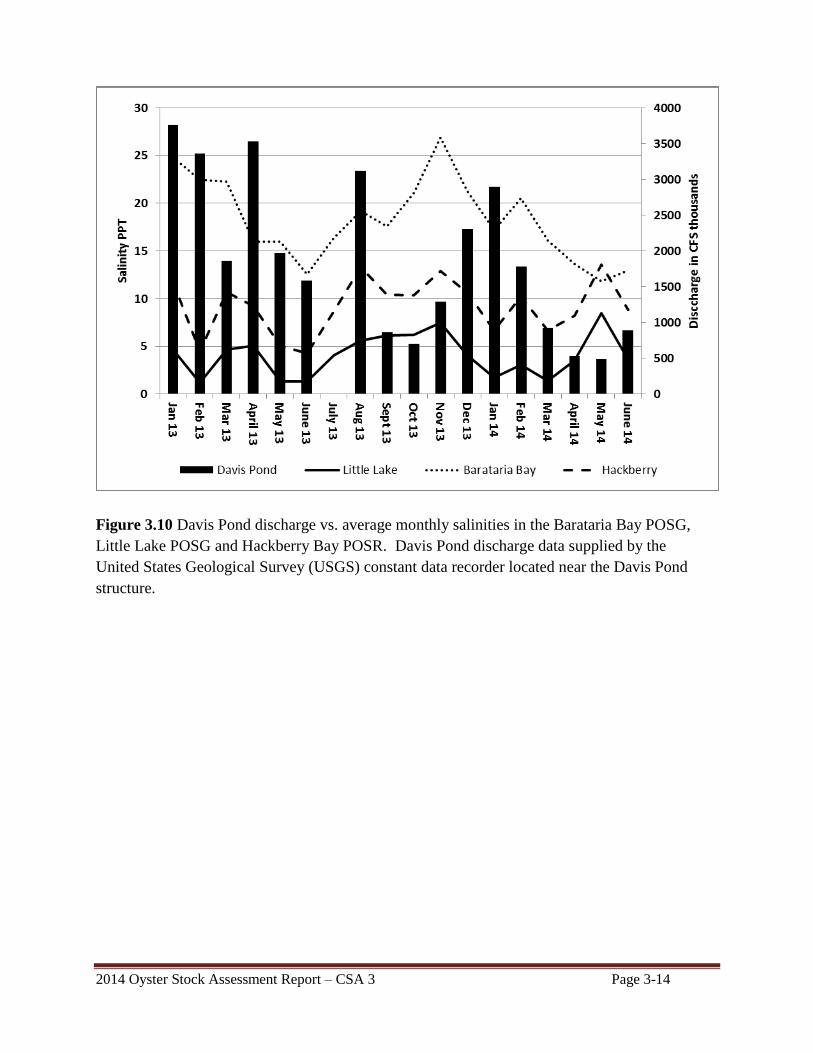
2014 Oyster Stock Assessment Report – CSA 3 Page 3-14
Figure 3.10 Davis Pond discharge vs. average monthly salinities in the Barataria Bay POSG,
Little Lake POSG and Hackberry Bay POSR. Davis Pond discharge data supplied by the
United States Geological Survey (USGS) constant data recorder located near the Davis Pond
structure.
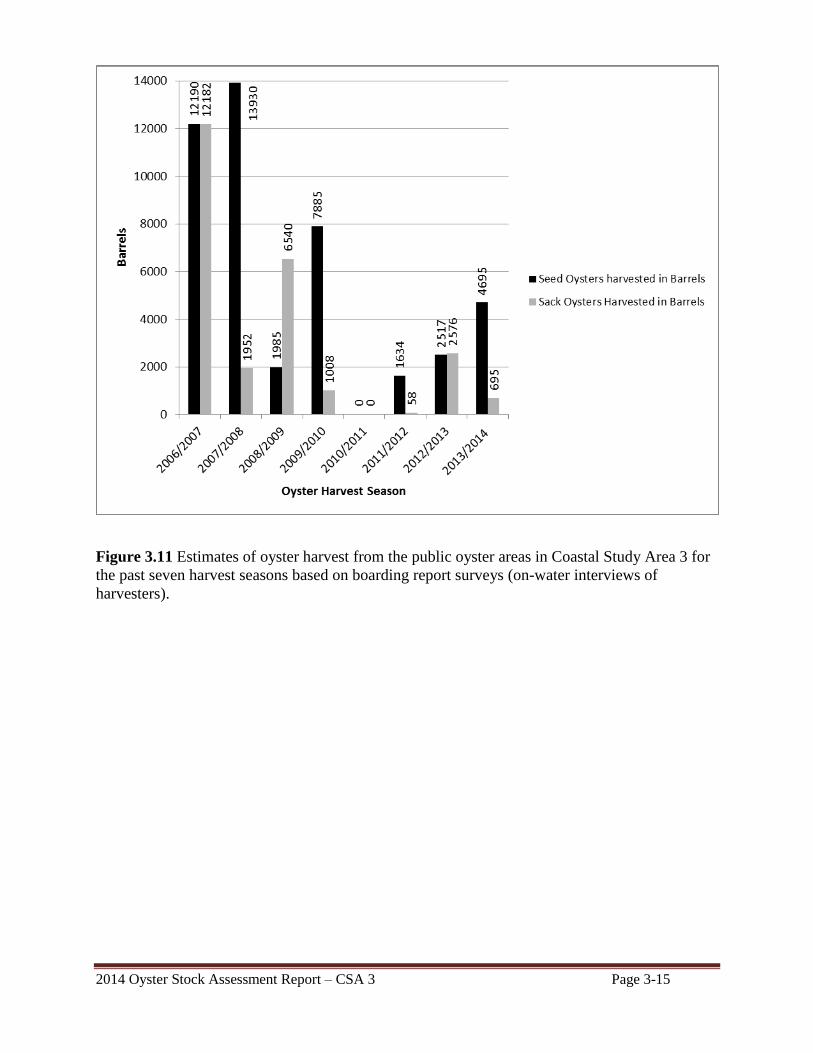
2014 Oyster Stock Assessment Report – CSA 3 Page 3-15
Figure 3.11 Estimates of oyster harvest from the public oyster areas in Coastal Study Area 3 for
the past seven harvest seasons based on boarding report surveys (on-water interviews of
harvesters).

This page intentionally left blank.
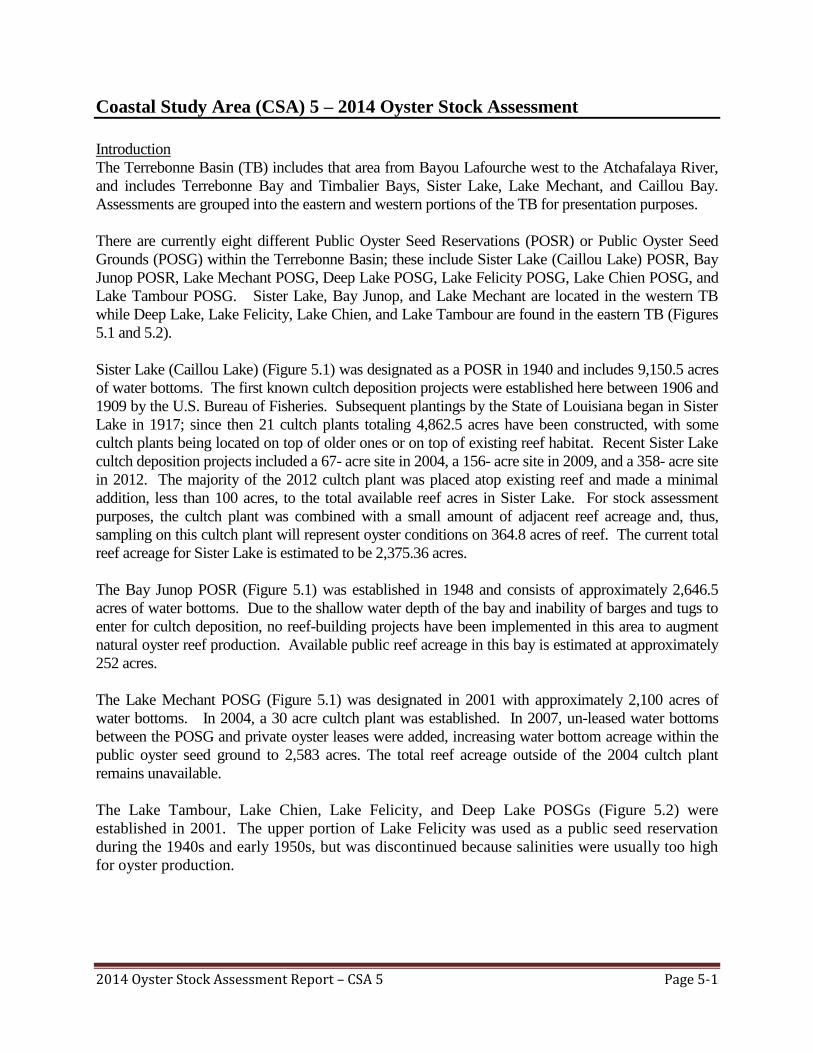
2014 Oyster Stock Assessment Report – CSA 5 Page 5-1
Coastal Study Area (CSA) 5 – 2014 Oyster Stock Assessment
Introduction
The Terrebonne Basin (TB) includes that area from Bayou Lafourche west to the Atchafalaya River,
and includes Terrebonne Bay and Timbalier Bays, Sister Lake, Lake Mechant, and Caillou Bay.
Assessments are grouped into the eastern and western portions of the TB for presentation purposes.
There are currently eight different Public Oyster Seed Reservations (POSR) or Public Oyster Seed
Grounds (POSG) within the Terrebonne Basin; these include Sister Lake (Caillou Lake) POSR, Bay
Junop POSR, Lake Mechant POSG, Deep Lake POSG, Lake Felicity POSG, Lake Chien POSG, and
Lake Tambour POSG. Sister Lake, Bay Junop, and Lake Mechant are located in the western TB
while Deep Lake, Lake Felicity, Lake Chien, and Lake Tambour are found in the eastern TB (Figures
5.1 and 5.2).
Sister Lake (Caillou Lake) (Figure 5.1) was designated as a POSR in 1940 and includes 9,150.5 acres
of water bottoms. The first known cultch deposition projects were established here between 1906 and
1909 by the U.S. Bureau of Fisheries. Subsequent plantings by the State of Louisiana began in Sister
Lake in 1917; since then 21 cultch plants totaling 4,862.5 acres have been constructed, with some
cultch plants being located on top of older ones or on top of existing reef habitat. Recent Sister Lake
cultch deposition projects included a 67- acre site in 2004, a 156- acre site in 2009, and a 358- acre site
in 2012. The majority of the 2012 cultch plant was placed atop existing reef and made a minimal
addition, less than 100 acres, to the total available reef acres in Sister Lake. For stock assessment
purposes, the cultch plant was combined with a small amount of adjacent reef acreage and, thus,
sampling on this cultch plant will represent oyster conditions on 364.8 acres of reef. The current total
reef acreage for Sister Lake is estimated to be 2,375.36 acres.
The Bay Junop POSR (Figure 5.1) was established in 1948 and consists of approximately 2,646.5
acres of water bottoms. Due to the shallow water depth of the bay and inability of barges and tugs to
enter for cultch deposition, no reef-building projects have been implemented in this area to augment
natural oyster reef production. Available public reef acreage in this bay is estimated at approximately
252 acres.
The Lake Mechant POSG (Figure 5.1) was designated in 2001 with approximately 2,100 acres of
water bottoms. In 2004, a 30 acre cultch plant was established. In 2007, un-leased water bottoms
between the POSG and private oyster leases were added, increasing water bottom acreage within the
public oyster seed ground to 2,583 acres. The total reef acreage outside of the 2004 cultch plant
remains unavailable.
The Lake Tambour, Lake Chien, Lake Felicity, and Deep Lake POSGs (Figure 5.2) were
established in 2001. The upper portion of Lake Felicity was used as a public seed reservation
during the 1940s and early 1950s, but was discontinued because salinities were usually too high
for oyster production.
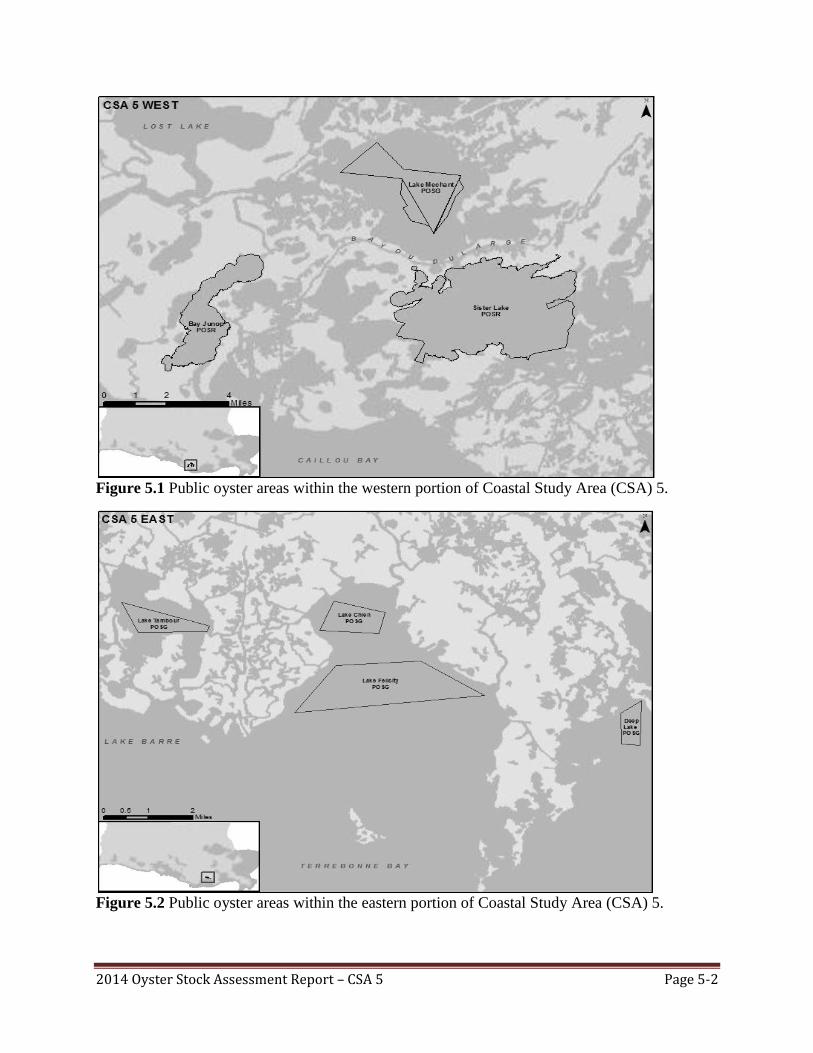
2014 Oyster Stock Assessment Report – CSA 5 Page 5-2
Figure 5.1 Public oyster areas within the western portion of Coastal Study Area (CSA) 5.
Figure 5.2 Public oyster areas within the eastern portion of Coastal Study Area (CSA) 5.
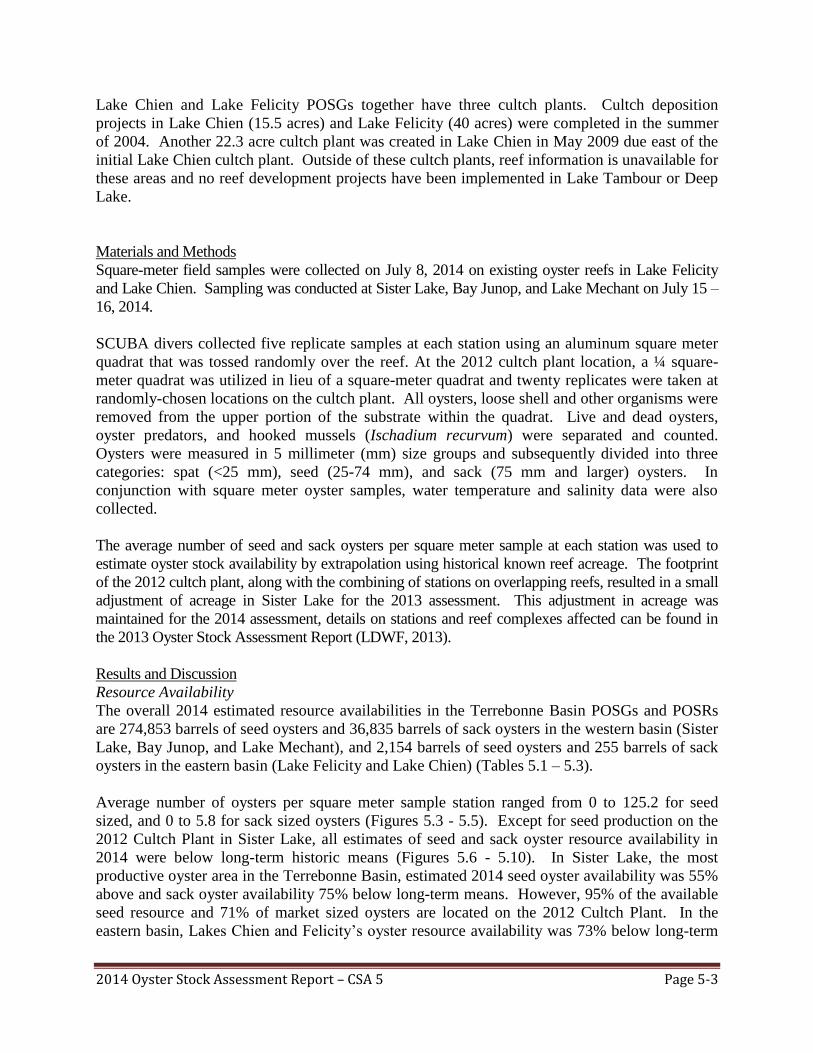
2014 Oyster Stock Assessment Report – CSA 5 Page 5-3
Lake Chien and Lake Felicity POSGs together have three cultch plants. Cultch deposition
projects in Lake Chien (15.5 acres) and Lake Felicity (40 acres) were completed in the summer
of 2004. Another 22.3 acre cultch plant was created in Lake Chien in May 2009 due east of the
initial Lake Chien cultch plant. Outside of these cultch plants, reef information is unavailable for
these areas and no reef development projects have been implemented in Lake Tambour or Deep
Lake.
Materials and Methods
Square-meter field samples were collected on July 8, 2014 on existing oyster reefs in Lake Felicity
and Lake Chien. Sampling was conducted at Sister Lake, Bay Junop, and Lake Mechant on July 15 –
16, 2014.
SCUBA divers collected five replicate samples at each station using an aluminum square meter
quadrat that was tossed randomly over the reef. At the 2012 cultch plant location, a ¼ square-
meter quadrat was utilized in lieu of a square-meter quadrat and twenty replicates were taken at
randomly-chosen locations on the cultch plant. All oysters, loose shell and other organisms were
removed from the upper portion of the substrate within the quadrat. Live and dead oysters,
oyster predators, and hooked mussels (Ischadium recurvum) were separated and counted.
Oysters were measured in 5 millimeter (mm) size groups and subsequently divided into three
categories: spat (<25 mm), seed (25-74 mm), and sack (75 mm and larger) oysters. In
conjunction with square meter oyster samples, water temperature and salinity data were also
collected.
The average number of seed and sack oysters per square meter sample at each station was used to
estimate oyster stock availability by extrapolation using historical known reef acreage. The footprint
of the 2012 cultch plant, along with the combining of stations on overlapping reefs, resulted in a small
adjustment of acreage in Sister Lake for the 2013 assessment. This adjustment in acreage was
maintained for the 2014 assessment, details on stations and reef complexes affected can be found in
the 2013 Oyster Stock Assessment Report (LDWF, 2013).
Results and Discussion
Resource Availability
The overall 2014 estimated resource availabilities in the Terrebonne Basin POSGs and POSRs
are 274,853 barrels of seed oysters and 36,835 barrels of sack oysters in the western basin (Sister
Lake, Bay Junop, and Lake Mechant), and 2,154 barrels of seed oysters and 255 barrels of sack
oysters in the eastern basin (Lake Felicity and Lake Chien) (Tables 5.1 – 5.3).
Average number of oysters per square meter sample station ranged from 0 to 125.2 for seed
sized, and 0 to 5.8 for sack sized oysters (Figures 5.3 - 5.5). Except for seed production on the
2012 Cultch Plant in Sister Lake, all estimates of seed and sack oyster resource availability in
2014 were below long-term historic means (Figures 5.6 - 5.10). In Sister Lake, the most
productive oyster area in the Terrebonne Basin, estimated 2014 seed oyster availability was 55%
above and sack oyster availability 75% below long-term means. However, 95% of the available
seed resource and 71% of market sized oysters are located on the 2012 Cultch Plant. In the
eastern basin, Lakes Chien and Felicity’s oyster resource availability was 73% below long-term
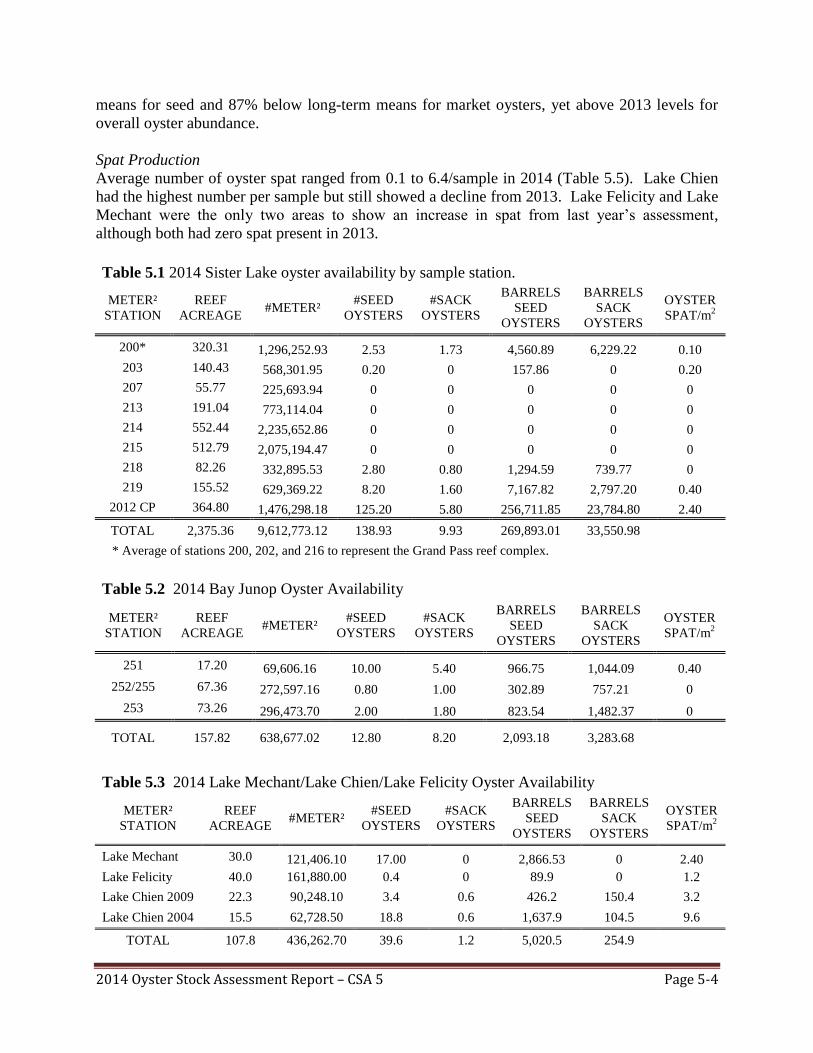
2014 Oyster Stock Assessment Report – CSA 5 Page 5-4
means for seed and 87% below long-term means for market oysters, yet above 2013 levels for
overall oyster abundance.
Spat Production
Average number of oyster spat ranged from 0.1 to 6.4/sample in 2014 (Table 5.5). Lake Chien
had the highest number per sample but still showed a decline from 2013. Lake Felicity and Lake
Mechant were the only two areas to show an increase in spat from last year’s assessment,
although both had zero spat present in 2013.
Table 5.1 2014 Sister Lake oyster availability by sample station.
METER²
STATION
REEF
ACREAGE #METER²
#SEED
OYSTERS
#SACK
OYSTERS
BARRELS
SEED
OYSTERS
BARRELS
SACK
OYSTERS
OYSTER
SPAT/m2
200* 320.31 1,296,252.93 2.53 1.73 4,560.89 6,229.22 0.10
203 140.43 568,301.95 0.20 0 157.86 0 0.20
207 55.77 225,693.94 0 0 0 0 0
213 191.04 773,114.04 0 0 0 0 0
214 552.44 2,235,652.86 0 0 0 0 0
215 512.79 2,075,194.47 0 0 0 0 0
218 82.26 332,895.53 2.80 0.80 1,294.59 739.77 0
219 155.52 629,369.22 8.20 1.60 7,167.82 2,797.20 0.40
2012 CP 364.80 1,476,298.18 125.20 5.80 256,711.85 23,784.80 2.40
TOTAL 2,375.36 9,612,773.12 138.93 9.93 269,893.01 33,550.98
* Average of stations 200, 202, and 216 to represent the Grand Pass reef complex.
Table 5.2 2014 Bay Junop Oyster Availability
METER²
STATION
REEF
ACREAGE #METER²
#SEED
OYSTERS
#SACK
OYSTERS
BARRELS
SEED
OYSTERS
BARRELS
SACK
OYSTERS
OYSTER
SPAT/m2
251 17.20 69,606.16 10.00 5.40 966.75 1,044.09 0.40
252/255 67.36 272,597.16 0.80 1.00 302.89 757.21 0
253 73.26 296,473.70 2.00 1.80 823.54 1,482.37 0
TOTAL 157.82 638,677.02 12.80 8.20 2,093.18 3,283.68
Table 5.3 2014 Lake Mechant/Lake Chien/Lake Felicity Oyster Availability
METER²
STATION
REEF
ACREAGE #METER²
#SEED
OYSTERS
#SACK
OYSTERS
BARRELS
SEED
OYSTERS
BARRELS
SACK
OYSTERS
OYSTER
SPAT/m2
Lake Mechant 30.0 121,406.10 17.00 0 2,866.53 0 2.40
Lake Felicity 40.0 161,880.00 0.4 0 89.9 0 1.2
Lake Chien 2009 22.3 90,248.10 3.4 0.6 426.2 150.4 3.2
Lake Chien 2004 15.5 62,728.50 18.8 0.6 1,637.9 104.5 9.6
TOTAL 107.8 436,262.70 39.6 1.2 5,020.5 254.9
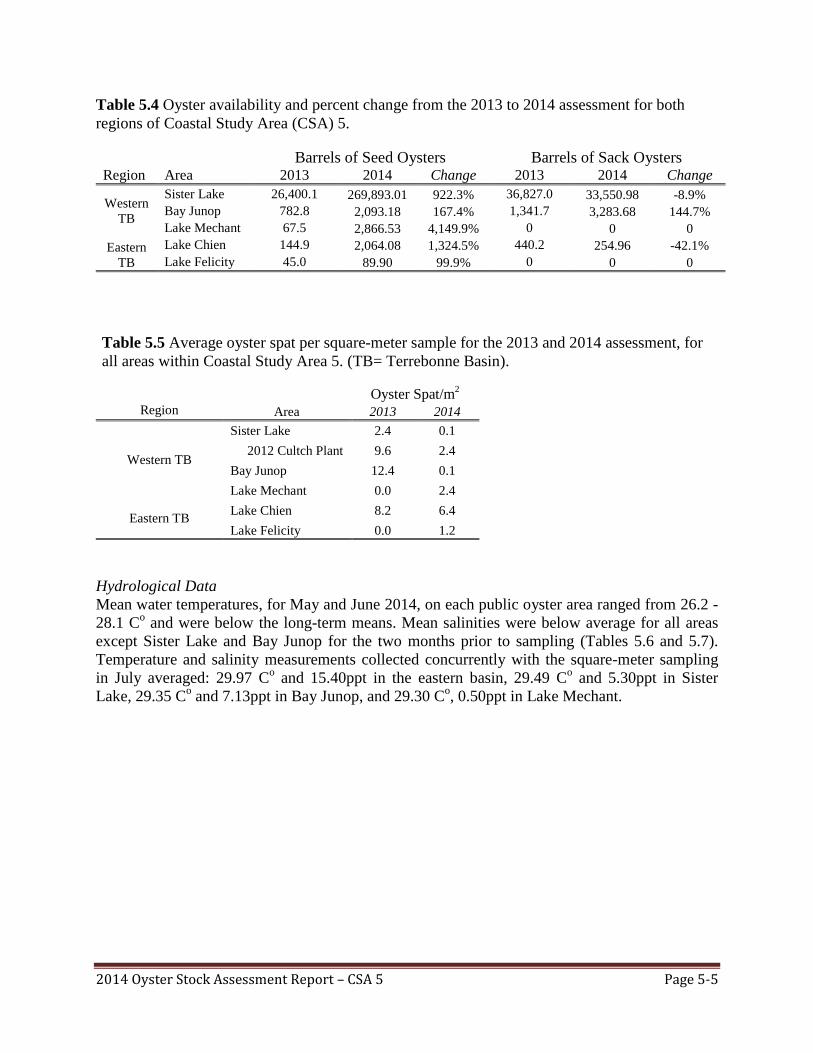
2014 Oyster Stock Assessment Report – CSA 5 Page 5-5
Table 5.4 Oyster availability and percent change from the 2013 to 2014 assessment for both
regions of Coastal Study Area (CSA) 5.
Barrels of Seed Oysters Barrels of Sack Oysters Region Area 2013 2014 Change 2013 2014 Change
Western
TB
Sister Lake 26,400.1 269,893.01 922.3% 36,827.0 33,550.98 -8.9%
Bay Junop 782.8 2,093.18 167.4% 1,341.7 3,283.68 144.7%
Lake Mechant 67.5 2,866.53 4,149.9% 0 0 0
Eastern
TB
Lake Chien 144.9 2,064.08 1,324.5% 440.2 254.96 -42.1%
Lake Felicity 45.0 89.90 99.9% 0 0 0
Table 5.5 Average oyster spat per square-meter sample for the 2013 and 2014 assessment, for
all areas within Coastal Study Area 5. (TB= Terrebonne Basin).
Oyster Spat/m2
Region Area 2013 2014
Western TB
Sister Lake 2.4 0.1
2012 Cultch Plant 9.6 2.4
Bay Junop 12.4 0.1
Lake Mechant 0.0 2.4
Eastern TB Lake Chien 8.2 6.4
Lake Felicity 0.0 1.2
Hydrological Data
Mean water temperatures, for May and June 2014, on each public oyster area ranged from 26.2 -
28.1 Co and were below the long-term means. Mean salinities were below average for all areas
except Sister Lake and Bay Junop for the two months prior to sampling (Tables 5.6 and 5.7).
Temperature and salinity measurements collected concurrently with the square-meter sampling
in July averaged: 29.97 Co and 15.40ppt in the eastern basin, 29.49 C
o and 5.30ppt in Sister
Lake, 29.35 Co and 7.13ppt in Bay Junop, and 29.30 C
o, 0.50ppt in Lake Mechant.
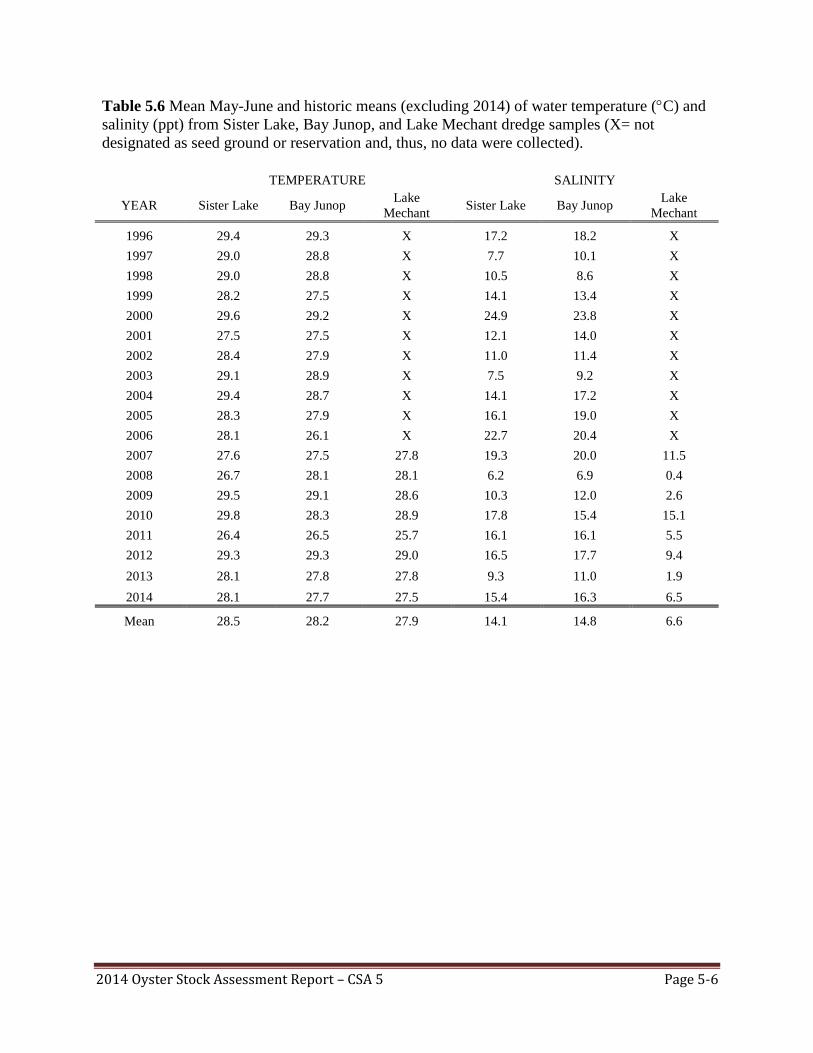
2014 Oyster Stock Assessment Report – CSA 5 Page 5-6
Table 5.6 Mean May-June and historic means (excluding 2014) of water temperature (C) and
salinity (ppt) from Sister Lake, Bay Junop, and Lake Mechant dredge samples (X= not
designated as seed ground or reservation and, thus, no data were collected).
TEMPERATURE SALINITY
YEAR Sister Lake Bay Junop Lake
Mechant Sister Lake Bay Junop
Lake
Mechant
1996 29.4 29.3 X 17.2 18.2 X
1997 29.0 28.8 X 7.7 10.1 X
1998 29.0 28.8 X 10.5 8.6 X
1999 28.2 27.5 X 14.1 13.4 X
2000 29.6 29.2 X 24.9 23.8 X
2001 27.5 27.5 X 12.1 14.0 X
2002 28.4 27.9 X 11.0 11.4 X
2003 29.1 28.9 X 7.5 9.2 X
2004 29.4 28.7 X 14.1 17.2 X
2005 28.3 27.9 X 16.1 19.0 X
2006 28.1 26.1 X 22.7 20.4 X
2007 27.6 27.5 27.8 19.3 20.0 11.5
2008 26.7 28.1 28.1 6.2 6.9 0.4
2009 29.5 29.1 28.6 10.3 12.0 2.6
2010 29.8 28.3 28.9 17.8 15.4 15.1
2011 26.4 26.5 25.7 16.1 16.1 5.5
2012 29.3 29.3 29.0 16.5 17.7 9.4
2013 28.1 27.8 27.8 9.3 11.0 1.9
2014 28.1 27.7 27.5 15.4 16.3 6.5
Mean 28.5 28.2 27.9 14.1 14.8 6.6
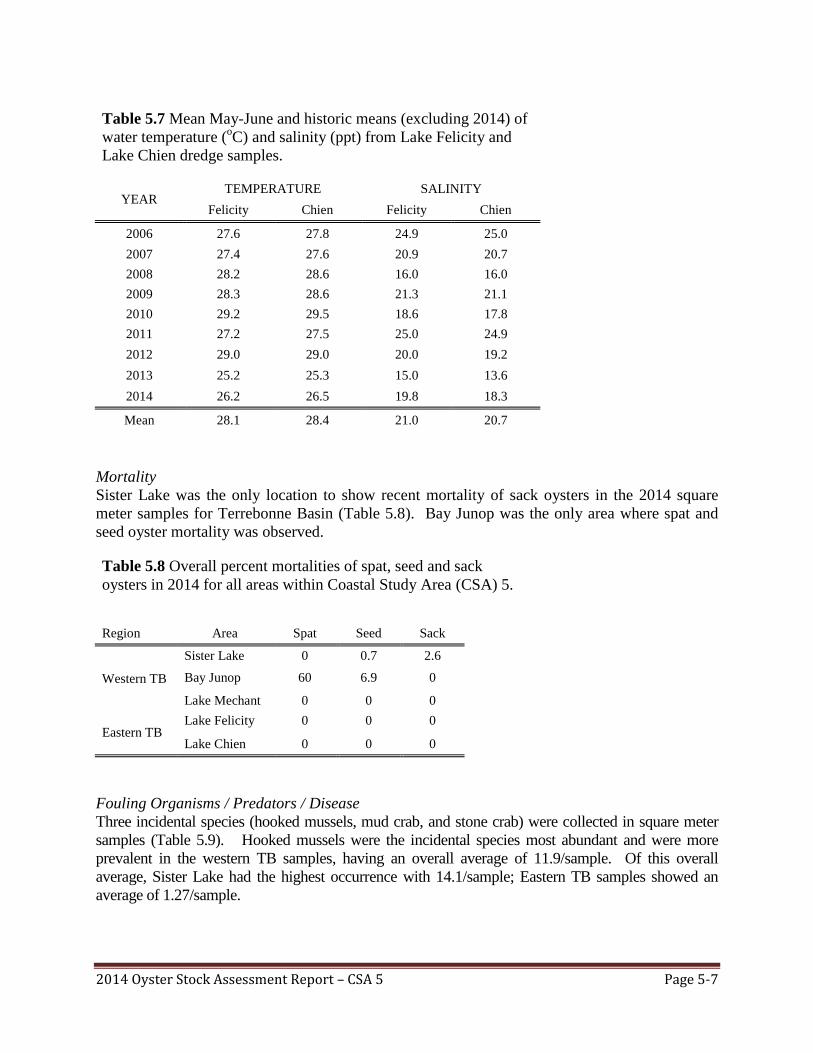
2014 Oyster Stock Assessment Report – CSA 5 Page 5-7
Table 5.7 Mean May-June and historic means (excluding 2014) of
water temperature (oC) and salinity (ppt) from Lake Felicity and
Lake Chien dredge samples.
YEAR TEMPERATURE SALINITY
Felicity Chien Felicity Chien
2006 27.6 27.8 24.9 25.0
2007 27.4 27.6 20.9 20.7
2008 28.2 28.6 16.0 16.0
2009 28.3 28.6 21.3 21.1
2010 29.2 29.5 18.6 17.8
2011 27.2 27.5 25.0 24.9
2012 29.0 29.0 20.0 19.2
2013 25.2 25.3 15.0 13.6
2014 26.2 26.5 19.8 18.3
Mean 28.1 28.4 21.0 20.7
Mortality
Sister Lake was the only location to show recent mortality of sack oysters in the 2014 square
meter samples for Terrebonne Basin (Table 5.8). Bay Junop was the only area where spat and
seed oyster mortality was observed.
Table 5.8 Overall percent mortalities of spat, seed and sack
oysters in 2014 for all areas within Coastal Study Area (CSA) 5.
Region Area Spat Seed Sack
Western TB
Sister Lake 0 0.7 2.6
Bay Junop 60 6.9 0
Lake Mechant 0 0 0
Eastern TB Lake Felicity 0 0 0
Lake Chien 0 0 0
Fouling Organisms / Predators / Disease
Three incidental species (hooked mussels, mud crab, and stone crab) were collected in square meter
samples (Table 5.9). Hooked mussels were the incidental species most abundant and were more
prevalent in the western TB samples, having an overall average of 11.9/sample. Of this overall
average, Sister Lake had the highest occurrence with 14.1/sample; Eastern TB samples showed an
average of 1.27/sample.
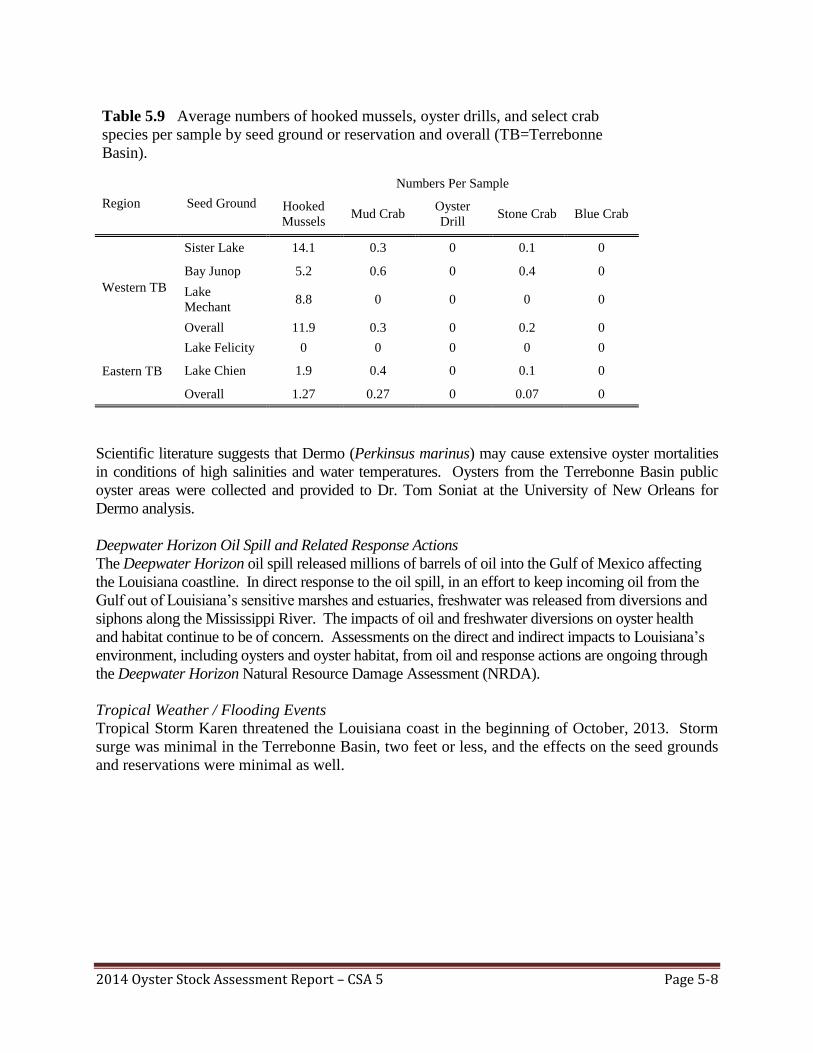
2014 Oyster Stock Assessment Report – CSA 5 Page 5-8
Table 5.9 Average numbers of hooked mussels, oyster drills, and select crab
species per sample by seed ground or reservation and overall (TB=Terrebonne
Basin).
Numbers Per Sample
Region Seed Ground Hooked
Mussels Mud Crab
Oyster
Drill Stone Crab Blue Crab
Western TB
Sister Lake 14.1 0.3 0 0.1 0
Bay Junop 5.2 0.6 0 0.4 0
Lake
Mechant 8.8 0 0 0 0
Overall 11.9 0.3 0 0.2 0
Eastern TB
Lake Felicity 0 0 0 0 0
Lake Chien 1.9 0.4 0 0.1 0
Overall 1.27 0.27 0 0.07 0
Scientific literature suggests that Dermo (Perkinsus marinus) may cause extensive oyster mortalities
in conditions of high salinities and water temperatures. Oysters from the Terrebonne Basin public
oyster areas were collected and provided to Dr. Tom Soniat at the University of New Orleans for
Dermo analysis.
Deepwater Horizon Oil Spill and Related Response Actions
The Deepwater Horizon oil spill released millions of barrels of oil into the Gulf of Mexico affecting
the Louisiana coastline. In direct response to the oil spill, in an effort to keep incoming oil from the
Gulf out of Louisiana’s sensitive marshes and estuaries, freshwater was released from diversions and
siphons along the Mississippi River. The impacts of oil and freshwater diversions on oyster health
and habitat continue to be of concern. Assessments on the direct and indirect impacts to Louisiana’s
environment, including oysters and oyster habitat, from oil and response actions are ongoing through
the Deepwater Horizon Natural Resource Damage Assessment (NRDA).
Tropical Weather / Flooding Events
Tropical Storm Karen threatened the Louisiana coast in the beginning of October, 2013. Storm
surge was minimal in the Terrebonne Basin, two feet or less, and the effects on the seed grounds
and reservations were minimal as well.
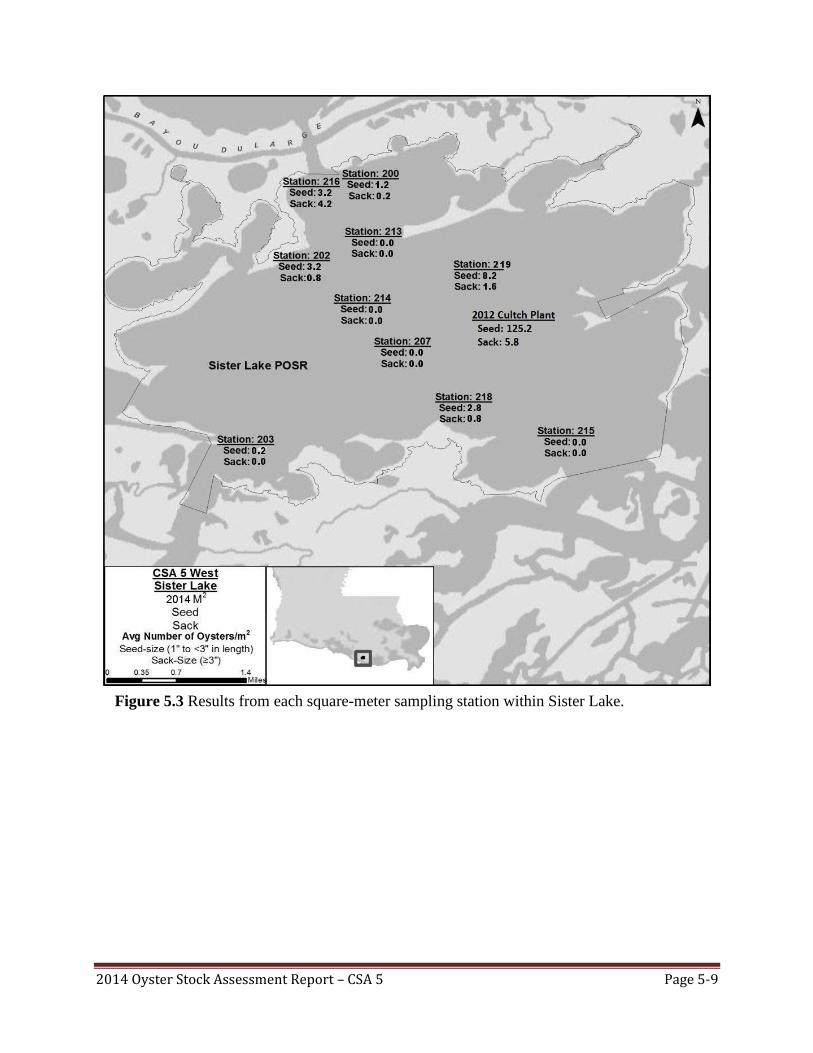
2014 Oyster Stock Assessment Report – CSA 5 Page 5-9
Figure 5.3 Results from each square-meter sampling station within Sister Lake.
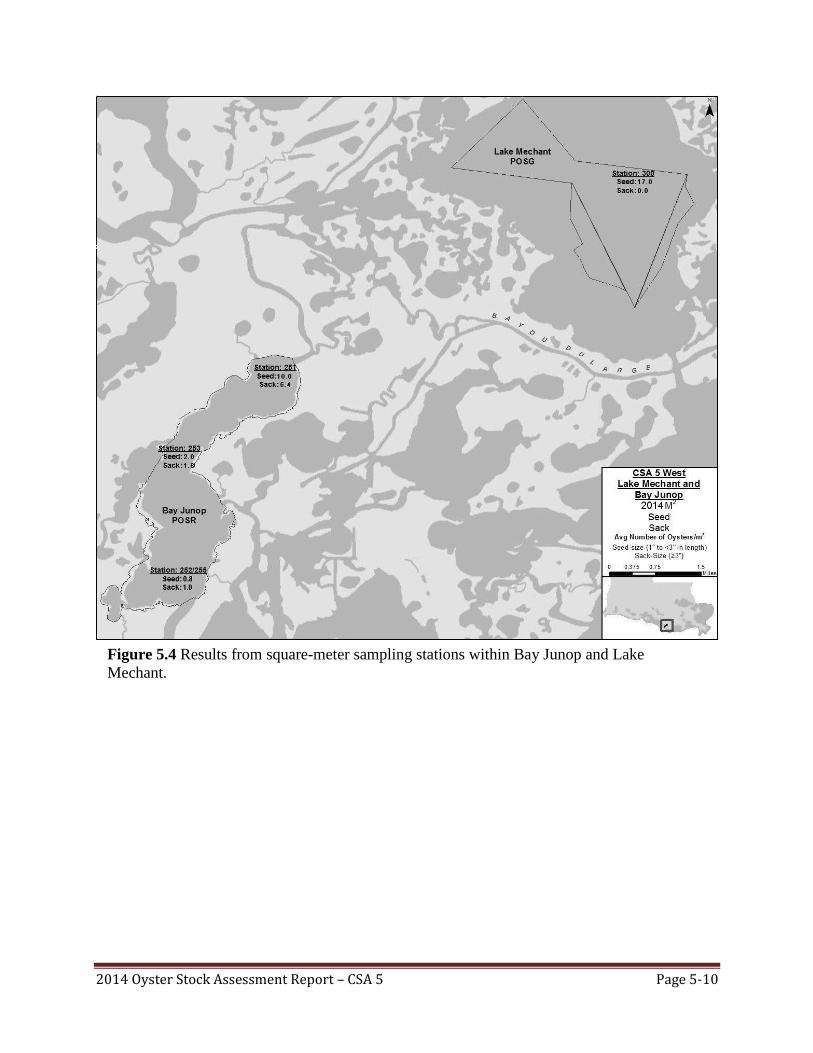
2014 Oyster Stock Assessment Report – CSA 5 Page 5-10
Figure 5.4 Results from square-meter sampling stations within Bay Junop and Lake
Mechant.
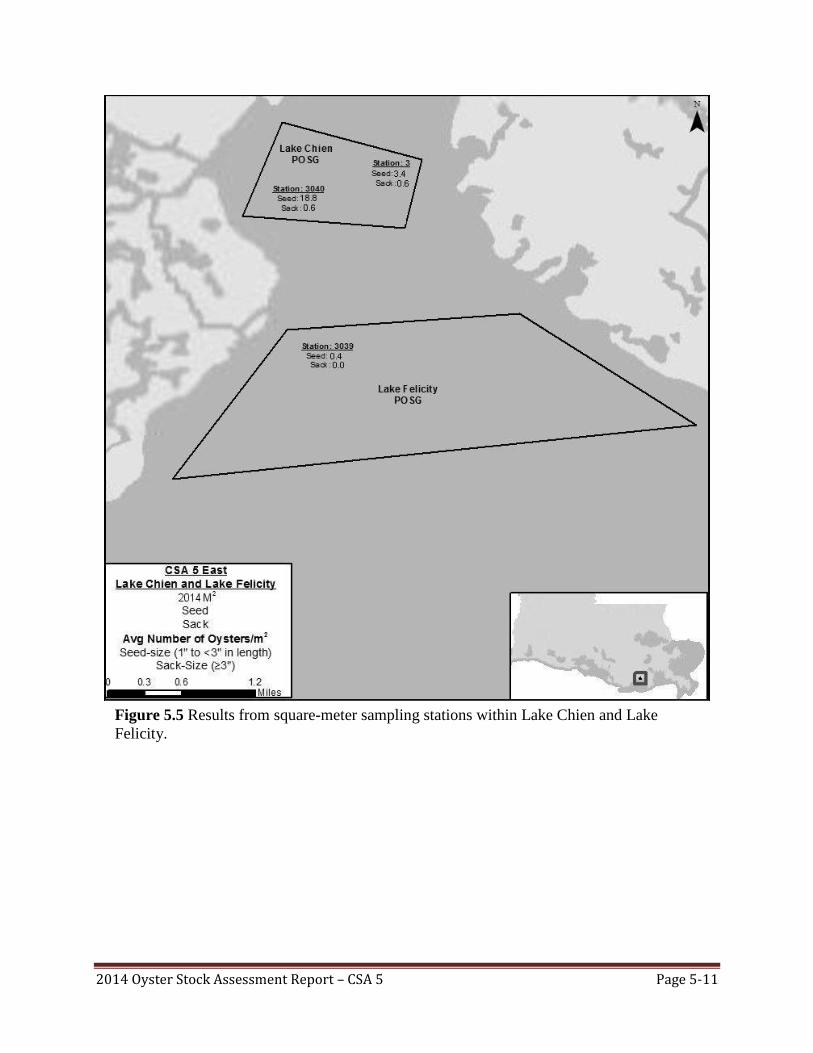
2014 Oyster Stock Assessment Report – CSA 5 Page 5-11
Figure 5.5 Results from square-meter sampling stations within Lake Chien and Lake
Felicity.
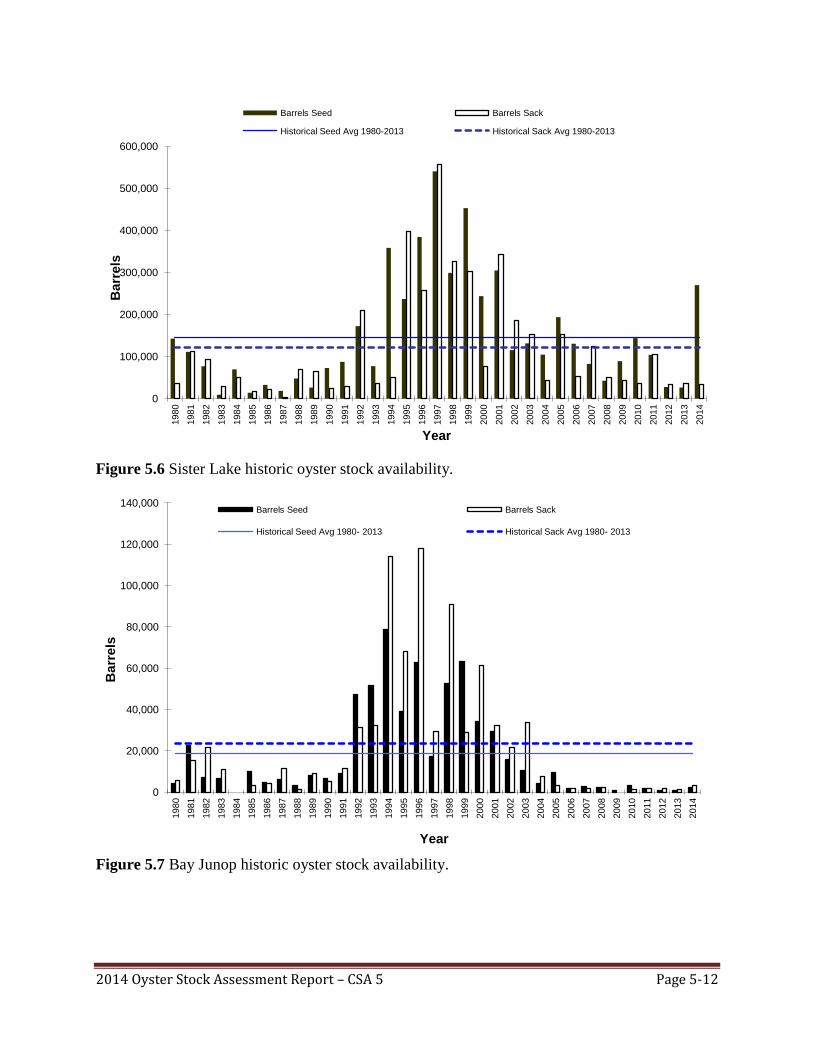
2014 Oyster Stock Assessment Report – CSA 5 Page 5-12
Figure 5.6 Sister Lake historic oyster stock availability.
Figure 5.7 Bay Junop historic oyster stock availability.
0
100,000
200,000
300,000
400,000
500,000
600,000
1980
1981
1982
1983
1984
1985
1986
1987
1988
1989
1990
1991
1992
1993
1994
1995
1996
1997
1998
1999
2000
2001
2002
2003
2004
2005
2006
2007
2008
2009
2010
2011
2012
2013
2014
Barr
els
Year
Barrels Seed Barrels Sack
Historical Seed Avg 1980-2013 Historical Sack Avg 1980-2013
0
20,000
40,000
60,000
80,000
100,000
120,000
140,000
1980
1981
1982
1983
1984
1985
1986
1987
1988
1989
1990
1991
1992
1993
1994
1995
1996
1997
1998
1999
2000
2001
2002
2003
2004
2005
2006
2007
2008
2009
2010
2011
2012
2013
2014
Barr
els
Year
Barrels Seed Barrels Sack
Historical Seed Avg 1980- 2013 Historical Sack Avg 1980- 2013
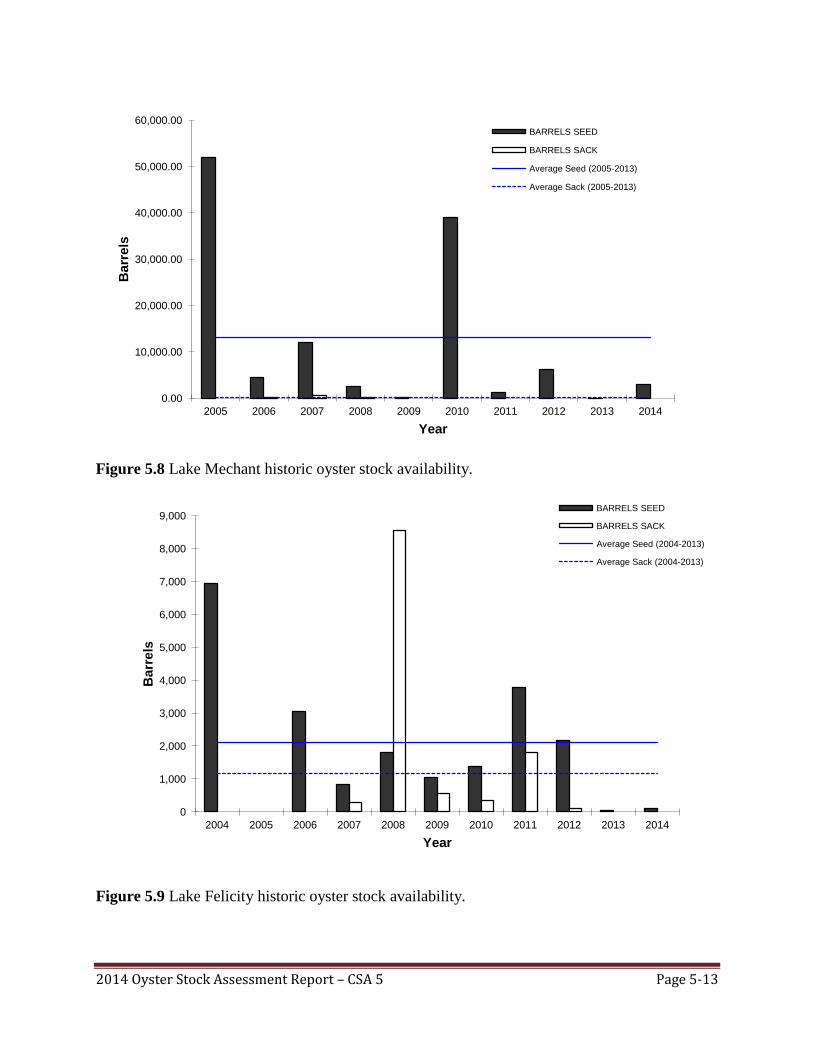
2014 Oyster Stock Assessment Report – CSA 5 Page 5-13
Figure 5.8 Lake Mechant historic oyster stock availability.
Figure 5.9 Lake Felicity historic oyster stock availability.
0.00
10,000.00
20,000.00
30,000.00
40,000.00
50,000.00
60,000.00
2005 2006 2007 2008 2009 2010 2011 2012 2013 2014
Barr
els
Year
BARRELS SEED
BARRELS SACK
Average Seed (2005-2013)
Average Sack (2005-2013)
0
1,000
2,000
3,000
4,000
5,000
6,000
7,000
8,000
9,000
2004 2005 2006 2007 2008 2009 2010 2011 2012 2013 2014
Barr
els
Year
BARRELS SEED
BARRELS SACK
Average Seed (2004-2013)
Average Sack (2004-2013)
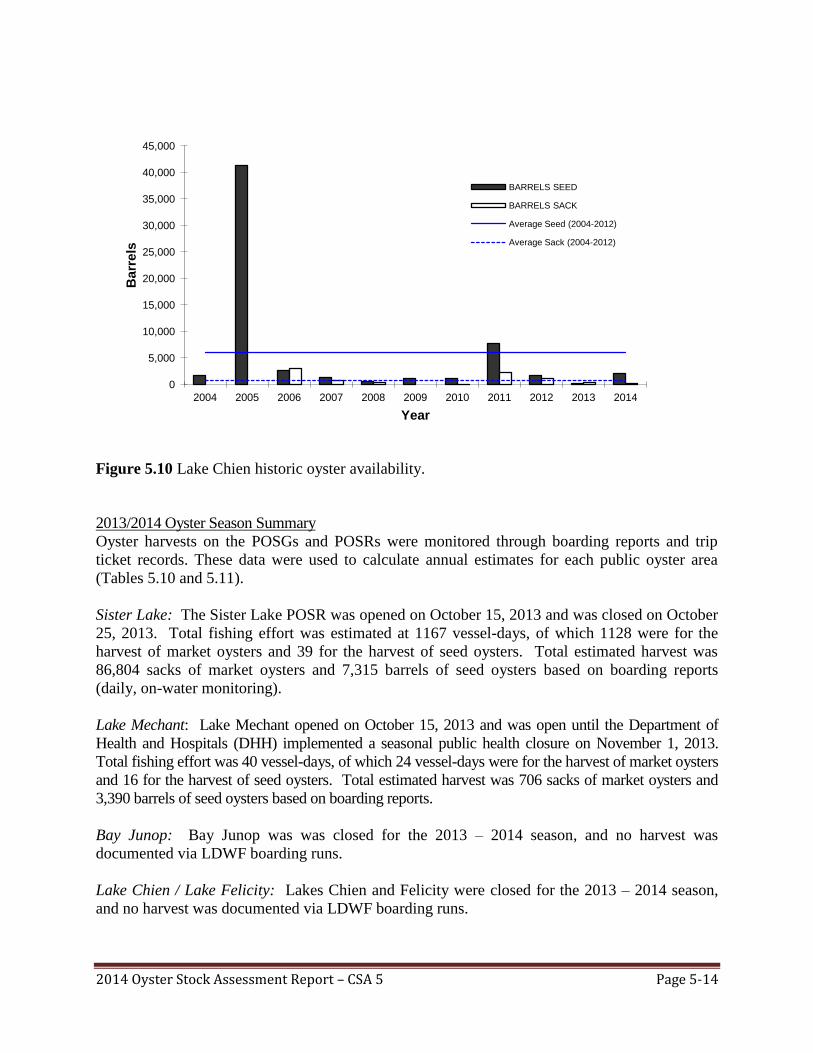
2014 Oyster Stock Assessment Report – CSA 5 Page 5-14
Figure 5.10 Lake Chien historic oyster availability.
2013/2014 Oyster Season Summary
Oyster harvests on the POSGs and POSRs were monitored through boarding reports and trip
ticket records. These data were used to calculate annual estimates for each public oyster area
(Tables 5.10 and 5.11).
Sister Lake: The Sister Lake POSR was opened on October 15, 2013 and was closed on October
25, 2013. Total fishing effort was estimated at 1167 vessel-days, of which 1128 were for the
harvest of market oysters and 39 for the harvest of seed oysters. Total estimated harvest was
86,804 sacks of market oysters and 7,315 barrels of seed oysters based on boarding reports
(daily, on-water monitoring).
Lake Mechant: Lake Mechant opened on October 15, 2013 and was open until the Department of
Health and Hospitals (DHH) implemented a seasonal public health closure on November 1, 2013.
Total fishing effort was 40 vessel-days, of which 24 vessel-days were for the harvest of market oysters
and 16 for the harvest of seed oysters. Total estimated harvest was 706 sacks of market oysters and
3,390 barrels of seed oysters based on boarding reports.
Bay Junop: Bay Junop was was closed for the 2013 – 2014 season, and no harvest was
documented via LDWF boarding runs.
Lake Chien / Lake Felicity: Lakes Chien and Felicity were closed for the 2013 – 2014 season,
and no harvest was documented via LDWF boarding runs.
0
5,000
10,000
15,000
20,000
25,000
30,000
35,000
40,000
45,000
2004 2005 2006 2007 2008 2009 2010 2011 2012 2013 2014
Barr
els
Year
BARRELS SEED
BARRELS SACK
Average Seed (2004-2012)
Average Sack (2004-2012)
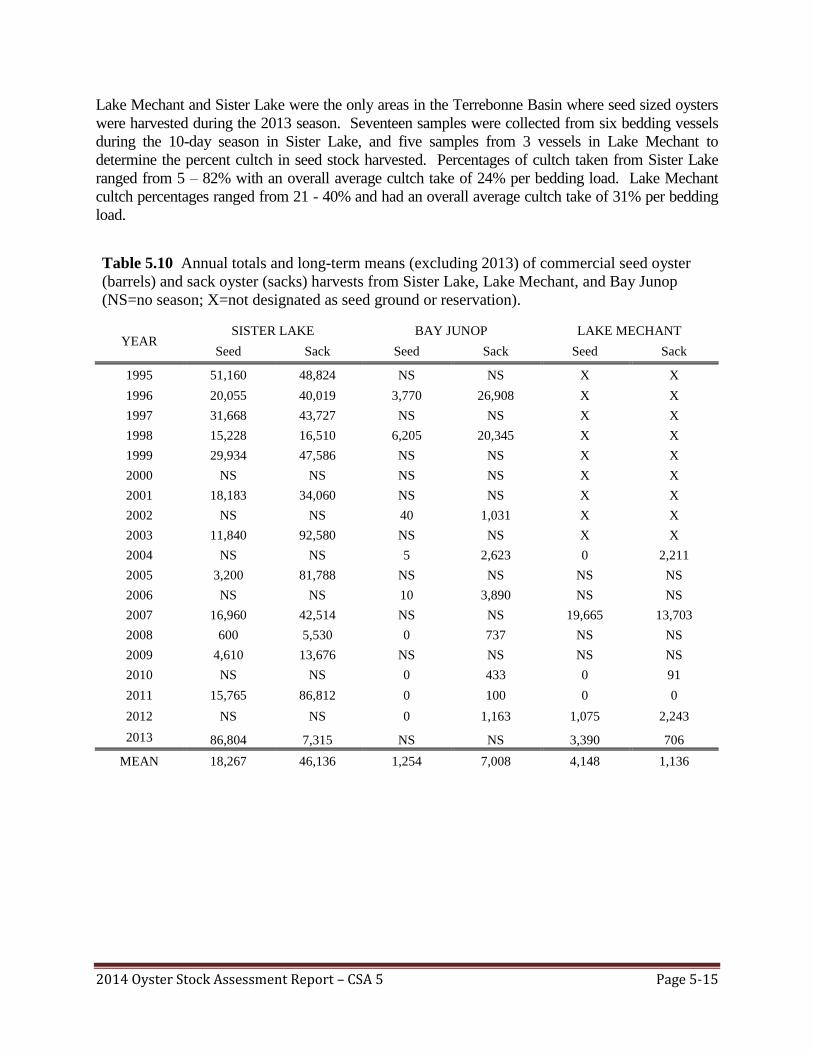
2014 Oyster Stock Assessment Report – CSA 5 Page 5-15
Lake Mechant and Sister Lake were the only areas in the Terrebonne Basin where seed sized oysters
were harvested during the 2013 season. Seventeen samples were collected from six bedding vessels
during the 10-day season in Sister Lake, and five samples from 3 vessels in Lake Mechant to
determine the percent cultch in seed stock harvested. Percentages of cultch taken from Sister Lake
ranged from 5 – 82% with an overall average cultch take of 24% per bedding load. Lake Mechant
cultch percentages ranged from 21 - 40% and had an overall average cultch take of 31% per bedding
load.
Table 5.10 Annual totals and long-term means (excluding 2013) of commercial seed oyster
(barrels) and sack oyster (sacks) harvests from Sister Lake, Lake Mechant, and Bay Junop
(NS=no season; X=not designated as seed ground or reservation).
YEAR SISTER LAKE BAY JUNOP LAKE MECHANT
Seed Sack Seed Sack Seed Sack
1995 51,160 48,824 NS NS X X
1996 20,055 40,019 3,770 26,908 X X
1997 31,668 43,727 NS NS X X
1998 15,228 16,510 6,205 20,345 X X
1999 29,934 47,586 NS NS X X
2000 NS NS NS NS X X
2001 18,183 34,060 NS NS X X
2002 NS NS 40 1,031 X X
2003 11,840 92,580 NS NS X X
2004 NS NS 5 2,623 0 2,211
2005 3,200 81,788 NS NS NS NS
2006 NS NS 10 3,890 NS NS
2007 16,960 42,514 NS NS 19,665 13,703
2008 600 5,530 0 737 NS NS
2009 4,610 13,676 NS NS NS NS
2010 NS NS 0 433 0 91
2011 15,765 86,812 0 100 0 0
2012 NS NS 0 1,163 1,075 2,243
2013 86,804 7,315 NS NS 3,390 706
MEAN 18,267 46,136 1,254 7,008 4,148 1,136
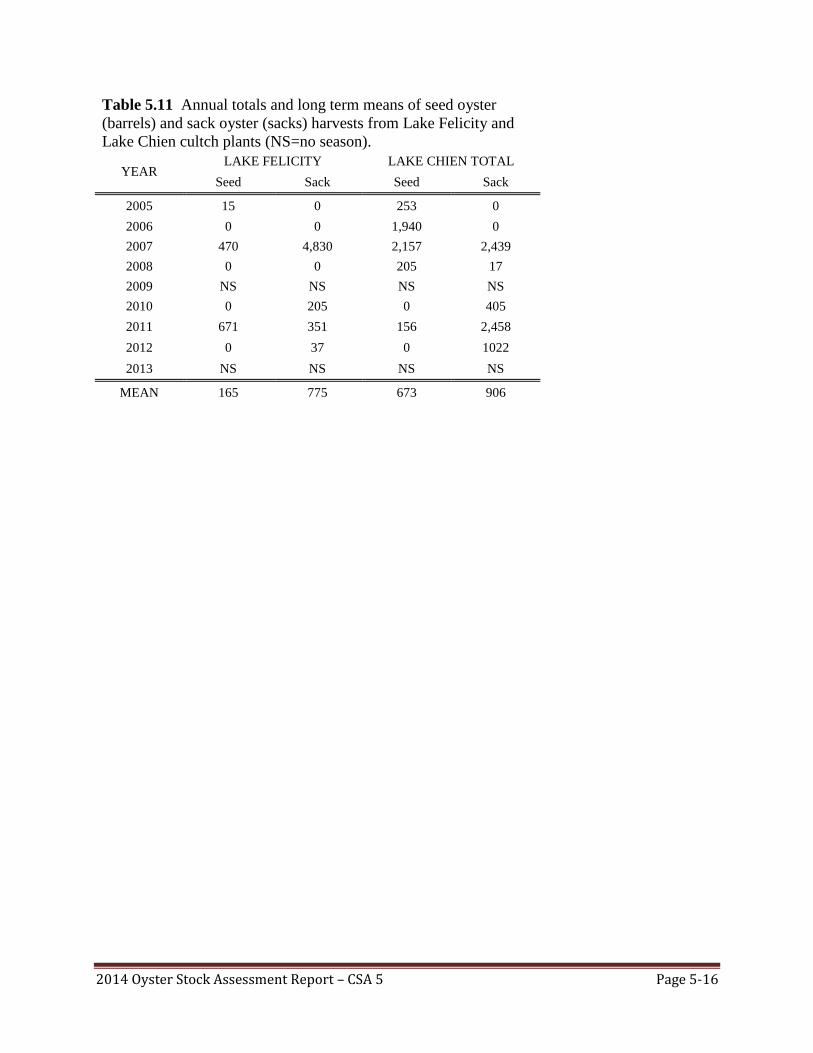
2014 Oyster Stock Assessment Report – CSA 5 Page 5-16
Table 5.11 Annual totals and long term means of seed oyster
(barrels) and sack oyster (sacks) harvests from Lake Felicity and
Lake Chien cultch plants (NS=no season).
YEAR LAKE FELICITY LAKE CHIEN TOTAL
Seed Sack Seed Sack
2005 15 0 253 0
2006 0 0 1,940 0
2007 470 4,830 2,157 2,439
2008 0 0 205 17
2009 NS NS NS NS
2010 0 205 0 405
2011 671 351 156 2,458
2012 0 37 0 1022
2013 NS NS NS NS
MEAN 165 775 673 906
2014 Oyster Stock Assessment Report – CSA 6 Page 6-1
Coastal Study Area (CSA) 6 – 2014 Oyster Stock Assessment
Introduction
Oyster reefs found in the Vermilion/East and West Cote Blanche/Atchafalaya Public Oyster Seed
Ground generally fall within the boundaries of Coastal Study Area 6 (CSA6). The inside oyster
seed ground, promulgated by the Louisiana Wildlife and Fisheries Commission in 1990, consists
of that portion of state water bottoms found generally north of a line from the western shore of
Vermilion Bay and Southwest Pass eastward to Point Au Fer. The outside area, designated in
1988, consists of Louisiana State Territorial Waters from the private oyster lease boundary near
Mound Point/Marsh Island eastward to Point Au Fer. Since 1986 (prior to the official designation
of these areas as seed grounds), LDWF managed the oyster resources found on local state water
bottoms in a manner similar to present seed ground management procedures. This allowed limited
harvest/relays from the Vermilion Bay area reefs when oyster abundance and distribution
permitted.
The Vermilion/Cote Blanche/Atchafalaya Bays Complex is a large, primarily open-water brackish
system with the public oyster seed grounds consisting of approximately 541,787 water bottom
acres. Primary influences on the bays dynamic salinity regime are the Gulf of Mexico, Atchafalaya
River and the adjacent Wax Lake Outlet, and the Vermilion River. In general, the public oyster
seed grounds within CSA 6 are highly influenced by freshwater discharge from the Atchafalaya
River. Typically, oyster reproduction occurs in the fall after the river stage abates, with oysters
growing to seed size (1 inch to < 3 inches) by the following spring. However, spring and early
summer floodwaters depress salinities, placing extreme physiological stress on the organisms.
These low salinities, coupled with high water temperatures through the summer months, typically
results in extensive oyster mortalities on the public grounds. Occasionally, however, reduced
freshwater inflow from the Atchafalaya River leads to higher-than-normal salinities and the normal
annual cycle of extensive oyster mortalities is broken, leading to a harvestable population of seed
oysters during the following oyster season (September through April). Such was the case in 2000,
2001, 2005, 2006, 2007, and 2013 when sizeable quantities of seed oysters were available for
harvest.
An overall Vermilion Bay area stock assessment is not possible at this time, as figures relative to
oyster reef sizes are not available. However, data collected from this year’s sampling program will
be compared to previous years’ data, with a look at hydrologic conditions, marine fouling, and
oyster predators on sampled reefs. In addition, information regarding the 2013/2014 oyster season
harvest on the Vermilion Bay area public oyster seed grounds will be presented.
Methods
Field sampling was conducted on July 16 and 25, 2014. A total of ten stations (Figures 6.1 and
6.2) were sampled with five replicate quadrat samples collected at each station, characterizing the
spatial distribution of sampling effort on the hard-bottom areas found within the system. Upon
reaching the designated site, the square meter frame was randomly thrown onto the oyster reef. A
SCUBA diver removed all oysters, associated macroscopic organisms, and loose surface shell
within the frame. All live oysters, and shells from recently dead oysters, were counted, measured
in five millimeter (mm) intervals, then classified as spat (<25 mm), seed (25 mm to < 75mm), or
2014 Oyster Stock Assessment Report – CSA 6 Page 6-2
sack oysters (≥75mm). Shells from recently dead oysters were defined as “box” (both valves
attached) or “valve” (one valve). Oyster size was determined by measuring the “straight-line”
distance from the hinge to the apex of the shell. Live predators and fouling organisms were
counted. Cultch type and reef condition were noted. Water temperature and salinity data were
collected in conjunction with square meter oyster samples.
Results and Discussion
Seed and Sack Stock
Live seed oysters were found at seven of the ten sample sites. Density numbers at the sites with
live seed ranged from 0.2 per replicate at South Point and Middle Reef to a high of 6.4 at
Lighthouse Point (Figures 6.1 and 6.2). Sack sized oysters were found only at the Lighthouse
Point station, where the average catch per replicate was 0.8.
Low production years associated with extended periods of high Atchafalaya River output are not
uncommon on the seed grounds of this bay system. Near 100% oyster mortality on the grounds
was noted in eight of the previous ten years and is reflected by the results of the annual oyster
stock assessment data (Figure 6.3).
Spat Production
Despite the presence of suitable substrate at all locations, live spat were found at only four of the
10 sample locations (Figures 6.1 and 6.2). Density numbers at the sites with spat ranged from 0.2
per replicate to a high of 1.0 at Bayou Blanc. Low spat productivity during periods of high
Atchafalaya River flow (with associated low salinity conditions) are common in this bay system.
Fouling organisms
An overall decrease of 18% in hooked mussel (Ischadium recurvum) abundance on the seed
ground compared to last year’s assessment was documented. A decrease in numbers was noted at
five of the stations while density increased at the remaining sites. (Table 6.1).
Oyster Predators
No evidence of the southern oyster drill (Stramonita haemastoma) was noted during sampling,
which is not surprising considering the depressed salinities normally found in this area. These
predatory marine snails are more often associated with high salinity waters where they are known
to prey heavily on oysters and other bivalve species. An overall increase of 73% in mud crab
(Xanthidae spp.) occurrence on sampled reefs was observed compared to the previous year’s
assessment. While five of the ten sites had no mud crabs, density reached a high of 3.6 crabs per
replicate at Lighthouse Point. No blue crabs (Callinectes sapidus) were collected. Only one Stone
crab (Menippe adinia) was collected (Bayou Blanc site) during the 2014 square meter square
survey.
Dermo
Dermo (Perkinsus marinus), a protozoan parasite prevalent in oysters, may cause extensive
mortalities in conditions of high salinities and water temperatures. As in previous years, an
attempt to collect samples from the eastern and western part of the system for analysis of the
presence of this pathogen was made. An oyster dredge was used to collect a sufficient number of
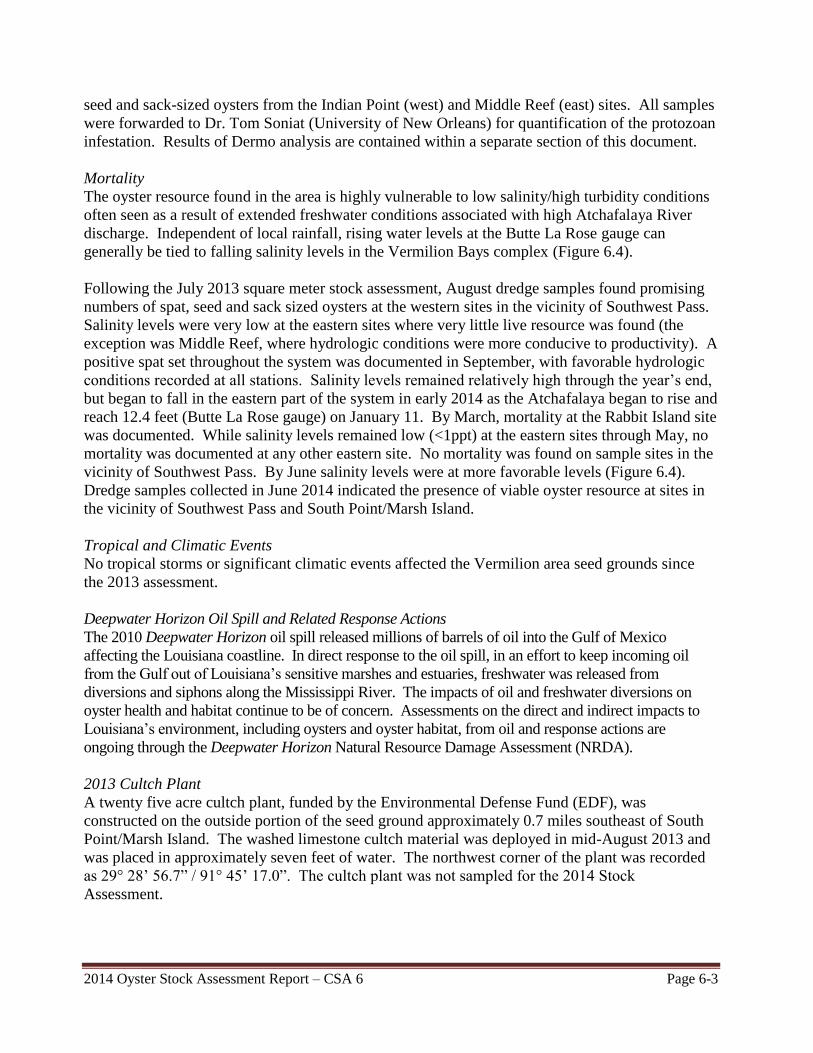
2014 Oyster Stock Assessment Report – CSA 6 Page 6-3
seed and sack-sized oysters from the Indian Point (west) and Middle Reef (east) sites. All samples
were forwarded to Dr. Tom Soniat (University of New Orleans) for quantification of the protozoan
infestation. Results of Dermo analysis are contained within a separate section of this document.
Mortality
The oyster resource found in the area is highly vulnerable to low salinity/high turbidity conditions
often seen as a result of extended freshwater conditions associated with high Atchafalaya River
discharge. Independent of local rainfall, rising water levels at the Butte La Rose gauge can
generally be tied to falling salinity levels in the Vermilion Bays complex (Figure 6.4).
Following the July 2013 square meter stock assessment, August dredge samples found promising
numbers of spat, seed and sack sized oysters at the western sites in the vicinity of Southwest Pass.
Salinity levels were very low at the eastern sites where very little live resource was found (the
exception was Middle Reef, where hydrologic conditions were more conducive to productivity). A
positive spat set throughout the system was documented in September, with favorable hydrologic
conditions recorded at all stations. Salinity levels remained relatively high through the year’s end,
but began to fall in the eastern part of the system in early 2014 as the Atchafalaya began to rise and
reach 12.4 feet (Butte La Rose gauge) on January 11. By March, mortality at the Rabbit Island site
was documented. While salinity levels remained low (<1ppt) at the eastern sites through May, no
mortality was documented at any other eastern site. No mortality was found on sample sites in the
vicinity of Southwest Pass. By June salinity levels were at more favorable levels (Figure 6.4).
Dredge samples collected in June 2014 indicated the presence of viable oyster resource at sites in
the vicinity of Southwest Pass and South Point/Marsh Island.
Tropical and Climatic Events
No tropical storms or significant climatic events affected the Vermilion area seed grounds since
the 2013 assessment.
Deepwater Horizon Oil Spill and Related Response Actions
The 2010 Deepwater Horizon oil spill released millions of barrels of oil into the Gulf of Mexico
affecting the Louisiana coastline. In direct response to the oil spill, in an effort to keep incoming oil
from the Gulf out of Louisiana’s sensitive marshes and estuaries, freshwater was released from
diversions and siphons along the Mississippi River. The impacts of oil and freshwater diversions on
oyster health and habitat continue to be of concern. Assessments on the direct and indirect impacts to
Louisiana’s environment, including oysters and oyster habitat, from oil and response actions are
ongoing through the Deepwater Horizon Natural Resource Damage Assessment (NRDA).
2013 Cultch Plant
A twenty five acre cultch plant, funded by the Environmental Defense Fund (EDF), was
constructed on the outside portion of the seed ground approximately 0.7 miles southeast of South
Point/Marsh Island. The washed limestone cultch material was deployed in mid-August 2013 and
was placed in approximately seven feet of water. The northwest corner of the plant was recorded
as 29° 28’ 56.7” / 91° 45’ 17.0”. The cultch plant was not sampled for the 2014 Stock
Assessment.
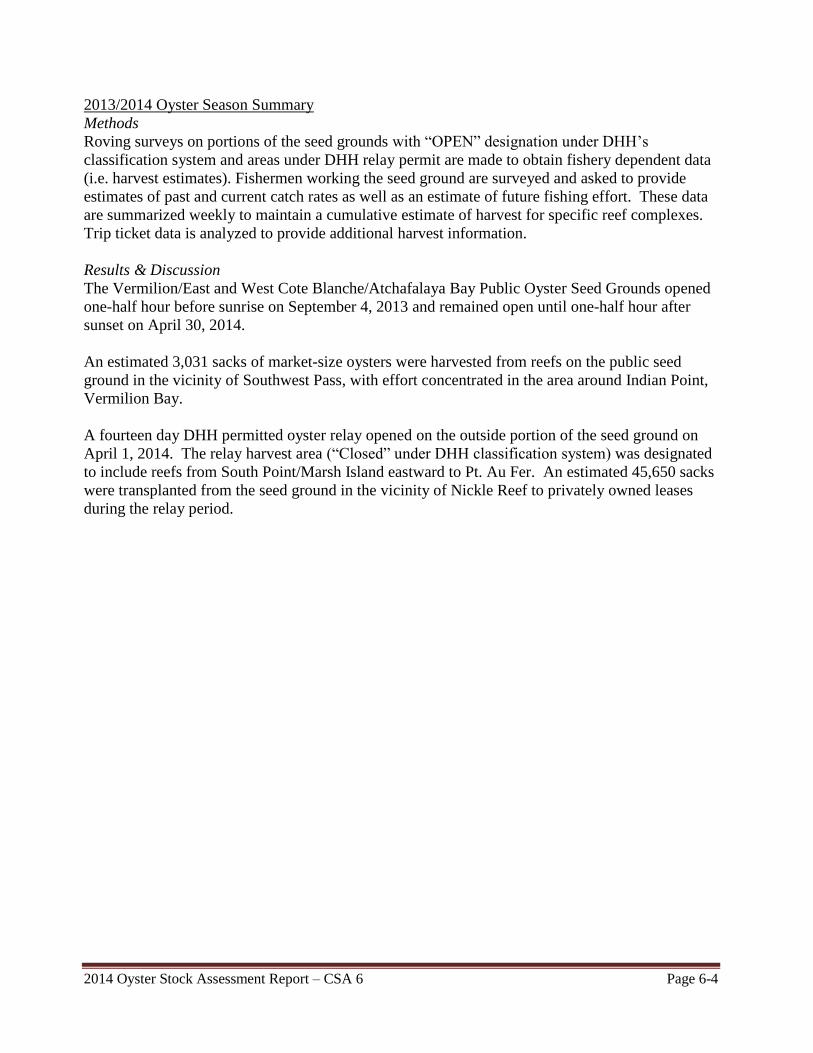
2014 Oyster Stock Assessment Report – CSA 6 Page 6-4
2013/2014 Oyster Season Summary
Methods
Roving surveys on portions of the seed grounds with “OPEN” designation under DHH’s
classification system and areas under DHH relay permit are made to obtain fishery dependent data
(i.e. harvest estimates). Fishermen working the seed ground are surveyed and asked to provide
estimates of past and current catch rates as well as an estimate of future fishing effort. These data
are summarized weekly to maintain a cumulative estimate of harvest for specific reef complexes.
Trip ticket data is analyzed to provide additional harvest information.
Results & Discussion
The Vermilion/East and West Cote Blanche/Atchafalaya Bay Public Oyster Seed Grounds opened
one-half hour before sunrise on September 4, 2013 and remained open until one-half hour after
sunset on April 30, 2014.
An estimated 3,031 sacks of market-size oysters were harvested from reefs on the public seed
ground in the vicinity of Southwest Pass, with effort concentrated in the area around Indian Point,
Vermilion Bay.
A fourteen day DHH permitted oyster relay opened on the outside portion of the seed ground on
April 1, 2014. The relay harvest area (“Closed” under DHH classification system) was designated
to include reefs from South Point/Marsh Island eastward to Pt. Au Fer. An estimated 45,650 sacks
were transplanted from the seed ground in the vicinity of Nickle Reef to privately owned leases
during the relay period.
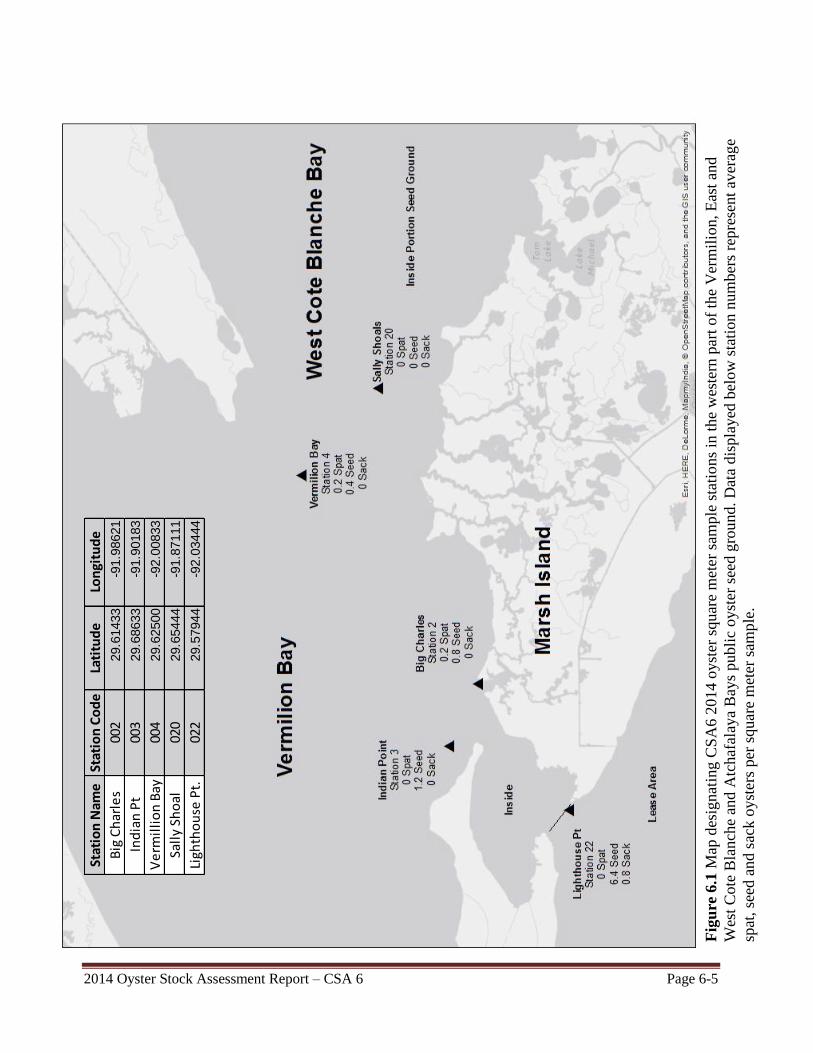
2014 Oyster Stock Assessment Report – CSA 6 Page 6-5
Stat
ion
Nam
eSt
atio
n C
od
eLa
titu
de
Lon
gitu
de
Big
Ch
arle
s00
229.6
1433
-91.9
8621
Ind
ian
Pt
003
29.6
8633
-91.9
0183
Ve
rmil
lio
n B
ay00
429.6
2500
-92.0
0833
Sall
y Sh
oal
020
29.6
5444
-91.8
7111
Ligh
tho
use
Pt.
022
29.5
7944
-92.0
3444
Fig
ure
6.1
Map
des
ignat
ing C
SA
6 2
014 o
yst
er s
quar
e m
eter
sam
ple
sta
tio
ns
in t
he
wes
tern
par
t of
the
Ver
mil
ion, E
ast
and
Wes
t C
ote
Bla
nch
e an
d A
tchaf
alay
a B
ays
publi
c oyst
er s
eed g
round.
Dat
a dis
pla
yed
bel
ow
sta
tion n
um
ber
s re
pre
sent
aver
age
spat
, se
ed a
nd s
ack o
yst
ers
per
squar
e m
eter
sam
ple
.
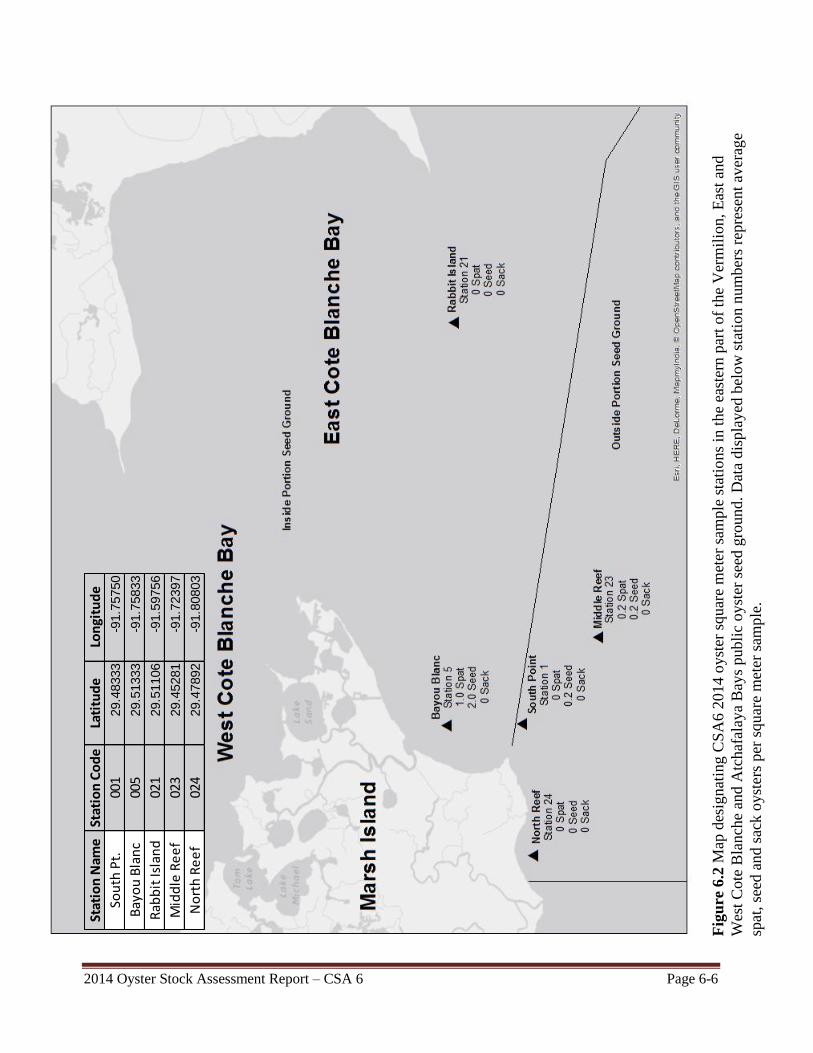
2014 Oyster Stock Assessment Report – CSA 6 Page 6-6
Stat
ion
Nam
eSt
atio
n C
od
eLa
titu
de
Lon
gitu
de
Sou
th P
t.00
129.4
8333
-91.7
5750
Bay
ou
Bla
nc
005
29.5
1333
-91.7
5833
Rab
bit
Isla
nd
021
29.5
1106
-91.5
9756
Mid
dle
Re
ef
023
29.4
5281
-91.7
2397
No
rth
Re
ef
024
29.4
7892
-91.8
0803
Fig
ure
6.2
Map
des
ignat
ing C
SA
6 2
014 o
yst
er s
quar
e m
eter
sam
ple
sta
tio
ns
in t
he
east
ern
par
t of
the
Ver
mil
ion, E
ast
and
Wes
t C
ote
Bla
nch
e an
d A
tchaf
alay
a B
ays
publi
c oyst
er s
eed g
round.
Dat
a dis
pla
yed
bel
ow
sta
tion n
um
ber
s re
pre
sent
aver
age
spat
, se
ed a
nd s
ack o
yst
ers
per
squar
e m
eter
sam
ple
.
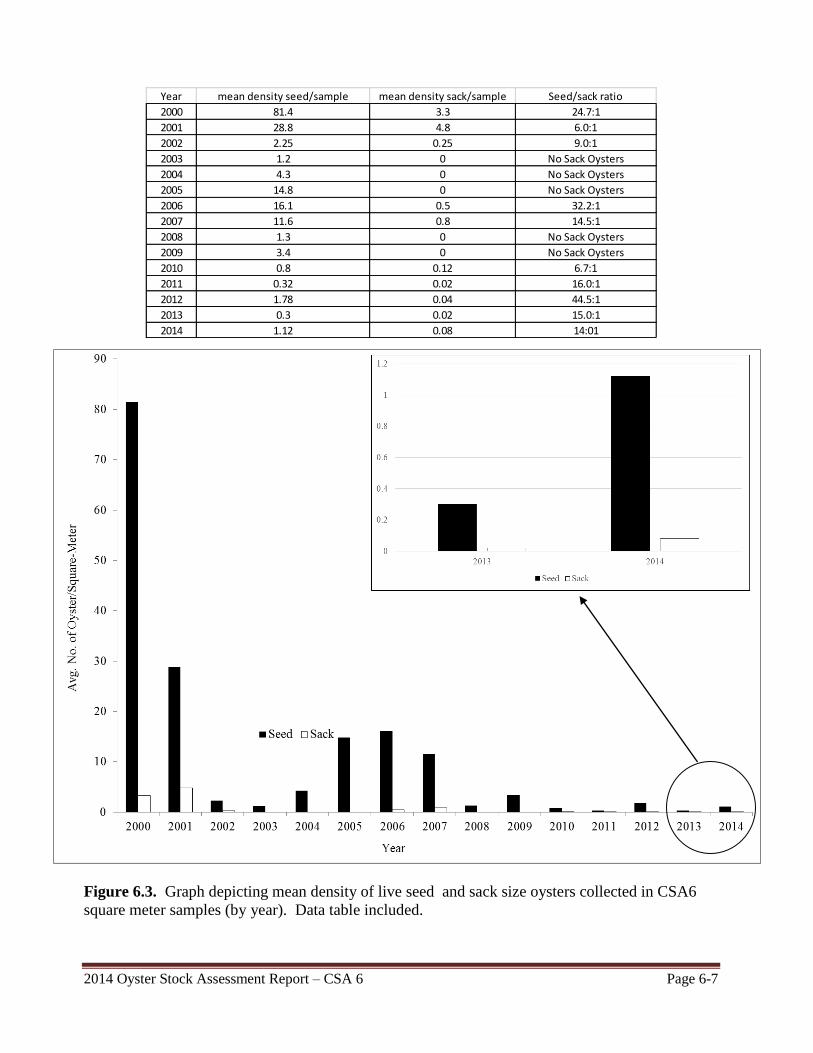
2014 Oyster Stock Assessment Report – CSA 6 Page 6-7
Year mean density seed/sample mean density sack/sample Seed/sack ratio
2000 81.4 3.3 24.7:1
2001 28.8 4.8 6.0:1
2002 2.25 0.25 9.0:1
2003 1.2 0 No Sack Oysters
2004 4.3 0 No Sack Oysters
2005 14.8 0 No Sack Oysters
2006 16.1 0.5 32.2:1
2007 11.6 0.8 14.5:1
2008 1.3 0 No Sack Oysters
2009 3.4 0 No Sack Oysters
2010 0.8 0.12 6.7:1
2011 0.32 0.02 16.0:1
2012 1.78 0.04 44.5:1
2013 0.3 0.02 15.0:1
2014 1.12 0.08 14:01
Figure 6.3. Graph depicting mean density of live seed and sack size oysters collected in CSA6
square meter samples (by year). Data table included.
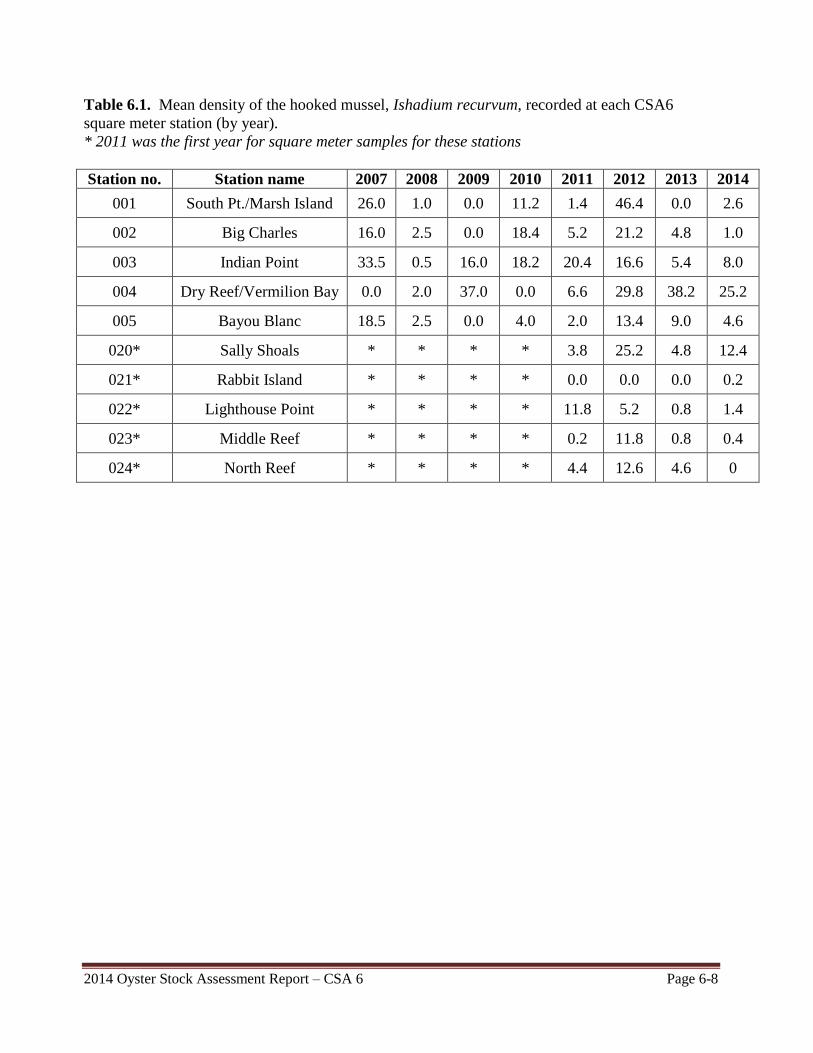
2014 Oyster Stock Assessment Report – CSA 6 Page 6-8
Table 6.1. Mean density of the hooked mussel, Ishadium recurvum, recorded at each CSA6
square meter station (by year).
* 2011 was the first year for square meter samples for these stations
Station no. Station name 2007 2008 2009 2010 2011 2012 2013 2014
001 South Pt./Marsh Island 26.0 1.0 0.0 11.2 1.4 46.4 0.0 2.6
002 Big Charles 16.0 2.5 0.0 18.4 5.2 21.2 4.8 1.0
003 Indian Point 33.5 0.5 16.0 18.2 20.4 16.6 5.4 8.0
004 Dry Reef/Vermilion Bay 0.0 2.0 37.0 0.0 6.6 29.8 38.2 25.2
005 Bayou Blanc 18.5 2.5 0.0 4.0 2.0 13.4 9.0 4.6
020* Sally Shoals * * * * 3.8 25.2 4.8 12.4
021* Rabbit Island * * * * 0.0 0.0 0.0 0.2
022* Lighthouse Point * * * * 11.8 5.2 0.8 1.4
023* Middle Reef * * * * 0.2 11.8 0.8 0.4
024* North Reef * * * * 4.4 12.6 4.6 0
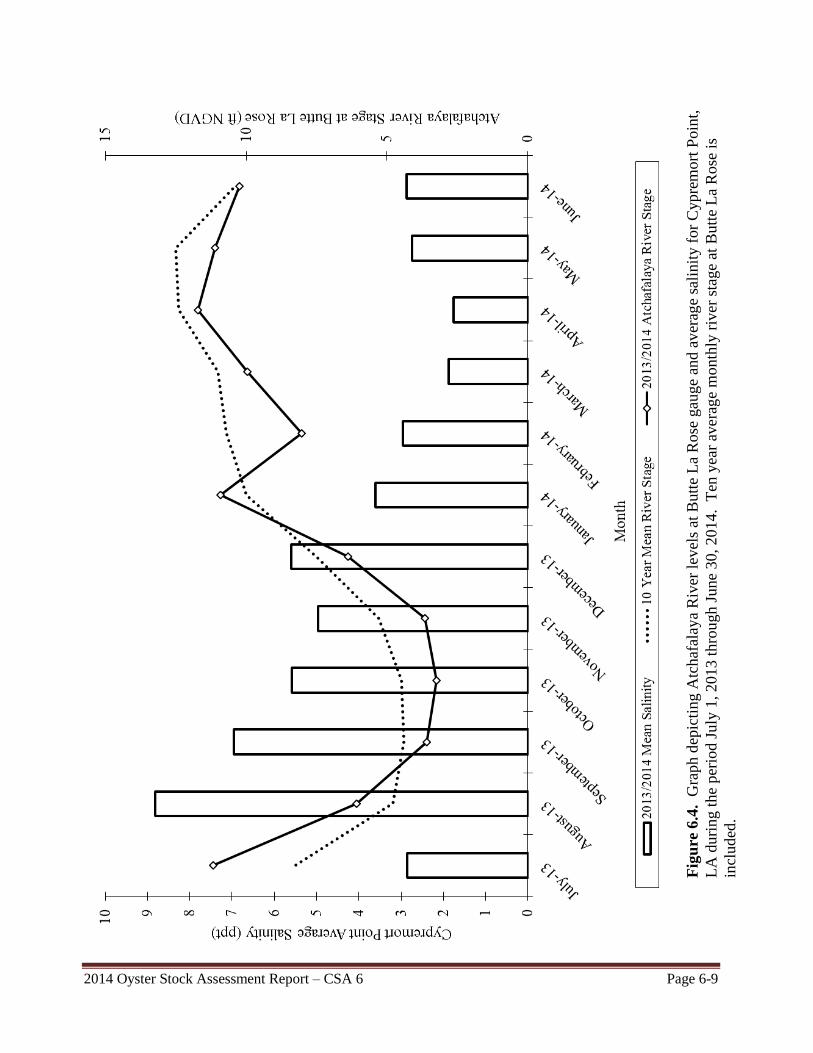
2014 Oyster Stock Assessment Report – CSA 6 Page 6-9
Fig
ure
6.4
. G
raph d
epic
ting A
tchaf
alay
a R
iver
lev
els
at B
utt
e L
a R
ose
gau
ge
and a
ver
age
sali
nit
y f
or
Cypre
mort
Poin
t,
LA
duri
ng t
he
per
iod J
uly
1, 2013 t
hro
ugh J
une
30
, 2014. T
en y
ear
aver
age
mo
nth
ly r
iver
sta
ge
at B
utt
e L
a R
ose
is
incl
uded
.

This page intentionally left blank.
2014 Oyster Stock Assessment Report – CSA 7 Page 7-1
Coast Study Area (CSA) 7 – 2014 Oyster Stock Assessment
Introduction
Louisiana Department of Wildlife and Fisheries’ (LDWF) Coastal Study Area VII is located in
Southwest Louisiana, from the Louisiana/Texas state line to Freshwater Bayou in Vermilion
Parish. It is comprised of Calcasieu and Mermentau River basins and the eastern portion of the
Sabine River Basin. Calcasieu Lake is located at the southern end of the Calcasieu River basin
in Calcasieu and Cameron parishes. It consists of approximately 58,260 water bottom acres with
oyster reefs located throughout the lake, especially in the southern end. The Mermentau River
basin has no oyster harvesting areas. Sabine Lake is located at the southern end of the Sabine
River basin in Cameron parish. It consists of approximately 55,057 water bottom acres with
approximately 34,067 acres in the Louisiana portion and the remainder in the Texas portion.
Oyster reefs are located mainly in the very southern portion of the lake.
It is unclear when commercial oyster harvesting began on Calcasieu Lake and to what extent it
took place. In 1967 Calcasieu Lake was closed to oyster harvesting and the closure remained
until 1975 when oyster harvesting was reopened. Oyster harvesting resumed in 1975, but gear
restrictions were placed on harvesting which allowed only taking by hand or tongs. The gear
restriction remained in effect until 2004, when legislation (HB160; ACT479) was passed
allowing for the use of hand oyster dredges of three feet wide or less in Calcasieu Lake. In 2006,
legislation (HB802; ACT398) was passed allowing the use of mechanical retrieval systems for
dredges. In 2011, legislation (SB73, ACT329) was passed restricting oyster harvest in Calcasieu
Lake to those who possessed a Calcasieu Lake Oyster Harvest Permit. The number of permits
granted was restricted to 126 oyster harvesters, of which 63 had to have historical oyster landings
from Calcasieu Lake, with the remaining being first come first serve. In 2012, legislation
(SB202, ACT541) removed the landings requirement as well as the restriction on the number of
harvesters that could possess the permit.
Oyster seasons in Sabine Lake haven’t occurred since the early 1960’s based on anecdotal
information; neither Texas nor Louisiana can document harvest beyond that time and no concrete
harvest data has been located.
For assessment purposes, Calcasieu Lake has always been divided into two areas – Eastside and
Westcove (the Calcasieu Ship Channel being the dividing line). In 1992, Louisiana Department
of Health and Hospitals (LDHH) also divided the lake into two separately managed shellfish
harvest areas – Calcasieu Lake Conditional Managed Area (CLCMA) and West Cove
Conditional Managed Area (WCCMA). Because the areas are classified as conditionally
managed, LDHH has the authority to set closure regulations based on health related concerns due
to poor water quality. Originally, LDHH established health related closures of oyster harvest in
Calcasieu Lake based on the river stage of the Calcasieu River at Kinder, LA. CLCMA would be
closed to oyster harvest when the river stage reached 12 feet and the WCCMA would close when
the river stage reached 7 feet. Once the river fell below these levels for 48 hours the LDHH
would reopen the areas for harvest. LDHH adjusted the CLCMA river stage threshold in 1998 to
13.5 feet. In 2004 LDHH reclassified the Louisiana Public Oyster Harvest Areas into Oyster
Growing Areas. The Eastside of Calcasieu Lake and West Cove are classified currently as
Growing Area 29 (GA-29) and Growing Area 30 (GA-30) (Figure 7.1).
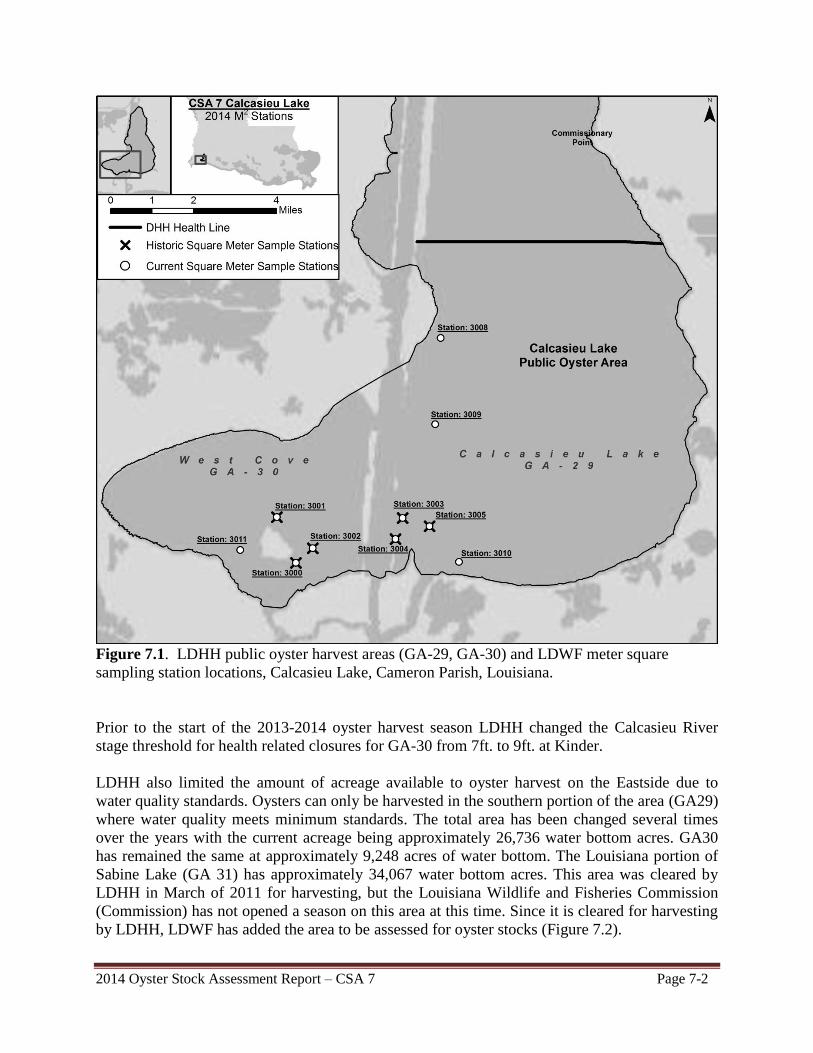
2014 Oyster Stock Assessment Report – CSA 7 Page 7-2
Figure 7.1. LDHH public oyster harvest areas (GA-29, GA-30) and LDWF meter square
sampling station locations, Calcasieu Lake, Cameron Parish, Louisiana.
Prior to the start of the 2013-2014 oyster harvest season LDHH changed the Calcasieu River
stage threshold for health related closures for GA-30 from 7ft. to 9ft. at Kinder.
LDHH also limited the amount of acreage available to oyster harvest on the Eastside due to
water quality standards. Oysters can only be harvested in the southern portion of the area (GA29)
where water quality meets minimum standards. The total area has been changed several times
over the years with the current acreage being approximately 26,736 water bottom acres. GA30
has remained the same at approximately 9,248 acres of water bottom. The Louisiana portion of
Sabine Lake (GA 31) has approximately 34,067 water bottom acres. This area was cleared by
LDHH in March of 2011 for harvesting, but the Louisiana Wildlife and Fisheries Commission
(Commission) has not opened a season on this area at this time. Since it is cleared for harvesting
by LDHH, LDWF has added the area to be assessed for oyster stocks (Figure 7.2).
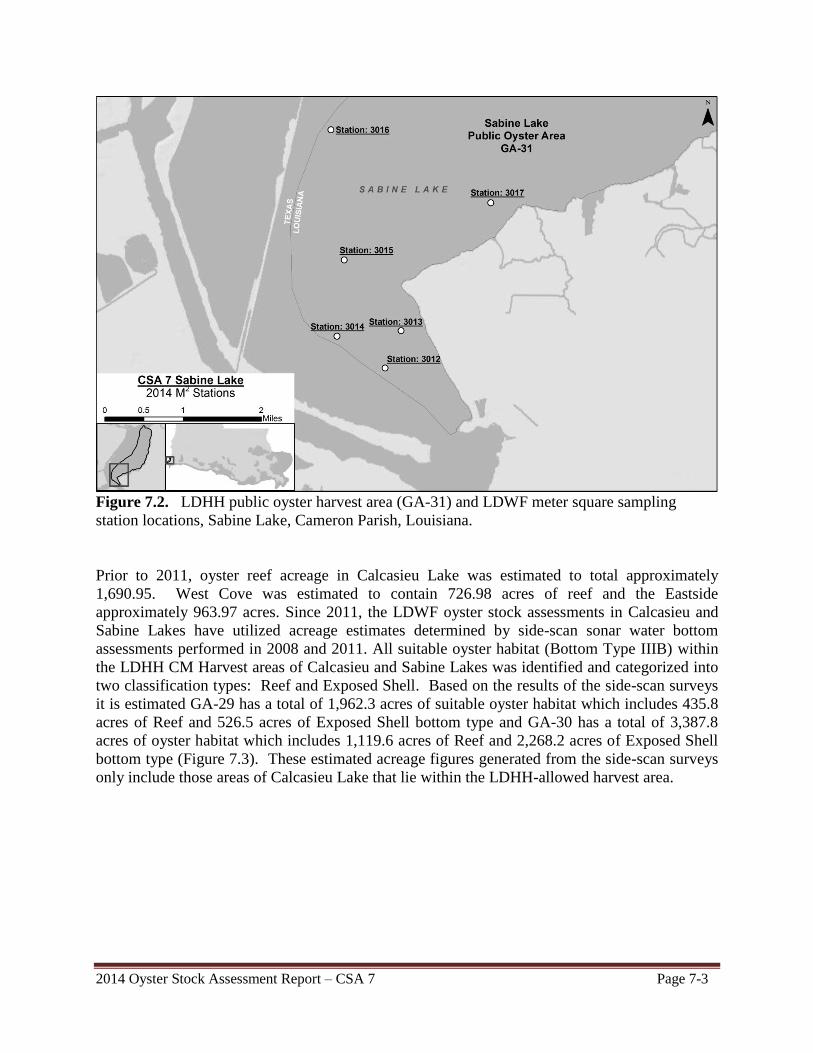
2014 Oyster Stock Assessment Report – CSA 7 Page 7-3
Figure 7.2. LDHH public oyster harvest area (GA-31) and LDWF meter square sampling
station locations, Sabine Lake, Cameron Parish, Louisiana.
Prior to 2011, oyster reef acreage in Calcasieu Lake was estimated to total approximately
1,690.95. West Cove was estimated to contain 726.98 acres of reef and the Eastside
approximately 963.97 acres. Since 2011, the LDWF oyster stock assessments in Calcasieu and
Sabine Lakes have utilized acreage estimates determined by side-scan sonar water bottom
assessments performed in 2008 and 2011. All suitable oyster habitat (Bottom Type IIIB) within
the LDHH CM Harvest areas of Calcasieu and Sabine Lakes was identified and categorized into
two classification types: Reef and Exposed Shell. Based on the results of the side-scan surveys
it is estimated GA-29 has a total of 1,962.3 acres of suitable oyster habitat which includes 435.8
acres of Reef and 526.5 acres of Exposed Shell bottom type and GA-30 has a total of 3,387.8
acres of oyster habitat which includes 1,119.6 acres of Reef and 2,268.2 acres of Exposed Shell
bottom type (Figure 7.3). These estimated acreage figures generated from the side-scan surveys
only include those areas of Calcasieu Lake that lie within the LDHH-allowed harvest area.
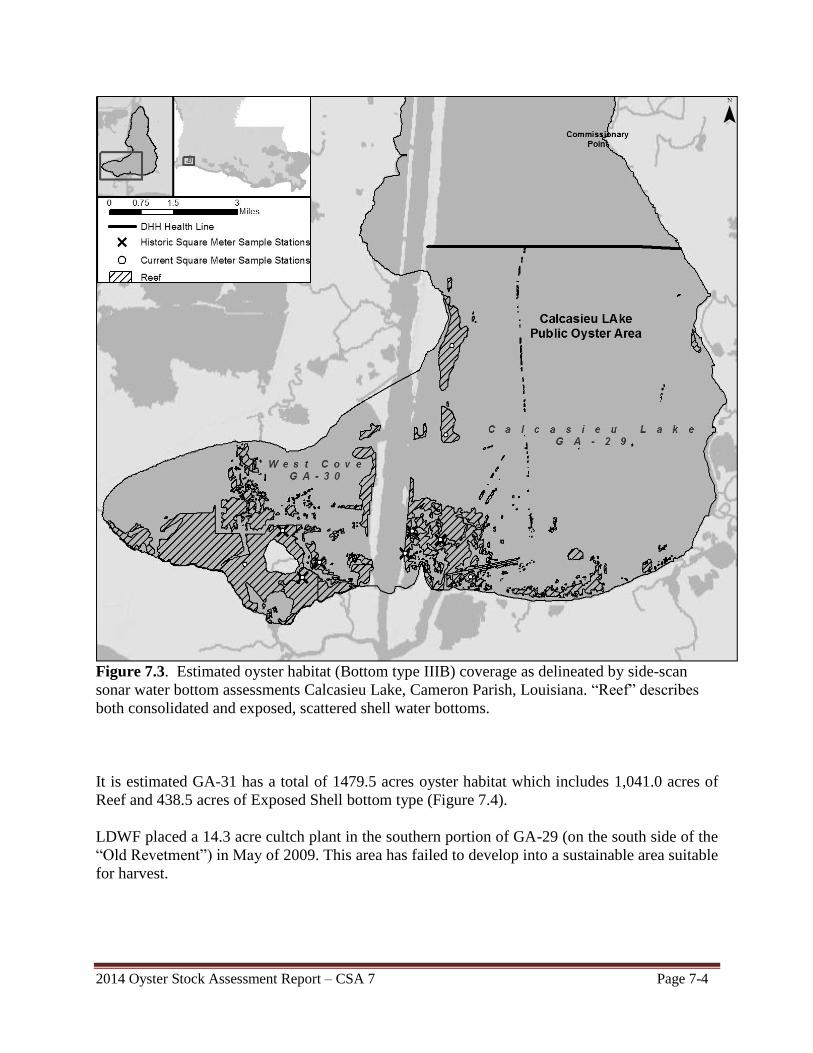
2014 Oyster Stock Assessment Report – CSA 7 Page 7-4
Figure 7.3. Estimated oyster habitat (Bottom type IIIB) coverage as delineated by side-scan
sonar water bottom assessments Calcasieu Lake, Cameron Parish, Louisiana. “Reef” describes
both consolidated and exposed, scattered shell water bottoms.
It is estimated GA-31 has a total of 1479.5 acres oyster habitat which includes 1,041.0 acres of
Reef and 438.5 acres of Exposed Shell bottom type (Figure 7.4).
LDWF placed a 14.3 acre cultch plant in the southern portion of GA-29 (on the south side of the
“Old Revetment”) in May of 2009. This area has failed to develop into a sustainable area suitable
for harvest.
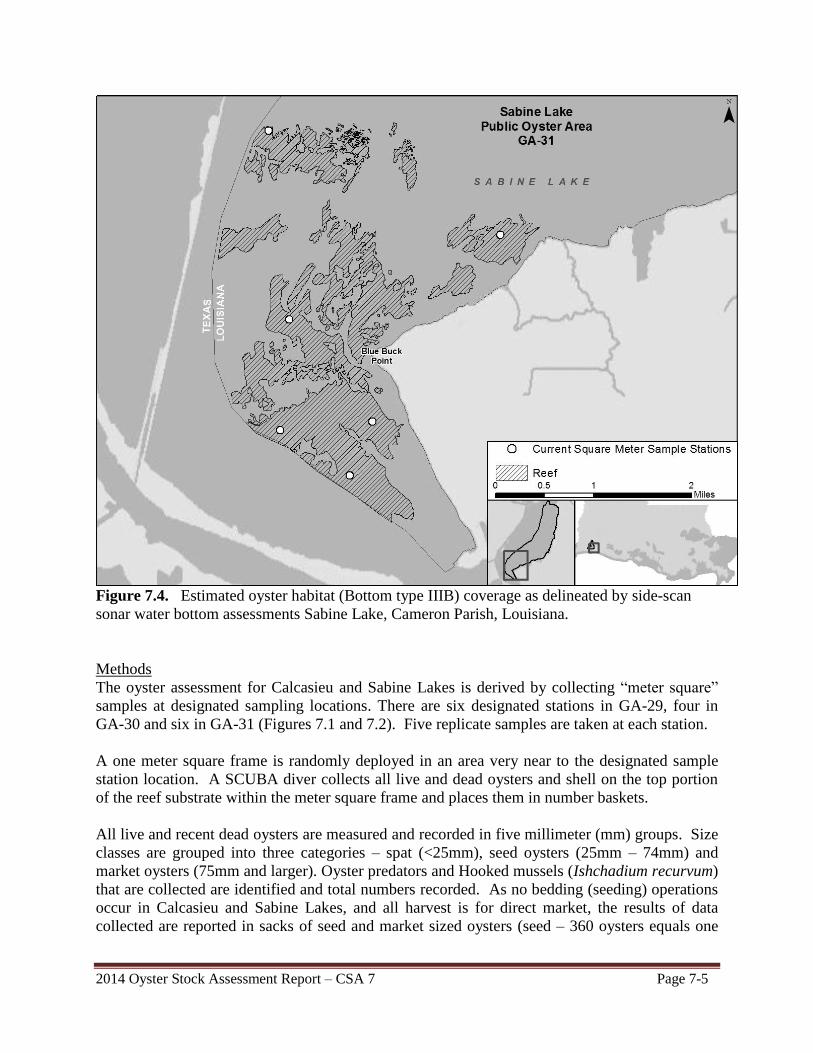
2014 Oyster Stock Assessment Report – CSA 7 Page 7-5
Figure 7.4. Estimated oyster habitat (Bottom type IIIB) coverage as delineated by side-scan
sonar water bottom assessments Sabine Lake, Cameron Parish, Louisiana.
Methods
The oyster assessment for Calcasieu and Sabine Lakes is derived by collecting “meter square”
samples at designated sampling locations. There are six designated stations in GA-29, four in
GA-30 and six in GA-31 (Figures 7.1 and 7.2). Five replicate samples are taken at each station.
A one meter square frame is randomly deployed in an area very near to the designated sample
station location. A SCUBA diver collects all live and dead oysters and shell on the top portion
of the reef substrate within the meter square frame and places them in number baskets.
All live and recent dead oysters are measured and recorded in five millimeter (mm) groups. Size
classes are grouped into three categories – spat (<25mm), seed oysters (25mm – 74mm) and
market oysters (75mm and larger). Oyster predators and Hooked mussels (Ishchadium recurvum)
that are collected are identified and total numbers recorded. As no bedding (seeding) operations
occur in Calcasieu and Sabine Lakes, and all harvest is for direct market, the results of data
collected are reported in sacks of seed and market sized oysters (seed – 360 oysters equals one
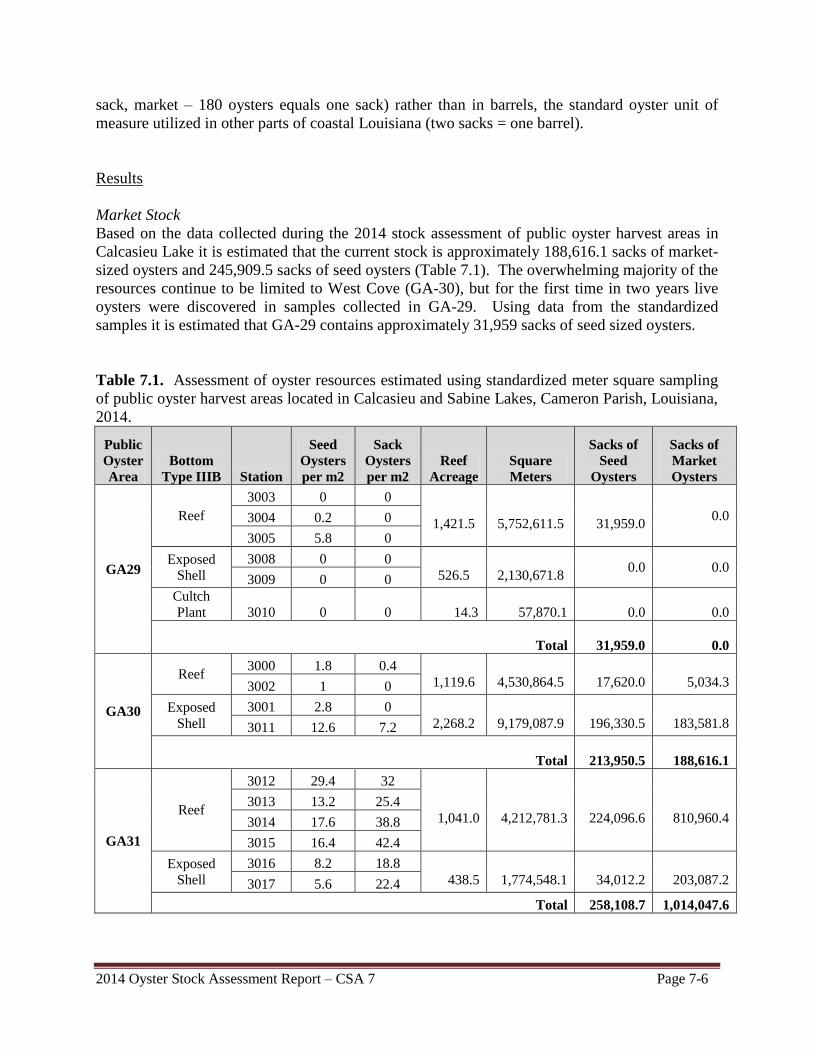
2014 Oyster Stock Assessment Report – CSA 7 Page 7-6
sack, market – 180 oysters equals one sack) rather than in barrels, the standard oyster unit of
measure utilized in other parts of coastal Louisiana (two sacks = one barrel).
Results
Market Stock
Based on the data collected during the 2014 stock assessment of public oyster harvest areas in
Calcasieu Lake it is estimated that the current stock is approximately 188,616.1 sacks of market-
sized oysters and 245,909.5 sacks of seed oysters (Table 7.1). The overwhelming majority of the
resources continue to be limited to West Cove (GA-30), but for the first time in two years live
oysters were discovered in samples collected in GA-29. Using data from the standardized
samples it is estimated that GA-29 contains approximately 31,959 sacks of seed sized oysters.
Table 7.1. Assessment of oyster resources estimated using standardized meter square sampling
of public oyster harvest areas located in Calcasieu and Sabine Lakes, Cameron Parish, Louisiana,
2014.
Public
Oyster
Area
Bottom
Type IIIB Station
Seed
Oysters
per m2
Sack
Oysters
per m2
Reef
Acreage
Square
Meters
Sacks of
Seed
Oysters
Sacks of
Market
Oysters
GA29
Reef
3003 0 0
1,421.5
5,752,611.5
31,959.0 0.0 3004 0.2 0
3005 5.8 0
Exposed
Shell
3008 0 0
526.5
2,130,671.8 0.0 0.0
3009 0 0
Cultch
Plant 3010 0 0 14.3 57,870.1 0.0 0.0
Total
31,959.0 0.0
GA30
Reef 3000 1.8 0.4
1,119.6
4,530,864.5
17,620.0
5,034.3 3002 1 0
Exposed
Shell
3001 2.8 0
2,268.2
9,179,087.9
196,330.5
183,581.8 3011 12.6 7.2
Total
213,950.5 188,616.1
GA31
Reef
3012 29.4 32
1,041.0
4,212,781.3
224,096.6
810,960.4
3013 13.2 25.4
3014 17.6 38.8
3015 16.4 42.4
Exposed
Shell
3016 8.2 18.8
438.5
1,774,548.1
34,012.2
203,087.2 3017 5.6 22.4
Total 258,108.7 1,014,047.6
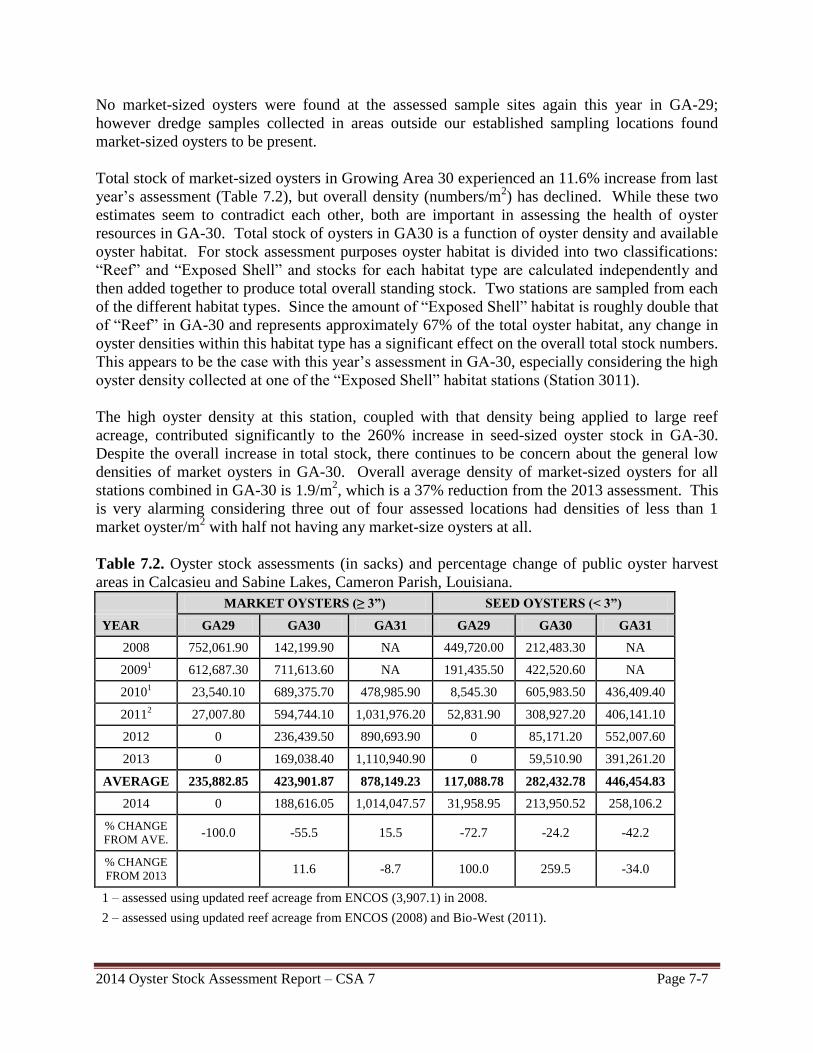
2014 Oyster Stock Assessment Report – CSA 7 Page 7-7
No market-sized oysters were found at the assessed sample sites again this year in GA-29;
however dredge samples collected in areas outside our established sampling locations found
market-sized oysters to be present.
Total stock of market-sized oysters in Growing Area 30 experienced an 11.6% increase from last
year’s assessment (Table 7.2), but overall density (numbers/m2) has declined. While these two
estimates seem to contradict each other, both are important in assessing the health of oyster
resources in GA-30. Total stock of oysters in GA30 is a function of oyster density and available
oyster habitat. For stock assessment purposes oyster habitat is divided into two classifications:
“Reef” and “Exposed Shell” and stocks for each habitat type are calculated independently and
then added together to produce total overall standing stock. Two stations are sampled from each
of the different habitat types. Since the amount of “Exposed Shell” habitat is roughly double that
of “Reef” in GA-30 and represents approximately 67% of the total oyster habitat, any change in
oyster densities within this habitat type has a significant effect on the overall total stock numbers.
This appears to be the case with this year’s assessment in GA-30, especially considering the high
oyster density collected at one of the “Exposed Shell” habitat stations (Station 3011).
The high oyster density at this station, coupled with that density being applied to large reef
acreage, contributed significantly to the 260% increase in seed-sized oyster stock in GA-30.
Despite the overall increase in total stock, there continues to be concern about the general low
densities of market oysters in GA-30. Overall average density of market-sized oysters for all
stations combined in GA-30 is 1.9/m2, which is a 37% reduction from the 2013 assessment. This
is very alarming considering three out of four assessed locations had densities of less than 1
market oyster/m2 with half not having any market-size oysters at all.
Table 7.2. Oyster stock assessments (in sacks) and percentage change of public oyster harvest
areas in Calcasieu and Sabine Lakes, Cameron Parish, Louisiana.
MARKET OYSTERS (≥ 3”) SEED OYSTERS (< 3”)
YEAR GA29 GA30 GA31 GA29 GA30 GA31
2008 752,061.90 142,199.90 NA 449,720.00 212,483.30 NA
20091 612,687.30 711,613.60 NA 191,435.50 422,520.60 NA
20101 23,540.10 689,375.70 478,985.90 8,545.30 605,983.50 436,409.40
20112 27,007.80 594,744.10 1,031,976.20 52,831.90 308,927.20 406,141.10
2012 0 236,439.50 890,693.90 0 85,171.20 552,007.60
2013 0 169,038.40 1,110,940.90 0 59,510.90 391,261.20
AVERAGE 235,882.85 423,901.87 878,149.23 117,088.78 282,432.78 446,454.83
2014 0 188,616.05 1,014,047.57 31,958.95 213,950.52 258,106.2
% CHANGE
FROM AVE. -100.0 -55.5 15.5 -72.7 -24.2 -42.2
% CHANGE
FROM 2013 11.6 -8.7 100.0 259.5 -34.0
1 – assessed using updated reef acreage from ENCOS (3,907.1) in 2008.
2 – assessed using updated reef acreage from ENCOS (2008) and Bio-West (2011).
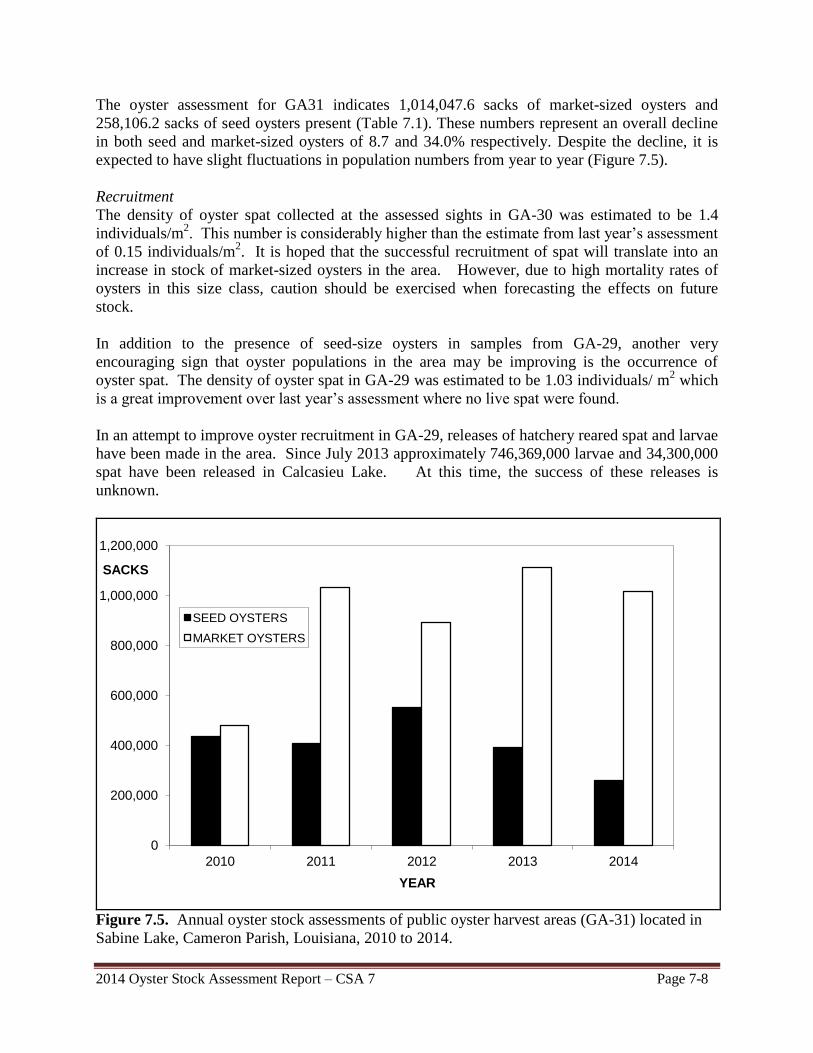
2014 Oyster Stock Assessment Report – CSA 7 Page 7-8
The oyster assessment for GA31 indicates 1,014,047.6 sacks of market-sized oysters and
258,106.2 sacks of seed oysters present (Table 7.1). These numbers represent an overall decline
in both seed and market-sized oysters of 8.7 and 34.0% respectively. Despite the decline, it is
expected to have slight fluctuations in population numbers from year to year (Figure 7.5).
Recruitment
The density of oyster spat collected at the assessed sights in GA-30 was estimated to be 1.4
individuals/m2. This number is considerably higher than the estimate from last year’s assessment
of 0.15 individuals/m2. It is hoped that the successful recruitment of spat will translate into an
increase in stock of market-sized oysters in the area. However, due to high mortality rates of
oysters in this size class, caution should be exercised when forecasting the effects on future
stock.
In addition to the presence of seed-size oysters in samples from GA-29, another very
encouraging sign that oyster populations in the area may be improving is the occurrence of
oyster spat. The density of oyster spat in GA-29 was estimated to be 1.03 individuals/ m2 which
is a great improvement over last year’s assessment where no live spat were found.
In an attempt to improve oyster recruitment in GA-29, releases of hatchery reared spat and larvae
have been made in the area. Since July 2013 approximately 746,369,000 larvae and 34,300,000
spat have been released in Calcasieu Lake. At this time, the success of these releases is
unknown.
Figure 7.5. Annual oyster stock assessments of public oyster harvest areas (GA-31) located in
Sabine Lake, Cameron Parish, Louisiana, 2010 to 2014.
0
200,000
400,000
600,000
800,000
1,000,000
1,200,000
2010 2011 2012 2013 2014
SACKS
YEAR
SEED OYSTERS
MARKET OYSTERS
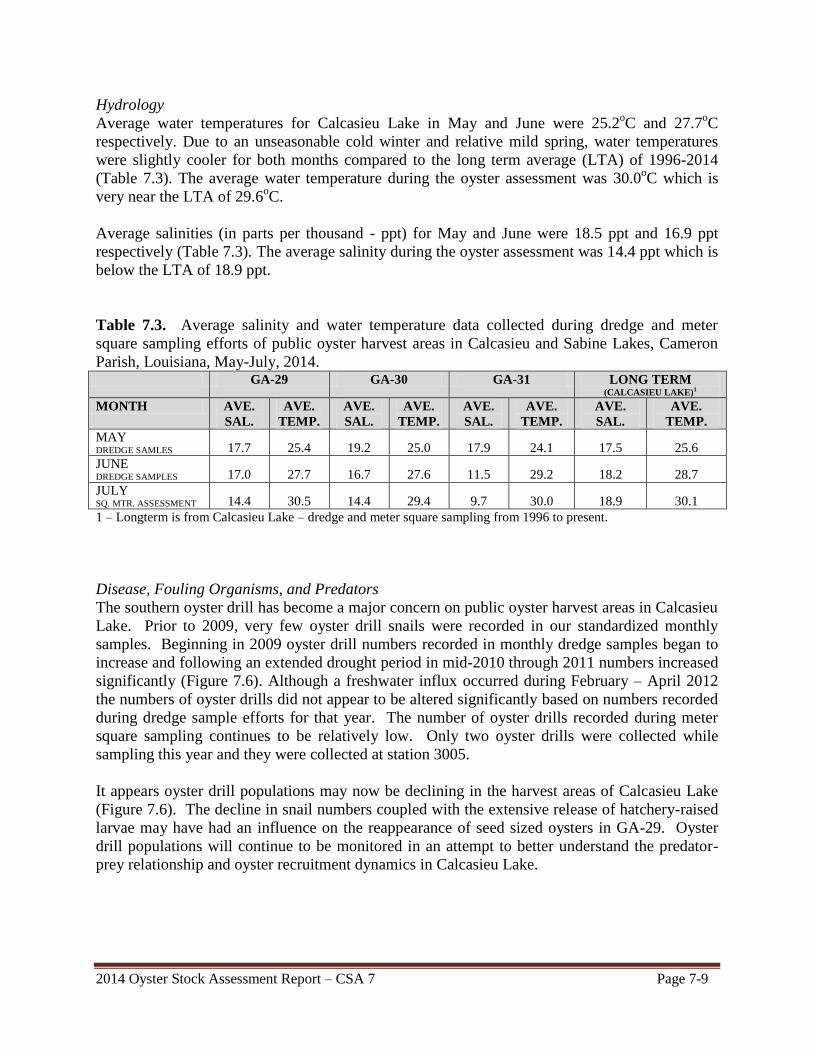
2014 Oyster Stock Assessment Report – CSA 7 Page 7-9
Hydrology
Average water temperatures for Calcasieu Lake in May and June were 25.2oC and 27.7
oC
respectively. Due to an unseasonable cold winter and relative mild spring, water temperatures
were slightly cooler for both months compared to the long term average (LTA) of 1996-2014
(Table 7.3). The average water temperature during the oyster assessment was 30.0oC which is
very near the LTA of 29.6oC.
Average salinities (in parts per thousand - ppt) for May and June were 18.5 ppt and 16.9 ppt
respectively (Table 7.3). The average salinity during the oyster assessment was 14.4 ppt which is
below the LTA of 18.9 ppt.
Table 7.3. Average salinity and water temperature data collected during dredge and meter
square sampling efforts of public oyster harvest areas in Calcasieu and Sabine Lakes, Cameron
Parish, Louisiana, May-July, 2014. GA-29 GA-30 GA-31 LONG TERM
(CALCASIEU LAKE)1
MONTH AVE.
SAL.
AVE.
TEMP.
AVE.
SAL.
AVE.
TEMP.
AVE.
SAL.
AVE.
TEMP.
AVE.
SAL.
AVE.
TEMP.
MAY DREDGE SAMLES 17.7 25.4 19.2 25.0 17.9 24.1 17.5 25.6
JUNE DREDGE SAMPLES 17.0 27.7 16.7 27.6 11.5 29.2 18.2 28.7
JULY SQ. MTR. ASSESSMENT 14.4 30.5 14.4 29.4 9.7 30.0 18.9 30.1
1 – Longterm is from Calcasieu Lake – dredge and meter square sampling from 1996 to present.
Disease, Fouling Organisms, and Predators
The southern oyster drill has become a major concern on public oyster harvest areas in Calcasieu
Lake. Prior to 2009, very few oyster drill snails were recorded in our standardized monthly
samples. Beginning in 2009 oyster drill numbers recorded in monthly dredge samples began to
increase and following an extended drought period in mid-2010 through 2011 numbers increased
significantly (Figure 7.6). Although a freshwater influx occurred during February – April 2012
the numbers of oyster drills did not appear to be altered significantly based on numbers recorded
during dredge sample efforts for that year. The number of oyster drills recorded during meter
square sampling continues to be relatively low. Only two oyster drills were collected while
sampling this year and they were collected at station 3005.
It appears oyster drill populations may now be declining in the harvest areas of Calcasieu Lake
(Figure 7.6). The decline in snail numbers coupled with the extensive release of hatchery-raised
larvae may have had an influence on the reappearance of seed sized oysters in GA-29. Oyster
drill populations will continue to be monitored in an attempt to better understand the predator-
prey relationship and oyster recruitment dynamics in Calcasieu Lake.
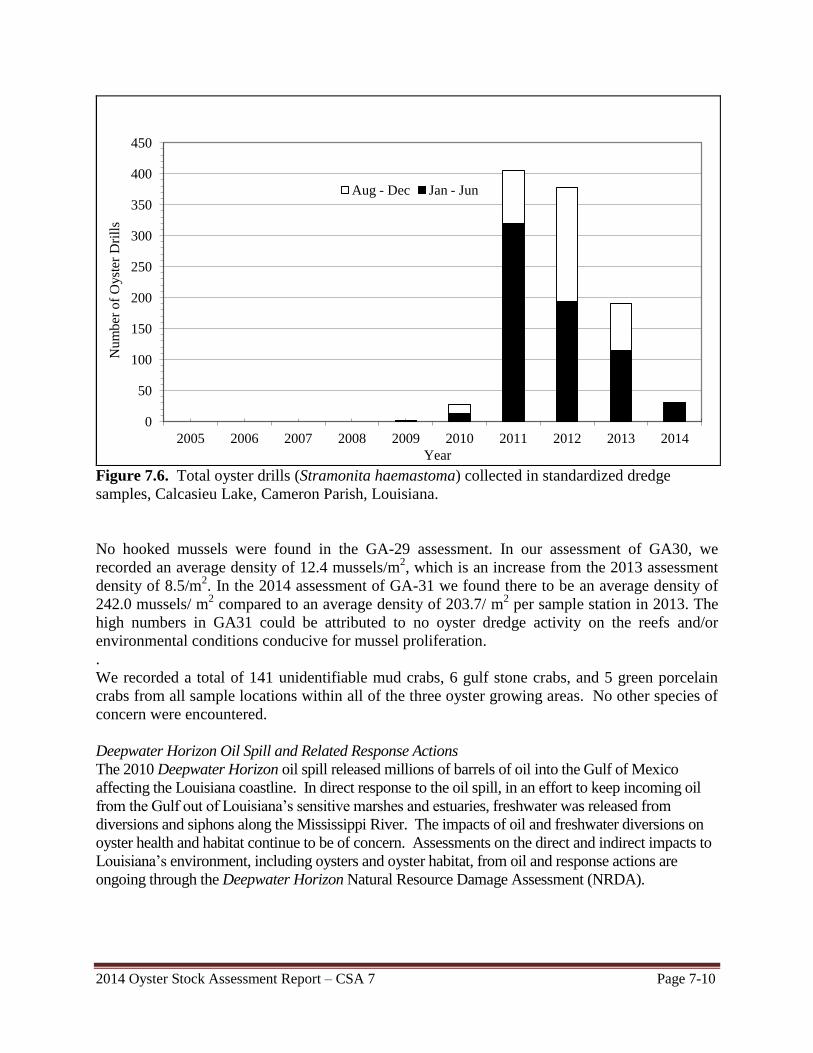
2014 Oyster Stock Assessment Report – CSA 7 Page 7-10
Figure 7.6. Total oyster drills (Stramonita haemastoma) collected in standardized dredge
samples, Calcasieu Lake, Cameron Parish, Louisiana.
No hooked mussels were found in the GA-29 assessment. In our assessment of GA30, we
recorded an average density of 12.4 mussels/m2, which is an increase from the 2013 assessment
density of 8.5/m2. In the 2014 assessment of GA-31 we found there to be an average density of
242.0 mussels/ m2 compared to an average density of 203.7/ m
2 per sample station in 2013. The
high numbers in GA31 could be attributed to no oyster dredge activity on the reefs and/or
environmental conditions conducive for mussel proliferation.
.
We recorded a total of 141 unidentifiable mud crabs, 6 gulf stone crabs, and 5 green porcelain
crabs from all sample locations within all of the three oyster growing areas. No other species of
concern were encountered.
Deepwater Horizon Oil Spill and Related Response Actions
The 2010 Deepwater Horizon oil spill released millions of barrels of oil into the Gulf of Mexico
affecting the Louisiana coastline. In direct response to the oil spill, in an effort to keep incoming oil
from the Gulf out of Louisiana’s sensitive marshes and estuaries, freshwater was released from
diversions and siphons along the Mississippi River. The impacts of oil and freshwater diversions on
oyster health and habitat continue to be of concern. Assessments on the direct and indirect impacts to
Louisiana’s environment, including oysters and oyster habitat, from oil and response actions are
ongoing through the Deepwater Horizon Natural Resource Damage Assessment (NRDA).
0
50
100
150
200
250
300
350
400
450
2005 2006 2007 2008 2009 2010 2011 2012 2013 2014
Nu
mb
er o
f O
yst
er D
rill
s
Year
Aug - Dec Jan - Jun
2014 Oyster Stock Assessment Report – CSA 7 Page 7-11
Future assessments
All the areas open to oyster harvest in GA-29, 30 and 31 that likely have oysters have had
bottom surveys completed and reliable estimates of total reef acreages for these areas have been
made.
One area of concern with future stock assessments in GA-29 and GA30 is the limited number of
sample sites. The current protocol consists of assessing 10 sample locations and collecting five
samples per station for a grand total of 50 meter squares assessed. Based on the total oyster
habitat in these harvest areas this equates to an assessment of one sample site per 535 acres of
available reef. Additional sample sites would provide a more accurate assessment of oyster
resources in Calcasieu Lake. Adding six additional stations (three in each growing area) for
stock assessment purposes will increase the number of sample sites per reef acreage to one per
334 acres. This would put the sampling intensity of Calcasieu Lake more in line with the Sister
Lake Public Oyster Seed Reservation, which has one sampling station per 264 acres of available
habitat.
2013-14 Oyster Season
Agreeing with recommendations from LDWF and the Louisiana Oyster Task Force, the
Louisiana Wildlife and Fisheries Commission continued to keep GA-29 closed to oyster harvest
and opened GA-30 on November 1, 2013 (Table 7.4). The sack limit was set at 10 sacks per day
for the entire season. GA31 remained closed.
Calcasieu Lake oyster landings data via the LDWF Trip-Ticket program indicate there were
40,163 sacks reported as landed during the 2013-14 season (Table 7.5, Figure 7.7), which
represents a 20.5% increase over last season’s report of 33,326 sacks landed. Harvest reported
via trip-tickets was slightly above the estimated harvest from LDWF boarding reports (36,304
sacks). If we assume all oyster harvesters are landing a full daily limit of 10 sacks per trip then
we can estimate the harvest effort for this past season was slightly higher than the previous year.
Using the trip-ticket harvest numbers and comparing them with the 2013 stock assessment we
estimate approximately 23.8% of the standing crop of market-sized oysters in GA-30 was
harvested last season.
Closures to oyster harvesting in GA-30 due to LDHH health concerns were minimal this past
season with closures only accounting for 23 days (Table 7.6). Limited rainfall during the season
kept the Calcasieu River flows at low levels. The increase in the LDHH conditional water levels
from 7ft. to 9ft. in GA-30 had minimal impact on the number of closure dates this season, but in
the future this may significantly reduce closure days and potentially allow an increase in total
harvest.
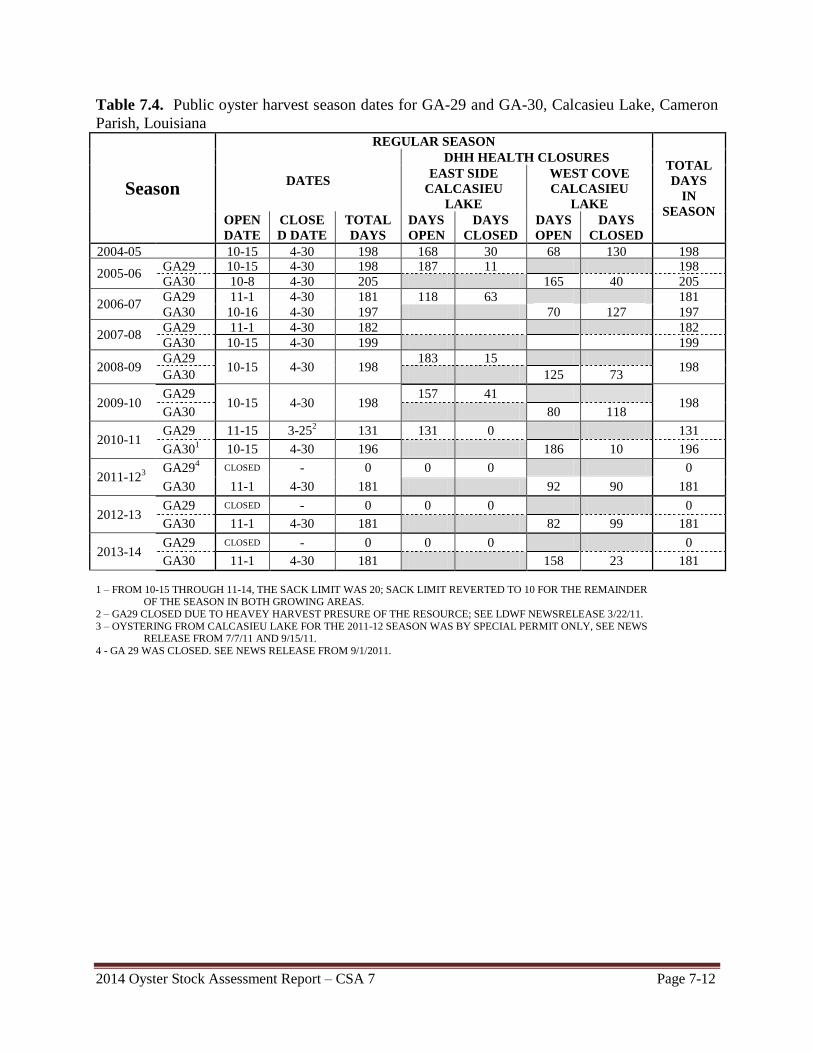
2014 Oyster Stock Assessment Report – CSA 7 Page 7-12
Table 7.4. Public oyster harvest season dates for GA-29 and GA-30, Calcasieu Lake, Cameron
Parish, Louisiana
Season
REGULAR SEASON
TOTAL
DAYS
IN
SEASON
DATES
DHH HEALTH CLOSURES
EAST SIDE
CALCASIEU
LAKE
WEST COVE
CALCASIEU
LAKE
OPEN
DATE
CLOSE
D DATE
TOTAL
DAYS
DAYS
OPEN
DAYS
CLOSED
DAYS
OPEN
DAYS
CLOSED
2004-05 10-15 4-30 198 168 30 68 130 198
2005-06 GA29 10-15 4-30 198 187 11 198
GA30 10-8 4-30 205 165 40 205
2006-07 GA29 11-1 4-30 181 118 63 181
GA30 10-16 4-30 197 70 127 197
2007-08 GA29 11-1 4-30 182 182
GA30 10-15 4-30 199 199
2008-09 GA29
10-15 4-30 198 183 15
198 GA30 125 73
2009-10 GA29
10-15 4-30 198 157 41
198 GA30 80 118
2010-11 GA29 11-15 3-25
2 131 131 0 131
GA301 10-15 4-30 196 186 10 196
2011-123
GA294 CLOSED - 0 0 0 0
GA30 11-1 4-30 181 92 90 181
2012-13 GA29 CLOSED - 0 0 0 0
GA30 11-1 4-30 181 82 99 181
2013-14 GA29 CLOSED - 0 0 0 0
GA30 11-1 4-30 181 158 23 181
1 – FROM 10-15 THROUGH 11-14, THE SACK LIMIT WAS 20; SACK LIMIT REVERTED TO 10 FOR THE REMAINDER OF THE SEASON IN BOTH GROWING AREAS.
2 – GA29 CLOSED DUE TO HEAVEY HARVEST PRESURE OF THE RESOURCE; SEE LDWF NEWSRELEASE 3/22/11.
3 – OYSTERING FROM CALCASIEU LAKE FOR THE 2011-12 SEASON WAS BY SPECIAL PERMIT ONLY, SEE NEWS RELEASE FROM 7/7/11 AND 9/15/11.
4 - GA 29 WAS CLOSED. SEE NEWS RELEASE FROM 9/1/2011.
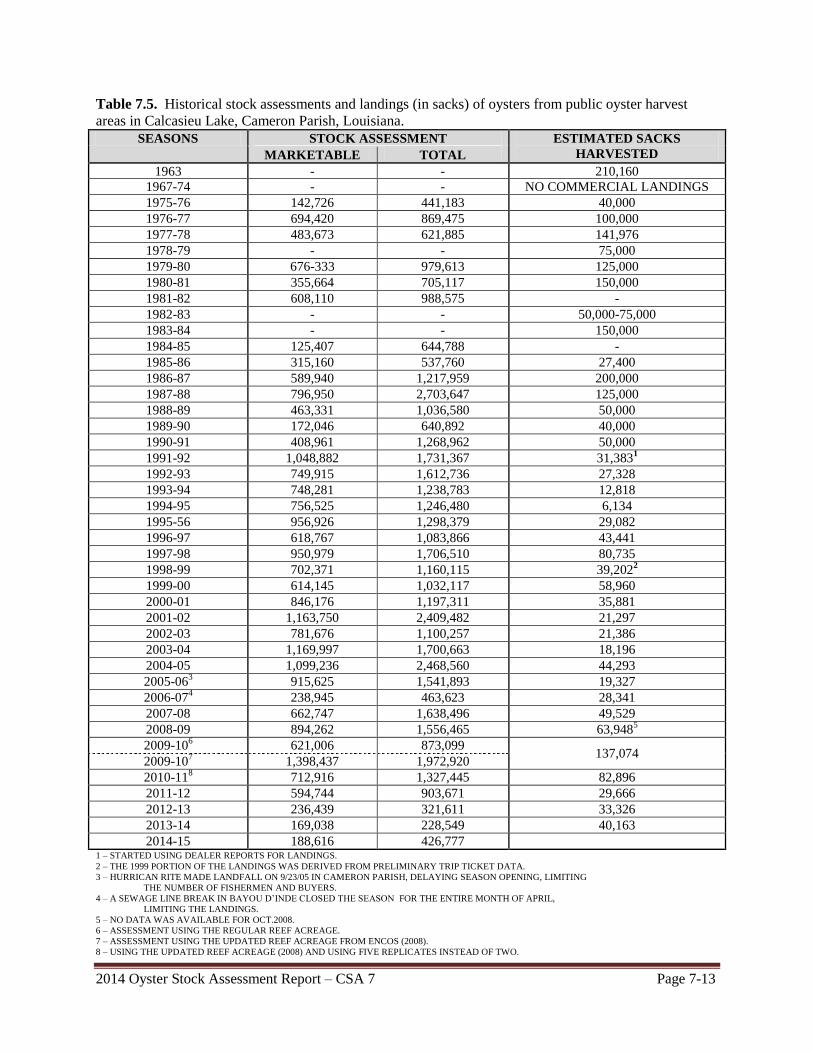
2014 Oyster Stock Assessment Report – CSA 7 Page 7-13
Table 7.5. Historical stock assessments and landings (in sacks) of oysters from public oyster harvest
areas in Calcasieu Lake, Cameron Parish, Louisiana.
SEASONS STOCK ASSESSMENT ESTIMATED SACKS
HARVESTED MARKETABLE TOTAL
1963 - - 210,160
1967-74 - - NO COMMERCIAL LANDINGS
1975-76 142,726 441,183 40,000
1976-77 694,420 869,475 100,000
1977-78 483,673 621,885 141,976
1978-79 - - 75,000
1979-80 676-333 979,613 125,000
1980-81 355,664 705,117 150,000
1981-82 608,110 988,575 -
1982-83 - - 50,000-75,000
1983-84 - - 150,000
1984-85 125,407 644,788 -
1985-86 315,160 537,760 27,400
1986-87 589,940 1,217,959 200,000
1987-88 796,950 2,703,647 125,000
1988-89 463,331 1,036,580 50,000
1989-90 172,046 640,892 40,000
1990-91 408,961 1,268,962 50,000
1991-92 1,048,882 1,731,367 31,3831
1992-93 749,915 1,612,736 27,328
1993-94 748,281 1,238,783 12,818
1994-95 756,525 1,246,480 6,134
1995-56 956,926 1,298,379 29,082
1996-97 618,767 1,083,866 43,441
1997-98 950,979 1,706,510 80,735
1998-99 702,371 1,160,115 39,2022
1999-00 614,145 1,032,117 58,960
2000-01 846,176 1,197,311 35,881
2001-02 1,163,750 2,409,482 21,297
2002-03 781,676 1,100,257 21,386
2003-04 1,169,997 1,700,663 18,196
2004-05 1,099,236 2,468,560 44,293
2005-063 915,625 1,541,893 19,327
2006-074 238,945 463,623 28,341
2007-08 662,747 1,638,496 49,529
2008-09 894,262 1,556,465 63,9485
2009-106 621,006 873,099
137,074 2009-10
7 1,398,437 1,972,920
2010-118 712,916 1,327,445 82,896
2011-12 594,744 903,671 29,666
2012-13 236,439 321,611 33,326
2013-14 169,038 228,549 40,163
2014-15 188,616 426,777 1 – STARTED USING DEALER REPORTS FOR LANDINGS.
2 – THE 1999 PORTION OF THE LANDINGS WAS DERIVED FROM PRELIMINARY TRIP TICKET DATA.
3 – HURRICAN RITE MADE LANDFALL ON 9/23/05 IN CAMERON PARISH, DELAYING SEASON OPENING, LIMITING
THE NUMBER OF FISHERMEN AND BUYERS.
4 – A SEWAGE LINE BREAK IN BAYOU D’INDE CLOSED THE SEASON FOR THE ENTIRE MONTH OF APRIL,
LIMITING THE LANDINGS.
5 – NO DATA WAS AVAILABLE FOR OCT.2008.
6 – ASSESSMENT USING THE REGULAR REEF ACREAGE.
7 – ASSESSMENT USING THE UPDATED REEF ACREAGE FROM ENCOS (2008).
8 – USING THE UPDATED REEF ACREAGE (2008) AND USING FIVE REPLICATES INSTEAD OF TWO.
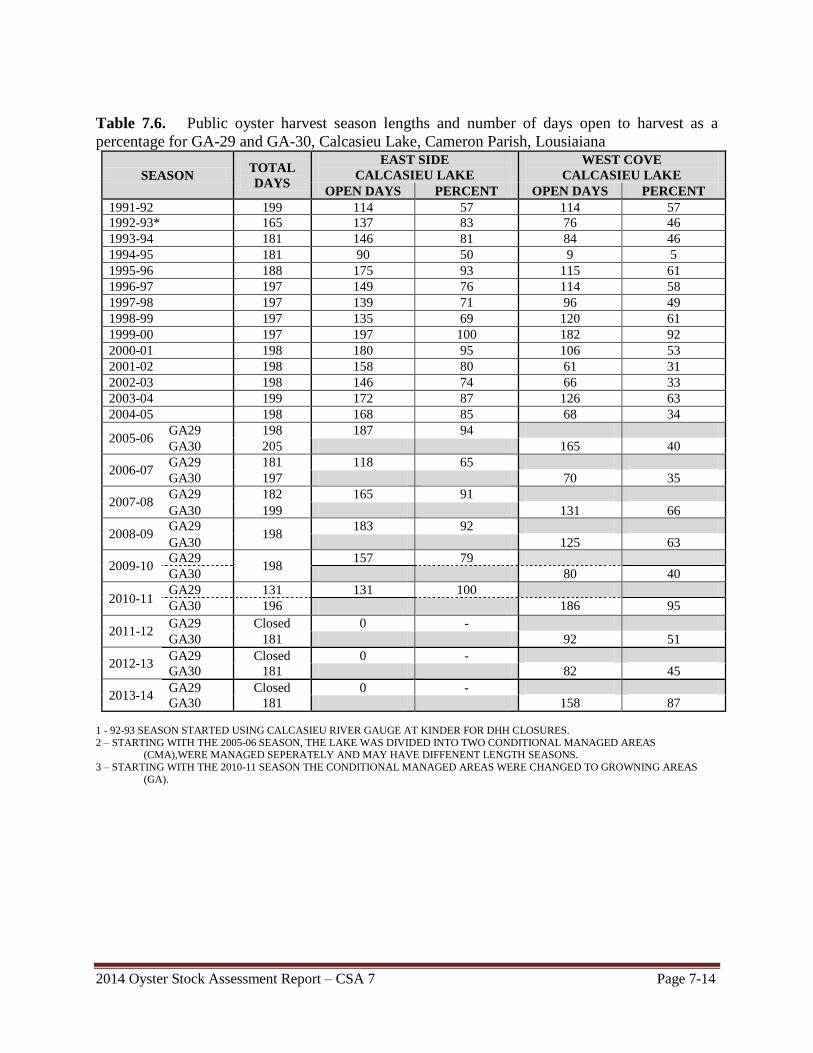
2014 Oyster Stock Assessment Report – CSA 7 Page 7-14
Table 7.6. Public oyster harvest season lengths and number of days open to harvest as a
percentage for GA-29 and GA-30, Calcasieu Lake, Cameron Parish, Lousiaiana
SEASON TOTAL
DAYS
EAST SIDE
CALCASIEU LAKE
WEST COVE
CALCASIEU LAKE
OPEN DAYS PERCENT OPEN DAYS PERCENT
1991-92 199 114 57 114 57
1992-93* 165 137 83 76 46
1993-94 181 146 81 84 46
1994-95 181 90 50 9 5
1995-96 188 175 93 115 61
1996-97 197 149 76 114 58
1997-98 197 139 71 96 49
1998-99 197 135 69 120 61
1999-00 197 197 100 182 92
2000-01 198 180 95 106 53
2001-02 198 158 80 61 31
2002-03 198 146 74 66 33
2003-04 199 172 87 126 63
2004-05 198 168 85 68 34
2005-06 GA29 198 187 94
GA30 205 165 40
2006-07 GA29 181 118 65
GA30 197 70 35
2007-08 GA29 182 165 91
GA30 199 131 66
2008-09 GA29
198 183 92
GA30 125 63
2009-10 GA29
198 157 79
GA30 80 40
2010-11 GA29 131 131 100
GA30 196 186 95
2011-12 GA29 Closed 0 -
GA30 181 92 51
2012-13 GA29 Closed 0 -
GA30 181 82 45
2013-14 GA29 Closed 0 -
GA30 181 158
87
1 - 92-93 SEASON STARTED USING CALCASIEU RIVER GAUGE AT KINDER FOR DHH CLOSURES.
2 – STARTING WITH THE 2005-06 SEASON, THE LAKE WAS DIVIDED INTO TWO CONDITIONAL MANAGED AREAS (CMA),WERE MANAGED SEPERATELY AND MAY HAVE DIFFENENT LENGTH SEASONS.
3 – STARTING WITH THE 2010-11 SEASON THE CONDITIONAL MANAGED AREAS WERE CHANGED TO GROWNING AREAS
(GA).
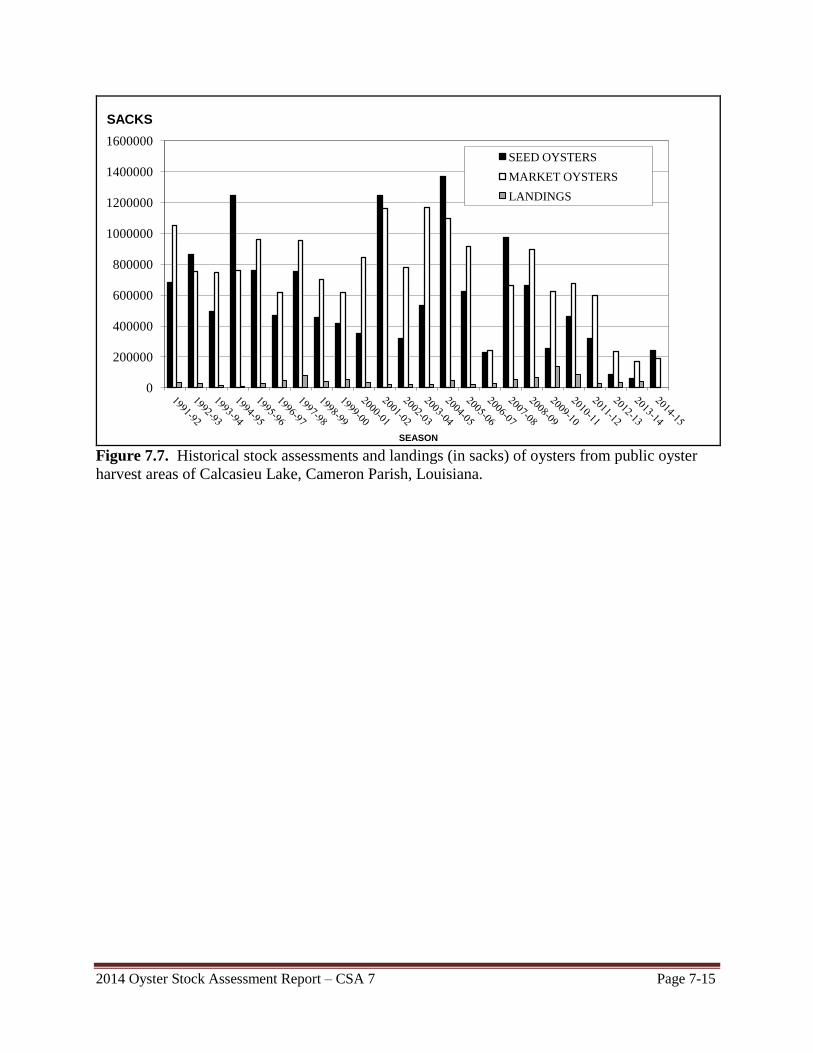
2014 Oyster Stock Assessment Report – CSA 7 Page 7-15
Figure 7.7. Historical stock assessments and landings (in sacks) of oysters from public oyster
harvest areas of Calcasieu Lake, Cameron Parish, Louisiana.
0
200000
400000
600000
800000
1000000
1200000
1400000
1600000
SACKS
SEASON
SEED OYSTERS
MARKET OYSTERS
LANDINGS

This page intentionally left blank.
2014 Oyster Stock Assessment Report – Dermo (Perkinsus marinus) Page 8-1
Levels of the parasite Perkinsus marinus
in sack and seed oysters: Louisiana Public Seed Grounds,
Summer 2014
by
Thomas M. Soniat, Ph.D.
29 August 2014
2014 Oyster Stock Assessment Report – Dermo (Perkinsus marinus) Page 8-2
Among the most significant causes of oyster mortality is the parasite Perkinsus marinus
which is responsible for annual mortality rates that exceed 50% in many populations of adult
eastern oysters, Crassostrea virginica. Perkinsus marinus was described in 1950 by John
Mackin, Malcolm Owen and Albert Collier as Dermocystidium marinum – hence the common
name “dermo” which is still in use (Mackin et al. 1950).
The discovery of the parasite was the result of investigations (funded by a consortium
of oil companies and directed by Texas A&M University) of the impact of oil and gas activities
on the Louisiana oyster industry (Mackin and Hopkins, 1962). Extensive studies were conducted
on the effects of crude oil, bleed water, natural gas, drilling mud and seismographic surveys. It
was ultimately realized that none of these pollutants or activities explained the widespread
mortalities of oysters that were observed. It is now known that the parasite is a major cause of
oyster mortality from Maine to Mexico (Soniat, 1996).
The critical environmental factors which favor the proliferation of the parasite are high
water temperatures and high salinities. Thus infections are more intense in the late summer, on
the seaward side of estuaries and during droughts. Drought conditions on the Gulf Coast are
associated with the La Niña phase of El Niño Southern Oscillation; however, increases in
prevalence (percent infection, PI) precede sharp increases in intensity (weighted prevalence, WP)
and epizootics of dermo in Louisiana can lag La Niña events by about 6 months (Soniat et al.,
2005). Management techniques to minimize disease and increase oyster harvest include moving
infected oysters to lower salinity, early harvest of infected populations, and even freshwater
diversion into high-salinity estuaries. Because of the key role of dermo as a cause of oyster
mortality, the success of oyster farming depends on the ability to manage oyster populations in
the presence of high levels of disease (Soniat and Kortright, 1998).
The standard assay for determining the level of parasitism is the fluid thioglycollate
method (Ray, 1966). A small piece tissue is removed and assayed for disease after incubation in
fluid thioglycollate and antibiotics for one week. P. marinus intensity is scored using a 0-to-5
scale developed by Mackin (1962), where 0 is no infection and 5 is an infection in which the
2014 Oyster Stock Assessment Report – Dermo (Perkinsus marinus) Page 8-3
oyster tissue is almost entirely obscured by the parasite. Calculations are made of percent
infection (PI) and weighted prevalence (WP), which is the sum of the disease code numbers
divided by the total number of oysters in the sample. A WP of 1.5 could be considered a level at
which disease-related mortalities are occurring (Mackin 1962, Bushek et al. 2012). Mackin
(1962) claims a population of live oyster with a weighted prevalence of 2.0 “contains an intense
epidemic, and more than half of the population may be in advanced stages of the disease, with all
of the individuals infected”.
Twenty two sites across coastal Louisiana were sampled for oysters for the summer 2014
study. Samples were taken from Grand Pass (GP1N) and Three Mile Pass (TM) in Mississippi
Sound; Mozambique Point (MP). Lonesome Island (LI), North Black Bay (NB), South Black
Bay (SB), Telegraph Point (TP), Bay Crabe (BC), and Bay Gardene (BG) in the Breton Sound
area; upper Hackberry Bay (HB) in the Barataria system; Lake Felicity (LF) and Lake Chien
(LC) in the Terrebonne Bay region; Grand Pass (GP5W) and Old Camp (OC) in Sister Lake;
Bayou DeWest (BD) and Buckskin Bayou (BB) in Bay Junop; Middle Reef (MR) and Indian
Point (IP) in Vermilion Bay; Northeast Rabbit Island (NE) and Commissary Point (CP) in Lake
Calcasieu; and two stations in Sabine Lake (SL2 and SL3).
An attempt was made to assay 10 market-sized (≥ 75 mm) oysters and 10 seed (25-74
mm) oysters from each site. However, in some cases insufficient numbers of oysters were
available to satisfy that standard (Table 1).
The length of oysters was measured to the nearest mm; anterior-ventral mantle tissue was
removed from each oyster, incubated at room temperature in fluid thioglycollate for about a
week, and assayed according to the standard Ray (1966) technique. The level of infection
(disease code) was scored from 0 to 5, where 0 is no infection and 5 is near total coverage of the
oyster tissue by the parasite. Weighted prevalence (WP) was calculated by summing the disease
code values and dividing by the number of oysters in the sample.
Weighed prevalence (WP) and percent infection (PI) results are shown in Table 1. As
compared to last year, this year’s WP results show a general decrease in disease. In direct reef-
2014 Oyster Stock Assessment Report – Dermo (Perkinsus marinus) Page 8-4
to-reef comparisons only seed oysters from TM showed an increase in WP (0.03 in 2013 vs. 0.07
in 2014); in all other like comparisons, WP of seed and market oysters deceased or remained the
same as compared to 2013. Higher WI was found in seed and market oysters from GP1N in
2014, as compared to nearby Cabbage Reef in 2013.
Overall, disease levels in 2014 have declined in comparison to 2013 levels, and remain
low across the state. Records of disease levels from this year and previous years are available
from Oyster Sentinel (www.oystersentinel.org).
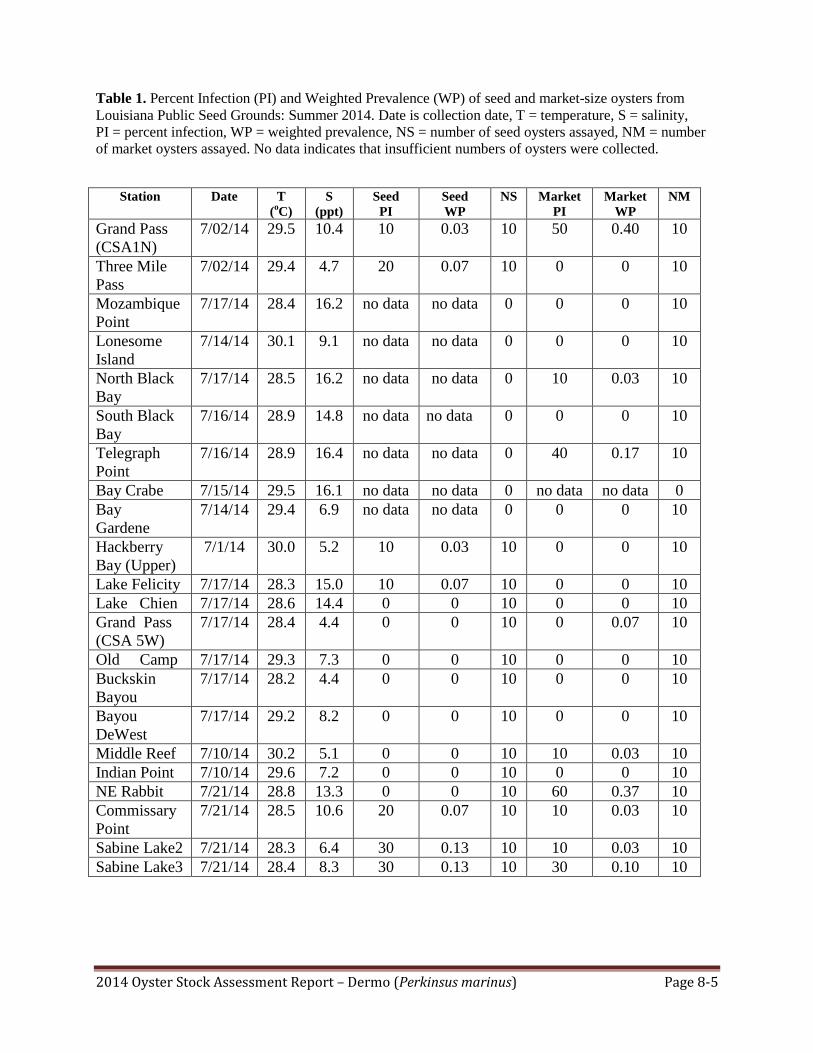
2014 Oyster Stock Assessment Report – Dermo (Perkinsus marinus) Page 8-5
Table 1. Percent Infection (PI) and Weighted Prevalence (WP) of seed and market-size oysters from
Louisiana Public Seed Grounds: Summer 2014. Date is collection date, T = temperature, S = salinity,
PI = percent infection, WP = weighted prevalence, NS = number of seed oysters assayed, NM = number
of market oysters assayed. No data indicates that insufficient numbers of oysters were collected.
Station Date T
(oC)
S
(ppt)
Seed
PI
Seed
WP
NS Market
PI
Market
WP
NM
Grand Pass
(CSA1N)
7/02/14 29.5 10.4 10 0.03 10 50 0.40 10
Three Mile
Pass
7/02/14 29.4 4.7 20 0.07 10 0 0 10
Mozambique
Point
7/17/14 28.4 16.2 no data no data 0 0 0 10
Lonesome
Island
7/14/14 30.1 9.1 no data no data 0 0 0 10
North Black
Bay
7/17/14 28.5 16.2 no data no data 0 10 0.03 10
South Black
Bay
7/16/14 28.9 14.8 no data no data 0 0 0 10
Telegraph
Point
7/16/14 28.9 16.4 no data no data 0 40 0.17 10
Bay Crabe 7/15/14 29.5 16.1 no data no data 0 no data no data 0
Bay
Gardene
7/14/14 29.4 6.9 no data no data 0 0 0 10
Hackberry
Bay (Upper)
7/1/14 30.0 5.2 10 0.03 10 0 0 10
Lake Felicity 7/17/14 28.3 15.0 10 0.07 10 0 0 10
Lake Chien 7/17/14 28.6 14.4 0 0 10 0 0 10
Grand Pass
(CSA 5W)
7/17/14 28.4 4.4 0 0 10 0 0.07 10
Old Camp 7/17/14 29.3 7.3 0 0 10 0 0 10
Buckskin
Bayou
7/17/14 28.2 4.4 0 0 10 0 0 10
Bayou
DeWest
7/17/14 29.2 8.2 0 0 10 0 0 10
Middle Reef 7/10/14 30.2 5.1 0 0 10 10 0.03 10
Indian Point 7/10/14 29.6 7.2 0 0 10 0 0 10
NE Rabbit 7/21/14 28.8 13.3 0 0 10 60 0.37 10
Commissary
Point
7/21/14 28.5 10.6 20 0.07 10 10 0.03 10
Sabine Lake2 7/21/14 28.3 6.4 30 0.13 10 10 0.03 10
Sabine Lake3 7/21/14 28.4 8.3 30 0.13 10 30 0.10 10
2014 Oyster Stock Assessment Report – Dermo (Perkinsus marinus) Page 8-6
Literature Cited
Bushek, D., S. E. Ford and I. Burt. 2012. Long-term patterns of an estuarine pathogen along a
salinity gradient. J. Mar. Res. 70:225-251.
Mackin, J.G. 1962. Oyster disease caused by Dermocystidium marinum and other
microorganisms in Louisiana. Publ. Inst. Mar. Sci. Univ. Tex. 7:132-299
Mackin, J.G. and S.H. Hopkins. 1962. Studies on oyster mortality in relation to natural
environments and to oil fields in Louisiana. Publ. Inst. Mar. Sci. Univ. Tex. 7:1-131.
Mackin, J.G., H.M. Owen and A. Collier. 1950. Preliminary note on the occurrence of a new
protistan parasite, Dermocystidium marinum n.sp. in Crassostrea virginica (Gmelin) Science
111:328-329.
Ray S.M. 1966. A review of the culture method for detecting Dermocystidium marinum with
suggested modifications and precautions. Proc. Natl. Shellfish. Assoc. 54:55-70.
Soniat, T.M. 1996. Epizootiology of Perkinsus marinus disease of eastern oysters in the Gulf of
Mexico. J. Shellfish Res. 15:35-43.
Soniat, T.M. and E.V. Kortright. 1998. Estimating time to critical levels of Perkinsus marinus in
eastern oysters, Crassostrea virginica. J. Shellfish Res. 17:1071-1080.
Soniat, T.M., J.H. Klinck, E.N. Powell, and E.E. Hofmann. 2005. Understanding the success and
failure of oyster populations: climatic cycles and Perkinsus marinus. J. Shellfish Res. 24: 83-93.