Embed Size (px)
DESCRIPTION
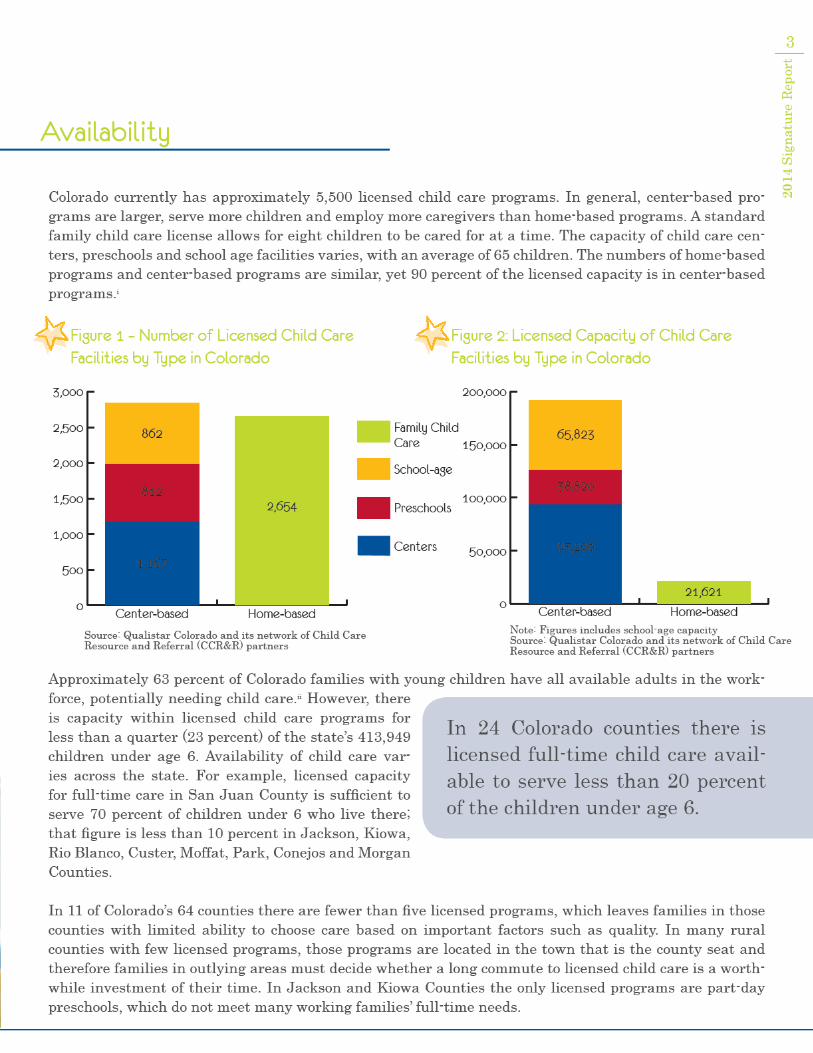
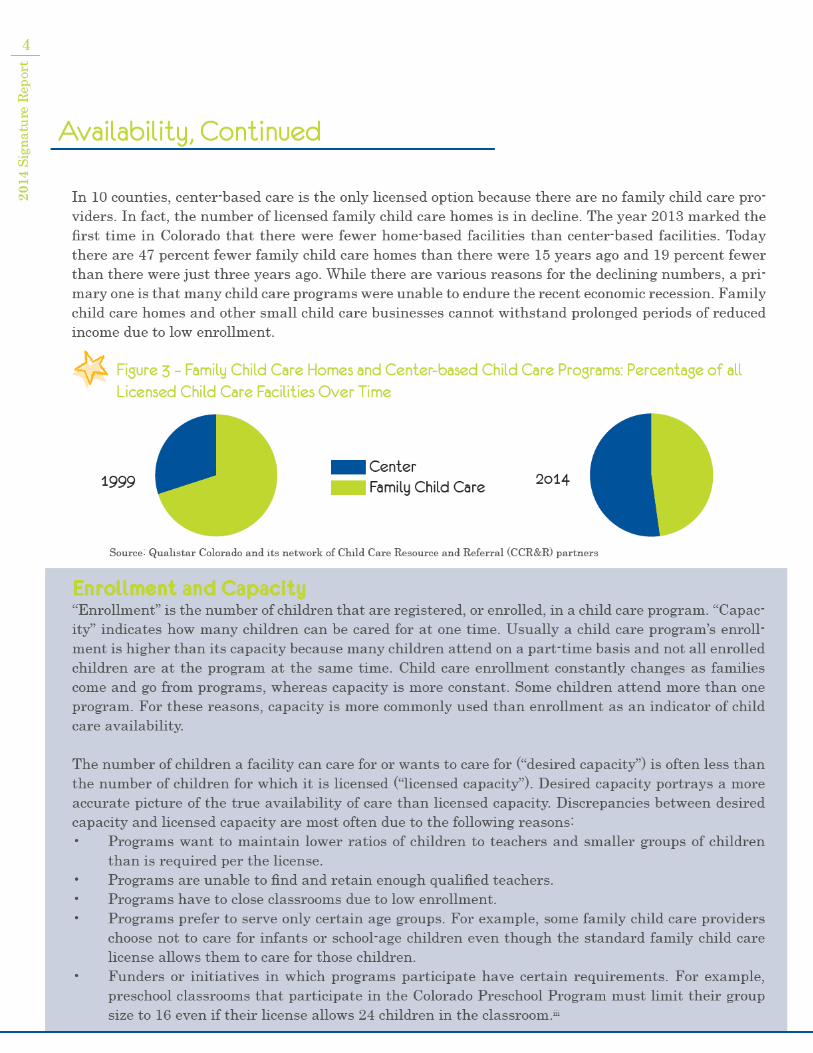
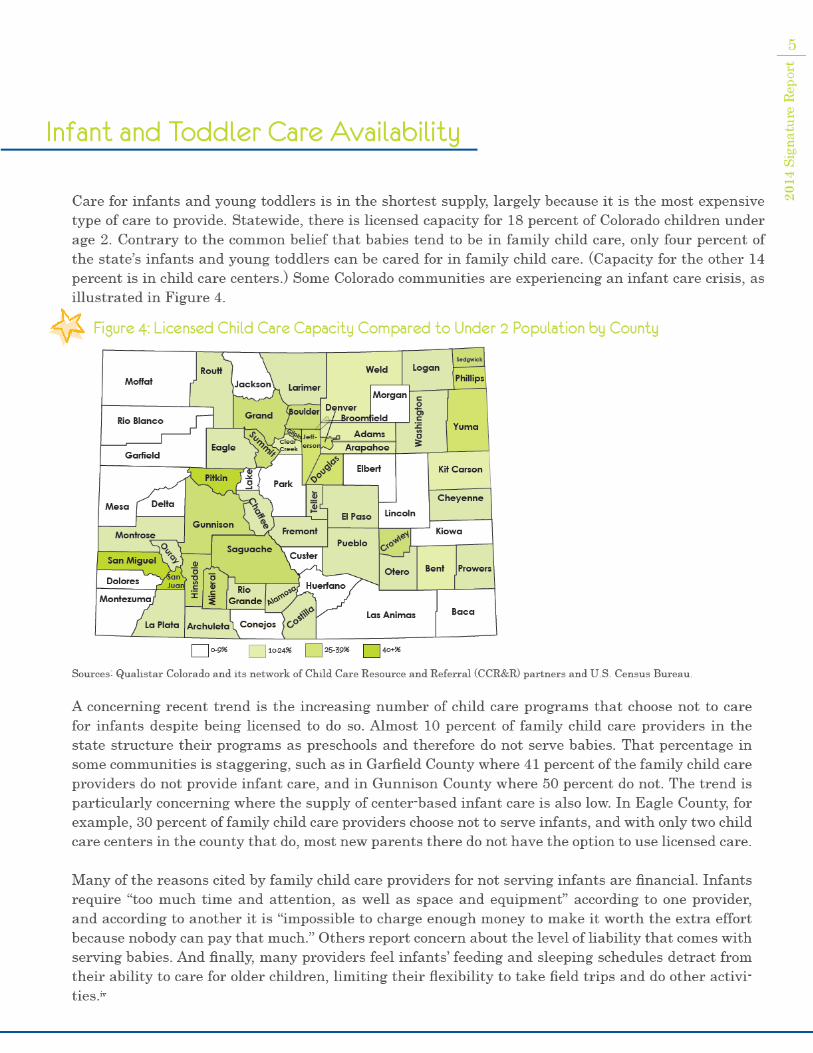
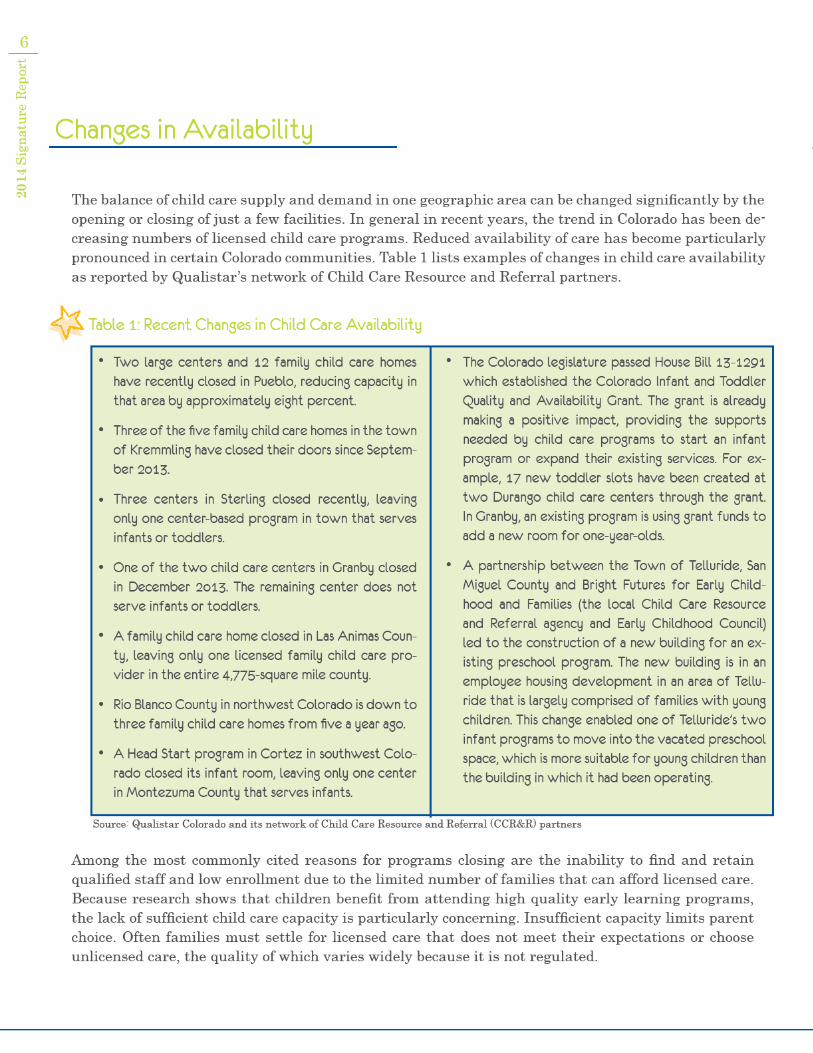
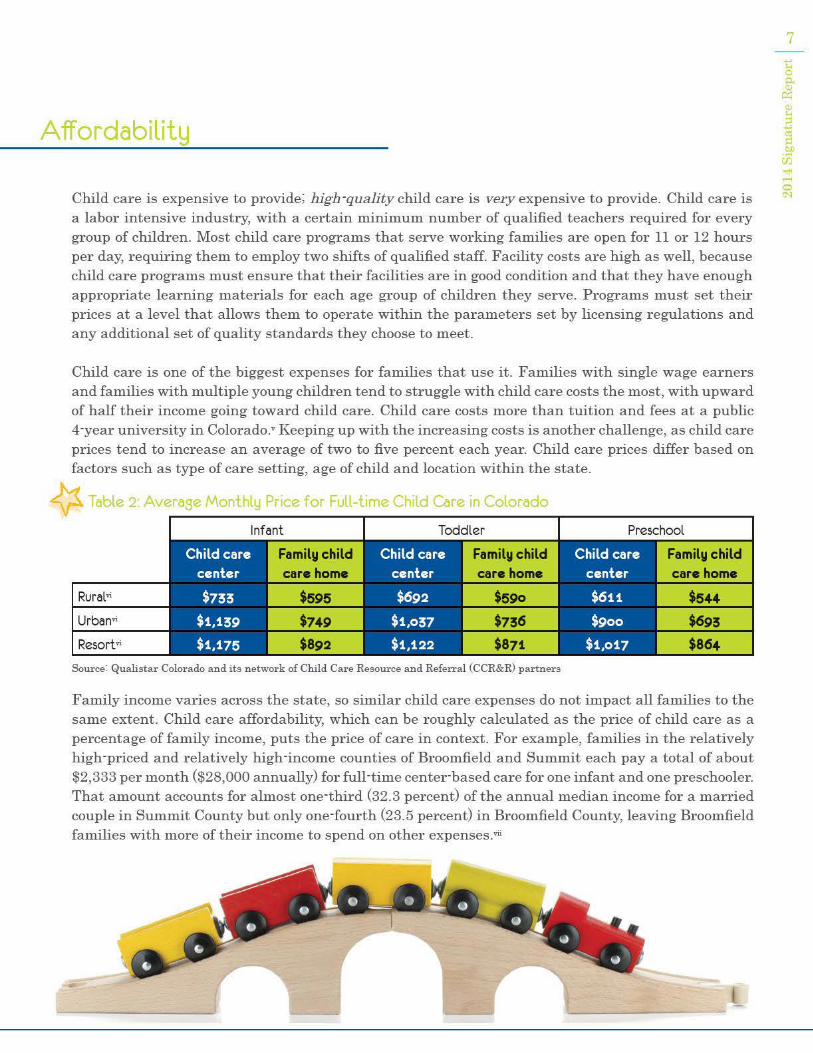
Published annually, the Signature Report highlights some of the most critical issues facing the early childhood education industry in Colorado, including the cost and availability of child care in the state and licensed capacity compared to Colorado’s child population.
Citation preview

1020
14 S
igna
ture
Rep
ort
Endnotesi Throughout this report, Colorado child care capacity and price data come from Qualistar Colorado and its network of Child Care Resource & Referral partners.
ii The Annie E. Casey Foundation, KIDS COUNT Data Center. Population Reference Bureau, analysis of data from the U.S. Census Bureau, 2009-2011 American Community Survey.
iii Colorado State Board of Education, Amended Rules for the Administration of The Colorado Preschool Program Act, 2003, accessed at http://www.cde.state.co.us/sites/default/files/documents/cpp/download/cppdocs/bdregs_301-32.pdf.
iv Electronic communication with Colorado child care programs via Qualistar Colorado’s network of Child Care Resource & Referral partners, April-May 2014.
v CollegeBoard. In-State Tuition and Fees by State, 2013-14, and Five-Year Percentage Changes, accessed at http://trends.collegeboard.org/college-pricing/figures-tables/in-state-tuition-fees-state-2013-14-and-5-year-percentage-changes.
vi In this report, counties are defined as urban, rural or rural resort as follows: Urban: Adams, Arapahoe, Boulder, Broomfield, Denver, Douglas, El Paso, Jefferson, Larimer, Mesa, Pueblo, Weld. Rural resort: Eagle, Garfield, Grand, Lake, Pitkin, Routt, Summit. The remaining 45 counties are defined as rural.
vii U.S. Census Bureau, American Community Survey, 2012 five-year estimates. Table B19126.
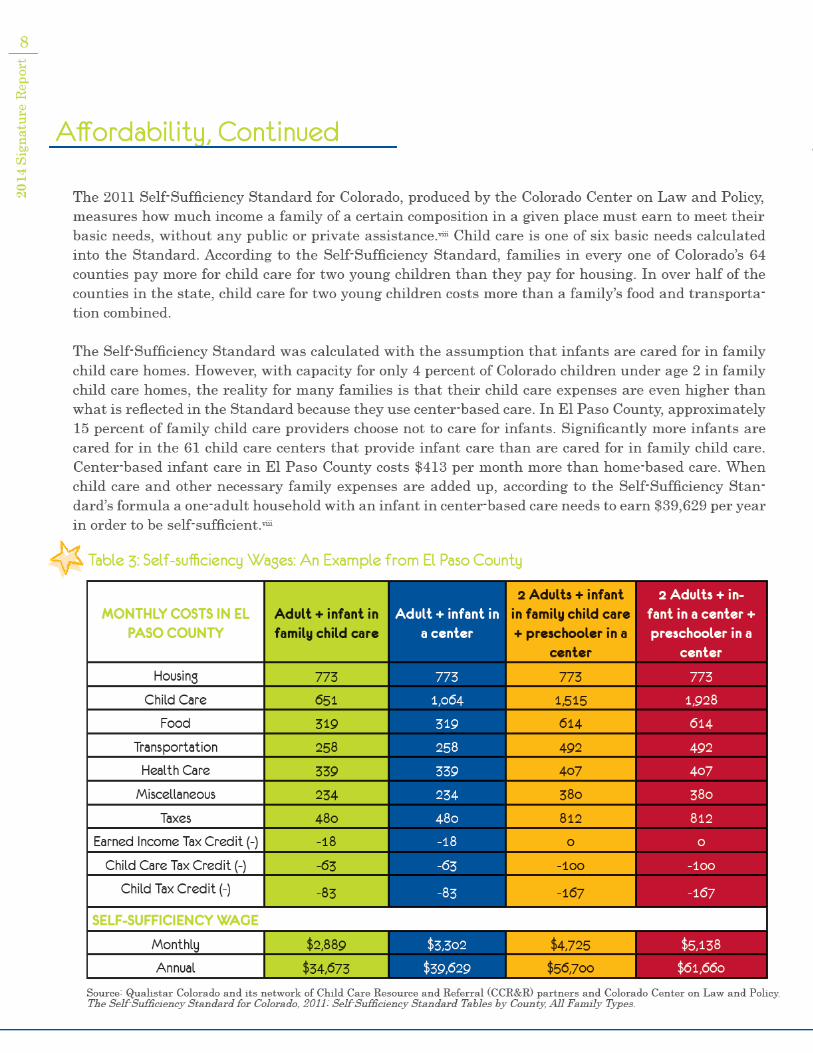
viii Colorado Center on Law and Policy. The Self-Sufficiency Standard for Colorado, 2011: Self-Sufficiency Standard Tables by County, All Family Types, accessed at http://www.selfsufficiencystandard.org/docs/Colorado2011.pdf.
ix College Board, Financial Aid: FAQs, accessed at https://bigfuture.collegeboard.org/pay-for-college/fi-nancial-aid-101/financial-aid-faqs.
xHouse Bill 1317- Colorado Childcare Assistance Program Changes, Colorado General Assembly 2014. The bill makes several changes to CCCAP, including provider rates, parent co-payments, payment for child absences and holidays, income eligibility changes, eligible activities for parents using CCCAP, Colorado Works transition, exit income eligibility, child care authorization, waiting lists, evidence of income, presumptive eligibility, and eligibility for families receiving food assistance.
xiU.S. Census Bureau, 2010 Census. Summary File 2, Table PCT3.
11
2014
Sig
natu
re R
epor
t
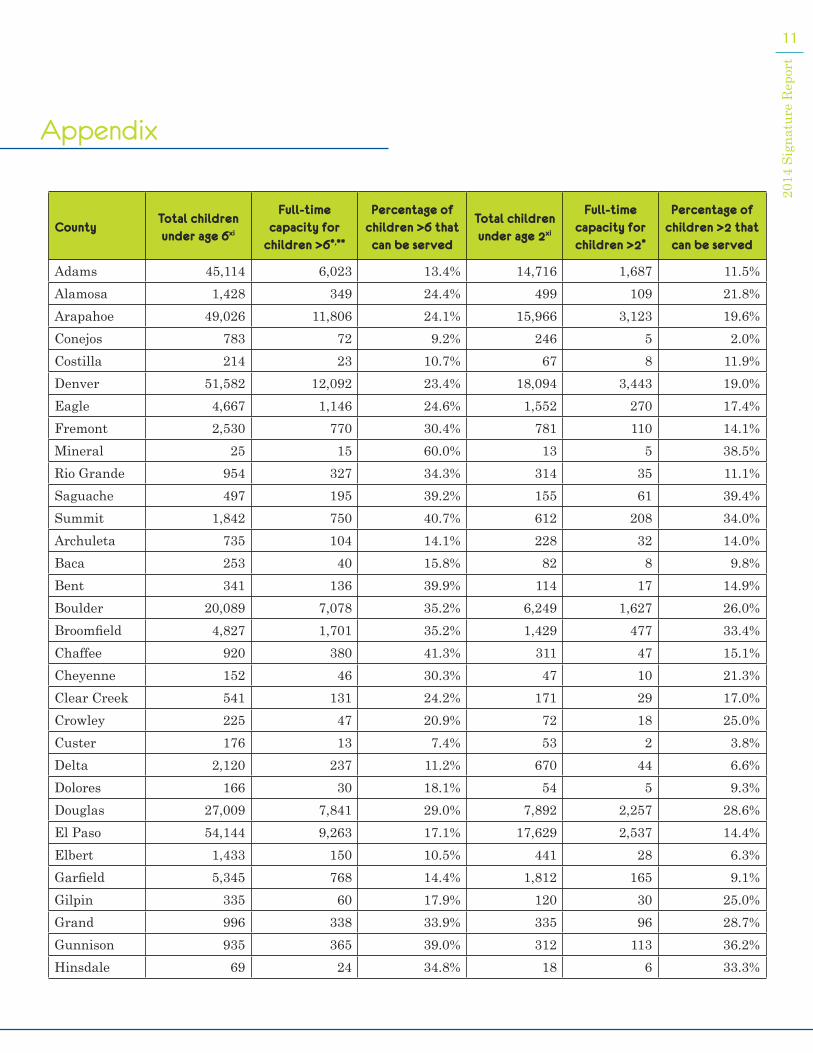
Appendix
CountyTotal children under age 6xi
Full-time capacity for
children >6*,**
Percentage of children >6 that can be served
Total children under age 2xi
Full-time capacity for children >2*
Percentage of children >2 that can be served
Adams 45,114 6,023 13.4% 14,716 1,687 11.5%Alamosa 1,428 349 24.4% 499 109 21.8%Arapahoe 49,026 11,806 24.1% 15,966 3,123 19.6%Conejos 783 72 9.2% 246 5 2.0%Costilla 214 23 10.7% 67 8 11.9%Denver 51,582 12,092 23.4% 18,094 3,443 19.0%Eagle 4,667 1,146 24.6% 1,552 270 17.4%Fremont 2,530 770 30.4% 781 110 14.1%Mineral 25 15 60.0% 13 5 38.5%Rio Grande 954 327 34.3% 314 35 11.1%Saguache 497 195 39.2% 155 61 39.4%Summit 1,842 750 40.7% 612 208 34.0%Archuleta 735 104 14.1% 228 32 14.0%Baca 253 40 15.8% 82 8 9.8%Bent 341 136 39.9% 114 17 14.9%Boulder 20,089 7,078 35.2% 6,249 1,627 26.0%Broomfield 4,827 1,701 35.2% 1,429 477 33.4%Chaffee 920 380 41.3% 311 47 15.1%Cheyenne 152 46 30.3% 47 10 21.3%Clear Creek 541 131 24.2% 171 29 17.0%Crowley 225 47 20.9% 72 18 25.0%Custer 176 13 7.4% 53 2 3.8%Delta 2,120 237 11.2% 670 44 6.6%Dolores 166 30 18.1% 54 5 9.3%Douglas 27,009 7,841 29.0% 7,892 2,257 28.6%El Paso 54,144 9,263 17.1% 17,629 2,537 14.4%Elbert 1,433 150 10.5% 441 28 6.3%Garfield 5,345 768 14.4% 1,812 165 9.1%Gilpin 335 60 17.9% 120 30 25.0%Grand 996 338 33.9% 335 96 28.7%Gunnison 935 365 39.0% 312 113 36.2%Hinsdale 69 24 34.8% 18 6 33.3%
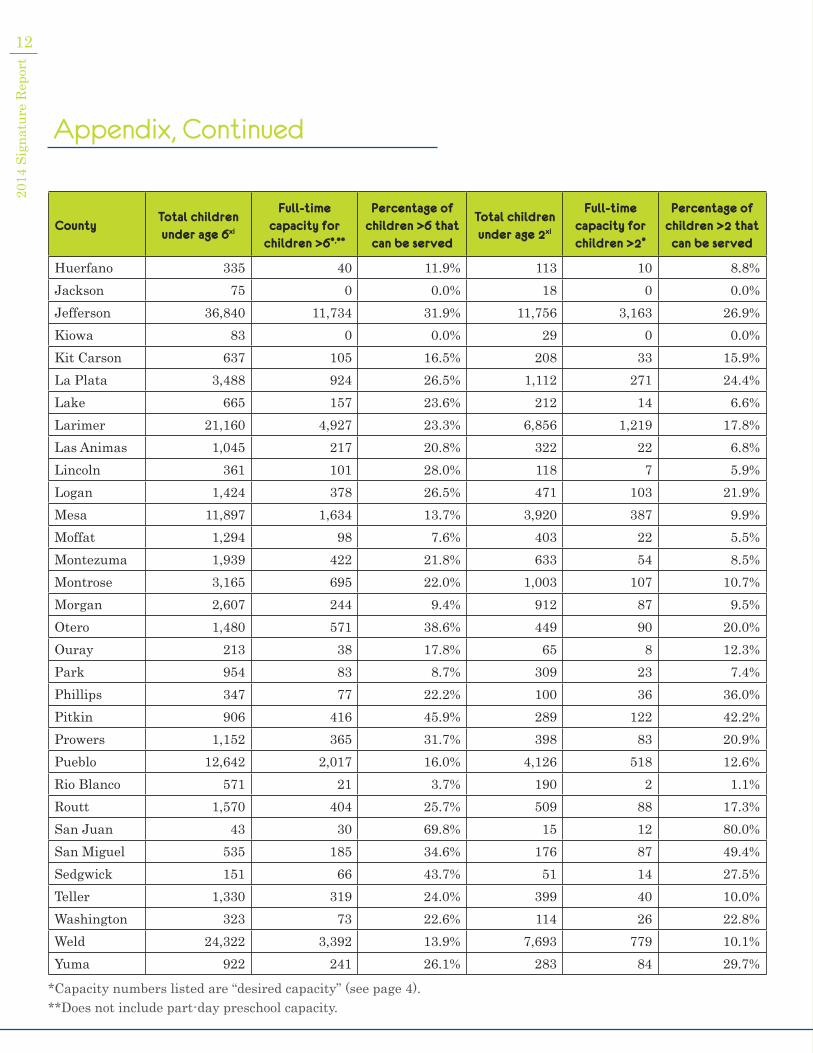
Appendix, Continued
1220
14 S
igna
ture
Rep
ort
CountyTotal children under age 6xi
Full-time capacity for
children >6*,**
Percentage of children >6 that can be served
Total children under age 2xi
Full-time capacity for children >2*
Percentage of children >2 that can be served
Huerfano 335 40 11.9% 113 10 8.8%Jackson 75 0 0.0% 18 0 0.0%Jefferson 36,840 11,734 31.9% 11,756 3,163 26.9%Kiowa 83 0 0.0% 29 0 0.0%Kit Carson 637 105 16.5% 208 33 15.9%La Plata 3,488 924 26.5% 1,112 271 24.4%Lake 665 157 23.6% 212 14 6.6%Larimer 21,160 4,927 23.3% 6,856 1,219 17.8%Las Animas 1,045 217 20.8% 322 22 6.8%Lincoln 361 101 28.0% 118 7 5.9%Logan 1,424 378 26.5% 471 103 21.9%Mesa 11,897 1,634 13.7% 3,920 387 9.9%Moffat 1,294 98 7.6% 403 22 5.5%Montezuma 1,939 422 21.8% 633 54 8.5%Montrose 3,165 695 22.0% 1,003 107 10.7%Morgan 2,607 244 9.4% 912 87 9.5%Otero 1,480 571 38.6% 449 90 20.0%Ouray 213 38 17.8% 65 8 12.3%Park 954 83 8.7% 309 23 7.4%Phillips 347 77 22.2% 100 36 36.0%Pitkin 906 416 45.9% 289 122 42.2%Prowers 1,152 365 31.7% 398 83 20.9%Pueblo 12,642 2,017 16.0% 4,126 518 12.6%Rio Blanco 571 21 3.7% 190 2 1.1%Routt 1,570 404 25.7% 509 88 17.3%San Juan 43 30 69.8% 15 12 80.0%San Miguel 535 185 34.6% 176 87 49.4%Sedgwick 151 66 43.7% 51 14 27.5%Teller 1,330 319 24.0% 399 40 10.0%Washington 323 73 22.6% 114 26 22.8%Weld 24,322 3,392 13.9% 7,693 779 10.1%Yuma 922 241 26.1% 283 84 29.7%
*Capacity numbers listed are “desired capacity” (see page 4). **Does not include part-day preschool capacity.

15
2014
Sig
natu
re R
epor
t
CountyTotal children under age 6xi
Full-time capacity for
children >6*,**
Percentage of children >6 that can be served
Total children under age 2xi
Full-time capacity for children >2*
Percentage of children >2 that can be served
Huerfano 335 40 11.9% 113 10 8.8%Jackson 75 0 0.0% 18 0 0.0%Jefferson 36,840 11,734 31.9% 11,756 3,163 26.9%Kiowa 83 0 0.0% 29 0 0.0%Kit Carson 637 105 16.5% 208 33 15.9%La Plata 3,488 924 26.5% 1,112 271 24.4%Lake 665 157 23.6% 212 14 6.6%Larimer 21,160 4,927 23.3% 6,856 1,219 17.8%Las Animas 1,045 217 20.8% 322 22 6.8%Lincoln 361 101 28.0% 118 7 5.9%Logan 1,424 378 26.5% 471 103 21.9%Mesa 11,897 1,634 13.7% 3,920 387 9.9%Moffat 1,294 98 7.6% 403 22 5.5%Montezuma 1,939 422 21.8% 633 54 8.5%Montrose 3,165 695 22.0% 1,003 107 10.7%Morgan 2,607 244 9.4% 912 87 9.5%Otero 1,480 571 38.6% 449 90 20.0%Ouray 213 38 17.8% 65 8 12.3%Park 954 83 8.7% 309 23 7.4%Phillips 347 77 22.2% 100 36 36.0%Pitkin 906 416 45.9% 289 122 42.2%Prowers 1,152 365 31.7% 398 83 20.9%Pueblo 12,642 2,017 16.0% 4,126 518 12.6%Rio Blanco 571 21 3.7% 190 2 1.1%Routt 1,570 404 25.7% 509 88 17.3%San Juan 43 30 69.8% 15 12 80.0%San Miguel 535 185 34.6% 176 87 49.4%Sedgwick 151 66 43.7% 51 14 27.5%Teller 1,330 319 24.0% 399 40 10.0%Washington 323 73 22.6% 114 26 22.8%Weld 24,322 3,392 13.9% 7,693 779 10.1%Yuma 922 241 26.1% 283 84 29.7%