Embed Size (px)
Citation preview
NEDBANK GROUP LIMITED
2014 RESULTSINVESTOR PRESENTATION
for year ended 31 December 2014
2
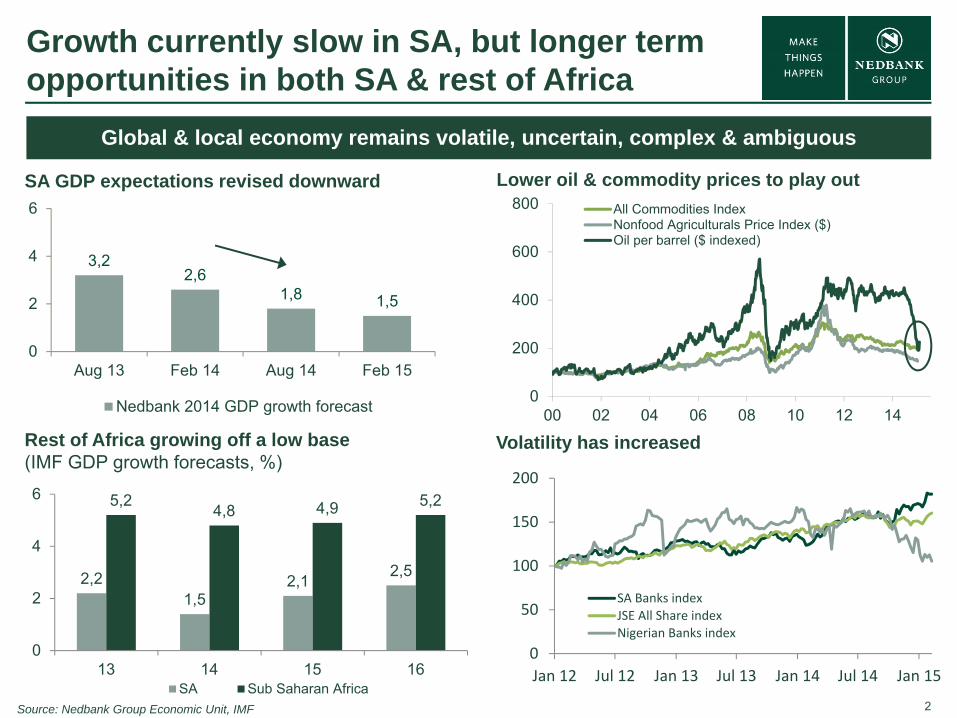
3,22,6
1,8 1,5
0
2
4
6
Aug 13 Feb 14 Aug 14 Feb 15
Nedbank 2014 GDP growth forecast
Growth currently slow in SA, but longer term opportunities in both SA & rest of Africa
Rest of Africa growing off a low base(IMF GDP growth forecasts, %)
SA GDP expectations revised downward
Global & local economy remains volatile, uncertain, complex & ambiguous
Source: Nedbank Group Economic Unit, IMF
2,21,5
2,1 2,5
5,2 4,8 4,9 5,2
0
2
4
6
13 14 15 16SA Sub Saharan Africa
Lower oil & commodity prices to play out
Volatility has increased
0
200
400
600
800
00 02 04 06 08 10 12 14
All Commodities IndexNonfood Agriculturals Price Index ($)Oil per barrel ($ indexed)
0
50
100
150
200
Jan 12 Jul 12 Jan 13 Jul 13 Jan 14 Jul 14 Jan 15
SA Banks indexJSE All Share indexNigerian Banks index
3
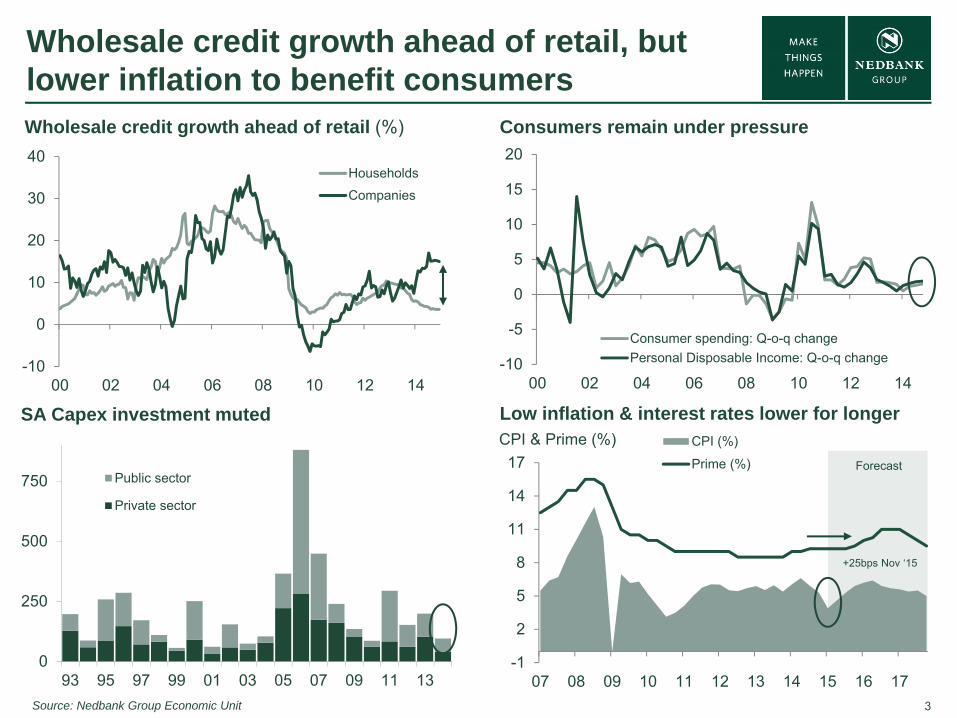
Wholesale credit growth ahead of retail, but lower inflation to benefit consumersWholesale credit growth ahead of retail (%)
Source: Nedbank Group Economic Unit
Consumers remain under pressure
Low inflation & interest rates lower for longer
-10
0
10
20
30
40
00 02 04 06 08 10 12 14
Households
Companies
SA Capex investment muted
0
250
500
750
93 95 97 99 01 03 05 07 09 11 13
Public sector
Private sector
CPI & Prime (%)
-10
-5
0
5
10
15
20
00 02 04 06 08 10 12 14
Consumer spending: Q-o-q changePersonal Disposable Income: Q-o-q change
-1
2
5
8
11
14
17
07 08 09 10 11 12 13 14 15 16 17
CPI (%)
Prime (%) Forecast
+25bps Nov ‘15
4
FOCUS ON SHAREHOLDER VALUE CREATION
5
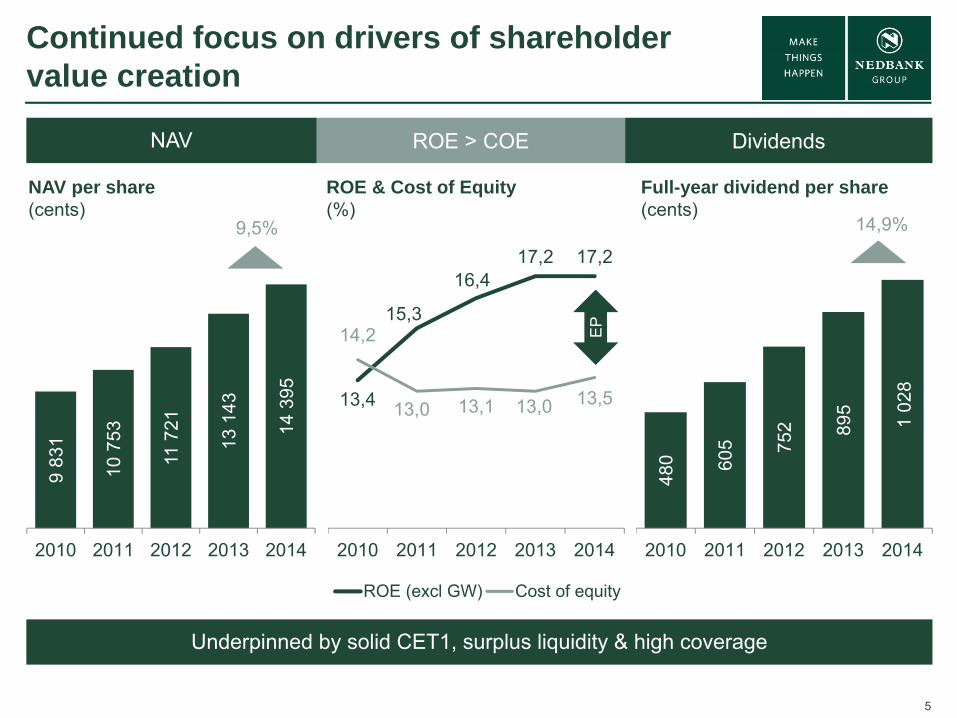
9 83
1
10 7
53
11 7
21
13 1
43
14 3
95
2010 2011 2012 2013 2014
Continued focus on drivers of shareholder value creation
480 60
5 752 89
5
1 02
8
2010 2011 2012 2013 2014
13,4
15,3
16,417,2 17,2
14,2
13,0 13,1 13,0 13,5
2010 2011 2012 2013 2014
ROE (excl GW) Cost of equity
NAV per share(cents)
ROE & Cost of Equity (%)
Full-year dividend per share(cents)
NAV ROE > COE
9,5%
EP
Dividends
14,9%
Underpinned by solid CET1, surplus liquidity & high coverage
6
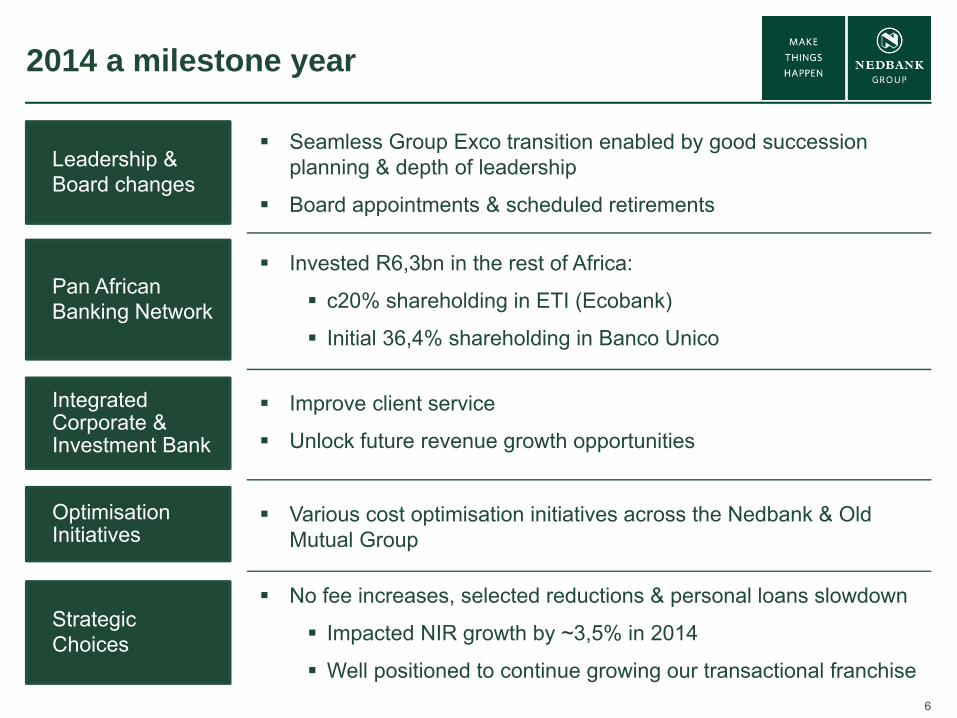
No fee increases, selected reductions & personal loans slowdown
Impacted NIR growth by ~3,5% in 2014
Well positioned to continue growing our transactional franchise
2014 a milestone year
Leadership & Board changes
Seamless Group Exco transition enabled by good succession planning & depth of leadership
Board appointments & scheduled retirements
Pan African Banking Network
Invested R6,3bn in the rest of Africa:
c20% shareholding in ETI (Ecobank)
Initial 36,4% shareholding in Banco Unico
Integrated Corporate & Investment Bank
Improve client service
Unlock future revenue growth opportunities
Optimisation Initiatives
Strategic Choices
Various cost optimisation initiatives across the Nedbank & Old Mutual Group
7
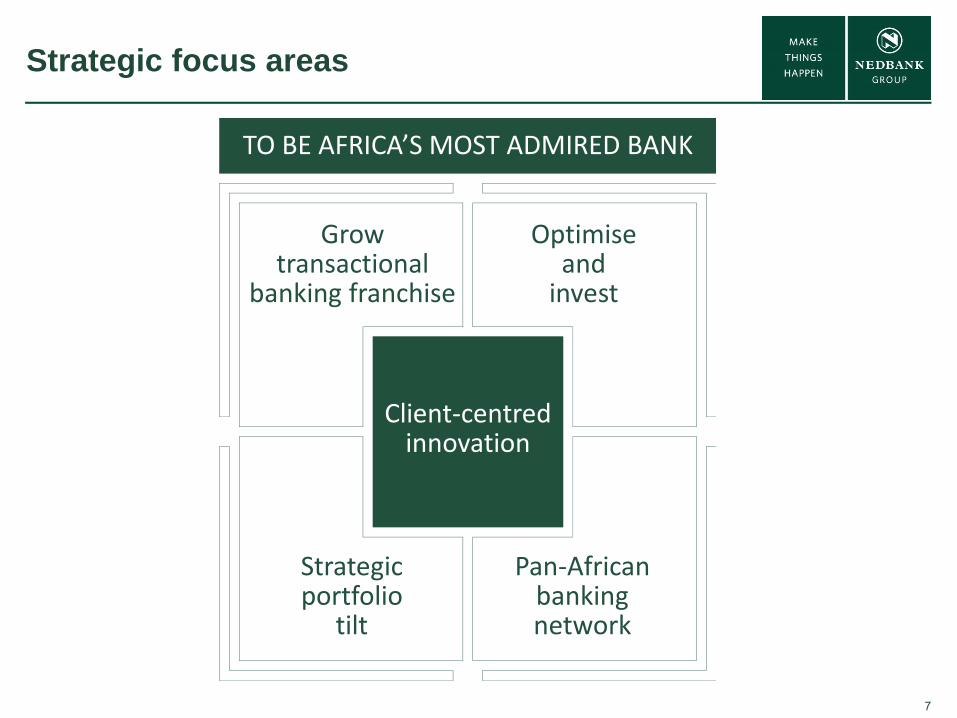
Strategic focus areas
TO BE AFRICA’S MOST ADMIRED BANK
Client‐centred innovation
Grow transactional
banking franchise
Optimiseandinvest
Strategic portfolio
tilt
Pan‐African banking network
8
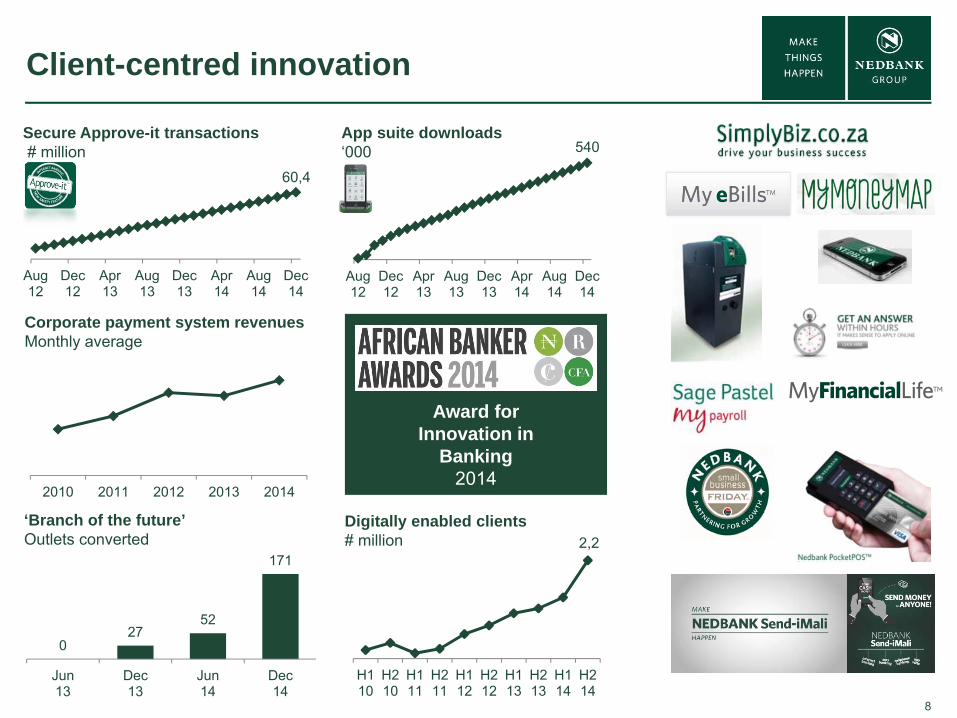
Client-centred innovation
Aug12
Dec12
Apr13
Aug13
Dec13
Apr14
Aug14
Dec14
App suite downloads‘000
Secure Approve-it transactions# million
Digitally enabled clients# million
Award for Innovation in
Banking2014
Corporate payment system revenuesMonthly average
‘Branch of the future’Outlets converted
H110
H210
H111
H211
H112
H212
H113
H213
H114
H214
Aug12
Dec12
Apr13
Aug13
Dec13
Apr14
Aug14
Dec14
2010 2011 2012 2013 2014
2,2
540
60,4
027
52
171
Jun13
Dec13
Jun14
Dec14
9
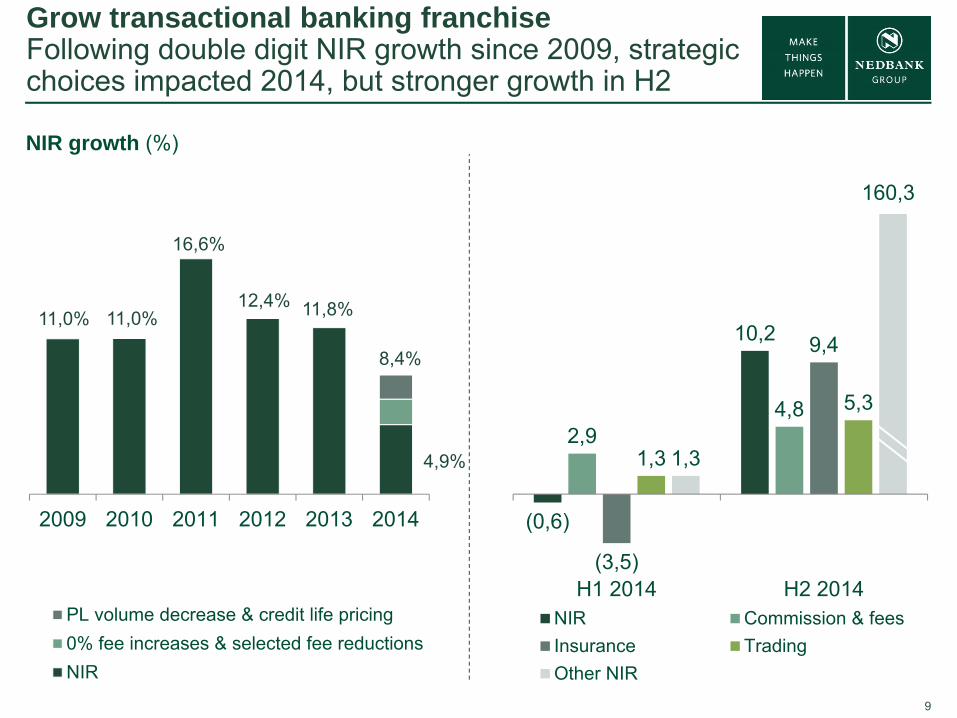
11,0% 11,0%
16,6%
12,4% 11,8%
4,9%
2009 2010 2011 2012 2013 2014
PL volume decrease & credit life pricing0% fee increases & selected fee reductionsNIR
Grow transactional banking franchise Following double digit NIR growth since 2009, strategic choices impacted 2014, but stronger growth in H2
NIR growth (%)
(0,6)
10,2
2,94,8
(3,5)
9,4
1,3
5,3
1,3
H1 2014 H2 2014NIR Commission & feesInsurance TradingOther NIR
160,3
8,4%
10
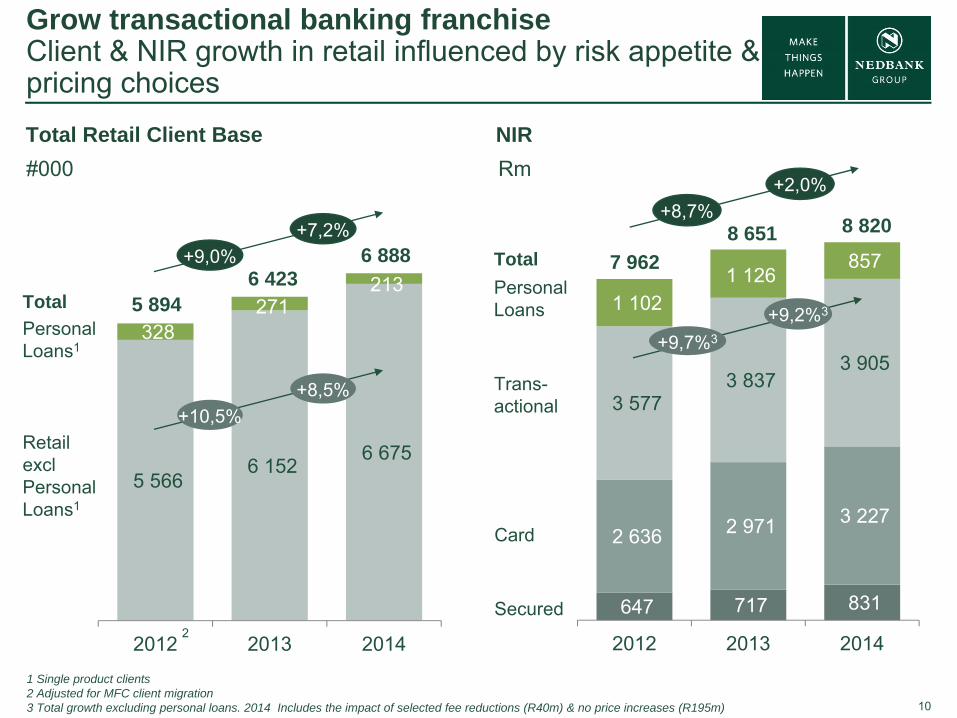
647 717 831
2 636 2 971 3 227
3 577 3 837
3 905
1 102 1 126
857
2012 2013 2014
5 566 6 152 6 675
328 271
213
2012 2013 2014
Grow transactional banking franchise Client & NIR growth in retail influenced by risk appetite & pricing choices
1 Single product clients2 Adjusted for MFC client migration3 Total growth excluding personal loans. 2014 Includes the impact of selected fee reductions (R40m) & no price increases (R195m)
#000 Rm
Card
Trans-actional
Secured
PersonalLoans
8 651 8 8206 888
6 423
+7,2%+9,0% 7 962
PersonalLoans1
Total Retail Client Base NIR
Retail exclPersonalLoans1
+10,5%+8,5%
Total
Total
+2,0%+8,7%
+9,2%3
+9,7%3
5 894
2
11
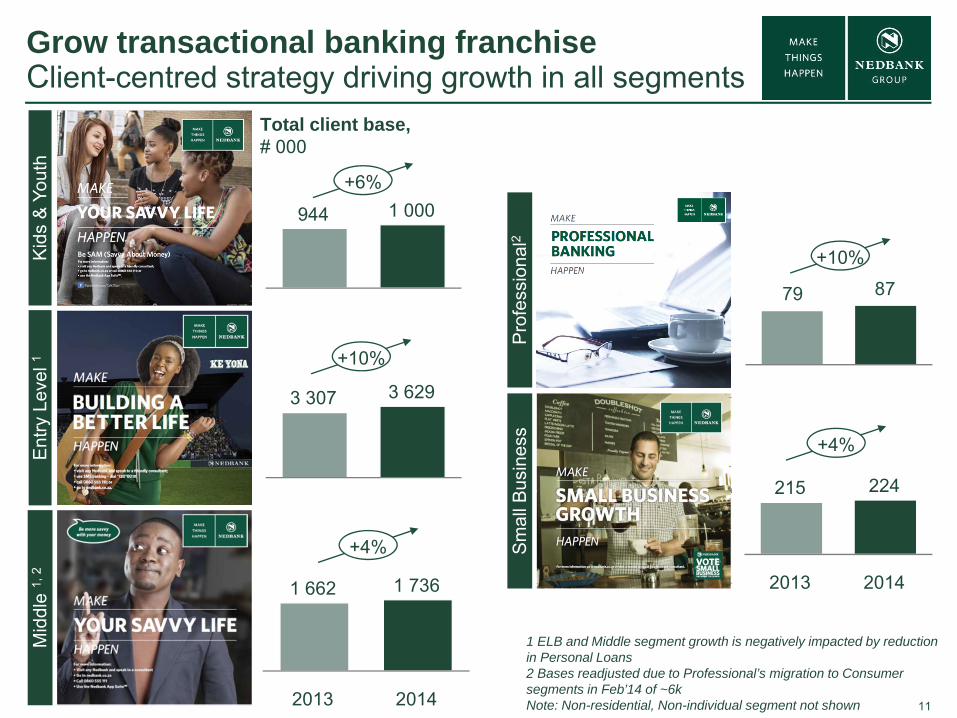
Grow transactional banking franchise Client-centred strategy driving growth in all segments
Total client base,# 000
Kid
s &
You
thE
ntry
Lev
el 1
Mid
dle
1, 2
Pro
fess
iona
l2S
mal
l Bus
ines
s
1 000944
3 6293 307
2013 2014
1 7361 662
79 87
215 224
20142013
1 ELB and Middle segment growth is negatively impacted by reduction in Personal Loans 2 Bases readjusted due to Professional’s migration to Consumer segments in Feb’14 of ~6kNote: Non-residential, Non-individual segment not shown
+6%
+10%
+4%
+10%
+4%
12
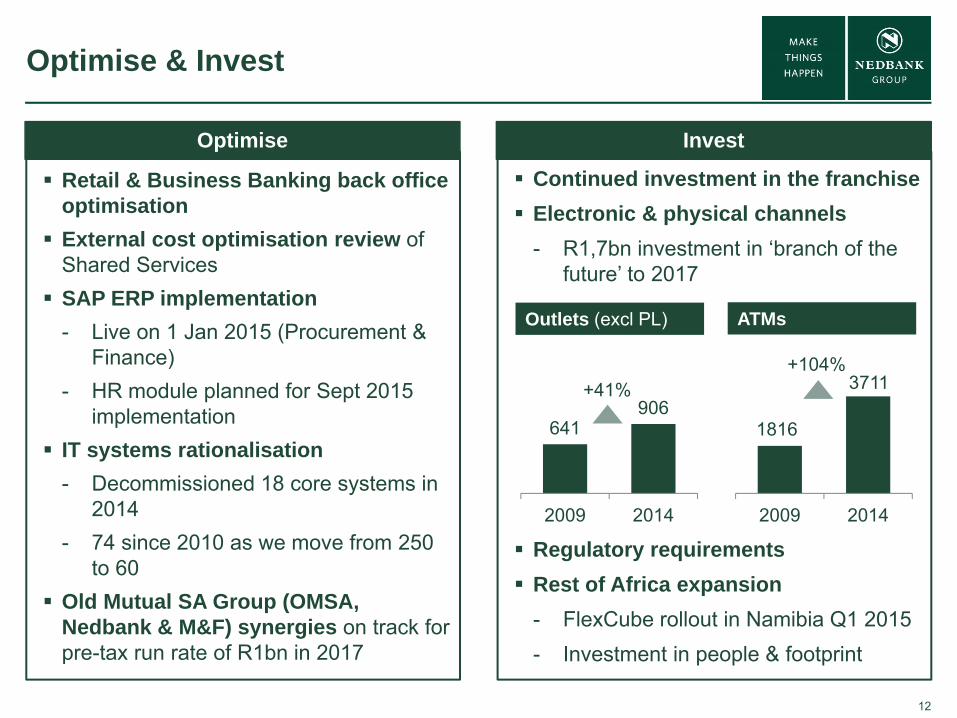
Optimise & Invest
Retail & Business Banking back office optimisation External cost optimisation review of
Shared Services SAP ERP implementation
- Live on 1 Jan 2015 (Procurement & Finance)
- HR module planned for Sept 2015 implementation
IT systems rationalisation- Decommissioned 18 core systems in
2014 - 74 since 2010 as we move from 250
to 60 Old Mutual SA Group (OMSA,
Nedbank & M&F) synergies on track for pre-tax run rate of R1bn in 2017
Optimise
Continued investment in the franchise Electronic & physical channels
- R1,7bn investment in ‘branch of the future’ to 2017
Regulatory requirements Rest of Africa expansion
- FlexCube rollout in Namibia Q1 2015- Investment in people & footprint
Invest
641906
2009 2014
Outlets (excl PL)
2009 2014
1816
3711+41%+104%
ATMs
13
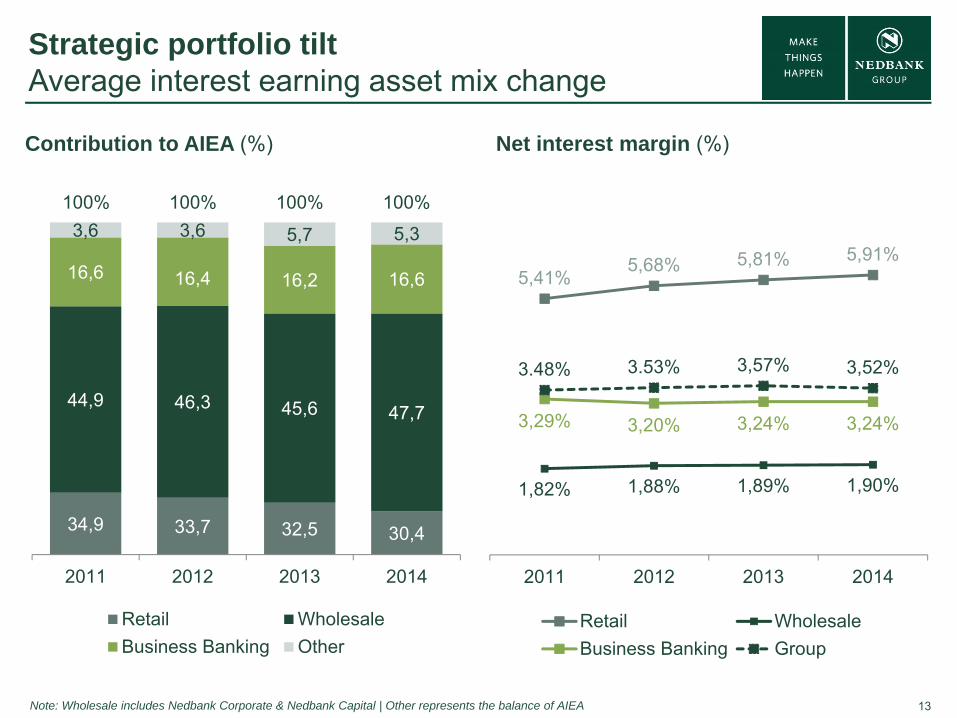
Strategic portfolio tilt Average interest earning asset mix change
34,9 33,7 32,5 30,4
44,9 46,3 45,6 47,7
16,6 16,4 16,2 16,6
3,6 3,6 5,7 5,3
2011 2012 2013 2014
Retail WholesaleBusiness Banking Other
5,41%5,68% 5,81% 5,91%
1,82% 1,88% 1,89% 1,90%
3,29% 3,20% 3,24% 3,24%
3.48% 3.53% 3,57% 3,52%
2011 2012 2013 2014
Retail WholesaleBusiness Banking Group
Contribution to AIEA (%) Net interest margin (%)
100% 100% 100%100%
Note: Wholesale includes Nedbank Corporate & Nedbank Capital | Other represents the balance of AIEA
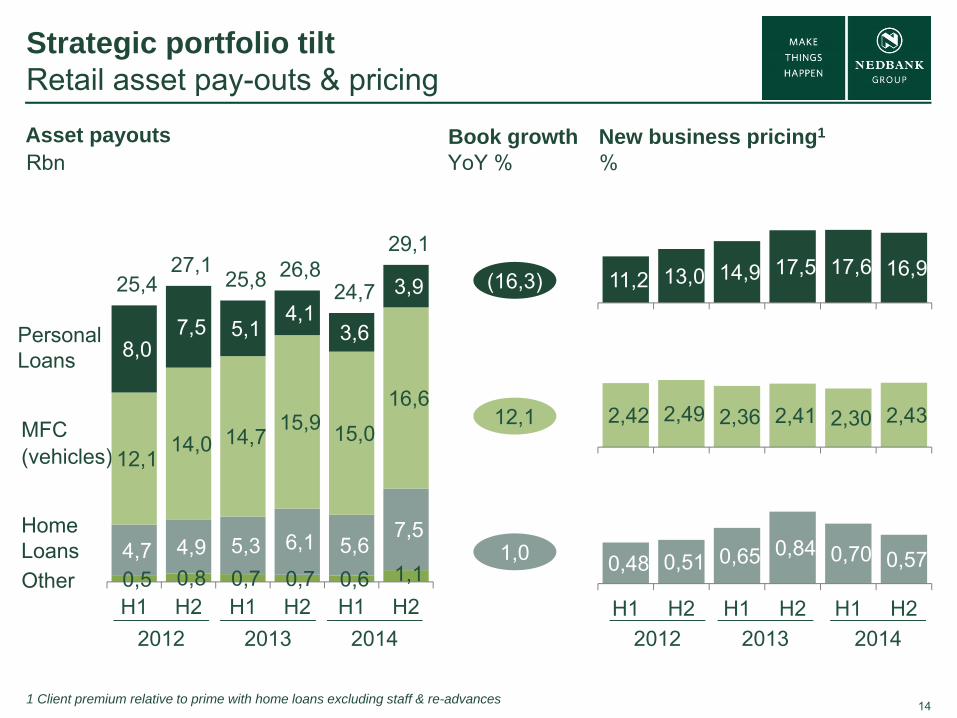
141 Client premium relative to prime with home loans excluding staff & re-advances
Strategic portfolio tilt Retail asset pay-outs & pricing
YoY %Rbn %
2,42 2,49 2,36 2,41 2,30 2,43
0,48 0,51 0,65 0,84 0,70 0,57
H1 H2 H1 H2 H1 H2
MFC(vehicles)
Home Loans
Personal Loans
Other
2012 2013
0,5 0,8 0,7 0,7 0,6 1,1 4,7 4,9 5,3 6,1 5,6
7,5
12,1 14,0 14,7
15,9 15,0 16,6
8,0 7,5 5,1
4,1 3,6
3,9 25,4 27,1
25,8 26,8 24,7
29,1
H1 H2 H1 H2 H1 H220142012 2013 2014
11,2 13,0 14,9 17,5 17,6 16,9
Asset payouts Book growth New business pricing1
12,1
1,0
(16,3)
15
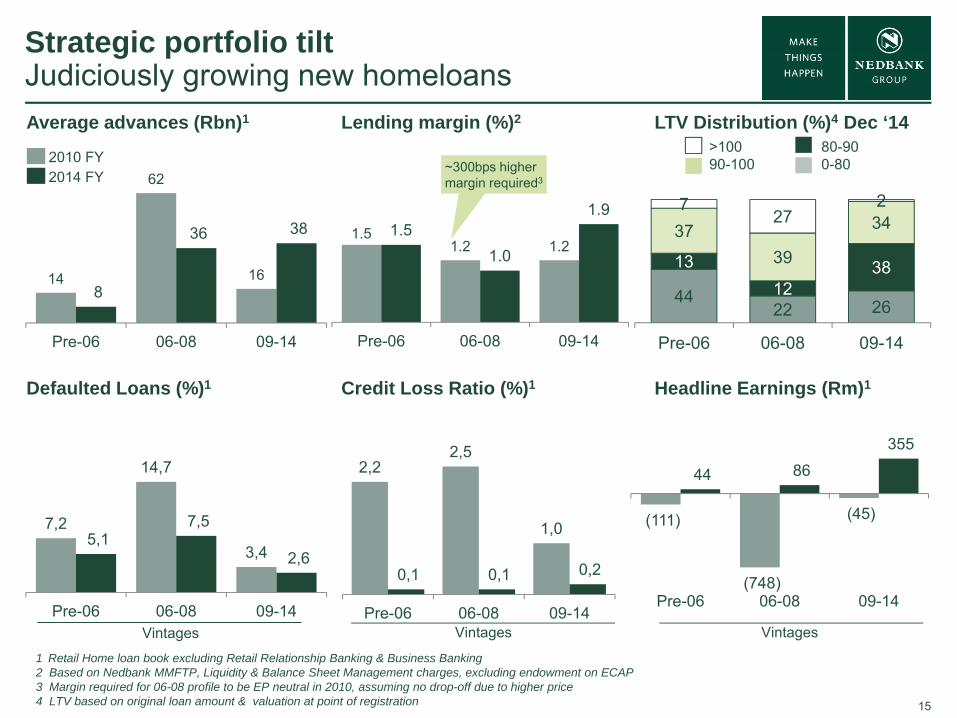
Strategic portfolio tilt Judiciously growing new homeloans
2010 FY2014 FY
Average advances (Rbn)1
Defaulted Loans (%)1 Credit Loss Ratio (%)1
Vintages Vintages
1 Retail Home loan book excluding Retail Relationship Banking & Business Banking2 Based on Nedbank MMFTP, Liquidity & Balance Sheet Management charges, excluding endowment on ECAP3 Margin required for 06-08 profile to be EP neutral in 2010, assuming no drop-off due to higher price4 LTV based on original loan amount & valuation at point of registration
>10090-100
LTV Distribution (%)4 Dec ‘14Lending margin (%)2
~300bps higher margin required3
80-900-80
4422 26
1312
38
3739
347
272
Pre-06 06-08 09-14
14
62
168
36 38
Pre-06 06-08 09-14
1.51.2 1.2
1.51.0
1.9
Pre-06 06-08 09-14
7,2
14,7
3,45,1
7,5
2,6
Pre-06 06-08 09-14
2,22,5
1,0
0,1 0,1 0,2
Pre-06 06-08 09-14
Headline Earnings (Rm)1
Vintages
(111)
(748)
(45)
44 86 355
Pre-06 06-08 09-14

16
Strategic portfolio tilt CLR reflective of mix change & quality portfolio
136113 105 106
79
11889
59 5546
Group CLR (bps)
Group CLR excl. PLs (bps)
Impairment charge (Rm)
2010 2011 2012 2013 2014
Personal loans Homeloans Wholesale Other
6 188
4 506
Group credit loss ratio (bps)
17
26 7
65
23 2
10
19 2
73
17 8
48
15 8
46
2010 2011 2012 2013 2014
9,1%
5,6%
4,8%3,1%
1,6%1,3%
5,5%
3,0%2,5%
Retail Wholesale Nedbank Group
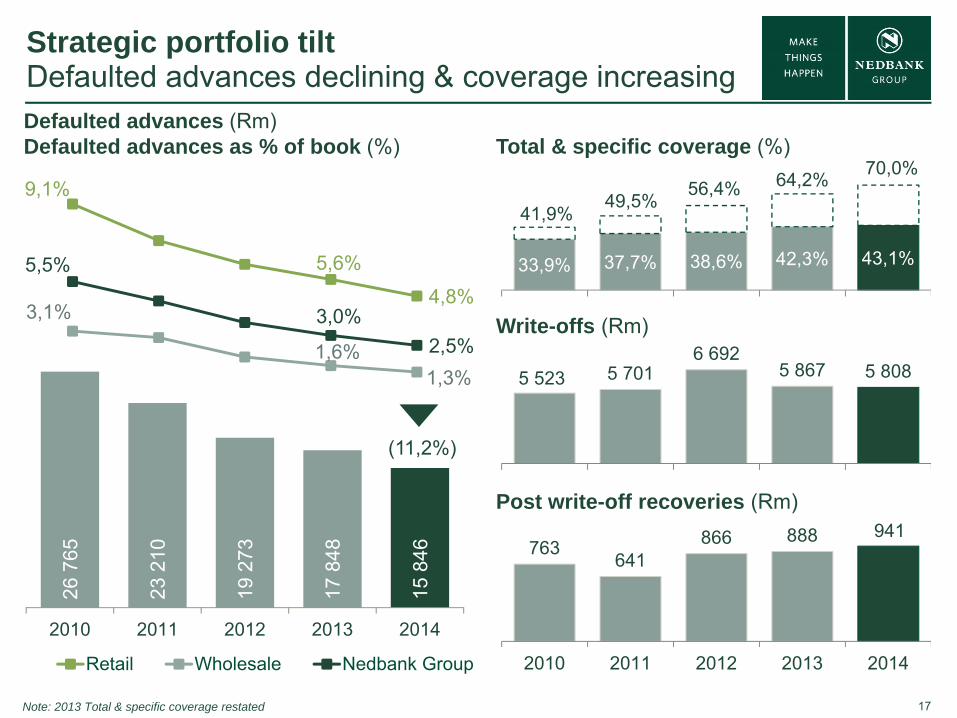
Strategic portfolio tilt Defaulted advances declining & coverage increasingDefaulted advances (Rm)Defaulted advances as % of book (%)
33,9% 37,7% 38,6% 42,3% 43,1%
5 523 5 7016 692
5 867 5 808
763 641866 888 941
2010 2011 2012 2013 2014
Total & specific coverage (%)
Write-offs (Rm)
Post write-off recoveries (Rm)
70,0%64,2%56,4%49,5%41,9%
Note: 2013 Total & specific coverage restated
(11,2%)
18
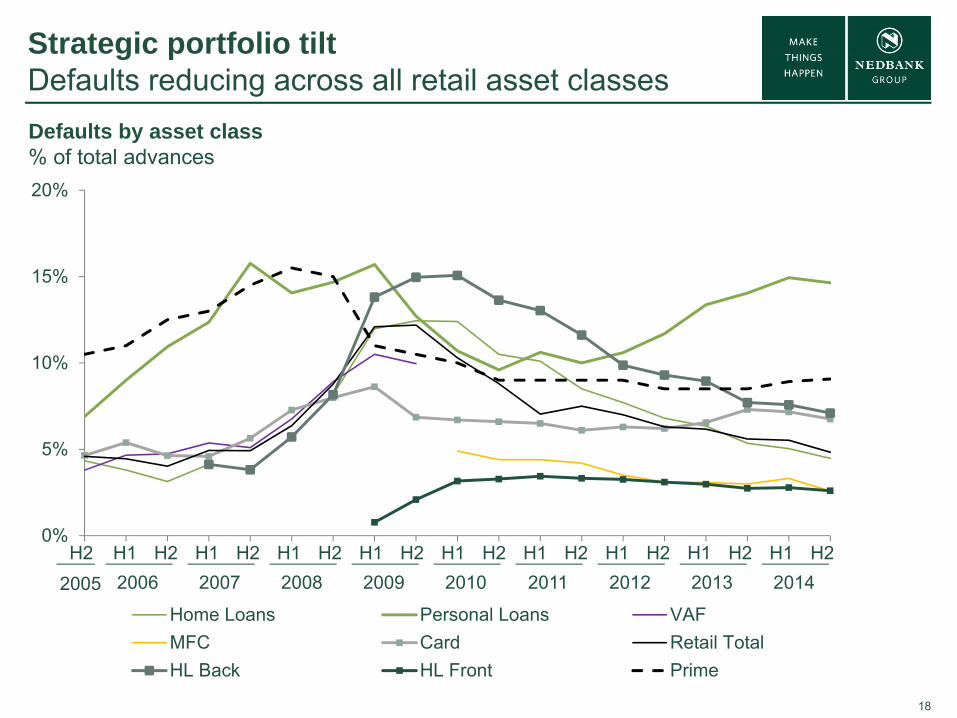
0%
5%
10%
15%
20%
Home Loans Personal Loans VAFMFC Card Retail TotalHL Back HL Front Prime
H2 H1 H2 H1 H2 H1 H2 H1 H2 H1 H2 H1 H2 H1 H2 H1 H2 H1 H22006 2007 2008 2009 2010 2011 2012 2013 2014
Strategic portfolio tilt Defaults reducing across all retail asset classes
2005
Defaults by asset class% of total advances
19
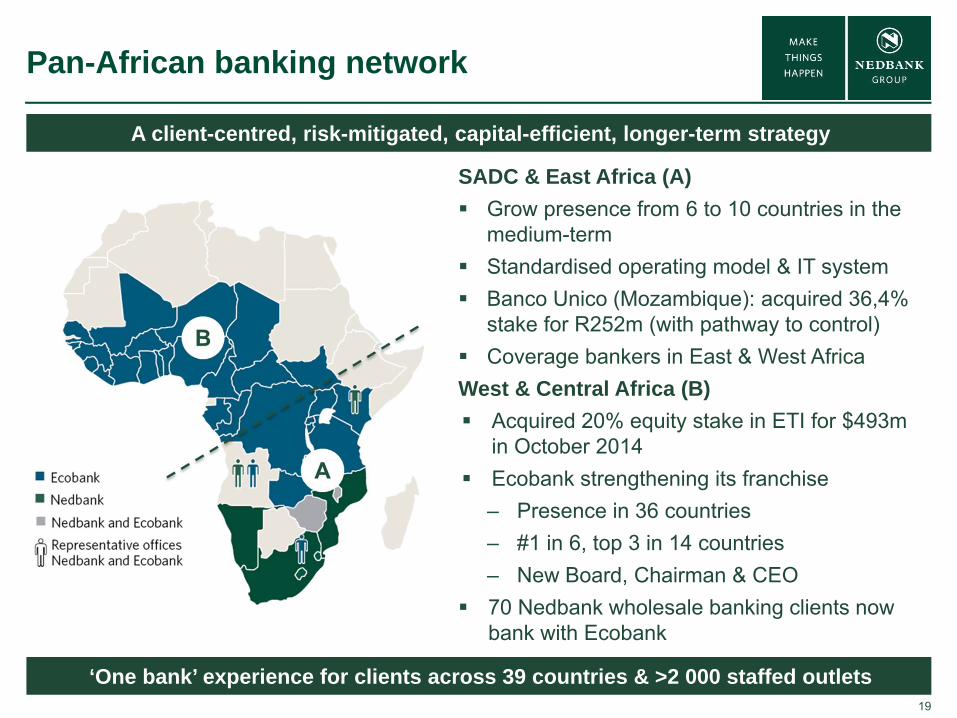
Pan-African banking network
A client-centred, risk-mitigated, capital-efficient, longer-term strategy
SADC & East Africa (A) Grow presence from 6 to 10 countries in the
medium-term Standardised operating model & IT system Banco Unico (Mozambique): acquired 36,4%
stake for R252m (with pathway to control) Coverage bankers in East & West Africa West & Central Africa (B) Acquired 20% equity stake in ETI for $493m
in October 2014 Ecobank strengthening its franchise
‒ Presence in 36 countries ‒ #1 in 6, top 3 in 14 countries‒ New Board, Chairman & CEO
70 Nedbank wholesale banking clients now bank with Ecobank
‘One bank’ experience for clients across 39 countries & >2 000 staffed outlets
20
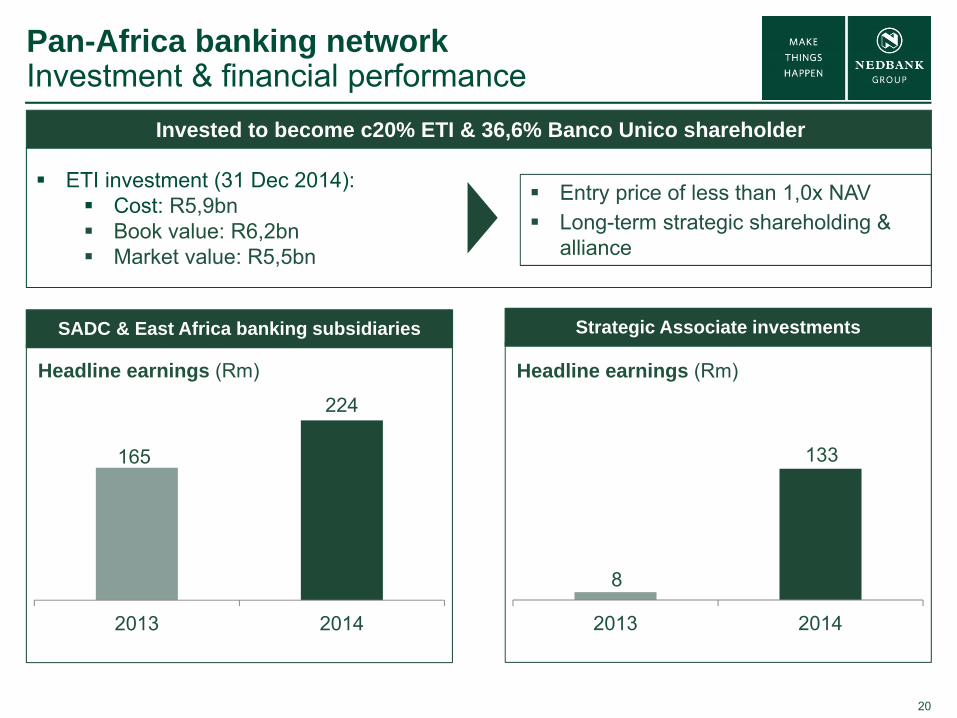
Pan-Africa banking networkInvestment & financial performance
Invested to become c20% ETI & 36,6% Banco Unico shareholder
ETI investment (31 Dec 2014): Cost: R5,9bn Book value: R6,2bn Market value: R5,5bn
Entry price of less than 1,0x NAV Long-term strategic shareholding &
alliance
8
133
-10
10
30
50
70
90
110
130
150
2013 2014
Headline earnings (Rm)
Strategic Associate investmentsSADC & East Africa banking subsidiaries
165
224
0
50
100
150
200
250
300
2013 2014
Headline earnings (Rm)
21
0%
1%
2%
3%
4%
0%
100%
200%
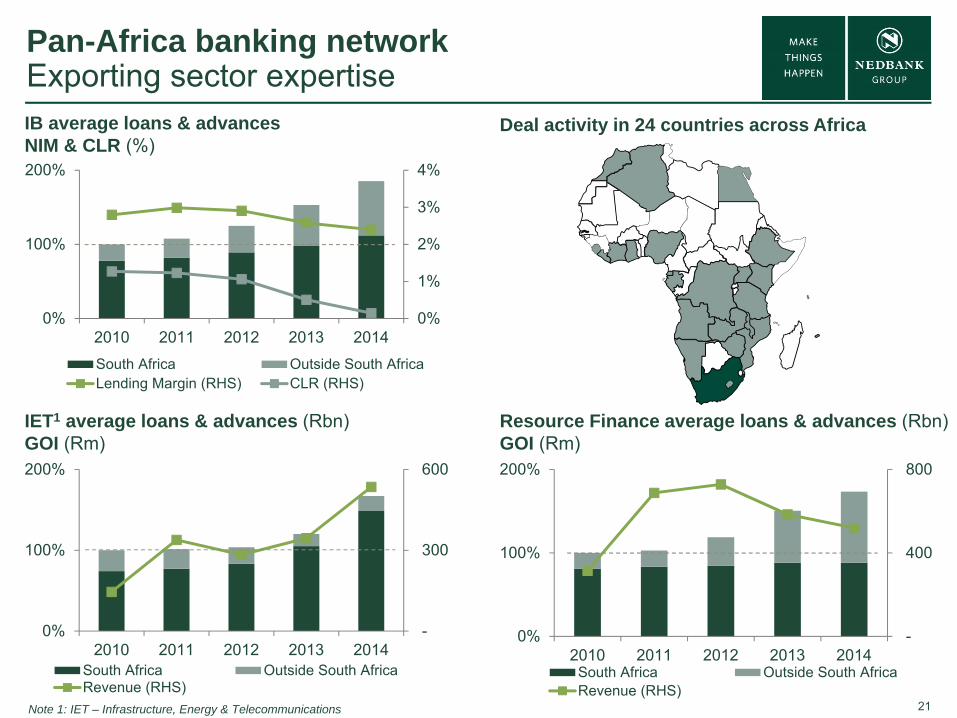
2010 2011 2012 2013 2014South Africa Outside South AfricaLending Margin (RHS) CLR (RHS)
Pan-Africa banking networkExporting sector expertise
Deal activity in 24 countries across AfricaIB average loans & advancesNIM & CLR (%)
IET1 average loans & advances (Rbn)GOI (Rm)
Resource Finance average loans & advances (Rbn)GOI (Rm)
-
300
600
0%
100%
200%
2010 2011 2012 2013 2014South Africa Outside South AfricaRevenue (RHS)
-
400
800
0%
100%
200%
2010 2011 2012 2013 2014South Africa Outside South AfricaRevenue (RHS)
Note 1: IET – Infrastructure, Energy & Telecommunications
22
FINANCIAL PERFORMANCE & OUTLOOK
23
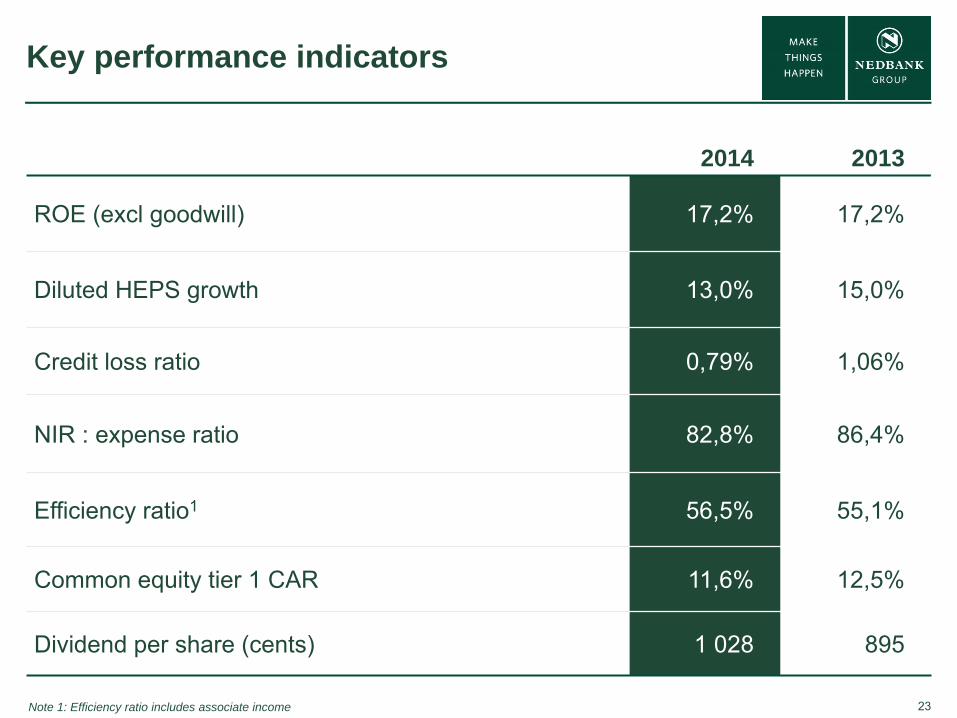
Key performance indicators
2014 2013
ROE (excl goodwill) 17,2% 17,2%
Diluted HEPS growth 13,0% 15,0%
Credit loss ratio 0,79% 1,06%
NIR : expense ratio 82,8% 86,4%
Efficiency ratio1 56,5% 55,1%
Common equity tier 1 CAR 11,6% 12,5%
Dividend per share (cents) 1 028 895
Note 1: Efficiency ratio includes associate income
24
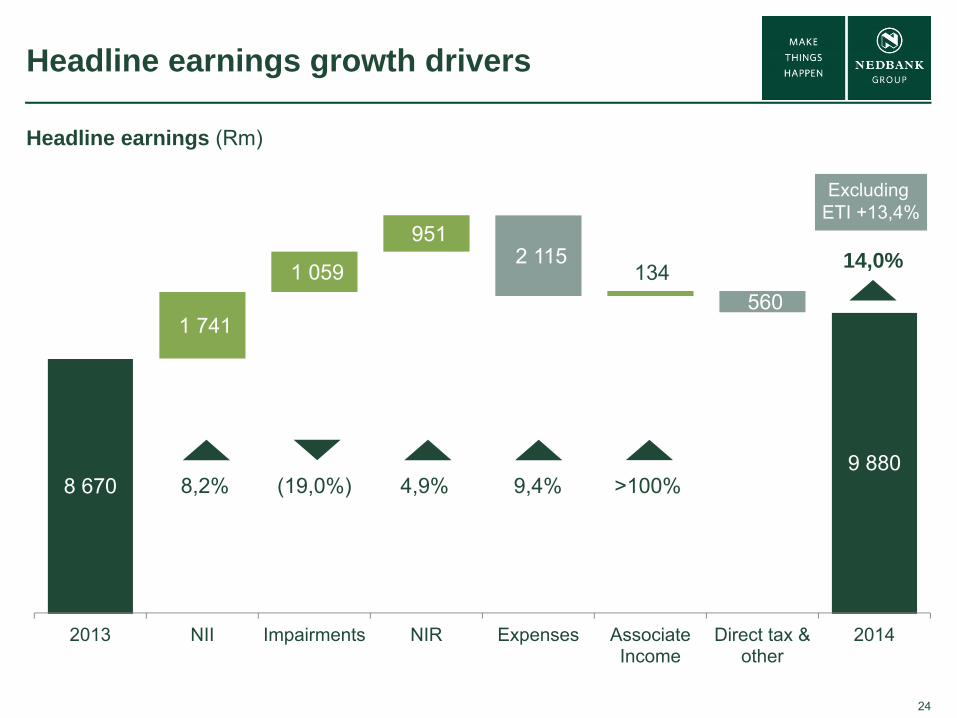
8 670 8 670
11 470
9 8809 880
1 741
1 059
951 2 115
134 560
2013 NII Impairments NIR Expenses AssociateIncome
Direct tax &other
2014
Headline earnings growth drivers
Headline earnings (Rm)
14,0%
8,2% (19,0%) 4,9% 9,4% >100%
Excluding ETI +13,4%
25
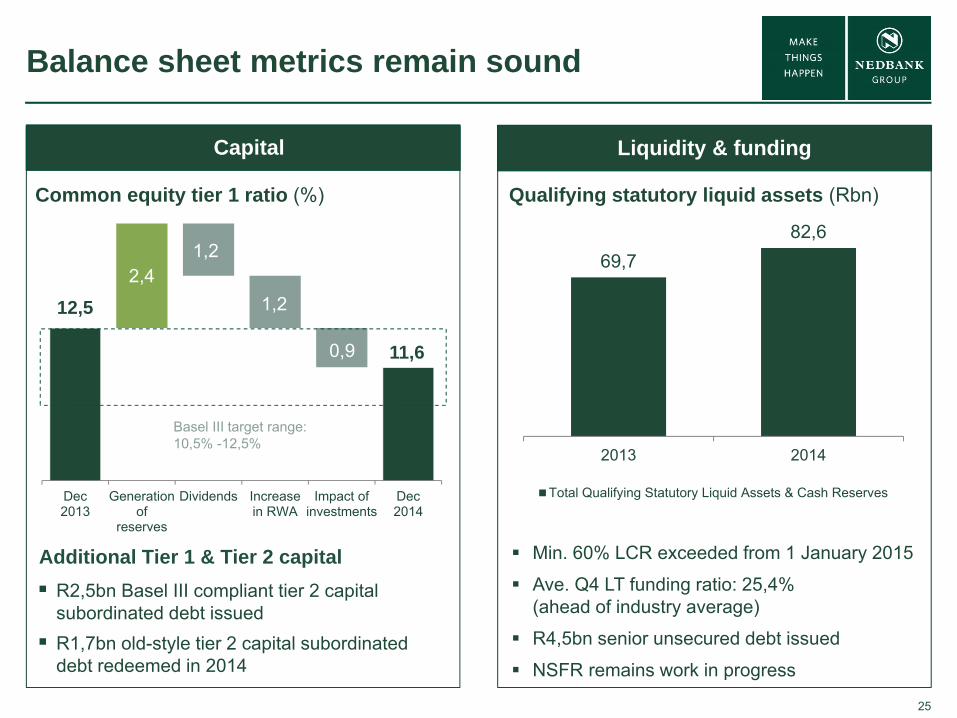
69,782,6
2013 2014
Total Qualifying Statutory Liquid Assets & Cash Reserves
12,5
11,6
2,4 1,2
1,2
0,9
Dec2013
Generationof
reserves
Dividends Increasein RWA
Impact ofinvestments
Dec2014
Capital Only 2015
Balance sheet metrics remain sound
Common equity tier 1 ratio (%)
Liquidity & funding
R2,5bn Basel III compliant tier 2 capital subordinated debt issued R1,7bn old-style tier 2 capital subordinated
debt redeemed in 2014
Basel III target range: 10,5% -12,5%
Additional Tier 1 & Tier 2 capital
Qualifying statutory liquid assets (Rbn)
Min. 60% LCR exceeded from 1 January 2015
Ave. Q4 LT funding ratio: 25,4% (ahead of industry average)
R4,5bn senior unsecured debt issued
NSFR remains work in progress
26
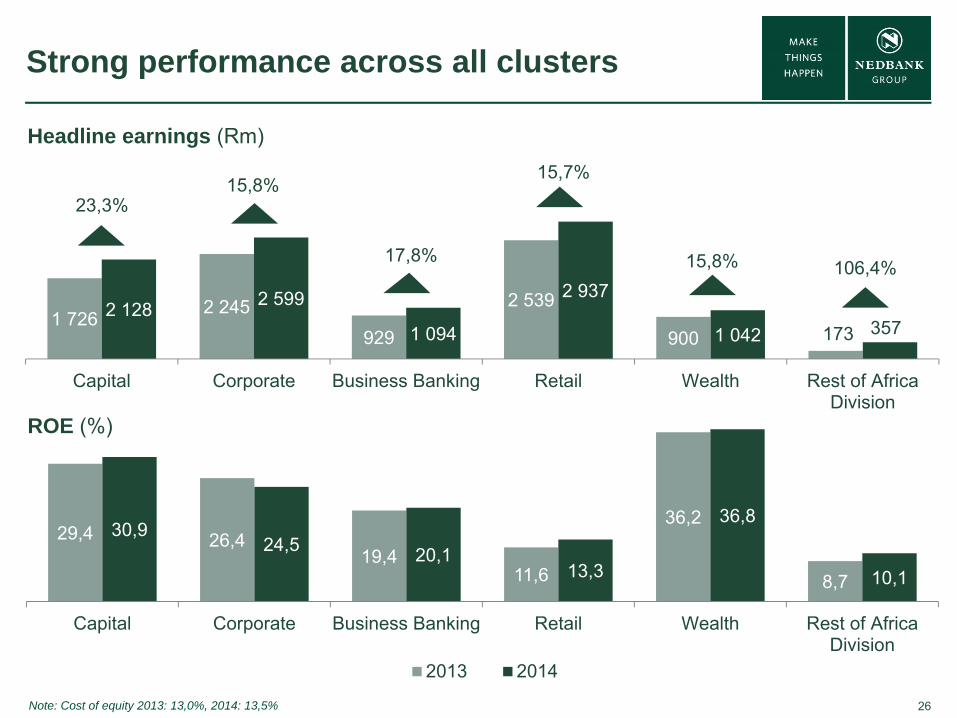
1 726 2 245929
2 539
900 1732 128 2 599
1 094
2 937
1 042 357
Capital Corporate Business Banking Retail Wealth Rest of AfricaDivision
29,4 26,419,4
11,6
36,2
8,7
30,924,5 20,1
13,3
36,8
10,1
Capital Corporate Business Banking Retail Wealth Rest of AfricaDivision
2013 2014
23,3%15,8%
17,8% 15,8%
Strong performance across all clusters
Headline earnings (Rm)
ROE (%)
106,4%
15,7%
Note: Cost of equity 2013: 13,0%, 2014: 13,5%
27
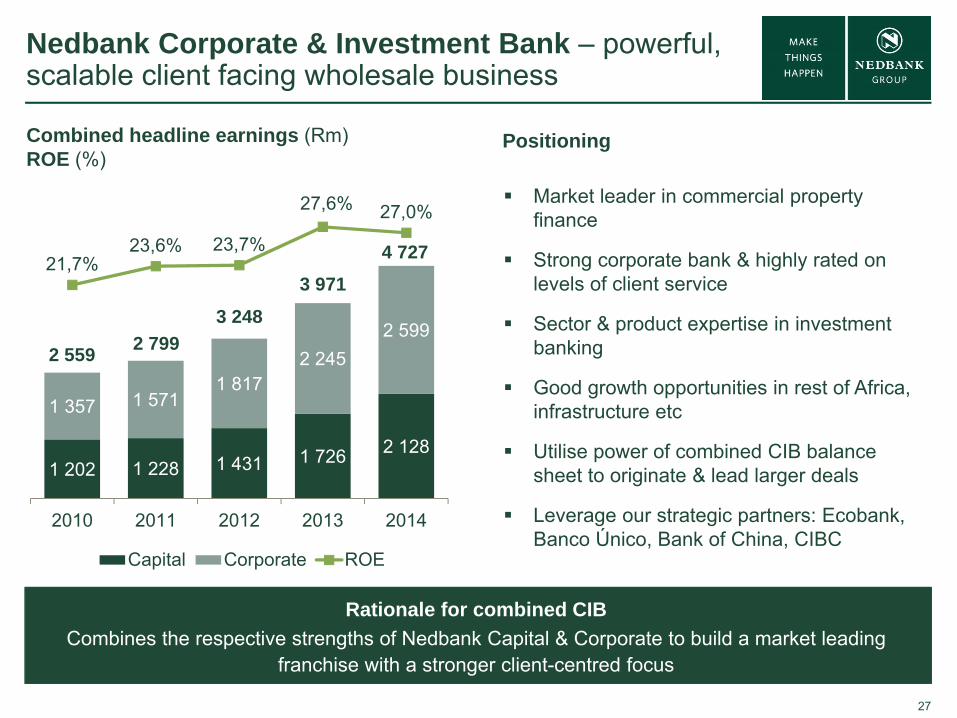
Nedbank Corporate & Investment Bank – powerful, scalable client facing wholesale business
Rationale for combined CIBCombines the respective strengths of Nedbank Capital & Corporate to build a market leading
franchise with a stronger client-centred focus
Combined headline earnings (Rm) ROE (%)
1 202 1 228 1 431 1 726 2 128
1 357 1 5711 817
2 2452 599
21,7%23,6% 23,7%
27,6% 27,0%
0%
5%
10%
15%
20%
25%
30%
0
1 000
2 000
3 000
4 000
5 000
6 000
2010 2011 2012 2013 2014
Capital Corporate ROE
2 559 2 7993 248
3 9714 727
Market leader in commercial property finance
Strong corporate bank & highly rated on levels of client service
Sector & product expertise in investment banking
Good growth opportunities in rest of Africa, infrastructure etc
Utilise power of combined CIB balance sheet to originate & lead larger deals
Leverage our strategic partners: Ecobank, Banco Único, Bank of China, CIBC
Positioning
28
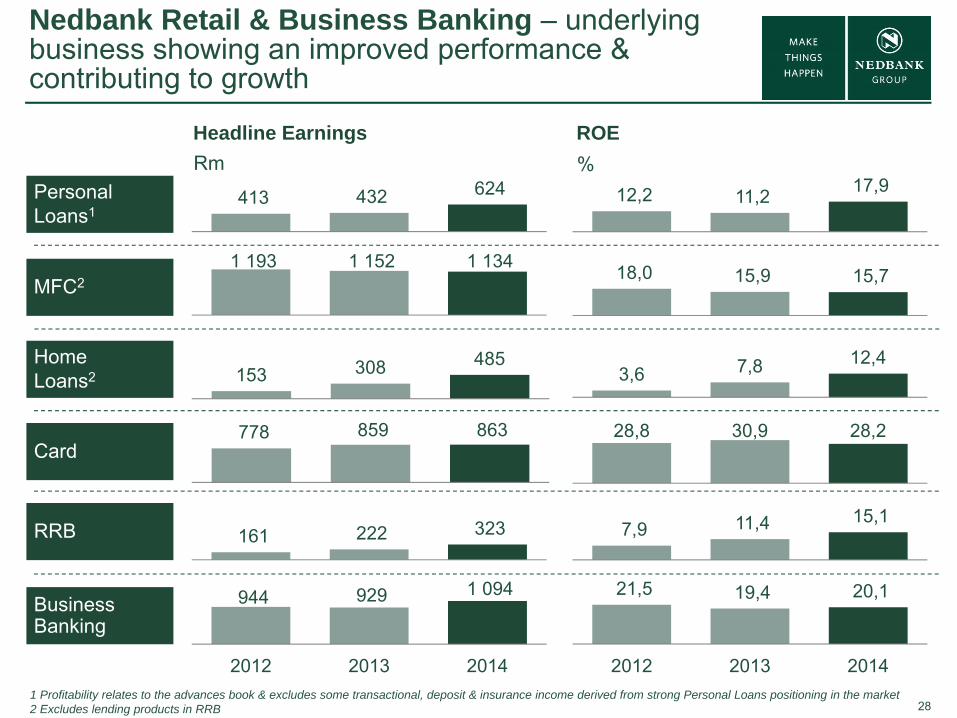
Nedbank Retail & Business Banking – underlying business showing an improved performance & contributing to growth
Headline Earnings
PersonalLoans1
Card
Rm
413 432 624
MFC21 193 1 152 1 134
HomeLoans2 153 308 485
RRB
778 859 863
12,2 11,2 17,9
18,0 15,9 15,7
3,6 7,8 12,4
28,8 30,9 28,2
ROE%
Business Banking
161 222 323 7,9 11,4 15,1
944 929 1 094
2012 2013 2014
21,5 19,4 20,1
2012 2013 20141 Profitability relates to the advances book & excludes some transactional, deposit & insurance income derived from strong Personal Loans positioning in the market2 Excludes lending products in RRB
29
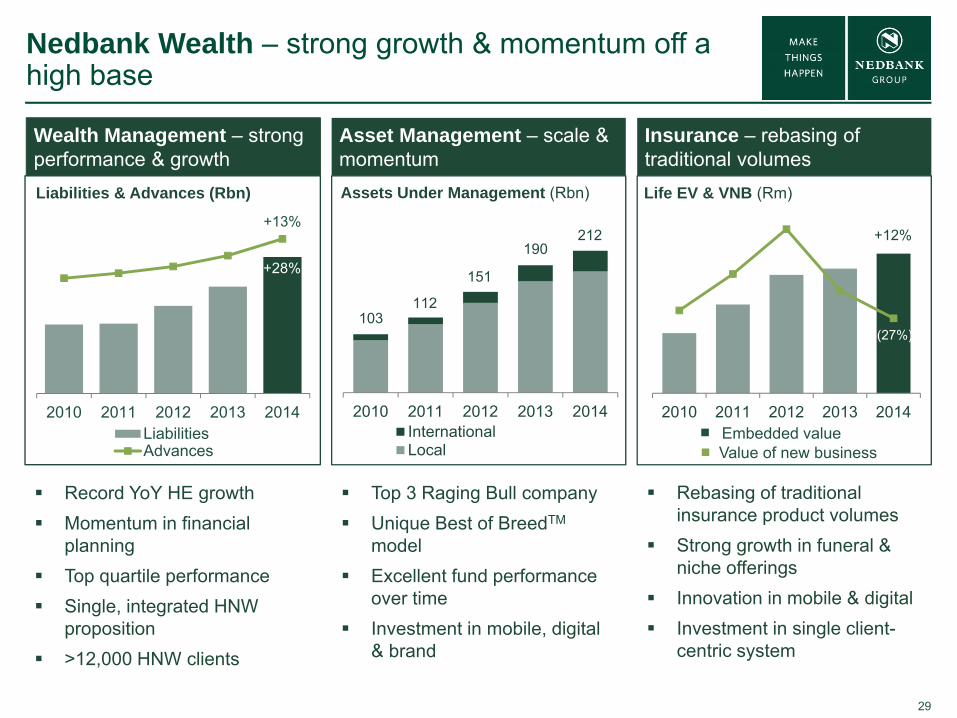
Nedbank Wealth – strong growth & momentum off a high base
Wealth Management – strong performance & growth
Record YoY HE growth Momentum in financial
planning Top quartile performance Single, integrated HNW
proposition >12,000 HNW clients
Asset Management – scale & momentum
Insurance – rebasing of traditional volumes
Top 3 Raging Bull company Unique Best of BreedTM
model Excellent fund performance
over time Investment in mobile, digital
& brand
Rebasing of traditional insurance product volumes
Strong growth in funeral & niche offerings
Innovation in mobile & digital Investment in single client-
centric system
Assets Under Management (Rbn)
2010 2011 2012 2013 2014InternationalLocal
212190
151
112103
0
100
200
300
400
500
600
0
500
1000
1500
2000
2500
3000
2010 2011 2012 2013 2014
+12%
Life EV & VNB (Rm)
Embedded valueValue of new business
(27%)
-2 000 000
3 000 000
8 000 000
13 000 000
18 000 000
23 000 000
2
5 000 002
10 000 002
15 000 002
20 000 002
25 000 002
30 000 002
2010 2011 2012 2013 2014LiabilitiesAdvances
Liabilities & Advances (Rbn)
+28%
+13%
30
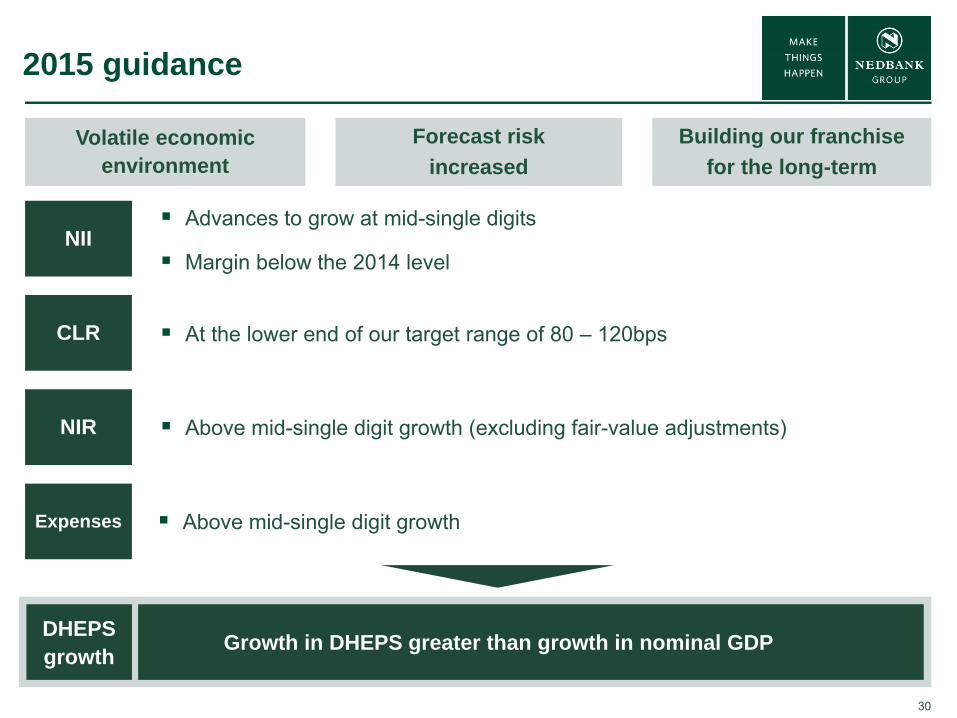
2015 guidance
Advances to grow at mid-single digits
Margin below the 2014 levelNII
At the lower end of our target range of 80 – 120bps
Above mid-single digit growth (excluding fair-value adjustments)
Above mid-single digit growth
CLR
NIR
Expenses
Volatile economic environment
Forecast risk increased
Building our franchise for the long-term
Growth in DHEPS greater than growth in nominal GDPDHEPSgrowth
31
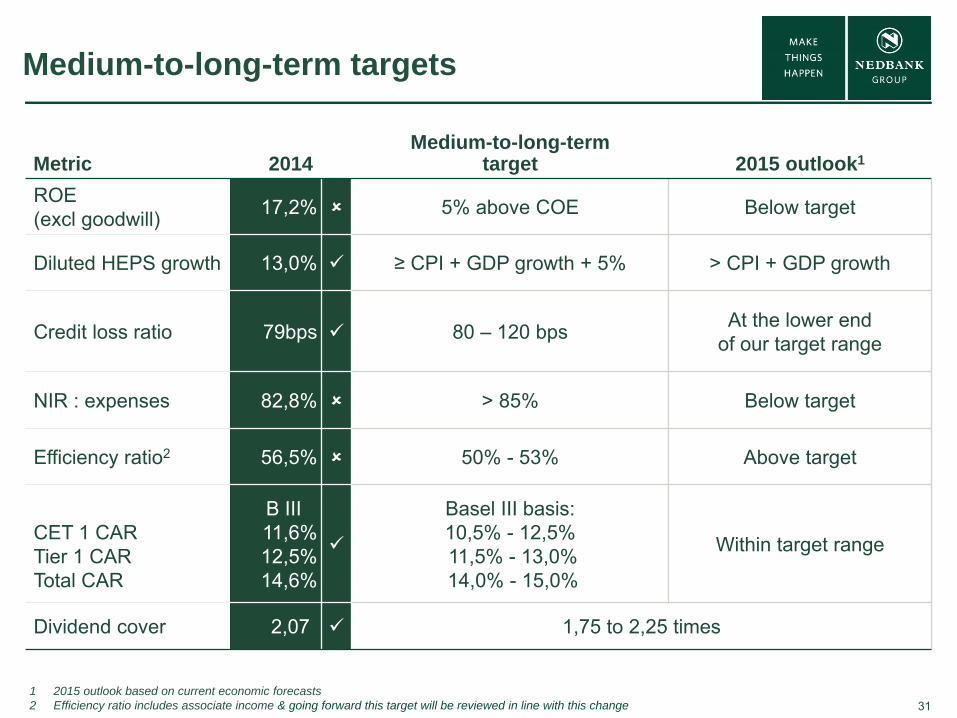
Medium-to-long-term targets
Metric 2014Medium-to-long-term
target 2015 outlook1
ROE (excl goodwill) 17,2% 5% above COE Below target
Diluted HEPS growth 13,0% ≥ CPI + GDP growth + 5% > CPI + GDP growth
Credit loss ratio 79bps 80 – 120 bps At the lower end of our target range
NIR : expenses 82,8% > 85% Below target
Efficiency ratio2 56,5% 50% - 53% Above target
CET 1 CARTier 1 CARTotal CAR
B III11,6%12,5%14,6%
Basel III basis:10,5% - 12,5%11,5% - 13,0%14,0% - 15,0%
Within target range
Dividend cover 2,07 1,75 to 2,25 times
1 2015 outlook based on current economic forecasts2 Efficiency ratio includes associate income & going forward this target will be reviewed in line with this change
32
Contact us
Nedbank Groupwww.nedbankgroup.co.zaNedbank Group LimitedTel: +27 (0) 11 294 4444Physical address 135 Rivonia RoadSandown 2196 South Africa
Download the Nedbank Investor Centre App from the Nedbank App Suite:
Nedbank Investor RelationsHead of Investor Relations Alfred Visagie Direct tel: +27 (0) 11 295 6249 Cell: +27 (0) 82 855 4692 Email: [email protected]
Investor Relations Consultant Penny Him Lok Direct tel: +27 (0)11 295 6549 Email: [email protected]
DisclaimerNedbank Group has acted in good faith and has made every reasonable effort to ensure the accuracy and completeness of the information contained in this document,including all information that may be defined as 'forward-looking statements' within the meaning of United States securities legislation.Forward-looking statements may be identified by words such as ‘believe’, 'anticipate', 'expect', 'plan', 'estimate', 'intend', 'project', 'target', 'predict' and 'hope'.Forward-looking statements are not statements of fact, but statements by the management of Nedbank Group based on its current estimates, projections, expectations,beliefs and assumptions regarding the group's future performance.No assurance can be given that forward-looking statements will prove to be correct and undue reliance should not be placed on such statements.The risks and uncertainties inherent in the forward-looking statements contained in this document include, but are not limited to: changes to IFRS and the interpretations,applications and practices subject thereto as they apply to past, present and future periods; domestic and international business and market conditions such as exchangerate and interest rate movements; changes in the domestic and international regulatory and legislative environments; changes to domestic and international operational,social, economic and political risks; and the effects of both current and future litigation.Nedbank Group does not undertake to update any forward-looking statements contained in this document and does not assume responsibility for any loss or damagewhatsoever and howsoever arising as a result of the reliance by any party thereon, including, but n limited to, loss of earnings, profits, or consequential loss or damage.†