Embed Size (px)
Citation preview
Prepared By: Kathy McAninch
Research and Analysis Division
2014 Retailers Motor Fuel Gallons Annual Report
April 2015
1
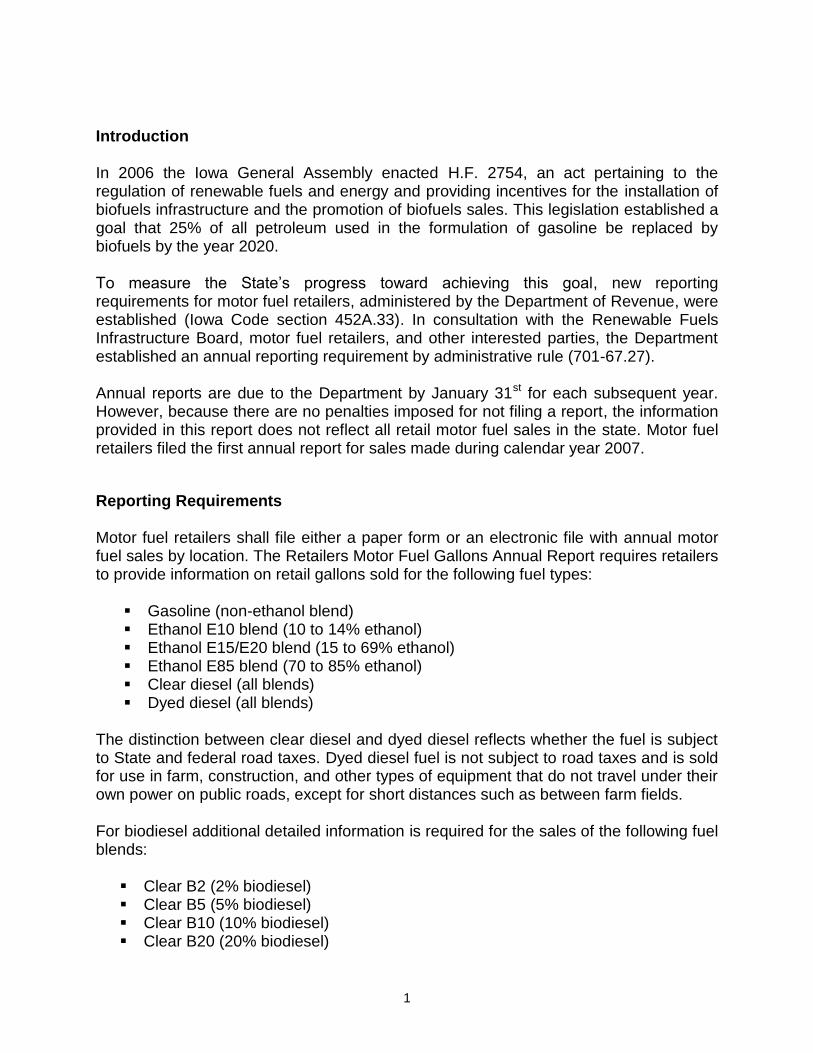
Introduction In 2006 the Iowa General Assembly enacted H.F. 2754, an act pertaining to the regulation of renewable fuels and energy and providing incentives for the installation of biofuels infrastructure and the promotion of biofuels sales. This legislation established a goal that 25% of all petroleum used in the formulation of gasoline be replaced by biofuels by the year 2020. To measure the State’s progress toward achieving this goal, new reporting requirements for motor fuel retailers, administered by the Department of Revenue, were established (Iowa Code section 452A.33). In consultation with the Renewable Fuels Infrastructure Board, motor fuel retailers, and other interested parties, the Department established an annual reporting requirement by administrative rule (701-67.27). Annual reports are due to the Department by January 31st for each subsequent year. However, because there are no penalties imposed for not filing a report, the information provided in this report does not reflect all retail motor fuel sales in the state. Motor fuel retailers filed the first annual report for sales made during calendar year 2007.
Reporting Requirements Motor fuel retailers shall file either a paper form or an electronic file with annual motor fuel sales by location. The Retailers Motor Fuel Gallons Annual Report requires retailers to provide information on retail gallons sold for the following fuel types:
Gasoline (non-ethanol blend) Ethanol E10 blend (10 to 14% ethanol) Ethanol E15/E20 blend (15 to 69% ethanol) Ethanol E85 blend (70 to 85% ethanol) Clear diesel (all blends) Dyed diesel (all blends)
The distinction between clear diesel and dyed diesel reflects whether the fuel is subject to State and federal road taxes. Dyed diesel fuel is not subject to road taxes and is sold for use in farm, construction, and other types of equipment that do not travel under their own power on public roads, except for short distances such as between farm fields. For biodiesel additional detailed information is required for the sales of the following fuel blends:
Clear B2 (2% biodiesel) Clear B5 (5% biodiesel) Clear B10 (10% biodiesel) Clear B20 (20% biodiesel)
2
Clear Biodiesel Other Dyed B2 (2% biodiesel) Dyed B5 (5% biodiesel) Dyed B10 (10% biodiesel) Dyed B20 (20% biodiesel) Dyed Biodiesel Other
Statistical Summary for 2014
The Department identified 2,593 potential retail locations at which motor fuel may have been sold during 2014. Paper report forms were mailed to 1,547 locations identified using Department of Agriculture and Land Stewardship motor fuel license information and the Department of Revenue motor fuel tax database. Electronic report files were e-mailed to fifteen large motor fuel retailers with 1,046 locations. The Department received either paper forms or electronic files representing 2,158 (83.2%) of the locations. Replies from 59 locations indicated that no retail sales of any type of motor fuel were made during 2014. 2,099 locations reported retail motor fuel sales. Of those 2,099 paper reporters eleven were out of state retailers and are not included in this analysis. The analysis is based on the 2,088 Iowa retailers (see Table 1). The response rate in 2014 is the lowest in the history of this report. The Department mailed the reports in late December. However in mid-January, retailers began to call the Department to inquire about when the reports were to be received. It became clear that the original mailing was not widely delivered. The Department sent out a second mailing that was unfortunately received around the time of the specified deadline. Directions noted the need for the second mailing and asked retailers to return the report as soon as possible. This glitch is likely the reason for the reduced compliance with completing the report. Of the reporting 2,088 Iowa retail locations, 1,983 (95.4%) reported selling E10 blend motor fuel, 84 (4.0%) reported selling E15/E20, 209 (10.0%) reported selling E85, and 368 (17.6%) reported selling one or more of the various blends of biodiesel. Biofuel sales by these locations are summarized below and in Table 1. Gasoline Fuel Sales During 2014, the reported amount of E10 gasoline sold equaled 1,269.7 million gallons, the amount of E85 gasoline sold equaled 12.1 million gallons, and the amount of E15/E20 gasoline equaled 4.0 million gallons. Combined, the three ethanol blends represented 85.8% of total gasoline motor fuel sales during the year. 1,991 (96.7%) of the 2,058 locations that sold gasoline motor fuels sold one or more ethanol blend. Because over 16% of locations did not return their Retailers Motor Fuel Gallons Annual Report to the Department for 2014, gallons from the Department’s Monthly Motor Fuel Tax Reports were used to estimate the amount of underreporting of gasoline sales. The
3
gallons presented in the Monthly Motor Fuel Tax Reports reflect taxable motor fuel shipped from terminals rather than gallons sold at retail locations. Because the Monthly Motor Fuel Tax Reports reflect fuel shipments made during the prior month, taxable gallons reported in the monthly reports covering February 2014 through January 2015 were compared with gallons reported as sold by retailers completing the 2014 annual report. During this period, fuel taxes were paid on a total of 1,659.8 million gallons of gasoline fuels. In comparison, the 83.2% of retail locations that filed annual reports indicated 1,498.9 million gallons of gasoline fuels were sold, including all ethanol blends and non-ethanol gasoline, which equals 90.3% of taxable gallons, reported for 2014. Despite the low response rate, this share is just above the 90.2% of taxable gallons reported in 2013. Diesel Fuel Sales During 2014, based on annual reports submitted to the Department, the amount of clear biodiesel sold equaled 314.4 million gallons, or 56.1% of total clear diesel fuel sales. Retailers reported selling 560.6 million of gallons of clear diesel fuel. In comparison, the number of taxable (clear) gallons of diesel fuel shipped during 2014 as reported on the Monthly Motor Fuel Tax Reports equaled 714.0 million. Therefore, retailers completing annual reports for 2014 accounted for 78.5% of diesel fuel on which fuel taxes were paid. This is down from the 79.5% reported in 2013. Also, during 2014, 164.4 million gallons of dyed (non-taxed) diesel fuel sales were reported on the annual reports, including 40.3 million biodiesel gallons (24.5%). Dyed diesel gallons are not captured in the Monthly Motor Fuel Tax Reports. Based on the annual reports, 1,247 locations sold clear diesel fuel and 114 of these locations sold clear biodiesel fuel during 2014. In addition, 309 locations sold dyed diesel fuel and 114 of these locations sold dyed biodiesel fuel during 2014. Total diesel gallons reported were 725.0 million gallons and total biodiesel gallons were 354.8 million gallons; therefore, biodiesel blended gallons accounted for 48.9% of diesel gallons sold by reporting retailers.
4
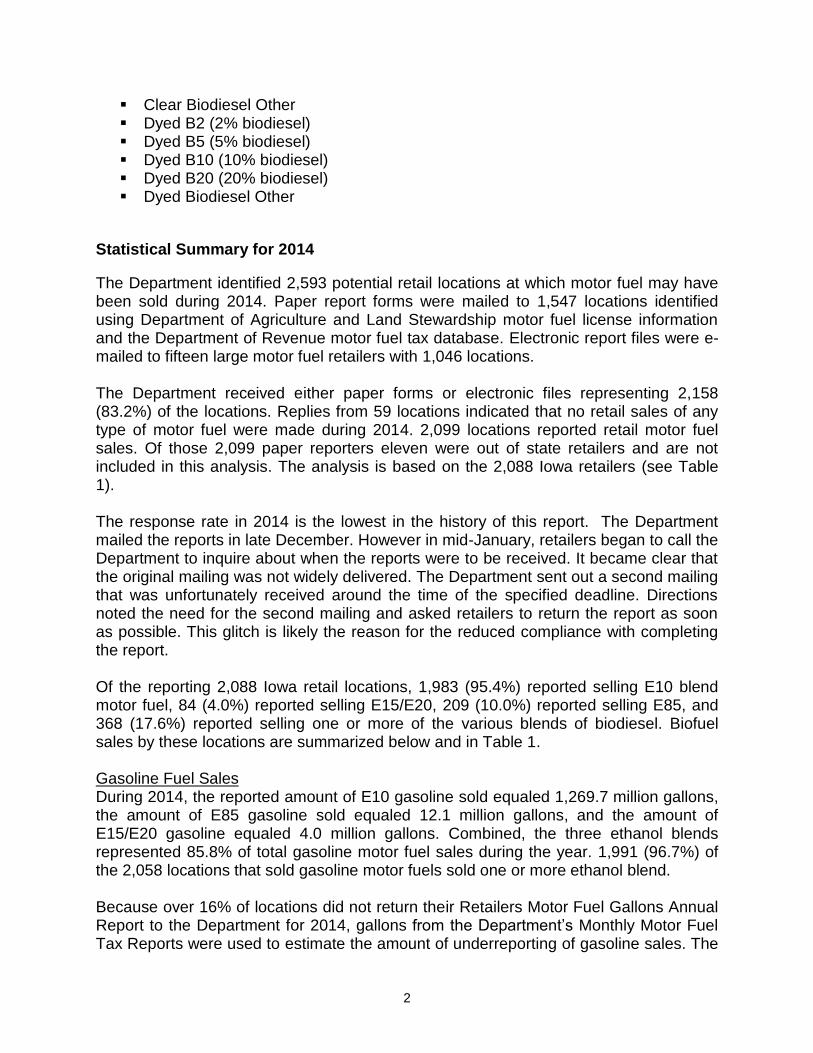
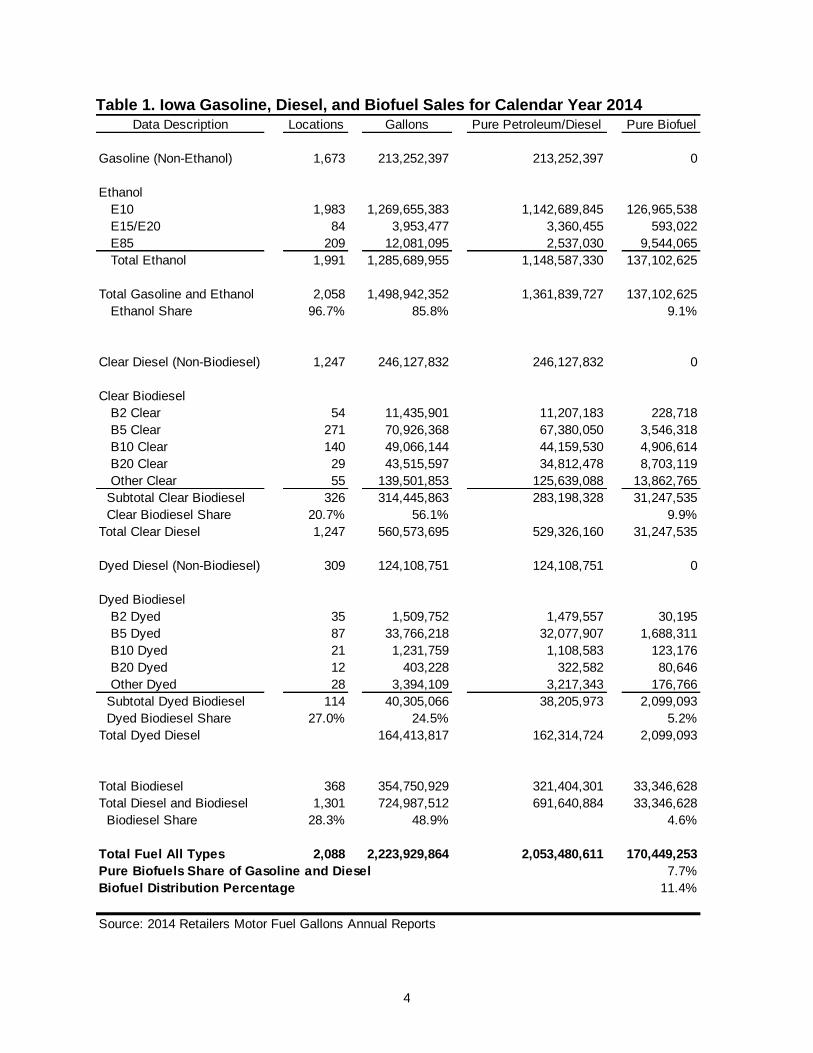
Table 1. Iowa Gasoline, Diesel, and Biofuel Sales for Calendar Year 2014
Data Description Locations Gallons Pure Petroleum/Diesel Pure Biofuel
Gasoline (Non-Ethanol) 1,673 213,252,397 213,252,397 0
Ethanol
E10 1,983 1,269,655,383 1,142,689,845 126,965,538
E15/E20 84 3,953,477 3,360,455 593,022
E85 209 12,081,095 2,537,030 9,544,065
Total Ethanol 1,991 1,285,689,955 1,148,587,330 137,102,625
Total Gasoline and Ethanol 2,058 1,498,942,352 1,361,839,727 137,102,625
Ethanol Share 96.7% 85.8% 9.1%
Clear Diesel (Non-Biodiesel) 1,247 246,127,832 246,127,832 0
Clear Biodiesel
B2 Clear 54 11,435,901 11,207,183 228,718
B5 Clear 271 70,926,368 67,380,050 3,546,318
B10 Clear 140 49,066,144 44,159,530 4,906,614
B20 Clear 29 43,515,597 34,812,478 8,703,119
Other Clear 55 139,501,853 125,639,088 13,862,765
Subtotal Clear Biodiesel 326 314,445,863 283,198,328 31,247,535
Clear Biodiesel Share 20.7% 56.1% 9.9%
Total Clear Diesel 1,247 560,573,695 529,326,160 31,247,535
Dyed Diesel (Non-Biodiesel) 309 124,108,751 124,108,751 0
Dyed Biodiesel
B2 Dyed 35 1,509,752 1,479,557 30,195
B5 Dyed 87 33,766,218 32,077,907 1,688,311
B10 Dyed 21 1,231,759 1,108,583 123,176
B20 Dyed 12 403,228 322,582 80,646
Other Dyed 28 3,394,109 3,217,343 176,766
Subtotal Dyed Biodiesel 114 40,305,066 38,205,973 2,099,093
Dyed Biodiesel Share 27.0% 24.5% 5.2%
Total Dyed Diesel 164,413,817 162,314,724 2,099,093
Total Biodiesel 368 354,750,929 321,404,301 33,346,628
Total Diesel and Biodiesel 1,301 724,987,512 691,640,884 33,346,628
Biodiesel Share 28.3% 48.9% 4.6%
Total Fuel All Types 2,088 2,223,929,864 2,053,480,611 170,449,253
Pure Biofuels Share of Gasoline and Diesel 7.7%
Biofuel Distribution Percentage 11.4%
Source: 2014 Retailers Motor Fuel Gallons Annual Reports
5
Biofuel Distribution Percentage The primary purpose of this report is to provide the information needed to determine the State’s progress toward replacing 25% of petroleum-based motor fuels with biofuels by the year 2020. Table 1 provides estimates of the breakdown between petroleum or diesel and pure biofuel for each fuel type. For the purpose of measuring progress toward that goal, the following computations were made to estimate the amount of each type of fuel sold that was pure biofuel:
For E10 blend gasoline fuel the number of gallons was multiplied by 0.10 For E15/20 blend gasoline fuel the number of gallons was multiplied by 0.15 For E85 blend gasoline fuel the number of gallons was multiplied by 0.79 For B2 blend diesel fuel the number of gallons was multiplied by 0.02 For B5 blend diesel fuel the number of gallons was multiplied by 0.05 For B10 blend diesel fuel the number of gallons was multiplied by 0.10 For B20 blend diesel fuel the number of gallons was multiplied by 0.20 For other biodiesel blends the number of gallons was multiplied by the average
pure biodiesel share based on the four reported blends (for clear other biodiesel: 0.099 and for dyed other biodiesel 0.052)
These calculations indicate that during 2014 pure ethanol comprised 9.1% of the volume of total gasoline and ethanol fuel sales. The aggregate ethanol gallonage, which is the number of pure ethanol gallons sold by retailers during 2014, was 137.1 million gallons. Pure biodiesel comprised 4.6% of diesel and biodiesel sales. The aggregate biodiesel gallonage, which is the number of pure biodiesel gallons sold by retailers during 2014, was 33.3 million gallons. Together, pure ethanol and pure biodiesel comprised 7.7% of all fuel sales reported by retail locations. However, the formula specified in Iowa Code 452.31 (8) for the biofuel distribution percentage used to determine progress toward meeting the 25% biofuels goal does not include diesel fuel in its denominator. The formula is: Biofuel Distribution Percentage =
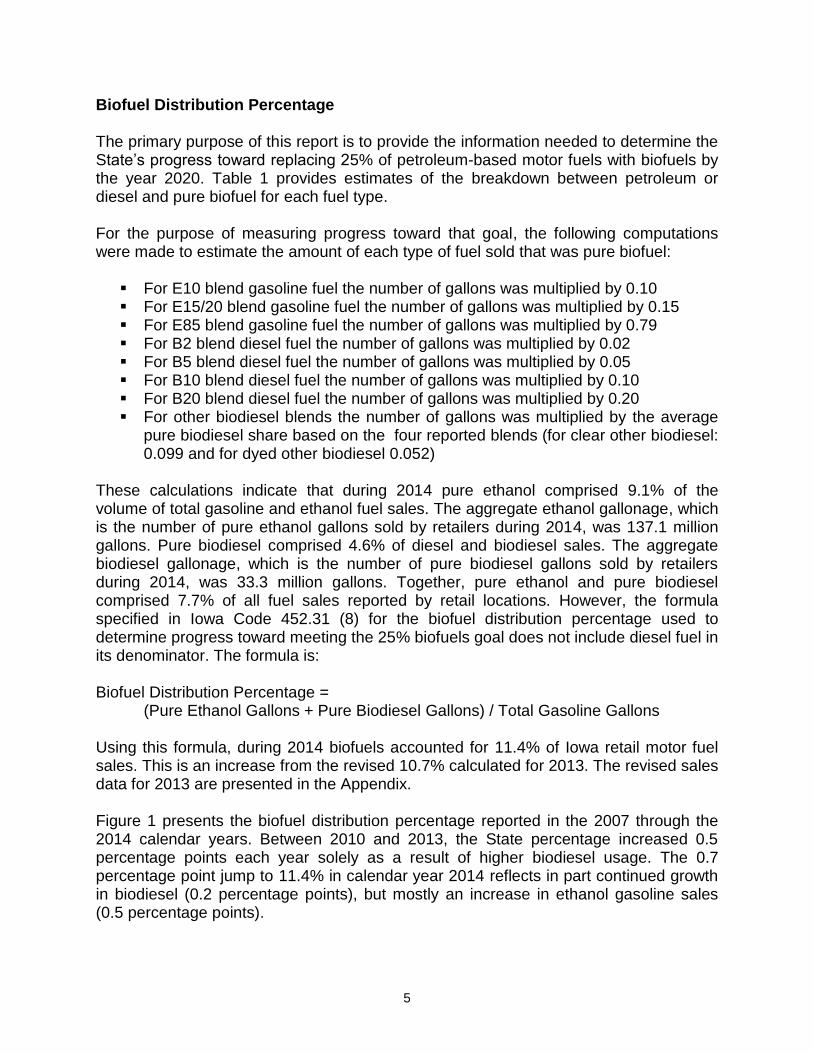
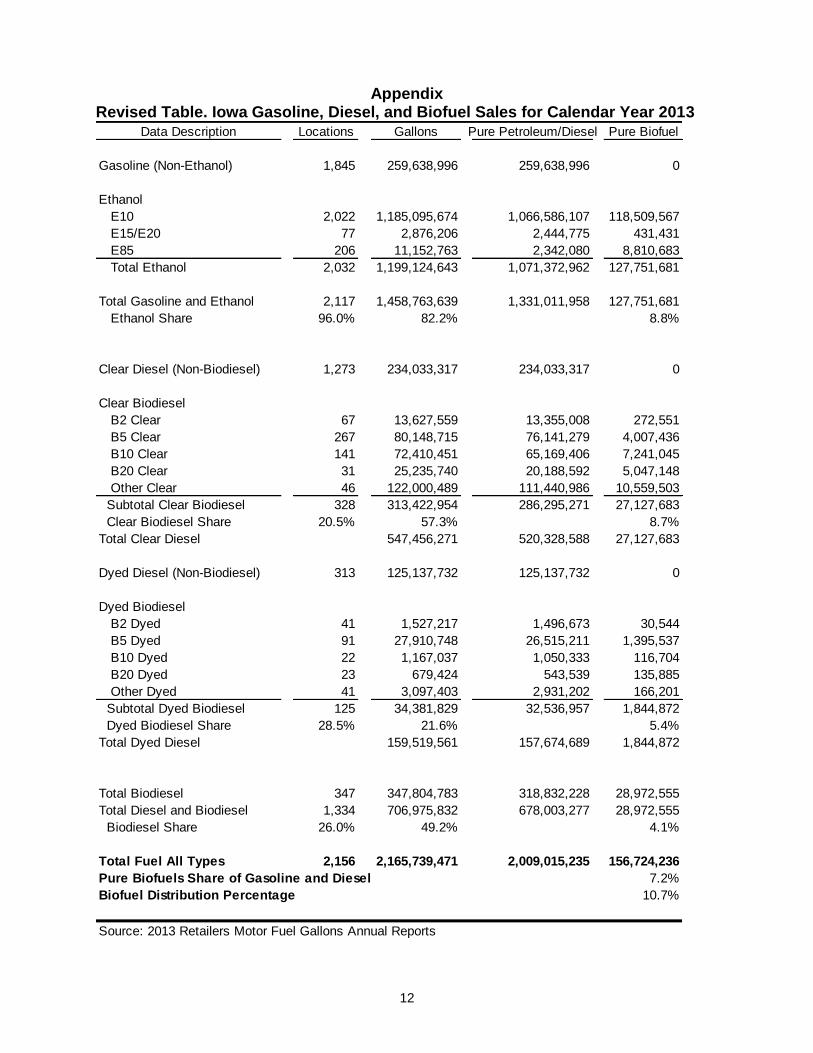
(Pure Ethanol Gallons + Pure Biodiesel Gallons) / Total Gasoline Gallons Using this formula, during 2014 biofuels accounted for 11.4% of Iowa retail motor fuel sales. This is an increase from the revised 10.7% calculated for 2013. The revised sales data for 2013 are presented in the Appendix. Figure 1 presents the biofuel distribution percentage reported in the 2007 through the 2014 calendar years. Between 2010 and 2013, the State percentage increased 0.5 percentage points each year solely as a result of higher biodiesel usage. The 0.7 percentage point jump to 11.4% in calendar year 2014 reflects in part continued growth in biodiesel (0.2 percentage points), but mostly an increase in ethanol gasoline sales (0.5 percentage points).
6
Figure 1: Biofuel Distribution Percentages Based on Annual Retailer Motor Fuel Reports, 2007-2013
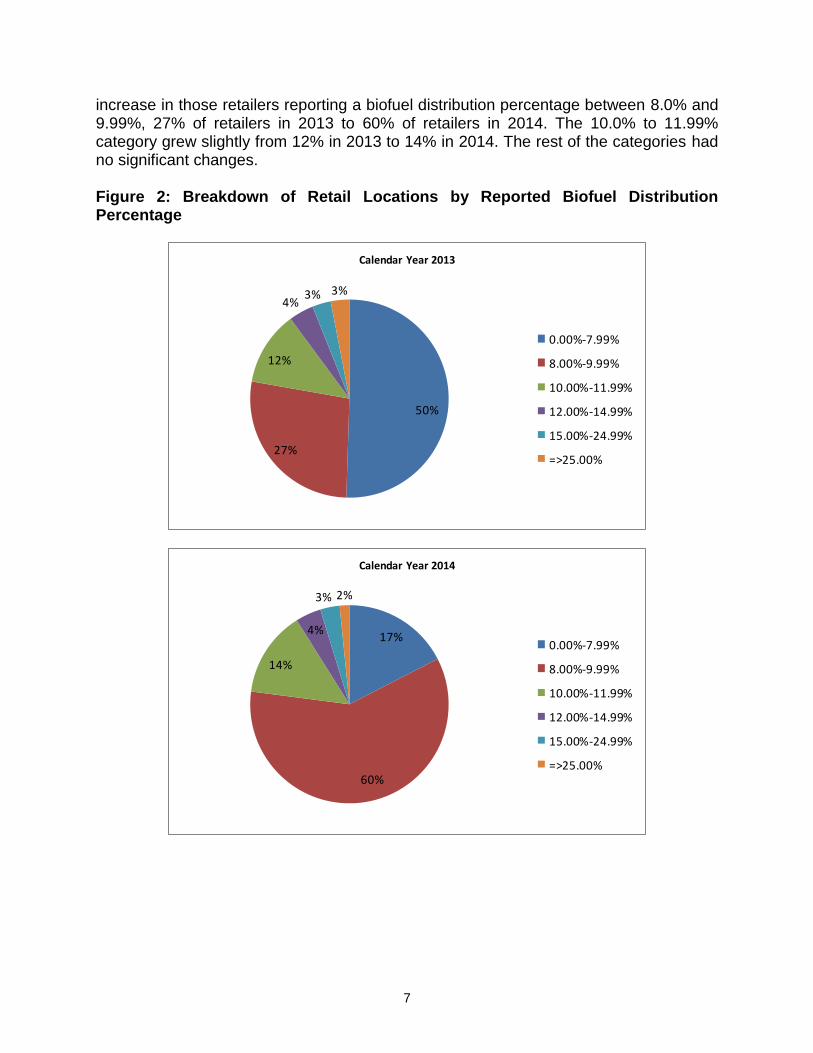
The rise in ethanol sales resulted from a pipeline change which occurred in late 2013. Iowa’s largest pipeline operator, Magellan Midstream Partners, stopped shipping 87-octane gasoline to its Iowa terminals and instead shipped 84-octane gasoline which cannot be legally sold because Iowa requires a minimum 87-octane fuel at gas pumps. Boosting the fuel to the minimum required 87-octane requires either blending with ethanol (87-octane fuel can be created by blending 90% 84-octane gasoline with 10% ethanol because ethanol has a high octane content) or with more expensive 91-octane premium gasoline. The need to include premium in any non-ethanol gasoline raised the relative price of non-ethanol gasoline. The impact of the pipeline change is seen in the higher ethanol sales in Iowa during 2014. Although the 25% goal was for the state as a whole, it is instructive to consider that same measure at the retailer and county level. Figure 2 illustrates the breakdown of retail locations by biofuel distribution percentage calculated using the sales reported by each retail location for which Retailers Motor Fuel Gallons Annual Reports were filed in 2014 or 2013. The data includes only the retail locations that reported gasoline or ethanol sales in the respective calendar year, excluding those with only diesel sales reported. However, as noted above, the calculation of the biofuel distribution percentage includes any pure biodiesel sales reported at those locations. The sharp decline in the share of retailers reporting less than an 8.0% biofuel distribution percentage in 2014 (17%) compared to 2013 (50%) again reflects the impact of the pipeline change in late 2013. In calendar year 2014 there was a significant
9.8%9.1% 9.0% 9.2% 9.7% 10.2% 10.7%
11.4%
25.0%
0%
5%
10%
15%
20%
25%
30%
2007 2008 2009 2010 2011 2012 2013 2014 2020 Target
7
increase in those retailers reporting a biofuel distribution percentage between 8.0% and 9.99%, 27% of retailers in 2013 to 60% of retailers in 2014. The 10.0% to 11.99% category grew slightly from 12% in 2013 to 14% in 2014. The rest of the categories had no significant changes. Figure 2: Breakdown of Retail Locations by Reported Biofuel Distribution Percentage
50%
27%
12%
4%3% 3%
Calendar Year 2013
0.00%-7.99%
8.00%-9.99%
10.00%-11.99%
12.00%-14.99%
15.00%-24.99%
=>25.00%
17%
60%
14%
4%
3% 2%
Calendar Year 2014
0.00%-7.99%
8.00%-9.99%
10.00%-11.99%
12.00%-14.99%
15.00%-24.99%
=>25.00%
8
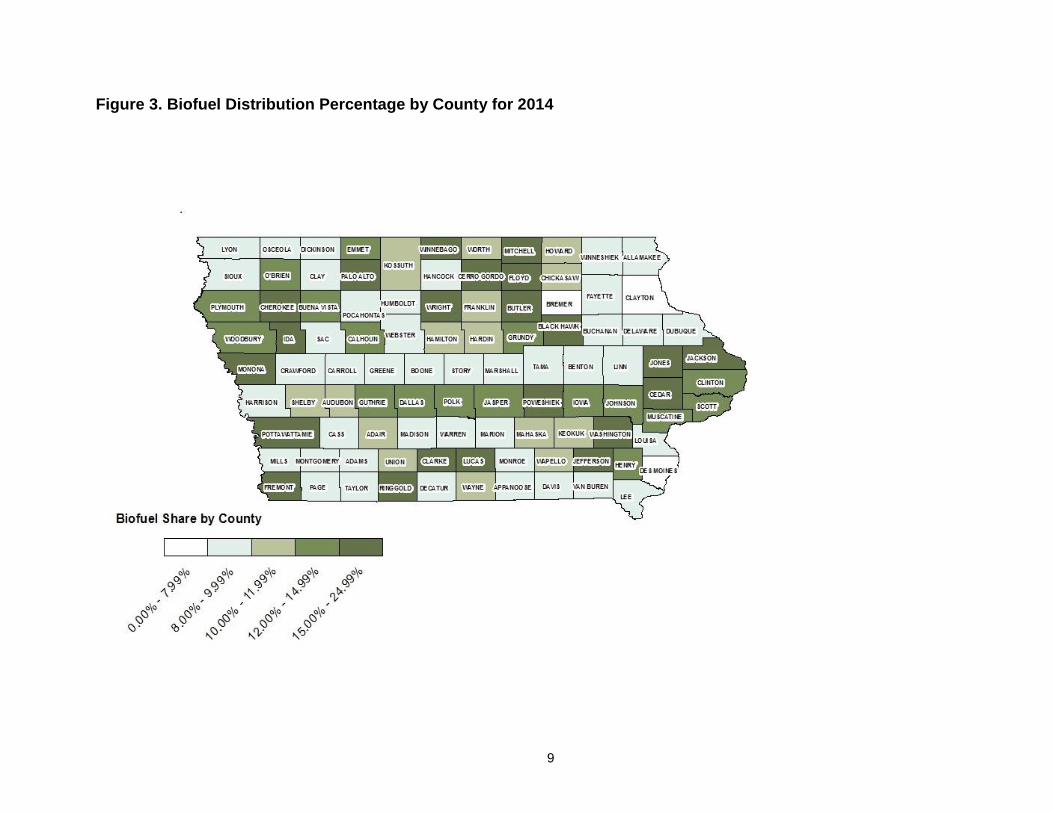
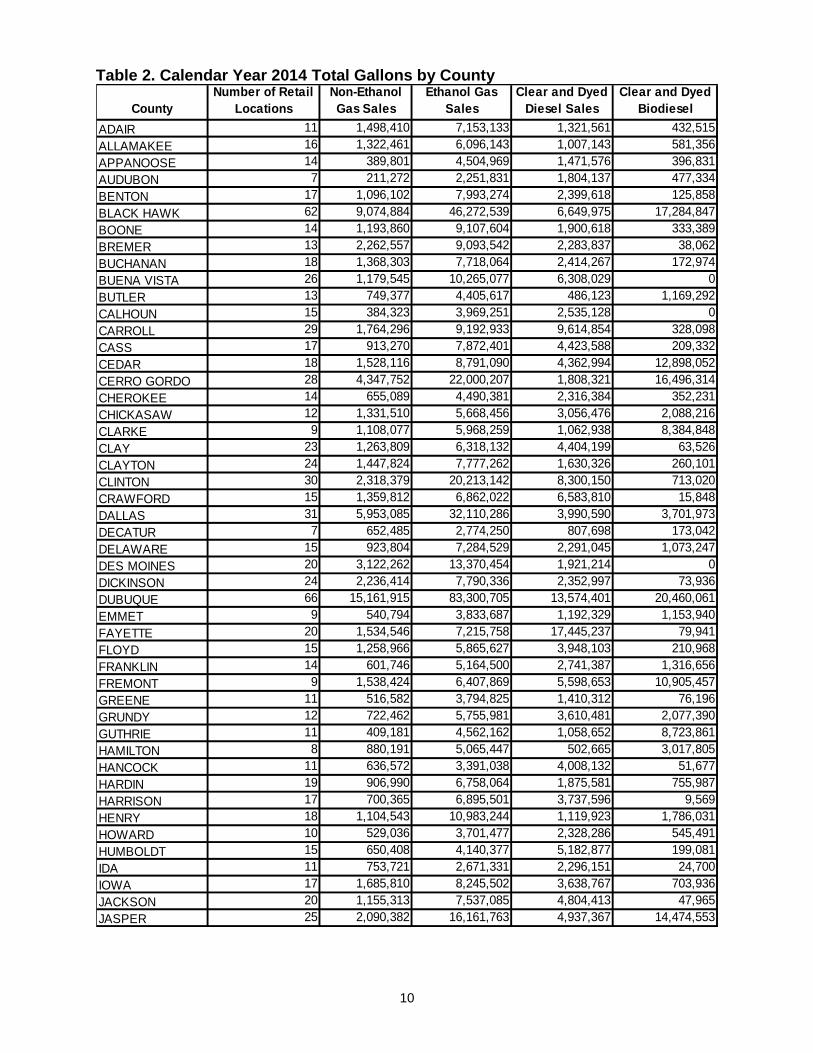
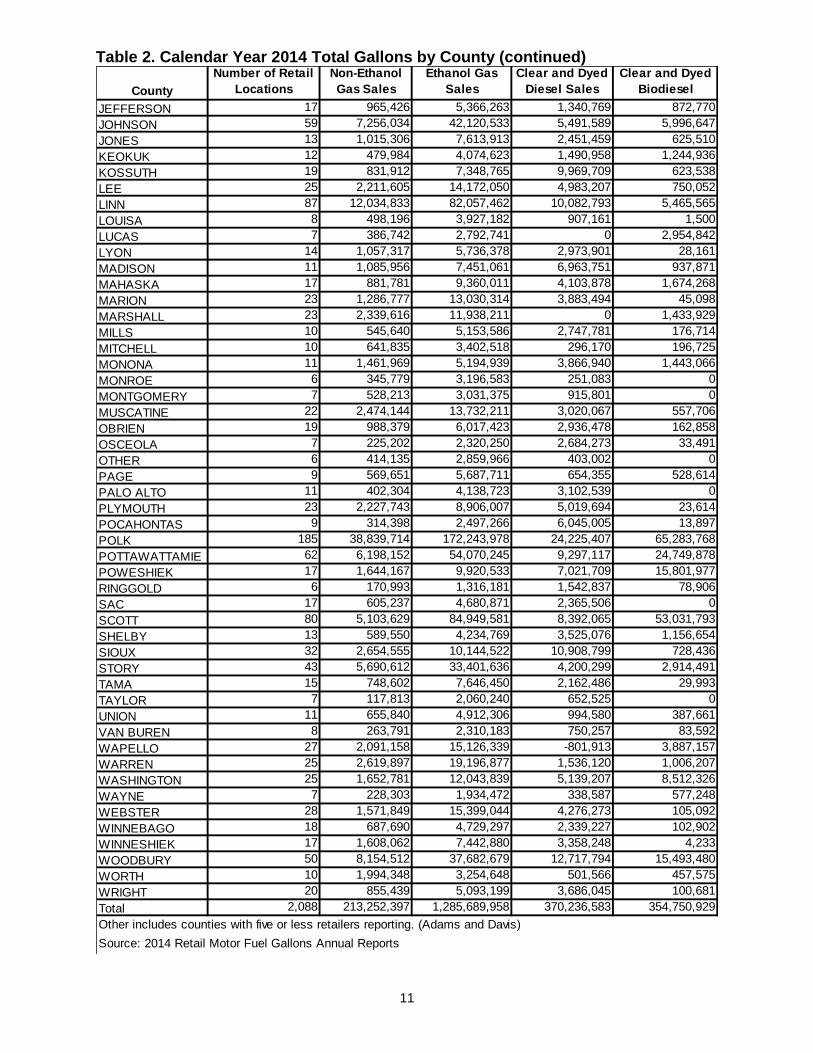
To further illustrate the variation in sales of biofuel among Iowa retailers, Figure 3 maps the biofuel distribution percentage calculated by county. These percentages are based on total sales reported by the retailers within each county who remitted the 2014 annual gallons report. No county exceeded the 25% goal, although nine counties had pure biofuel sales comprising between 15.0% and 24.99% of total motor fuel sales. Only five counties had biofuel distribution percentages below 8.0%. The majority of the counties (forty-five) fall in the 8.0% to 9.99% category. Table 3 provides the total gallons of non-ethanol gasoline, ethanol, clear and dyed non-biodiesel diesel, and clear and dyed biodiesel gallons for all counties with more than five retailers reporting sales to the Department.
9
Figure 3. Biofuel Distribution Percentage by County for 2014
10
Table 2. Calendar Year 2014 Total Gallons by County
County
Number of Retail
Locations
Non-Ethanol
Gas Sales
Ethanol Gas
Sales
Clear and Dyed
Diesel Sales
Clear and Dyed
Biodiesel
ADAIR 11 1,498,410 7,153,133 1,321,561 432,515
ALLAMAKEE 16 1,322,461 6,096,143 1,007,143 581,356
APPANOOSE 14 389,801 4,504,969 1,471,576 396,831
AUDUBON 7 211,272 2,251,831 1,804,137 477,334
BENTON 17 1,096,102 7,993,274 2,399,618 125,858
BLACK HAWK 62 9,074,884 46,272,539 6,649,975 17,284,847
BOONE 14 1,193,860 9,107,604 1,900,618 333,389
BREMER 13 2,262,557 9,093,542 2,283,837 38,062
BUCHANAN 18 1,368,303 7,718,064 2,414,267 172,974
BUENA VISTA 26 1,179,545 10,265,077 6,308,029 0
BUTLER 13 749,377 4,405,617 486,123 1,169,292
CALHOUN 15 384,323 3,969,251 2,535,128 0
CARROLL 29 1,764,296 9,192,933 9,614,854 328,098
CASS 17 913,270 7,872,401 4,423,588 209,332
CEDAR 18 1,528,116 8,791,090 4,362,994 12,898,052
CERRO GORDO 28 4,347,752 22,000,207 1,808,321 16,496,314
CHEROKEE 14 655,089 4,490,381 2,316,384 352,231
CHICKASAW 12 1,331,510 5,668,456 3,056,476 2,088,216
CLARKE 9 1,108,077 5,968,259 1,062,938 8,384,848
CLAY 23 1,263,809 6,318,132 4,404,199 63,526
CLAYTON 24 1,447,824 7,777,262 1,630,326 260,101
CLINTON 30 2,318,379 20,213,142 8,300,150 713,020
CRAWFORD 15 1,359,812 6,862,022 6,583,810 15,848
DALLAS 31 5,953,085 32,110,286 3,990,590 3,701,973
DECATUR 7 652,485 2,774,250 807,698 173,042
DELAWARE 15 923,804 7,284,529 2,291,045 1,073,247
DES MOINES 20 3,122,262 13,370,454 1,921,214 0
DICKINSON 24 2,236,414 7,790,336 2,352,997 73,936
DUBUQUE 66 15,161,915 83,300,705 13,574,401 20,460,061
EMMET 9 540,794 3,833,687 1,192,329 1,153,940
FAYETTE 20 1,534,546 7,215,758 17,445,237 79,941
FLOYD 15 1,258,966 5,865,627 3,948,103 210,968
FRANKLIN 14 601,746 5,164,500 2,741,387 1,316,656
FREMONT 9 1,538,424 6,407,869 5,598,653 10,905,457
GREENE 11 516,582 3,794,825 1,410,312 76,196
GRUNDY 12 722,462 5,755,981 3,610,481 2,077,390
GUTHRIE 11 409,181 4,562,162 1,058,652 8,723,861
HAMILTON 8 880,191 5,065,447 502,665 3,017,805
HANCOCK 11 636,572 3,391,038 4,008,132 51,677
HARDIN 19 906,990 6,758,064 1,875,581 755,987
HARRISON 17 700,365 6,895,501 3,737,596 9,569
HENRY 18 1,104,543 10,983,244 1,119,923 1,786,031
HOWARD 10 529,036 3,701,477 2,328,286 545,491
HUMBOLDT 15 650,408 4,140,377 5,182,877 199,081
IDA 11 753,721 2,671,331 2,296,151 24,700
IOWA 17 1,685,810 8,245,502 3,638,767 703,936
JACKSON 20 1,155,313 7,537,085 4,804,413 47,965
JASPER 25 2,090,382 16,161,763 4,937,367 14,474,553
11
Table 2. Calendar Year 2014 Total Gallons by County (continued)
County
Number of Retail
Locations
Non-Ethanol
Gas Sales
Ethanol Gas
Sales
Clear and Dyed
Diesel Sales
Clear and Dyed
Biodiesel
JEFFERSON 17 965,426 5,366,263 1,340,769 872,770
JOHNSON 59 7,256,034 42,120,533 5,491,589 5,996,647
JONES 13 1,015,306 7,613,913 2,451,459 625,510
KEOKUK 12 479,984 4,074,623 1,490,958 1,244,936
KOSSUTH 19 831,912 7,348,765 9,969,709 623,538
LEE 25 2,211,605 14,172,050 4,983,207 750,052
LINN 87 12,034,833 82,057,462 10,082,793 5,465,565
LOUISA 8 498,196 3,927,182 907,161 1,500
LUCAS 7 386,742 2,792,741 0 2,954,842
LYON 14 1,057,317 5,736,378 2,973,901 28,161
MADISON 11 1,085,956 7,451,061 6,963,751 937,871
MAHASKA 17 881,781 9,360,011 4,103,878 1,674,268
MARION 23 1,286,777 13,030,314 3,883,494 45,098
MARSHALL 23 2,339,616 11,938,211 0 1,433,929
MILLS 10 545,640 5,153,586 2,747,781 176,714
MITCHELL 10 641,835 3,402,518 296,170 196,725
MONONA 11 1,461,969 5,194,939 3,866,940 1,443,066
MONROE 6 345,779 3,196,583 251,083 0
MONTGOMERY 7 528,213 3,031,375 915,801 0
MUSCATINE 22 2,474,144 13,732,211 3,020,067 557,706
OBRIEN 19 988,379 6,017,423 2,936,478 162,858
OSCEOLA 7 225,202 2,320,250 2,684,273 33,491
OTHER 6 414,135 2,859,966 403,002 0
PAGE 9 569,651 5,687,711 654,355 528,614
PALO ALTO 11 402,304 4,138,723 3,102,539 0
PLYMOUTH 23 2,227,743 8,906,007 5,019,694 23,614
POCAHONTAS 9 314,398 2,497,266 6,045,005 13,897
POLK 185 38,839,714 172,243,978 24,225,407 65,283,768
POTTAWATTAMIE 62 6,198,152 54,070,245 9,297,117 24,749,878
POWESHIEK 17 1,644,167 9,920,533 7,021,709 15,801,977
RINGGOLD 6 170,993 1,316,181 1,542,837 78,906
SAC 17 605,237 4,680,871 2,365,506 0
SCOTT 80 5,103,629 84,949,581 8,392,065 53,031,793
SHELBY 13 589,550 4,234,769 3,525,076 1,156,654
SIOUX 32 2,654,555 10,144,522 10,908,799 728,436
STORY 43 5,690,612 33,401,636 4,200,299 2,914,491
TAMA 15 748,602 7,646,450 2,162,486 29,993
TAYLOR 7 117,813 2,060,240 652,525 0
UNION 11 655,840 4,912,306 994,580 387,661
VAN BUREN 8 263,791 2,310,183 750,257 83,592
WAPELLO 27 2,091,158 15,126,339 -801,913 3,887,157
WARREN 25 2,619,897 19,196,877 1,536,120 1,006,207
WASHINGTON 25 1,652,781 12,043,839 5,139,207 8,512,326
WAYNE 7 228,303 1,934,472 338,587 577,248
WEBSTER 28 1,571,849 15,399,044 4,276,273 105,092
WINNEBAGO 18 687,690 4,729,297 2,339,227 102,902
WINNESHIEK 17 1,608,062 7,442,880 3,358,248 4,233
WOODBURY 50 8,154,512 37,682,679 12,717,794 15,493,480
WORTH 10 1,994,348 3,254,648 501,566 457,575
WRIGHT 20 855,439 5,093,199 3,686,045 100,681
Total 2,088 213,252,397 1,285,689,958 370,236,583 354,750,929
Other includes counties with five or less retailers reporting. (Adams and Davis)
Source: 2014 Retail Motor Fuel Gallons Annual Reports
12
Appendix Revised Table. Iowa Gasoline, Diesel, and Biofuel Sales for Calendar Year 2013
Data Description Locations Gallons Pure Petroleum/Diesel Pure Biofuel
Gasoline (Non-Ethanol) 1,845 259,638,996 259,638,996 0
Ethanol
E10 2,022 1,185,095,674 1,066,586,107 118,509,567
E15/E20 77 2,876,206 2,444,775 431,431
E85 206 11,152,763 2,342,080 8,810,683
Total Ethanol 2,032 1,199,124,643 1,071,372,962 127,751,681
Total Gasoline and Ethanol 2,117 1,458,763,639 1,331,011,958 127,751,681
Ethanol Share 96.0% 82.2% 8.8%
Clear Diesel (Non-Biodiesel) 1,273 234,033,317 234,033,317 0
Clear Biodiesel
B2 Clear 67 13,627,559 13,355,008 272,551
B5 Clear 267 80,148,715 76,141,279 4,007,436
B10 Clear 141 72,410,451 65,169,406 7,241,045
B20 Clear 31 25,235,740 20,188,592 5,047,148
Other Clear 46 122,000,489 111,440,986 10,559,503
Subtotal Clear Biodiesel 328 313,422,954 286,295,271 27,127,683
Clear Biodiesel Share 20.5% 57.3% 8.7%
Total Clear Diesel 547,456,271 520,328,588 27,127,683
Dyed Diesel (Non-Biodiesel) 313 125,137,732 125,137,732 0
Dyed Biodiesel
B2 Dyed 41 1,527,217 1,496,673 30,544
B5 Dyed 91 27,910,748 26,515,211 1,395,537
B10 Dyed 22 1,167,037 1,050,333 116,704
B20 Dyed 23 679,424 543,539 135,885
Other Dyed 41 3,097,403 2,931,202 166,201
Subtotal Dyed Biodiesel 125 34,381,829 32,536,957 1,844,872
Dyed Biodiesel Share 28.5% 21.6% 5.4%
Total Dyed Diesel 159,519,561 157,674,689 1,844,872
Total Biodiesel 347 347,804,783 318,832,228 28,972,555
Total Diesel and Biodiesel 1,334 706,975,832 678,003,277 28,972,555
Biodiesel Share 26.0% 49.2% 4.1%
Total Fuel All Types 2,156 2,165,739,471 2,009,015,235 156,724,236
Pure Biofuels Share of Gasoline and Diesel 7.2%
Biofuel Distribution Percentage 10.7%
Source: 2013 Retailers Motor Fuel Gallons Annual Reports