Embed Size (px)
Citation preview
EN0710151004MKE 1
T E C H N I C A L M E M O R A N D U M
2014 Sitewide Groundwater Sampling Technical Memorandum, Garfield Groundwater Contamination Superfund Site, Garfield, New Jersey
PREPARED FOR: U.S. Environmental Protection Agency, Region II U.S. Army Corps of Engineers, Kansas City District
PREPARED BY: CH2M HILL
DATE: September 25, 2015
Introduction CH2M HILL conducted groundwater monitoring activities at the Garfield Groundwater Contamination Superfund Site in the city of Garfield, Bergen County, New Jersey (site) during a 3-week period in December 2014. This sitewide groundwater sampling event was conducted to supplement the Remedial Investigation Report (RIR) that was prepared for the U.S. Environmental Protection Agency (USEPA), Region II and the U.S. Army Corps of Engineers (USACE), Kansas City District (CH2M HILL 2014a). These groundwater monitoring activities consisted of the following:
• Groundwater elevation level synoptic monitoring at 50 monitoring wells and one Passaic River “stream gauge” (one monitoring well was excluded from the synoptic measurements because of a parked car blocking access).
• Groundwater sampling at 51 monitoring wells including flexible liner underground technology (FLUTe) multiport monitoring wells for hexavalent chromium (Cr(VI)) and field analysis of ferrous (+II) iron. Select monitoring wells also were analyzed for groundwater redox parameters including total chromium, dissolved iron, dissolved manganese, sulfate, nitrate/nitrite, and total organic carbon (TOC). The groundwater sample tracking table is included as Table 1.
The data other than Cr(VI) were collected during this 2014 sitewide sampling event to support the in-situ reduction pilot study (pilot study) that was conducted in phases during 2014. This technical memorandum incudes a discussion about the process of collecting the data while the results of the pilot study are discussed in the Results of the In Situ Reduction Pilot Study Test memorandum (CH2M HILL 2015).
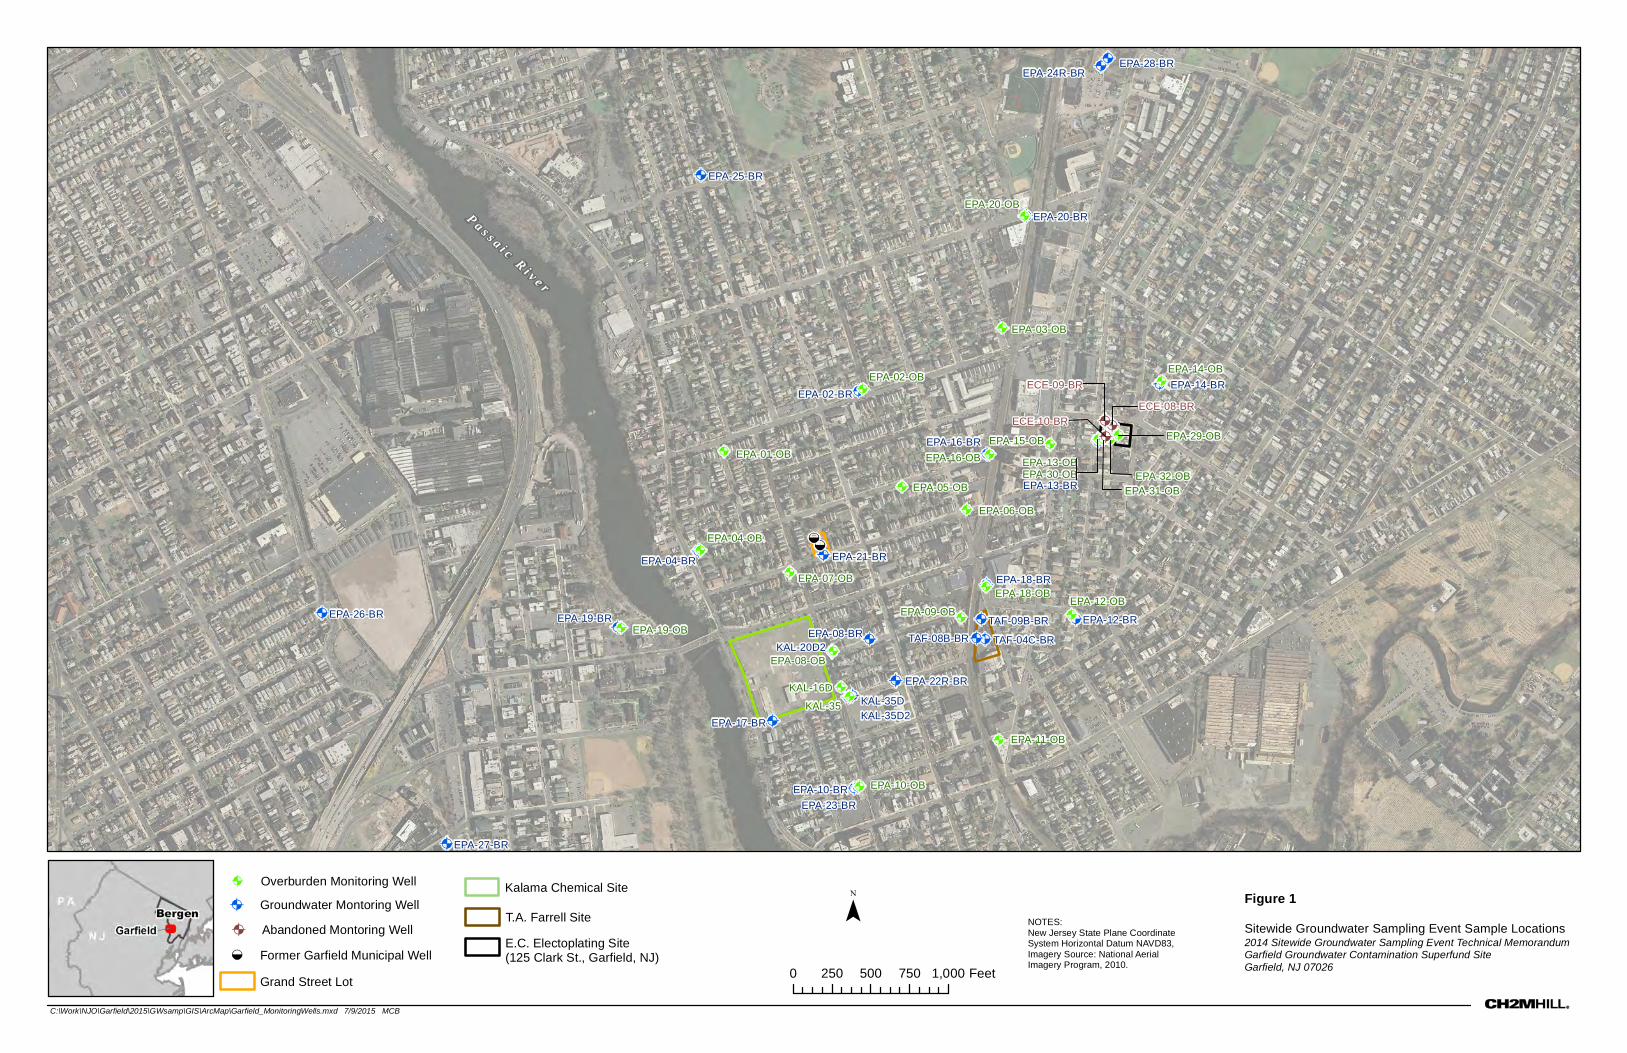
Groundwater sampling activities were conducted in accordance with the procedures outlined in the primary site-specific Uniform Federal Policy for Quality Assurance Project Plans (UFP-QAPP; CH2M HILL 2012) and the addendum to the primary site-specific UFP-QAPP (CH2M HILL 2014b) at each of the monitoring wells sampled. Figure 1 depicts the locations of the site monitoring wells. Details of the synoptic water level event, groundwater sampling activities, and groundwater analytical results are described below.
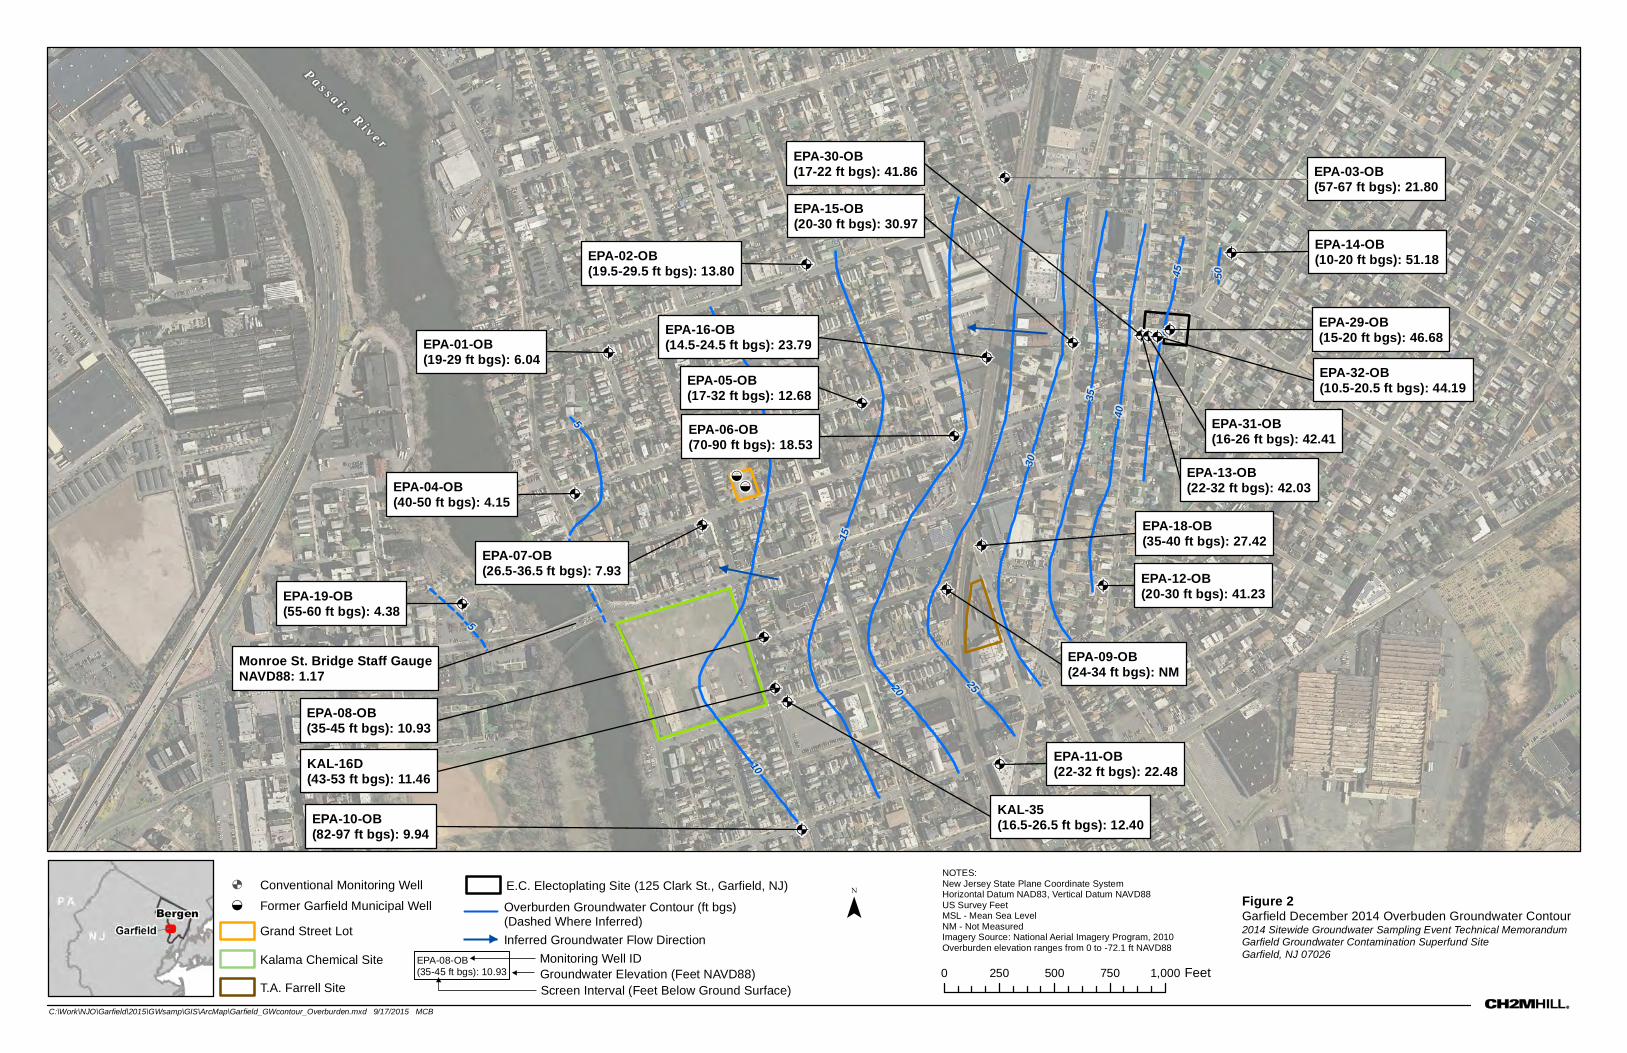
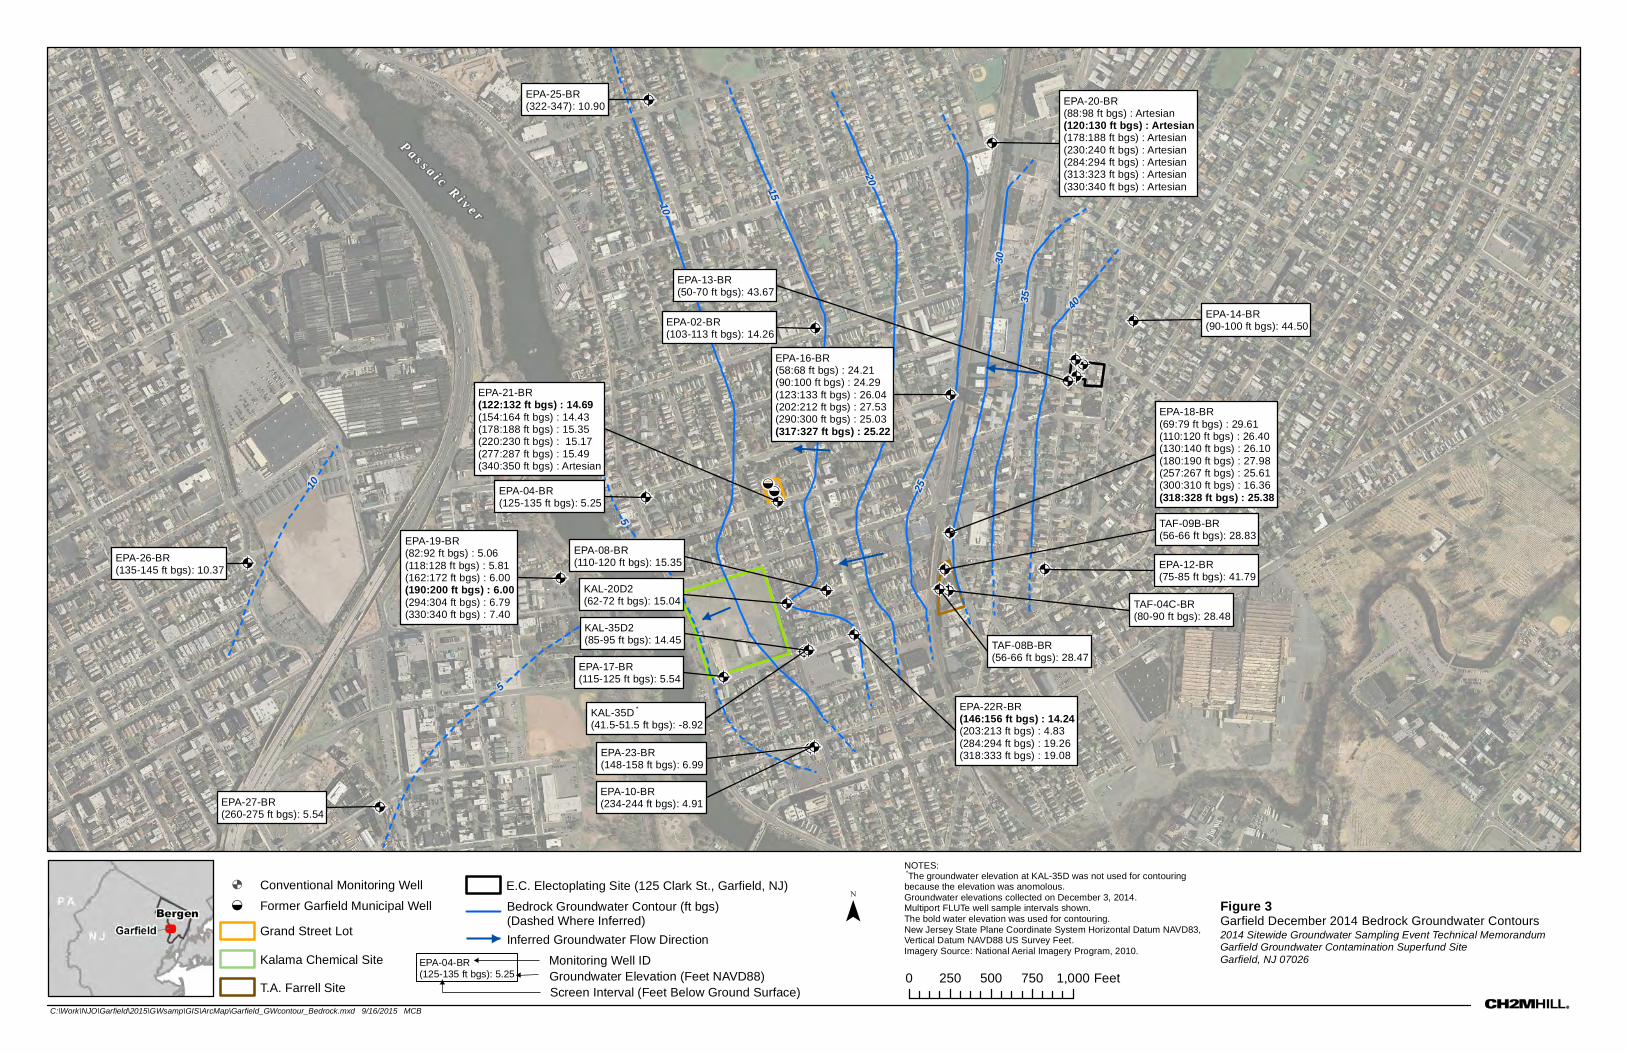
Monitoring Well Water Level Synoptic Event Before sampling groundwater, one round of synoptic depth-to-water measurements was collected on December 3, 2014, from 50 of 51 onsite monitoring wells (including select Kalama Chemical and T.A. Farrell monitoring wells). Monitoring well EPA-09-OB could not be measured on December 3, 2014, nor when attempted again on December 4, 2014, because a car was parked on top of the well. Monitoring well EPA-19-BR was not able to be measured on December 3, 2014, because a car was parked on the well, but was measured on the following day. Flowing artesian groundwater conditions were observed at EPA-24R-BR, EPA-28-BR, and each of the ports within EPA-20-BR except port EPA-20-BR-125. As a result, no groundwater elevations were calculated at these locations. The water level measurements were used to calculate the groundwater elevation at each well. Groundwater elevation contour maps were prepared for the overburden and bedrock aquifers from these measurements and calculations to provide information on the
2014 SITEWIDE GROUNDWATER SAMPLING TECHNICAL MEMORANDUM, GARFIELD GROUNDWATER CONTAMINATION SUPERFUND SITE, GARFIELD, NEW JERSEY
2 EN0710151004MKE
inferred groundwater flow direction (Figures 2 and 3). Table 2 presents a summary of the depth-to-water measurements and corresponding groundwater elevations.
Before obtaining water levels at each monitoring well, well headspace and breathing zone readings were collected using a calibrated photoionization detector (PID) with a 10.6-electron volt lamp. At conventional monitoring wells, depth-to-water measurements were collected using an electronic water level indicator following an equilibration period to allow the water column to stabilize to atmospheric pressure after removing the well cap. Depth–to-water measurements at the FLUTe wells were collected from within the sample tubing of each FLUTe port following the manufacture’s specified procedures using a narrow-diameter electronic water level indicator. Following the manufacturer’s recommendations, the sample tubing at each FLUTe port was purged before each synoptic event to minimize the potential for inaccurate water level measurements caused by a check-valve integrated in the FLUTe construction and changes in water levels and barometric pressure over time. Each water level indicator/probe and probe measuring tape was decontaminated with a rinse of Alconox and deionized water after each location to minimize the potential for cross-contamination between monitoring wells.
The inferred groundwater flow directions (flow perpendicular to the groundwater elevation contours) were similar to those from previous synoptic measurement events. Groundwater is inferred to flow generally east to west toward the Passaic River for both the overburden and bedrock aquifers.
Groundwater Sampling Groundwater Sampling Procedure One round of groundwater samples was collected from the 51 monitoring wells in general accordance with the procedures outlined in the site-specific UFP-QAPPs (CH2M HILL 2012, 2014b). Groundwater samples from conventional monitoring wells were collected following the USEPA standard operating procedures (SOPs) for low-stress (low-flow)/minimal drawdown groundwater sample collection and procedures using decontaminated Grundfos RediFlo-2 submersible pumps with polyethylene purge/sample tubing. Significantly more costly Teflon-lined discharge tubing was not required because volatile organic compounds were not analyzed. Groundwater samples from FLUTe wells were collected using inert nitrogen gas to expel water from the sample port following procedures described in the UFP-QAPPs (CH2M HILL 2012, 2014b).
Groundwater samples were shipped to Australian Laboratory Services Group (ALS) of Rochester, New York for Cr (VI) analysis using USEPA Method 218.6. Samples also were analyzed by the USEPA’s Contract Laboratory Program and Division of Environmental Science and Assessment laboratory systems for the following analyses:
• Total chromium • Dissolved iron and manganese (Method ISM01.3) • TOC (Method SM 5310B) • Nitrate + nitrite (USEPA Method 353.2) • Sulfate (Method SW9056)
Disposable, single-use 0.45-micron filters were used to filter groundwater in the field for dissolved metals and Cr(VI).
Ferrous (+II) iron was analyzed for in the field with a field Hach colorimeter following the stabilization of groundwater parameters. Water quality parameters, including hydrogen ion potential (pH), temperature, specific conductivity, oxidation-reduction potential (ORP), dissolved oxygen (DO), and salinity, were collected using a Horiba U-52 during the purging of each well and recorded on field data sheets. An airtight Horiba flow-through cell was used to ensure accurate water quality parameters data, specifically DO and ORP, which can be influenced by atmospheric oxygen. Turbidity was measured using a Hach 2100Q turbidity meter. Groundwater purge and sample field data sheets are included in Attachment 1.
2014 SITEWIDE GROUNDWATER SAMPLING TECHNICAL MEMORANDUM, GARFIELD GROUNDWATER CONTAMINATION SUPERFUND SITE, GARFIELD, NEW JERSEY
EN0710151004MKE 3
Field sample collection, decontamination, and quality control (QC)/quality assurance (QA) procedures were followed in accordance with the project-specific UFP-QAPPs (CH2M HILL 2012, 2014b). Field duplicates (FD) and matrix spike (MS)/matrix spike duplicates (MSD) volumes were collected at a rate of 1 per 20 field samples for all analysis, with the exception of redox potential parameters, which did not require QA/QC procedures. Equipment blanks were collected at a rate of one sample per day by running Type II reagent grade deionized water through a decontaminated pump into the required sample bottles.
Data Quality Evaluation CH2M HILL performed a data quality evaluation (DQE) for Cr(VI) groundwater sample analytical data collected as part of the 2014 sitewide sampling event. The DQE reports contain an assessment of the quality and usability of the Cr(VI) analytical data. The DQE is included at Attachment 2.
The DQE found that the data generated from groundwater sample analyses were of sufficient quality and quantity necessary for accomplishing the project objectives. However, the DQE did describe equipment blank contamination issues likely attributable to buffer solution used by the laboratory. The blank contamination resulted in “B” or “UB” data qualifier flags for 81 analytical results associated with equipment blanks that had concentrations of Cr(VI) over the reporting limit. The DQE includes recommendations to avoid potential blank contamination during future sampling events.
Deviations during Groundwater Sampling The sample from EPA-21-BR-183 was collected on January 7, 2015, because of a blockage of unknown origin and composition in the discharge line during the initial December 9, 2014 sample attempt. CH2M HILL attempted to reconcile the blockage/sample issue by consulting with FLUTe personnel; however, the discharge line remains blocked. The groundwater sample was ultimately collected on the second attempt through the air line following an alternative sample procedure SOP provided by FLUTe.
The ALS laboratory mistakenly failed to analyze Cr(VI) groundwater samples collected from EPA-11-OB, EPA-19-OB, EPA-21-BR sampling Port 1 (85 feet below ground surface [bgs]), EPA-21-BR sampling Port 2 (127 feet bgs), and EPA-21-BR sampling Port 3 (159 feet bgs) within the required hold time. As a result, these wells were resampled on February 4 and 5, 2015 for Cr(VI) analysis.
EPA-21-BR-225 was sampled twice during the 2014 sampling event because the initial Cr(VI) result from December 17, 2014 (2,940 micrograms per liter [µg/L]) was significantly higher than the August and September 2012 results (31 µg/L and 7 µg/L, respectively). The Cr(VI) result from February 5, 2015 was 2,820 µg/L, which was similar to the December 17, 2014 result.
The results for EPA-21-BR-127 also exhibited varying concentrations of Cr(VI). The concentration of Cr(VI) for the sample collected from this port in December, 2014 was 33 µg/L, which is significantly lower than the concentrations observed in August and September, 2012 (3,370 µg/L and 3,520 µg/L, respectfully).
It was determined in September 2015, the reason for these varying concentrations of Cr(VI) at EPA-21-BR was that the sampling ports for EPA-21-BR-127 and EPA-21-BR-225 were not installed in sequence when the FLUTe monitor well was re-installed in December 2013, therefore the results for EPA-21-BR-127 are the actual results for EPA-21-BR-225 and the sample results for EPA-21-BR-225 are the actual results for EPA-21-BR-127. .
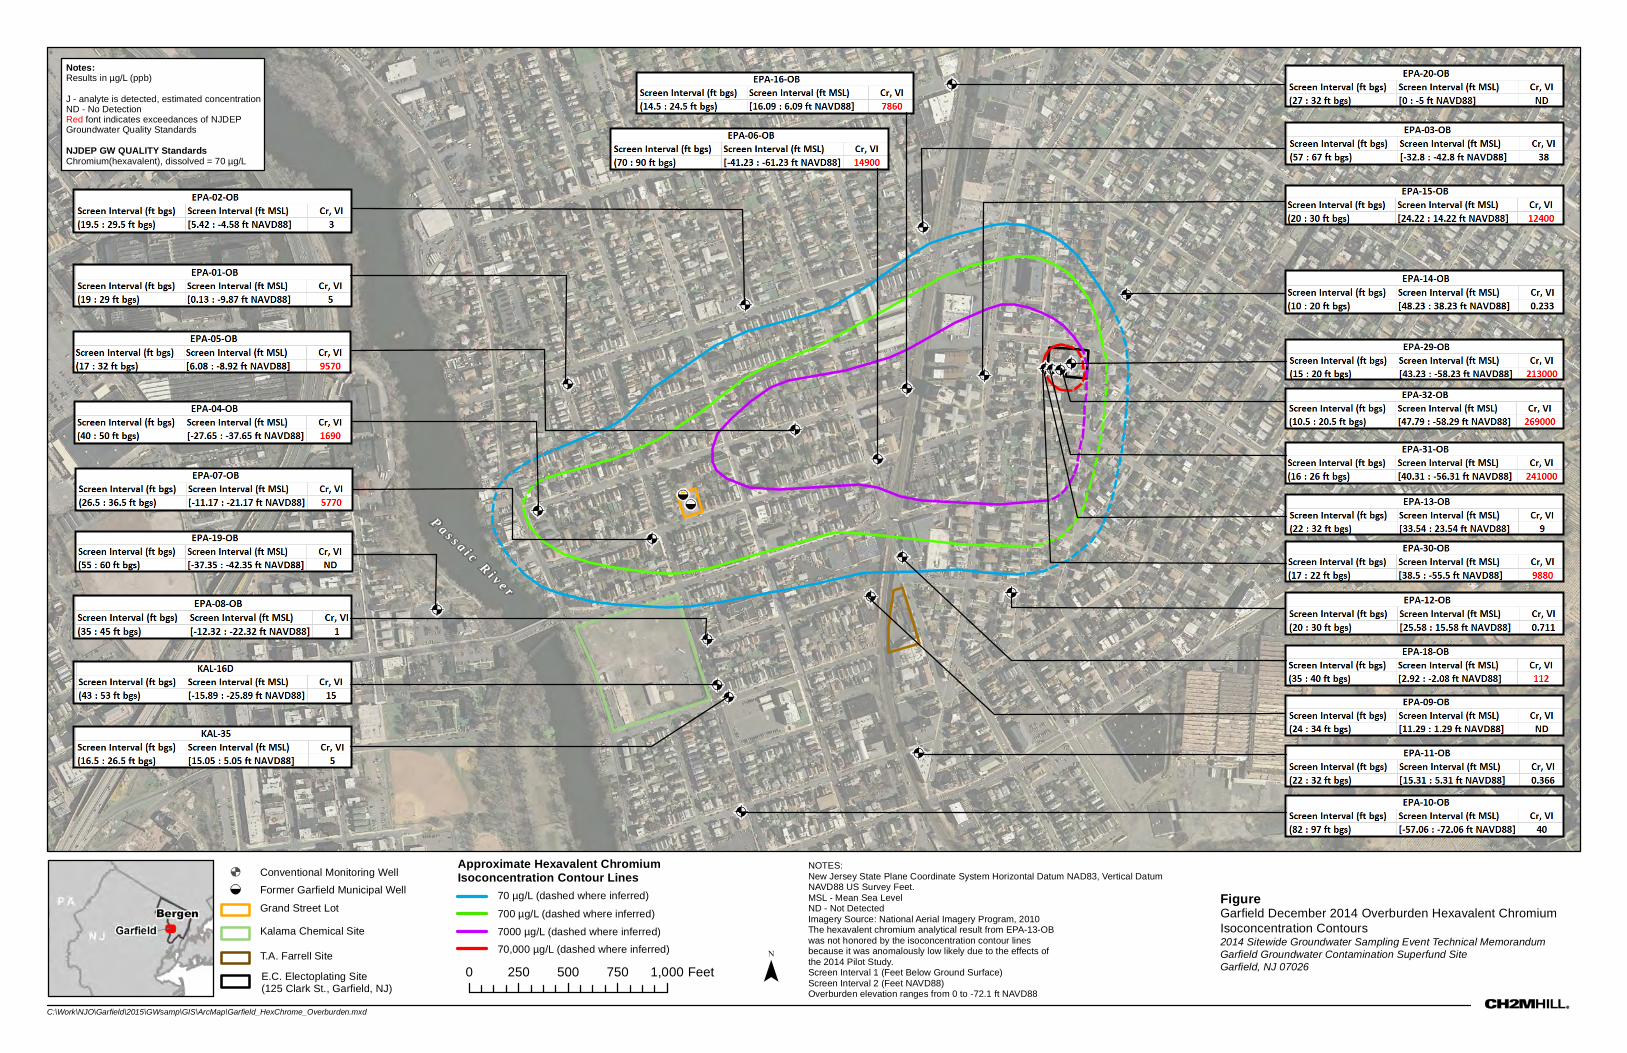
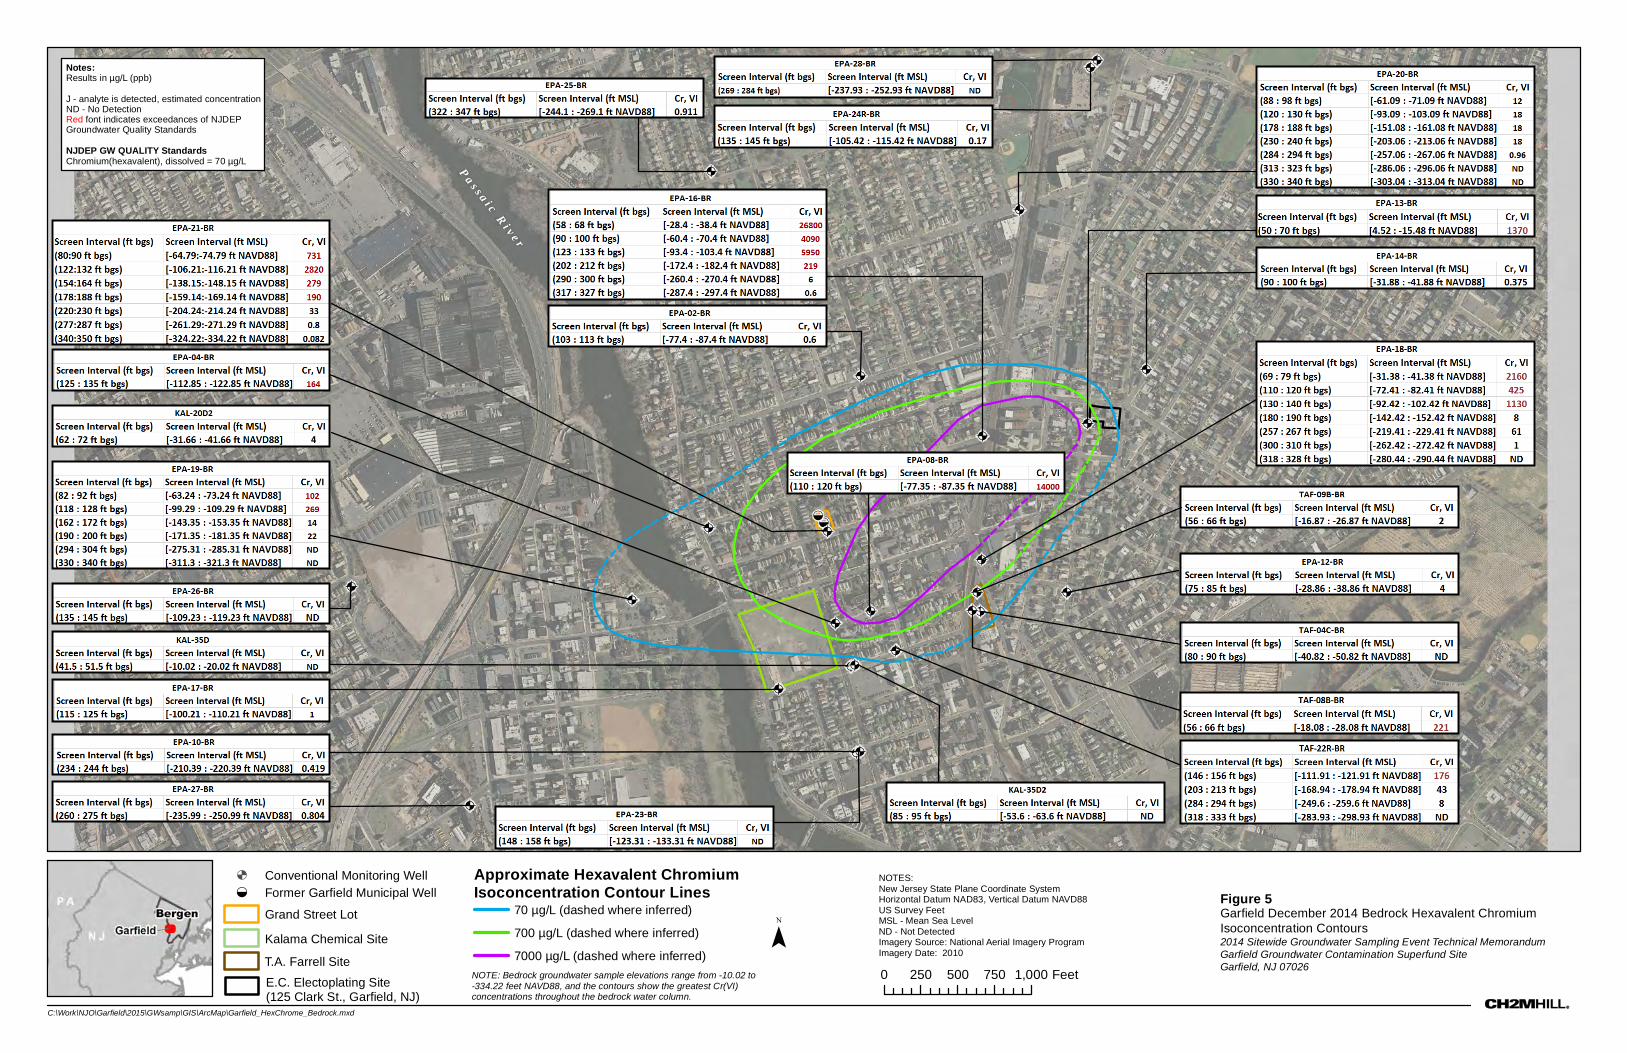
Groundwater Sampling Results The analytical results of the groundwater samples are presented in Table 3 along with a summary of groundwater field parameters. Groundwater redox parameters were collected and analyzed as part of this 2014 sitewide sampling event; the results of these parameters are evaluated in the Results of the In Situ Reduction Pilot Study Test memorandum (CH2M HILL 2015). Figure 4 shows Cr(VI) isoconcentration contours in the overburden aquifer wells, and Figure 5 shows Cr(VI) isoconcentration contours in the bedrock aquifer
2014 SITEWIDE GROUNDWATER SAMPLING TECHNICAL MEMORANDUM, GARFIELD GROUNDWATER CONTAMINATION SUPERFUND SITE, GARFIELD, NEW JERSEY
4 EN0710151004MKE
wells. Isoconcentration contours for the overburden aquifer and bedrock aquifer were created using Cr(VI) analytical results from the 2014 groundwater sampling event.
The extent of the overburden groundwater Cr(VI) plume based on the December 2014 analytical data is similar to that describe in the RIR (CH2M HILL 2014a). The overburden plume expands westward from the E.C. Electroplating (ECE) property and appears to dissipate at the Passaic River. Although the general size and geometry of the 2D overburden Cr(VI) plume was similar in 2014 to 2012, new wells on the ECE property from the pilot study were available in 2014. The wells in the center of the property (EPA-29-OB, EPA-31-OB, and EPA-32-OB) had significantly higher Cr(VI) concentrations (between 213,000 µg/L and 269,000 µg/L) than EPA-13-OB did during the remedial investigation (RI) (from 44,300 to 56,500 µg/L). EPA-13-OB was the only overburden well in the ECE property area that was installed and sampled during the RI. It should be noted that EPA-13-OB and EPA-30-OB were influenced by the pilot test and had significant reduced Cr(VI) concentrations in December 2014 compared to before the pilot testing injections.
The approximate overburden boundaries of the Cr(VI) plume, defined as concentrations exceeding the New Jersey Department of Environmental Protection (NJDEP) groundwater quality standard (GWQS) of 70 µg/L, encompass a north-south width of approximately 1,700 feet (from the area near Van Winkle Avenue to Commerce Street) and a length of approximately 3,200 feet from the east (ECE site) to the west (Passaic River). This plume boundary is similar to that which was observed during the RI.
The extent of Cr(VI) contamination in bedrock extends west from the ECE site in Garfield, beneath the Passaic River, and into the city of Passaic at EPA-19-BR. Cr(VI) has been detected in bedrock at concentrations exceeding the NJDEP GWQS to depths of 330 feet bgs (EPA-16-BR) and at concentrations near the source area at more than 1,000 times the NJDEP GWQS.
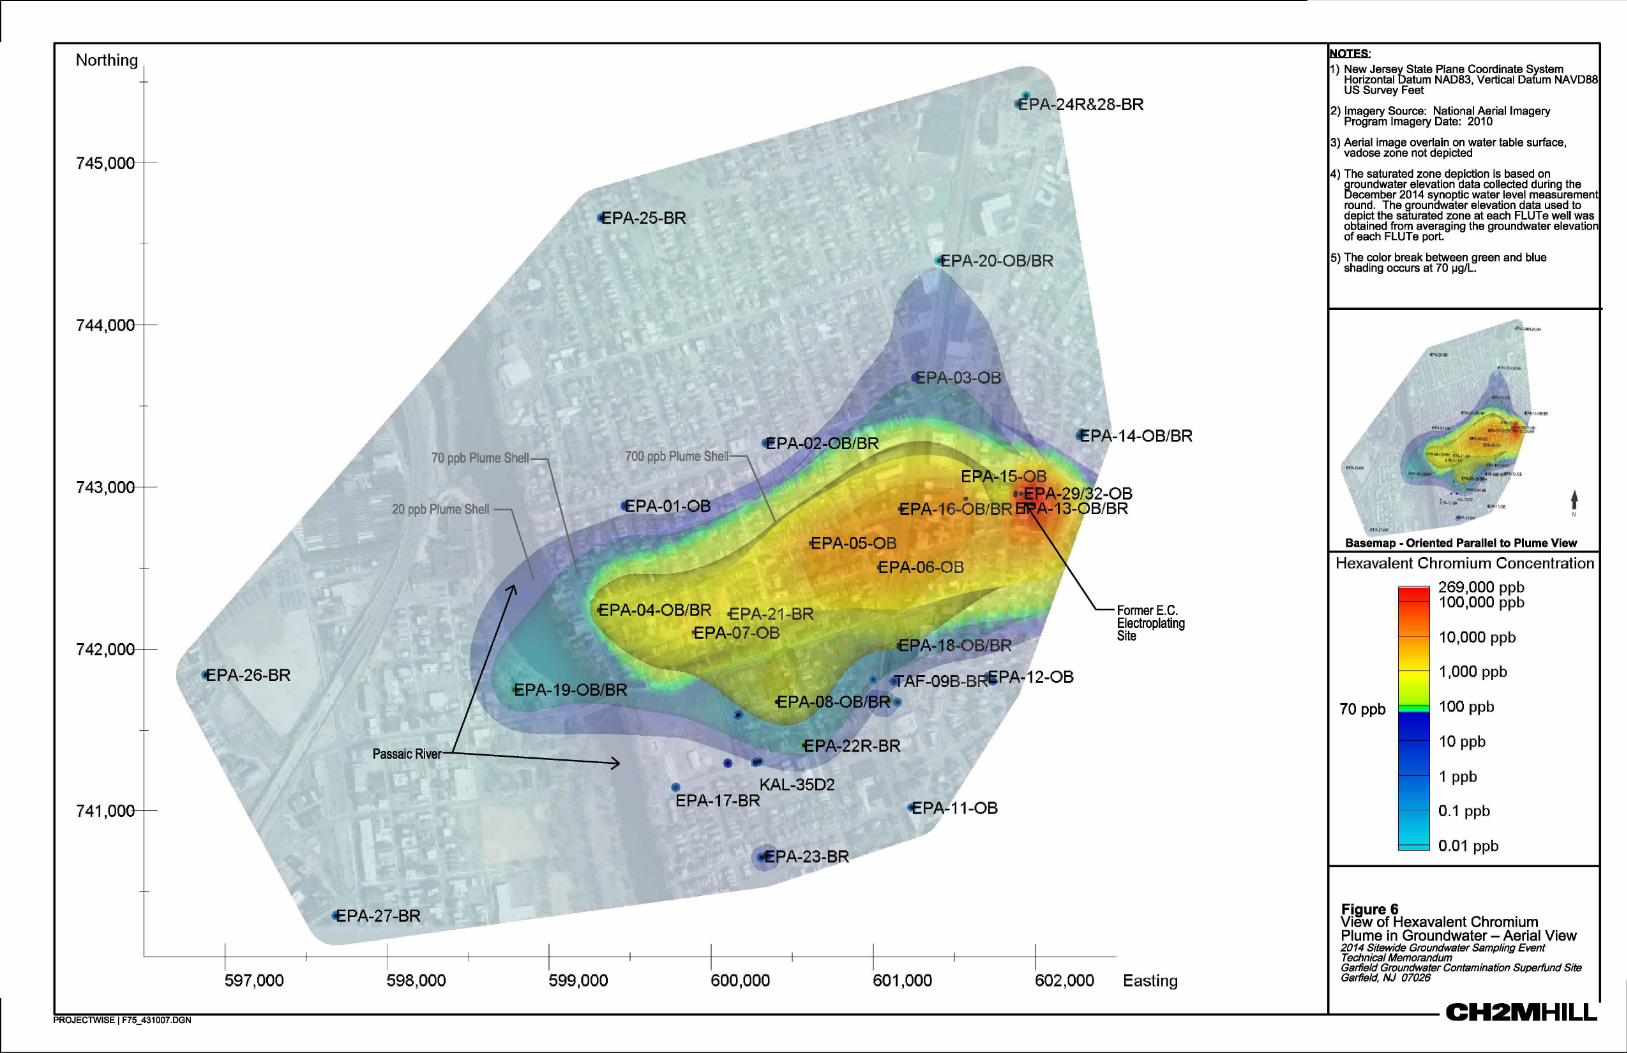
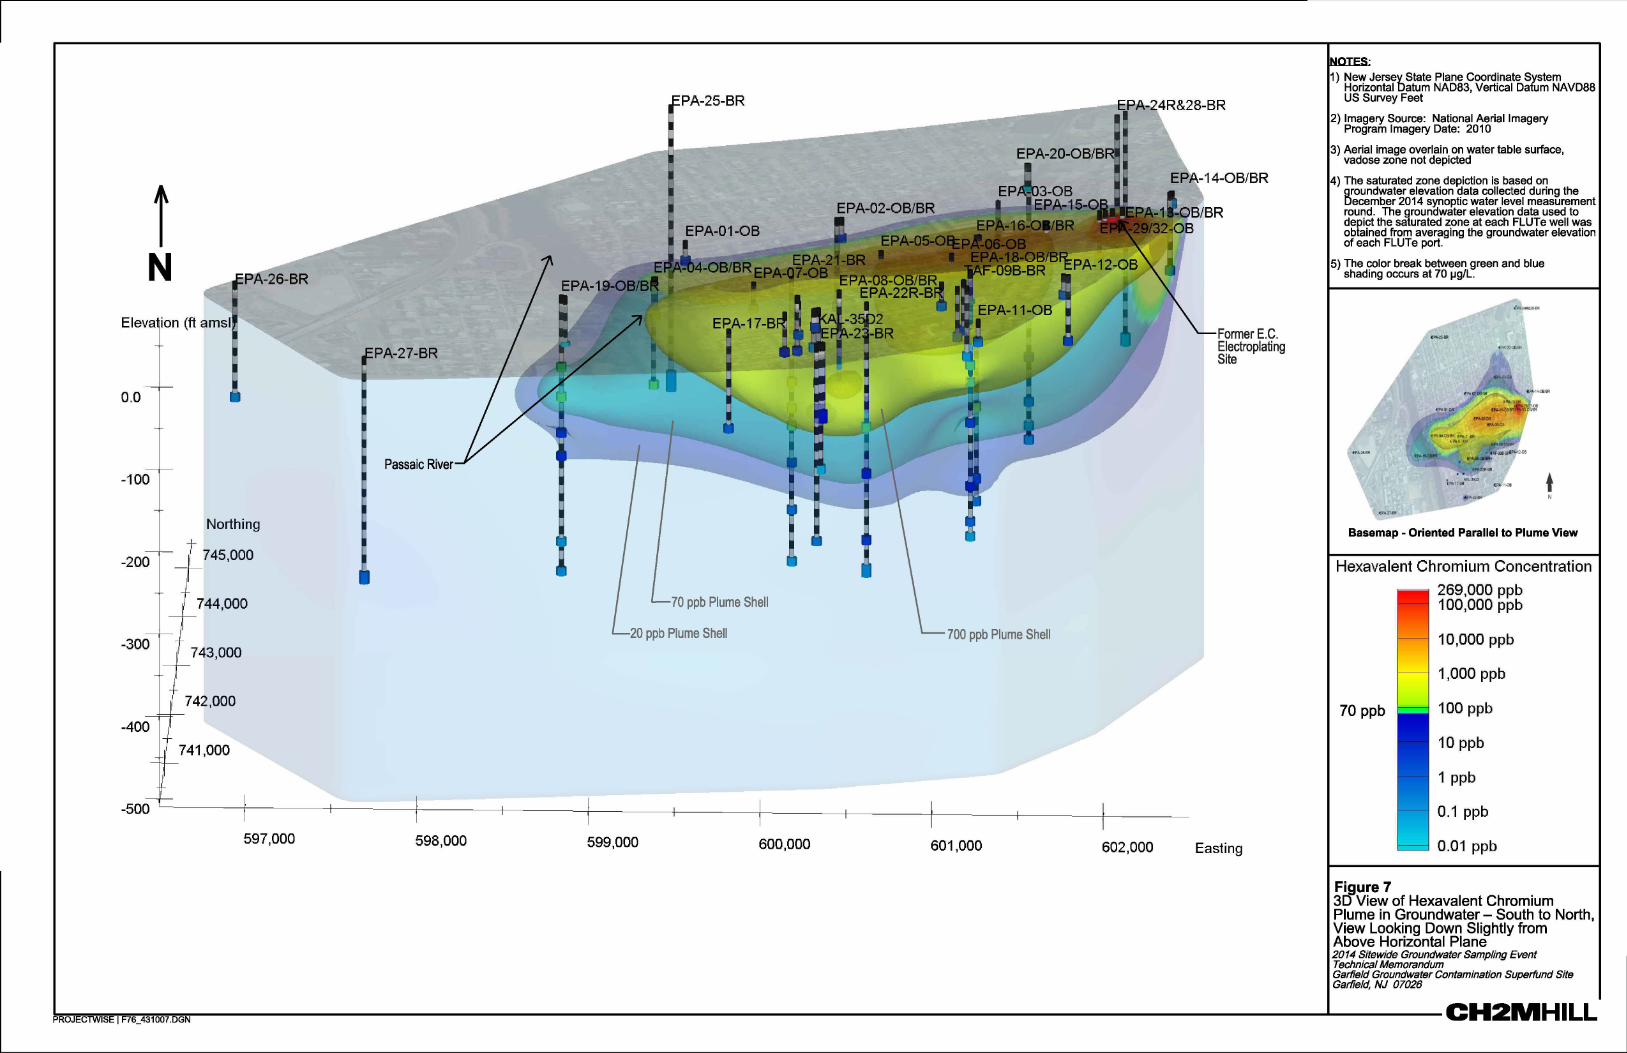
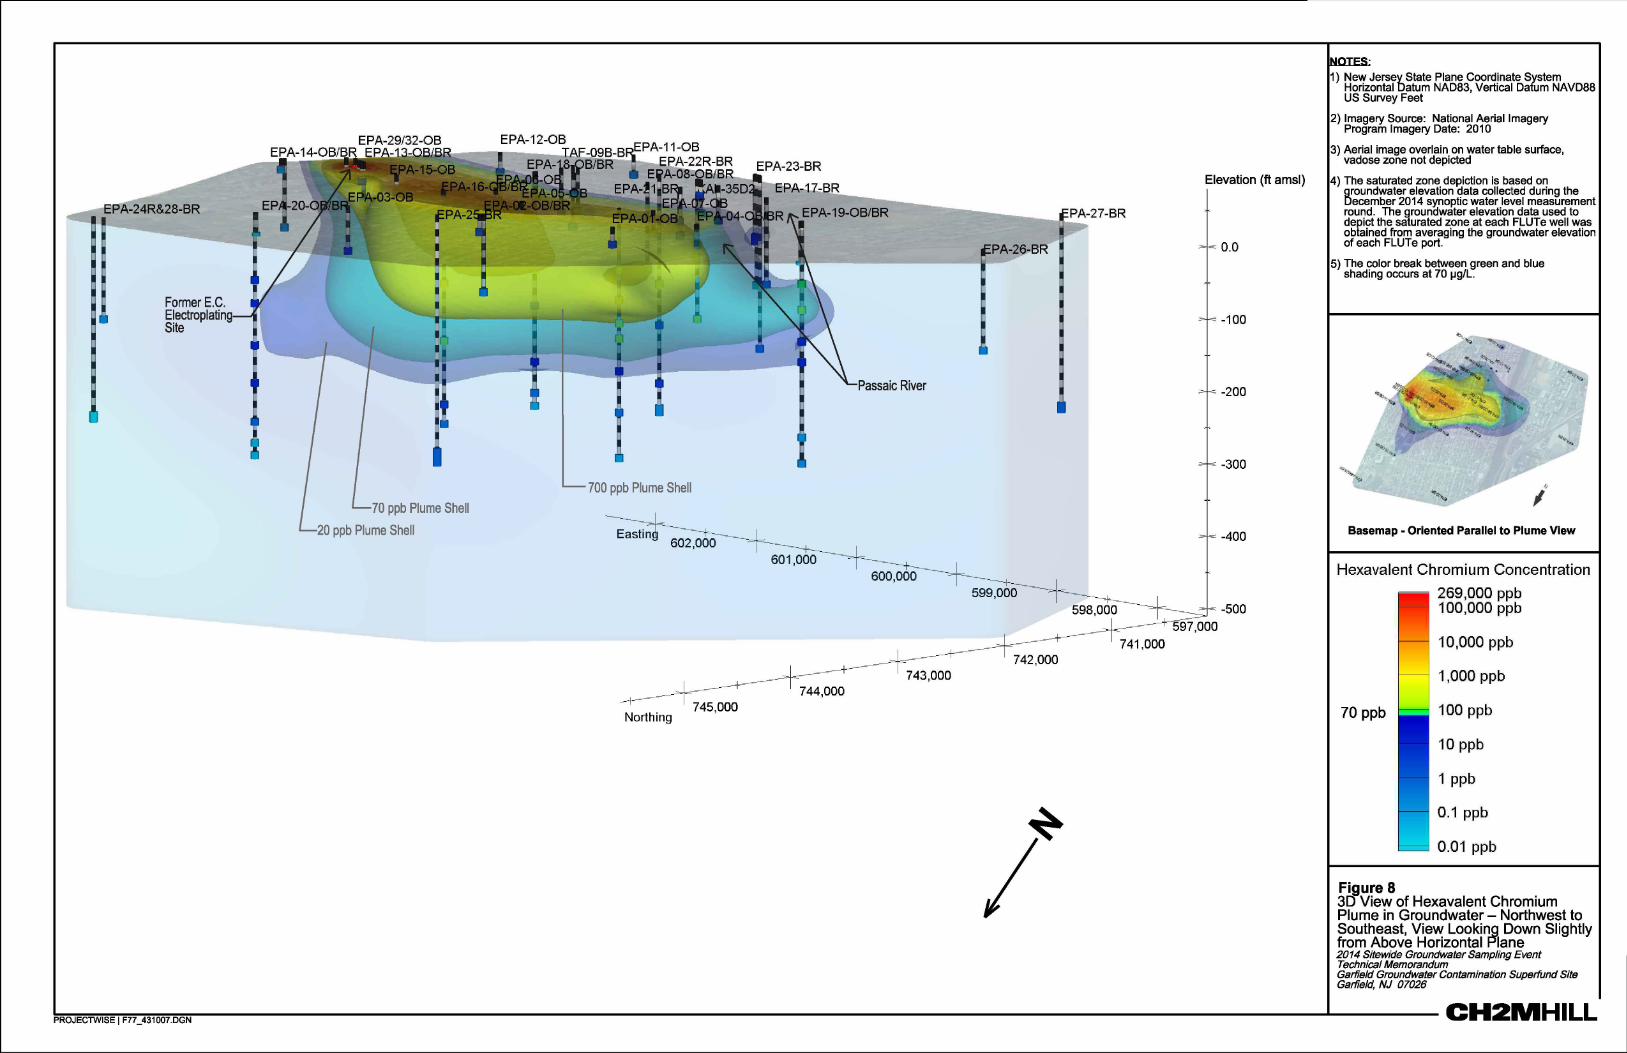
Results from the 2014 sampling event were entered into the 3D visualization software program Mining Visualization System (MVS) developed by C-Tech Development Corporation. The software was used to create a 3D image of the extent of Cr(VI) contamination in the overburden and bedrock aquifers based on the laboratory analytical data from the 2014 sitewide groundwater sampling event. The 3D images are presented in this memorandum to help visually convey the spatial distribution and relative concentrations of the Cr(VI) plume in groundwater. Figures 6, 7, and 8 present images of the 3D Cr(VI) plume in the overburden and bedrock aquifers from three different perspectives.
The MVS software also was used to estimate the volume of the Cr(VI) plume in groundwater beneath the site. The boundaries of the plume for the volumetric estimate/calculation were defined as the 3D extent of groundwater with Cr(VI) concentrations equal to or greater than the NJDEP GWQS of 70 µg/L. The porosity values that are required to estimate the plume volume using MVS were averaged from analytical soil porosity values obtained during the 2012 RI from borehole locations EPA-18-OB through EPA-20-OB for overburden material. The matrix porosity used for overburden soils and weathered bedrock (together comprising the overburden aquifer) was 0.35 (35 percent). The matrix porosity value for bedrock aquifer was obtained from the results of the matrix diffusion study (University of Guelph 2013). The average porosity value determined by the matrix diffusion study performed at EPA-21-BR is 0.10 (10 percent).
The estimated volume of groundwater with concentrations above the NJDEP GWQS beneath the site, as calculated from the 2014 sampling event, is approximately 815 million gallons. Approximately 46 percent (378 million gallons) of the contaminated groundwater is located within the overburden aquifer, and 54 percent (436 million gallons) of the volume is within the bedrock (Brunswick) aquifer. This is similar to the volumetric size estimate that was calculated by MVS for the RIR (CH2M HILL 2014a): 785 million gallons, which was approximately 50 percent each overburden and bedrock plume volume. The relative location and extent of the sample points in the 2012 data set relative to the 2014 data set (e.g., the packer testing results from the former ECE production well were included in the 2012 data set but not in the 2014 data set, the four overburden pilot study wells at the ECE property were included in the 2014 data set but were not part of the 2012 data set, etc.) in addition to the variation in Cr(VI) analytical results resulted in the different volumetric size estimate between the two data sets.
2014 SITEWIDE GROUNDWATER SAMPLING TECHNICAL MEMORANDUM, GARFIELD GROUNDWATER CONTAMINATION SUPERFUND SITE, GARFIELD, NEW JERSEY
EN0710151004MKE 5
The 3D MVS depictions on Figures 6, 7, and 8, show the plume at the highest concentration (bright red color) at the ECE property. As previously observed during the RI, the shape of the plume extends north toward monitoring well EPA-20-BR although at concentrations lower than the NJDEP GWQS of 70 µg/L. It extends, south just beyond EPA-22R-BR, and west just beyond EPA-19-BR. The plume is unbound to the east/southeast of the ECE property because no sample points are in that area. The Cr(VI) plume is interpolated by MVS to extend to a relatively uniform maximum depth of approximately 230 feet below mean sea level below the central portion of the plume. The maximum plume depth is interpolated to be slightly shallower at approximately 180 feet below mean sea level at the western and northeastern edges of the plume.
Investigation-derived Waste Management Investigation-derived waste (IDW) created throughout the sampling event was stored within the ECE property and stored in 55-gallon drums.
Two IDW samples were collected and analyzed by a subcontracted laboratory (ALS) for the following:
• Hexavalent chromium, target compound list volatile organics, semivolatile organics, pesticides, polychlorinated biphenyls, target analyte list metals (including mercury and cyanide), total petroleum hydrocarbons – gasoline and diesel ranges, corrosivity, and ignitability
Portions of wastewater from the sampling event were classified as hazardous and non-hazardous based on analytical results of the IDW samples collected.
Two 55-gallons drums of hazardous wastewater were disposed of by Capital Environmental at the EQ Pennsylvania (Envirite of PA) facility in York, Pennsylvania. Seven 55-gallon drums of non-hazardous wastewater was transported to Environmental Recovery of Lancaster, Pennsylvania by Capitol Environmental.
Pilot Study Groundwater Data Results and Conclusions The pilot study-specific groundwater data results are discussed in detail in the Results of the In Situ Reduction Pilot Study Test memorandum (CH2M HILL 2015) but chromium-related results are summarized below.
• The Pilot Study found that the injection of organic substrates such as EVO can stimulate the anaerobic reduction of Cr(VI), however only where the pH of groundwater was neutral. For example, after in situ EVO injections the resultant reduction in Cr(VI) concentrations in EPA-13-OB (just downgradient of the ECE source area where pH is neutral) was 97 percent. Where pH was acidic (approximately 3 to 6) at the ECE source area, microbial activity and biological reduction of Cr(VI) was inhibited. The lack of Cr(VI) reduction at the source area also could be associated with toxic effects of high Cr(VI) concentrations (above approximately 200,000 μg/L) on microbial growth.
• Where the greatest Cr(VI) reductions were observed at downgradient wells EPA-13-OB and EPA-30-OB, geochemical parameters indicated that EVO injections created reducing conditions, as indicated by low ORP (less than -200 mV), reduced nitrate concentrations (less than 1 mg/L), reduced iron and manganese concentrations, and the generation of methane. Similarly, where Cr(VI) reduction was not observed in areas of low pH, geochemical parameters showed that groundwater conditions remained oxidizing (approximately 100 to 500 mV), with limited reduction of terminal electron acceptor concentrations.
• Dissolved total chromium was analyzed to evaluate the potential for organic acids resulting from the breakdown of EVO to form soluble complexes with Cr(III). The complexation of Cr(III) by organic acids occurs after Cr(VI) is reduced either biologically or abiotically, so the presence of organic acids

2014 SITEWIDE GROUNDWATER SAMPLING TECHNICAL MEMORANDUM, GARFIELD GROUNDWATER CONTAMINATION SUPERFUND SITE, GARFIELD, NEW JERSEY
6 EN0710151004MKE
does not have a bearing on biotic or abiotic Cr(VI) reduction. The complexes, while stable and not likely to re-oxidize to Cr(VI), would allow Cr(III) to remain in solution at higher pH levels where Cr(III) is expected to precipitate. In most of the monitoring wells, Cr(VI) composed a majority of the dissolved chromium. In downgradient monitoring well EPA-13-OB, Cr(III) made up approximately 70 to 80 percent of the dissolved chromium, an indication that Cr(III) had complexed with organic acids. However, the concentration of dissolved chromium in this well was still below the NJDEP Groundwater Quality Standard (GWQS) of 70 μg/L. Compared to the greater than two-orders-of magnitude reduction of total chromium and Cr(VI) concentrations in this well, the magnitude of Cr(III) complexation is not significant.
Summary and Conclusions The following are the conclusions of the 2014 sitewide groundwater sampling event:
• The inferred groundwater flow direction in the overburden and bedrock aquifers is west to east toward the Passaic River. The groundwater elevation contours and flow direction were similar between the 2012 and 2014 data.
• The Cr(VI) concentrations from the 2014 sitewide groundwater sampling event were generally similar to those from the 2012 sampling events with the exception of EPA-21-BR-225, which displayed concentrations in 2014 that were approximately two orders of magnitude higher than observed in 2012.
• The estimated volume of groundwater with concentrations above the NJDEP GWQS beneath the site, as calculated from the 2014 sampling event is approximately 815 million gallons. Approximately 46 percent (378 million gallons) of the contaminated groundwater is located within the overburden aquifer, and 54 percent (436 million gallons) of the volume is within the bedrock (Brunswick) aquifer.
References CH2M HILL. 2012. Remedial Investigation Uniform Federal Policy for Quality Assurance Project Plan, Garfield Groundwater Contamination Superfund Site, Garfield, Bergen County, New Jersey.
CH2M HILL. 2014a. Remedial Investigation Report, Garfield Groundwater Contamination Superfund Site, Garfield, Bergen County, New Jersey.
CH2M HILL. 2014b. Addendum to the Remedial Investigation Uniform Federal Policy for Quality Assurance Project Plan, Garfield Groundwater Contamination Superfund Site, Garfield, Bergen County, New Jersey.
CH2M. 2015. Results of the In Situ Reduction Pilot Study Test, Garfield Groundwater Contamination Superfund Site, Garfield, Bergen County, New Jersey.
University of Guelph, School of Engineering (Guelph). 2013. Data Report on Rock Core Subsampling and Hexavalent Chromium Analysis at the Garfield Chromium Contamination Superfund Site, Garfield, NJ.
2014 SITEWIDE GROUNDWATER SAMPLING TECHNICAL MEMORANDUM, GARFIELD GROUNDWATER CONTAMINATION SUPERFUND SITE, GARFIELD, NEW JERSEY
EN0710151004MKE 7
Enclosures Tables 1 Groundwater Sample Tracking Table 2 Synoptic Groundwater Measurements - December 3, 2014 3 Concentrations in Groundwater (NJDEP GWQS) 4 Investigational Derived Waste
Figures 1 Sitewide Groundwater Sampling Event Sample Locations 2 Garfield December 2014 Overburden Groundwater Contour 3 Garfield December 2014 Bedrock Groundwater Contours 4 Garfield December 2014 Overburden Hexavalent Chromium 5 Garfield December 2014 Bedrock Hexavalent Chromium 6 View of Hexavalent Chromium Plume in Groundwater – Aerial View 7 3D View of Hexavalent Chromium Plume in Groundwater – South to North, View Looking Down
Slightly from Above Horizontal Plane 8 3D View of Hexavalent Chromium Plume in Groundwater – Northwest to Southwest, View Looking
Down Slightly from Above Horizontal Plane
Attachments 1 Field Data Sheets 2 Data Quality Evaluation

Tables
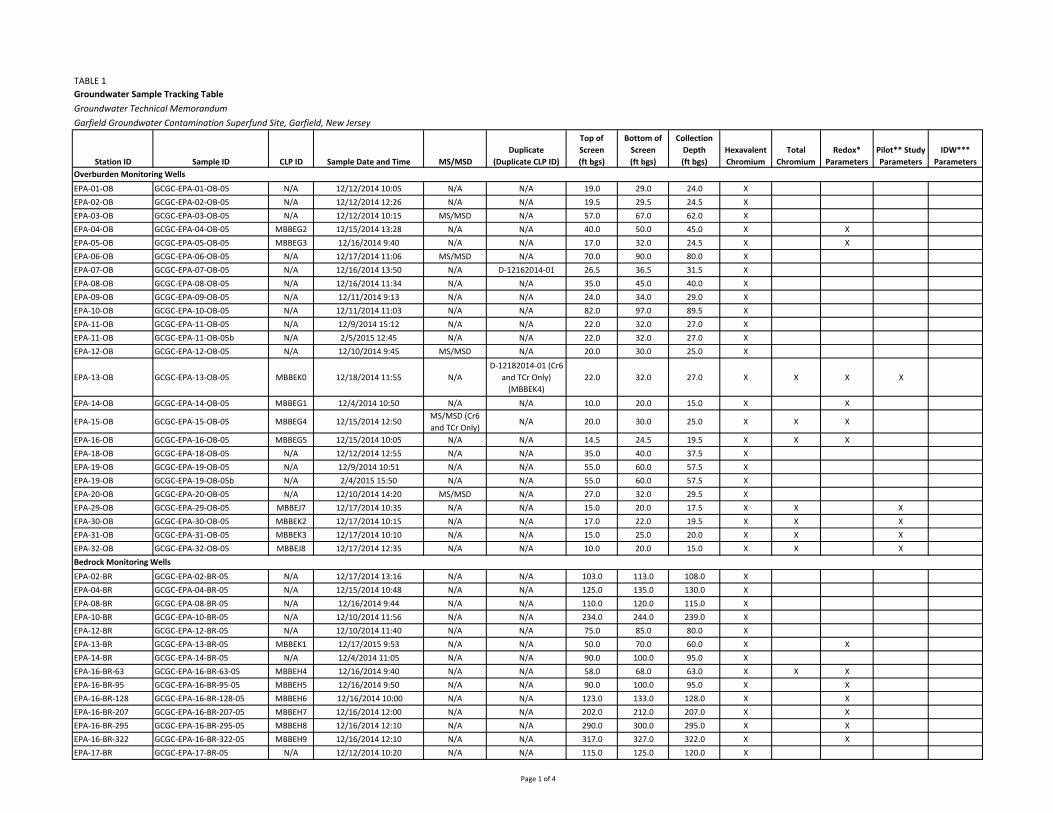
TABLE 1Groundwater Sample Tracking TableGroundwater Technical MemorandumGarfield Groundwater Contamination Superfund Site, Garfield, New Jersey
Station ID Sample ID CLP ID Sample Date and Time MS/MSDDuplicate
(Duplicate CLP ID)
Top of Screen (ft bgs)
Bottom of Screen (ft bgs)
Collection Depth(ft bgs)
Hexavalent Chromium
Total Chromium
Redox* Parameters
Pilot** Study Parameters
IDW*** Parameters
EPA‐01‐OB GCGC‐EPA‐01‐OB‐05 N/A 12/12/2014 10:05 N/A N/A 19.0 29.0 24.0 XEPA‐02‐OB GCGC‐EPA‐02‐OB‐05 N/A 12/12/2014 12:26 N/A N/A 19.5 29.5 24.5 XEPA‐03‐OB GCGC‐EPA‐03‐OB‐05 N/A 12/12/2014 10:15 MS/MSD N/A 57.0 67.0 62.0 XEPA‐04‐OB GCGC‐EPA‐04‐OB‐05 MBBEG2 12/15/2014 13:28 N/A N/A 40.0 50.0 45.0 X XEPA‐05‐OB GCGC‐EPA‐05‐OB‐05 MBBEG3 12/16/2014 9:40 N/A N/A 17.0 32.0 24.5 X XEPA‐06‐OB GCGC‐EPA‐06‐OB‐05 N/A 12/17/2014 11:06 MS/MSD N/A 70.0 90.0 80.0 XEPA‐07‐OB GCGC‐EPA‐07‐OB‐05 N/A 12/16/2014 13:50 N/A D‐12162014‐01 26.5 36.5 31.5 XEPA‐08‐OB GCGC‐EPA‐08‐OB‐05 N/A 12/16/2014 11:34 N/A N/A 35.0 45.0 40.0 XEPA‐09‐OB GCGC‐EPA‐09‐OB‐05 N/A 12/11/2014 9:13 N/A N/A 24.0 34.0 29.0 XEPA‐10‐OB GCGC‐EPA‐10‐OB‐05 N/A 12/11/2014 11:03 N/A N/A 82.0 97.0 89.5 XEPA‐11‐OB GCGC‐EPA‐11‐OB‐05 N/A 12/9/2014 15:12 N/A N/A 22.0 32.0 27.0 XEPA‐11‐OB GCGC‐EPA‐11‐OB‐05b N/A 2/5/2015 12:45 N/A N/A 22.0 32.0 27.0 XEPA‐12‐OB GCGC‐EPA‐12‐OB‐05 N/A 12/10/2014 9:45 MS/MSD N/A 20.0 30.0 25.0 X
EPA‐13‐OB GCGC‐EPA‐13‐OB‐05 MBBEK0 12/18/2014 11:55 N/AD‐12182014‐01 (Cr6
and TCr Only) (MBBEK4)
22.0 32.0 27.0 X X X X
EPA‐14‐OB GCGC‐EPA‐14‐OB‐05 MBBEG1 12/4/2014 10:50 N/A N/A 10.0 20.0 15.0 X X
EPA‐15‐OB GCGC‐EPA‐15‐OB‐05 MBBEG4 12/15/2014 12:50MS/MSD (Cr6 and TCr Only)
N/A 20.0 30.0 25.0 X X X
EPA‐16‐OB GCGC‐EPA‐16‐OB‐05 MBBEG5 12/15/2014 10:05 N/A N/A 14.5 24.5 19.5 X X XEPA‐18‐OB GCGC‐EPA‐18‐OB‐05 N/A 12/12/2014 12:55 N/A N/A 35.0 40.0 37.5 XEPA‐19‐OB GCGC‐EPA‐19‐OB‐05 N/A 12/9/2014 10:51 N/A N/A 55.0 60.0 57.5 XEPA‐19‐OB GCGC‐EPA‐19‐OB‐05b N/A 2/4/2015 15:50 N/A N/A 55.0 60.0 57.5 XEPA‐20‐OB GCGC‐EPA‐20‐OB‐05 N/A 12/10/2014 14:20 MS/MSD N/A 27.0 32.0 29.5 XEPA‐29‐OB GCGC‐EPA‐29‐OB‐05 MBBEJ7 12/17/2014 10:35 N/A N/A 15.0 20.0 17.5 X X XEPA‐30‐OB GCGC‐EPA‐30‐OB‐05 MBBEK2 12/17/2014 10:15 N/A N/A 17.0 22.0 19.5 X X XEPA‐31‐OB GCGC‐EPA‐31‐OB‐05 MBBEK3 12/17/2014 10:10 N/A N/A 15.0 25.0 20.0 X X XEPA‐32‐OB GCGC‐EPA‐32‐OB‐05 MBBEJ8 12/17/2014 12:35 N/A N/A 10.0 20.0 15.0 X X X
EPA‐02‐BR GCGC‐EPA‐02‐BR‐05 N/A 12/17/2014 13:16 N/A N/A 103.0 113.0 108.0 XEPA‐04‐BR GCGC‐EPA‐04‐BR‐05 N/A 12/15/2014 10:48 N/A N/A 125.0 135.0 130.0 XEPA‐08‐BR GCGC‐EPA‐08‐BR‐05 N/A 12/16/2014 9:44 N/A N/A 110.0 120.0 115.0 XEPA‐10‐BR GCGC‐EPA‐10‐BR‐05 N/A 12/10/2014 11:56 N/A N/A 234.0 244.0 239.0 XEPA‐12‐BR GCGC‐EPA‐12‐BR‐05 N/A 12/10/2014 11:40 N/A N/A 75.0 85.0 80.0 XEPA‐13‐BR GCGC‐EPA‐13‐BR‐05 MBBEK1 12/17/2015 9:53 N/A N/A 50.0 70.0 60.0 X XEPA‐14‐BR GCGC‐EPA‐14‐BR‐05 N/A 12/4/2014 11:05 N/A N/A 90.0 100.0 95.0 XEPA‐16‐BR‐63 GCGC‐EPA‐16‐BR‐63‐05 MBBEH4 12/16/2014 9:40 N/A N/A 58.0 68.0 63.0 X X XEPA‐16‐BR‐95 GCGC‐EPA‐16‐BR‐95‐05 MBBEH5 12/16/2014 9:50 N/A N/A 90.0 100.0 95.0 X XEPA‐16‐BR‐128 GCGC‐EPA‐16‐BR‐128‐05 MBBEH6 12/16/2014 10:00 N/A N/A 123.0 133.0 128.0 X XEPA‐16‐BR‐207 GCGC‐EPA‐16‐BR‐207‐05 MBBEH7 12/16/2014 12:00 N/A N/A 202.0 212.0 207.0 X XEPA‐16‐BR‐295 GCGC‐EPA‐16‐BR‐295‐05 MBBEH8 12/16/2014 12:10 N/A N/A 290.0 300.0 295.0 X XEPA‐16‐BR‐322 GCGC‐EPA‐16‐BR‐322‐05 MBBEH9 12/16/2014 12:10 N/A N/A 317.0 327.0 322.0 X XEPA‐17‐BR GCGC‐EPA‐17‐BR‐05 N/A 12/12/2014 10:20 N/A N/A 115.0 125.0 120.0 X
Overburden Monitoring Wells
Bedrock Monitoring Wells
Page 1 of 4
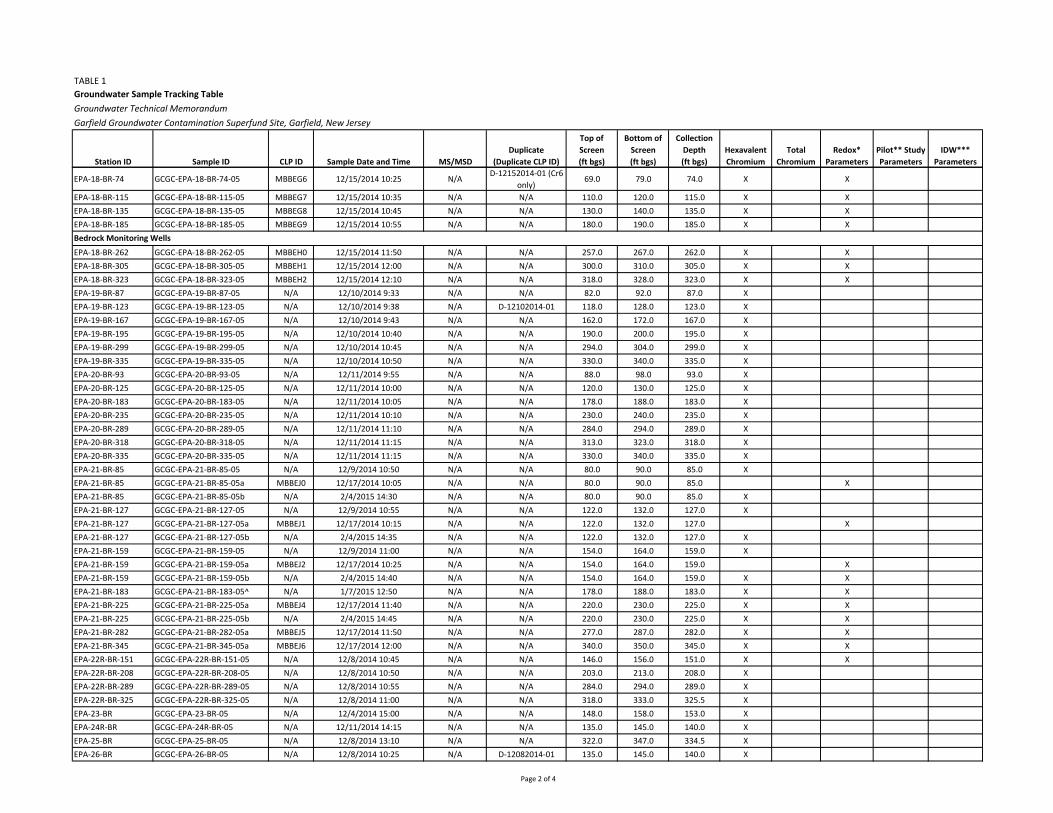
TABLE 1Groundwater Sample Tracking TableGroundwater Technical MemorandumGarfield Groundwater Contamination Superfund Site, Garfield, New Jersey
Station ID Sample ID CLP ID Sample Date and Time MS/MSDDuplicate
(Duplicate CLP ID)
Top of Screen (ft bgs)
Bottom of Screen (ft bgs)
Collection Depth(ft bgs)
Hexavalent Chromium
Total Chromium
Redox* Parameters
Pilot** Study Parameters
IDW*** Parameters
EPA‐18‐BR‐74 GCGC‐EPA‐18‐BR‐74‐05 MBBEG6 12/15/2014 10:25 N/AD‐12152014‐01 (Cr6
only)69.0 79.0 74.0 X X
EPA‐18‐BR‐115 GCGC‐EPA‐18‐BR‐115‐05 MBBEG7 12/15/2014 10:35 N/A N/A 110.0 120.0 115.0 X XEPA‐18‐BR‐135 GCGC‐EPA‐18‐BR‐135‐05 MBBEG8 12/15/2014 10:45 N/A N/A 130.0 140.0 135.0 X XEPA‐18‐BR‐185 GCGC‐EPA‐18‐BR‐185‐05 MBBEG9 12/15/2014 10:55 N/A N/A 180.0 190.0 185.0 X X
EPA‐18‐BR‐262 GCGC‐EPA‐18‐BR‐262‐05 MBBEH0 12/15/2014 11:50 N/A N/A 257.0 267.0 262.0 X XEPA‐18‐BR‐305 GCGC‐EPA‐18‐BR‐305‐05 MBBEH1 12/15/2014 12:00 N/A N/A 300.0 310.0 305.0 X XEPA‐18‐BR‐323 GCGC‐EPA‐18‐BR‐323‐05 MBBEH2 12/15/2014 12:10 N/A N/A 318.0 328.0 323.0 X XEPA‐19‐BR‐87 GCGC‐EPA‐19‐BR‐87‐05 N/A 12/10/2014 9:33 N/A N/A 82.0 92.0 87.0 XEPA‐19‐BR‐123 GCGC‐EPA‐19‐BR‐123‐05 N/A 12/10/2014 9:38 N/A D‐12102014‐01 118.0 128.0 123.0 XEPA‐19‐BR‐167 GCGC‐EPA‐19‐BR‐167‐05 N/A 12/10/2014 9:43 N/A N/A 162.0 172.0 167.0 XEPA‐19‐BR‐195 GCGC‐EPA‐19‐BR‐195‐05 N/A 12/10/2014 10:40 N/A N/A 190.0 200.0 195.0 XEPA‐19‐BR‐299 GCGC‐EPA‐19‐BR‐299‐05 N/A 12/10/2014 10:45 N/A N/A 294.0 304.0 299.0 XEPA‐19‐BR‐335 GCGC‐EPA‐19‐BR‐335‐05 N/A 12/10/2014 10:50 N/A N/A 330.0 340.0 335.0 XEPA‐20‐BR‐93 GCGC‐EPA‐20‐BR‐93‐05 N/A 12/11/2014 9:55 N/A N/A 88.0 98.0 93.0 XEPA‐20‐BR‐125 GCGC‐EPA‐20‐BR‐125‐05 N/A 12/11/2014 10:00 N/A N/A 120.0 130.0 125.0 XEPA‐20‐BR‐183 GCGC‐EPA‐20‐BR‐183‐05 N/A 12/11/2014 10:05 N/A N/A 178.0 188.0 183.0 XEPA‐20‐BR‐235 GCGC‐EPA‐20‐BR‐235‐05 N/A 12/11/2014 10:10 N/A N/A 230.0 240.0 235.0 XEPA‐20‐BR‐289 GCGC‐EPA‐20‐BR‐289‐05 N/A 12/11/2014 11:10 N/A N/A 284.0 294.0 289.0 XEPA‐20‐BR‐318 GCGC‐EPA‐20‐BR‐318‐05 N/A 12/11/2014 11:15 N/A N/A 313.0 323.0 318.0 XEPA‐20‐BR‐335 GCGC‐EPA‐20‐BR‐335‐05 N/A 12/11/2014 11:15 N/A N/A 330.0 340.0 335.0 XEPA‐21‐BR‐85 GCGC‐EPA‐21‐BR‐85‐05 N/A 12/9/2014 10:50 N/A N/A 80.0 90.0 85.0 XEPA‐21‐BR‐85 GCGC‐EPA‐21‐BR‐85‐05a MBBEJ0 12/17/2014 10:05 N/A N/A 80.0 90.0 85.0 XEPA‐21‐BR‐85 GCGC‐EPA‐21‐BR‐85‐05b N/A 2/4/2015 14:30 N/A N/A 80.0 90.0 85.0 XEPA‐21‐BR‐127 GCGC‐EPA‐21‐BR‐127‐05 N/A 12/9/2014 10:55 N/A N/A 122.0 132.0 127.0 XEPA‐21‐BR‐127 GCGC‐EPA‐21‐BR‐127‐05a MBBEJ1 12/17/2014 10:15 N/A N/A 122.0 132.0 127.0 XEPA‐21‐BR‐127 GCGC‐EPA‐21‐BR‐127‐05b N/A 2/4/2015 14:35 N/A N/A 122.0 132.0 127.0 XEPA‐21‐BR‐159 GCGC‐EPA‐21‐BR‐159‐05 N/A 12/9/2014 11:00 N/A N/A 154.0 164.0 159.0 XEPA‐21‐BR‐159 GCGC‐EPA‐21‐BR‐159‐05a MBBEJ2 12/17/2014 10:25 N/A N/A 154.0 164.0 159.0 XEPA‐21‐BR‐159 GCGC‐EPA‐21‐BR‐159‐05b N/A 2/4/2015 14:40 N/A N/A 154.0 164.0 159.0 X XEPA‐21‐BR‐183 GCGC‐EPA‐21‐BR‐183‐05^ N/A 1/7/2015 12:50 N/A N/A 178.0 188.0 183.0 X XEPA‐21‐BR‐225 GCGC‐EPA‐21‐BR‐225‐05a MBBEJ4 12/17/2014 11:40 N/A N/A 220.0 230.0 225.0 X XEPA‐21‐BR‐225 GCGC‐EPA‐21‐BR‐225‐05b N/A 2/4/2015 14:45 N/A N/A 220.0 230.0 225.0 X XEPA‐21‐BR‐282 GCGC‐EPA‐21‐BR‐282‐05a MBBEJ5 12/17/2014 11:50 N/A N/A 277.0 287.0 282.0 X XEPA‐21‐BR‐345 GCGC‐EPA‐21‐BR‐345‐05a MBBEJ6 12/17/2014 12:00 N/A N/A 340.0 350.0 345.0 X XEPA‐22R‐BR‐151 GCGC‐EPA‐22R‐BR‐151‐05 N/A 12/8/2014 10:45 N/A N/A 146.0 156.0 151.0 X XEPA‐22R‐BR‐208 GCGC‐EPA‐22R‐BR‐208‐05 N/A 12/8/2014 10:50 N/A N/A 203.0 213.0 208.0 XEPA‐22R‐BR‐289 GCGC‐EPA‐22R‐BR‐289‐05 N/A 12/8/2014 10:55 N/A N/A 284.0 294.0 289.0 XEPA‐22R‐BR‐325 GCGC‐EPA‐22R‐BR‐325‐05 N/A 12/8/2014 11:00 N/A N/A 318.0 333.0 325.5 XEPA‐23‐BR GCGC‐EPA‐23‐BR‐05 N/A 12/4/2014 15:00 N/A N/A 148.0 158.0 153.0 XEPA‐24R‐BR GCGC‐EPA‐24R‐BR‐05 N/A 12/11/2014 14:15 N/A N/A 135.0 145.0 140.0 XEPA‐25‐BR GCGC‐EPA‐25‐BR‐05 N/A 12/8/2014 13:10 N/A N/A 322.0 347.0 334.5 XEPA‐26‐BR GCGC‐EPA‐26‐BR‐05 N/A 12/8/2014 10:25 N/A D‐12082014‐01 135.0 145.0 140.0 X
Bedrock Monitoring Wells
Page 2 of 4
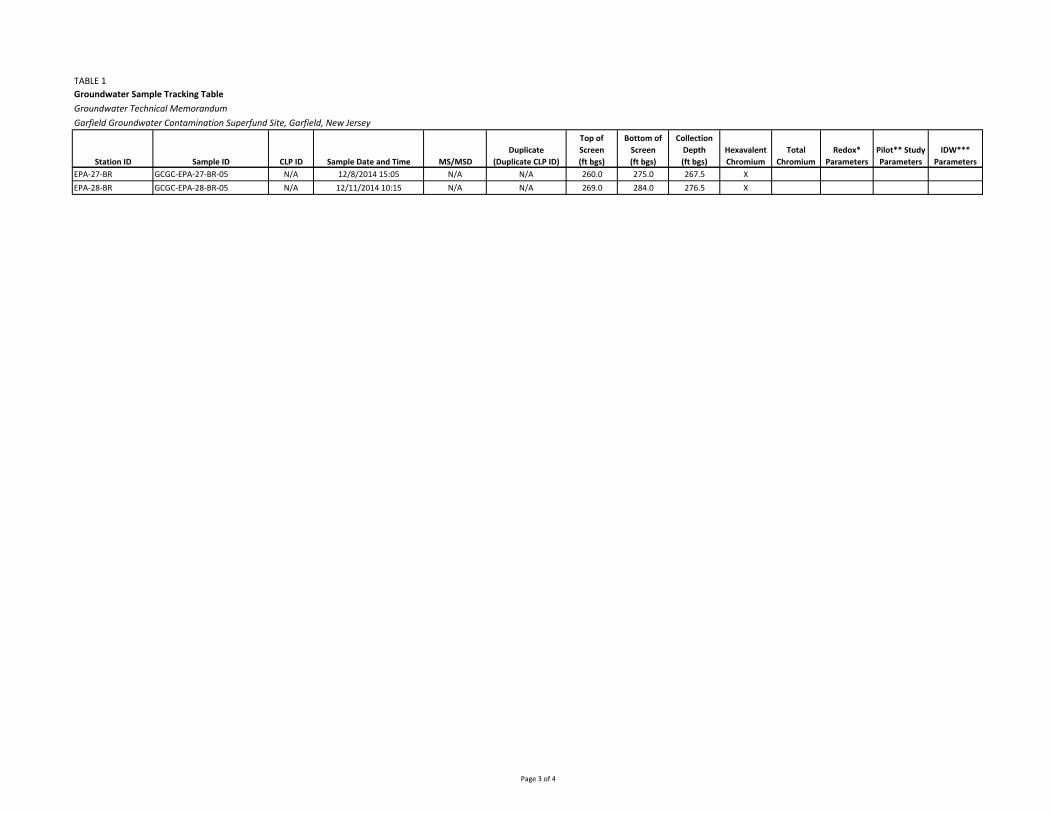
TABLE 1Groundwater Sample Tracking TableGroundwater Technical MemorandumGarfield Groundwater Contamination Superfund Site, Garfield, New Jersey
Station ID Sample ID CLP ID Sample Date and Time MS/MSDDuplicate
(Duplicate CLP ID)
Top of Screen (ft bgs)
Bottom of Screen (ft bgs)
Collection Depth(ft bgs)
Hexavalent Chromium
Total Chromium
Redox* Parameters
Pilot** Study Parameters
IDW*** Parameters
EPA‐27‐BR GCGC‐EPA‐27‐BR‐05 N/A 12/8/2014 15:05 N/A N/A 260.0 275.0 267.5 XEPA‐28‐BR GCGC‐EPA‐28‐BR‐05 N/A 12/11/2014 10:15 N/A N/A 269.0 284.0 276.5 X
Page 3 of 4

TABLE 1Groundwater Sample Tracking TableGroundwater Technical MemorandumGarfield Groundwater Contamination Superfund Site, Garfield, New Jersey
Station ID Sample ID CLP ID Sample Date and Time MS/MSDDuplicate
(Duplicate CLP ID)
Top of Screen (ft bgs)
Bottom of Screen (ft bgs)
Collection Depth(ft bgs)
Hexavalent Chromium
Total Chromium
Redox* Parameters
Pilot** Study Parameters
IDW*** Parameters
KAL‐MW 16D (overburden well)
GCGC‐KAL‐MW‐16D‐05 N/A 12/5/2014 13:43 N/A N/A 43.0 53.0 48.0 X
KAL‐MW 20D2 GCGC‐KAL‐MW‐20D2‐05 N/A 12/5/2014 12:48 N/A N/A 62.0 72.0 67.0 X
KAL‐MW‐35 (overburden well)
GCGC‐KAL‐MW‐35‐05 N/A 12/5/2014 12:00 N/A N/A 16.5 26.5 21.5 X
KAL‐MW‐35D GCGC‐KAL‐MW‐35D‐05 N/A 12/5/2014 10:15 N/A N/A 41.5 51.5 46.5 XKAL‐MW‐35D2 GCGC‐KAL‐MW‐35D2‐05 N/A 12/5/2014 10:30 N/A N/A 85.0 95.0 90.0 X
TAF‐04C‐BR GCGC‐TAF‐04C‐05 N/A 12/11/2014 16:13 N/A N/A 80.0 90.0 85.0 XTAF‐08B‐BR GCGC‐TAF‐08B‐05 N/A 12/11/2015 15:50 N/A N/A 56.0 66.0 61.0 XTAF‐09B‐BR GCGC‐TAF‐09B‐05 N/A 12/11/2014 16:55 N/A N/A 56.0 66.0 61.0 X
Equipment Blank EB‐120414 N/A 12/4/2014 15:15 N/A N/A N/A N/A N/A XEquipment Blank EB‐120514 N/A 12/5/2014 14:00 N/A N/A N/A N/A N/A XEquipment Blank EB‐120914 N/A 12/9/2014 15:00 N/A N/A N/A N/A N/A XEquipment Blank EB‐121014 N/A 12/10/2014 15:00 N/A N/A N/A N/A N/A XEquipment Blank EB‐121114 N/A 12/11/2014 15:00 N/A N/A N/A N/A N/A XEquipment Blank EB‐121214 N/A 12/12/2014 12:00 N/A N/A N/A N/A N/A XEquipment Blank EB‐121514 MBBEH3 12/15/2014 16:00 N/A N/A N/A N/A N/A X XEquipment Blank EB‐121614 N/A 12/16/2014 13:50 N/A N/A N/A N/A N/A XEquipment Blank EB‐121714 MBBEJ9 12/17/2014 16:00 N/A N/A N/A N/A N/A X XEquipment Blank EB‐020415‐01 N/A 2/4/2015 15:30 N/A N/A N/A N/A N/A X
Field Blanks FB‐020415‐01 N/A 2/4/2015 15:35 N/A N/A N/A N/A N/A X
IDW‐Wastewater IDW‐WW‐12192014‐01 N/A 12/17/2014 9:00 N/A N/A N/A N/A N/A XIDW‐Wastewater IDW‐WW‐12192014‐02 N/A 12/17/2014 9:30 N/A N/A N/A N/A N/A XNotes:BR ‐ Bedrockft ‐ feetft bgs ‐ feet below ground surfaceID ‐ IdentificationN/A ‐ Not ApplicableKAL ‐ Kalama Chemical SiteOB‐ OverburdenTAF ‐ T.A. Ferrell SiteIDW ‐ Investigation Derived Waste
** Pilot Study Parameters include the following analyses: dissolved chromium, dissolved iron, total iron, sulfide, sulfate, chloride, total organic carbon*** IDW Parameters includes volatile organic compounds, semivolatile organic compounds, pesticides, PCBs, metals including mercury and cyanide hexavalent chromium, pH, flashpoint, diesel range organics, and gasoline range organics^ The sample from EPA‐21‐BR‐183 was collected January 7th due to a blockage in the sample line during the first sample attempt in December.
* Redox Parameters include the following analyses: total organic carbon, sulfate, nitrate, dissolved iron, and dissolved manganese
IDW Samples
Equipment Blanks
T.A. Farrell Site Monitoring Wells
Kalama Site Monitoring Wells
Field Blanks
Page 4 of 4
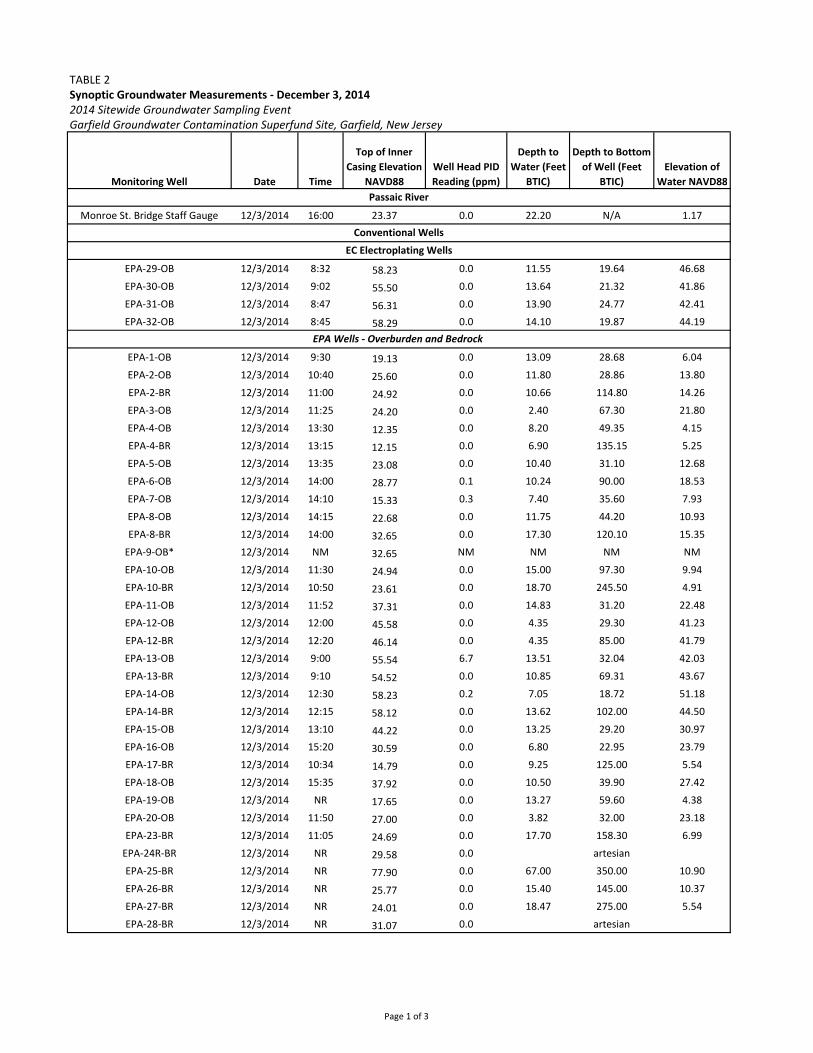
TABLE 2Synoptic Groundwater Measurements - December 3, 20142014 Sitewide Groundwater Sampling EventGarfield Groundwater Contamination Superfund Site, Garfield, New Jersey
Monitoring Well Date Time
Top of Inner Casing Elevation
NAVD88Well Head PID Reading (ppm)
Depth to Water (Feet
BTIC)
Depth to Bottom of Well (Feet
BTIC)Elevation of
Water NAVD88
Monroe St. Bridge Staff Gauge 12/3/2014 16:00 23.37 0.0 22.20 N/A 1.17
EPA-29-OB 12/3/2014 8:32 58.23 0.0 11.55 19.64 46.68EPA-30-OB 12/3/2014 9:02 55.50 0.0 13.64 21.32 41.86EPA-31-OB 12/3/2014 8:47 56.31 0.0 13.90 24.77 42.41EPA-32-OB 12/3/2014 8:45 58.29 0.0 14.10 19.87 44.19
EPA-1-OB 12/3/2014 9:30 19.13 0.0 13.09 28.68 6.04EPA-2-OB 12/3/2014 10:40 25.60 0.0 11.80 28.86 13.80EPA-2-BR 12/3/2014 11:00 24.92 0.0 10.66 114.80 14.26EPA-3-OB 12/3/2014 11:25 24.20 0.0 2.40 67.30 21.80EPA-4-OB 12/3/2014 13:30 12.35 0.0 8.20 49.35 4.15EPA-4-BR 12/3/2014 13:15 12.15 0.0 6.90 135.15 5.25EPA-5-OB 12/3/2014 13:35 23.08 0.0 10.40 31.10 12.68EPA-6-OB 12/3/2014 14:00 28.77 0.1 10.24 90.00 18.53EPA-7-OB 12/3/2014 14:10 15.33 0.3 7.40 35.60 7.93EPA-8-OB 12/3/2014 14:15 22.68 0.0 11.75 44.20 10.93EPA-8-BR 12/3/2014 14:00 32.65 0.0 17.30 120.10 15.35
EPA-9-OB* 12/3/2014 NM 32.65 NM NM NM NMEPA-10-OB 12/3/2014 11:30 24.94 0.0 15.00 97.30 9.94EPA-10-BR 12/3/2014 10:50 23.61 0.0 18.70 245.50 4.91EPA-11-OB 12/3/2014 11:52 37.31 0.0 14.83 31.20 22.48EPA-12-OB 12/3/2014 12:00 45.58 0.0 4.35 29.30 41.23EPA-12-BR 12/3/2014 12:20 46.14 0.0 4.35 85.00 41.79EPA-13-OB 12/3/2014 9:00 55.54 6.7 13.51 32.04 42.03EPA-13-BR 12/3/2014 9:10 54.52 0.0 10.85 69.31 43.67EPA-14-OB 12/3/2014 12:30 58.23 0.2 7.05 18.72 51.18EPA-14-BR 12/3/2014 12:15 58.12 0.0 13.62 102.00 44.50EPA-15-OB 12/3/2014 13:10 44.22 0.0 13.25 29.20 30.97EPA-16-OB 12/3/2014 15:20 30.59 0.0 6.80 22.95 23.79EPA-17-BR 12/3/2014 10:34 14.79 0.0 9.25 125.00 5.54EPA-18-OB 12/3/2014 15:35 37.92 0.0 10.50 39.90 27.42EPA-19-OB 12/3/2014 NR 17.65 0.0 13.27 59.60 4.38EPA-20-OB 12/3/2014 11:50 27.00 0.0 3.82 32.00 23.18EPA-23-BR 12/3/2014 11:05 24.69 0.0 17.70 158.30 6.99
EPA-24R-BR 12/3/2014 NR 29.58 0.0 artesianEPA-25-BR 12/3/2014 NR 77.90 0.0 67.00 350.00 10.90EPA-26-BR 12/3/2014 NR 25.77 0.0 15.40 145.00 10.37EPA-27-BR 12/3/2014 NR 24.01 0.0 18.47 275.00 5.54EPA-28-BR 12/3/2014 NR 31.07 0.0 artesian
Passaic River
Conventional WellsEC Electroplating Wells
EPA Wells - Overburden and Bedrock
Page 1 of 3
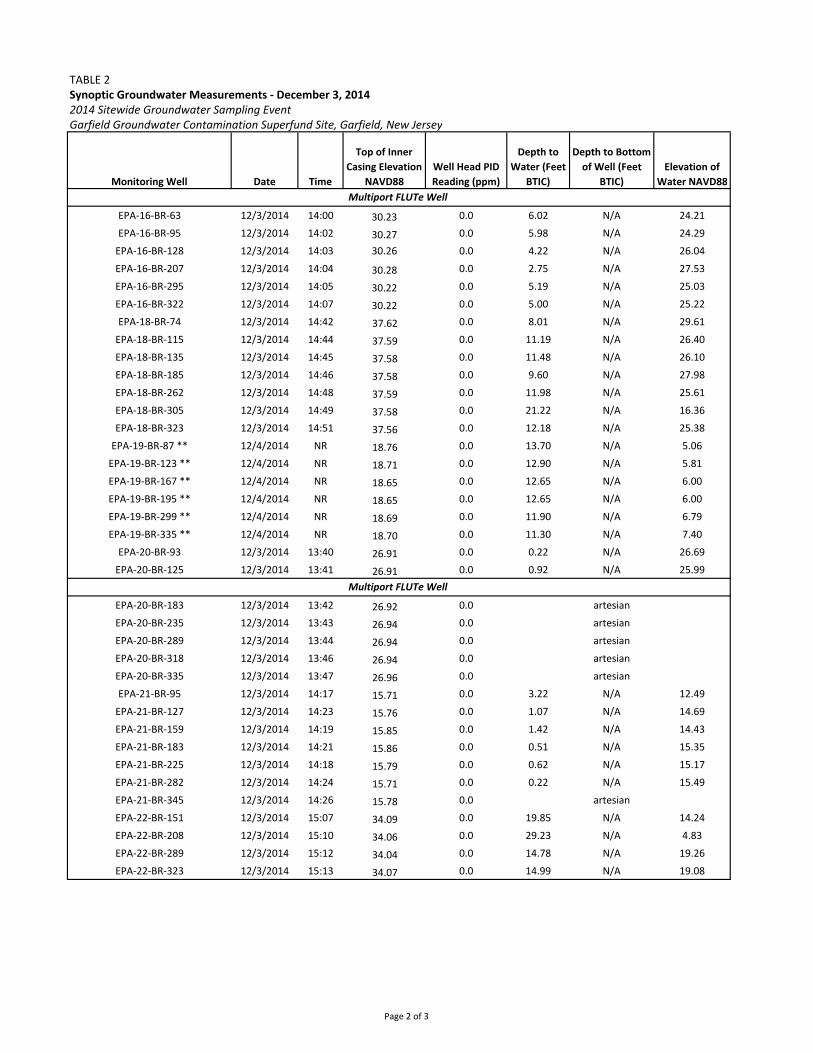
TABLE 2Synoptic Groundwater Measurements - December 3, 20142014 Sitewide Groundwater Sampling EventGarfield Groundwater Contamination Superfund Site, Garfield, New Jersey
Monitoring Well Date Time
Top of Inner Casing Elevation
NAVD88Well Head PID Reading (ppm)
Depth to Water (Feet
BTIC)
Depth to Bottom of Well (Feet
BTIC)Elevation of
Water NAVD88
EPA-16-BR-63 12/3/2014 14:00 30.23 0.0 6.02 N/A 24.21EPA-16-BR-95 12/3/2014 14:02 30.27 0.0 5.98 N/A 24.29
EPA-16-BR-128 12/3/2014 14:03 30.26 0.0 4.22 N/A 26.04EPA-16-BR-207 12/3/2014 14:04 30.28 0.0 2.75 N/A 27.53EPA-16-BR-295 12/3/2014 14:05 30.22 0.0 5.19 N/A 25.03EPA-16-BR-322 12/3/2014 14:07 30.22 0.0 5.00 N/A 25.22EPA-18-BR-74 12/3/2014 14:42 37.62 0.0 8.01 N/A 29.61
EPA-18-BR-115 12/3/2014 14:44 37.59 0.0 11.19 N/A 26.40EPA-18-BR-135 12/3/2014 14:45 37.58 0.0 11.48 N/A 26.10EPA-18-BR-185 12/3/2014 14:46 37.58 0.0 9.60 N/A 27.98EPA-18-BR-262 12/3/2014 14:48 37.59 0.0 11.98 N/A 25.61EPA-18-BR-305 12/3/2014 14:49 37.58 0.0 21.22 N/A 16.36EPA-18-BR-323 12/3/2014 14:51 37.56 0.0 12.18 N/A 25.38
EPA-19-BR-87 ** 12/4/2014 NR 18.76 0.0 13.70 N/A 5.06EPA-19-BR-123 ** 12/4/2014 NR 18.71 0.0 12.90 N/A 5.81EPA-19-BR-167 ** 12/4/2014 NR 18.65 0.0 12.65 N/A 6.00EPA-19-BR-195 ** 12/4/2014 NR 18.65 0.0 12.65 N/A 6.00EPA-19-BR-299 ** 12/4/2014 NR 18.69 0.0 11.90 N/A 6.79EPA-19-BR-335 ** 12/4/2014 NR 18.70 0.0 11.30 N/A 7.40
EPA-20-BR-93 12/3/2014 13:40 26.91 0.0 0.22 N/A 26.69EPA-20-BR-125 12/3/2014 13:41 26.91 0.0 0.92 N/A 25.99
EPA-20-BR-183 12/3/2014 13:42 26.92 0.0 artesianEPA-20-BR-235 12/3/2014 13:43 26.94 0.0 artesianEPA-20-BR-289 12/3/2014 13:44 26.94 0.0 artesianEPA-20-BR-318 12/3/2014 13:46 26.94 0.0 artesianEPA-20-BR-335 12/3/2014 13:47 26.96 0.0 artesianEPA-21-BR-95 12/3/2014 14:17 15.71 0.0 3.22 N/A 12.49
EPA-21-BR-127 12/3/2014 14:23 15.76 0.0 1.07 N/A 14.69EPA-21-BR-159 12/3/2014 14:19 15.85 0.0 1.42 N/A 14.43EPA-21-BR-183 12/3/2014 14:21 15.86 0.0 0.51 N/A 15.35EPA-21-BR-225 12/3/2014 14:18 15.79 0.0 0.62 N/A 15.17EPA-21-BR-282 12/3/2014 14:24 15.71 0.0 0.22 N/A 15.49EPA-21-BR-345 12/3/2014 14:26 15.78 0.0 artesianEPA-22-BR-151 12/3/2014 15:07 34.09 0.0 19.85 N/A 14.24EPA-22-BR-208 12/3/2014 15:10 34.06 0.0 29.23 N/A 4.83EPA-22-BR-289 12/3/2014 15:12 34.04 0.0 14.78 N/A 19.26EPA-22-BR-323 12/3/2014 15:13 34.07 0.0 14.99 N/A 19.08
Multiport FLUTe Well
Multiport FLUTe Well
Page 2 of 3
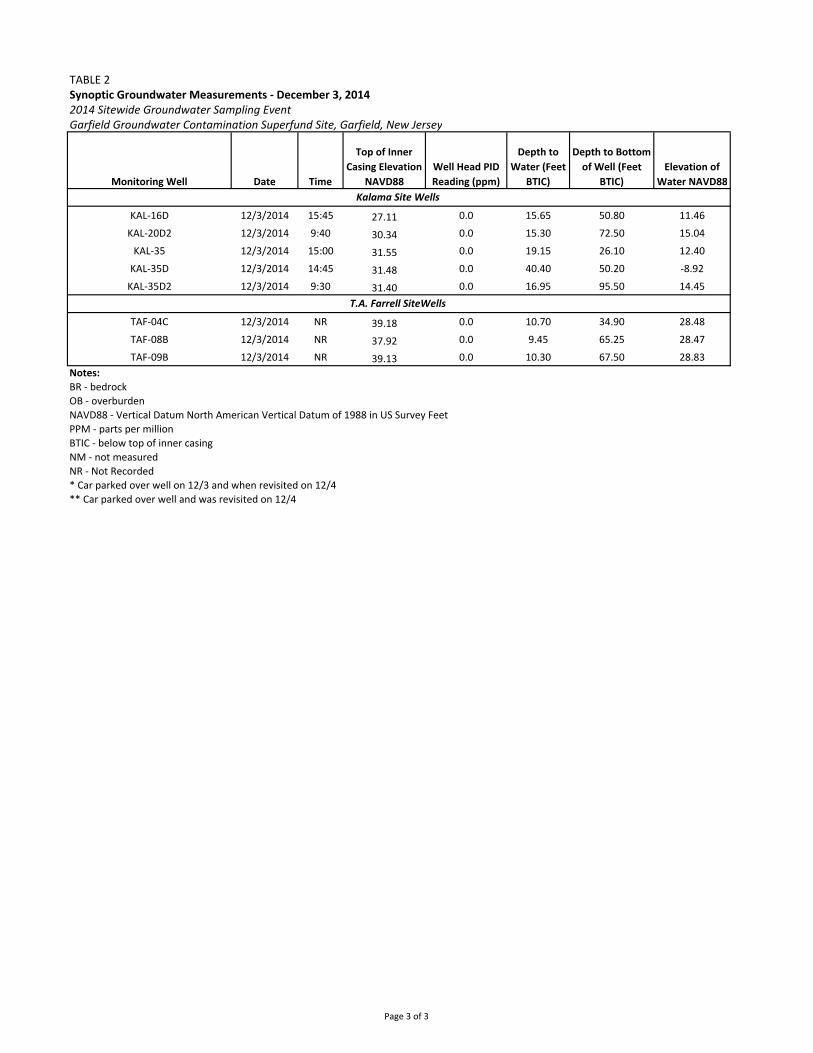
TABLE 2Synoptic Groundwater Measurements - December 3, 20142014 Sitewide Groundwater Sampling EventGarfield Groundwater Contamination Superfund Site, Garfield, New Jersey
Monitoring Well Date Time
Top of Inner Casing Elevation
NAVD88Well Head PID Reading (ppm)
Depth to Water (Feet
BTIC)
Depth to Bottom of Well (Feet
BTIC)Elevation of
Water NAVD88
KAL-16D 12/3/2014 15:45 27.11 0.0 15.65 50.80 11.46KAL-20D2 12/3/2014 9:40 30.34 0.0 15.30 72.50 15.04
KAL-35 12/3/2014 15:00 31.55 0.0 19.15 26.10 12.40KAL-35D 12/3/2014 14:45 31.48 0.0 40.40 50.20 -8.92
KAL-35D2 12/3/2014 9:30 31.40 0.0 16.95 95.50 14.45
TAF-04C 12/3/2014 NR 39.18 0.0 10.70 34.90 28.48TAF-08B 12/3/2014 NR 37.92 0.0 9.45 65.25 28.47TAF-09B 12/3/2014 NR 39.13 0.0 10.30 67.50 28.83
Notes:BR - bedrock OB - overburden NAVD88 - Vertical Datum North American Vertical Datum of 1988 in US Survey FeetPPM - parts per millionBTIC - below top of inner casingNM - not measuredNR - Not Recorded* Car parked over well on 12/3 and when revisited on 12/4** Car parked over well and was revisited on 12/4
Kalama Site Wells
T.A. Farrell SiteWells
Page 3 of 3

TABLE 3Concentrations in Groundwater (NJDEP GWQS)2014 Site Wide Groundwater Sampling Technical MemorandumGarfield Groundwater Contamination Superfund Site, Garfield, New Jersey
Location EPA-21-BR-225 EPA-21-BR-127 EPA-21-BR-127 EPA-21-BR-159 EPA-21-BR-183 EPA-21-BR-225 EPA-21-BR-282 EPA-21-BR-345 EPA-22R-BR-151 EPA-22R-BR-208Sample ID GCGC-EPA-21-BR-127-05B GCGC-EPA-21-BR-225-05A GCGC-EPA-21-BR-225-05B GCGC-EPA-21-BR-159-05B GCGC-EPA-21-BR-183-05 GCGC-EPA-21-BR-127-05B GCGC-EPA-21-BR-282-05A GCGC-EPA-21-BR-345-05A GCGC-EPA-22R-BR-151-05 GCGC-EPA-22R-BR-208-05
Sample Depth (ft) 225 127 127 159 183 225 282 345 151 208Sample Date 2/4/2015 12/17/2014 2/4/2015 2/4/2015 1/7/2015 2/4/2015 12/17/2014 12/17/2014 12/8/2014 12/8/2014
(A) NJDEP GroundwaterScreening Levels
Metals (μg/L)Chromium (hexavalent), dissolved 70 33 2940 2820 279 190 33 0.8 J 0.082 176 43
Chromium (trivalent), dissolved (calculated) 70 -- -- -- -- -- -- -- -- -- --Chromium, total 70 -- -- -- -- -- -- -- -- -- --
Groundwater Redox Parameters (mg/L)Iron, dissolved - - 0.321 0.16 J -- 0.0908 J 0.05 U 0.321 0.263 0.208 -- --
Manganese, dissolved - - 0.0583 NE 0.0112 NE -- 0.0114 NE 0.005 U 0.0583 NE 0.0215 NE 0.0277 NE -- --Nitrate/Nitrite (As N) - - 0.5 4.3 -- 4 2.2 0.5 0.05 U 0.05 U -- --
Sulfate - - 160 30 -- 18 44 160 180 200 -- --Total Organic Carbon - - 1 U 1 U -- 1 U 1 U 1 U 1 U 1 U -- --
Field ParametersConductivity (mS/cm) - - 0.523 0.551 -- 0.335 -- 0.523 0.584 0.533 0.683 0.53
Dissolved Oxygen (mg/l) - - 1.08 0.38 -- 2.81 -- 1.08 0.3 6.8 3.44 1.93ORP (mV) - - 105 -106 -- 109 -- 105 -78 -67 -66 -84
pH (standard units) - - 9.28 8.51 -- 8.52 -- 9.28 8.43 8.3 10.41 10.27Salinity (ppt) - - 0.2 0.3 -- 0.2 -- 0.2 0.3 0.3 0.3 0.3
Temperature (degree Celsius) - - 12.67 13.89 -- 12.47 -- 12.67 13.68 12.72 11.79 12.2Turbidity (NTU) - - 0 0 -- 0 -- 0 0 0 0 0
Ferrous Iron (mg/L) - - 0.00 0.00 0.01 0.01 0.00Notes:
-- = Not analyzed- - = No screening criteria establishedBold indicates the analyte was detectedShading indicates exceedance of the screening criteria
ft = FeetJ = Analyte detected at an estimated concentration
UJ = Non-detect, estimated concentrationμg/L = Micrograms per litermS/cm = millisiemen per centimetermg/L = milligram per litermV = millivoltsppt = parts per thousandNTU = nephelometric turbidity unitsN = nitrogen
U = Non-detect or not detected at significantly greater than that in an associated blank
Italic - It was determined in September 2015 that the sampling ports for EPA-21-BR-127 and EPA-21-BR-225 were not installed in sequence when the FLUTe monitor well was re-installed in December 2013
(A) - New Jersey Department of Environmental Protection(NJDEP) Groundwater Quality Standards Class IIA Constituent Values (July 2010)1 Total hardness value calculated based on assumed hardness of 100 mg/kg as CaC03.
* Note that the hexavalent concentration was higher than the total chromium concentration, so both should be considered to be estimated
S = Screening level data quality only. Chromium (trivalent) result, dissolved. Calculated by subtracting hexavalent chromium from chromium, dissolved.
Page 1 of 3

TABLE 3Concentrations in Groundwater (NJDEP GWQS)2014 Site Wide Groundwater Sampling Technical MemorandumGarfield Groundwater Contamination Superfund Site, Garfield, New Jersey
LocationSample ID
Sample Depth (ft)Sample Date
(A) NJDEP GroundwaterScreening Levels
Metals (μg/L)Chromium (hexavalent), dissolved 70
Chromium (trivalent), dissolved (calculated) 70Chromium, total 70
Groundwater Redox Parameters (mg/L)Iron, dissolved - -
Manganese, dissolved - -Nitrate/Nitrite (As N) - -
Sulfate - -Total Organic Carbon - -
Field ParametersConductivity (mS/cm) - -
Dissolved Oxygen (mg/l) - -ORP (mV) - -
pH (standard units) - -Salinity (ppt) - -
Temperature (degree Celsius) - -Turbidity (NTU) - -
Ferrous Iron (mg/L) - -Notes:
-- = Not analyzed- - = No screening criteria establishedBold indicates the analyte was detectedShading indicates exceedance of the screening criteria
ft = FeetJ = Analyte detected at an estimated concentration
UJ = Non-detect, estimated concentrationμg/L = Micrograms per litermS/cm = millisiemen per centimetermg/L = milligram per litermV = millivoltsppt = parts per thousandNTU = nephelometric turbidity unitsN = nitrogen
U = Non-detect or not detected at significantly greater than that in an associated blank
Italic - It was determined in September 2015 that the sampling ports for EPA-21-BR-127 and EPA-21-BR-225 were not installed in sequence when the FLUTe monitor well was re-installed in December 2013
(A) - New Jersey Department of Environmental Protection(NJDEP) Groundwater Quality Standards Class IIA Constituent Values (July 2010)1 Total hardness value calculated based on assumed hardness of 100 mg/kg as CaC03.
* Note that the hexavalent concentration was higher than the total chromium concentration, so both should be considered to be estimated
S = Screening level data quality only. Chromium (trivalent) result, dissolved. Calculated by subtracting hexavalent chromium from chromium, dissolved.
EPA-22R-BR-289 EPA-22R-BR-325 EPA-23-BR EPA-24R-BR EPA-25-BR EPA-26-BR EPA-26-BR EPA-27-BR EPA-28-BR EPA-29-OB EPA-30-OB EPA-31-OBGCGC-EPA-22R-BR-289-05 GCGC-EPA-22R-BR-325-05 GCGC-EPA-23-BR-05 GCGC-EPA-24R-BR-05 GCGC-EPA-25-BR-05 D-12082014-01 GCGC-EPA-26-BR-05 GCGC-EPA-27-BR-05 GCGC-EPA-28-BR-05 GCGC-EPA-29-OB-05 GCGC-EPA-30-OB-05 GCGC-EPA-31-OB-05
289 325.5 153 140 334.5 140 140 267.5 276.5 17.5 19.5 2112/8/2014 12/8/2014 12/4/2014 12/11/2014 12/8/2014 12/8/2014 12/8/2014 12/8/2014 12/11/2014 12/17/2014 12/18/2014 12/18/2014
8 0.331 U 0.086 U 0.17 J 0.911 J 0.466 UB 0.469 U 0.804 J 0.033 U 213000 9880 241000-- -- -- -- -- -- -- -- -- 54000 S 0* S 29000 S-- -- -- -- -- -- -- -- -- 267000 9150 270000
-- -- -- -- -- -- -- -- -- 0.2 U 0.447 1.21 -- -- -- -- -- -- -- -- -- -- -- ---- -- -- -- -- -- -- -- -- -- -- ---- -- -- -- -- -- -- -- -- 92 68 130 -- -- -- -- -- -- -- -- -- 6.3 J 3.7 8.6
0.351 0.312 0.501 0.533 0.362 -- 0.855 0.889 0.404 1.4 1.19 1.742.11 1.97 0.45 0 3.25 -- 2.31 1.48 0 0 2.17 0-60 -65 -6 -4 91 -- 147 125 4 459 -3 331
11.65 10.15 10.75 9.07 8.92 -- 8.82 10.34 11.95 3.28 7.04 5.810.2 0.2 0.2 0.3 0.2 -- 0.4 0.4 0.2 0.7 0.6 0.9
12.71 12.59 15.04 12.2 14.07 -- 14.45 11.66 11.1 17.43 18.72 16.970 0.3 30.9 20.9 1.64 -- 8.04 18.6 20.4 7.09 7.03 36.9
0.06 0.00 0.14 0.14 0.34 -- 0.29 0.00 0.00 0.00 0.15 Error limit
Page 2 of 3

TABLE 3Concentrations in Groundwater (NJDEP GWQS)2014 Site Wide Groundwater Sampling Technical MemorandumGarfield Groundwater Contamination Superfund Site, Garfield, New Jersey
LocationSample ID
Sample Depth (ft)Sample Date
(A) NJDEP GroundwaterScreening Levels
Metals (μg/L)Chromium (hexavalent), dissolved 70
Chromium (trivalent), dissolved (calculated) 70Chromium, total 70
Groundwater Redox Parameters (mg/L)Iron, dissolved - -
Manganese, dissolved - -Nitrate/Nitrite (As N) - -
Sulfate - -Total Organic Carbon - -
Field ParametersConductivity (mS/cm) - -
Dissolved Oxygen (mg/l) - -ORP (mV) - -
pH (standard units) - -Salinity (ppt) - -
Temperature (degree Celsius) - -Turbidity (NTU) - -
Ferrous Iron (mg/L) - -Notes:
-- = Not analyzed- - = No screening criteria establishedBold indicates the analyte was detectedShading indicates exceedance of the screening criteria
ft = FeetJ = Analyte detected at an estimated concentration
UJ = Non-detect, estimated concentrationμg/L = Micrograms per litermS/cm = millisiemen per centimetermg/L = milligram per litermV = millivoltsppt = parts per thousandNTU = nephelometric turbidity unitsN = nitrogen
U = Non-detect or not detected at significantly greater than that in an associated blank
Italic - It was determined in September 2015 that the sampling ports for EPA-21-BR-127 and EPA-21-BR-225 were not installed in sequence when the FLUTe monitor well was re-installed in December 2013
(A) - New Jersey Department of Environmental Protection(NJDEP) Groundwater Quality Standards Class IIA Constituent Values (July 2010)1 Total hardness value calculated based on assumed hardness of 100 mg/kg as CaC03.
* Note that the hexavalent concentration was higher than the total chromium concentration, so both should be considered to be estimated
S = Screening level data quality only. Chromium (trivalent) result, dissolved. Calculated by subtracting hexavalent chromium from chromium, dissolved.
EPA-32-OB KAL-16D KAL-20D2 KAL-35 KAL-35D KAL-35D2 TAF-04C-BR TAF-08B-BR TAF-09B-BRGCGC-EPA-32-OB-05 GCGC-KAL-MW-16D-05 GCGC-KAL-MW-20D2-05 GCGC-KAL-MW-35-05 GCGC-KAL-MW-35D-05 GCGC-KAL-MW-35D2-05 GCGC-TAF-04C-05 GCGC-TAF-08B-05 GCGC-TAF-09B-05
15.5 48 67 21.5 46.5 90 85 61 6112/17/2014 12/5/2014 12/5/2014 12/5/2014 12/5/2014 12/5/2014 12/11/2014 12/11/2014 12/11/2014
269000 15 4 5 0.056 U 0.183 U 0.075 U 221 243000 S -- -- -- -- -- -- -- --312000 -- -- -- -- -- -- -- --
0.731 D -- -- -- -- -- -- -- ---- -- -- -- -- -- -- -- ---- -- -- -- -- -- -- -- --
150 -- -- -- -- -- -- -- --5.2 -- -- -- -- -- -- -- --
1.68 1.04 8.28 0.701 0.625 3.5 1.05 0.85 6.560.14 0 2.18 6.95 0.22 0.26 0.43 3.37 0488 20 -72 185 136 -171 -138 100 -3413.25 8.57 13.75 7.43 8.42 9.86 7.44 7.36 6.830.8 0.5 4.6 0.3 0.3 2 0.5 0.4 3.6
17.87 14.96 15.44 16.97 15.29 13.4 9.83 13.96 14.914.39 2.96 1.23 0.99 4.34 20.2 1.94 1.9 98.60.27 0.15 2.87 0.00 0.06 0.07 0.72 0.00 0.63
Page 3 of 3
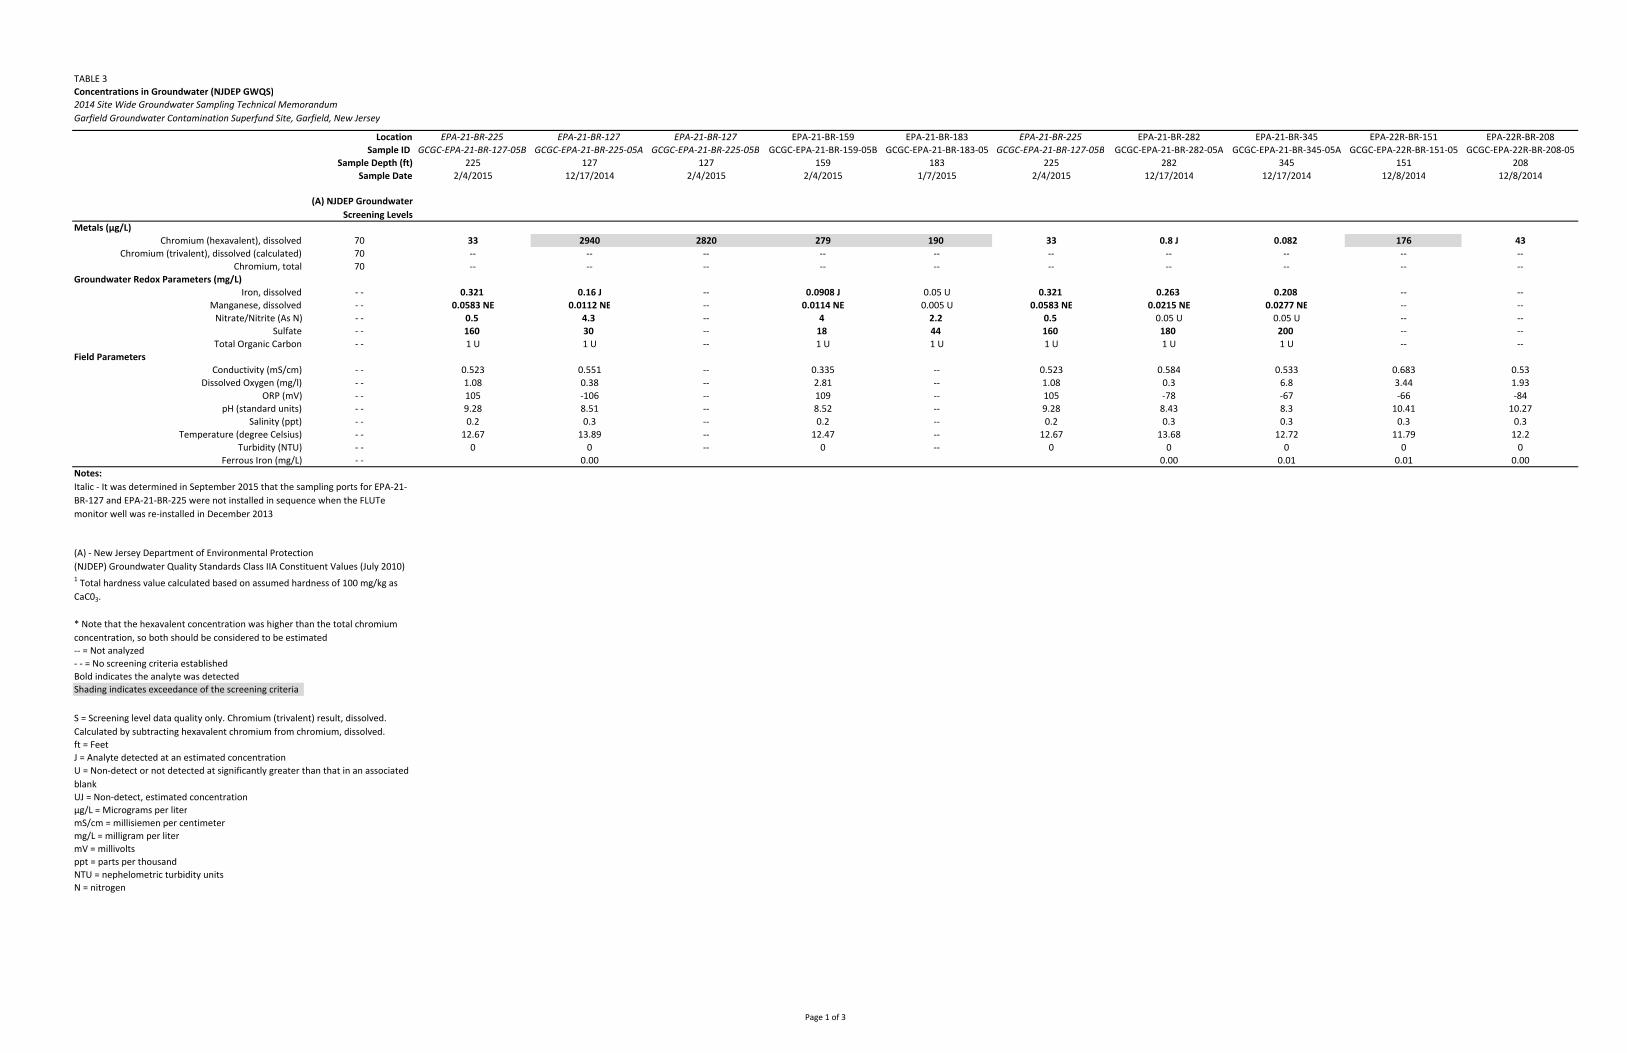
TABLE 3Concentrations in Groundwater (NJDEP GWQS)2014 Site Wide Groundwater Sampling Technical MemorandumGarfield Groundwater Contamination Superfund Site, Garfield, New Jersey
Location EPA-21-BR-225 EPA-21-BR-127 EPA-21-BR-127 EPA-21-BR-159 EPA-21-BR-183 EPA-21-BR-225 EPA-21-BR-282 EPA-21-BR-345 EPA-22R-BR-151 EPA-22R-BR-208Sample ID GCGC-EPA-21-BR-127-05B GCGC-EPA-21-BR-225-05A GCGC-EPA-21-BR-225-05B GCGC-EPA-21-BR-159-05B GCGC-EPA-21-BR-183-05 GCGC-EPA-21-BR-127-05B GCGC-EPA-21-BR-282-05A GCGC-EPA-21-BR-345-05A GCGC-EPA-22R-BR-151-05 GCGC-EPA-22R-BR-208-05
Sample Depth (ft) 225 127 127 159 183 225 282 345 151 208Sample Date 2/4/2015 12/17/2014 2/4/2015 2/4/2015 1/7/2015 2/4/2015 12/17/2014 12/17/2014 12/8/2014 12/8/2014
(A) NJDEP GroundwaterScreening Levels
Metals (μg/L)Chromium (hexavalent), dissolved 70 33 2940 2820 279 190 33 0.8 J 0.082 176 43
Chromium (trivalent), dissolved (calculated) 70 -- -- -- -- -- -- -- -- -- --Chromium, total 70 -- -- -- -- -- -- -- -- -- --
Groundwater Redox Parameters (mg/L)Iron, dissolved - - 0.321 0.16 J -- 0.0908 J 0.05 U 0.321 0.263 0.208 -- --
Manganese, dissolved - - 0.0583 NE 0.0112 NE -- 0.0114 NE 0.005 U 0.0583 NE 0.0215 NE 0.0277 NE -- --Nitrate/Nitrite (As N) - - 0.5 4.3 -- 4 2.2 0.5 0.05 U 0.05 U -- --
Sulfate - - 160 30 -- 18 44 160 180 200 -- --Total Organic Carbon - - 1 U 1 U -- 1 U 1 U 1 U 1 U 1 U -- --
Field ParametersConductivity (mS/cm) - - 0.523 0.551 -- 0.335 -- 0.523 0.584 0.533 0.683 0.53
Dissolved Oxygen (mg/l) - - 1.08 0.38 -- 2.81 -- 1.08 0.3 6.8 3.44 1.93ORP (mV) - - 105 -106 -- 109 -- 105 -78 -67 -66 -84
pH (standard units) - - 9.28 8.51 -- 8.52 -- 9.28 8.43 8.3 10.41 10.27Salinity (ppt) - - 0.2 0.3 -- 0.2 -- 0.2 0.3 0.3 0.3 0.3
Temperature (degree Celsius) - - 12.67 13.89 -- 12.47 -- 12.67 13.68 12.72 11.79 12.2Turbidity (NTU) - - 0 0 -- 0 -- 0 0 0 0 0
Ferrous Iron (mg/L) - - 0.00 0.00 0.01 0.01 0.00Notes:
-- = Not analyzed- - = No screening criteria establishedBold indicates the analyte was detectedShading indicates exceedance of the screening criteria
ft = FeetJ = Analyte detected at an estimated concentration
UJ = Non-detect, estimated concentrationμg/L = Micrograms per litermS/cm = millisiemen per centimetermg/L = milligram per litermV = millivoltsppt = parts per thousandNTU = nephelometric turbidity unitsN = nitrogen
U = Non-detect or not detected at significantly greater than that in an associated blank
Italic - It was determined in September 2015 that the sampling ports for EPA-21-BR-127 and EPA-21-BR-225 were not installed in sequence when the FLUTe monitor well was re-installed in December 2013
(A) - New Jersey Department of Environmental Protection(NJDEP) Groundwater Quality Standards Class IIA Constituent Values (July 2010)1 Total hardness value calculated based on assumed hardness of 100 mg/kg as CaC03.
* Note that the hexavalent concentration was higher than the total chromium concentration, so both should be considered to be estimated
S = Screening level data quality only. Chromium (trivalent) result, dissolved. Calculated by subtracting hexavalent chromium from chromium, dissolved.
Page 1 of 3
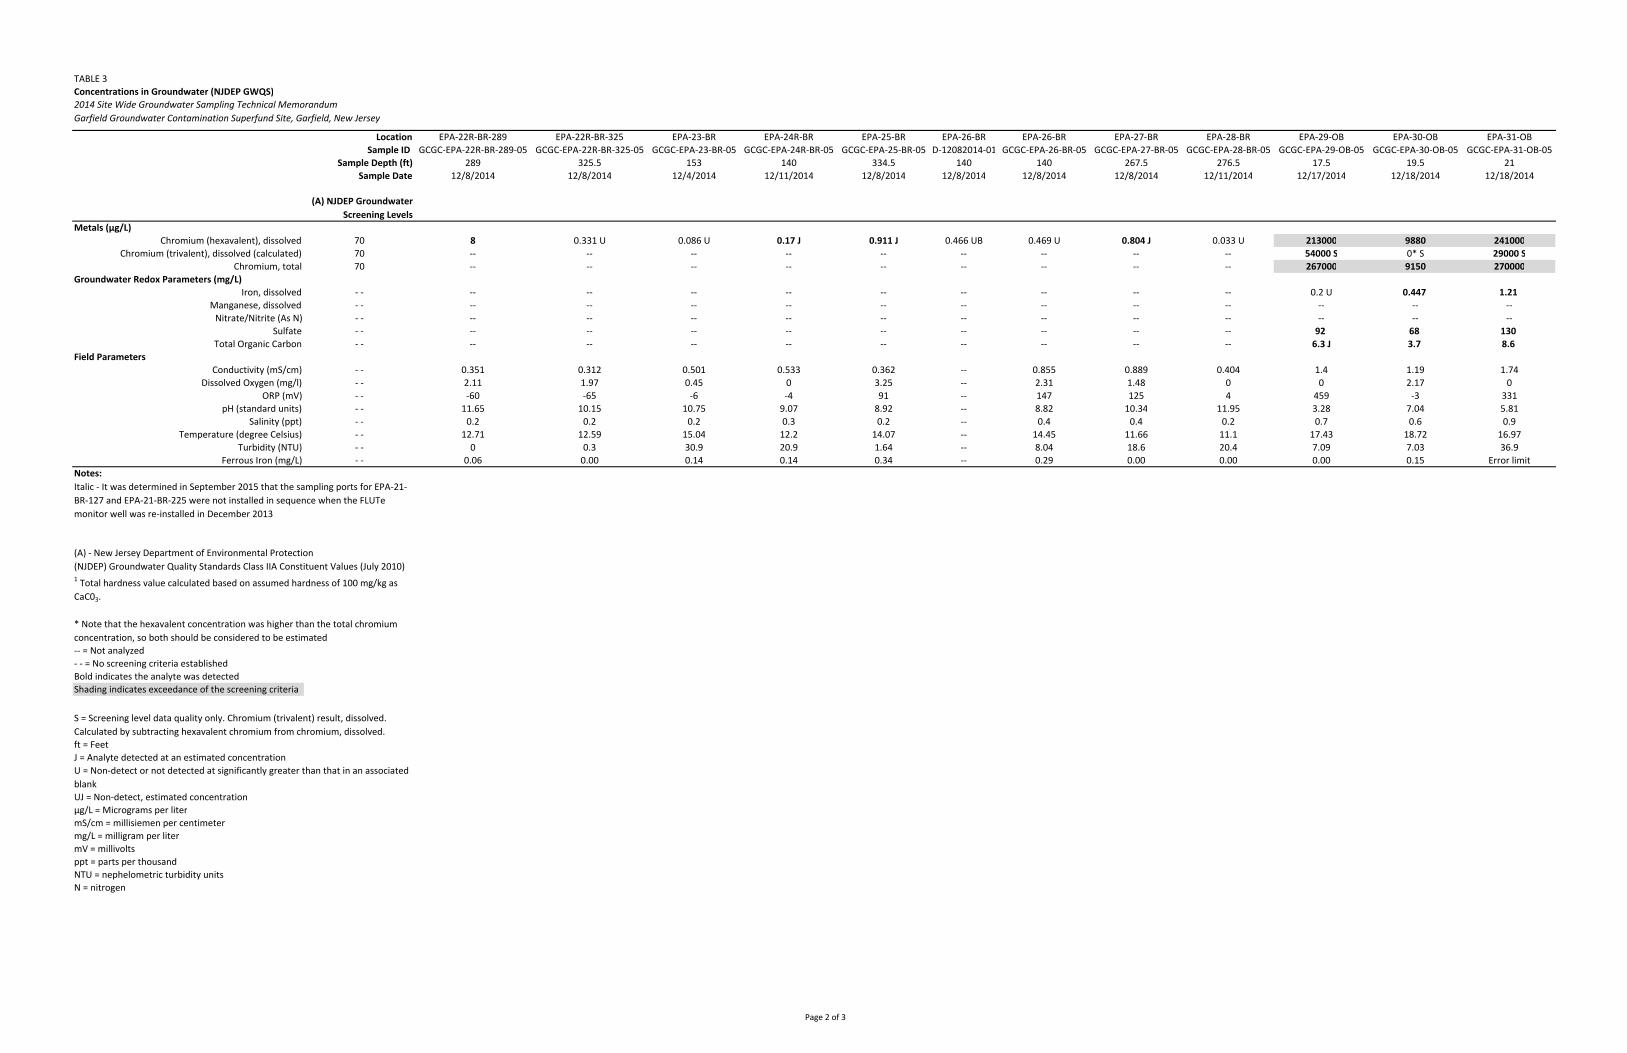
TABLE 3Concentrations in Groundwater (NJDEP GWQS)2014 Site Wide Groundwater Sampling Technical MemorandumGarfield Groundwater Contamination Superfund Site, Garfield, New Jersey
LocationSample ID
Sample Depth (ft)Sample Date
(A) NJDEP GroundwaterScreening Levels
Metals (μg/L)Chromium (hexavalent), dissolved 70
Chromium (trivalent), dissolved (calculated) 70Chromium, total 70
Groundwater Redox Parameters (mg/L)Iron, dissolved - -
Manganese, dissolved - -Nitrate/Nitrite (As N) - -
Sulfate - -Total Organic Carbon - -
Field ParametersConductivity (mS/cm) - -
Dissolved Oxygen (mg/l) - -ORP (mV) - -
pH (standard units) - -Salinity (ppt) - -
Temperature (degree Celsius) - -Turbidity (NTU) - -
Ferrous Iron (mg/L) - -Notes:
-- = Not analyzed- - = No screening criteria establishedBold indicates the analyte was detectedShading indicates exceedance of the screening criteria
ft = FeetJ = Analyte detected at an estimated concentration
UJ = Non-detect, estimated concentrationμg/L = Micrograms per litermS/cm = millisiemen per centimetermg/L = milligram per litermV = millivoltsppt = parts per thousandNTU = nephelometric turbidity unitsN = nitrogen
U = Non-detect or not detected at significantly greater than that in an associated blank
Italic - It was determined in September 2015 that the sampling ports for EPA-21-BR-127 and EPA-21-BR-225 were not installed in sequence when the FLUTe monitor well was re-installed in December 2013
(A) - New Jersey Department of Environmental Protection(NJDEP) Groundwater Quality Standards Class IIA Constituent Values (July 2010)1 Total hardness value calculated based on assumed hardness of 100 mg/kg as CaC03.
* Note that the hexavalent concentration was higher than the total chromium concentration, so both should be considered to be estimated
S = Screening level data quality only. Chromium (trivalent) result, dissolved. Calculated by subtracting hexavalent chromium from chromium, dissolved.
EPA-22R-BR-289 EPA-22R-BR-325 EPA-23-BR EPA-24R-BR EPA-25-BR EPA-26-BR EPA-26-BR EPA-27-BR EPA-28-BR EPA-29-OB EPA-30-OB EPA-31-OBGCGC-EPA-22R-BR-289-05 GCGC-EPA-22R-BR-325-05 GCGC-EPA-23-BR-05 GCGC-EPA-24R-BR-05 GCGC-EPA-25-BR-05 D-12082014-01 GCGC-EPA-26-BR-05 GCGC-EPA-27-BR-05 GCGC-EPA-28-BR-05 GCGC-EPA-29-OB-05 GCGC-EPA-30-OB-05 GCGC-EPA-31-OB-05
289 325.5 153 140 334.5 140 140 267.5 276.5 17.5 19.5 2112/8/2014 12/8/2014 12/4/2014 12/11/2014 12/8/2014 12/8/2014 12/8/2014 12/8/2014 12/11/2014 12/17/2014 12/18/2014 12/18/2014
8 0.331 U 0.086 U 0.17 J 0.911 J 0.466 UB 0.469 U 0.804 J 0.033 U 213000 9880 241000-- -- -- -- -- -- -- -- -- 54000 S 0* S 29000 S-- -- -- -- -- -- -- -- -- 267000 9150 270000
-- -- -- -- -- -- -- -- -- 0.2 U 0.447 1.21 -- -- -- -- -- -- -- -- -- -- -- ---- -- -- -- -- -- -- -- -- -- -- ---- -- -- -- -- -- -- -- -- 92 68 130 -- -- -- -- -- -- -- -- -- 6.3 J 3.7 8.6
0.351 0.312 0.501 0.533 0.362 -- 0.855 0.889 0.404 1.4 1.19 1.742.11 1.97 0.45 0 3.25 -- 2.31 1.48 0 0 2.17 0-60 -65 -6 -4 91 -- 147 125 4 459 -3 331
11.65 10.15 10.75 9.07 8.92 -- 8.82 10.34 11.95 3.28 7.04 5.810.2 0.2 0.2 0.3 0.2 -- 0.4 0.4 0.2 0.7 0.6 0.9
12.71 12.59 15.04 12.2 14.07 -- 14.45 11.66 11.1 17.43 18.72 16.970 0.3 30.9 20.9 1.64 -- 8.04 18.6 20.4 7.09 7.03 36.9
0.06 0.00 0.14 0.14 0.34 -- 0.29 0.00 0.00 0.00 0.15 Error limit
Page 2 of 3
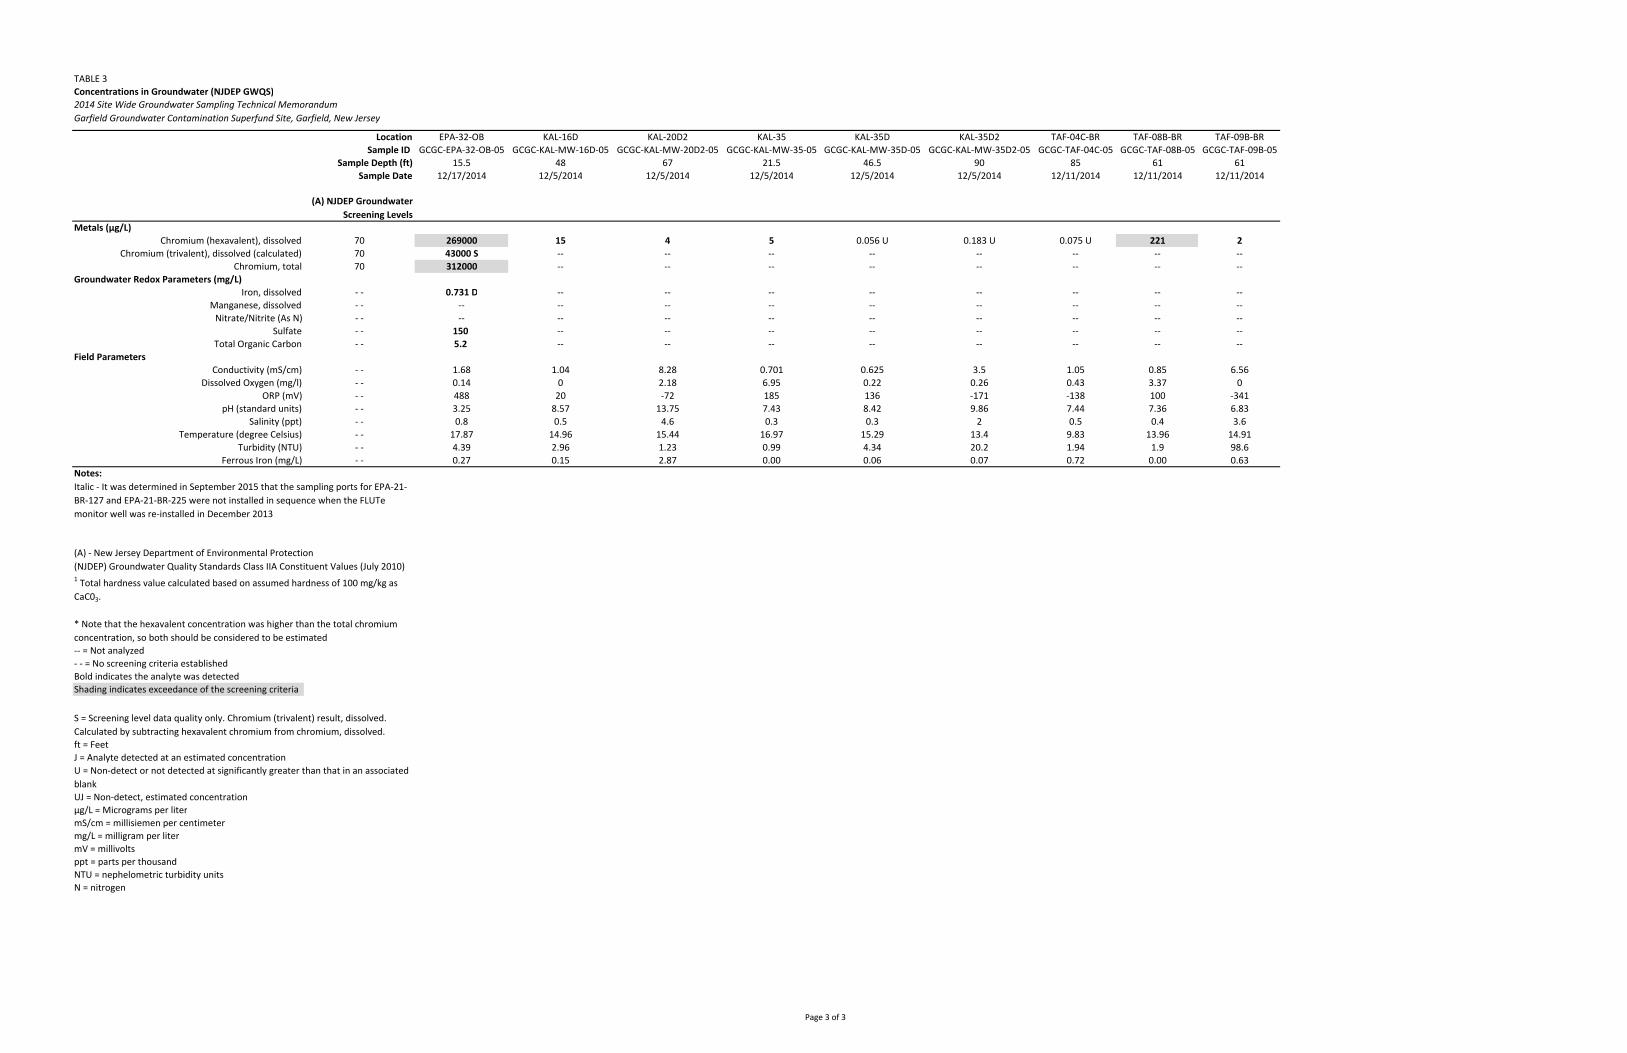
TABLE 3Concentrations in Groundwater (NJDEP GWQS)2014 Site Wide Groundwater Sampling Technical MemorandumGarfield Groundwater Contamination Superfund Site, Garfield, New Jersey
LocationSample ID
Sample Depth (ft)Sample Date
(A) NJDEP GroundwaterScreening Levels
Metals (μg/L)Chromium (hexavalent), dissolved 70
Chromium (trivalent), dissolved (calculated) 70Chromium, total 70
Groundwater Redox Parameters (mg/L)Iron, dissolved - -
Manganese, dissolved - -Nitrate/Nitrite (As N) - -
Sulfate - -Total Organic Carbon - -
Field ParametersConductivity (mS/cm) - -
Dissolved Oxygen (mg/l) - -ORP (mV) - -
pH (standard units) - -Salinity (ppt) - -
Temperature (degree Celsius) - -Turbidity (NTU) - -
Ferrous Iron (mg/L) - -Notes:
-- = Not analyzed- - = No screening criteria establishedBold indicates the analyte was detectedShading indicates exceedance of the screening criteria
ft = FeetJ = Analyte detected at an estimated concentration
UJ = Non-detect, estimated concentrationμg/L = Micrograms per litermS/cm = millisiemen per centimetermg/L = milligram per litermV = millivoltsppt = parts per thousandNTU = nephelometric turbidity unitsN = nitrogen
U = Non-detect or not detected at significantly greater than that in an associated blank
Italic - It was determined in September 2015 that the sampling ports for EPA-21-BR-127 and EPA-21-BR-225 were not installed in sequence when the FLUTe monitor well was re-installed in December 2013
(A) - New Jersey Department of Environmental Protection(NJDEP) Groundwater Quality Standards Class IIA Constituent Values (July 2010)1 Total hardness value calculated based on assumed hardness of 100 mg/kg as CaC03.
* Note that the hexavalent concentration was higher than the total chromium concentration, so both should be considered to be estimated
S = Screening level data quality only. Chromium (trivalent) result, dissolved. Calculated by subtracting hexavalent chromium from chromium, dissolved.
EPA-32-OB KAL-16D KAL-20D2 KAL-35 KAL-35D KAL-35D2 TAF-04C-BR TAF-08B-BR TAF-09B-BRGCGC-EPA-32-OB-05 GCGC-KAL-MW-16D-05 GCGC-KAL-MW-20D2-05 GCGC-KAL-MW-35-05 GCGC-KAL-MW-35D-05 GCGC-KAL-MW-35D2-05 GCGC-TAF-04C-05 GCGC-TAF-08B-05 GCGC-TAF-09B-05
15.5 48 67 21.5 46.5 90 85 61 6112/17/2014 12/5/2014 12/5/2014 12/5/2014 12/5/2014 12/5/2014 12/11/2014 12/11/2014 12/11/2014
269000 15 4 5 0.056 U 0.183 U 0.075 U 221 243000 S -- -- -- -- -- -- -- --312000 -- -- -- -- -- -- -- --
0.731 D -- -- -- -- -- -- -- ---- -- -- -- -- -- -- -- ---- -- -- -- -- -- -- -- --
150 -- -- -- -- -- -- -- --5.2 -- -- -- -- -- -- -- --
1.68 1.04 8.28 0.701 0.625 3.5 1.05 0.85 6.560.14 0 2.18 6.95 0.22 0.26 0.43 3.37 0488 20 -72 185 136 -171 -138 100 -3413.25 8.57 13.75 7.43 8.42 9.86 7.44 7.36 6.830.8 0.5 4.6 0.3 0.3 2 0.5 0.4 3.6
17.87 14.96 15.44 16.97 15.29 13.4 9.83 13.96 14.914.39 2.96 1.23 0.99 4.34 20.2 1.94 1.9 98.60.27 0.15 2.87 0.00 0.06 0.07 0.72 0.00 0.63
Page 3 of 3
Figures
P a s s a i c R i v e r
KAL-35KAL-16D
EPA-32-OBEPA-31-OB
EPA-30-OB
EPA-29-OB
EPA-20-OB
EPA-19-OB
EPA-18-OB
EPA-16-OBEPA-15-OB
EPA-14-OB
EPA-12-OB
EPA-11-OB
EPA-10-OB
EPA-09-OB
EPA-08-OB
EPA-07-OB
EPA-06-OBEPA-05-OB
EPA-04-OB
EPA-03-OB
EPA-02-OB
EPA-01-OB EPA-13-OB
KAL-35DKAL-35D2
KAL-20D2
ECE-09-BR
EPA-23-BR
EPA-21-BR
EPA-20-BR
EPA-19-BR
EPA-18-BR
EPA-17-BR
EPA-14-BR
EPA-10-BR
EPA-08-BR
EPA-04-BR
EPA-28-BR
EPA-27-BR
EPA-26-BR
EPA-25-BR
EPA-12-BR
ECE-08-BR
EPA-16-BR
EPA-02-BR
TAF-09B-BRTAF-08B-BR TAF-04C-BR
EPA-22R-BR
EPA-24R-BR
EPA-13-BR
ECE-10-BR
Figure 1 Sitewide Groundwater Sampling Event Sample Locations2014 Sitewide Groundwater Sampling Event Technical MemorandumGarfield Groundwater Contamination Superfund SiteGarfield, NJ 070260 250 500 750 1,000 Feet
NOTES:New Jersey State Plane Coordinate System Horizontal Datum NAVD83,Imagery Source: National Aerial Imagery Program, 2010.Former Garfield Municipal Well
Kalama Chemical SiteT.A. Farrell Site
C:\Work\NJO\Garfield\2015\GWsamp\GIS\ArcMap\Garfield_MonitoringWells.mxd 7/9/2015 MCB
Grand Street Lot
Overburden Monitoring WellGroundwater Montoring Well
E.C. Electoplating Site(125 Clark St., Garfield, NJ)
Abandoned Montoring Well
A
A
A
A
A
A
A
A
A
A
A
A
A
A
A
A
A
A
AA
AAAA
>>
P a s s a i c R i v e r
EPA-09-OB(24-34 ft bgs): NM
KAL-16D(43-53 ft bgs): 11.46
EPA-19-OB(55-60 ft bgs): 4.38
EPA-10-OB(82-97 ft bgs): 9.94
EPA-04-OB(40-50 ft bgs): 4.15
EPA-03-OB(57-67 ft bgs): 21.80
EPA-01-OB(19-29 ft bgs): 6.04
EPA-31-OB(16-26 ft bgs): 42.41
EPA-30-OB(17-22 ft bgs): 41.86
EPA-29-OB(15-20 ft bgs): 46.68
KAL-35(16.5-26.5 ft bgs): 12.40
EPA-18-OB(35-40 ft bgs): 27.42
EPA-15-OB(20-30 ft bgs): 30.97
EPA-14-OB(10-20 ft bgs): 51.18
EPA-12-OB(20-30 ft bgs): 41.23
EPA-11-OB(22-32 ft bgs): 22.48
EPA-08-OB(35-45 ft bgs): 10.93
EPA-06-OB(70-90 ft bgs): 18.53
EPA-05-OB(17-32 ft bgs): 12.68
EPA-07-OB(26.5-36.5 ft bgs): 7.93
EPA-02-OB(19.5-29.5 ft bgs): 13.80
EPA-16-OB(14.5-24.5 ft bgs): 23.79
EPA-13-OB(22-32 ft bgs): 42.03
EPA-32-OB(10.5-20.5 ft bgs): 44.19
Monroe St. Bridge Staff GaugeNAVD88: 1.17 20 25
15
10
30
35
405
45 50
5
Figure 2 Garfield December 2014 Overbuden Groundwater Contour2014 Sitewide Groundwater Sampling Event Technical MemorandumGarfield Groundwater Contamination Superfund SiteGarfield, NJ 07026
¯
0 250 500 750 1,000 Feet
NOTES:New Jersey State Plane Coordinate SystemHorizontal Datum NAD83, Vertical Datum NAVD88 US Survey FeetMSL - Mean Sea LevelNM - Not MeasuredImagery Source: National Aerial Imagery Program, 2010Overburden elevation ranges from 0 to -72.1 ft NAVD88
< Conventional Monitoring Well> Former Garfield Municipal Well
Kalama Chemical Site
E.C. Electoplating Site (125 Clark St., Garfield, NJ)
T.A. Farrell Site
Overburden Groundwater Contour (ft bgs)(Dashed Where Inferred)
EPA-08-OB(35-45 ft bgs): 10.93
Inferred Groundwater Flow DirectionMonitoring Well IDGroundwater Elevation (Feet NAVD88)Screen Interval (Feet Below Ground Surface)
Grand Street Lot
C:\Work\NJO\Garfield\2015\GWsamp\GIS\ArcMap\Garfield_GWcontour_Overburden.mxd 9/17/2015 MCB
A
A
AA
A
A
A
A
A
A
A
A
A
A
A
A
A
A
A
A
A
AA
A
AA
A
>>
P a s s a i c R i v e r
EPA-21-BR(122:132 ft bgs) : 14.69(154:164 ft bgs) : 14.43(178:188 ft bgs) : 15.35(220:230 ft bgs) : 15.17(277:287 ft bgs) : 15.49(340:350 ft bgs) : Artesian
EPA-20-BR(88:98 ft bgs) : Artesian(120:130 ft bgs) : Artesian(178:188 ft bgs) : Artesian(230:240 ft bgs) : Artesian(284:294 ft bgs) : Artesian(313:323 ft bgs) : Artesian(330:340 ft bgs) : Artesian
EPA-19-BR(82:92 ft bgs) : 5.06(118:128 ft bgs) : 5.81(162:172 ft bgs) : 6.00(190:200 ft bgs) : 6.00(294:304 ft bgs) : 6.79(330:340 ft bgs) : 7.40
EPA-18-BR(69:79 ft bgs) : 29.61(110:120 ft bgs) : 26.40(130:140 ft bgs) : 26.10(180:190 ft bgs) : 27.98(257:267 ft bgs) : 25.61(300:310 ft bgs) : 16.36(318:328 ft bgs) : 25.38
EPA-16-BR(58:68 ft bgs) : 24.21(90:100 ft bgs) : 24.29(123:133 ft bgs) : 26.04(202:212 ft bgs) : 27.53(290:300 ft bgs) : 25.03(317:327 ft bgs) : 25.22
EPA-22R-BR(146:156 ft bgs) : 14.24(203:213 ft bgs) : 4.83(284:294 ft bgs) : 19.26(318:333 ft bgs) : 19.08
KAL-35D2(85-95 ft bgs): 14.45
KAL-20D2(62-72 ft bgs): 15.04
EPA-14-BR(90-100 ft bgs): 44.50
EPA-13-BR(50-70 ft bgs): 43.67
EPA-12-BR(75-85 ft bgs): 41.79
TAF-09B-BR(56-66 ft bgs): 28.83
TAF-08B-BR(56-66 ft bgs): 28.47
TAF-04C-BR(80-90 ft bgs): 28.48
EPA-23-BR(148-158 ft bgs): 6.99
EPA-17-BR(115-125 ft bgs): 5.54
EPA-10-BR(234-244 ft bgs): 4.91
EPA-04-BR(125-135 ft bgs): 5.25
EPA-27-BR(260-275 ft bgs): 5.54
EPA-25-BR(322-347): 10.90
KAL-35D *
(41.5-51.5 ft bgs): -8.92
EPA-26-BR(135-145 ft bgs): 10.37
EPA-02-BR(103-113 ft bgs): 14.26
EPA-08-BR(110-120 ft bgs): 15.35
10
5
15
20
25
3035 40
10
5
Figure 3Garfield December 2014 Bedrock Groundwater Contours2014 Sitewide Groundwater Sampling Event Technical MemorandumGarfield Groundwater Contamination Superfund SiteGarfield, NJ 07026
¯
0 250 500 750 1,000 Feet
NOTES: *The groundwater elevation at KAL-35D was not used for contouring because the elevation was anomolous.Groundwater elevations collected on December 3, 2014.Multiport FLUTe well sample intervals shown.The bold water elevation was used for contouring.New Jersey State Plane Coordinate System Horizontal Datum NAVD83,Vertical Datum NAVD88 US Survey Feet.Imagery Source: National Aerial Imagery Program, 2010.
< Conventional Monitoring Well> Former Garfield Municipal Well
Kalama Chemical Site
E.C. Electoplating Site (125 Clark St., Garfield, NJ)
T.A. Farrell Site
Bedrock Groundwater Contour (ft bgs)(Dashed Where Inferred)
EPA-04-BR(125-135 ft bgs): 5.25
Inferred Groundwater Flow DirectionMonitoring Well IDGroundwater Elevation (Feet NAVD88)Screen Interval (Feet Below Ground Surface)
C:\Work\NJO\Garfield\2015\GWsamp\GIS\ArcMap\Garfield_GWcontour_Bedrock.mxd 9/16/2015 MCB
Grand Street Lot
P a s s a i c R i v e r
Figure Garfield December 2014 Overburden Hexavalent ChromiumIsoconcentration Contours2014 Sitewide Groundwater Sampling Event Technical MemorandumGarfield Groundwater Contamination Superfund SiteGarfield, NJ 070260 250 500 750 1,000 Feet
Notes:Results in µg/L (ppb)J - analyte is detected, estimated concentrationND - No DetectionRed font indicates exceedances of NJDEPGroundwater Quality StandardsNJDEP GW QUALITY StandardsChromium(hexavalent), dissolved = 70 µg/L
NOTES:New Jersey State Plane Coordinate System Horizontal Datum NAD83, Vertical Datum NAVD88 US Survey Feet.MSL - Mean Sea LevelND - Not DetectedImagery Source: National Aerial Imagery Program, 2010The hexavalent chromium analytical result from EPA-13-OB was not honored by the isoconcentration contour lines because it was anomalously low likely due to the effects of the 2014 Pilot Study.Screen Interval 1 (Feet Below Ground Surface)Screen Interval 2 (Feet NAVD88)Overburden elevation ranges from 0 to -72.1 ft NAVD88
Approximate Hexavalent ChromiumIsoconcentration Contour Lines
E.C. Electoplating Site(125 Clark St., Garfield, NJ)
C:\Work\NJO\Garfield\2015\GWsamp\GIS\ArcMap\Garfield_HexChrome_Overburden.mxd
Conventional Monitoring WellFormer Garfield Municipal WellGrand Street LotKalama Chemical SiteT.A. Farrell Site
70 µg/L (dashed where inferred)700 µg/L (dashed where inferred)7000 µg/L (dashed where inferred)70,000 µg/L (dashed where inferred)
A
A
A
A
A
A
A
A
A
A
A
A
A
A
A
AA
AA
A
>>
A
A
A
A
A
A
P a s s a i c R i v e r
Figure 5Garfield December 2014 Bedrock Hexavalent ChromiumIsoconcentration Contours2014 Sitewide Groundwater Sampling Event Technical MemorandumGarfield Groundwater Contamination Superfund SiteGarfield, NJ 07026
¯0 250 500 750 1,000 Feet
NOTES:New Jersey State Plane Coordinate SystemHorizontal Datum NAD83, Vertical Datum NAVD88 US Survey FeetMSL - Mean Sea LevelND - Not DetectedImagery Source: National Aerial Imagery ProgramImagery Date: 2010
< Conventional Monitoring Well> Former Garfield Municipal Well
Kalama Chemical SiteT.A. Farrell Site
Approximate Hexavalent ChromiumIsoconcentration Contour Lines
70 µg/L (dashed where inferred)700 µg/L (dashed where inferred)7000 µg/L (dashed where inferred)
E.C. Electoplating Site(125 Clark St., Garfield, NJ)
C:\Work\NJO\Garfield\2015\GWsamp\GIS\ArcMap\Garfield_HexChrome_Bedrock.mxd
Grand Street Lot
Notes:Results in µg/L (ppb)J - analyte is detected, estimated concentrationND - No DetectionRed font indicates exceedances of NJDEPGroundwater Quality StandardsNJDEP GW QUALITY StandardsChromium(hexavalent), dissolved = 70 µg/L
NOTE: Bedrock groundwater sample elevations range from -10.02 to -334.22 feet NAVD88, and the contours show the greatest Cr(VI) concentrations throughout the bedrock water column.
Northing
745,00
744,00
743,00
742,00
741,00
597,000
PA-24R&28-BR
tEPA-25-BR
\l!EPA-20-08/BR
Passaic River· ....... --------~
tEPA-27-BR
598,000 599,000
700 ppb Plume Shell
€PA-05-0B
EPA-06-0B
e KAL-3502 EPA-17-BR
tlEPA-23-BR
600,000 601,000 602,000
Former E.C. Electroplating Site
Easting
1 ) New Jersey State Plane Coordinate System Horizontal Datum NAD83, Vertical Datum NAVD88 US Survey Feet
2) Imagery Source: National Aerial Imagery Program Imagery Date: 2010
3) Aerial image overlain on water table surface, vadose zone not depicted
4) The saturated zone depiction is based on groundwater elevation data collected during the December 2014 synoptic water level measurement round. The groundwater elevation data used to depict the saturated zone at each FLUTe well was obtained from averaging the groundwater elevation of each FLUTe port.
5) The color break between green and blue shading occurs at 70 µg/L.
• Basemap - Oriented Parallel to Plume View
Hexavalent Chromium Concentration
269,000 ppb
70 ppb
100,000 ppb
10,000 ppb
1,000 ppb
100 ppb
10 ppb
1 ppb
0.1 ppb
0.01 ppb
Figure 6 View of Hexavalent Chromium Plume in Groundwater - Aerial View 2014 Sitewide Groundwater Sampling Event Technical Memorandum Garfield Groundwater Contamination Superfund Site Garfield, NJ 07026
PA-25-BR
t N
PA-27-BR
0.0
Passaic River -100
Northing
-200 745,000
744,000 70 ppb Plume Shell
-300 743,000
700 ppb Plume Shell
742,000
-400
741,000
-500
597,000 598,000 599,000 600,000 601,000
EPA-24R&28-BR
602,000
Former E.C. Electroplating Site
Easting
1) New Jersey State Plane Coordinate System Horizontal Datum NAD83, Vertical Datum NAVD88 US Survey Feet
2) Imagery Source: National Aerial Imagery Program Imagery Date: 2010
3) Aerial image overlain on water table surface, vadose zone not depicted
4) The saturated zone depiction is based on groundwater elevation data collected during the December 2014 synoptic water level measurement round. The groundwater elevation data used to depict the saturated zone at each FLUTe well was obtained from averaging the groundwater elevation of each FLUTe port.
5) The color break between green and blue shading occurs at 70 µg/L.
t
Basemap - Oriented Parallel to Plume View
Hexavalent Chromium Concentration
269,000 ppb
70 ppb
100,000 ppb
10,000 ppb
1,000 ppb
100 ppb
10 ppb
1 ppb
0.1 ppb
0.01 ppb
Figure 7 3D View of Hexavalent Chromium Plume in Groundwater - South to North, View Looking Down Slightly from Above Horizontal Plane 2014 Sitewide Groundwater Sampling Event Technical Memorandum Garfield Groundwater Contamination Superfund Site Garfield, NJ 07026
Former E.C. Electroplating Site
70 ppb Plume Shell
20 ppb Plume Shell
700 ppb Plume Shell
Northing
601,000
744,000 745,000
Elevation (ft amsl)
0.0
-100
Passaic River -200
-300
-400
599,000 -500
743,000
1) New Jersey State Plane Coordinate System Horizontal Datum NAD83, Vertical Datum NAVD88 US Survey Feet
2) Imagery Source: National Aerial Imagery Program Imagery Date: 2010
3) Aerial image overlain on water table surface, vadose zone not depicted
4) The saturated zone depiction is based on groundwater elevation data collected during the December 2014 synoptic water level measurement round. The groundwater elevation data used to depict the saturated zone at each FLUTe well was obtained from averaging the groundwater elevation of each FLUTe port.
5) The color break between green and blue shading occurs at 70 µg/L.
Basemap - Oriented Parallel to Plume View
Hexavalent Chromium Concentration
269,000 ppb
70 ppb
100,000 ppb
10,000 ppb
1,000 ppb
100 ppb
10 ppb
1 ppb
0.1 ppb
0.01 ppb
Figure 8 30 View of Hexavalent Chromium Plume in Groundwater - Northwest to Southeast, View Looking Down Slightly from Above Horizontal Plane 2014 Sitewide Groundwater Sampling Event Technical Memorandum Garfield Groundwater Contamination Superfund Site Garfield, NJ 07026
Attachment 1 Field Data Sheets
Attachment 2 Data Quality Evaluation