Embed Size (px)
Citation preview

Washington Student Achievement Council www.wsac.wa.gov
2014 State Need Grant Legislative Report
Rachelle Sharpe, Ph.D. Report to the Legislature December 2014

Washington Student Achievement Council
EXECUTIVE SUMMARY
The State Need Grant (SNG) program has provided funding to low-income students for more than 40 years, expanding access and affordability in higher education for Washington residents.
Research consistently links improved earnings potential and life outcomes with increasing levels of attainment in higher education. SNG has been a key tool for state lawmakers to expand access and affordability and is a critical strategy to position Washington to successfully meet its degree attainment goals.
Like many states, Washington struggled during the great recession to keep higher education affordable for students and families. Yet, even in the wake of widespread budget reductions, the Legislature deserves great credit for remaining committed to increasing SNG funding in an attempt to keep pace with public college tuition increases for the lowest-income students served by the program.
Funding for low-income students has emerged as the Council’s priority in the 2014 Strategic Action Plan to support progress toward the state’s attainment goals. In addition, the Council is developing an Affordability Framework to help inform and support future legislative higher education funding decisions.
This report augments previous work on SNG conducted by the Council and the Washington State Institute for Public Policy, and incorporates advice provided by a national expert, HCM Strategists. SNG program design and current trends are included, such as:
$303 million in SNG funding enabled over 70,100 low-income resident students to pursue a degree or credential in 2013-14.
Despite the maintained funding, the program was unable to serve more than 33,500 eligible students due to insufficient funds.
Students are less likely to receive the grant in the eligible upper-income ranges at four-year institutions.
SNG coordinates with other aid: 95 percent of students receive Pell Grant, 40 percent receive institutional or scholarship aid, and 50 percent borrow student loans.
Over 2,000 undocumented students have applied for SNG in 2014-15.
68 higher education institutions currently participate in SNG.
Following a thorough review of the recommendations provided by HCM Strategists, the Council proposes:
Strategically investing to fully fund all SNG-eligible students under current policy by 2023, starting with an additional $16 million in fiscal year (FY) 2016 and $32 million in FY 17.

Washington Student Achievement Council
Establishing in statute the policy goal and award eligibility for SNG to minimize future variability in eligibility and awards. Include the less-than-halftime enrollment category in statute.
Continuing to provide comprehensive information regarding SNG eligibility to the public on the Ready, Set, Grad website and in training materials for high school counselors and college access partners.
Using administrative data sets to model the shared responsibility approach used in Minnesota (and variations) to evaluate the associated impact on service to eligible students in Washington with the WSAC financial aid workgroup and stakeholders.
Developing proposals to incentivize student progress using SNG in collaboration with the Education Research and Data Center, the WSAC financial aid workgroup, and other stakeholders.
The State Need Grant program has provided access for students for over 40 years and
should continue to be evaluated for improved student outcomes and to be supported to
assist students in reaching their educational goals.

Washington Student Achievement Council
TABLE OF CONTENTS
I. BACKGROUND OF THE STATE NEED GRANT REPORT ................................................................................. 1
A. Supporting Resources & Expertise ................................................................................................... 2
B. Affordability Initiatives in Washington ........................................................................................... 2
1. Affordability Framework ............................................................................................................... 3
2. Washington Financial Aid Programs ............................................................................................ 3
3. College Bound Scholarship Connections to State Need Grant .................................................... 4
II. OUTCOMES OF STATE NEED GRANT RECIPIENTS ........................................................................................ 4
A. WSIPP Study of SNG Outcomes ........................................................................................................ 4
B. Persistence and Completion Rates ................................................................................................... 5
C. Student Survey Results ..................................................................................................................... 5
III. STATE NEED GRANT PROGRAM OVERVIEW .............................................................................................. 6
A. Program History ................................................................................................................................ 6
1. State Need Grant Timeline of Key Policy Changes ....................................................................... 7
2. Primary Reviews of State Need Grant .......................................................................................... 7
3. Student Eligibility ........................................................................................................................... 8
4. Program Service Levels.................................................................................................................. 8
5. Student Awards & Other Aid ..................................................................................................... 112
6. Institution Participation and Oversight ...................................................................................... 14
7. Program Administration .............................................................................................................. 15
IV. PROGRAM DESIGN RECOMMENDATIONS ................................................................................................. 16
A. HCM Recommendations and WSAC Analyses for State Need Grant Policies .............................. 16
B. WSAC Recommendations for State Need Grant Policies .............................................................. 19

Washington Student Achievement Council Page 1
I. BACKGROUND OF THE STATE NEED GRANT REPORT
The Washington Student Achievement Council was created in 2012 to advance educational opportunities and attainment in Washington. The Council was immediately tasked with developing the state’s strategic ten-year Roadmap for educational attainment, including proposing the goals and related strategies to reach the goals and fill the state’s workforce needs. One of the goals, adopted by the Legislature in 2014, is that 70 percent of Washington adults will have earned a postsecondary credential by 2023. The Council is required to submit a strategic action plan every other year to recommend required funding and educational policies designed to make significant strides in improving student attainment across the educational pipeline.
In the Roadmap, the Council identified affordability as the key strategy to achieving higher levels of educational attainment in Washington (http://www.wsac.wa.gov/the-roadmap). In order to reach the state’s goals, students and families must believe that higher education is affordable—and find the means to cover educational costs. The Council views full funding of the State Need Grant (SNG) program as the first and most tangible step to increasing affordability, and perceptions of affordability, for those residents with the greatest challenges in finding those means.
This is why, in addition to the specific policy recommendations contained in this report, the Council strongly supports sustained, strategic biennial investments in SNG—including an additional $16 million in FY 16 and $32 million in FY 17—to ensure that all eligible students actually receive the grant by 2023.
The Council was directed to report on the effectiveness of SNG in meeting the higher education needs of low-income students and in achieving the state’s educational attainment goals (28B.77.020).1 The report must include:
The outcomes of SNG recipients and impacts on meeting the state’s attainment goals.
Options for prioritization of SNG and consequences of each option.
Considerations for alternative SNG award structures.
This report augments previous work requested by the Legislature or led by the Council to evaluate and improve SNG. Current information related to student awards and distributions across sector and background related to program history and student and institutional eligibility are included. In addition, the Council engaged a national consultant to provide input related to program design in conjunction with this report. The Council’s recommendations for program improvements are provided.
1 (iii) The council shall report by December 1, 2014, to the joint higher education committee in RCW 44.04.360 on the outcomes of students receiving state need grants, impacts on meeting the state's higher education goals for educational attainment, and options for prioritization of the state need grant and possible consequences of implementing each option. When examining options for prioritizing the state need grant the council shall consider awarding grants based on need rather than date of application and making awards based on other criteria selected by the council.

Washington Student Achievement Council Page 2
Supporting Resources & Expertise
This report builds on the analysis and findings of several recent reviews of SNG (links to full reports below). The affordability analyses are used to provide a backdrop for the review of need-based aid, and the Washington State Institute for Public Policy’s (WSIPP) longitudinal analysis of student outcomes is summarized. The Council’s review of SNG in 2012 provided historical and program design information utilized in this report.
WSIPP report on the effectiveness of State Need Grant in 2014 (http://www.wsipp.wa.gov/ReportFile/1545/Wsipp_The-Effectiveness-of-Washingtons-State-Need-Grant-Program-Final-Evaluation-Report_Final-Report.pdf)
WSAC analyses of affordability to develop strategies to reach the state’s educational attainment goals in 2012 (http://www.wsac.wa.gov/sites/default/files/Affordability%20Issue%20Brief%20FINAL.pdf)
WSAC in-depth review of State Need Grant with a workgroup of aid administrators in 2012 (http://www.wsac.wa.gov/sites/default/files/SNG-PolicyReviewReport.pdf)
To deepen and expand the analysis of how SNG might be more effective, the Council sought to learn from the experience of other states with large need-based grant programs and from national expertise. The Council contracted with an outside consultant to develop recommendations related to higher education funding policy, improvements to student service within SNG, and the state’s overall approach to need-based aid.
HCM Strategists, LLC was selected as the consultant. HCM has conducted similar projects, including an analysis of the effectiveness of financial aid policies in the state of Indiana, analysis of options for simplifying the federal student aid system and improving incentives for on-time completion funded by Gates Foundation, counsel to the state of Oregon on cost effectiveness of financial aid policies funded by Lumina Foundation’s Strategy Labs, and others. Section IV of this report summarizes HCM’s recommendations and provides the Council’s analysis. The full HCM Report is included in Appendix A.
Affordability Initiatives in Washington
The primary goal of the SNG program is to provide the means for resident students from low-income backgrounds to access and complete postsecondary education in Washington. While this is vital, SNG is just one part of the state’s comprehensive effort to improve affordability for all students through appropriations to institutions to offset the cost of education. The review of SNG should therefore be viewed within the context and goal of affordability for all students, and with an understanding of all of the financing components available to students, families, and the state. As such, the Council has developed several initiatives to support policymakers addressing affordability through higher education and financial aid policy and funding.

Washington Student Achievement Council Page 3
Affordability Framework
As states seek to offset tuition increases for the lowest-income students, and consider affordability for all students, a framework is needed to guide funding decisions for higher education that better coordinates subsidies to institutions, tuition decisions, and financial aid funding levels and priorities. The Council is developing an Affordability Framework to support decisions related to higher education funding (as noted in the agency’s Strategic Action Plan, December 2014, and described in Appendix B). As policymakers consider potential alterations to the design and structure of SNG, changes should be grounded in the overall higher education funding and affordability philosophy for the state.
In order to better address affordability-related state fiscal policies, an Affordability Interactive Model (AIM) was developed by University of Washington professor Dr. James Fridley, under contract with the Council. The conceptual model allows a visual exploration of the impact of various higher education financing components including savings, parent income, student income from work, federal and state grants, institutional aid and scholarships, and student loans (see Appendix B).
As policymakers explore changes to state higher education funding and financial aid policies, the model demonstrates the impact on students and families. AIM visually demonstrates the important role of SNG, its coordination with federal aid, and the significant funding gap for SNG-eligible students when state aid is not available. The Council is continuing its work with Dr. Fridley to refine models that provide improved displays of the impact of funding decisions to students and families, regardless of income.
Affordability for all students has been identified as the key strategy by the Council to reach the state’s educational goals. The Council’s previous work discusses perceptions of affordability, the student versus state share of cost of instruction, the ability of students and families to cover all education-related costs, and the timing of required payments, including the role of savings and student work. (http://www.wsac.wa.gov/sites/default/files/Affordability%20Issue%20Brief%20FINAL.pdf)
The HCM report, Options for Affordability and the State Need Grant Program in Washington, also defines key concepts, explains institution and student costs, and outlines resources available to students (state support, savings, federal sources, student work, student debt, and institutional and private aid) as critical background information related to affordability (see Appendix A).
Washington Financial Aid Programs
Financial aid programs and activities authorized in Washington can be categorized within three policy objectives: need-based, targeted workforce, and merit. The majority of funding has been provided to the need-based programs targeted to lower-income students, primarily SNG and the College Bound Scholarship. Appendix C provides an overview of the state’s aid programs and anticipated expenditures for FY 15.

Washington Student Achievement Council Page 4
College Bound Scholarship Connections to State Need Grant
The College Bound Scholarship (CBS) was designed to be an early commitment of an enhanced SNG award that relied on predictable funding and policies within SNG. However, since CBS was created in 2007, several changes in SNG have occurred, including enrollments of eligible students outstripping funding, expansions to SNG eligibility, and reductions to awards by income category and for students attending private institutions. Because the programs are linked, SNG changes often have a direct fiscal impact on CBS.
In 2011, the Legislature assigned CBS to the Caseload Forecast Council to assist with projecting student enrollments for budgeting purposes. Although CBS is projected to continue to grow—serving four cohorts in a single academic year beginning in FY 16—it is still projected to represent less than one-fifth of the students and eleven percent of total funding among both programs. Regardless of the level of student crossover between programs, however, changes to SNG need to be considered carefully in the context of the potential fiscal impact to CBS. A legislative workgroup is making recommendations related to CBS that will be submitted to the Legislature in December 2014.
II. OUTCOMES OF STATE NEED GRANT RECIPIENTS
The most recent review of student outcomes indicates that SNG is associated with higher persistence and completion rates for eligible students who actually receive the grant. Conversely, student surveys describe the increased stress and anxiety that result when eligible students go unserved. Without SNG, unserved students must make difficult choices about work hours, debt levels, and course load, often with negative consequences on their ability to persist and complete.
WSIPP Study of SNG Outcomes
The Legislature asked the Washington State Institute for Public Policy (WSIPP) to conduct a comprehensive study of SNG. WSIPP submitted its report in January 2014, evaluating the effectiveness of SNG in improving enrollment and degree completion outcomes.2 WSIPP found that, for students with the lowest family incomes, receipt of SNG is associated with higher retention and completion rates. The interactions between SNG and other sources of aid, and the relationship between overall aid and the student’s cost of attendance, were explored. WSIPP’s conclusions were as follows (page 21):
2 2014. Washington State Institute for Public Policy (WSIPP). The Effectiveness of Washington State Need Grant Program. http://www.wsipp.wa.gov/ReportFile/1545/Wsipp_The-Effectiveness-of-Washingtons-State-Need-Grant-Program-Final-Evaluation-Report_Final-Report.pdf

Washington Student Achievement Council Page 5
For students with the lowest family incomes, we looked at the impact of a 25% change in the SNG award amount (about $600 for CTC students and $2,000 for public baccalaureate students). We estimate that this level of SNG assistance is associated with a 2 to 4 percentage point change in student re-enrollment. Similarly, adjusting the grant award by this amount is also associated with a 4 to 8 percentage point change in completion rates for the lowest income students. Among eligible students at higher income levels (70% MFI), we found that partial grants are associated with similar enrollment and completion effects for students at public baccalaureate institutions. We were unable to draw conclusions regarding the effectiveness of SNG dollars for students at private four-year degree granting institutions, which may be a result of the small sample size available for this sector. Overall, our results indicate that State Need Grant assistance is related to gains in enrollment and completion among undergraduate students with high levels of financial need. Not all eligible students can receive a grant given current funding levels, however. Alternative approaches to determining eligibility and award levels may improve access to the SNG program (by serving more students within current funding levels without substantial reductions in grant amounts for the lowest-income students).
Persistence and Completion Rates
WSIPP found that, among first-time students enrolling in a community or technical college in fall 2010, 82 percent re-enrolled during spring 2011, and just over 60 percent re-enrolled in fall 2011. About one-third of workforce students completed a credential within four years; among academic transfer students, 30 percent completed a degree and an additional 10 percent had transferred or were transfer-ready.
Among full-time SNG students entering four-year institutions, most (94 to 98 percent) re-enrolled in the spring and again in the fall (84 to 92 percent). Between 60 and 65 percent of those enrolled in private or public research institutions, and 47 percent of students attending public regional institutions, completed a four-year degree within six years.
Student Survey Results
In addition to the WSIPP quantitative study, WSAC conducted a survey of SNG-eligible students who received the grant during the 2011-12 academic year but were unserved during 2012-13. Nearly 50 percent of the over 300 respondents had been community college students during 2011-12, while 42 percent had been enrolled in a public four-year institution, and nine percent in a private institution.
Although SNG had composed nearly one-third of their total aid in 2011-12, these students did not receive any SNG in the following year. The survey inquired about the impact the loss of SNG had on their educational progress and financial decisions.

Washington Student Achievement Council Page 6
Students had to make more than one type of adjustment to their educational plans and lifestyle in order to make up for the lack of SNG:
51 percent borrowed more from student loan programs. Many were uncomfortable doing so and expressed anxiety over their ability to repay the loans after graduation.
42 percent changed their living situation through various means, including eating less, adding roommates, living in their cars, going without textbooks, and driving less.
32 percent borrowed money from family or friends.
26 percent worked more hours at their current job, leaving less time to focus on education.
15 percent enrolled in fewer classes, slowing progress toward their degree.
14 percent took on an additional job, reducing time for studies.
III. STATE NEED GRANT PROGRAM OVERVIEW
SNG has provided Washington residents with the opportunity to access postsecondary education for 45 years. During that time, the program has been evaluated several times and the criteria for determining funding levels and student eligibility have been altered.
The direct tie to tuition and fee growth that was implemented in 1998 has led to predictable funding with the intention of serving the majority of eligible students. In fact, Washington ranks first in need-based funding per undergraduate enrollments.3 However, the unprecedented enrollment of needy students in recent years has left tens of thousands of eligible students unserved.
Program History
Since it was established in 1969, SNG has supported low-income students and offset tuition increases. Sixteen years into the program (1988), the award amount was changed from a flat grant to a variable award that was tied to the cost of attendance. The use of median family income (MFI) as a standard was adopted in 1993. In 1998, the policy to tie grant amounts to public tuition was implemented. The following timeline summarizes major policy changes that have taken place in the 45 years of program history. There have been several studies, agency reviews, and examinations of the program by national experts.
3 National Association for State Student Grant Aid Programs, 2012-13 Survey.
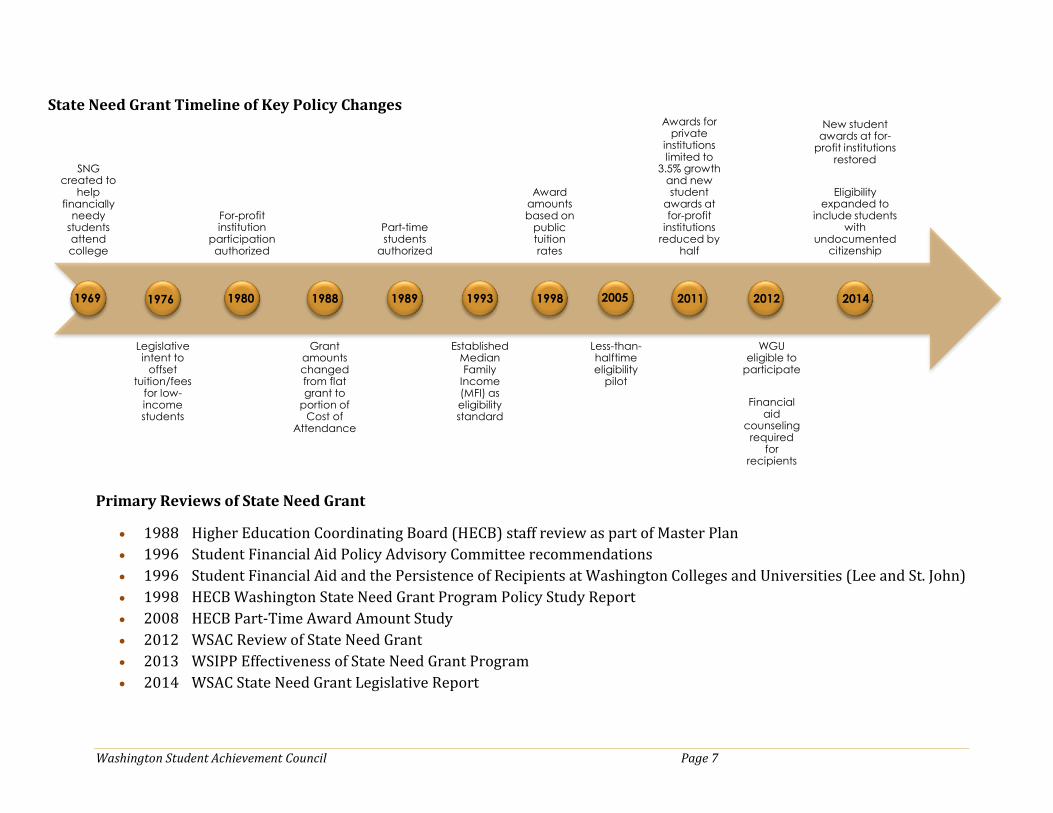
Washington Student Achievement Council Page 7
State Need Grant Timeline of Key Policy Changes
Primary Reviews of State Need Grant
1988 Higher Education Coordinating Board (HECB) staff review as part of Master Plan
1996 Student Financial Aid Policy Advisory Committee recommendations
1996 Student Financial Aid and the Persistence of Recipients at Washington Colleges and Universities (Lee and St. John)
1998 HECB Washington State Need Grant Program Policy Study Report
2008 HECB Part-Time Award Amount Study
2012 WSAC Review of State Need Grant
2013 WSIPP Effectiveness of State Need Grant Program
2014 WSAC State Need Grant Legislative Report
SNG created to
help financially
needy students attend college
Legislative intent to
offset tuition/fees
for low-income students
For-profit institution
participation authorized
Grant amounts changed from flat grant to
portion of Cost of
Attendance
Part-time students
authorized
Established Median Family
Income (MFI) as eligibility standard
Award amounts based on
public tuition rates
Less-than-halftime eligibility
pilot
Awards for private
institutions limited to
3.5% growth and new student
awards at for-profit
institutions reduced by
half
WGU eligible to
participate
Financial aid
counseling required
for recipients
New student awards at for-
profit institutions restored
Eligibility expanded to
include students with
undocumented citizenship
1969 1976 2012
1988 1989 1993 1998 2005 2011 2014 1980

Washington Student Achievement Council Page 8
Student Eligibility
Students are eligible for SNG as resident undergraduates enrolled in an eligible program (at least two quarters in length that is not theology) attending one of 68 participating institutions. Eligible students must have a family income at or below 70 percent of the state MFI ($58,500 for a family of four in 2014-15). Students must maintain satisfactory academic progress by completing the credit hours associated with their award amount and meeting a minimum grade point average, usually 2.0.
Students remain eligible for SNG for five years or 125 percent of the length of their program, whichever comes first. They may only receive SNG for one associate degree within a five-year period. Students who withdraw early in the term will owe a repayment to the program and are not eligible if in default or repayment to any aid program, federal or state.
In 2012-13, the following profile describes SNG recipients:
About 48 percent are age 24 or older 85 percent enrolled full-time (in fall term) 30 percent have children 38 percent are students of color 67 percent attend two-year institutions 39 percent are dependent students and 61 percent are independent Average family income for dependent students is $27,400 Average income for independent students is $13,900
In 2014, the Legislature expanded the definition of residency for SNG purposes to include students eligible for in-state tuition, including those with presumed undocumented citizenship status. An additional $5 million was added to the program appropriation to offset the expected increase in demand. The Council consulted with three other states with similar programs and developed a separate application for these students, the Washington Application for State Financial Aid (WASFA).
As of October 2014, over 2,000 students had applied for assistance through the WASFA. The number of students in this category who were a) enrolled, b) eligible for funding, and c) received the grant, will be known at the end of the academic year. Although students apply through a separate application, they do not receive priority and funding is not a guarantee; however, the WASFA has enabled institutions to evaluate eligibility for institutional aid and private sources of aid for these students.
Program Service Levels
To protect the lowest-income students from tuition increases, the Legislature has provided for increases to award amounts for individual SNG recipients. For students in the lowest-income category, awards increase on a dollar-for-dollar basis in relation to public tuition increases. The SNG appropriation has doubled since 2005-06—to $308 million in 2014-15—in order to keep pace with the growth in tuition over the same period (see Figure 1).
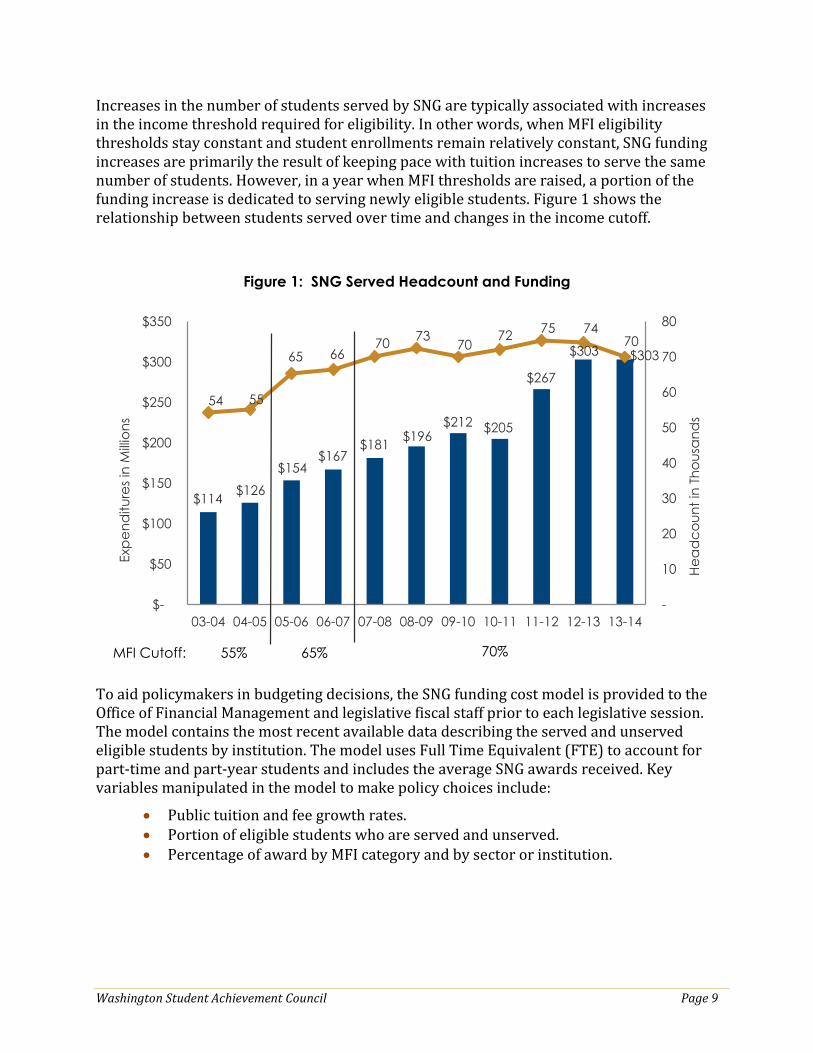
Washington Student Achievement Council Page 9
Increases in the number of students served by SNG are typically associated with increases in the income threshold required for eligibility. In other words, when MFI eligibility thresholds stay constant and student enrollments remain relatively constant, SNG funding increases are primarily the result of keeping pace with tuition increases to serve the same number of students. However, in a year when MFI thresholds are raised, a portion of the funding increase is dedicated to serving newly eligible students. Figure 1 shows the relationship between students served over time and changes in the income cutoff.
Figure 1: SNG Served Headcount and Funding
To aid policymakers in budgeting decisions, the SNG funding cost model is provided to the Office of Financial Management and legislative fiscal staff prior to each legislative session. The model contains the most recent available data describing the served and unserved eligible students by institution. The model uses Full Time Equivalent (FTE) to account for part-time and part-year students and includes the average SNG awards received. Key variables manipulated in the model to make policy choices include:
Public tuition and fee growth rates. Portion of eligible students who are served and unserved. Percentage of award by MFI category and by sector or institution.
$114 $126
$154 $167
$181 $196
$212 $205
$267
$303 $303
54 55
65 66 70
73 70
72 75 74
70
-
10
20
30
40
50
60
70
80
$-
$50
$100
$150
$200
$250
$300
$350
03-04 04-05 05-06 06-07 07-08 08-09 09-10 10-11 11-12 12-13 13-14
He
ad
co
un
t in
Th
ou
san
ds
Exp
en
ditu
res
in M
illio
ns
MFI Cutoff: 55% 65% 70%

Washington Student Achievement Council Page 10
Despite increased appropriations over time, increasing enrollments of low-income students has outstripped available SNG funding, leaving growing numbers of eligible students unserved. As shown in Figure 2, the number of eligible students increased significantly during the recession. As a result, about 30 percent of eligible students have not been served annually over the past three years. Even as the economy has begun to improve and enrollments have decreased in the community and technical colleges, the number of total eligible students has only decreased slightly.
Figure 2: SNG Eligible Students
In 2013-14, about 29 percent of public four-year institution total undergraduate enrollments, and 34 percent of community and technical college enrollments, were eligible for SNG.4
4 A total of 110,974 resident undergraduate public baccalaureate enrollments per Education and Research Data Center and 62,504 enrollments in aid-eligible programs per State Board for Community and Technical Colleges.
66,364
70,085
72,511
70,376
72,338
74,703
73,985
70,109
3,118
1,880
1,601
5,518
21,951
25,677
30,966
32,444
33,557
2006-07
2007-08
2008-09
2009-10
2010-11
2011-12
2012-13
2013-14
SNG Served Served with Local Funds SNG Unserved

Washington Student Achievement Council Page 11
Figure 3: SNG Enrolled Students, by Sector, 2013-14
Funds are distributed to each institution based on its share of the total statewide need. As a result, the percent by sector among served and unserved students is typically relatively similar. Figure 3 shows what portion each sector represents in grant recipients, unserved eligible students, and funding.
In 2013-14, community and technical colleges were able to serve greater proportions of their eligible students due to decreasing enrollments. The private four-year unserved data includes the first year of Western Governors University (WGU) participation eligibility with a partial allocation, leading to an increased unserved percentage in that sector. The tie to public tuition growth has led to an increased share of funding going to the four-year institutions.
61%
3%
6%
13%
17%
Served
70,109 Students
56%
1%
12%
14%
17%
Unserved
33,557 Students
35%
1%
9%19%
36%
Funding
$303 Million
Source: WSAC May Interim Report, 2013-14 (May 2014). CBS recipients.

Washington Student Achievement Council Page 12
Student Awards & Other Aid
SNG awards are tied to public tuition (operating, service and activity fees) at 15 credits; however, due to the timing of when institutions set tuition, there is a gap between the award and actual tuition charges. Figure 4 provides the maximum award amounts by sector or institution. The award amount received varies based on the institution or sector, MFI level, enrollment status, and other grant aid received.
Figure 4: SNG Maximum Award Amount
2014-15 SNG Award Amounts for 0-50% MFI
University of Washington $10,868
Washington State University $10,868
Central Washington University $7,631
Eastern Washington University and CTC Applied BA $7,196
The Evergreen State College $7,611
Western Washington University $7,882
Private Four-Year $8,517
WGU-Washington $5,619
Community & Technical Colleges and Nonprofit Two-Year $3,696
For-Profit Two-Year
$2,823
Changes to Awards for Private Institutions
The 2011-13 biennial budget instituted a cost reduction policy by limiting the growth rate for awards at private institutions to 3.5 percent, rather than tying the growth rate to public sector tuition increases. In addition, the awards for new students attending for-profit institutions were further reduced by half; however, that policy was removed in 2014.
Median Family Income Eligibility and Award Prorations
The income eligibility cutoff has been 70 percent of MFI since 2007 ($58,500 for a family of four in 2014-15). As a budget savings measure, the 2009 Legislature expanded the MFI award categories from three to five to reduce awards for students above 50 percent of median family income (see Figure 5).
Figure 5: SNG Award Prorations
Percentage of Maximum Award by MFI Category
Percentage of MFI 0-50 51-55 56-60 61-65 66-70
Percentage of maximum award 100% 70% 65% 60% 50%

Washington Student Achievement Council Page 13
In response to the trend of eligible student demand exceeding available funding, four-year institutions have prioritized awarding to the lowest-income students, while two-year institutions’ enrollment patterns are more apt to result in eligible students being funded on a “first-come, first-served” basis (see Figure 6).
Figure 6: Percentage of Eligible Served by MFI Category, by Sector
SNG recipients rely on multiple forms of aid to cover their total cost of attendance, including tuition, books, and living and personal expenses. Nearly all SNG recipients are receiving Pell Grants (95 percent) and about half are borrowing through student loans (see Figure 7).
The institution sets an awarding policy to determine which students will be selected and what portion of the maximum award they will receive. Many institutions will limit the portion of a total cost of attendance that can be received via gift assistance. Various prioritization policies have been developed, including prioritizing limited funds to the lowest income, incoming freshmen, previous recipients, early applicants, etc.
71.5%
56.6%
49.1%
45.2%
41.5%
0%
10%
20%
30%
40%
50%
60%
70%
80%
90%
MFI<50 50<MFI<55 55<MFI<60 60<MFI<65 65<MFI<70
CTC Private 2 Private 4 Regional Research Statewide

Washington Student Achievement Council Page 14
Figure 7: SNG Coordination with Other Aid 2012-13
SNG Avg.
Pell
Grant
Institutional/
Scholarships
Other
Grants
Student
Loans
Work
Study
Research 97% 69% 83% 67% 11%
$8,894 $4,547 $2,843 $662 $6,946 $2,752
Regional 95% 48% 32% 74% 11%
$6,372 $4,477 $2,236 $698 $6,690 $2,637
Private
Four-Year
93% 91% 63% 87% 26%
$6,718 $4,308 $11,678 $1,642 $9,351 $2,532
Community &
Technical
Colleges
95% 28% 25% 37% 7%
$2,364 $3,868 $1,237 $1,469 $6,061 $2,895
Private
Two-Year
91% 17% 44% 90% 2%
$1,403 $3,991 $1,737 $2,394 $8,223 $2,022
All Sectors
95% 40% 38% 50% 9%
$4,098 $4,093 $3,063 $1,159 $6,806 $2,768
State Need Grant does not act alone in supporting students with educational expenses. Nearly all SNG recipients are receiving the federal Pell Grant, and institutional aid is an important source of funding provided to four in ten SNG recipients. About half of SNG students borrow student loans. Among the lowest-income student borrowers attending public four-year institutions, SNG recipients borrow about $2,000 less than eligible students without SNG. The average amount borrowed is not significantly different for students attending lower-cost institutions than for students in the upper-income categories where SNG awards are lower.
Institution Participation and Oversight
Sixty-eight institutions currently participate in the State Need Grant program (see Appendix D). Private, nonprofit, four-year institutions have participated since the program’s inception, and for-profit institutions began participating in 1980.
Twenty-seven private institutions currently participate in the program, including 18 institutions placed in the four-year award category, two of which are for-profit (DigiPen Institute of Technology and Northwest College of Art and Design). The private two-year award category has ten participating institutions, two of which are nonprofit (Perry Technical Institute and Northwest Indian College).
Note: Aid received by SNG recipients is from WSAC 2012-13 SNG Interim Report and Unit Record Report data. Percentages represent the percent of SNG recipients in those categories who received those aid types. Dollars represent the average amount for the students who received that aid type.

Washington Student Achievement Council Page 15
Each year, the agency reviews student outcome and fiscal viability data for proprietary and newly admitted nonprofit private institutions to evaluate the risk of state funds. Reviewed data include the institution’s standing with the U.S. Department of Education and its accreditation body, completion and placement rates, federal compliance audits, annual financial statements, loan default rates, and other accountability measures. When performance concerns are identified, intervention may include expanding training requirements, placing a campus on probation with required corrective action, requiring a letter of credit, or suspension from participation in state aid programs.
The Council has a dedicated training and compliance officer who provides support to institutions with reporting and compliance and offers on-site training to institutions as necessary. In-person, full-day workshops are held in the spring in all regions of the state. In addition, the Council participates in the executive committee of the Washington Financial Aid Association to provide training to aid administrators.
Program Administration
The Council is directed in statute (RCW 28B.92) to oversee the design of SNG by:
Seeking to continuously improve the program and administration.
Using research and data to support decisions.
Coordinating aid programs to complement existing programs.
Establishing criteria to determine the financial needs of students recognizing costs and family resources.
Ensuring state funding follows the student to their choice of institution.
Developing policies that support the state’s educational attainment goals.
Monitoring expenditures appropriately.
Providing appropriations to institutions in a timely manner.
The Council works closely with a state financial aid workgroup composed of aid administrators and representatives from all sectors to evaluate program data, develop policy recommendations, and implement administrative improvements.
Currently, the workgroup is considering a recommendation to waive or reduce the self-help requirement for eligible students who have made choices to reduce costs by attending a lower-cost institution or reducing living expenses. In addition, the workgroup is evaluating the impact and feasibility of providing institutions with earlier information about their potential allocations, pending legislative action. The new process would use average student enrollment data over a three-year period rather than only using the most recent enrollment year. The change would provide institutions with more timely funding information for awarding decisions and lessen dramatic changes from one year to the next.
Washington Student Achievement Council Page 16
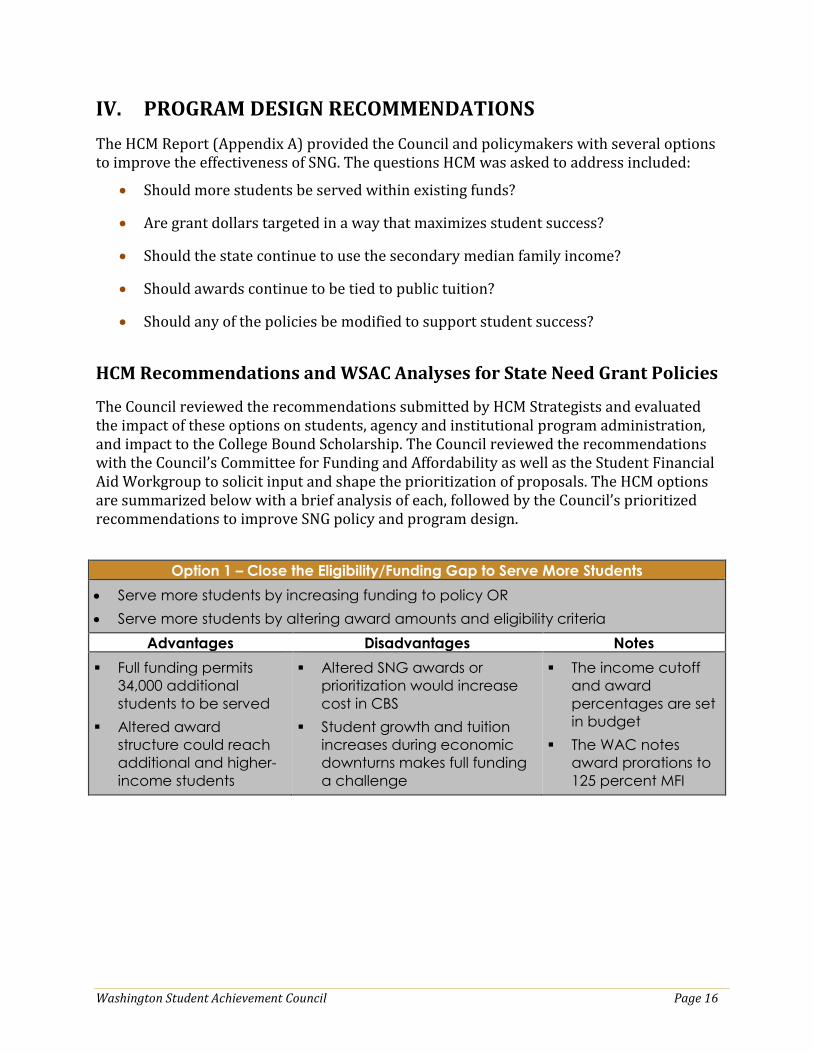
IV. PROGRAM DESIGN RECOMMENDATIONS
The HCM Report (Appendix A) provided the Council and policymakers with several options to improve the effectiveness of SNG. The questions HCM was asked to address included:
Should more students be served within existing funds?
Are grant dollars targeted in a way that maximizes student success?
Should the state continue to use the secondary median family income?
Should awards continue to be tied to public tuition?
Should any of the policies be modified to support student success?
HCM Recommendations and WSAC Analyses for State Need Grant Policies
The Council reviewed the recommendations submitted by HCM Strategists and evaluated the impact of these options on students, agency and institutional program administration, and impact to the College Bound Scholarship. The Council reviewed the recommendations with the Council’s Committee for Funding and Affordability as well as the Student Financial Aid Workgroup to solicit input and shape the prioritization of proposals. The HCM options are summarized below with a brief analysis of each, followed by the Council’s prioritized recommendations to improve SNG policy and program design.
Option 1 – Close the Eligibility/Funding Gap to Serve More Students
Serve more students by increasing funding to policy OR
Serve more students by altering award amounts and eligibility criteria
Advantages Disadvantages Notes
Full funding permits
34,000 additional
students to be served
Altered award
structure could reach
additional and higher-
income students
Altered SNG awards or
prioritization would increase
cost in CBS
Student growth and tuition
increases during economic
downturns makes full funding
a challenge
The income cutoff
and award
percentages are set
in budget
The WAC notes
award prorations to
125 percent MFI

Washington Student Achievement Council Page 17
Option 2 – Change Use of Median Family Income to Determine Eligibility
Guarantee a meaningful minimum award of state and federal assistance (e.g.
$2,000)
Use a gap analysis to establish a scale for higher awards
Establish statewide messaging to inform students and families of eligibility and
minimum and maximum awards
Communicate estimates of combined state and federal benefits (referred to as
“shared responsibility”)
Advantages Disadvantages Notes
A “shared
responsibility”
approach would
more tightly
coordinate with family
resources and federal
aid and serve more
students
Statewide information
would increase
awareness and have
a greater likelihood of
impacting student
and family behaviors
MFI is easier to
describe to
policymakers than
Expected Family
Contribution (EFC)
methodology
An altered award
structure would
deviate from the tie to
tuition that has
allowed for some
predictability in
funding increases
An altered SNG award
structure would
increase cost to CBS
Use of MFI was
recommended in 1993 due
to changes in federal
methodology
“Shared responsibility”
approach would alter the
current sector distribution
and student eligibility
A new methodology would
need to be phased in to
allow 68 institutions to
reprogram management
systems and permit
communication with
continuing students
Option 3 – Improve Transparency and Impact with Early Commitments
Consider additional ways to let students know in advance what they will qualify for
Determine populations the program could be committed to (placebound transfer
students, students eligible for means-tested benefit programs, Pell-eligible students)
Advantages Disadvantages Notes
Statewide information
would increase awareness
and have the potential to
affect student behavior
Early commitments
may lead to funding
obligations
Statewide messaging
would require some
administrative
resources
As a decentralized
program, SNG uses the
FAFSA and institutions
identify and award
students
The application process is
streamlined but students
are unaware of the
program

Washington Student Achievement Council Page 18
Option 4 – Establish a Reserve for Predictability and Institutional Discretion
To communicate eligibility and predictability in funding, a reserve could
accommodate unexpected changes in participation (80 to 85 percent of
appropriation)
Any change in the program would require two-year advance warning
The balance could be transferred to institution or help to cover the next year’s
commitment or managed at the state level
Advantages Disadvantages Notes
Predictability
supports
transparency
options
Forecasting trends would be a
challenge if eligibility criteria are
established in the budget cycle
WSAC has the
authority to carry
forward funds in SNG
if necessary
Option 5 – Support and Encourage Student Progress
Set the maximum combined award based on 15 quarter credits, or 45 per year
Prorate part-time awards to receive a proportionate level
Develop a communications campaign focused on on-time progress and
completion
Incentivize higher levels of credit
Advantages Disadvantages Notes
Full-time attendance
is linked to higher
degree completion
Students would have
better information on
award increases tied
to credit completion
May disadvantage
two-year college
students who are more
likely to attend part-
time
Currently students receive
the same amount for 12
credits as for 18 credits
SNG maximum awards are
based on 15 credits
Part-time award proposal
submitted in 2008 to
increase awards at least to
the lowest-credit tuition level
in the enrollment category

Washington Student Achievement Council Page 19
WSAC Recommendations for State Need Grant Policies
Based on the analysis of the HCM options, and a comprehensive review of SNG historical trends (see Section III), the Council recommends the following approaches to SNG program design and policies: 1. The Council has proposed strategic investments to fully fund eligible students under
current policy, including an additional $16 million in fiscal year (FY) 2016 and $32 million in FY 17. The current system that leaves one in three eligible students without funding is inequitable. The cost to fully fund SNG is estimated to be $123 million or a total of $431 million. By strategically investing an additional $16 million each year through 2023, the state can close the funding gap in SNG and fulfill its commitment to the lowest-income students. Each increase would serve an additional 4,000 students annually.
2. The Council believes the policy goal for SNG eligibility should be established in statute to minimize the variability of eligibility and award changes determined each budget cycle in order to improve understanding and predictability in program policies. The variability in SNG policy that can occur in the budget cycle makes it difficult for students and families and outreach partners to understand. Despite funding shortfalls during challenging economic periods, the policy goal should be established in statute.
3. The Council will continue to provide comprehensive information regarding SNG eligibility on the Ready, Set, Grad website and in training materials for high school counselors and college access partners. In 2012, the Legislature asked the Council to develop a financial aid counseling website to ensure every student offered State Need Grant has quality information regarding loan options, financial literacy, scholarships, work study, and more. The Council developed ReadySetGrad.org as a “one-stop” information site for students, families, and educators regarding planning and preparing for postsecondary education. The “$ for College” section has financial aid slide shows, peer videos, and information about programs, application and eligibility, and borrowing. Institutions link to this page from the Opportunity Pathways label that is included on all award letters.
4. The Council will use administrative data sets to model the shared responsibility approach used by Minnesota (and variations) to evaluate the impact of service to eligible students (average awards, numbers of students, income range, dependency status, sector, and the impact on the College Bound Scholarship). This will be reported through the Committee on Funding and Affordability and included in the December 2015 annual report on state financial aid.

Washington Student Achievement Council Page 20
The Minnesota shared responsibility framework has been in place since 1983. The program provided $161 million to 99,000 low-income students in FY 13 and is designed to complement the Pell Grant. The formula establishes a state student budget by sector and assumes students are responsible for nearly half of the costs. The contribution from either the parent (dependent) or student (independent) is subtracted and the Pell Grant is subtracted to determine the state grant eligibility. WSIPP estimated that if Washington used this framework, SNG award averages would be reduced, resulting in an additional 9,000 students being served from the current $308 million available. The Council is interested in exploring the impact of this model in more detail and evaluating the impact to students by income level and sector.
5. The Council will work with the Education Research and Data Center and evaluate research-based practices to develop proposals to incentivize student progress using State Need Grant. Several states have altered satisfactory academic progress standards or award structures in their aid programs to incentivize higher levels of student credit completion. For example, West Virginia has explored “stacking” need and merit awards to motivate student performance. Indiana has reformed its need-based program to shift incentives from enrollment to completion by requiring a minimum number of credits be completed each year; students receive a “bonus” with additional credits completed and 3.0 GPA. The Council would like to evaluate the impact of various completion-focused models using historical academic and financial aid data in collaboration with the Education Research and Data Center.
6. The Council recommends that the less-than-halftime enrollment eligibility be permitted to allow students to maintain momentum when circumstances lead them to drop enrollment to a single course in a term. Less-than-halftime eligibility has been permitted since 2006 via the budget process. Several legislative reports have been submitted indicating the majority of students in less-than-halftime enrollment attend community or technical colleges and are in this enrollment category on a temporary basis. The last report was submitted in 2013 (http://www.wsac.wa.gov/sites/default/files/2013.LessThanHalfTimeReport.pdf).

OPTIONS FOR AFFORDABILITY AND THE STATE NEED GRANT PROGRAM IN WASHINGTON
PREPARED FOR:
Washington Student Achievement Council
TEAM MEMBERS:
Nate Johnson and Kristin Conklin
DRAFT SUBMITTED:
September 16, 2014
APPENDIX A
2
BACKGROUND
This report responds to the questions posed by the Washington Student Achievement Council in Contract 15-PR091, which was awarded to HCM Strategists through a competitive request for proposals in early 2014. The purpose is to provide a menu of options for consideration by the Council that address the following set of questions related to affordability generally and the role of the state need grant specifically in maintaining affordability:
PART A: Affordability (General)
What are options to develop a comprehensive higher education funding policy that is predictable for students and families and maintains funding and flexibility for institutions?
PART B: Within State Need Grant (Specific)
•• Should more students be served within existing funds?
•• Are grant dollars targeted in a way that maximizes student success?
•• Should the state continue to use the secondary median family income?
•• Should awards continue to be tied to public tuition?
•• Should any of the policies be modified to support student success?
The recommended options that follow are based on analysis that draws from multiple sources: a review of available data about Washington’s key affordability policies, including the State Need Grant; studies published by the Washington Student Achievement Council and the Washington State Institute for Public Policy; the affordability model developed by Professor James Fridley; select stakeholder interviews; discussions with the Council and the task forces on affordability and the state need grant; and on academic research and the experience of other states where applicable to Washington’s context.

3
SUMMARY OF OPTIONS
AFFORDABILITY OPTION 1:
Create a Comprehensive Affordability Framework for Policy Development
•• Define terms and concepts clearly
•• Establish a “spectrum” for affordability: Affordable Unaffordable
•• Identify all higher education costs to graduate a student: institutional and student
•• Identify all known resources available: state appropriations, parent/family, federal grants and tax credits
•• Examine remaining gaps and set policy for remaining roles: student self-help (work, loans), institutional aid, State Need Grant and other state programs
AFFORDABILITY OPTION 2:
Focus on Cash-Flow Issues and Timing
•• Promote long-term savings, emergency financing, short-term forbearance on balances, bridge loans
•• Provide advice on maximizing and timing federal tax benefits
AFFORDABILITY OPTION 3:
Use Outcomes-Based Funding to Encourage and Enable Institutions
•• Focus on low-income students
•• Determine goals, let institutions decide how to achieve
AFFORDABILITY OPTION 4:
Link Budgets to Specific Conditions
•• Alternative to/not compatible with outcomes-based funding
•• Focus on multi-year agreements, predictability for students and institutions
•• Account for different levels of financial need at different institutions

4
State Need Grant Design Principles
•• State Need Grant is only one piece of puzzle: focus on size of gaps not size of grants
•• Use as both support and incentive
•• Narrow biggest affordability gaps first (e.g. students eligible but not receiving awards)
•• Make programs transparent and predictable
•• Focus on 70% goal: target students whose outcomes are most likely to change
STATE NEED GRANT OPTION 1:
Close the Eligibility / Funding Gap to Serve More Students
•• By fully funding program as currently structured (increased investment); or
•• Creating more gradual phase-out of benefits (more investment or revenue-neutral)
STATE NEED GRANT OPTION 2:
Change Use of Median Family Income to Determine Eligibility
•• Use median family income for minimum eligibility and communication
•• Use federal formula to allocate larger amounts
•• Focus on gaps and combine state/federal aid in setting targets for each student
STATE NEED GRANT OPTION 3:
Improve Transparency and Impact with Early Commitments of State Need Grant Funds
•• Continue commitment to College Bound Scholarships as pre-commitment of need grant
•• Identify other groups for whom pre-commitment is possible

5
STATE NEED GRANT OPTION 4:
Establish Reserve for Predictability and Institutional Discretion
•• Ensure grant levels are predictable for at least two years
•• Set award schedule based on conservative estimates of demand
•• Hold remaining funds over or distribute to institutions for additional, targeted awarding
STATE NEED GRANT OPTION 5:
Support and Encourage Progress
•• Focus on efforts to reduce time-to-degree
•• Equalize state/federal financial aid per credit hour up to 15 hours per term to support both part- and full-time students
•• Include additional incentive for completing a certain number or proportion of credits

6
AFFORDABILITY AND STATE NEED GRANT CONTEXT
To many in the 38 states that rank below it in degree attainment, Washington, with its well-educated population and thriving high-tech industries, sets a standard that they would only be too happy to reach. But many of the state’s educated adults earned their credentials elsewhere while large parts of the resident population remain under-served. At the same time, Washington often competes with states and other countries whose level of postsecondary attainment is even higher. As a result, in order to better serve an increasingly diverse population and to advance its economic priorities, the recently formed Washington Student Achievement Council established a goal for the state of having 70 percent of the state’s adults with a postsecondary credential within ten years.
The additional students who must be recruited, educated, and graduated to meet that goal are not likely to be the children of affluent families whose parents and grandparents also went to college. Those students are likely already doing well in the state’s high quality public and private colleges and universities. The new students are more likely to come from depressed rural areas and poor urban neighborhoods, to be older than traditional college freshmen, to be academically underprepared, economically disadvantaged, and to have parents with no experience of postsecondary education to set a precedent and guide them through the academic and financial maze to success.
A Sea Change in Higher Education Funding
At the same time as Washington has set ambitious goals to graduate large numbers of additional hard-to-serve students, severe fiscal constraints and competing government priorities for limited tax revenues led the state to cut appropriations for higher education by 27% in constant dollars between FY 2008 and FY 2013, which amounted to $2,700 in lost state funding per student (State Higher Education Executive Officers 2013). What followed were tuition increases that were among the largest in the country, rising in constant dollar terms more than $1,000 at community colleges and more than $4,000 at four-year universities between 2007-08 and 2013-14 (Baum and Ma 2013). Even those increases, however, did not make up the total revenue loss in appropriations, and total educational revenues per student including both tuition and appropriations remained down by $900 in FY 2013 compared to FY 2008.
These changes represented a qualitative shift in the landscape of higher education in Washington. While declining state support and increasing reliance on tuition continued a longstanding trend for most states, data from the State Higher Education Executive Officers

7
shows that it was only with the Great Recession that Washington’s reliance on tuition, which had hovered between 20% and 30% of total educational revenue for more than two decades, spiked to 44% by FY 2013. Before the recession it was a state where it was implicit that public higher education is primarily the responsibility of taxpayers; it is now a state where students are expected to share the cost more equally. Such a shift requires a re-thinking of the public and private roles in higher education to answer again for its citizens the questions posed in the Carnegie Foundation’s landmark 1973 report: “Who Pays? Who Benefits? Who Should Pay?” (The Carnegie Foundation for the Advancement of Teaching 1973).
CHART 1. Proportion of Total Education Revenues from Tuition, 1988-2013
50% -
40% -
30% -
20% -
10% -
0% -
1988
1989
1990
1991
1992
1993
1994
1995
1996
1997
1988
1999
2000
2001
2002
2003
2004
2005
2006
2007
2008
2009
2010
2011
2012
2013
Source: SHEEO FinanceSurvey 2013
Washington United States
It is within this economic and policy context that the Washington Student Achievement Council has been exploring innovative strategies to accomplish the goals of the Roadmap, including new ways to define and ensure the affordability of higher education. The council has been working to outline potential strategies to improve affordability and has dedicated special attention to the State Need Grant program. The program was among the few budget items to increase during the recession and has grown in strategic importance as the overall level of state subsidy has declined.
Even with the increases, however, the State Need Grant program has not been able to fully fund the increasing number of students who qualify based on income and attendance status. In 2012-13, more than 32,000 students who were eligible for a grant did not actually receive funding. This gap, which is alarming and confusing for students, families, and institutions, is both a symptom of the larger affordability policy issue facing Washington and the result of the specific design of the program. The options proposed in this report are intended to lead to more effective, fair and transparent ways to address the affordability concerns of Washington’s citizens, with the need grant as the capstone component of a comprehensive strategy.
8
PART A: OPTIONS FOR AFFORDABILITY
AFFORDABILITY OPTION 1:
Create a Comprehensive Affordability Framework for Policy Development
In order to make sure that policies are effective and focused, and that the state’s multiple investments in higher education are well-coordinated and understood by stakeholders, the first option to consider is development of a framework that brings together all the elements of the state’s approach to affordability. Key action steps in developing the framework would include:
•• Defining key terms and concepts
•• Establishing an affordability “spectrum” with significant benchmarks
•• Identifying all higher education costs that have to be covered to get a student to graduation
•• Identifying all resources that could be available to pay for those costs
•• Establishing roles or “shared responsibility” for the state, parents, students, and institutions in paying the full cost of education
•• Communicating those roles and expectations to everyone involved
While affordability is a major topic in Washington as in other states, it often means different things to different people, which can result in unfocused policy discussions. Leaders and citizens need a consistent set of terms and concepts to make sure they are talking about the same problem when discussing affordability, even if they may disagree about the solution. One set of possible definitions is outlined below, but if another framework would better serve the state’s needs, the most important step would be to establish common ground.
The state that has the most comprehensive framework for affordability, which has endured over 30 years through state political control by three different parties and multiple economic cycles, is Minnesota with its “Shared Responsibility” model. Oregon and the University of California system have also adopted the model at least as an analytic framework, and many other states and institutions have incorporated some of the underlying concepts.1 The
1 Recently David Longanecker and Brian Prescott from the Western State Interstate Commission for Higher Education (WICHE) elaborated some of the ideas behind Minnesota’s model in a paper commissioned by Lumina Foundation (Prescott and Longanecker 2013).

9
recommendations here take that model an additional step by incorporating the full cost of education into the discussion, so that the state’s support of institutions through appropriations becomes part of the same framework.
The most important first step in establishing a comprehensive approach is to define terms in order to break the broad problem of affordability down into manageable pieces. Following are suggestions that Washington could use or modify in creating a framework suited to the needs of the state.
Suggested key concepts and terms
Affordability: alignment between the full cost of higher education and the resources available to pay
Cost of higher education: the sum of what institutions and students must invest for a given student to graduate (or achieve any other desired result)
Resources available to pay: all sources of financial support—individual, family, federal, state, institutional, etc.—that a student could reasonably expect to use to cover the cost
Students: any current or potential future students for whom the state wants higher education to be affordable (not limited to the currently served population)
If affordability is defined as alignment between cost of education and available resources, then it might also be helpful to develop a scale or spectrum for assessing how affordable higher education is for a given student or group of students. Such a spectrum, instead of a simple opposition between “affordable” and “not affordable”, could help clarify and prioritize problem areas and avoid polarizing the debate. Most students would fall between the two extremes below, and there could also be additional categories or levels that would be important for the state to define.
An affordability “spectrum”
Unaffordability: A student or family is unable to access even one viable pathway to a degree because of resource constraints.
Minimal affordability: A student or family has the resources for at least one viable pathway to a bachelor’s degree, including significant part-time work and student loans.

10
Moderate affordability: A student or family has the resources they need to choose among several higher options, including light part-time work and modest levels of loans; some options may still be too expensive.
Total affordability: A student or family has the resources to make choices among all available higher education options for which they are qualified, with no need for part time work or student loans. Only students from very high income families would likely fit in this category.
Explaining Costs
What are the costs of higher education that have to be considered to finance the education of a single college graduate in Washington? One reason this issue can be confusing is because many attempts to analyze costs take too narrow a view. On the one hand, students at public institutiions and their families often do not realize that in-state tuition does not cover the institution’s full cost of instruction and related services. On the other hand, focusing strictly on the institutions’ cost misses the significant cost to students of enrolling in college, apart from simply paying institutions for instruction. In fact, both institutional and student costs must be covered to make higher education possible.
Institutions’ Costs
Table 1 shows the average estimated institutional expenditure for a year of postsecondary education for students in Washington using one common method to estimate costs per student. For all students at public and private nonprofit institutions, the average was $13,700, ranging from $8,900 at community and technical colleges to $18-$20,000 at private nonprofit colleges and public research universities.2 This includes instruction, student support services, and institutional support/overhead. At colleges that do nothing but undergraduate instruction, this represents their entire annual expenditure per student. At colleges with more diverse operations, it excludes expenditures unrelated to instruction, such as sponsored research, dormitories, hospitals, auxiliary businesses, etc.
2 These numbers follow a methodology similar to that of Delta Project on Postsecondary Costs, using expenditure and enrollment information from the Integrated Postsecondary Education Data System (IPEDS) for FY 2011-12. Costs include direct instructional expenses as well as indirect costs such as administrative overhead, student services, libraries, etc. While the annual cost of buildings and other capital assets is included based on their depreciation schedule as well as direct operational expense, it would probably cost more in most cases to build the institutions from nothing at today’s land, construction, and technology prices. One departure from the Delta Project methodology is to account for the higher cost of graduate education by weighting graduate students double, consistent with typical weights in most states that have detailed cost analyses. This slightly reduces the estimated cost for undergraduates at institutions that also have graduate students. The estimates are adjusted for inflation using the Higher Education Price Index (HEPI). For profit and out-of-state institutions are not included here, for simpler illustration.

11
TABLE 1. Institutions’ Annual Undergraduate Education and Related Expenditure
2014 Estimate
Private Nonprofit Washington Colleges $20,300
Community and Technical Colleges $8,900
Regional Four-Year Universities and Evergreen $10,900
Research Universities $18,400
Average In-State $12,800
Average In-State Public Four-Year $15,500
The institutional cost is the approximate amount that institutions must finance somehow—through tuition, state appropriations, private support, etc.—to provide undergraduate education. It is typically more than the sticker price of tuition at public institutions, since taxpayers foot part of the bill. It is often lower than the sticker price at private institutions that do not have big endowments, since the sticker price is essentially the maximum amount, and most students get significant discounts. On average, however, private colleges could not afford to discount their tuition below the level of their cost, so the total cost of providing the instruction is a reasonable estimate of what a typical student who did not qualify for state or federal grant aid might be expected to pay after institutional discounts are taken into account.
Students’ Costs
In addition to what institutions spend to deliver postsecondary education, the total cost also has to include students’ non-tuition costs of attendance. Since the state is developing policy for potential as well as actual students, it is important to have a statewide benchmark estimate that is independent of where and whether students eventually choose to go.
In 2014, a simple estimate of the student’s cost might be in the range of $13,400 per year, on average. Part of this is books and supplies, which the College Board estimates nationally at about $1,200 per year for full-time students. Washington institutions typically use similar amounts. The remaining $12,200 represents the cost of the student’s time.
It is common to include living expenses as part of college costs, but for estimating the impact of costs on affordability, most economists would say that is not the right measure to use. People will have room, board, and other unavoidable living expenses whether or not they are enrolled in college and someone will have to pay those expenses. And an affordability analysis has to provide a general enough estimate of costs that it applies to students who have not enrolled, and therefore have not made the specific decisions about institution or living arrangements, which combine elements of necessity and choice.

12
From an economic perspective, while living expenses are not a direct cost of college, enrolling reduces the amount of time students have available to work to pay those expenses. That “opportunity cost” is really what changes the potential return on investment of attendance. It is what a student has to weigh in deciding whether college makes economic sense for them—is “affordable”, in other words (Cowen and Tabarrok 2009). Consider a star junior basketball player at the University of Washington who could command a $2 million salary in the NBA draft. For him, the cost attending UW his senior year has nothing to do with actual living expenses. It’s $2 million, which he probably will not consider affordable and which the university can probably do nothing about.
For the purpose of the 70% attainment goal, the opportunity costs for most potential students is lower, given the weak earning power of workers without a postsecondary credential. In principle, full-time enrollment (15 credits) requires about the same amount of class and study time as full-time employment. At the state minimum wage, a student who is spending 40 hours a week in class or preparing for class over nine months might be giving up about $12,200 in potential after-tax wages.
One reason it is helpful to use the opportunity cost is because it allows for more accurate accounting of the cost of part-time enrollment. Part-time students eat just as much as full-time students—so the room and board estimate wouldn’t change—but they have proportionally less time to work to pay their grocery bills.
While this number is somewhat arbitrary, it is important that it should not be set too high, since the main priority of state affordability policy is not to enable potential NBA players or citizens who are already making $100,000 per year to return to college. It should not be too low, either, since prospective students really do have to consider how much time they will need to be away from work and how they will make ends meet.
Total Estimated Cost to Graduate a Washington Student
The last step is to factor the number of years those costs will need to be covered.3 For credentials that can be completed in a single year, which may be an important component of the overall goal and can often lead to significant gains in earning power for students, the one year cost is fine. But for an associate degree at a community college, the total shared cost for institutions and for low-income students, if they can do it on time, amounts to about $44,600, and ranges from $93,000 for a “2+2” degree with a regional university, up to $127,000 at public research universities or private colleges.
3 Since this is a student-centered description of the prospective cost to finance a degree, the best measure is the normal time students might expect to be in college, even if in practice it turns out to be longer. If the purpose were for accountability, or planning to estimate total institutional costs to reach a certain goal, a different approach might be appropriate. (Johnson, What Does A College Degree Cost? Comparing Approaches to Cost Per Degree 2008).

13
TABLE 2. Total Cost to Graduate
Institution Annual
Cost
Students’ Other Costs
Total Annual Cost x Yrs
Total Estimated Cost for a
Degree
One-Year Certificate (WCTCS) $8,900 $13,400 $22,300 1 $22,300
Two-Year Associate Degree (WCTCS) $8,900 $13,400 $22,300 2 $44,600
Four-Year Bachelor’s Degree (WCTCS 2+2 with Regional)
$9,900 $13,400 $23,300 4 $93,200
Four-Year Bachelor’s Degree (Regional Only) $10,900 $13,400 $24,300 4 $97,200
Four-Year Bachelor’s Degree (Public Research)
$18,400 $13,400 $31,800 4 $127,200
Four-Year Bachelor’s Degree (WA Private Nonprofit)
$20,300 $13,400 $33,700 4 $134,800
Explaining Resources
Given the estimated cost to graduate, what resources are available to meet those expenses, and how do they vary by the income level of families and the type of institution attended? Following are a series of steps intended to show how much of the remaining cost needs to be financed after each source of support is taken into account.
Drawing from public sources of information as well as an affordability model developed for the Council, each step reduces the gap between costs and resources for at least some students. The different income levels are intended to illustrate a continuum by using points near thresholds in state and federal aid programs: one student who is expected to have no parental support, either because of being classified as independent or because the family income is too low; another who is close to the upper eligibility boundary for both Pell grants and State Need Grants; another who is above the level for most state and federal grant aid, but whose parents’ expected contribution falls well short of meeting the full cost; and another whose parents’ income is well above the state median but still not at a level that would make it easy to meet the full student budget at a public research university or private college.

14
State Support for Colleges and Universities: The “Invisible Scholarship”
One question the affordability framework should help Washington address is: “How much of the cost of education should be paid for by taxpayers through appropriations to institutions?” It is unlikely to be easily settled, since reasoned and principled positions could lead to different conclusions, but stakeholders should start at least with an understanding of the current level of taxpayer support.
Even after dramatic cuts, the state’s biggest investment in affordability is the funding it provides to support colleges’ operating budgets through annual appropriations. These funds enable institutions to charge resident students less than the full cost of instruction and related activities. The difference between the resident undergraduate tuition rate at public institutions and the cost of providing that student’s education could be considered a form of “invisible scholarship.” Based on the most recent data available, we estimate the amount of this scholarship at $2,000 per year at comprehensive universities, $5,400 at research universities, and $4,700 at community and technical colleges.
All resident students at public institutions, regardless of their income level or ability to pay receive this form of financial support from the state. Recognizing the subsidy explicitly allows for a clearer understanding of the impact on affordability when the level of support goes up or down. Private colleges do not receive direct appropriations in most states but do often qualify for student financial aid.
TABLE 3. Estimating the “Invisible Scholarship” for Resident Undergraduates
2013-14 Estimated Annual Institutional Cost
2013-14 Annual Tuition
Estimated Annual Support
from State Appropriation
Community and Technical Colleges $8,900 - $4,200 = $4,700
Regional Four-Year Universities and Evergreen $10,900 - $8,900 = $2,000
Research Universities $18,400 - $13,000 = $5,400

15
The chart below makes the “invisible scholarship” visible as a contribution to the cost of a bachelor’s degree over four years, taking any of three different pathways. While it makes a significant dent, it still leaves the vast majority of the full cost to be met with other resources.
CHART 2. “Invisible Scholarships” from State Appropriations and the Full Cost of bachelor’s Degrees
$160,000 -
$120,000 -
$80,000 -
$40,000 -
$0 -
Four-Year Cost State Appropriation Support for Resident Tuition
$93,200 $97,200
$127,200
$13,400 $8,000 $21,600
Four-Year Bachelor’s Degree (WCTCS 2+2
with Regional)
Four-Year Bachelor’s Degree (Regional Only)
Four-Year Bachelor’s Degree (Public
Research)
The remaining illustrations in this section will use the first pathway in Chart 2, the $93,200 total cost of a bachelor’s degree using the 2+2 route through a community college and a regional university. Appendix 1 shows the estimates for the other pathways not listed.
Parents / Family Income and Savings
Family support, when available, comes next in the sequence of resources available for higher education costs. The federal financial aid formula, which many states and institutions use (although Washington does not) also assumes that families of dependent students will contribute toward their children’s higher education. 43% of Washington students who received need-based financial aid were classified as dependent in 2012-13, and 57% were independent. Other approaches could be used to estimating what parents can and should contribute. The current State Need Grant matrix in Washington uses percentages of Median Family Income to establish award levels, but does not explicitly state what level of support is expected from the parents themselves at the different income levels.
The federal formula for estimating a parent contribution is not perfect, but it is important in practice because it establishes the amount of federal grant aid that will be available for students. To help make better estimates of reasonable levels of student and parent contribution, Professor Jim Fridley at the University of Washington developed an affordability model at the request of the Washington Student Achievement Council (Washington Student Achievement Council 2013). This model approximates the federal method for calculating the

16
family contribution but goes the extra step of breaking down how much of that expected contribution might come from income or from savings.
Chart 3 shows what parents with different income levels might be expected to contribute to the $93,200 total cost of the 2+2 degree over four years based on the federal formula. At the lowest level, no contribution would be expected since every dollar would presumably be needed for basic living expenses. At the highest level, the contribution expected would actually cover the remaining cost of the education, after the state’s $13,400 “invisible scholarship” is taken into account.
CHART 3. Estimated Parent Contribution at Selected Family Income Levels
$150,000 -
$100,000 -
$50,000 -
$0
$0
$30,000 $60,000 $80,000 $120,000
$18,200 $39,400
$86,300
Family Income
Parent Contribution
State Support through Appropriations
Four-Year Cost
What a particular parent or family really can or will contribute is impossible to predict consistently with a formula. The “estimated parent contribution” should not be mistaken for what every parent will consider affordable or reasonable or actually be able to contribute. It is a number applied to a wide variety of different families, whether they live in Seattle or Wenatchee. While it is calculated based on a single year of income, most middle class families would find it very difficult to pay as much as the formula often suggests without either saving or borrowing. Spread out over a number of years of saving (or paying back loans), the total amount needed per month or per year may be more manageable. Over a ten-year period, the $18,200 contribution expected of the family at the $60,000 income level works out to about $150 per month, which is more plausible than the $400 per month it would take to cover the cost in four years.
But that will also depend. Parents who had been earning $80,000 for many years in Spokane and saving $3,000 per year in a tax sheltered account might find it relatively easy to come up with the $39,000 they would be expected to contribute to their child’s four year degree. A different set of parents earning $80,000 per year in Seattle, who may have just reached

17
that level of income after many years earning much less might think it absurd that they could pay so much out of pocket. And there are some parents who might be financially able to help pay for college, but unwilling to do so. On the other hand, some of the parents in the bottom group may have more resources available to them than it appears—wealthy relatives, business income or assets not captured in the formula, or fluctuations in annual income that average out to a higher level over time.
Since formulas are a necessary evil for broad-based state policy, they will inevitably miss the mark in a certain percentage of cases. For that reason alone, it is important to ensure that there are options for students whose circumstances do not fit the standard template, whether that takes the form of providing low-cost pathways to a credential (e.g. community colleges, Western Governors University) or ensuring that institutions have discretion and resources to make reasonable exceptions to broad-based formulas.
Parent Resources: The Role of Savings
Higher education might seem more affordable if the bills didn’t arrive all at once. Fridley’s affordability model, for example, analyzes the cost of higher education as a cash flow problem and shows the impact of different savings rates on the family’s ability to afford college. Financing a $100,000 investment over several decades, including savings, current income and, if needed, loans and loan repayment, is different from trying to do so out of present income. Families who have not saved may end up borrowing, and paying the parent’s share of the cost over multiple years after the student enrolls instead of saving to pay beforehand. Some will do a combination of both.
Programs like Washington’s GET savings plan and other federally recognized 529 plans are one way government encourages saving for college. They are usually not considered in calculating federal and state financial need, although some institutions do take them into account in estimating total family resources.
There is a strong economic case for a state like Washington, which has no income tax (and therefore no deductions or credits) to encourage its citizens to take maximum advantage of federal tax sheltered savings programs. The state loses no revenue, and the benefit of the savings stays entirely in state.4 Especially for middle- and lower-middle income families who may be able to set aside small payments over a longer period of time, savings may be the only way to contribute anything like the expected amounts set by formula without going into additional debt.
4 As a federal policy, however, research has shown that the benefits of such programs go disproportionately to higher income families, who are in a better position to take advantage of the incentive (Dynarski 2005).

18
The state should continue to promote savings, including the GET program and should use the affordability framework to help families understand as early as possible how much they will be probably expected to contribute to the cost of their child’s two- or four-year degree and what they would have to set aside each month to make that contribution possible.
Ultimately, the state is not bound, in its own framework for defining affordability, to use the same method to estimate parents’ ability contribution as the federal government does. If there is widespread agreement that the formula produces unreasonable results, the state could propose something different. If the state reduces the amount of parent contribution that it considers “affordable”, however, the effect would be to increase the size of the gaps left to fill with other resources, since the federal government’s policy would be unlikely to change.
Federal Pell Grants and American Opportunity Tax Credits (AOTC)
So how much does the federal government contribute to the resources available to pay for higher education in Washington? The biggest forms of support reduce the cost of lower- and middle-income students’ education primarily through a combination of Pell Grants and American Opportunity Tax Credits (leaving aside the loan programs for the moment). Washington students received $456 million in Pell grants in 2012-13, according to the state’s annual report on aid programs (Washington Student Achievement Council 2013) and the state’s taxpayers received $374 million in education tax credits in 2012, according to the Internal Revenue Service (Internal Revenue Service 2013). These are amounts that directly reduce the net cost of higher education and include no obligation to repay.5
Only the families in the lower two income categories would normally qualify for Pell grants, with the lowest-income student qualifying for the maximum grant of about $5,650 in 2014, or about $22,600 over four years. Eligibility phases out so that at a family income of $60,000 a student might only qualify for about $1,100, or $4,400 over four years. At the same time, however, eligibility for the tax credit phases in. The credit reimburses the first $1,000 ($4,000 over four years) of covered expenses even if the parent or student doesn’t owe any taxes—they will still get a refund. But to qualify for the maximum of $2,500 per year ($10,000 over four years), they have to earn enough to owe at least $1,500 in taxes. The credit is available to most taxpayers and only starts to phase out when the adjusted income of a married couple filing jointly reaches $160,000. After state support to institutions and family resources, this represents the third largest external resource available to finance the cost of college. Chart 4 shows the combined effects of Pell Grants and AOTC on the remaining cost of the 2+2 degree.
5 Other forms of federal grant aid and tax benefits could also be included here, but are much smaller in scale. Federal loans and work study support would be included in the student work and loan categories below.

19
CHART 4. Estimated Federal Resources to Offset Higher Education Costs
$150,000 -
$100,000 -
$50,000 -
$0
$30,000 $60,000 $80,000 $120,000
Family Income
Federal Support
Parent Contribution
State Support through Appropriations
Four-Year Cost$26,600 $14,400
$10,000
$10,000
Tax credits are included here because in federal policy they were intended to offset the cost of college and because they have the same effect on the net cost as a grant program. But they do have disadvantages that are important to note. First, they are often not widely understood nor anticipated in advance by families. Second, the benefit typically comes a year or more after the need for it first arises (entry to college) and, while applying for the credit is not difficult, there are certain strategies students can use to maximize the combined benefit of the programs that they may not understand. The Treasury Department is evaluating ways to make the tax credit more effective and better coordinated with Pell grants (U.S. Department of the Treasury 2014), but until the federal government acts, states and institutions should provide clear guidance so that every student who qualifies receives the maximum benefit of the program.
Remaining Gaps: Policy Questions for the State of Washington
Having accounted for the effect of state appropriations, parent contributions, and federal resources, the policy questions for the state become clearer, if no less controversial.
•• How should the remaining gaps be closed?
•• What are roles of state, student, institutions, private philanthropy in closing affordability gaps?
•• What is the maximum amount of borrowing that is consistent with an “affordable” degree?
•• How much is it reasonable to expect students to work while they are enrolled and how big an impact would that have on the remaining cost?

20
•• Should the state expect institutions to contribute to closing the gaps?
•• If the gaps can’t be fully closed for every student, how should the state prioritize?
There is no single right answer for these questions. The suggestions that follow are placeholders to show how different choices or answers could lead to different policy conclusions. To the extent the state is focused on its 70% attainment goal, there is empirical support for some of the recommended options grounded in research or other states’ experience. But the evidence is usually imperfect, especially as other considerations factor in—the importance of student choice, reducing debt, etc. What is important is that the state makes its key assumptions explicit, even if they need to be reviewed or changed from time to time.
Student resources / self-help
Low-income students are unlikely to have big savings accounts or other assets to fill in the remaining gaps themselves, which leave working or borrowing as the primary ways they can contribute to the cost of their education. Both have disadvantages—working takes time away from academics, and borrowing can put students at long-term financial risk, especially those who never complete their degrees. In principle, however, even low-income students have ways that they can meet some of the remaining costs themselves. The role of the state’s framework should be to set expectations of the maximum amounts of work or borrowing that would still be considered compatible with an affordable system of higher education. The State Need Grant currently assumes a student contribution of 25% of the cost of attendance, which could imply very different levels of employment or debt depending on the institution attended.
Part-time work
The days when students could work at a minimum wage job and put themselves through college without financial aid or borrowing are long gone, as college tuition prices over the last 30 years have risen much faster than inflation and the minimum wage has gone up less than the inflation rate. But nationally, about 2/3 of students do work at least part-time while enrolled and 1/3 work more than 30 hours per week. Even most students from high-income families work during college, although not as many hours as those from modest backgrounds. Older, financially independent students are the most likely to be working and to be working full-time. The lowest income dependent students are most likely to be at one extreme or the other—not working at all, or working full-time (NPSAS 2012).
Working a modest amount—15 hours per week for example—is common for both low- and middle-income students and would help close the resource gap without setting low-income students at a disadvantage to their middle-income peers.

21
Washington may decide that a higher or lower amount is more consistent with the state’s definition of affordability, but the amount here—$18,700—represents the after-tax value of working 15 hours per week during the school year for four years at the state minimum wage of $9.32 per hour.
CHART 5. Student Contribution from Part-Time Employment
$150,000 -
$100,000 -
$50,000 -
$0
$30,000 $60,000 $80,000 $120,000
Family Income
Part-Time Work (15 Hours @ Min Wage)
Federal Support
Parent Contribution
State Support through Appropriations
Four-Year Cost
$18,700 $18,700
$18,700
$18,700
Work-study programs
For students who work while enrolled, the best and most recent research suggests that employment that keeps them on campus or engaged in high quality professional experiences is probably more compatible with academic success (Scott-Clayton and Minaya 2014). Work-study programs subsidize employers, including the institution itself, who hire students to work part-time. Federal work study funds provided about $15 million to Washington students in 2013-14. In addition to the federal work study program, Washington is one of few states that has its own substantial work study fund, which matches roughly 60% in state funding with 40% in employer funding to generate about $13 million in total wages for 5,000 students each year (Washington Student Achievement Council 2013). The total level of funding is down two-thirds since the recession, however. If low-income students are expected to contribute to the cost of their education through employment, then programs like this one may help ensure that appropriate jobs, consistent with their educational goals, are available.
Student borrowing
Student loans have become a highly charged political and emotional issue in higher education, but faced with a gap between cash resources and costs, loans are an obvious and common solution for many students. In reality, there are two opposed problems with student borrowing. On the one hand, some students borrow what is clearly an unmanageable amount, especially if they end up not graduating or being underemployed at graduation. On the other

22
hand, some students are strongly debt-averse, to the point that they avoid enrolling in college at all or reduce their course loads in order to avoid debt, even if the economic cost of those choices ends up being much higher than the cost of borrowing (Boatman, Evans and Soliz 2014).
The Project on Student Debt produces the most frequently cited numbers on student loan debt. Washington’s key metrics—a reported 56% of bachelor graduates with debt, and an average of $23,293 per borrower—are both well under the national average of 70% and $29,400 (The Institute for College Access and Success 2013). Some of that, however, is probably due to lower tuition rates that were in place when 2012 graduates started college before the recession. Recent data from the Washington Student Achievement Council shows average borrowing increasing steadily with the rise in tuition (Washington Student Achievement Council 2013).
The average numbers for Washington, however, mean that 44% of graduates are finishing without debt. If their rate of zero debt is included in the average, then the average debt at graduation for Washington bachelor degree students—not considering some of the recent tuition increases—was $13,044 in the most recent report.
Even more concerning than debt of college graduates, however, is the debt of students who do not graduate. Nationally, according to one analysis, 29% of all freshmen borrowers in 2003-04 left college with no degree by 2008-09 (Nguyen 2012). Students at for-profit institutions were most likely to leave with debt and no degree, followed by students at community colleges. The high risk of non-graduation is one reason why students at community colleges should be especially cautious about borrowing.
On the other hand, students who choose not to attend college at all or to go part-time when loans could enable them to attend full-time, may be hurting their academic prospects and increasing the total cost of their degree for the sake of avoiding loans in the short-term. It is important that fear of debt not discourage students who are good risks for graduating and succeeding economically from taking advantage of low-cost loan programs with modest borrowing.
What is an appropriate target for the maximum amount of debt that the state should expect or encourage its students to take out for higher education? Some would say zero; others might set a number comparable to purchasing a new car, another type of common indebtedness. One policymaker we interviewed suggested that the amount should be repayable within a few years after graduation, allowing students to enjoy the middle class standard of living that higher education has promised. Some would suggest higher levels of debt are still affordable if the benefits of the education are commensurate.
23
For purposes of illustration, given a “new car” benchmark for student debt, $20,000 (or $5,000 per year) might be an acceptable maximum for an “affordable” four-year education. For community college students, it might be less, given their lower odds of graduation and lower average long-term earnings. The chart below assumes that community college students in the first half of a 2+2 program would have a maximum affordable borrowing level half as high as students at four-year institutions, or $2,500 per year, for a total debt at graduation of $15,000.
CHART 6. Student Contribution from Limited Borrowing
$150,000 -
$100,000 -
$50,000 -
$0
$30,000 $60,000 $80,000 $120,000
Family Income
$15,000 $15,000
$15,000 Student Loans ($2,500 at two-year, $5,000 at four-year)
Part-Time Work (15 Hours @ Min Wage)
Federal Support
Parent Contribution
State Support through Appropriations
$15,000
Institutional and private financial aid
Institutional and private sources of aid may fill in some of the remaining gap, but not in ways that state policy can easily anticipate or control. State aid, like federal aid, covers broad populations that fit general criteria within the state. Institutions and private sources of aid provide targeted funding for students, which is sometimes but not always based on financial need. In Washington, according to the Council’s most recent report, institutional aid accounted for 15% of all sources of student aid in the state (excluding the “invisible scholarship” of resident tuition rates), and other sources accounted for 4% (Washington Student Achievement Council 2013).
While this can be a very large source of support at some institutions, it is distributed unevenly across institutions and tends not to be available where there is greatest need. In Washington, the college with the largest endowment per student enrolled has fewer than 100 State Need Grant students (Bania, Burley and Pennucci 2014). Most colleges, especially those with large numbers of low-income students, have much less to work with.
One advantage of institutional aid is that institutions are closer to students and are in a better position to target aid where it will be most effective. They may know, for example, which
24
federal and state aid recipients have access to resources not captured by standard formulas and which have much less capacity to pay than those formulas would indicate.
On the other hand, institutional priorities and state priorities do not always align. If one institution has more high-need students than another, it is unlikely to shift its own aid resources to the other college’s students. Institutions are also often in a position of competing for the same students, and may use their aid budgets to attract students who would have been just as likely to graduate at another college, with no net gain for the state or country as a whole.
To attempt to balance state and institutional needs, some states have attempted to use regulation or “matching” programs to require or encourage institutions to allocate aid in certain ways. After recent steep tuition increases, for example, Washington and a number of other states, including Florida and Texas, began requiring public universities that raised tuition above certain levels to alloccate a portion of the revenue generated from tuition increases to need-based financial aid.
Note that the numbers in the appendix for private colleges assume that private institutions are charging a net price equivalent to the actual cost of education. For low-income students eligible for State Need Grant, it would seem reasonable to expect them to discount their sticker prices at least that much, if not more. Even with that level of discount, substantial gaps remain in the cost that students may not be able to cover without additional borrowing or other resources.
Framework summary and additional options
The framework above shows one way to look at affordability in Washington before getting to the question of the role of the State Need Grant in Part II. By clarifying what higher education really costs, the state can then engage in a clearer conversation about the appropriate roles of taxpayer funding, family resources, part-time work or work-study, student debt, and institutional financial aid in meeting those costs.
One outcome of that conversation could be a set of communication tools to help students and families plan for the cost of higher education, so they understand in advance what is likely to be expected of them, when and how much work or debt might be expected or required, and how much the state is contributing, even if they do not receive need-based aid.
Additionally, the state may also want to use the framework to develop other policies designed to improve affordability that could include some of the following recommended options.

25
AFFORDABILITY OPTION 2:
Focus on Cash-Flow Issues and Timing
One relatively low-cost area for reform is in helping citizens and institutions align their cash flow so the resources are available when they are needed. Possibilities for reform include:
•• Promoting long term savings plans, such as GET / other 529 plans for all income levels so that families don’t have to cover their contribution through current income alone (but do not expect that many of the lowest-income families will save)
•• Expanding, clarifying and promoting short-term payment plan options so that students and families have ways to make payments over the course of a year, rather than being faced with a large bill to pay all at once
•• Providing emergency financing, short-term forbearance on outstanding balances, or bridge loans.6
•• Developing clear advice and recommendations for students and families to maximize their federal tax benefits, possibly including ways to receive and use the funds earlier for college expenses.
Sometimes the issue is not “how much” but “when”. It is not only important to identify how much higher education costs and what resources are available to pay. To be useful, the timing also has to work—the resources need to be available at the time the bills come due.
AFFORDABILITY OPTION 3:
Use Outcomes-Based Funding to Encourage and Enable Institutional Innovation and Action
The shift to funding institutions through tuition also shifts the incentive and support structure for colleges, so that their financial success or even their viability depends on recruiting and enrolling students who can pay. Even if that is not what institutions want to focus on, they will find it increasingly difficult to thrive financially if they do not. One way to compensate is to shift a larger proportion of the remaining state funds to objectives that are important but not enabled or encouraged by a tuition-based model alone. Enrolling and graduating low-income students would probably be among those objectives.
Most states that have implemented outcomes-based funding have a significant component of the funding allocated to low-income student success, which provides both an incentive and
6 MDRC has demonstrated the potential of emergency financial interventions, often quite small, to prevent major academic setbacks, and institutions such as Georgia State and the University of Oklahoma have implemented innovative programs to help students with short-term financial issues (Baum and McClintock 2014).
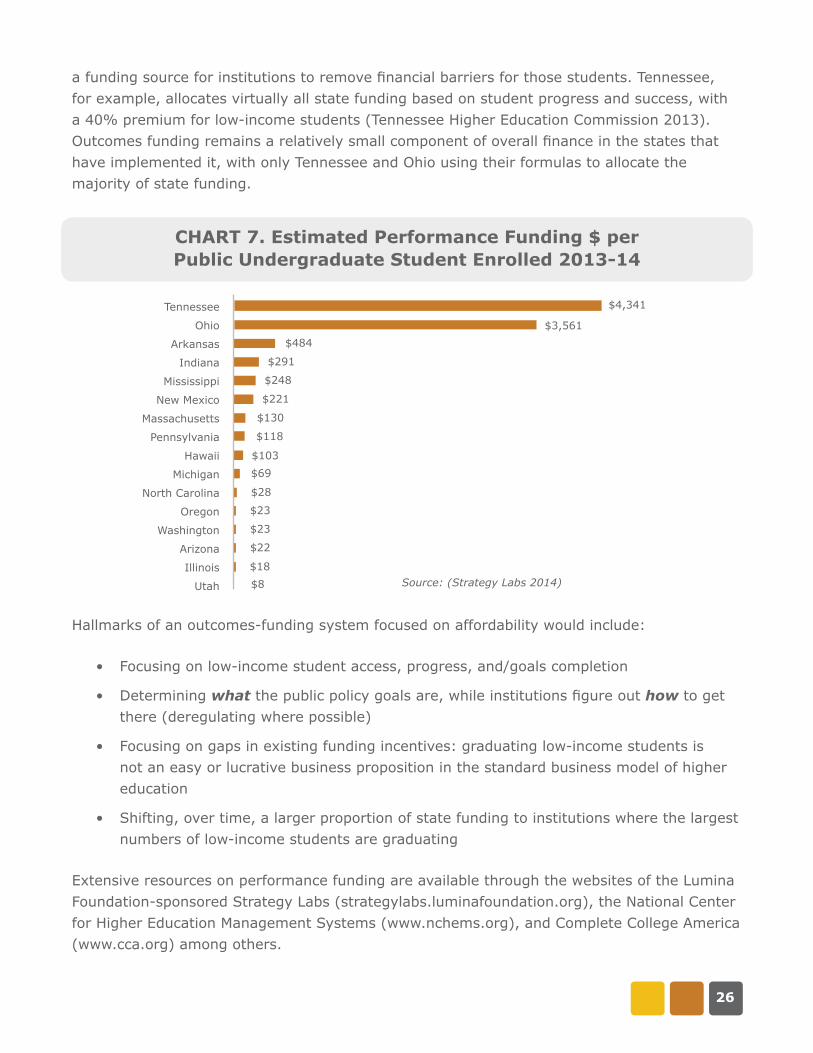
26
a funding source for institutions to remove financial barriers for those students. Tennessee, for example, allocates virtually all state funding based on student progress and success, with a 40% premium for low-income students (Tennessee Higher Education Commission 2013). Outcomes funding remains a relatively small component of overall finance in the states that have implemented it, with only Tennessee and Ohio using their formulas to allocate the majority of state funding.
CHART 7. Estimated Performance Funding $ per Public Undergraduate Student Enrolled 2013-14
Tennessee
Ohio
Arkansas
Indiana
Mississippi
New Mexico
Massachusetts
Pennsylvania
Hawaii
Michigan
North Carolina
Oregon
Washington
Arizona
Illinois
Utah
$4,341
$3,561
$484
$291
$248
$221
$130
$118 $103 $69
$28
$23
$23
$22
$18
$8 Source: (Strategy Labs 2014)
Hallmarks of an outcomes-funding system focused on affordability would include:
•• Focusing on low-income student access, progress, and/goals completion
•• Determining what the public policy goals are, while institutions figure out how to get there (deregulating where possible)
•• Focusing on gaps in existing funding incentives: graduating low-income students is not an easy or lucrative business proposition in the standard business model of higher education
•• Shifting, over time, a larger proportion of state funding to institutions where the largest numbers of low-income students are graduating
Extensive resources on performance funding are available through the websites of the Lumina Foundation-sponsored Strategy Labs (strategylabs.luminafoundation.org), the National Center for Higher Education Management Systems (www.nchems.org), and Complete College America (www.cca.org) among others.

27
AFFORDABILITY OPTION 4:
Link Budgets to Specific Institutional Policies or Conditions
An alternative approach, not compatible with the philosophy of outcomes-based funding, would be to tie the base appropriations to institutions to specific policies or conditions that favor affordability. Unlike outcomes-based funding, this approach focuses on the “how” more than the “what.” New York, for example, has entered into a broad agreement about “rational tuition” between the two major systems, SUNY and CUNY, and the legislature, a multi-year policy that more explicitly and consistently links tuition policy and state appropriations, providing consistency and predictability for institutions and students. Under the policy, tuition increases are limited and funds raised from tuition are required to be invested in student instruction and support (SUNY 2012). Institutions are also expected to control costs and find internal efficiencies to help keep price increases limited.
The most common policy that states link to appropriation is making state funds conditional on the level of resident tuition and fees charged to students. While the majority of states do this in one way or another, it tends to take place in a year-to-year (or biennial) fashion and to be less predictable than the multi-year approach New York has adopted. Washington, for example, typically uses budget language preventing or limiting tuition increases, including freezes in resident tuition rates in 2013 and 2014.
Washington is also one of thirteen states that require a portion of any tuition increase exceeding certain levels to be set aside for need-based financial aid (Carlson 2013). While this approach may be helpful in the short term at some institutions, it has limitations as a statewide policy to address affordability. Each institution has a different proportion of students with financial need, and the proportion of tuition increase that would be required to “hold harmless” low-income students varies widely. For example, Western Washington University would need to set aside about 23% of any tuition increase to keep prices constant for Pell Grant-eligible students, while Big Bend Community College would need to set aside 55% of any increase.7 In order to raise the same amount of money for its operating budget, therefore, Big Bend would need to increase tuition more than twice as much as Western, and tuition would end up going up more at the institution with the most low-income students.
To avoid this problem, Texas requires part of its “set-aside” money to be returned to the state for reallocation based on levels of low-income student enrollment at different institutions. Other states achieve a similar result by adjusting appropriations to institutions so that those with less capacity to increase tuition receive a higher proportion of direct support from the state or, like Washington, by increasing funding to state need-based aid programs.
7 Based on percent of undergraduates receiving Pell grants (NCES College Navigator 2012-13).

28
Hallmarks of a strong policy linking affordability to core higher education budgets would include:
•• Multi-year predictability for students and institutions
•• Higher proportions of state funding at institutions serving low-income students
•• Provisions to offset impacts of tuition increases
•• Mechanisms to account for different levels of student/family income at institutions in a state
The State Higher Education Executive Officers survey of state tuition and aid policies includes more detailed information on state policies to connect tuition and appropriations (Carlson 2013).
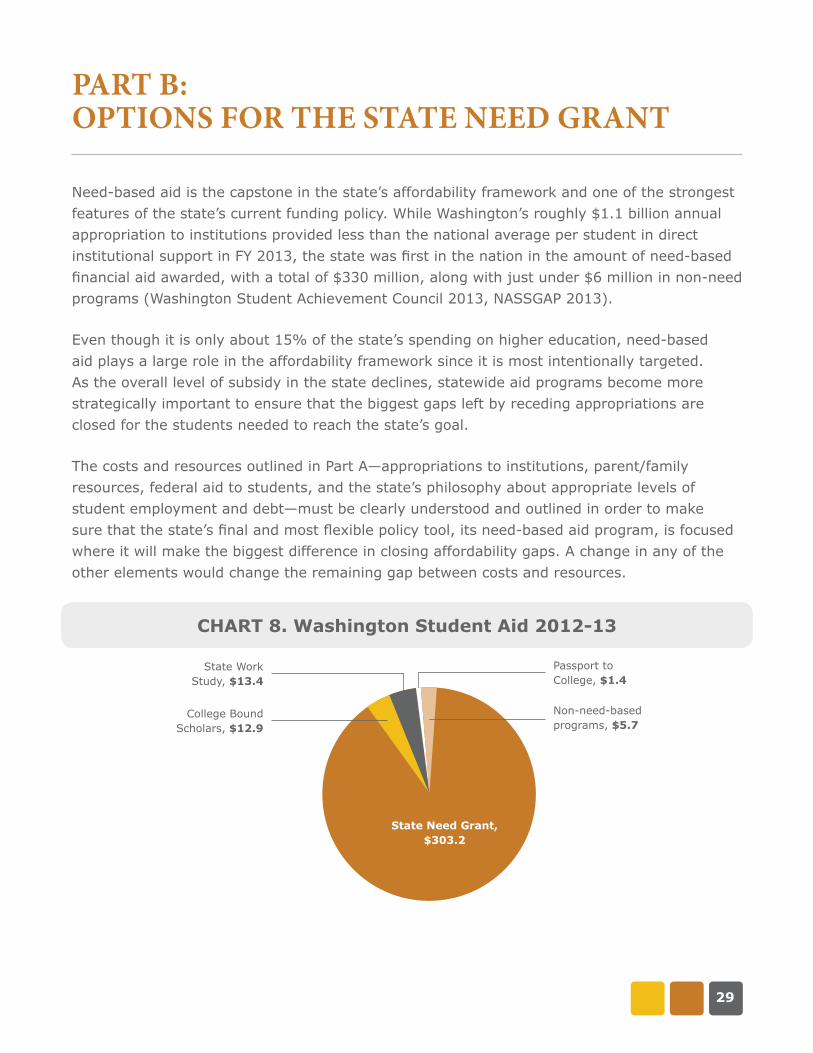
29
PART B: OPTIONS FOR THE STATE NEED GRANT
Need-based aid is the capstone in the state’s affordability framework and one of the strongest features of the state’s current funding policy. While Washington’s roughly $1.1 billion annual appropriation to institutions provided less than the national average per student in direct institutional support in FY 2013, the state was first in the nation in the amount of need-based financial aid awarded, with a total of $330 million, along with just under $6 million in non-need programs (Washington Student Achievement Council 2013, NASSGAP 2013).
Even though it is only about 15% of the state’s spending on higher education, need-based aid plays a large role in the affordability framework since it is most intentionally targeted. As the overall level of subsidy in the state declines, statewide aid programs become more strategically important to ensure that the biggest gaps left by receding appropriations are closed for the students needed to reach the state’s goal.
The costs and resources outlined in Part A—appropriations to institutions, parent/family resources, federal aid to students, and the state’s philosophy about appropriate levels of student employment and debt—must be clearly understood and outlined in order to make sure that the state’s final and most flexible policy tool, its need-based aid program, is focused where it will make the biggest difference in closing affordability gaps. A change in any of the other elements would change the remaining gap between costs and resources.
CHART 8. Washington Student Aid 2012-13
Non-need-based programs, $5.7
Passport to College, $1.4
College Bound Scholars, $12.9
State Need Grant,$303.2
State Work Study, $13.4

30
A recent study by the Washington State Institute for Public Policy found positive impacts of the grant on student retention, consistent with similar well-designed evaluations of need-based financial aid programs in other states (Burley and Lemon 2012).8 They conclude that there is a four to eight percentage point change in graduation rates associated with a 25% change in the State Need Grant award amount. That level of impact is typical of findings in other states (Bettinger 2011) and provides good justification for investing in the program while ensuring that it is designed and targeted to make it as effective as possible.
Design principles for 70% attainment goal
If the goal of affordability is to increase attainment within the state, then the State Need Grant should be designed and administered in ways that maximize its impact on the goal. Consistent with high quality experimental or quasi-experimental research (Dynarski and Scott-Clayton 2013), principles for design of the program would include:
•• Use financial aid dollars as both incentive (encouraging students to do things that are in their own long-term interests) and support (enabling them to do those things)
•• Make programs and policies simple, transparent, and predictable
•• Size the awards for maximum impact; narrow the biggest gaps left after other resources are maximized
•• Target students whose outcome is most likely to change (not necessarily the poorest or the most meritorious) as a result of the investment
More than the vast majority of other states, Washington is already doing all of these things and is a leader for others to follow. Yet the preliminary gap analysis illustrated in the appendix shows there are some degree pathways and some students for whom significant gaps in affordability remain after reasonable assumptions about available resources are taken into account. The largest gaps are most likely to be an obstacle to progress and completion, and focusing available financial aid funds on those gaps.
Preliminary gap analysis
Using the assumptions outlined in Part A, after state appropriations, parental contributions, federal resources, and modest student contributions through borrowing and part-time work are taken into account, our initial analysis found large remaining affordability gaps for some students and some degree pathways while for others the gaps were minimal or nonexistent.
8 Researchers’ ability to detect the impact of aid is limited because state programs are generally available to all who qualify, and there is no control group of otherwise identical students who did not get the grant.
31
The largest gaps, with the greatest potential impact on the state’s 70% goal, included:
•• The lowest-income (<50% of state median income) eligible students who do not receive State Need Grant (primarily at community colleges)
• Lower-income students (50-70% of state median income) at four-year comprehensive and research universities who are eligible but do not receive reduced State Need Grants
• Lower- and middle-income students at research universities, even with their State Need Grants fully funded
• Lowest to middle-income students at private institutions, with or without State need Grant
Note that while the lowest income students who do not receive awards are left with significant affordability gaps, the students in that category who are awarded grants end up with significantly more total resources than students whose family incomes are only slightly higher, due to the steep combined phase out of Pell and State Need Grants (see Option 2 below). The findings of the Washington State Institute for Public Policy study suggested that the steep drops in award levels across income levels had a significant effect on completion (Bania, Burley and Pennucci 2014). Adjusting the size of the highest awards to make the phase out more gradual would result in a more equitable and efficient distribution of funds to a larger number of students.
Based on the design principles and gap analysis above, we are presenting several options to make the State Need Grant a more effective component of the state’s affordability strategy.
STATE NEED GRANT OPTION 1:
Close the Eligibility / Funding Gap to Serve More Students
Financial aid research, as well as research in related public policy areas, has demonstrated that financial support is most effective when it is clearly understood and predictable for the population it is intended to serve (Dynarski and Scott-Clayton, Financial Aid: Lessons from Research 2013). That is not currently the case with the State Need Grant. Despite clear published criteria for eligibility, the fact that not all eligible students are funded makes the system opaque; they only learn of their award after they have made many of their most important college-related decisions. Predictability and transparency could make the same aid dollar more effective by giving it a better chance and more time to have an effect on students’ planning and choices.
The first option for the State Need Grant, therefore, is to close the gap, either by increasing funding to cover eligible students or by aligning eligibility criteria and award amounts with the budget, so that any investment the state does choose to make through this important program has a greater impact.

32
Option 1a: Serve More Students by Increasing Funding
Increasing funding to close the eligibility gap could increase access and completion rates for low-income students in two ways. First, as the study by the Washington State Institute for Public Policy demonstrated, the program as it is currently structured has a positive impact, so additional funds would be going into a program with a demonstrated effect. Secondly, by closing the eligibility gap, the investment would likely increase the impact of the existing investment by making the program as a whole more predictable. In addition to having an impact on retention, it would make it possible for students to count on the funds in their college planning process, with likely positive impacts on rates of college preparation and enrollment.
A recent estimate of the cost of fully funding the program is $123 million (Washington Student Achievement Council 2014). In order to sustain the program over time—in years when tax revenues shrink as well as when they grow—the state would need to adopt a principle of funding the State Need Grant program before funding other discretionary budget items. If the legislature does protect or expand the total pool of funds available for higher education, that could mean that appropriations to institutions would be subject to more variability, as they have been in California, where Cal Grants come first in budget deliberations.
Chart 9 shows how the State Need Grant effectively closes the remaining affordability gap for the lowest-income students in a 2+2 degree pathway, assuming that they contribute part of the cost through modest levels of work or borrowing. At four-year public and private colleges, most of the students at the lowest income level—50% of the state’s median family income—currently receive the grant or could be guaranteed support at current funding levels. At community colleges, however, many of the 18,800 unserved but eligible students (Washington Student Achievement Council 2013) are at the lowest income level and their institutions do not have funds to support every student even at the lowest income points.

33
CHART 9. Effect of State Need Grant if Fully Implemented for Students at 50% of Median Family Income
$150,000 -
$100,000 -
$50,000 -
$0 $30,000 $60,000 $80,000 $120,000
Family Income
State Need Grant (with funding at 50% MFI level)
Student Loans ($2,500 at two-year, $5,000 at four-year)
Part-Time Work (15 Hours @ Min Wage)
Federal Support
Parent Contribution
State Support through Appropriations
$29,800 $0
$0
$0
Chart 10, along with the tables in Appendix 1, shows the effect of fully funding the program as currently established in policy, with all students in the 50-70% of the median family income range receiving awards at the levels set by the matrix. In practice many institutions prioritize the lowest income students when selecting which eligible students receive awards. This often leaves those with slightly higher family incomes without awards. Fully funding the program would close the remaining gap for students who are often not currently served.

34
CHART 10. Effect of State Need Grant if Fully Implemented (up to 70% Median Family Income)
$150,000 -
$100,000 -
$50,000 -
$0
$29,800 $14,900
$0
$0
$30,000 $60,000 $80,000 $120,000
Family Income
State Need Grant (with funding at 50% MFI level)
Student Loans ($2,500 at two-year, $5,000 at four-year)
Part-Time Work (15 Hours @ Min Wage)
Federal Support
Parent Contribution
State Support through Appropriations
Option 1b: Serve More Students by Altering Award Amounts
If the state cannot commit to fully funding all eligible students at current award levels, an alternative would be to adjust award amounts so that all eligible students could be covered. Our preliminary gap analysis suggests that adjusting amounts would help close more affordability gaps than the alternative, which would be reducing the number of eligible students in order to fully fund those who remain.
Support for the State Need Grant in Washington is very strong, and there are risks to altering its basic structure, not least of which is the possibility that support for it could weaken if it changes too much. Yet if it cannot be funded at the levels established in policy, then the state should consider modifying award levels to be consistent with its funding commitment. That would make the same level of investment more effective since it would be something students and potential students could count on and that the state could use to encourage college preparation, application, and enrollment.
A more comprehensive reform, however, could also have the result of expanding the number of students served, but would require adoption of additional changes to the program’s structure as outlined in options 2, 3, and 4.

35
STATE NEED GRANT OPTION 2:
Change Use of Median Family Income to Determine Eligibility
Median Family Income, adjusted for family size, is currently the primary eligibility criterion for State Need Grant. The potential advantage of this approach, if the current program were fully funded, is that it is relatively easy to see where a given student or family would fall, without having to go through complicated formulas or calculators.
On the other hand, the use of a different measure of eligibility from the federal formula makes the total amount of support difficult to predict. Since the federal formula takes assets into account, the state program sometimes allocates funds to students who wouldn’t qualify under federal standards. The Washington State Institute for Public Policy’s analysis of program recipients found that about 5% of State Need Grant recipients did not qualify for Pell, virtually all of whom were in the 51-70% MFI range (Bania, Burley and Pennucci 2014).
CHART 11. Total State and Federal Support by Percent of Washington Median Family Income (Research University)
$20,000 -
$15,000 -
$10,000 -
$5,000 -
$0 -
30% 40% 50% 60% 70% 80%
Pell State Need Grant American Opportunity Tax Credit
Percent of Median Family Income, Family of Four
The state formula also combines with the federal formula to results in a steep drop in combined benefits for students and families at certain income levels. For a family of four with an income of $50,000, Fridley’s model shows that for every dollar of additional state income they would lose 74 cents in Pell and State Need Grant benefits. The American Opportunity Tax Credit was designed to soften the effect of the phase out of Pell grant benefits, but Washington has nothing similar for the state program. 9
9 Chart 11 phase-out based on information from WSAC’s affordability model and tax credit estimates from H&R Block’s 2013 tax estimating tool.

36
To balance the value of transparency with the potential for more predictability and effective allocation of aid, the state could continue to use MFI to establish minimum eligibility, but use the federal formula to allocate the award at higher levels. The state could then combine its award with federal dollars to establish more predictable levels of total grant support.
This would combine the advantages of the Shared Responsibility Framework that Minnesota uses with the greater transparency and predictability of an income-based award. It would also allow the state to establish a smoother “phase-out” of benefits that coordinates with federal grant phase-out.
•• Guarantee a meaningful minimum combined award of state and federal assistance (e.g. $2,000) for all students with family incomes at 70% or less of the state median
•• Use a gap analysis to establish a scale for higher awards that sets the total combined amount of state and federal aid students should expect at different levels of need (EFC) at different institutions
•• Communicate the minimum and maximum amounts early and often to potential students (e.g. “If your income is less than X, you are guaranteed to receive at least $2,000 and up to $15,000 from the state and federal government to help pay your college expenses.”)
•• Include estimates of federal tax credit eligibility in setting total award amounts, with clear information on how to obtain them
STATE NEED GRANT OPTION 3:
Improve Transparency and Impact with Early Commitments of State Need Grant Funds
Some groups of potential students would almost certainly qualify for State Need Grant if they applied and enrolled. By identifying these groups and guaranteeing them in advance the financial support they would likely receive anyway, the state magnifies the impact of the investment by turning it into an incentive for college enrollment.
The College Bound Scholarship is one such pre-commitment of State Need Grant dollars. Like similar programs in Indiana and Oklahoma, it is intended give aid a bigger opportunity to affect students’ choices, goals, and plans. Results from these programs are promising. One recent randomized controlled experiment in Canada found that rates of college graduation doubled for low-income high school students who received early commitments of college grants compared to a control group (Social Research and Demonstration Corporation 2014). Given the current litigation and controversy over spending on K-12 education in Washington, programs that improve outcomes for high school students could be considered part of the state’s investment at both the postsecondary and secondary levels.

37
Using logic similar to the College Bound Scholarship, the state should also consider other ways to let potential students know in advance what they will qualify for. This could include:
•• Place-bound transfer students
• Students/families eligible for food stamps, Medicaid, or other government programs tied to income levels that would qualify for State Need Grant
• Pell-eligible Washington residents who transfer from institutions not participating in State Need Grant
STATE NEED GRANT OPTION 4:
Establish a Reserve for Predictability and Institutional Discretion
If funding and eligibility are aligned, every student who qualifies receives a predictable award that can be established and communicated by the state in advance. This means sufficient funds must be available to allow for unexpected changes in participation rates or eligibility levels. A reserve provision should be established that would ensure at least two years’ advance warning of any change in the program (longer for College Bound Scholarships and other commitments). High school seniors and others considering initial college enrollment in a given application cycle should always be able to accurately estimate their eligibility without fear of changes prior to their first day of classes.
Given the unpredictability of demand, especially in the first years of a revised program, initial award levels should be established conservatively, so that only 80-85% of appropriations are committed based on the statewide formula. The balance, once all students were funded, could be transferred to institutions to use to fill in gaps left by the state formula, deal with unexpected emergencies, provide summer assistance to eligible students, etc.
If demand projections changed unexpectedly, however, the remaining amount could also be held in reserve at the agency to cover the following year’s statewide commitment. This approach would retain some of the advantages of institution-based awarding while also keeping the advantage of statewide transparency and predictability for the basic award levels.
STATE NEED GRANT OPTION 5:
Support and Encourage Progress
Affordability policies and aid programs should be designed to encourage and enable students to progress on-time to graduation or as close to that pace as they can. Extended time-to-degree beyond the standard four years for a bachelor’s degree or two years for an associate degree has huge implications for affordability. An additional year in college removes one year
38
of a college graduate-level income from a student’s working life, at a net cost of more than $50,000 in addition to any additional tuition, fees, or books.10 Yet students and institutions sometimes make choices to save small amounts of money in the short term, in spite of the much larger long-term cost (Boatman, Evans and Soliz 2014).
Incentive programs based on college grades have significant disadvantages. If the grades required are higher than what is needed to get a degree, then students who fall below the threshold and lose eligibility could be at a higher risk of dropping out and not completing. They can also encourage students to reduce their rate of progress by dropping or repeating courses in order to raise their grades.
On the other hand, states and institutions that have actively promoted higher course loads (as opposed to higher grades) and faster rates of progress have generally been successful and fears that retention rates could decline if students take more courses have not been well founded. West Virginia experienced significant increases in graduation rates when it instituted a 30 credit hour annual course completion requirement for its merit scholarship program (Scott-Clayton 2011). Indiana has recently built an incentive for course completion into its need-based aid programs. Hawai’i, Indiana, and Utah, along with individual institutions in other states, have created campaigns around the concept of “15 to Finish” that have increased course loads with no decline in student retention rates (Baumgartner 2014). A series of controlled experiments conducted by MDRC on college campuses around the country also generally found that students increased their rates of credit accumulation with no decline in retention rates (Patel and Richburg-Hayes 2012). A summary of rigorous research on financial aid programs concluded that using programs as both incentive and support was likely to increase their impact (Dynarski and Scott-Clayton 2013).
In Minnesota’s shared responsibility model, the state sets the maximum combined state/federal award based on 15 hour course loads and prorates the combined award for any lower level of attendance. The National Association of Student Financial Aid Administrators has also proposed changes to the Pell grant that would provide support for 15 credit attendance and allow more flexibility to use the award year-round (National Association of Student Financial Aid Administrators 2013).
Washington’s policies in this regard are already stronger than in most states. To graduate on time, students need to enroll in an average of fifteen quarter or semester credits per term. The amount of Federal Pell grants and most state grants, however, is capped at twelve credit hours per term; students get no additional aid if they take more. The State Need Grant, however, is tied to tuition, and will cover up to fifteen hours. In addition, quarter system courses in Washington are typically five credit hours, so students cannot easily drop below
10 Based on median income for a Washington bachelor’s degree holder of $52,900 from the American Community Survey 2012.

39
fifteen hours without reducing their Pell grant eligibility. But neither federal nor state programs cover the additional cost of books and supplies or the higher opportunity cost of fifteen hours.
In Washington, a revised State Need Grant program designed to promote progress and support both full-time and part-time students could:
•• Establish each student’s maximum combined state/federal award based on the assumption of 15 hours per quarter or 45 per year (30 in semester systems)
• Prorate the award for any level below that, so part-time students receive a proportionate per credit level of combined state/federal aid
• Include a communications campaign focused on the importance of on-time progress and completion
• Include additional incentives for completing a certain number or proportion of credit hours per year

40
Lowest
Income (up to $30,000)
Lower Income ($30-
$60,000)
Middle Income
($80,000)
Upper Middle ($120,000)
Research Univs. Estimated $ $ 127,200 $ 127,200 $ 127,200 $ 127,200
Comprehensive Univs. Estimated $ $ 97,200 $ 97,200 $ 97,200 $ 97,200
2+2 Degree (WCTCS to Comprehensive)
Estimated $ $ 93,200 $ 93,200 $ 93,200 $ 93,200
Private Nonprofit (WA) Estimated $ $ 134,800 $ 134,800 $ 134,800 $ 134,800
APPENDIX: GAP ANALYSIS FOR ALTERNATIVE DEGREE PATHWAYS
1. Start with Total Estimated Institutional and Student Cost of the Degree
2. Subtract what the State Contributes through Appropriations to Institutions (Invisible Scholarships)
Lowest
Income (up to $30,000)
Lower Income ($30-
$60,000)
Middle Income
($80,000)
Upper Middle ($120,000)
Research Univs. Estimated $ $ 21,600 $ 21,600 $ 21,600 $ 21,600
Remaining $ 105,600 $ 105,600 $ 105,600 $ 105,600
Comprehensive Univs. Estimated $ $ 8,000 $ 8,000 $ 8,000 $ 8,000
Remaining $ 89,200 $ 89,200 $ 89,200 $ 89,200
2+2 Degree (WCTCS to Comprehensive)
Estimated $ $ 13,400 $ 13,400 $ 13,400 $ 13,400
Remaining $ 79,800 $ 79,800 $ 79,800 $ 79,800
Private Nonprofit (WA) Estimated $ $ - $ - $ - $ -
Remaining $ 134,800 $ 134,800 $ 134,800 $ 134,800
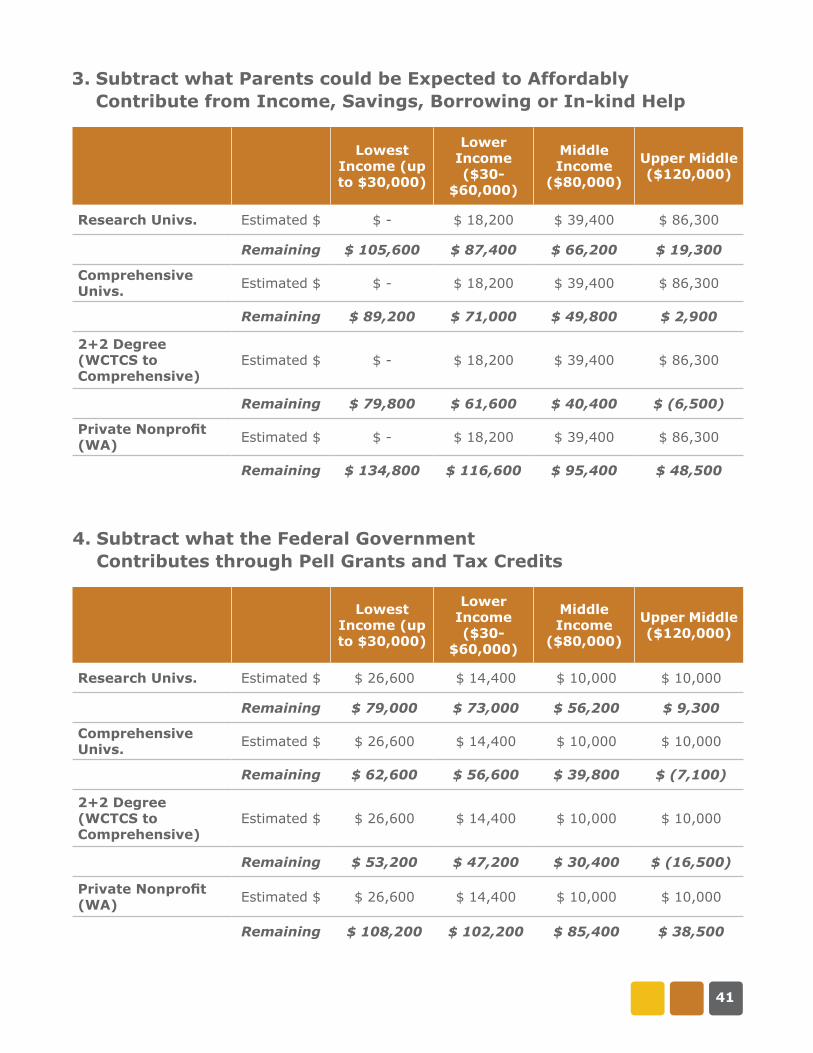
41
3. Subtract what Parents could be Expected to Affordably Contribute from Income, Savings, Borrowing or In-kind Help
Lowest
Income (up to $30,000)
Lower Income ($30-
$60,000)
Middle Income
($80,000)
Upper Middle ($120,000)
Research Univs. Estimated $ $ - $ 18,200 $ 39,400 $ 86,300
Remaining $ 105,600 $ 87,400 $ 66,200 $ 19,300
Comprehensive Univs. Estimated $ $ - $ 18,200 $ 39,400 $ 86,300
Remaining $ 89,200 $ 71,000 $ 49,800 $ 2,900
2+2 Degree (WCTCS to Comprehensive)
Estimated $ $ - $ 18,200 $ 39,400 $ 86,300
Remaining $ 79,800 $ 61,600 $ 40,400 $ (6,500)
Private Nonprofit (WA) Estimated $ $ - $ 18,200 $ 39,400 $ 86,300
Remaining $ 134,800 $ 116,600 $ 95,400 $ 48,500
Lowest
Income (up to $30,000)
Lower Income ($30-
$60,000)
Middle Income
($80,000)
Upper Middle ($120,000)
Research Univs. Estimated $ $ 26,600 $ 14,400 $ 10,000 $ 10,000
Remaining $ 79,000 $ 73,000 $ 56,200 $ 9,300
Comprehensive Univs. Estimated $ $ 26,600 $ 14,400 $ 10,000 $ 10,000
Remaining $ 62,600 $ 56,600 $ 39,800 $ (7,100)
2+2 Degree (WCTCS to Comprehensive)
Estimated $ $ 26,600 $ 14,400 $ 10,000 $ 10,000
Remaining $ 53,200 $ 47,200 $ 30,400 $ (16,500)
Private Nonprofit (WA) Estimated $ $ 26,600 $ 14,400 $ 10,000 $ 10,000
Remaining $ 108,200 $ 102,200 $ 85,400 $ 38,500
4. Subtract what the Federal Government Contributes through Pell Grants and Tax Credits

42
Lowest Income (up to $30,000)
Lower Income ($30-
$60,000)
Middle Income
($80,000)
Upper Middle ($120,000)
Research Univs. Estimated $ $ 18,700 $ 18,700 $ 18,700 $ 18,700
Remaining $ 60,300 $ 54,300 $ 37,500 $ (9,400)
Comprehensive Univs. Estimated $ $ 18,700 $ 18,700 $ 18,700 $ 18,700
Remaining $ 43,900 $ 37,900 $ 21,100 $ (25,800)
2+2 Degree (WCTCS to Comprehensive)
Estimated $ $ 18,700 $ 18,700 $ 18,700 $ 18,700
Remaining $ 34,500 $ 28,500 $ 11,700 $ (35,200)
Private Nonprofit (WA) Estimated $ $ 18,700 $ 18,700 $ 18,700 $ 18,700
Remaining $ 89,500 $ 83,500 $ 66,700 $ 19,800
5. Subtract an Amount that Students could Reasonably be Expected to Earn from Work (Example = 15 hrs/week at state minimum wage)
Lowest
Income (up to $30,000)
Lower Income ($30-
$60,000)
Middle Income
($80,000)
Upper Middle ($120,000)
Research Univs. Estimated $ $ 20,000 $ 20,000 $ 20,000 $ 20,000
Remaining $ 40,300 $ 34,300 $ 17,500 $ (29,400)
Comprehensive Univs. Estimated $ $ 20,000 $ 20,000 $ 20,000 $ 20,000
Remaining $ 23,900 $ 17,900 $ 1,100 $ (45,800)
2+2 Degree (WCTCS to Comprehensive)
Estimated $ $ 15,000 $ 15,000 $ 15,000 $ 15,000
Remaining $ 19,500 $ 13,500 $ (3,300) $ (50,200)
Private Nonprofit (WA) Estimated $ $ 20,000 $ 20,000 $ 20,000 $ 20,000
Remaining $ 69,500 $ 63,500 $ 46,700 $ (200)
6. Subtract an Amount Students could Borrow and Still Consider “Affordable” (Example = $5,000 per year for 4-year, $2,500 for CTCS)

43
Lowest
Income (up to $30,000)
Lower Income ($30-
$60,000)
Middle Income
($80,000)
Upper Middle ($120,000)
Research Univs. Estimated $ $ 43,500 $ - $ - $ -
Remaining $ (3,200) $ 34,300 $ 17,500 $ (29,400)
Comprehensive Univs. Estimated $ $ 30,000 $ - $ - $ -
Remaining $ (6,100) $ 17,900 $ 1,100 $ (45,800)
2+2 Degree (WCTCS to Comprehensive)
Estimated $ $ 29,800 $ - $ - $ -
Remaining $ (10,300) $ 13,500 $ (3,300) $ (50,200)
Private Nonprofit (WA) Estimated $ $ 34,100 $ - $ - $ -
Remaining $ 35,400 $ 63,500 $ 46,700 $ (200)
7. Determine How Much State Need Grant Provide if all Students up to 50% of MFI were Covered
8. Determine How Much State Need Grant would Provide if all Students up to 70% of MFI were Covered
Lowest
Income (up to $30,000)
Lower Income ($30-
$60,000)
Middle Income
($80,000)
Upper Middle ($120,000)
Research Univs. Estimated $ $ 43,500 $ 21,750 $ - $ -
Remaining $ (3,200) $ 12,550 $ 17,500 $ (29,400)
Comprehensive Univs. Estimated $ $ 30,000 $ 15,000 $ - $ -
Remaining $ (6,100) $ 2,900 $ 1,100 $ (45,800)
2+2 Degree (WCTCS to Comprehensive)
Estimated $ $ 29,800 $ 14,900 $ - $ -
Remaining $ (10,300) $ (1,400) $ (3,300) $ (50,200)
Private Nonprofit (WA) Estimated $ $ 34,100 $ 17,050 $ - $ -
Remaining $ 35,400 $ 46,450 $ 46,700 $ (200)
44
WORKS CITED
Bania, N., M. Burley, and A. Pennucci. The Effectiveness of Washington’s State Need Grant Program: Final Evaluation Report. Olympia, WA: Washington State Institute for Public Policy, 2014.
Baum, Sandy, and Jennifer Ma. Trends in College Pricing. Report, New York: College Board, 2013.
Bettinger, Eric. Financial Aid: A Blunt Instrument for Improving Degree Attainment. Washington, DC: American Enterprise Institute, 2011.
Boatman, Angela, Brent Evans, and Adela Soliz. Applying the Lessons of Behavioral Economics to Improve the Federal Student Loan Programs: Six Policy Recommendations. Indianapolis: Lumina Foundation, 2014.
Burley, M., and M. Lemon. State Need Grant: Student Profiles and Outcomes. Olympia, WA: Washington State Institute for Public Policy, 2012.
Campaign for College Opportunity. “The Real Cost of College: Time and Credits to Degree in California.” Los Angeles, 2014.
Carlson, Andrew. State Tuition, Fees, and Financial Assistance Policies 2012-13. Boulder: State Higher Education Executive Officers, 2013.
Cowen, Tyler, and Alex Tabarrok. Modern Principles of Economics. New York: Worth, 2009.
Crandall-Hollick, Margot. The American Opportunity Tax Credit: Overview, Analysis and Policy Options. Washington DC: Congressional Research Service, 2014.
Dynarski, Susan. High Income Families Benefit Most from New Savings Incentives. Washington DC: Urban-Brookings Tax Policy Center, 2005.
Dynarski, Susan, and Judith Scott-Clayton. “Financial Aid: Lessons from Research.” The Future of Children: Postsecondary Education in the United States, 2013: 67-91.
Howard, George E. “The State University in America.” The Atlantic Monthly, March 1891: 332-353.
Internal Revenue Service. Tax Statistics Tables 2012, Table 2. Washington, DC: IRS, 2013.
45
Johnson, Nate. College Costs, Prices and the Great Recession. Indianapolis: Lumina Foundation for Education, 2014.
Johnson, Nate. What Does A College Degree Cost? Comparing Approaches to Cost Per Degree. White Paper, Washington, DC: Delta Project on Postsecondary Costs, 2008.
NASSGAP. 43rd Annual Survey Report on State-Sponsored Student Financial Aid, 2011-2012 Academic Year. NASSGAP, 2013.
National Association of Student Financial Aid Administrators. Reimagining Financial Aid to Improve Student Access and Outcomes. Washington, DC: NASFAA, 2013.
Nguyen, Mary. Degreeless in Debt: What Happens to Borrowers Who Drop Out. Washington, DC: Education Sector, 2012.
Prescott, Brian, and David Longanecker. States in the Driver’s Seat: Leveraging State Aid to Align Policies and Promote Access, Success, and Affordability. Boulder: Western Interstate Commission for Higher Education, 2013.
Scott-Clayton, Judith. “The Causal Effect of Federal Work-Study Participation.” Educational Evaluation and Policy Analysis, 2011.
Scott-Clayton, Judith, and Veronica Minaya. “Should Student Employment Be Subsidized? Conditional Counterfactuals and the Outcomes of Work-Study Participation.” National Bureau of Economic Research, 2014.
Social Research and Demonstration Corporation. “Putting higher education access programs to the test.” www.sdrc.org. August 25, 2014. http://www.srdc.org/news/putting-higher-education-access-programs-to-the-test.aspx (accessed September 13, 2014).
State Higher Education Executive Officers. State Higher Education Finance Report - FY 2012. Boulder: State Higher Education Executive Officers, 2013.
Strategy Labs. “How Much are States Investing in Outcomes-Based Funding.” strategylabs.luminafoundation.org. April 2014. http://strategylabs.luminafoundation.org/wp-content/uploads/2013/03/OBF-Table_Notes.pdf (accessed September 13, 2014).
The Carnegie Foundation for the Advancement of Teaching. Higher Education: Who Pays? Who Benefits? Who Should Pay? New York: McGraw-Hill, 1973.
The Institute for College Access and Success. “The Project on Student Debt.” projectonstudentdebt.org. 2013. http://projectonstudentdebt.org/state_by_state-data.php (accessed July 21, 2014).

46
U.S. Department of the Treasury. Report to Congress on Coordinating the American Opportunity Tax Credit and the Federal Pell Grant. Washington DC: U.S. Department of the Treasury, 2014.
Washington Student Achievement Council. A Model to Examine Affordability in the State of Washington. Olympia, 2013.
Washington Student Achievement Council. State Grant Programs Review 2011-12 and 2012-13. Washington Student Achievement Council, 2013.
—. “Strategic Action Plan--Council Approval of Recommendations.” Washington Student Achievement Council. August 21, 2014. http://www.wsac.wa.gov/sites/default/files/2014.08.21.051.SAP.pdf (accessed September 13, 2014).
Washington Student Achievement Council. Student Financial Aid and Access Programs Annual Report 2011-12 and 2012-13. Olympia: Washington Student Achievement Council, 2013.

E D U C A T I O N • O P P O R T U N I T Y • R E S U L T S
Affordability Interactive Model
Name, TitlePhone | Email
www.wsac.wa.gov
Marc Webster, Senior Fiscal Policy Advisor360-753-7862 | [email protected]
www.wsac.wa.gov
Washington needs an affordability framework
Student work
Student loans
Philanthropy
Parent contribution
Familysavings
Institutional�nancial aid
State subsidy to institutions
Federal grants
State grants
Washington needs an affordability framework to coordinate institutional appropriations, tuition, and financial aid. The framework will explain the impact of funding policies on all students. It will develop parameters to define reasonable levels for debt, work, and savings. This will demonstrate the affordability of postsecondary education for all students.
A framework will also support policy-driven decisions that make higher education more affordable for all students. It will do this by recommending policies to reduce the volatility in tuition increases, curb student debt, and increase investments in postsecondary education. The framework will account for the role of the federal government, institutions, and private funders.
Without a framework to guide appropriations and intentionally link them to need-based aid and tuition policies, Washington will continue to focus on separate pieces of the overall higher education funding puzzle. With a framework, the state can clearly delineate the responsibility of the student, the school, and the state, and thus target state appropriations to make the system more affordable.
The Council has collaborated with Dr. Jim Fridley, professor at the University of Washington, to develop an Affordability Interactive Model (AIM) that reflects the various financing components by income level. The model elucidates the interconnectivity between federal and state financial aid policies as well as state higher education funding and tuition decisions. As policymakers explore changes to state higher education funding and financial aid policies, the model demonstrates the impact on students and families.
AIM shows affordability from the perspective of a family’s ability to cover the cost of attendance. The model allows users to manipulate the relative contributions of major student funding components based on state and federal policies. These include:
• Savings• Parent income• Student income from work• Pell Grant• State Need Grant• Institutional aid and scholarships• Student loans
An Affordability Framework for Washington State

Affordability Interactive Model
Dr. James FridleyProfessor, University of Washington
206-543-6993 | [email protected]
Interactive Model Improves Understanding of Affordability
• AIM demonstrates the difficulty low-income families experience in paying or saving for postsecondary education.
• AIM shows that—even with the federal Pell Grant, State Need Grant, and institutional aid included—there are still financing gaps for the lowest-income students, which must be met through student work, student loans, or other means.
• State Need Grant is currently funded to serve about 70 percent of eligible students. AIM visually displays the importance of this tuition assistance for the 70,000 students who are served by the program—and the significant gap for the more than 30,000 students who are unable to receive it—when the program is removed from the display.
• After all financing components are activated in the model, there is a clear gap in unmet financing or presumed debt for the middle/moderate income students. These students are not eligible for grant assistance and have less capacity to save and cover expenses using parental income.
• AIM shows the important role of state appropriations to institutions in offsetting tuition costs.
AIM displays the amount of state subsidy to the institution, tuition, and the remaining costs to attend postsecondary education. The user may select from any of the following sectors: public two-year, public regional, public research, or private non-profit four-year institutions.
Fund sources are displayed as a percentage of the cost of attendance by income range. The user may interactively adjust policy assumptions such as:
• Number of years of savings.
• Savings interest rate.
• Percent of available income applied to savings.
• Number of years of college attendance.
• Percent change in tuition.
• Percent of available income while in college.
• Number of hours a student may work.
AIM helps policymakers develop a common understanding of higher education affordability for Washington students.

Washington Student Achievement Council Page 69
APPENDIX C
WSAC State Student Financial Aid Programs Projected Expenditures
Program Description # Students FY 2015
State Need Grant Provides tuition assistance for students from low-
income families to provide access to and support
completion in postsecondary education.
74,000 $308 M
College Bound
Scholarship
Early commitment of state financial aid to middle
school students from low-income families to
increase high school graduation and
postsecondary success.
12,000 $33 M
State Work Study Provides students with work opportunities that
help pay college costs and develop skills.
Leverages employer contributions.5
5,000 $13 M
Passport to College Assists former foster youth with grant assistance to
support enrollment and completion.6
400 $1.3 M
Aerospace Loan Program Provides low-interest loans to students in short
certificate aerospace training programs.
200 480 K
Health Professional Provides loan repayment or conditional
scholarships to students willing to serve as
providers in healthcare professional shortage
areas. Provides a state dollar for dollar match to
the federal program.
18 $525 K
WAVE Scholarship funding provided for previously
selected vocational students.
25 $150 K
Washington Scholars Scholarship funding provided for previously
selected high achieving students.
10 $99 K
Totals $356 M
Appropriations for Student Support Activities
Program Purpose FY 2015
Leadership 1000
Scholarship7
Provides funding to College Success Foundation
for scholarship fund raising and administration,
and to match private donors with needy students
through scholarships and mentoring.
$1.5 M
State Expanded GEAR UP Matches federal funding and expands college
readiness program services in high poverty
middle and high schools.
$1 M
Child Care Matching
Grants Assists institutions in providing accessible and
affordable child care for students.
$75 K
College Assistance
Migrant Program (CAMP) Provides supplement to federal program to
attract and retain postsecondary students from
within the migrant and seasonal farm worker
communities.
$25 K
Passport Provides funding to institutions and College
Success Foundation to offer student support
services to former foster youth.2
$1 M
Totals $3.6 M
Total Appropriations for WSAC Administered Aid and Access Programs $359 M
5 Includes $5 in employer matching funds. 6 Institutions receive funding for recruitment and retention, and the College Success Foundation receives $500,000 to coordinate and provide support services. 7 Provided to College Success Foundation via WSAC-administered contract.

Washington Student Achievement Council Page 70
APPENDIX D
PARTICIPATING INSTITUTIONS
STATE NEED GRANT, COLLEGE BOUND SCHOLARSHIP, PASSPORT
2014-15
Public Four-Year/Research Community & Technical Colleges
University of Washington Bates Technical College
Washington State University Bellevue College
Public Four-Year/Comprehensive Bellingham Technical College
Central Washington University Big Bend Community College
Eastern Washington University Cascadia Community College
The Evergreen State College Centralia College
Western Washington University Clark College
Independent/Private Four-Year Clover Park Technical College
Antioch University Columbia Basin College
Bastyr University Edmonds Community College
Cornish College of the Arts Everett Community College
DigiPen Institute of Technology Grays Harbor College
Gonzaga University Green River Community College
Heritage University Highline Community College
Northwest University Lake Washington Institute of Technology
Northwest College of Art and Design Lower Columbia College
Pacific Lutheran University Northwest Indian College
St. Martin’s University North Seattle Community College
Seattle Pacific University Olympic College
Seattle University Peninsula College
Trinity Lutheran College Pierce College
University Puget Sound Renton Technical College
Walla Walla University Seattle Central Community College
WGU Washington Seattle Vocational Institute
Whitman College Shoreline Community College
Whitworth University Skagit Valley College
Private Career Colleges South Puget Sound Community College
Art Institute of Seattle South Seattle Community College
Divers Institute of Technology Spokane Community College
Gene Juarez Academy Spokane Falls Community College
Glen Dow Academy Tacoma Community College
Interface College Walla Walla Community College
International Air & Hospitality Academy Wenatchee Valley College
ITT Technical Institute Whatcom Community College
Lucas Marc Academy Yakima Valley College
Perry Technical Institute

Washington Student Achievement Council Page 71
AUTHOR CONTACT INFORMATION
Rachelle Sharpe, Ph.D. Senior Director for Student Financial Aid & Support Services 360.753.7872 [email protected]