Embed Size (px)
Citation preview

Technical Fisheries Committee Administrative Report 2014:
Status of Lake Trout and Lake Whitefish Populations
in the 1836 Treaty-Ceded Waters of Lakes Superior, Huron, and Michigan,
with Recommended Yield and Effort Levels for 2014
A Report Submitted by the Modeling Subcommittee to the
Technical Fisheries Committee
D.C. Caroffino (Michigan Department of Natural Resources)
S.J. Lenart (United States Fish and Wildlife Service)
Editors

2
Recommended citation formats:
Entire report: Modeling Subcommittee, Technical Fisheries Committee. 2014. Technical Fisheries
Committee Administrative Report 2014: Status of Lake Trout and Lake Whitefish Populations in the
1836 Treaty-Ceded Waters of Lakes Superior, Huron and Michigan, with Recommended Yield and Effort
Levels for 2014.
http://www.michigan.gov/greatlakesconsentdecree
Section: Caroffino, D.C. and Lenart, S.J. 2014. Executive Summary in Caroffino, D.C., and Lenart, S.J.,
eds. Technical Fisheries Committee Administrative Report 2014: Status of Lake Trout and Lake
Whitefish Populations in the 1836 Treaty-Ceded Waters of Lakes Superior, Huron and Michigan, with
Recommended Yield and Effort Levels for 2014.
http://www.michigan.gov/greatlakesconsentdecree

3
Table of Contents
Executive Summary .................................................................................................................. 4 Management Unit Descriptions ................................................................................................. 9 Status of Lake Trout Populations ............................................................................................ 16 Lake Superior .......................................................................................................................... 16
MI-5 (Marquette) ................................................................................................................. 16 MI-6 (Munising)................................................................................................................... 17 MI-7 (Grand Marais) ............................................................................................................ 18
Lake Huron .............................................................................................................................. 19 MH-1 (Northern Lake Huron) .............................................................................................. 19 MH-2 (North-Central Lake Huron) ...................................................................................... 20
Lake Michigan ......................................................................................................................... 21 MM-123 (Northern Treaty Waters) ...................................................................................... 21 MM-4 (Grand Traverse Bay) ............................................................................................... 22 MM-5 (Leelanau Peninsula to Arcadia) ............................................................................... 23 MM-67 (Southern Treaty Waters)........................................................................................ 24
Status of Lake Whitefish Populations ..................................................................................... 25 Lake Superior .......................................................................................................................... 25
WFS-04 (Marquette-Big Bay) .............................................................................................. 25 WFS-05 (Munising) ............................................................................................................. 27 WFS-06 (Grand Marais) ...................................................................................................... 28 WFS-07 (Tahquamenon Bay) .............................................................................................. 29 WFS-08 (Brimley) ............................................................................................................... 31
Lake Huron .............................................................................................................................. 32 Northern Huron (WFH-01 to WFH-04) ............................................................................... 32 WFH-05 (Alpena) ................................................................................................................ 34
Lake Michigan ......................................................................................................................... 36 WFM-01 (Bays De Noc) ...................................................................................................... 36 WFM-02 (Manistique) ......................................................................................................... 38 WFM-03 (Naubinway) ......................................................................................................... 40 WFM-04 (Beaver Island) ..................................................................................................... 42 WFM-05 (Grand Traverse Bay) ........................................................................................... 44 WFM-06 (Leland) ................................................................................................................ 46 WFM-07 (Manistee to Pentwater)........................................................................................ 48 WFM-08 (Muskegon) .......................................................................................................... 49

4
EXECUTIVE SUMMARY
Prepared by Stephen J. Lenart and David C. Caroffino
This document outlines the status of lake
trout and lake whitefish stocks as assessed by
the 2000 Consent Decree’s (Decree) Modeling
Subcommittee. We retain here the revised report
format first instituted in 2013. The objective of
the revised format is to provide a more succinct,
consistent summary without losing focus on the
primary purposes of the report, which are 1) to
briefly describe the status of each stock in the
context of establishing harvest limits according
to the terms of the Decree and 2) to document
important technical changes in the stock
assessment process. We expect to retain this
format in all subsequent annual reports.
Table 1. Yield and effort limits for 2014.
Model-generated yield limits and actual
yield and effort limits for 2014 are provided in
Table 1. In instances where actual yield limits
for lake trout units or shared-allocation whitefish
units (WFS-04, WFS-05, WFM-01, WFM-06
and WFM-08) differ from model-generated yield
limits, a brief explanation is provided below. For
non-shared whitefish units, where the tribes have
exclusive commercial fishing opportunities,
harvest regulation guidelines (HRGs), as
established by the Chippewa-Ottawa Resource
Authority (CORA), serve as final yield limits
and thus may differ from the model-generated
limits.
Species Lake
Management
unit
Model-generated
yield limit (lb)
Actual yield
limit (lb)
Gill net limit
(ft)
Lake
trout
Superior MI-5 145,304 145,304 NA
MI-6 172,412 172,412 3,564,000
MI-7 91,065 85,088 2,916,000
Huron MH-1 204,000 400,775 10,567,000
MH-2 143,800 143,800 NA
Michigan MM-123 0 503,000 12,954,000
MM-4 145,183 171,500 842,000
MM-5 57,225 98,000 139,000
MM-67 441,022 441,022 NA
Lake
whitefish
Superior WFS-04 102,000 102,000 NA
WFS-05 372,000 372,000 NA
WFS-06 No model estimate 210,000 NA
WFS-07 539,000 539,000 NA
WFS-08 130,000 130,000 NA
Huron
Northern Huron 735,000 437,157
NA
WFH-05 727,000 634,300 NA
Michigan WFM-01 1,354,000 2,000,000 NA
WFM-02 559,000 559,000 NA
WFM-03 976,000 976,000 NA
WFM-04 548,000 548,000 NA
WFM-05 492,000 365,000 NA
WFM-06 273,000 250,000 NA
WFM-07 No model estimate 500,000 NA
WFM-08 1,576,000 1,400,000 NA

5
Lake Trout
In 2014, the MSC continued the lake trout
model rotation strategy first implemented in
2009. Full stock assessments were not
completed for lake trout units MI-7 and MM-67.
Instead, output from the 2012 assessment was
used, along with current harvest and sea lamprey
mortality information, to project the population
forward an additional year. The mortality
provisions of the Consent Decree were then
applied to the projected populations to calculate
harvest limits for 2014. Full stock assessments
for these units are next scheduled for 2015. For
the first time since the rotation strategy was
implemented, one of the predetermined rotation
“triggers” was met – i.e a condition that requires
the MSC to conduct a full assessment for a unit
that would otherwise have remained in rotation.
Specifically, the doubling of sea lamprey-
induced mortality (from the prior year’s average
for fish ages 6-11) in unit MH-2 required a full
assessment to be conducted for the 2014 fishing
season.
In Lake Superior, lean lake trout are self-
sustaining, and the statistical catch-at-age
(SCAA) models and target mortality rates apply
to these wild fish in three management areas
(MI-5, MI-6, and MI-7). Declines in population
abundance and biomass have occurred since the
late 1990s, a product of a long-term decline in
recruitment. Aside from natural mortality, sea
lamprey-induced mortality (SLIM) represents
the greatest individual source of mortality in all
modeled Superior units and current average
SLIM estimates (ages 6-11) range between 0.05
to 0.10 y-1
. Estimated SLIM rates tend to be
higher for fish greater than age 11, ranging
between 0.10 to 0.19 y-1
.
Commercial mortality in Lake Superior
remains low (generally below 0.05 y-1
), though,
as in 2012, commercial yield from unit MI-6 in
2013 (28,120 lb) was considerably higher than
the long-term average for the modeled time
series. Whether the fishery continues to operate
at this level remains uncertain. The recreational
fishery has operated at a fairly consistent level in
the western units (MI-5 and MI-6), while
recreational harvest has been more variable in
unit MI-7. Current recreational fishery mortality
rates are below 0.03 y-1
in all management units.
Mortality and harvest of lean lake trout
remain below targets throughout Lake Superior,
thus our projections suggest yield could be
increased in all modeled Lake Superior
management unit in 1836 waters. There have
been no efforts to fit a stock assessment model
for lake trout in MI-8 of Lake Superior because
this is a deferred area.
Recruitment of wild lake trout to the adult
population continues to be evident throughout
Lake Huron. In 2013, unclipped fish
represented 41% of the commercial and 56% of
the recreational fishery samples in unit MH-1.
In unit MH-2, the proportion of unclipped fish in
the Canadian commercial fishery exceeded 95%,
while the proportion in the recreational fishery
(US waters) was 36%. This disparity is the result
of stocking practices in the north-central region,
where only U.S. waters are stocked with
hatchery-reared fish. Since these wild fish are
predominately younger than age 9, hatchery fish
still represent the largest proportion of the adult
stock in US waters. To account for the growing
proportion of wild fish in the population, the
Lake Huron assessments are now structured to
include both wild and hatchery fish.
Commercial fishing is the largest source of
mortality in northern Lake Huron (unit MH-1),
where total commercial yield exceeded 300,000
lb for the second consecutive year. Commercial
yield from the Ontario waters of north-central
Lake Huron (unit MH-2) was just below 30,000
lb, the lowest value since 1999. The sport
fishery harvested less than 20,000 lb of lake
trout from each unit during 2013 and
recreational fishery mortality rates are below
0.02 y-1
. Sea lamprey-induced mortality rates in
north-central Huron were above 0.10 y-1
for the
first time since 2007, while rates in northern
Lake Huron declined slightly to 0.10 y-1
.
Estimated spawning biomass in northern
Lake Huron has declined approximately 35%
since 2009, while the lower overall mortality
rates in north-central Lake Huron have allowed
spawning biomass to continue to increase there.
Substantial declines in survival of stocked fish
since the middle 2000s has helped contribute to
the decline in hatchery biomass, particularly in
the north, where wild fish compose 18% of the
spawning biomass. Nearly 38% of the spawning

6
biomass in the north-central region is composed
of wild fish.
In Lake Michigan treaty waters, where wild
adult lake trout are scarce, the assessment
models and target mortality rates apply only to
stocked fish. In unit MM-123 total mortality is
well above target, a product of excessive
commercial fishing and sea lamprey-induced
mortality. Sea lamprey-induced mortality has
slowly declined in MM-123 since the early
2000s, yet rates remain above 0.2 yr-1
.
Commercial fishing mortality rates increased to
the 0.4 yr-1
in 2013 and the estimated number of
fish killed by commercial fisheries was the
highest in the modeled time series. Recreational
fishery mortality rates are modest by
comparison, having remained below 0.03 y-1
since the onset of the Decree. Biomass of young
fish is increasing due to increased stocking, yet
few fish survive beyond age 7 and adult stocks
remain depressed. A Decree Amendment dated
4 April 2007 set the harvest limit in MM-123 at
453,000 lb for CORA and 50,000 lb for the
State. These limits were imposed because the
current rates of sea lamprey mortality would
prevent any harvest under the original terms of
the Consent Decree. The stipulated limits will
remain in place until conditions of the
amendment are met.
Estimated biomass has declined slightly in
unit MM-4 after the marked increase observed in
the middle 2000s. Mortality from sea lamprey
(0.06 y-1
), commercial fishing (0.15 y-1
), and
recreational fishing (0.08 y-1
) are factors in this
unit, though current total mortality rates remain
below target. Total yield of lake trout from
MM-4 in 2013 (173,706 lb) was the highest
observed since the Decree was implemented,
though only slightly above the level reported in
2012. Recruitment has been enhanced by the
substantial increase in stocking in adjacent MM-
123, a mitigating factor for the relatively intense
harvest that occurs in the unit. There is a
Consent Decree stipulation for MM-4 which
establishes the 2014 harvest limit at 171,500 lb,
nearly double the model-recommended value.
Actual harvest has been well above the model-
generated limit for the past five years, yet model
estimates of mortality remain below target.
Recent analyses by the MSC suggest that the
application of certain rules relating to the
calculation of target spawning-stock biomass per
recruit (SSBR) in the TAC projection process
help explain this apparent disconnect. Mortality
rates in units MM-5 and MM-67 remain below
target and natural mortality is currently the
largest source of mortality in these units.
Recreational fishery yield from MM-5 increased
nearly four-fold in 2013 to the highest level
observed since the Decree was implemented and
fishery mortality rates approached 0.07 yr-1
. The
recreational fishery in MM-67 is a minor
component (<0.03 yr-1
) of the overall mortality
in the unit. The 2013 commercial fishery yield
was modest in MM-5 (25,600 lb) and nearly
non-existent in unit MM-67. Sea lamprey-
induced mortality had recently shown a marked
increase in MM-5 for a two year period (2009-
2010), but rates are now below 0.10 yr-1
. Rates
in MM-67 have remained below 0.10 yr-1
for the
past ten years. The relatively low mortality rates
in these southernmost Lake Michigan units have
allowed adult biomass to build over the past
decade. There is a Decree stipulation for MM-5
which establishes the 2014 harvest limit at
98,000 lb.
Lake Whitefish
In the western 1836 treaty waters of Lake
Superior (WFS-04 and WFS-05), commercial
harvest of lake whitefish declined during the
middle 2000s in response to declining effort.
Effort has recently increased in unit WFS-05 and
fishing mortality rates are on par with natural
mortality (0.13 yr-1
). Stable recruitment,
combined with generally low mortality rates, has
resulted in stable to increasing biomass in the
west. Effort, and hence yield, has been more
variable in the eastern units (WFS-07 and WFS-
08) and mortality rates are higher overall. A
long-term decline in recruitment was evident
during the late 1980s and 1990s in unit WFS-07
and biomass had predictably declined in concert
with recruitment, though recent estimates
suggest some improvement. In contrast,
recruitment in adjacent unit WFS-08 appears to
have been stable-to- increasing during much of
the 1990s. The small, variable fishery in WFS-
06 restricts the utility of the SCAA assessment,
which has not been populated since 2004. As a
result, only fishery harvest and effort data are
presented in this report.

7
In northern Lake Huron treaty waters
(WFH-01-WFH-04), whitefish biomass peaked
in the mid to late 1990s, as did commercial
yield, which has declined by more than 50% in
the last decade. Although similar patterns in
biomass are evident in unit WFH-05,
commercial yield peaked there in 2007,
following substantial increases in effort since the
late 1990s. Effort and yield have since declined.
As is the case with all whitefish stocks, these
biomass patterns are driven by recruitment,
which has demonstrated a steep decline since the
early 2000s. Catch rates, which are at their
lowest point in the time series, have followed
suit. Sea lamprey-induced mortality on lake
whitefish has increased over the past decade and
remains a significant mortality source in Lake
Huron management areas, though a change to
the estimation method resulted in a scaling down
of this mortality component relative to prior
years (see Technical Changes section for
description). Certain age classes in northern
Lake Huron are experiencing mortality near the
65% annual target. High adult mortality,
coupled with low recruitment, presents a
troubling scenario for Lake Huron lake whitefish
stocks. Growth appears to have improved
somewhat in Lake Huron treaty waters, likely in
response to the release of density-dependent
factors.
Northern Lake Michigan whitefish stocks
had, in recent years, provided a contrast to those
in northern Lake Huron - strong recruitment in
the late 1990s and early 2000s and relatively low
mortality allowed stocks to build through the
middle 2000s. The most recent assessments from
northern Lake Michigan (WFM-01 to WFM-04)
suggest that recruitment and biomass have
declined from those peaks. Yields have
remained stable to increasing, thus mortality
rates have generally increased across most
northern Lake Michigan stocks. Nonetheless,
peak mortality rates remain below target. The
decline in biomass was most pronounced in unit
WFM-01, where estimated biomass was more
than 50% lower than the mid-2000 peak. The
uncertainty associated with model estimates of
stock size, coupled with the low performance
rating, resulted in the TFC recommending a
harvest limit of 2 million lb for WFM-01 in
2014, a limit that was first established by the
TFC for the 2013 fishing season.
Although estimated recruitment has declined
in unit WFM-05, fishing effort and mortality
have declined as well; as a result biomass has
remained fairly stable in recent years. 2012 yield
was the lowest in the modeled time series,
eclipsing the low from 2011. In contrast, trap-
net fishery effort increased dramatically in unit
WFM-06 during 2010- 2012, mainly due to the
entrance of a State-licensed commercial
operation. As a result, trap-net yield remains
substantially higher than it has been since the
Decree was implemented. The dramatic shift in
the trap-net fishery dynamics and the sporadic
nature of the gill-net fishery have resulted in
widely varying estimates of stock size; as a
consequence, the TFC has recommended a
constant harvest limit of 250,000 lb in unit
WFM-06 until model performance improves.
Trap-net fishery effort and yield in unit
WFM-07 has declined since reaching a peak in
2007. The lack of available data has precluded
development of a SCAA model and the HRG for
this unit has remained at a constant level since
2007. The MSC will continue to evaluate the
available data to ascertain whether it is feasible
to develop a model in the future.
Trap-net fishery yield has remained fairly
stable in unit WFM-08, though model estimates
suggest that recruitment, and hence biomass, has
not declined as it has in the north. Natural
mortality is the largest source of mortality in this
unit and historical model-generated harvest
limits suggest that fishery yield is small relative
to stock size. The assessment for unit WFM-08
has generated highly variable estimates of stock
size over the years, a condition which has lead
the TFC to recommend a constant harvest limit
of 1.4 million lb. The MSC will continue to
conduct the stock assessment and evaluate a
suite of stock parameters when making a
recommendation to the TFC for continuance of
the constant catch policy.
Technical Changes
The estimation of sea lamprey-induced
mortality as a separable component of the
overall mortality on lake whitefish is currently
restricted to the Lake Huron management areas.
Historically these estimates were calculated for

8
an individual management unit by adjusting the
year- and age-specific marking rates (A1-A3,
fall data) by the year-specific deviations from
the long-term marking rates for that unit:
t
yt
ya
ta
m
mm
mm
1
,
,
where m is the average number of sea lamprey
marks per fish, a is age class, t is year, and y is
the time period. This methodology was
employed primarily to deal with small sample
sizes for individual age classes within a year.
These adjusted marking rates were then
translated to age-and year-specific mortality
rates, assuming a probability of survival of 0.25.
To address concerns over the application of
these methods, the MSC agreed to evaluate the
use of raw (unadjusted) age-specific marking
rates to directly estimate mortality, relying on
marking data within an the entire calendar year
to develop the age-specific values. This revised
method was implemented for the 2014
assessments. While the revised method seemed
preferable to the previous method, we note that
it did result in highly suspect values for age
classes that were not well represented in the
samples in a given year (as evidenced by certain
extreme mortality values in the mortality graphs
for Northern Lake Huron and WFH-05 on pages
32 and 34). Thus the MSC considered another
alternative, which was to employ the
methodology utilized to estimate sea lamprey-
induced mortality for lake trout, where size-
based wounding rates are fit to an asymptotic
function and are then translated to mortality
rates based on growth parameters of the stock.
We will continue to explore this option in the
coming year.
We also note that most of the Lake
Michigan lake trout assessments, as well as the
Lake Superior whitefish assessments, now
incorporate the revised variance estimation
structure which was described in this section of
the 2013 Status Report.

9
MANAGEMENT UNIT DESCRIPTIONS
The Great Lakes are divided into spatially
explicit management units, which differ for lake
trout and lake whitefish. The provisions of the
2000 Consent Decree apply to each of the
individual management units either partially or
wholly contained within the 1836 Treaty-ceded
(Treaty) waters of the Great Lakes. What
follows are descriptions of the nine lake trout
management units (Figure 1) and 15 lake
whitefish management units (Figure 2), which
are assessed by the Modeling Subcommittee.
Lake Trout Management Units
MI-5: Lake trout management unit MI-5
extends from Pine River Point (west of Big Bay)
to Laughing Fish Point (east of Marquette)
covering 374,000 ha. This management unit
includes Stannard Rock, an offshore shoal about
72 km north of Marquette, and is in both the
1836 (250,000 ha) and 1842 Treaty waters
(124,000 ha). The 1836 Treaty area extends east
from the north-south line established by the
western boundaries of grids 1130, 1230, 1330,
1430, and 1530. This unit has a wide
bathymetric range with depths beyond 235 m,
and with 117,000 ha shallower than 80 m.
MI-6: Lake trout management unit MI-6
extends from Laughing Fish Point (east of
Marquette) to Au Sable Point (east of
Munising), encompassing 728,000 ha. This
management unit includes Big Reef, an offshore
reef complex about 32 km northeast of
Munising. This management unit contains the
deepest waters of Lake Superior with soundings
deeper than 400 m, and only 105,000 ha of the
total area is shallower than 80 m.
MI-7: Lake trout management unit MI-7
extends from Au Sable Point (west of Grand
Marais) to Little Lake Harbor (east of Grand
Marais), encompassing 457,000 ha. This
management unit has complex bathymetry with
many lacustrine ridges, trenches, and slopes.
There is approximately158,000 ha of lean lake
trout habitat (depth less than 80 m).
MH-1: Lake trout management unit MH-1 is
located in northern Lake Huron and extends
from the Mackinac Bridge south to the border
between grids 607 and 608. For stock
assessment purposes, biological data from
waters in adjacent Ontario management area 4-1
are included. The management unit has a wide
bathymetric range with areas in grids 407 and
408 as deep as 130 m. The Michigan portion of
this unit lies completely within 1836 Treaty
waters, covering 437,000 ha, of which
approximately 308,000 ha are less than 80 m in
depth. The Ontario portion, which lies outside
1836 Treaty waters, covers approximately
124,000 ha, of which approximately 69,000 ha is
less than 80 m in depth. On the Michigan shore
this unit encompasses the ports of Saint Ignace,
Mackinaw City, Cheboygan, Hammond Bay,
and Rogers City. The St. Marys River,
connecting Lakes Superior and Huron, flows
into Lake Huron in grid 306. The majority of
Lake Huron’s historically important lake trout
spawning reefs and shoals are located in MH-1.
The Drummond Island Refuge is located in grids
307, the northern ½ of grid 407, and Michigan
waters of grids 308, 408, 409, and 410, and
covers 72,000 ha of 1836 Treaty waters.
Retention of lake trout in the refuge is
prohibited.
MH-2: Lake trout management unit MH-2 is
located in north-central Lake Huron. It includes
statistical district MH-2 (approximately 640,000
ha) as well as adjacent Canadian waters (areas 4-
2, 4-3, and 4-7 for a total of approximately
546,000 ha). Michigan waters of the MH-2 unit
include both 1836 Treaty waters (304,000 ha)
and non-treaty waters (336,000 ha), divided by a
line running north-east from the tip of North
Point to the international border. The Michigan
ports of Presque Isle and Alpena are contained
in this unit. The management unit has a wide
bathymetric range with areas in grids 714 and
814 deeper than 210 m, and a total of
approximately 255,000 ha of the Michigan
portion has bottom depths less than 80 m. A

10
similar area (257,000 ha) in the Ontario portion
contains waters less than 80 m. This
management unit contains a limited number of
historically important lake trout spawning reefs
and shoals. These reefs are located near Middle
Island, North Point, and Six Fathom Bank, a
large offshore reef complex that bisects districts
MH-2 and MH-3. A portion of the Six Fathom
Bank Refuge is contained in unit MH-2,
covering the eastern half of grid 913 grid 914
and Michigan waters of grid 915. Retention of
lake trout is prohibited in the refuge. Canadian
waters adjacent to the refuge are a commercially
protected area where commercial fishers are
prohibited from fishing in waters shallower than
40 fathoms.
MM-123: Management unit MM-123 is
made up of statistical districts MM-1, MM-2 and
MM-3 and encompasses Michigan’s waters of
northern Lake Michigan and northern Green
Bay, covering 1.29 million ha. Water depths in
the northern portion of the unit are generally less
than 45 m, and approximately 911,000 ha are
less than 80 m. In southern portions of the unit,
depths can be greater than 170 m. Most of the
historically important lake trout spawning reefs
in Lake Michigan are located in MM-123. The
unit contains many islands including the Beaver
Island complex (Beaver, Hat, Garden, Whiskey,
Trout, High and Squaw Islands), North and
South Fox Islands, and Gull Island in Lake
Michigan. Another series of islands form a line
separating Green Bay from Lake Michigan;
these include Little Gull, Gravely, St. Martins,
Big and Little Summer and Poverty Islands.
Except for the southern one-half of MM-1 in
Green Bay, this management unit is entirely in
1836 Treaty waters, and contains a lake trout
refuge. The “northern refuge” is nearly 233,000
ha and occupies the southern ½ of grids 313 and
314, grids 413, 414, 513-516, the northwest
quarter of grid 517, grid 613, and the northern ½
of grid 614. Retention of lake trout by sport or
commercial fisheries is prohibited in the refuge.
Both commercial and subsistence gill-net fishing
are prohibited in the refuge, while commercial
trap-net operations are permitted to harvest lake
whitefish.
MM-4: Lake trout management unit MM-4
encompasses the Grand Traverse Bay region of
Lake Michigan. There are two islands in this
management unit, Bellow and Marion Island. A
large peninsula bisects the southern half of the
bay. For the most part water depths in the bay
range up to 85 m. However, waters on either
side of the peninsula are much deeper, ranging
to 134 m in the west arm and 195 m in the east
arm. This management unit is entirely in 1836
Treaty waters. There are no refuge areas
allocated, however commercial fishing is
prohibited in the southern most portion of the
bay (grids 915 and 916). The total area of the
unit is 66,000 ha of which 50,000 ha are less
than 80 m in depth. Based on estimates from
historical commercial catch rates only a small
amount of lake trout spawning habitat is located
in the management unit.
MM-5: Lake trout management unit MM-5
is located in eastern central Lake Michigan and
corresponds to the MM-5 statistical district.
This area constitutes an area of high use by both
Tribal and State interests. The unit covers
546,000 ha and encompasses Michigan’s waters
of Lake Michigan from Arcadia north to the tip
of the Leelanau Peninsula, extending to the state
line bisecting the middle of the lake. There are
two islands in this management unit, the North
and South Manitou Islands. Some of the deepest
waters and largest drop-offs in Lake Michigan
occur in MM-5. Water depths range to 250 m
and for the most part are greater than 120 m.
Only 125,000 ha (23%) of the unit are at depths
less than 80 m. The entire area is in 1836 Treaty
waters and there are no refuges allocated within
the management unit. Only a small amount of
lake trout spawning habitat is located here, most
of which is located in the near shore zone and
around the North and South Manitou Islands.
MM-67: Lake trout management unit MM-
67 is located in eastern central Lake Michigan,
comprising statistical districts MM-6 and MM-7.
The area covers Michigan’s waters of Lake
Michigan from Arcadia to Holland, extending to
the state line bisecting the middle of the lake.
The management unit covers 1,157,000 ha, of
which 241,000 ha are less than 80 m in depth.
The northern section of the region (MM-6) is
deeper, with depths up to 275 m, and is
characterized by greater slope than the southern
section (MM-7). For the most part, water depths
in MM-7 are less than 122 m. There are no
islands or structures in southern treaty waters,

11
and there is little lake trout spawning habitat,
with the exception of offshore deepwater
spawning reefs located within the mid-lake
refuge. The southern treaty management unit is
not entirely comprised of 1836 waters- the
northern section (MM-6) is entirely treaty ceded
territory while only the northern two-thirds of
the southern section (MM-7) is within treaty
territory. A total of 179,000 ha in the unit are
outside treaty waters. A line running parallel to
the northern side of the Grand River (located
approximately ¾ of the way through grids in the
1900 series) out to the state line in the middle of
the lake delineates the southern boundary of
treaty territories in the unit. Management unit
MM-67 contains a portion of the deepwater mid-
lake lake trout refuge, which comprises 850
square miles of the unit (grids 1606, 1607, 1706,
1707, 1806, 1807, 1906 and 1907). It is illegal
for recreational, commercial and subsistence
fishers to retain lake trout when fishing in the
refuge area. Gill-net fishing (both commercial
and subsistence) is prohibited in the refuge,
State- and Tribal-licensed commercial trap-net
operations are permitted to fish in the refuge;
however, the retention of lake trout is prohibited.
Lake Whitefish Management Units
WFS-04: Lake whitefish unit WFS-04
(486,000 ha) is located in Lake Superior near
Marquette, roughly between Big Bay and
Laughing Fish Point. Near shoreline features of
this zone include many points, bays, islands, and
in-flowing rivers. Habitat suitable for lake
whitefish growth and reproduction is associated
with many of these features. This unit holds
waters both within and outside the 1836 Treaty
area. Based partly on the number of statistical
grids on either side of the 1836 treaty line and
partly on established protocol for a similar
situation with lake trout, 70% of WFS-04 is
considered to be in 1836 waters.
WFS-05: The WFS-05 lake whitefish
management unit extends approximately from
Laughing Point to Au Sable Point in Michigan
waters of Lake Superior. Surface area of the
unit is 747,000 ha. Several bays (Shelter Bay,
Au Train Bay, South Bay, and Trout Bay) and
islands (Au Train Island, Wood Island, Williams
Island, and Grand Island) are prominent in this
area, providing substrate and depth contours
suitable for lake whitefish habitat and spawning.
Different whitefish stocks exist within this unit,
including a smaller, slower-growing stock
identified in Munising (South) Bay.
WFS-06: The Grand Marais stock of lake
whitefish is probably one of the smallest in the
1836 ceded waters, certainly the smallest in
terms of harvest levels in Lake Superior waters.
There are typically only small aggregations of
spawning lake whitefish in WFS-06, based on
anecdotal information from commercial fishers
that have regularly fished WFS-06 throughout
the year.
WFS-07: WFS-07 is located in the
Whitefish Bay area of Lake Superior and
contains 150,000 ha of water less than 80-m
deep. There is a substantial commercial fishery
in adjacent Canadian management unit 33.
WFS-07 contains a single, large stock of
whitefish that spawns in the southwest portion
of Whitefish Bay.
WFS-08: WFS-08 is located in the southeast
portion of Whitefish Bay, Lake Superior. WFS-
08 is spatially the smallest of the management
units in the 1836 ceded waters of Lake Superior,
and it contains 65,000 ha of water less than 80-
m deep. A substantial commercial fishery
targeting whitefish also exists in adjacent
Canadian management units 33 and 34. It is
thought that four reproductively isolated stocks
of whitefish contribute to the commercial fishery
in WFS-08. There are two spawning areas in
WFS-08, a probable contributing spawning
population in Canadian waters of management
unit 34, as well as contributions from spawning
fish in WFS-07 directly west of WFS-08.
Northern Huron: The catch-at-age model for
lake whitefish in Northern Lake Huron was
created in 2009 after mark-recapture data
showed fluid movement of adult fish between
management units WFH-01, WFH-02, WFH-03,
and WFH-04. The consolidated stock
assessment model was an attempt by the
Modeling Subcommittee to estimate population
parameters for a mixed-stock fishery exploited
by only one agency (CORA). Management unit
WFH-01 is located in the northwest portion of
the main basin of Lake Huron. It is relatively
shallow and contains 94,000 ha of water less
than 80 m. Management unit WFH-02 is located
along the northern shore of the main basin of

12
Lake Huron. Much of WFH-02 is deeper than
45 m and maximum depth is slightly more than
90 m. WFH-02 is a small unit made up of only
three statistical grids and contains 50,000 ha of
water less than 80-m deep. The unit has an
irregular shoreline with many small, rocky
points, small bays, and scattered boulders.
Management unit WFH-03 is small and
encompasses only the area around Drummond
Island. A lake trout refuge is located along the
south shore of Drummond Island where large-
mesh gill-net fishing is prohibited and retention
of lake trout by trap-net fisheries is prohibited.
The south side of WFH-03 is deep. with much of
the water exceeding 45 m in depth, whereas the
north and west sides of Drummond Island are
relatively shallow. WFH-03 contains six
statistical grids and less than 40,000 ha of water
less than 80-m deep. WFH-04 is the largest
whitefish management unit in the 1836 Treaty
waters of Lake Huron. The unit contains
153,000 ha of water less than 80-m deep.
Spawning concentrations of whitefish are
scattered throughout the unit with concentrations
being found from Cheboygan to Hammond Bay.
WFH-05: WFH-05 extends from Presque
Isle south to the southern end of grids 809-815
in US waters and includes some waters of Lake
Huron that lie outside the 1836 Treaty waters.
There are an estimated 85,000 ha of water less
than 80-m deep in WFH-05. WFH-05 contains
multiple spawning aggregates, most of which are
likely associated with the numerous islands
(Crooked, Gull, Middle, Sugar and Thunder
Bay) or small embayments that are found in the
southern part of the unit.
WFM-01: Lake whitefish management unit
WFM-01 is located in the 1836 Treaty waters of
northern Green Bay. Prominent features of this
area include two large bays (Big and Little Bay
de Noc), numerous small embayments, several
islands (including St. Martins Island, Poverty
Island, Summer Island, Little Summer Island,
Round Island, Snake Island, and St. Vital
Island), as well as various shoal areas (Gravelly
Island Shoals, Drisco Shoal, North Drisco Shoal,
Minneapolis Shoal, Corona Shoal, Eleven Foot
Shoal, Peninsula Point Shoal, Big Bay de Noc
Shoal, Ripley Shoal, and shoals associated with
many of the islands listed above). Little Bay de
Noc is the embayment delineated by statistical
grid 306, and its surface area is 16,000 ha.
Shallow waters characterize the northern end
and nearshore areas, but there is a 12- to 30-m
deep channel that runs the length of the bay.
Rivers that flow into Little Bay de Noc include
the Whitefish, Rapid, Tacoosh, Days, Escanaba,
and Ford. Big Bay de Noc is a larger
embayment of 38,000 ha delineated by statistical
grids 308 and 309. Big Bay de Noc is relatively
shallow with over half the area less than 10-m
deep and a maximum depth of 21 m. Rivers that
empty into Big Bay de Noc include the Big,
Little, Ogontz, Sturgeon, Fishdam, and Little
Fishdam. Only grids 308, 309, 407 and 408 are
entirely within 1836 Treaty waters
WFM-02: WFM-02 is located in the
northwest portion of Lake Michigan. There are
157,000 ha of water less than 80-m deep in the
unit. The only known spawning population of
whitefish in the management unit is located in
Portage Bay; this population is not as abundant
as other stocks in Lake Michigan. Many of the
whitefish inhabiting WFM-02 move into the unit
from adjacent units.
WFM-03: WFM-03 is located in northern
Lake Michigan. The unit extends from the
Straits of Mackinac west to Seul Choix Point
and is bounded on the south by Beaver Island
and a complex of shoals and islands surrounding
it. Nearly the entire unit is shallow water less
than 27 m deep. There are 195,000 ha of water
less than 80-m deep.
WFM-04: WFM-04 is located in central
northern Lake Michigan and contains a very
diverse range of habitat. The Beaver Island
archipelago, which consists of eight named
islands, is the dominant feature of the unit.
These islands, located mainly along the northern
edge of the unit, are associated with a large,
rocky reef complex that extends about 15 miles
west from Waugoshance Point near the
northwestern tip of Michigan’s Lower
Peninsula. This northern reef complex is
shallow, ranging from 2- to 9-m deep. Many
smaller submerged reefs extend from the
northern reef complex to the south, running
along the east and west sides of Beaver Island, a
14,245 ha landmass that bisects the unit. These
latter reefs are surrounded by deep water.
WFM-04 contains 234,000 ha of water less than
80-m deep.

13
WFM-05: Management unit WFM-05
encompasses the area from Little Traverse Bay
through Grand Traverse Bay and offshore waters
of Lake Michigan north and west of the
Leelanau Peninsula. Much of WFM-05 contains
water greater than 80-m deep, including both the
east and west arms of Grand Traverse Bay. The
deepest parts of WFM-05 exceed 183 m, both in
the offshore waters west of the Leelanau
Peninsula, as well as within the east arm of
Grand Traverse Bay. Several small shallow
reef areas are located in the offshore waters, and
there is an extensive shallow water area
associated with the Fox Islands. Seventeen
statistical grids make up WFM-05, but only
197,000 ha, or 46% of the water in these grids, is
less than 80-m deep. Much of the offshore
waters of WFM-05 are part of the northern Lake
Michigan lake trout refuge.
WFM-06: Lake whitefish management unit
WFM-06 is located in 1836 Treaty waters west
of the Leelanau Peninsula from about Cathead
Point south to Arcadia. Surface area for this unit
is 382,000 ha (including part or all of grids 709-
714, 808-814, 908-912, and 1008-1011). These
waters of Lake Michigan include Good Harbor
Bay, Sleeping Bear Bay, and Platte Bay. Two
large islands, North Manitou and South
Manitou, are contained in this management
zone, as are three large shoal areas including
North Manitou Shoal, Pyramid Point Shoal, and
Sleeping Bear Shoal. Major rivers flowing into
WFM-06 include the Platte and the Betsie.
Betsie Lake is a drowned river mouth formed
where the Betsie River flows into Lake
Michigan. Except for areas near shore or around
the islands, most of the waters in WFM-06 are
deep (greater than 60 m). Bays, islands, and
shoal areas offer the best habitat for lake
whitefish spawning in this management area.
WFM-07: Lake whitefish management unit
WFM-07 is located within the 1836 Treaty
Ceded Waters of eastern central Lake Michigan
from Arcadia in the north to just south of Stony
Lake, and west to the Michigan/Wisconsin state
line bisecting the middle of the lake. This lake
whitefish management unit includes part or all
of grids 1107-1111, 1207-1211, 1306-1310,
1406-1410, 1506-1510 and 1606-1609. The
surface area for this unit is 521,000 ha, of which
111,000 ha have bottom depths of 80 m or less,
with maximum depths up to 275 m. There are
several inflows from the Big Manistee, Little
Manistee, Big Sable, Pere Marquette, and
Pentwater Rivers, and drowned river mouths at
Manistee Lake, Pere Marquette Lake, and
Pentwater Lake.
WFM-08: Management unit WFM-08 is the
Lake Michigan whitefish zone that extends from
Montague south past Port Sheldon. WFM-08
has a surface area of 610,000 ha in Michigan
grids 1706-1710, 1806-1810, 1906-1911, and
2006-2011; only those waters north of the Grand
River lie within 1836 Treaty waters. Apart from
the shoreline, and inflows from the White,
Muskegon, and Grand Rivers, and drowned river
mouths at White Lake, Muskegon Lake, Mona
Lake, and Pigeon Lake, this area has few other
distinguishing features relevant to lake whitefish
biology. Depth gradients west from shore are
relatively gradual, but most of the waters in
WFM-08 are 61-m deep or deeper.

14
Figure 1. Lake Trout Management Units. Shaded areas denote units which are subject to
provisions of the 2000 Consent Decree. Like shading indicates where statistical districts have
been combined into a single management unit for stock assessment purposes. No stock
assessment has been developed for Lake Superior unit MI-8.
15
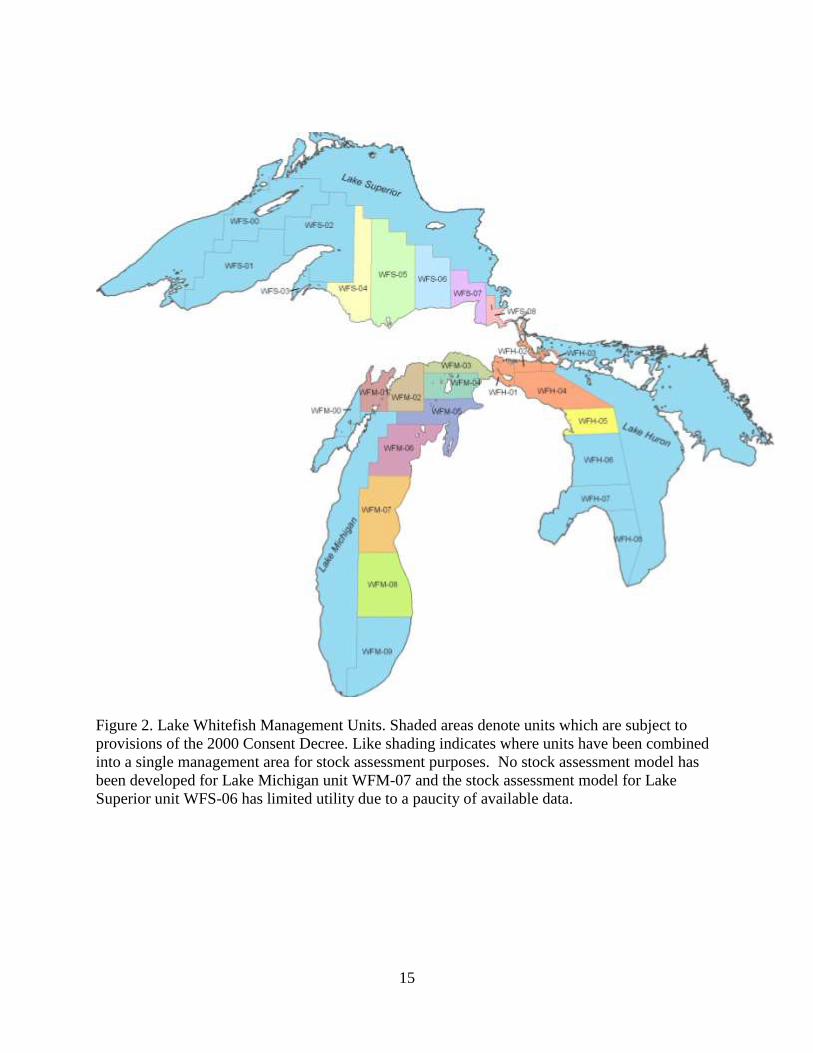
Figure 2. Lake Whitefish Management Units. Shaded areas denote units which are subject to
provisions of the 2000 Consent Decree. Like shading indicates where units have been combined
into a single management area for stock assessment purposes. No stock assessment model has
been developed for Lake Michigan unit WFM-07 and the stock assessment model for Lake
Superior unit WFS-06 has limited utility due to a paucity of available data.

16
STATUS OF LAKE TROUT POPULATIONS
Lake Superior
MI-5 (Marquette) Shawn Sitar
Parameter Value
Base SSBR 7.13 lb
Current SSBR 2.18 lb
Target SSBR 0.40 lb
Current SPR 0.31
M 0.14 y-1
F, Commercial (2011-2013) 0.01 y-1
F, Recreational (2011-2013) 0.02 y-1
Sea Lamprey Mort (2010-2012) 0.06 y-1
Z 0.22 y-1
Recommended TAC 145,304 lb
Actual TAC 145,304 lb
Model Rating Medium
Notable Fishery Dynamics and Model Changes:
Lake trout abundance has progressively
declined since the 1990s, driven by reduced
recruitment. Total mortality rates have
declined since 2007, largely due to declining
sea lamprey-induced mortality, which is at its
lowest point since the mid-1990s.
Recreational harvest increased by 33% from
2012-2013 and continues to exceed
commercial landings. Total annual mortality
for lake trout ages 6-11 averaged 20% in the
last three years. The lake trout harvest limit in
2014 increased by 9% due to slightly higher
estimates of abundance in the fishable
population.

17
MI-6 (Munising) Shawn Sitar
Parameter Value
Base SSBR 5.36 lb
Current SSBR 1.45 lb
Target SSBR 0.59 lb
Current SPR 0.27
M 0.15 y-1
F, Commercial (2011-2013) 0.03 y-1
F, Recreational (2011-2013) 0.02 y-1
Sea Lamprey Mort (2010-2012) 0.10 y-1
Z 0.29 y-1
Recommended TAC 172,412 lb
Actual TAC 172,412 lb
Model Rating Low
Notable Fishery Dynamics and Model Changes:
Abundance of lake trout continues to decline due
to major declines in recruitment since 2001.
Total mortality has not varied appreciably in the
last 10 years and is mostly driven by sea
lamprey predation. Commercial landings in
2012 and 2013 were five-fold higher than the
previous decades, due to a new fisher entering
the area. Total annual mortality for lake trout
ages 6-11 averaged 25% in the last three years.
The 2014 harvest limit for MI-6 increased by
6% due to small increases in predicted
recruitment. This model retains a low rating
because it still relies on a key abundance scaling
parameter from the MI-5 model to produce
output consistent with our professional
perception of stock size in this area.

18
MI-7 (Grand Marais) Shawn Sitar
Parameter Value
Base SSBR 3.08 lb
Current SSBR 0.43 lb
Target SSBR 0.22 lb
Current SPR 0.14
M 0.18 y-1
F, Commercial (2009-2011) 0.07 y-1
F, Recreational (2009-2011) 0.03 y-1
Sea Lamprey Mort (2010-2012) 0.10 y-1
Z (2011) 0.39 y-1
Recommended TAC 91,065 lb
Actual TAC 85,088 lb
Model Rating N/A
Notable Fishery Dynamics and Model Changes:
This model was in rotation status for 2014;
therefore, the harvest limits were projected from
2012 model estimates of abundance and
recruitment, with updated fishing and sea
lamprey mortality rates. After declines in 2012,
harvest in 2013 returned to average levels for
both the recreational and commercial fisheries in
this unit. Sea lamprey mortality slightly
declined from 0.10 y-1
in 2011 to 0.09 y-1
in
2012. The 2014 TAC for MI-7 increased 23%
from 2013 because of recent increases in
abundance as estimated by the 2012 model. A
complete assessment will be completed in 2015.

19
Lake Huron
MH-1 (Northern Lake Huron) Ji He
Parameter Value
Base SSBR 2.58 lb
Current SSBR 0.16 lb
Target SSBR 0.11 lb
Current SPR 0.06
M 0.08 y-1
F, Commercial (2011-2013) 0.23 y-1
F, Recreational (2011-2013) 0.02 y-1
Sea Lamprey Mort (2010-2012) 0.12 y-1
Z 0.44 y-1
Recommended TAC 204,000 lb
Actual TAC 400,775 lb
Model Rating Low
Notable Fishery Dynamics and Model Changes:
No changes were implemented to the assessment
model this year. Fishery yield in 2013 was
similar to previous years. Average estimated
annual mortality was 39%, and sea lamprey
induced mortality declined from 0.13 y-1
to 0.10
y-1
. The 2014 model-generated harvest limit
declined by 59% from 2013 due to uncertainties
surrounding recruitment of age 4 and age 5 lake
trout. A long-standing issue is that the fisheries
and surveys do not provide sufficient
observations of age-4 or age-5 fish, despite the
fact that we observed major increases in fishery
and survey catch of age 3-5 lake trout during
2013. The model realized these increased
catches by elevating selectivity of small fish,
which is suspect. The low rating is a result of
the highly uncertain recruitment estimates,
coupled with less than optimal diagnostics.

20
MH-2 (North-Central Lake Huron) Ji He
Parameter Value
Base SSBR 0.52 lb
Current SSBR 0.11 lb
Target SSBR 0.04 lb
Current SPR 0.22
M 0.13 y-1
F, Commercial (2011-2013) 0.06 y-1
F, Recreational (2011-2013) 0.03 y-1
Sea Lamprey Mort (2010-2012) 0.08 y-1
Z 0.33 y-1
Recommended TAC 143,800 lb
Actual TAC 143,800 lb
Model Rating Low
Notable Fishery Dynamics and Model Changes
The MH-2 model structure was fundamentally
the same as MH-1, but it did not encounter the
issue of an unreasonable increase in juvenile
selectivity and the apparent underestimate of
age-4 recruitment. Consistent recruitment of
wild juvenile lake trout in this unit, particularly
in commercial fishery, started much earlier than
MH-1. Harvest in 2013 was well below the
established limits. Sea lamprey-induced
mortality doubled from 0.06 y-1
to 0.12 y-1
,
triggering a full assessment for a unit that would
otherwise have been in rotation. Estimated
annual mortality averaged 26%. The 2014
model-generated TAC was 143,800 lb, a 10%
increase over 2013. This increase is the result of
an expanding adult stock.
21
Lake Michigan
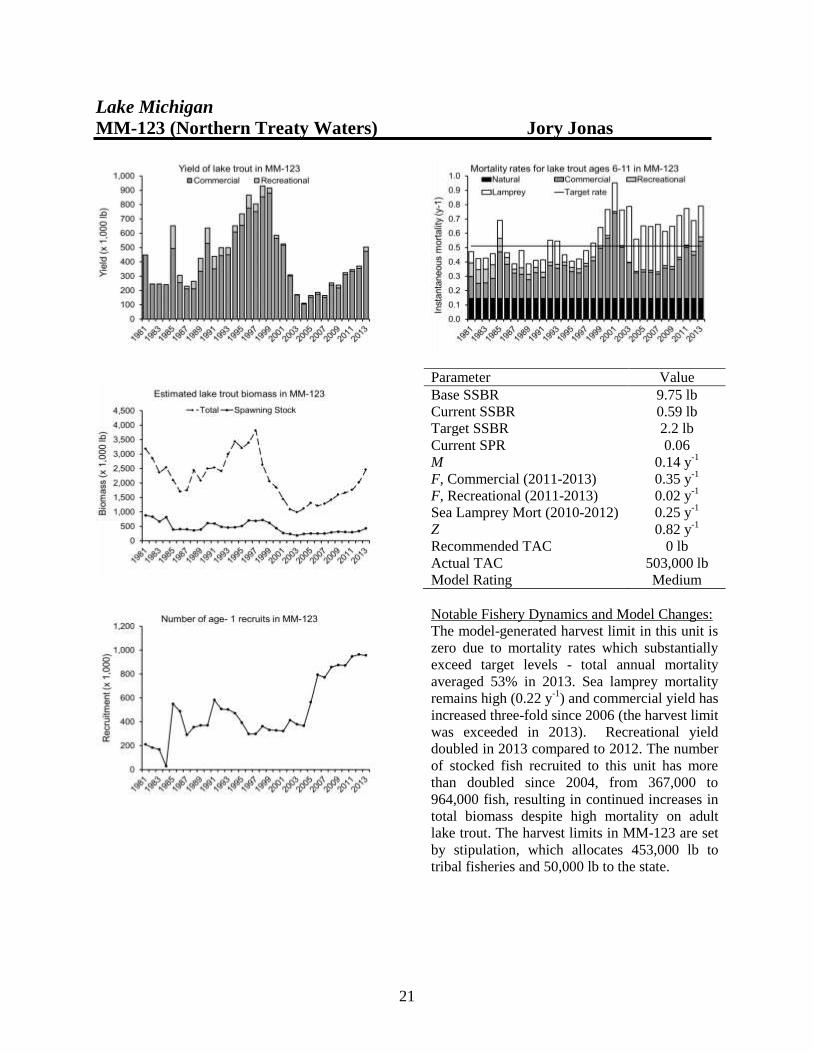
MM-123 (Northern Treaty Waters) Jory Jonas
Parameter Value
Base SSBR 9.75 lb
Current SSBR 0.59 lb
Target SSBR 2.2 lb
Current SPR 0.06
M 0.14 y-1
F, Commercial (2011-2013) 0.35 y-1
F, Recreational (2011-2013) 0.02 y-1
Sea Lamprey Mort (2010-2012) 0.25 y-1
Z 0.82 y-1
Recommended TAC 0 lb
Actual TAC 503,000 lb
Model Rating Medium
Notable Fishery Dynamics and Model Changes:
The model-generated harvest limit in this unit is
zero due to mortality rates which substantially
exceed target levels - total annual mortality
averaged 53% in 2013. Sea lamprey mortality
remains high (0.22 y-1
) and commercial yield has
increased three-fold since 2006 (the harvest limit
was exceeded in 2013). Recreational yield
doubled in 2013 compared to 2012. The number
of stocked fish recruited to this unit has more
than doubled since 2004, from 367,000 to
964,000 fish, resulting in continued increases in
total biomass despite high mortality on adult
lake trout. The harvest limits in MM-123 are set
by stipulation, which allocates 453,000 lb to
tribal fisheries and 50,000 lb to the state.

22
MM-4 (Grand Traverse Bay) Jory Jonas
Parameter Value
Base SSBR 3.11 lb
Current SSBR 0.53 lb
Target SSBR 0.52 lb
Current SPR 0.17
M 0.19 y-1
F, Commercial (2011-2013) 0.14 y-1
F, Recreational (2011-2013) 0.08 y-1
Sea Lamprey Mort (2010-2012) 0.10 y-1
Z 0.48 y-1
Recommended TAC 145,183 lb
Actual TAC 171,500 lb
Model Rating Medium
Notable Fishery Dynamics and Model Changes:
The projected harvest limits for 2014 were
higher than 2013, due to continued increases in
recruitment, a reduction in sea lamprey induced
mortality (declined from 0.11 y-1
to 0.06 y-1
),
and modifications to the model structure (new
variance estimation approach). Total yield
slightly declined in 2013, but still exceeded
model-generated harvest limits. Total annual
mortality averaged 38%. The actual harvest
limits in MM-4 are set by stipulation, which
allocates 94,300 lb to tribal fisheries and 77,200
lb to the state. The state slightly exceeded its
harvest quota in 2013, so a transfer of unused
quota did not occur in 2014.

23
MM-5 (Leelanau Peninsula to Arcadia) Jory Jonas
Parameter Value
Base SSBR 1.22 lb
Current SSBR 0.47 lb
Target SSBR 0.43 lb
Current SPR 0.39
M 0.24 y-1
F, Commercial (2011-2013) 0.04 y-1
F, Recreational (2011-2013) 0.04 y-1
Sea Lamprey Mort (2010-2012) 0.13 y-1
Z 0.41 y-1
Recommended TAC 57,225 lb
Actual TAC 98,000 lb
Model Rating Medium
Notable Fishery Dynamics and Model Changes:
The projected harvest limits for 2014 were
approximately 15% lower than 2013. Mortality
was estimated to be slightly higher, averaging
36%. The model structure was altered to
incorporate the new variance ratio structure.
Lamprey mortality and recruitment were largely
unchanged, though recreational fishery harvest
was the highest in more than a decade. This
increase was due to a poor Chinook Salmon
fishing year, causing charter and sport anglers to
target lake trout. The harvest limits in MM-5
are set by stipulation, which allocates a
minimum of 39,200 lb to tribal fisheries and
58,800 lb to the State recreational fishery.

24
MM-67 (Southern Treaty Waters) Jory Jonas
Parameter Value
Base SSBR 2.26 lb
Current SSBR 1.09 lb
Target SSBR 0.40 lb
Current SPR 0.48
M 0.17 y-1
F, Commercial (2010-2012) 0.01 y-1
F, Recreational (2010-2012) 0.03 y-1
Sea Lamprey Mort (2010-2012) 0.08 y-1
Z 0.27 y-1
Recommended TAC 465,272 lb
Actual TAC 465,272 lb
Model Rating N/A
Notable Fishery Dynamics and Model Changes:
This unit was in rotation for 2014 and a full
assessment was not conducted. Harvest and sea
lamprey data were updated to project the 2014
harvest limits. The projected harvest limits for
2014 were lower than those established in 2013.
Recreational harvest in 2013 increased closer to
the level extracted in 2011. The commercial
fishery experienced complications in 2013 and
only harvested 160 lb of lake trout, the lowest
yield since fishing began in 2004. The average
annual mortality rate for lake trout ages 6-11 in
this unit was estimated to be 26% when the last
full assessment was run in 2012. A full
assessment will be completed in 2015.

25
STATUS OF LAKE WHITEFISH POPULATIONS
Lake Superior WFS-04 (Marquette-Big Bay) Mike Seider
Parameter Value
Base SSBR 8.84 lb
Current SSBR 2.58 lb
Target SSBR 0.22 lb
Current SPR 0.29
M 0.15 y-1
F, trap net (2010-2012) 0.12 y-1
F, gill net (2010-2012) 0.09 y-1
Z 0.37 y-1
Recommended TAC 102,000 lb
Actual TAC 102,000 lb
Model Rating Medium
Notable Fishery Dynamics and Model Changes:
Commercial CPUE has been relatively stable
over the past decade. Annual mortality for the
most vulnerable age class was 43% in 2012.
Changes to the 2014 assessment model included
incorporating the ratio approach to estimating
variance, a switch to random walk function for
time varying selectivity, a switch to length-based
selectivity, and allowing catchability to vary

26
over time via a random walk function. Structural
changes improved data fits and model stability
but did suggest a more pronounced decline in
recruitment than previous model versions. The
2014 yield limit was 10% lower than for 2013.

27
WFS-05 (Munising) Shawn Sitar
Parameter Value
Base SSBR 10.11 lb
Current SSBR 5.27 lb
Target SSBR 0.21 lb
Current SPR 0.52
M 0.13 y-1
F, trap net (2010-2012) 0.05 y-1
F, gill net (2010-2012) 0.03 y-1
Z 0.21 y-1
Recommended TAC 372,000 lb
Actual TAC 372,000 lb
Model Rating Medium
Notable Fishery Dynamics and Model Changes:
The 2014 yield limit was 15% lower than 2013.
The decline was due to a decreasing trend in
stock abundance since 2009. Key changes to the
model included implementation of the variance
ratio approach to specify the standard deviation
of each data source used in model fitting and a
random walk, time-varying gamma selectivity
function for the fishery data. The maximum
annual mortality for 2012 was 34%. Trap-net
yield has increased since 2008 and gill-net yield
nearly tripled from 2011 to 2012.

28
WFS-06 (Grand Marais)
There is no current stock assessment model for
WFS-06. Low levels of effort and harvest and a
lack of fishery monitoring data since the early
2000s limit the ability to produce a model
assessment in this unit.

29
WFS-07 (Tahquamenon Bay) Mark Ebener
Parameter Value
Base SSBR 6.61 lb
Current SSBR 1.21 lb
Target SSBR 0.24 lb
Current SPR 0.18
M 0.17 y-1
F, trap net (2010-2012) 0.19 y-1
F, gill net (2010-2012) 0.19 y-1
Z 0.54 y-1
Recommended TAC 539,000 lb
Actual TAC 539,000 lb
Model Rating Low
Notable Fishery Dynamics and Model Changes:
There were no structural changes made to the
WFS-07 model, which was generally stable, but
substantial differences in fishable biomass were
obtained when the reference length for gear
selectivity was changed. There were very strong
and divergent retrospective patterns in estimated
biomass, recruitment, and population size, with
the most divergent patterns being for biomass.
Fishable biomass in WFS-07 continued its two-

30
decade long decline in 2012. Annual mortality
of the most fully vulnerable age class was
estimated to be 45% in 2012. The model was
rated as low because different starting values
produced different final results, MCMCs were
not quite normal, and because of the
retrospective patterns.
31
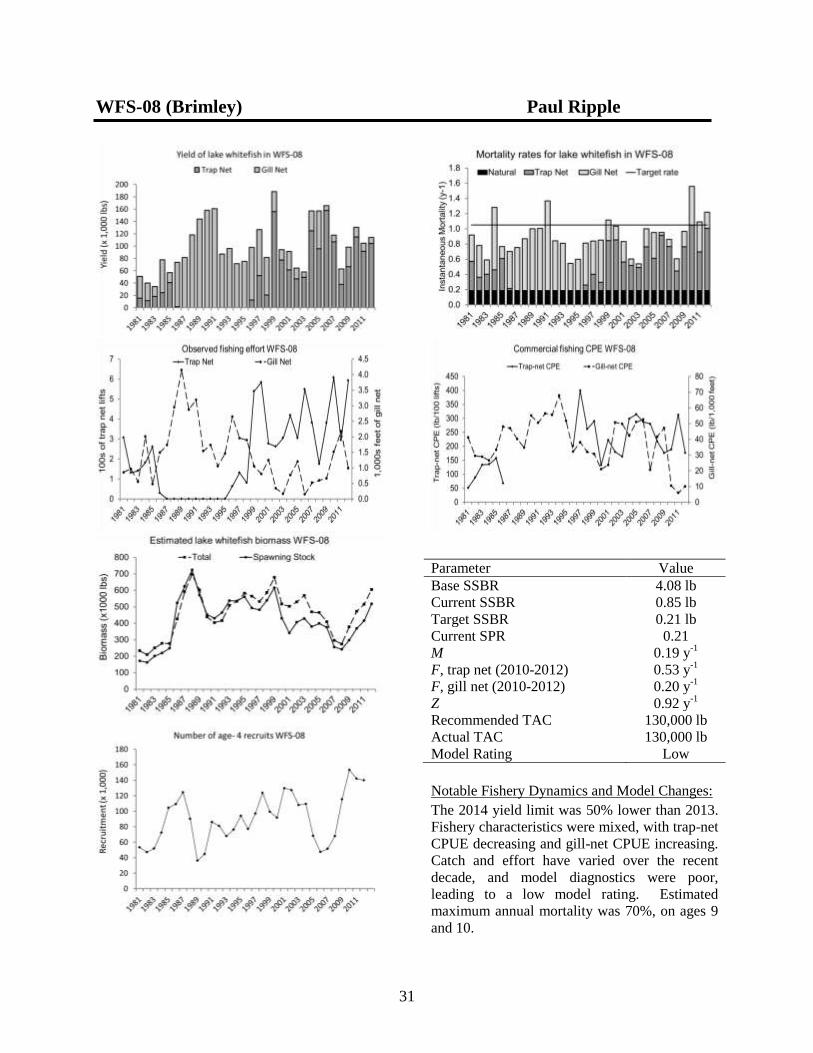
WFS-08 (Brimley) Paul Ripple
Parameter Value
Base SSBR 4.08 lb
Current SSBR 0.85 lb
Target SSBR 0.21 lb
Current SPR 0.21
M 0.19 y-1
F, trap net (2010-2012) 0.53 y-1
F, gill net (2010-2012) 0.20 y-1
Z 0.92 y-1
Recommended TAC 130,000 lb
Actual TAC 130,000 lb
Model Rating Low
Notable Fishery Dynamics and Model Changes:
The 2014 yield limit was 50% lower than 2013.
Fishery characteristics were mixed, with trap-net
CPUE decreasing and gill-net CPUE increasing.
Catch and effort have varied over the recent
decade, and model diagnostics were poor,
leading to a low model rating. Estimated
maximum annual mortality was 70%, on ages 9
and 10.
32
Lake Huron
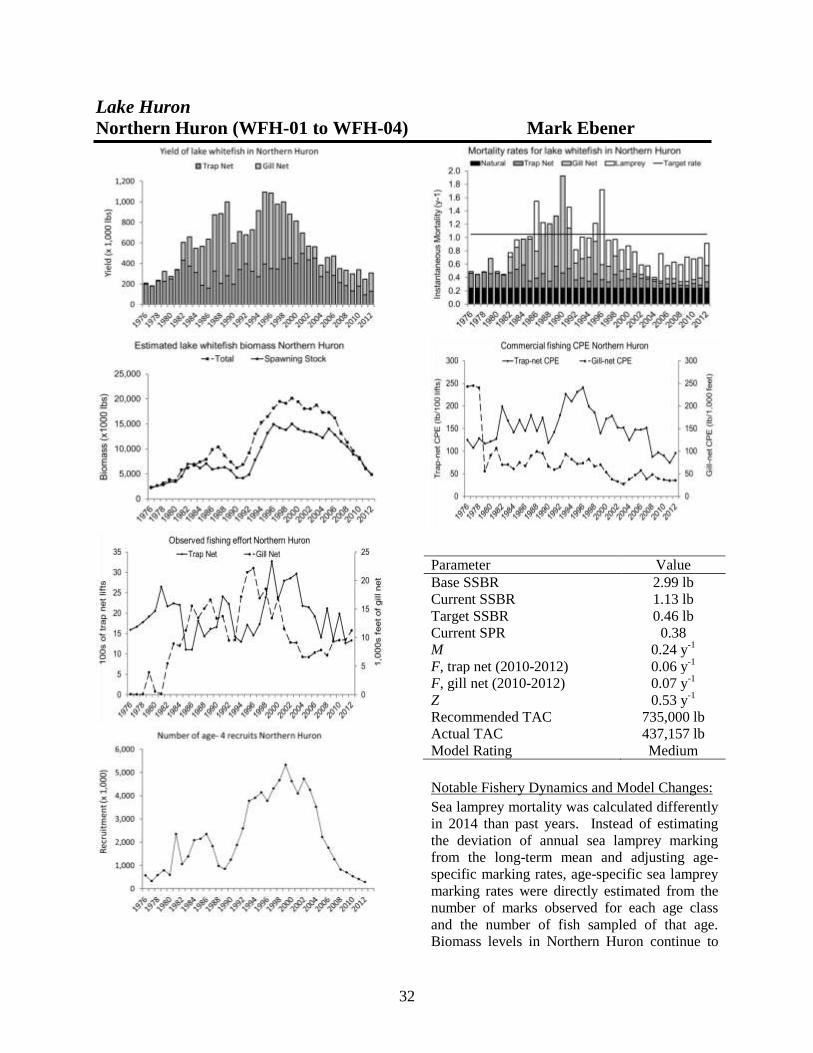
Northern Huron (WFH-01 to WFH-04) Mark Ebener
Parameter Value
Base SSBR 2.99 lb
Current SSBR 1.13 lb
Target SSBR 0.46 lb
Current SPR 0.38
M 0.24 y-1
F, trap net (2010-2012) 0.06 y-1
F, gill net (2010-2012) 0.07 y-1
Z 0.53 y-1
Recommended TAC 735,000 lb
Actual TAC 437,157 lb
Model Rating Medium
Notable Fishery Dynamics and Model Changes:
Sea lamprey mortality was calculated differently
in 2014 than past years. Instead of estimating
the deviation of annual sea lamprey marking
from the long-term mean and adjusting age-
specific marking rates, age-specific sea lamprey
marking rates were directly estimated from the
number of marks observed for each age class
and the number of fish sampled of that age.
Biomass levels in Northern Huron continue to

33
decline and are currently near an all-time low.
The dramatic decline in biomass was due partly
to huge declines in recruitment after 2004 and to
increased sea lamprey predation over the last
few years. Total mortality on the most fully
vulnerable age class was estimated to be 60%,
with about one-half of this mortality being
attributable to sea lamprey (28%). The yield
limit increased nearly two-fold in northern Lake
Huron from 2013 and 2014 because estimates of
sea lamprey mortality were 50% lower on the
oldest and most vulnerable age class in the
current stock assessment than in the 2013 stock
assessment. The Northern Huron model was
rated medium because the model appeared
stable, without troubling retrospective patterns.

34
WFH-05 (Alpena) Steve Lenart
Parameter Value
Base SSBR 4.03 lb
Current SSBR 1.51 lb
Target SSBR 0.26 lb
Current SPR 0.37
M 0.18 y-1
F, trap net (2010-2012) 0.10 y-1
F, gill net (2010-2012) 0 y-1
Z 0.41 y-1
Recommended TAC 727,000 lb
Actual TAC 634,300 lb
Model Rating Medium
Notable Fishery Dynamics and Model Changes:
Biomass continues to decline in response to
declines in recruitment. Maximum annual
mortality was 52% (age 13) in 2012. Sea-
lamprey induced mortality continues to be high
on older age classes, though estimates are, on
average, lower than previous assessments due to
a change in the calculation methodology (see
Northern Huron narrative). The 2014 yield limit
declined 5% from 2013, primarily because the

35
projected abundance of the fishable stock is
lower than last year, a result of declining
recruitment in the face of relatively high
mortality on older age classes. Aside from
allowing fishery catchability to vary freely
through time, no substantive changes were made
to the model structure. Model performance was
rated medium, though strong retrospective
patterns in spawning biomass remain an issue.

36
Lake Michigan
WFM-01 (Bays De Noc) Mark Ebener
Parameter Value
Base SSBR 1.61 lb
Current SSBR 0.73 lb
Target SSBR 0.18 lb
Current SPR 0.45
M 0.28 y-1
F, trap net (2010-2012) 0.20 y-1
F, gill net (2010-2012) 0 y-1
Z 0.48 y-1
Recommended TAC 1,354,000 lb
Actual TAC 2,000,000 lb
Model Rating Low
Notable Fishery Dynamics and Model Changes:
In the 2014 stock assessment model for WFM-
01 the standard deviation around the Pauly
equation was returned to 0.001 (from 0.1 in
2013), which resulted in a natural mortality
estimate of 0.28 for 2014 compared to 0.17 in
2013. The 2014 SCAA stock assessment for
WFM-01 was generally unstable because only
slight changes to bounds or starting values
produced assessments that did not converge or

37
models that exited abnormally before reaching
convergence. MCMC simulations were very
poor showing bimodal probability distributions,
sticky chains, and very high auto-correlation.
As a consequence of a larger estimated natural
mortality rate, 2012 estimated biomass in WFM-
01 was roughly 55% greater than the 2011 value
estimated with the 2013 SCAA. Biomass has
declined over the last decade due to lower levels
of recruitment. Age-12+ was the most fully
vulnerable age group in 2012 with an estimated
total annual mortality rate of 57%. The 2014
yield limit was 23% lower than 2013.
Retrospective patterns of biomass, recruitment,
and population size were mildly problematic.
The WFM-01 stock assessment model is rated
low because of the instability and poor MCMC
results.

38
WFM-02 (Manistique) Ted Treska
Parameter Value
Base SSBR 1.40 lb
Current SSBR 1.09 lb
Target SSBR 0.19 lb
Current SPR 0.78
M 0.34 y-1
F, trap net (2010-2012) 0.14 y-1
F, gill net (2010-2012) 0.08 y-1
Z 0.41 y-1
Recommended TAC 559,000 lb
Actual TAC 559,000 lb
Model Rating Low
Notable Fishery Dynamics and Model Changes:
The 13% increase in the yield limit is likely due
to increases in both population size and growth
of older age classes, along with an apparent
spike in recruitment in 2012. The 11 and 12+
age classes experienced the maximum annual
mortality rate of 45%. Trap-net effort over the
last decade is significantly lower than earlier in
the time series, but trap-net CPUE has increased
dramatically since 2004. Gill-net fishery effort

39
has expanded recently, yet catch rates have
declined more than 50% in the last two years. A
lack of a signal from the trap-net fishery during
the mid-to-late 2000’s continues to be a problem
and model continues to struggle to match the
gill-net age composition in the last 5 years. This
model continues to be rated low due to
convergence problems, retrospective analyses,
and the requirement to fix some parameters for
suitable model performance.

40
WFM-03 (Naubinway) Ted Treska
Parameter Value
Base SSBR 1.45 lb
Current SSBR 1.09 lb
Target SSBR 0.15 lb
Current SPR 0.75
M 0.40 y-1
F, trap net (2010-2012) 0.11 y-1
F, gill net (2010-2012) 0.06 y-1
Z 0.55 y-1
Recommended TAC 976,000 lb
Actual TAC 976,000 lb
Model Rating Low
Notable Fishery Dynamics and Model Changes:
The 2014 yield limit declined 39% from 2013.
In order to better track the population and the
abundance of older fish, the “plus group” used in
the model was changed from age 10+ to age
15+. Data in this year’s model reduced the
amount of expected recruitment over the last few
years, which likely resulted in the decrease in
harvestable biomass. The maximum annual
mortality rate was 63% on age 13 fish. CPUE
has remained relatively constant in both

41
fisheries, with sizeable variations among the
years, but a stable trend overall. Effort in WFM-
03 has been increasing in both fisheries over the
last 5 years, with trap net increasing almost 3
fold, and gill net increasing almost 20 fold. The
model is rated low due to issues with
retrospective patterns, including convergence
issues in some iterations, and persistent
covariance warnings.

42
WFM-04 (Beaver Island) Kevin Donner
Parameter Value
Base SSBR 1.52 lb
Current SSBR 0.76 lb
Target SSBR 0.20 lb
Current SPR 0.50
M 0.34 y-1
F, trap net (2010-2012) 0.14 y-1
F, gill net (2010-2012) 0.11 y-1
Z 0.58 y-1
Recommended TAC 548,000 lb
Actual TAC 548,000 lb
Model Rating Medium
Notable Fishery Dynamics and Model Changes:
The 2014 yield limit is 14% lower than 2013,
mostly attributable to a slow but steady decline
in estimated biomass since the middle 1990s.
Biomass trends are likely being driven by
estimates of recruitment, since fishing mortality
had declined markedly during 2000-2008
compared to the 1990s. The maximum annual
mortality rate during 2012 was 34%. Yield
declined predominantly due to a decrease in

43
effort by the trap-net fishery after two operations
moved from the unit. Gill-net effort has
increased substantially since 2007 and, during
2012, gill-net yield exceeded trap-net yield for
only the second time since 2000. Trap-net
fishery catch rates have declined substantially
compared to the middle 1990s and gill-net catch
rates show a modest, but steady decline since
2002. The model was rated medium and
exhibited generally good fit, no troubling
retrospective patterns, and reasonable MCMC
results.

44
WFM-05 (Grand Traverse Bay) Steve Lenart
Parameter Value
Base SSBR 3.45 lb
Current SSBR 2.11 lb
Target SSBR 0.30 lb
Current SPR 0.61
M 0.25 y-1
F, trap net (2010-2012) 0.02 y-1
F, gill net (2010-2012) 0.10 y-1
Z 0.37 y-1
Recommended TAC 492,000 lb
Actual TAC 492,000 lb
Model Rating Medium
Notable Fishery Dynamics and Model Changes:
Estimated total biomass and abundance showed
a substantial increase in 2012, driven by a huge
estimated 2009 year class. Spawning biomass
increased substantially as well, primarily as a
result of substantial increases in growth over the
past few years. This increase in mean weight-at-
age was the primary factor driving the 35%
increase in the model-generated TAC. Although
gill-net effort remained fairly stable, the trap-net
fishery has only recorded 18 lifts over the past

45
two years and fishery mortality rates remain
low. No substantive changes were made to
model structure and model performance was
rated medium, although recent recruitment
estimates are likely inflated. Recruitment
estimates were influenced by the dominance of
age 3-4 fish in the small number of 2012 fishery
samples, all of which were collected late in the
year. Maximum annual mortality was 29%.

46
WFM-06 (Leland) Dave Caroffino
Parameter Value
Base SSBR 3.86 lb
Current SSBR 1.84 lb
Target SSBR 0.45 lb
Current SPR 0.48
M 0.25 y-1
F, trap net (2010-2012) 0.25 y-1
F, gill net (2010-2012) 0.01 y-1
Z 0.51 y-1
Recommended TAC 250,000 lb
Actual TAC 250,000 lb
Model Rating Medium
Notable Fishery Dynamics and Model Changes:
Recruitment in the last two years was estimated
to be the highest in the time series. This was
influenced by the highest proportion of age-3
and age-4 fish in the commercial biodata in the
last decade. The maximum annual mortality rate
experienced by the stock was 47%. The model
structure was updated to include length-based
selectivity, random walk catchability, and a
modified approach to variance estimation. The
model is rated medium because diagnostics have

47
improved with the new model structure. Yield
was high in 2012, as was CPUE, and the
evidence of young fish in the commercial
monitoring data suggests that the potential exists
for a strong recruit class to enter the fishery in
the coming years. Therefore, the MSC
recommends continuing the constant harvest
limit for this unit (250,000 lb).
48
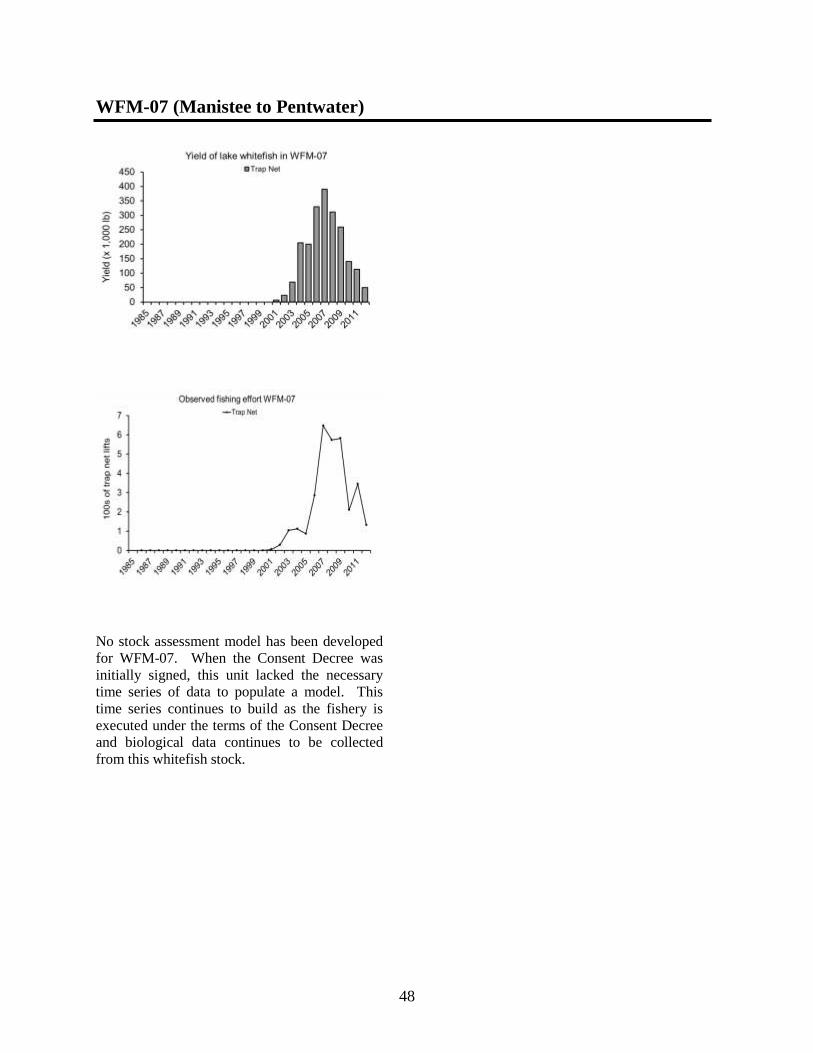
WFM-07 (Manistee to Pentwater)
No stock assessment model has been developed
for WFM-07. When the Consent Decree was
initially signed, this unit lacked the necessary
time series of data to populate a model. This
time series continues to build as the fishery is
executed under the terms of the Consent Decree
and biological data continues to be collected
from this whitefish stock.
49
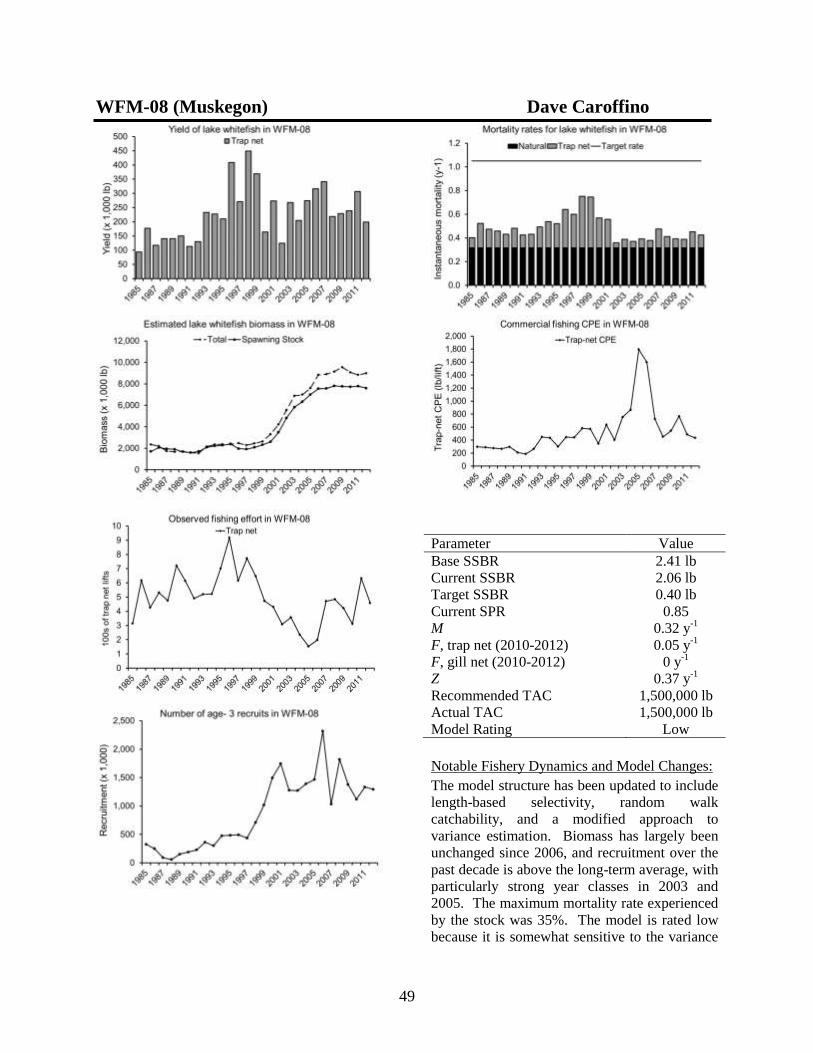
WFM-08 (Muskegon) Dave Caroffino
Parameter Value
Base SSBR 2.41 lb
Current SSBR 2.06 lb
Target SSBR 0.40 lb
Current SPR 0.85
M 0.32 y-1
F, trap net (2010-2012) 0.05 y-1
F, gill net (2010-2012) 0 y-1
Z 0.37 y-1
Recommended TAC 1,500,000 lb
Actual TAC 1,500,000 lb
Model Rating Low
Notable Fishery Dynamics and Model Changes:
The model structure has been updated to include
length-based selectivity, random walk
catchability, and a modified approach to
variance estimation. Biomass has largely been
unchanged since 2006, and recruitment over the
past decade is above the long-term average, with
particularly strong year classes in 2003 and
2005. The maximum mortality rate experienced
by the stock was 35%. The model is rated low
because it is somewhat sensitive to the variance

50
estimation technique. The model-generated
harvest limit is 1,576,000 lb. Because overall
yield is low and catch rates are near the long-
term average, the MSC recommended that the
constant harvest limit for this unit (1,400,000
lb), first adopted in 2013, be continued for 2014.