Embed Size (px)
Citation preview
2014 WATER QUALITY MONITORING
PROGRAM REPORT
Prepared by
Brian Corcoran, VLAWMO Water Resource Manager
December 2014
VLAWMO would like to thank the volunteers for their vital role in the Citizens Lake Monitoring Program. The volunteers for 2014 were: Ron Auger & Jim Grisim (Birch Lake), Paul Peterson (Amelia), Sue Fox (Gilfillan Lake), Kurt Carpenter (Goose Lake West & East) and Shannon Stewart (Tamarack Lake)
VLAWMO would also like to acknowledge and thank the following agencies for their assistance with assuring the quality of water within the watershed: St. Paul Regional Water Service, the Citizen’s Lake Monitoring Program at the Minnesota Pollution Control Agency, the Lake Level Program at the Minnesota Department of Natural Resources, the Ramsey County Limnology Lab, Braun Intertec, Pace Analytical and Burns & McDonnell.
Definitions & Abbreviations
Ammonia (NH3) – an inorganic form of nitrogen that is contained in fertilizers, septic system effluent, and animal wastes. It is also a product of bacterial decomposition of organic matter. NH3 becomes a concern if high levels of the un-ionized form are present. In this form NH3 can be toxic to aquatic organisms. The presence of un-ionized ammonia is a function of the NH3 concentration, pH, and temperature. Conversion of NH3 to NO2 by nitrification requires large quantities of oxygen which can kill aquatic organisms due to the lowered dissolved oxygen concentrations in water.
Aquatic Invasive Species (AIS) – non-native species such as zebra mussels and Eurasian watermilfoil
Birch Lake Improvement District (BLID) – Homeowner/lakeshore owners on Birch Lake in White Bear Lake MN
Chlorophyll-a (Chl A) - Chl A is a green pigment in algae. Measuring Chl A concentration gives an indication of how abundant algae are in a waterbody.
Colony Forming Units (CFU) – unit used in measuring the level of E. coli in a water sample.
Conductivity (mS/cm) - Conductivity is a good measure of salinity in water. The measurement detects chloride ions from the salt. Salinity affects the potential dissolved oxygen levels in the water. The greater the salinity, the lower the saturation point. Measurement in millisiemens per cm. 1 mS/cm = 1000 uS/cm.
Dissolved Oxygen (DO) - The concentration of molecular oxygen (O2) dissolved in water. The DO level represents one of the most important measurements of water quality and is a critical indicator of a water body's ability to support healthy ecosystems. Levels above 5 mg/L are considered optimal, and most fish cannot survive for prolonged periods at levels below 3 mg/L. Microbial communities in water use oxygen to breakdown organic materials, such as animal waste products and decomposing algae and other vegetation. Low levels of dissolved oxygen can be a sign that too much organic material is in a water body.
Ecoli – Criteria for E. coli set forth in Minn.R. 7050.0222 creek must not exceed 126 organisms per 100 ml as a geometric mean of not less than 5 samples in any calendar month, nor shall more than ten percent of all samples taken during any calendar month individually exceed 1,260 organisms per 100 ml
EQuIS - a repository for water quality, biological, and physical data and is used by state environmental agencies, EPA and other federal agencies, universities, private citizens, and many others. The MPCA uses the information entered into the database to determine the quality of the state’s water bodies. If water quality standards are not met, the water body will designated as impaired and will need to have a TMDL study conducted.
Eutrophic – a water body that is high in nutrients and low oxygen content. A eutrophic lake is usually shallow, green, with limited oxygen in the bottom layer of water.
Eutrophication – The aging process by which lakes are fertilized with nutrients. Natural eutrophication will gradually change the character of a lake. Human activities can accelerate the process.
Hypereutrophic – A very nutrient-rich lake with murky water, frequent algal blooms and fish kills, foul odor, and rough fish
Impaired Waters – The Clean Water Act requires states to publish, every two years, a list of streams and lakes that are not meeting their designated uses because of excess pollutants. The list, known as the 303(d) list, is based on violations of water quality standards.
Mesotrophic – the classification between eutrophic and oligotrophic lakes. These lakes have moderately clear water, late-summer algal blooms, moderate macrophyte populations, and occasional fish kills.
Molecular Sourcing – the use of specific DNA markers to determine presence of a specific host origin of E.coli in a water sample (example, Human or Avian)
Most Probable Number (MPN) - unit used in measuring the level of E. coli in a water sample, similar to (CFU)
Nitrate (NO3) – High NO3 levels are often caused by over application of fertilizers that leach into waterbodies. Nitrate loading from water bodies in Minnesota has national implications as it is the primary chemical contributing to the hypoxia (low oxygen) zone at the mouth of the Mississippi River in the Gulf of Mexico. The Environmental Protection Agency (EPA) has a standard for nitrates in drinking water of 10ppb, infants and children are especially at risk.
Nitrite (NO2) – The second stage of the nitrogen cycle. Nitrite is poisonous to fish. Levels over 75 ug/L can cause stress in fish and greater than 500 ug/L can be toxic
Nitrogen (N) – Nitrogen is second only to phosphorus as an important nutrient for plant and algae growth. The amount of nitrogen in a water body strongly correlates to land use. Nitrogen comes from fertilizers, animal waste, sewage treatment plants and septic systems through surface runoff or groundwater sources. Nitrogen does not occur naturally in soil minerals but is a major component of all organic matter.
Nitrogen Cycle - the process of nitrogen breakdown in water. The first stage is the production of NH3. The second stage is the oxidation of NH3 into NO2 which is very poisonous to fish. The final stage is conversion of NO3 which aquatic plants use. Once the plants have used their share of NO3, bacteria change it back into a gaseous form and release it back to the atmosphere. The Nitrogen Cycle is dependent on oxygen. If a water body has low DO, organic decay of nitrogen is slower and the water will have increased interim levels of toxic products (NH3 and NO2). The cycle also moves quicker in warmer water.
Oligotrophic – a water body that is generally clear, deep, and free of weeds or large algae blooms.
Particulate Phosphorus – a form of phosphorus that is attached to sediment particles and in plant and animal fragments suspended in the water and may not be immediately available to support algae growth. Some of this phosphorus is readily available but the amount can vary.
Phosphorus (P) - Phosphorus is the primary cause of excessive plant and algae growth in lake systems. Phosphorus originates from a variety of sources, many of which are human related. Major sources include human and animal wastes, soil erosion, detergents, septic systems and runoff from farmland, yards, and streets.
Secchi Disk – a round, white, metal disk that is used to determine water clarity. It is lowered into the water until it is not visible. The depth is recorded, and then the disk is raised until it is visible. The mean value of the two readings gives the clarity.
Secchi Disk Transparency (SDT) - the term used in describing the results of a secchi reading expressed in feet or meters.
Soluble Reactive Phosphorus (SRP) – a form of phosphorus that dissolves in water and is readily available (bio-available) to algae and has an immediate effect on algae growth and DO depletion. Its concentration varies widely over short periods of time as plants take it up and release it.
St. Paul Regional Water Service (SPRWS) – Agency which assists VLAWMO with water quality testing and controls the Vadnais chain of lakes, which supplies drinking water to the city of St. Paul.
Surface Water Assessment Grant (SWAG) - Grant awarded by the PCA to help fund surface water monitoring
Total Kjehldahl Nitrogen (TKN) – The sum of NO2, NO3, and NH3 in a water body. High measurements of TKN typically results from sewage and manure discharges to water bodies.
Total Maximum Daily Load (TMDL) – Calculation of the maximum amount of a pollutant that a waterbody can receive and still meet water quality standards and an allocation of that amount to the pollutant’s source.
Total Nitrate and Nitrite Nitrogen - Nitrate (NO3) plus nitrite (NO2) as nitrogen. In lakes, most nitrate/nitrogen is in NO3 form.
Total Phosphorus (TP) – A nutrient essential to the growth of organisms, and is commonly the limiting factor in the primary productivity of surface water bodies. Total phosphorus includes the amount of phosphorus in solution (reactive) and in particle form. Agricultural drainage, wastewater, and certain industrial discharges are typical sources of phosphorus, and can contribute to the eutrophication of surface water bodies.
Total Suspended Solids (TSS) – Very small particles remaining dispersed in a liquid due to turbulent mixing that can create turbid or cloudy conditions. A measure of the material suspended in water in mg/l. Total suspended solids (TSS) cause: a) interference with light penetration, b) buildup of sediment and c) potential reduction in aquatic habitat. Solids also carry nutrients that cause algal blooms and other toxic pollutants that are harmful to fish. Clay, silt, and sand from soils, phytoplankton (suspended algae), bits of decaying vegetation, industrial wastes, and sewage are common suspended solids.
Trophic Status Indicator (TSI) – TSI is an indicator of water quality. Lakes can be divided into three categories based on trophic state – oligotrophic, mesotrophic and eutrophic. A natural aging process occurs in lakes which cause them to change from oligotrophic to eutrophic over time and eventually fill in. Humans can accelerate this process by allowing nutrients from agriculture, lawn fertilizers, streets, septic systems, and urban storm drains to enter lakes. Trophic status is determined through TP, Chl A, and SDT measurements.
Turbidity – a water quality parameter that refers to how clear the water is. It is an indicator of the concentration of suspended solids in the water. Excessive sedimentation in streams and rivers is considered to be the major source of surface water pollution in the United States. Polluted waters are commonly turbid. Turbidity is expressed in NTU (Nephelometric Turbidity Units).

Volatile Suspended Solids (VSS) – a measure of the organic matter in suspended particles. When measured in conjunction with TSS, the proportions of organic versus mineral content of the particles can be determined.
Introduction
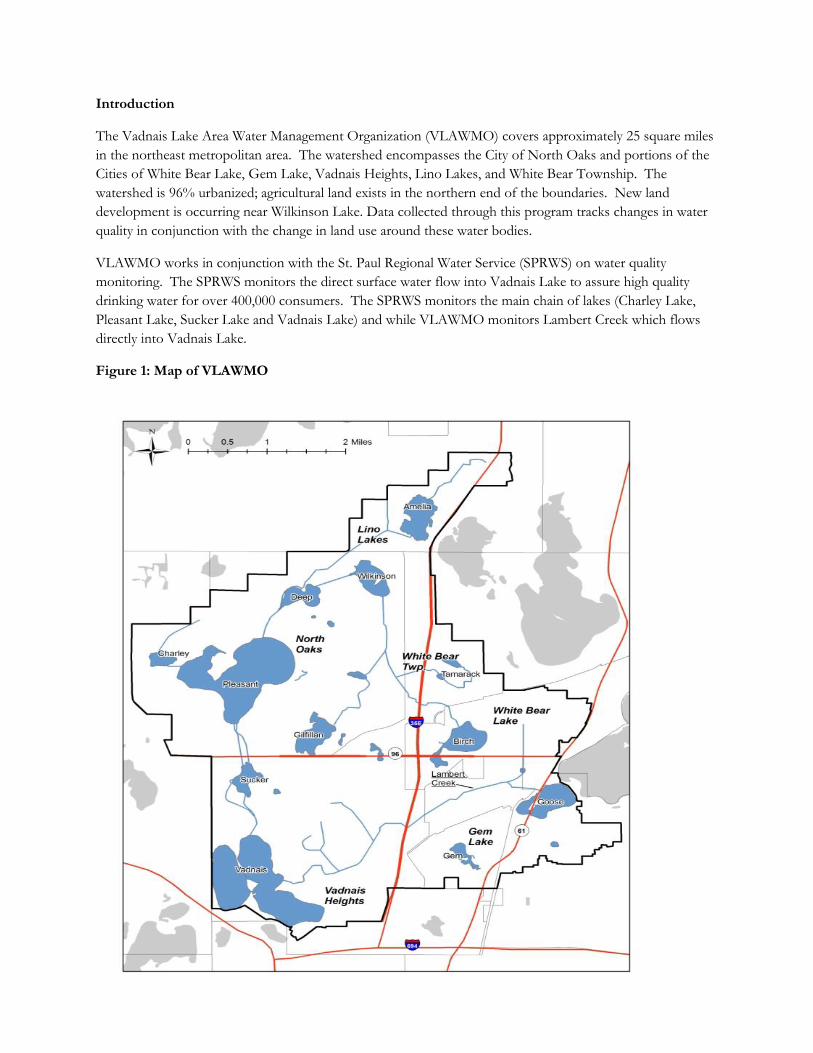
The Vadnais Lake Area Water Management Organization (VLAWMO) covers approximately 25 square miles in the northeast metropolitan area. The watershed encompasses the City of North Oaks and portions of the Cities of White Bear Lake, Gem Lake, Vadnais Heights, Lino Lakes, and White Bear Township. The watershed is 96% urbanized; agricultural land exists in the northern end of the boundaries. New land development is occurring near Wilkinson Lake. Data collected through this program tracks changes in water quality in conjunction with the change in land use around these water bodies.
VLAWMO works in conjunction with the St. Paul Regional Water Service (SPRWS) on water quality monitoring. The SPRWS monitors the direct surface water flow into Vadnais Lake to assure high quality drinking water for over 400,000 consumers. The SPRWS monitors the main chain of lakes (Charley Lake, Pleasant Lake, Sucker Lake and Vadnais Lake) and while VLAWMO monitors Lambert Creek which flows directly into Vadnais Lake.
Figure 1: Map of VLAWMO
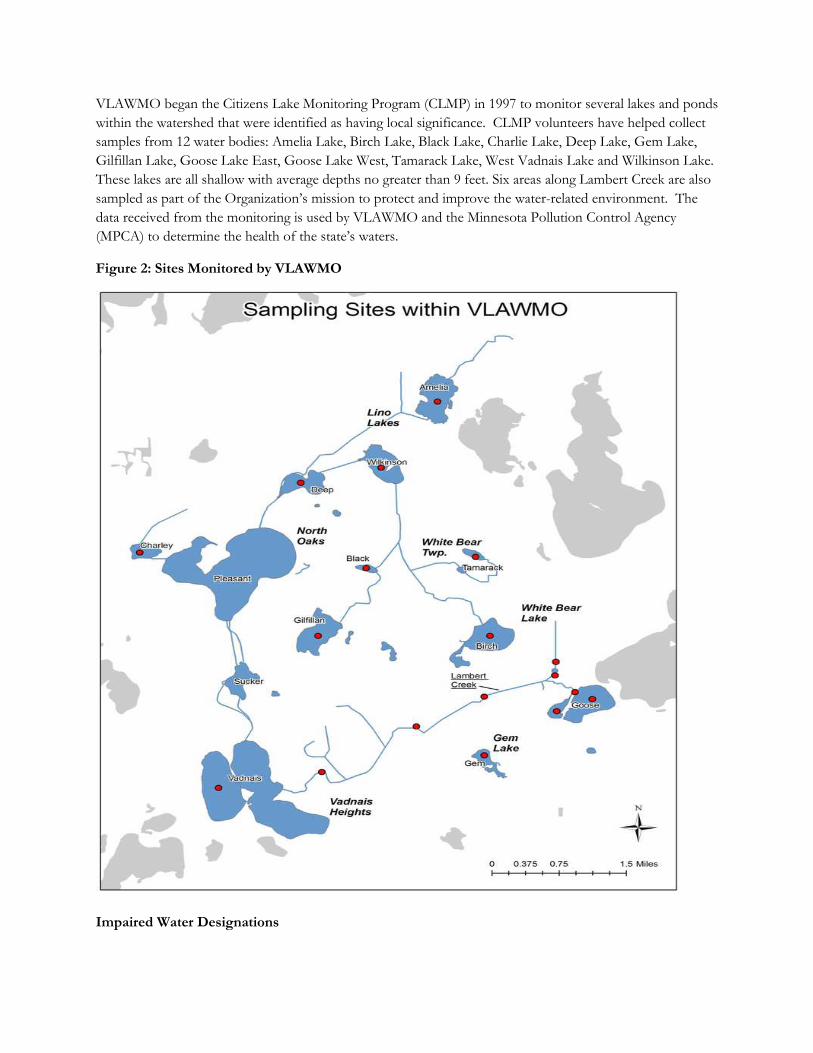
VLAWMO began the Citizens Lake Monitoring Program (CLMP) in 1997 to monitor several lakes and ponds within the watershed that were identified as having local significance. CLMP volunteers have helped collect samples from 12 water bodies: Amelia Lake, Birch Lake, Black Lake, Charlie Lake, Deep Lake, Gem Lake, Gilfillan Lake, Goose Lake East, Goose Lake West, Tamarack Lake, West Vadnais Lake and Wilkinson Lake. These lakes are all shallow with average depths no greater than 9 feet. Six areas along Lambert Creek are also sampled as part of the Organization’s mission to protect and improve the water-related environment. The data received from the monitoring is used by VLAWMO and the Minnesota Pollution Control Agency (MPCA) to determine the health of the state’s waters.
Figure 2: Sites Monitored by VLAWMO
Impaired Water Designations
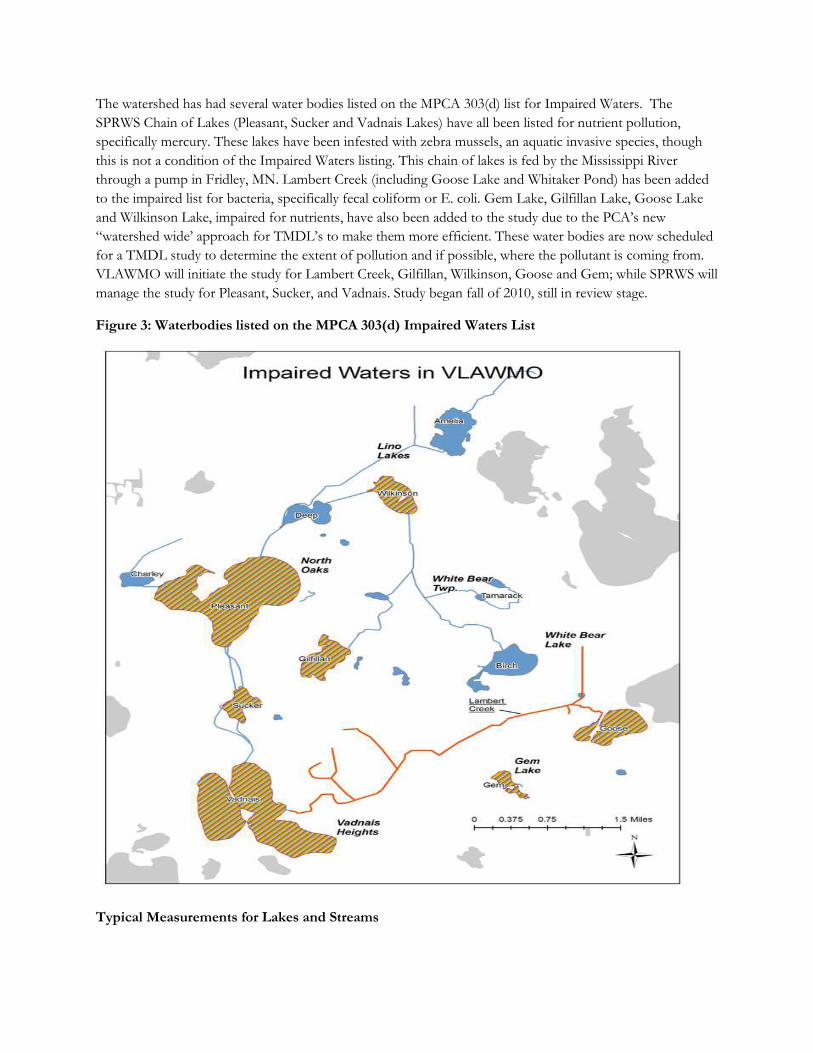
The watershed has had several water bodies listed on the MPCA 303(d) list for Impaired Waters. The SPRWS Chain of Lakes (Pleasant, Sucker and Vadnais Lakes) have all been listed for nutrient pollution, specifically mercury. These lakes have been infested with zebra mussels, an aquatic invasive species, though this is not a condition of the Impaired Waters listing. This chain of lakes is fed by the Mississippi River through a pump in Fridley, MN. Lambert Creek (including Goose Lake and Whitaker Pond) has been added to the impaired list for bacteria, specifically fecal coliform or E. coli. Gem Lake, Gilfillan Lake, Goose Lake and Wilkinson Lake, impaired for nutrients, have also been added to the study due to the PCA’s new “watershed wide’ approach for TMDL’s to make them more efficient. These water bodies are now scheduled for a TMDL study to determine the extent of pollution and if possible, where the pollutant is coming from. VLAWMO will initiate the study for Lambert Creek, Gilfillan, Wilkinson, Goose and Gem; while SPRWS will manage the study for Pleasant, Sucker, and Vadnais. Study began fall of 2010, still in review stage.
Figure 3: Waterbodies listed on the MPCA 303(d) Impaired Waters List
Typical Measurements for Lakes and Streams
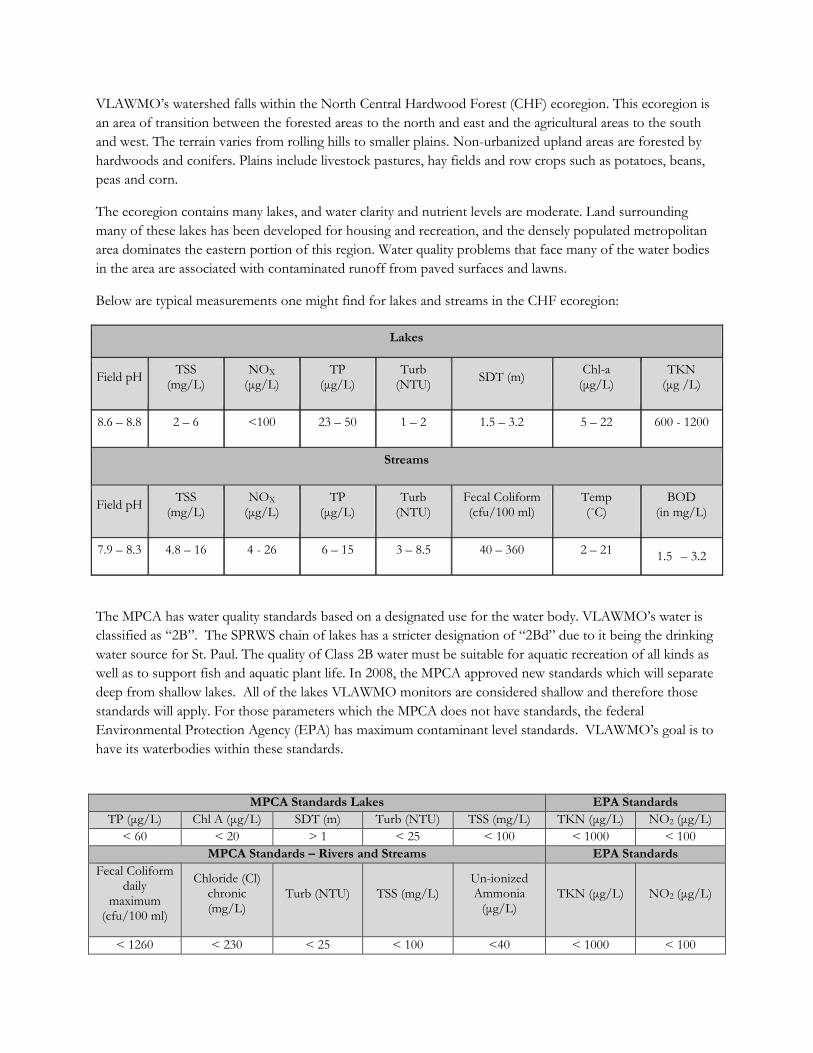
VLAWMO’s watershed falls within the North Central Hardwood Forest (CHF) ecoregion. This ecoregion is an area of transition between the forested areas to the north and east and the agricultural areas to the south and west. The terrain varies from rolling hills to smaller plains. Non-urbanized upland areas are forested by hardwoods and conifers. Plains include livestock pastures, hay fields and row crops such as potatoes, beans, peas and corn.
The ecoregion contains many lakes, and water clarity and nutrient levels are moderate. Land surrounding many of these lakes has been developed for housing and recreation, and the densely populated metropolitan area dominates the eastern portion of this region. Water quality problems that face many of the water bodies in the area are associated with contaminated runoff from paved surfaces and lawns.
Below are typical measurements one might find for lakes and streams in the CHF ecoregion:
Lakes
Field pH TSS (mg/L)
NOX (μg/L)
TP (μg/L)
Turb (NTU) SDT (m) Chl-a
(μg/L) TKN
(μg /L)
8.6 – 8.8 2 – 6 <100 23 – 50 1 – 2 1.5 – 3.2 5 – 22 600 - 1200
Streams
Field pH TSS (mg/L)
NOX (μg/L)
TP (μg/L)
Turb (NTU)
Fecal Coliform (cfu/100 ml)
Temp (˚C)
BOD (in mg/L)
7.9 – 8.3 4.8 – 16 4 - 26 6 – 15 3 – 8.5 40 – 360 2 – 21 1.5 – 3.2
The MPCA has water quality standards based on a designated use for the water body. VLAWMO’s water is classified as “2B”. The SPRWS chain of lakes has a stricter designation of “2Bd” due to it being the drinking water source for St. Paul. The quality of Class 2B water must be suitable for aquatic recreation of all kinds as well as to support fish and aquatic plant life. In 2008, the MPCA approved new standards which will separate deep from shallow lakes. All of the lakes VLAWMO monitors are considered shallow and therefore those standards will apply. For those parameters which the MPCA does not have standards, the federal Environmental Protection Agency (EPA) has maximum contaminant level standards. VLAWMO’s goal is to have its waterbodies within these standards.
MPCA Standards Lakes EPA Standards TP (μg/L) Chl A (μg/L) SDT (m) Turb (NTU) TSS (mg/L) TKN (μg/L) NO2 (μg/L)
< 60 < 20 > 1 < 25 < 100 < 1000 < 100 MPCA Standards – Rivers and Streams EPA Standards
Fecal Coliform daily
maximum (cfu/100 ml)
Chloride (Cl) chronic (mg/L)
Turb (NTU) TSS (mg/L) Un-ionized Ammonia
(μg/L) TKN (μg/L) NO2 (μg/L)
< 1260
< 230 < 25 < 100 <40 < 1000 < 100
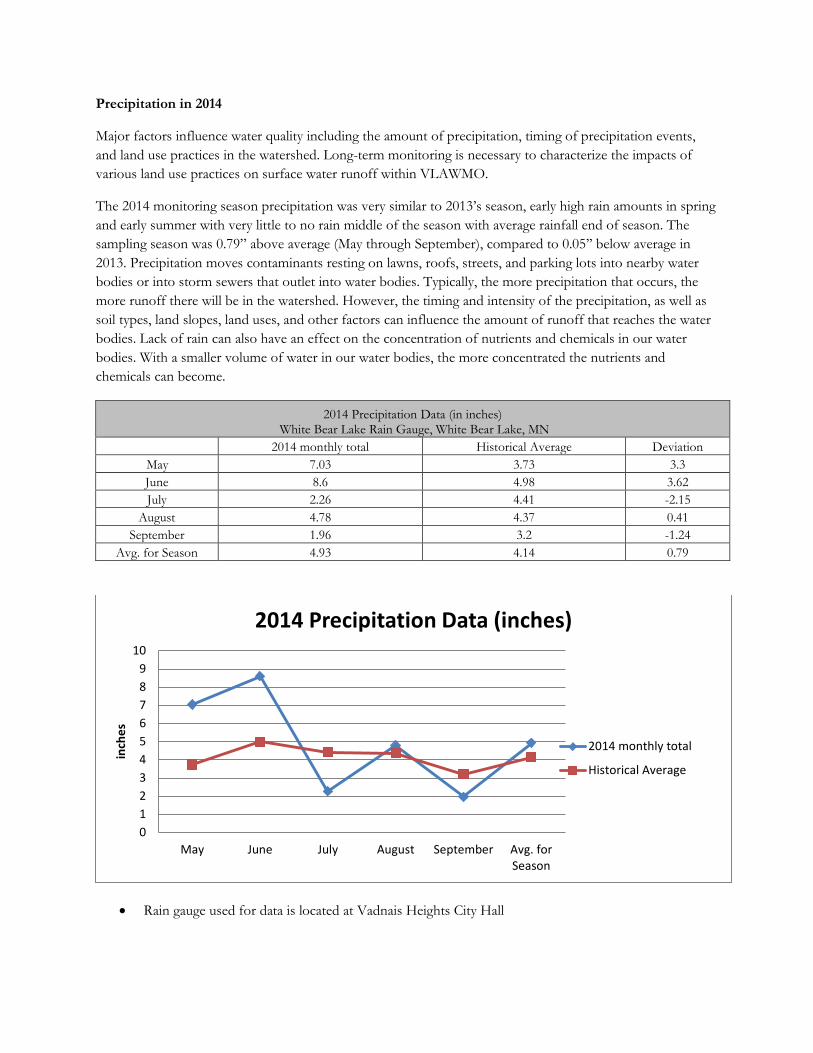
Precipitation in 2014
Major factors influence water quality including the amount of precipitation, timing of precipitation events, and land use practices in the watershed. Long-term monitoring is necessary to characterize the impacts of various land use practices on surface water runoff within VLAWMO.
The 2014 monitoring season precipitation was very similar to 2013’s season, early high rain amounts in spring and early summer with very little to no rain middle of the season with average rainfall end of season. The sampling season was 0.79” above average (May through September), compared to 0.05’’ below average in 2013. Precipitation moves contaminants resting on lawns, roofs, streets, and parking lots into nearby water bodies or into storm sewers that outlet into water bodies. Typically, the more precipitation that occurs, the more runoff there will be in the watershed. However, the timing and intensity of the precipitation, as well as soil types, land slopes, land uses, and other factors can influence the amount of runoff that reaches the water bodies. Lack of rain can also have an effect on the concentration of nutrients and chemicals in our water bodies. With a smaller volume of water in our water bodies, the more concentrated the nutrients and chemicals can become.
2014 Precipitation Data (in inches) White Bear Lake Rain Gauge, White Bear Lake, MN
2014 monthly total Historical Average Deviation May 7.03 3.73 3.3
June 8.6 4.98 3.62 July 2.26 4.41 -2.15
August 4.78 4.37 0.41 September 1.96 3.2 -1.24
Avg. for Season 4.93 4.14 0.79
• Rain gauge used for data is located at Vadnais Heights City Hall
0123456789
10
May June July August September Avg. forSeason
inch
es
2014 Precipitation Data (inches)
2014 monthly total
Historical Average
Preliminary Analysis of Lake Data
VLAWMO staff worked with volunteers to collect samples from the lakes at two-week intervals from May through September. VLAWMO staff collected all creek samples. At the time of collection, volunteers measure water transparency with a Secchi disk (SDT), evaluate the physical and recreational conditions of the water, and if available, take a lake level reading. Samples are brought to Braun Intertec by VLAWMO staff within 24 hours for chemical analysis. Parameters measured at the lab include Phosphorus (TP &SRP), Chlorophyll-a (Chl A), total Kjeldahl Nitrogen, nitrate, ammonia and Total Suspended Solids (TSS). The data from these tests aid in the determination of the state of the water quality in a particular lake or stream and allow for monitoring of the long term health of the water body. Standards for water quality are set by the US Environmental Protection Agency (EPA) and enforced through the MPCA.
A measure of the lake health and lake age is Carlson’s Trophic State Index (TSI), which measures the productivity level of a lake or degree of eutrophication. As a lake ages, it becomes more eutrophic, however human impact speeds up the process. High TSI values can relate to poorer water quality but not always. Trophic state is an absolute scale that describes the biological condition of a water body. Water quality, on the other hand, is a term used to describe the condition of a water body in relation to human needs or values
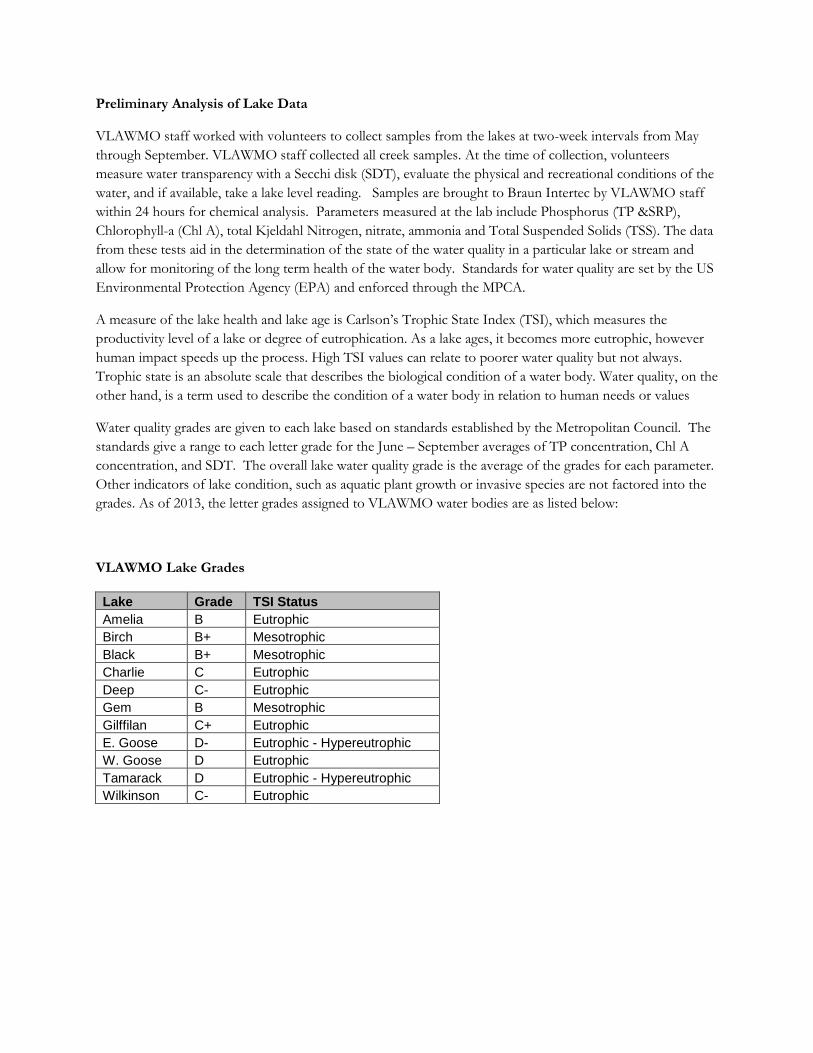
Water quality grades are given to each lake based on standards established by the Metropolitan Council. The standards give a range to each letter grade for the June – September averages of TP concentration, Chl A concentration, and SDT. The overall lake water quality grade is the average of the grades for each parameter. Other indicators of lake condition, such as aquatic plant growth or invasive species are not factored into the grades. As of 2013, the letter grades assigned to VLAWMO water bodies are as listed below:
VLAWMO Lake Grades
Lake Grade TSI Status Amelia B Eutrophic Birch B+ Mesotrophic Black B+ Mesotrophic Charlie C Eutrophic Deep C- Eutrophic Gem B Mesotrophic Gilffilan C+ Eutrophic E. Goose D- Eutrophic - Hypereutrophic W. Goose D Eutrophic Tamarack D Eutrophic - Hypereutrophic Wilkinson C- Eutrophic
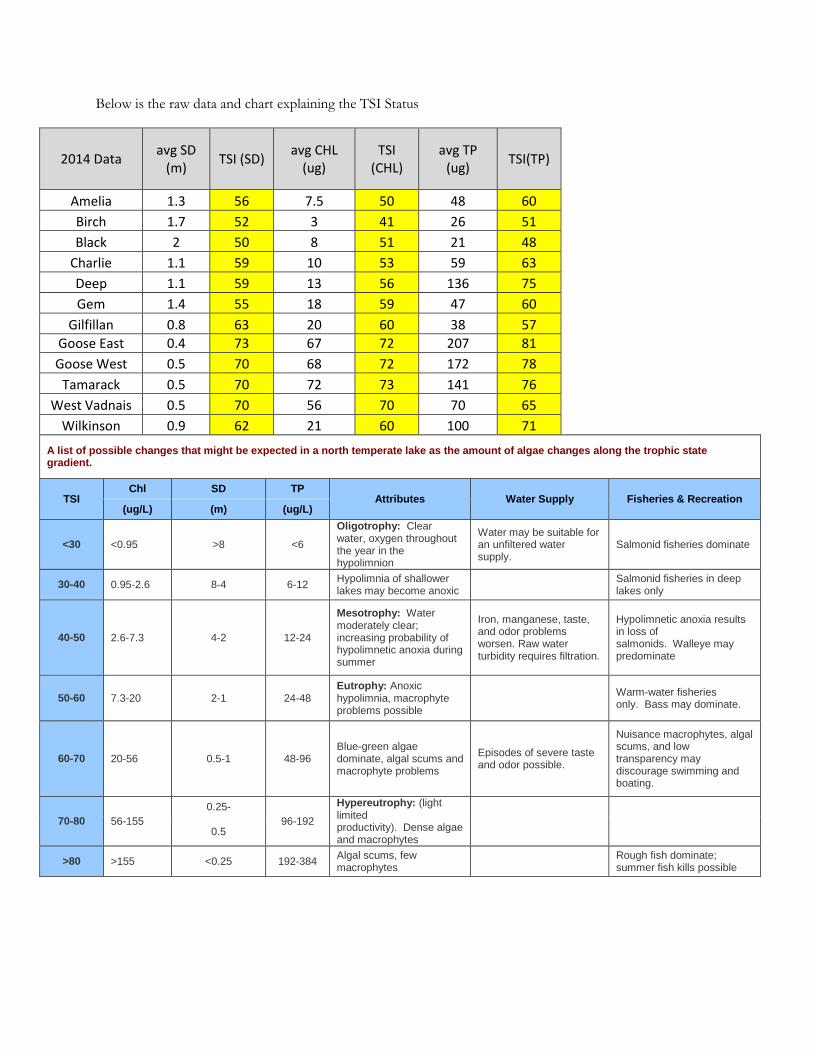
Below is the raw data and chart explaining the TSI Status
2014 Data avg SD (m) TSI (SD) avg CHL
(ug) TSI
(CHL) avg TP
(ug) TSI(TP)
Amelia 1.3 56 7.5 50 48 60 Birch 1.7 52 3 41 26 51 Black 2 50 8 51 21 48
Charlie 1.1 59 10 53 59 63 Deep 1.1 59 13 56 136 75 Gem 1.4 55 18 59 47 60
Gilfillan 0.8 63 20 60 38 57 Goose East 0.4 73 67 72 207 81 Goose West 0.5 70 68 72 172 78
Tamarack 0.5 70 72 73 141 76 West Vadnais 0.5 70 56 70 70 65
Wilkinson 0.9 62 21 60 100 71
A list of possible changes that might be expected in a north temperate lake as the amount of algae changes along the trophic state gradient.
TSI Chl SD TP
Attributes Water Supply Fisheries & Recreation (ug/L) (m) (ug/L)
<30 <0.95 >8 <6
Oligotrophy: Clear water, oxygen throughout the year in the hypolimnion
Water may be suitable for an unfiltered water supply.
Salmonid fisheries dominate
30-40 0.95-2.6 8-4 6-12 Hypolimnia of shallower lakes may become anoxic Salmonid fisheries in deep
lakes only
40-50 2.6-7.3 4-2 12-24
Mesotrophy: Water moderately clear; increasing probability of hypolimnetic anoxia during summer
Iron, manganese, taste, and odor problems worsen. Raw water turbidity requires filtration.
Hypolimnetic anoxia results in loss of salmonids. Walleye may predominate
50-60 7.3-20 2-1 24-48 Eutrophy: Anoxic hypolimnia, macrophyte problems possible
Warm-water fisheries only. Bass may dominate.
60-70 20-56 0.5-1 48-96 Blue-green algae dominate, algal scums and macrophyte problems
Episodes of severe taste and odor possible.
Nuisance macrophytes, algal scums, and low transparency may discourage swimming and boating.
70-80 56-155 0.25-
96-192
Hypereutrophy: (light limited productivity). Dense algae and macrophytes
0.5
>80 >155 <0.25 192-384 Algal scums, few macrophytes Rough fish dominate;
summer fish kills possible
VLAWMO’s water resource manager completes the required data entry each year into the MPCA EQuIS program which makes the determination of impairment and opens opportunities for grants to help remedy the impairments.
2014 Monitoring Results
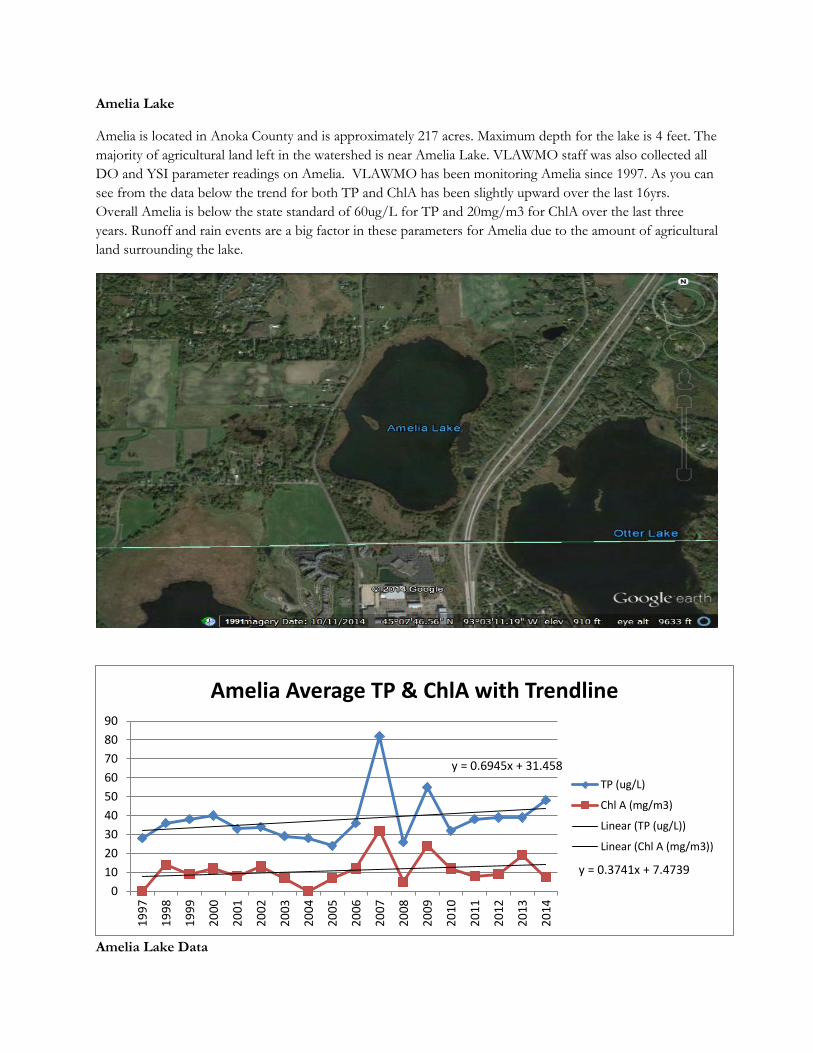
Amelia Lake
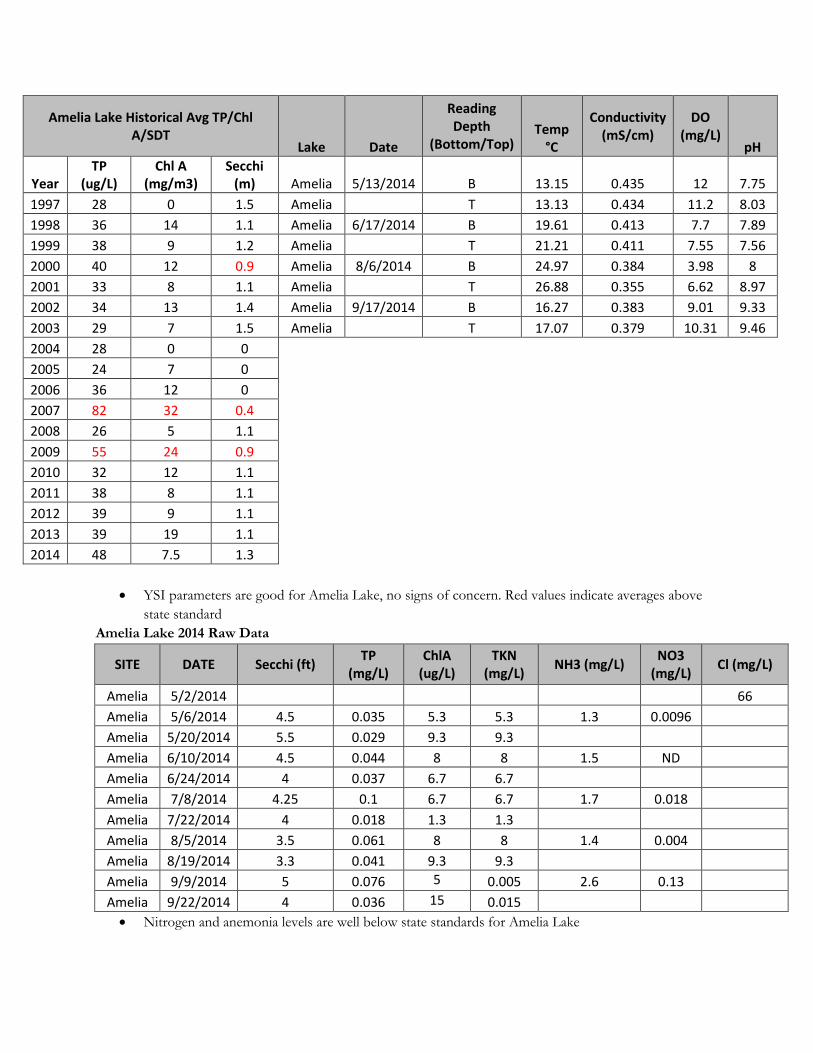
Amelia is located in Anoka County and is approximately 217 acres. Maximum depth for the lake is 4 feet. The majority of agricultural land left in the watershed is near Amelia Lake. VLAWMO staff was also collected all DO and YSI parameter readings on Amelia. VLAWMO has been monitoring Amelia since 1997. As you can see from the data below the trend for both TP and ChlA has been slightly upward over the last 16yrs. Overall Amelia is below the state standard of 60ug/L for TP and 20mg/m3 for ChlA over the last three years. Runoff and rain events are a big factor in these parameters for Amelia due to the amount of agricultural land surrounding the lake.
Amelia Lake Data
y = 0.6945x + 31.458
y = 0.3741x + 7.4739
0102030405060708090
1997
1998
1999
2000
2001
2002
2003
2004
2005
2006
2007
2008
2009
2010
2011
2012
2013
2014
Amelia Average TP & ChlA with Trendline
TP (ug/L)
Chl A (mg/m3)
Linear (TP (ug/L))
Linear (Chl A (mg/m3))
Amelia Lake Historical Avg TP/Chl A/SDT
Lake Date
Reading Depth
(Bottom/Top) Temp
°C
Conductivity (mS/cm)
DO (mg/L)
pH
Year TP
(ug/L) Chl A
(mg/m3) Secchi
(m) Amelia 5/13/2014 B 13.15 0.435 12 7.75 1997 28 0 1.5 Amelia T 13.13 0.434 11.2 8.03 1998 36 14 1.1 Amelia 6/17/2014 B 19.61 0.413 7.7 7.89 1999 38 9 1.2 Amelia T 21.21 0.411 7.55 7.56 2000 40 12 0.9 Amelia 8/6/2014 B 24.97 0.384 3.98 8 2001 33 8 1.1 Amelia T 26.88 0.355 6.62 8.97 2002 34 13 1.4 Amelia 9/17/2014 B 16.27 0.383 9.01 9.33 2003 29 7 1.5 Amelia T 17.07 0.379 10.31 9.46 2004 28 0 0
2005 24 7 0 2006 36 12 0 2007 82 32 0.4 2008 26 5 1.1 2009 55 24 0.9 2010 32 12 1.1 2011 38 8 1.1 2012 39 9 1.1 2013 39 19 1.1 2014 48 7.5 1.3
• YSI parameters are good for Amelia Lake, no signs of concern. Red values indicate averages above state standard
Amelia Lake 2014 Raw Data
SITE DATE Secchi (ft) TP (mg/L)
ChlA (ug/L)
TKN (mg/L) NH3 (mg/L) NO3
(mg/L) Cl (mg/L)
Amelia 5/2/2014 66 Amelia 5/6/2014 4.5 0.035 5.3 5.3 1.3 0.0096 Amelia 5/20/2014 5.5 0.029 9.3 9.3 Amelia 6/10/2014 4.5 0.044 8 8 1.5 ND Amelia 6/24/2014 4 0.037 6.7 6.7 Amelia 7/8/2014 4.25 0.1 6.7 6.7 1.7 0.018 Amelia 7/22/2014 4 0.018 1.3 1.3 Amelia 8/5/2014 3.5 0.061 8 8 1.4 0.004 Amelia 8/19/2014 3.3 0.041 9.3 9.3 Amelia 9/9/2014 5 0.076 5 0.005 2.6 0.13 Amelia 9/22/2014 4 0.036 15 0.015 • Nitrogen and anemonia levels are well below state standards for Amelia Lake
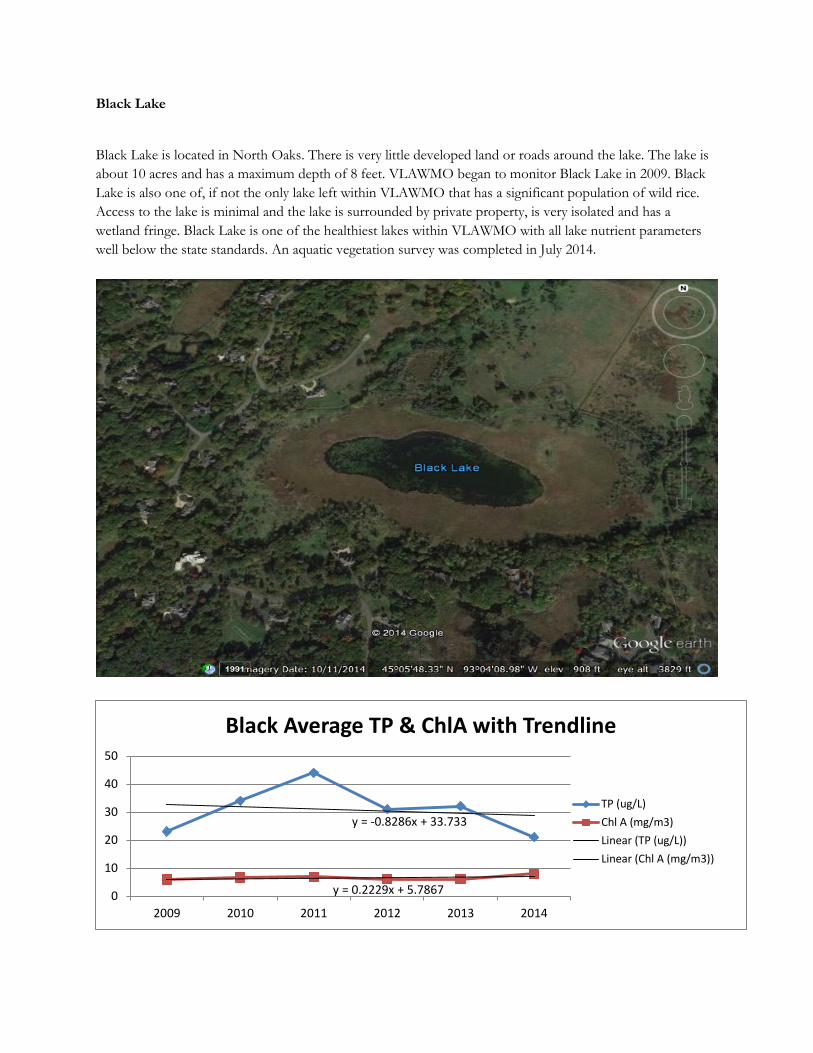
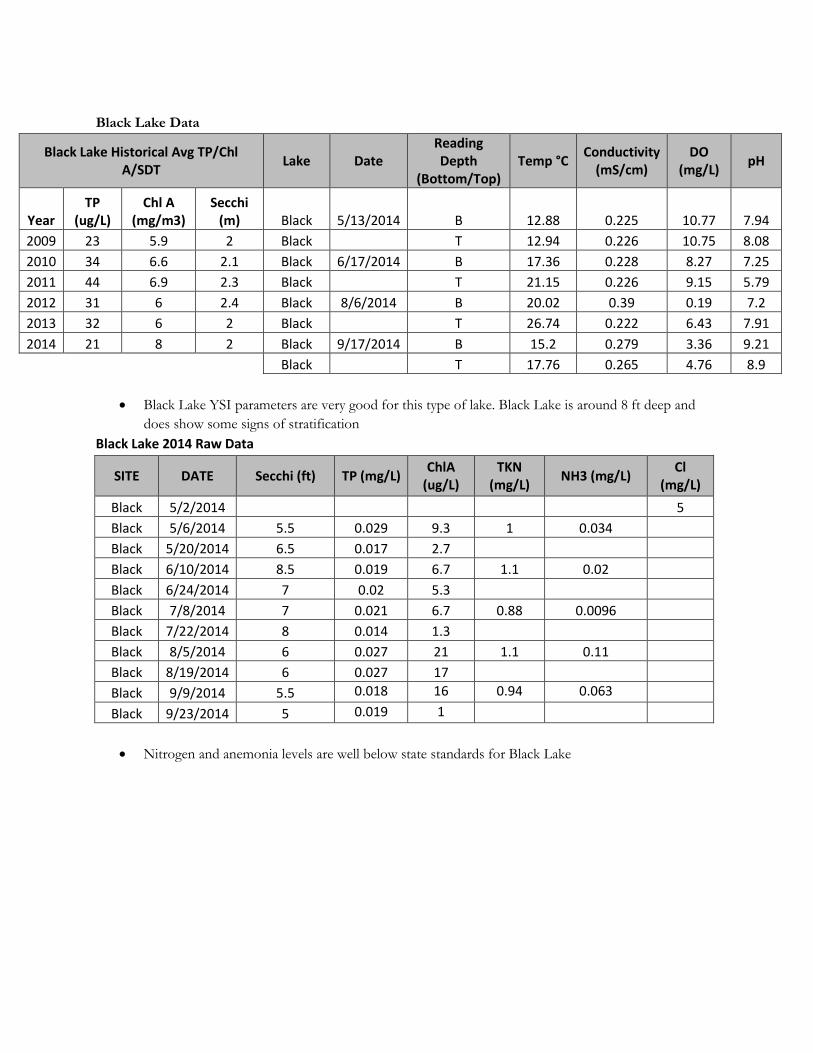
Black Lake
Black Lake is located in North Oaks. There is very little developed land or roads around the lake. The lake is about 10 acres and has a maximum depth of 8 feet. VLAWMO began to monitor Black Lake in 2009. Black Lake is also one of, if not the only lake left within VLAWMO that has a significant population of wild rice. Access to the lake is minimal and the lake is surrounded by private property, is very isolated and has a wetland fringe. Black Lake is one of the healthiest lakes within VLAWMO with all lake nutrient parameters well below the state standards. An aquatic vegetation survey was completed in July 2014.
y = -0.8286x + 33.733
y = 0.2229x + 5.7867 0
10
20
30
40
50
2009 2010 2011 2012 2013 2014
Black Average TP & ChlA with Trendline
TP (ug/L)Chl A (mg/m3)Linear (TP (ug/L))Linear (Chl A (mg/m3))
Black Lake Data
Black Lake Historical Avg TP/Chl A/SDT Lake Date
Reading Depth
(Bottom/Top) Temp °C Conductivity
(mS/cm) DO
(mg/L) pH
Year TP
(ug/L) Chl A
(mg/m3) Secchi
(m) Black 5/13/2014 B 12.88 0.225 10.77 7.94 2009 23 5.9 2 Black T 12.94 0.226 10.75 8.08 2010 34 6.6 2.1 Black 6/17/2014 B 17.36 0.228 8.27 7.25 2011 44 6.9 2.3 Black T 21.15 0.226 9.15 5.79 2012 31 6 2.4 Black 8/6/2014 B 20.02 0.39 0.19 7.2 2013 32 6 2 Black T 26.74 0.222 6.43 7.91 2014 21 8 2 Black 9/17/2014 B 15.2 0.279 3.36 9.21
Black T 17.76 0.265 4.76 8.9
• Black Lake YSI parameters are very good for this type of lake. Black Lake is around 8 ft deep and
does show some signs of stratification Black Lake 2014 Raw Data
SITE DATE Secchi (ft) TP (mg/L) ChlA (ug/L)
TKN (mg/L) NH3 (mg/L) Cl
(mg/L) Black 5/2/2014 5 Black 5/6/2014 5.5 0.029 9.3 1 0.034 Black 5/20/2014 6.5 0.017 2.7 Black 6/10/2014 8.5 0.019 6.7 1.1 0.02 Black 6/24/2014 7 0.02 5.3 Black 7/8/2014 7 0.021 6.7 0.88 0.0096 Black 7/22/2014 8 0.014 1.3 Black 8/5/2014 6 0.027 21 1.1 0.11 Black 8/19/2014 6 0.027 17 Black 9/9/2014 5.5 0.018 16 0.94 0.063 Black 9/23/2014 5 0.019 1
• Nitrogen and anemonia levels are well below state standards for Black Lake
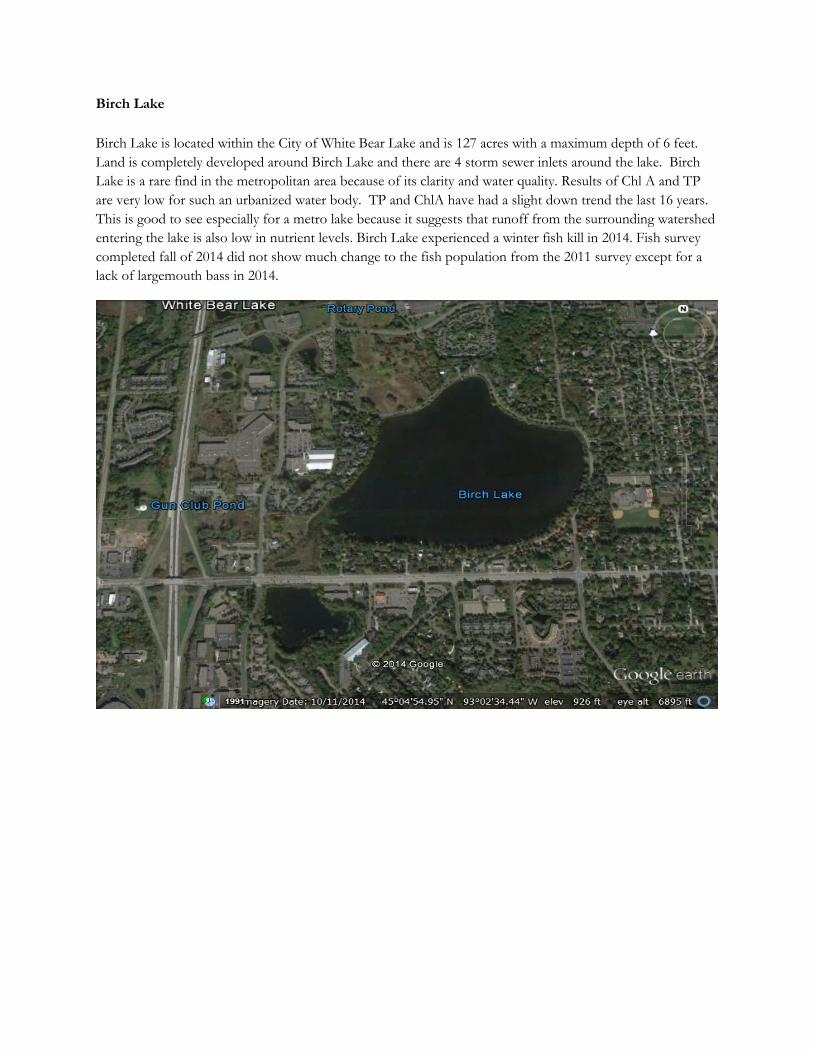
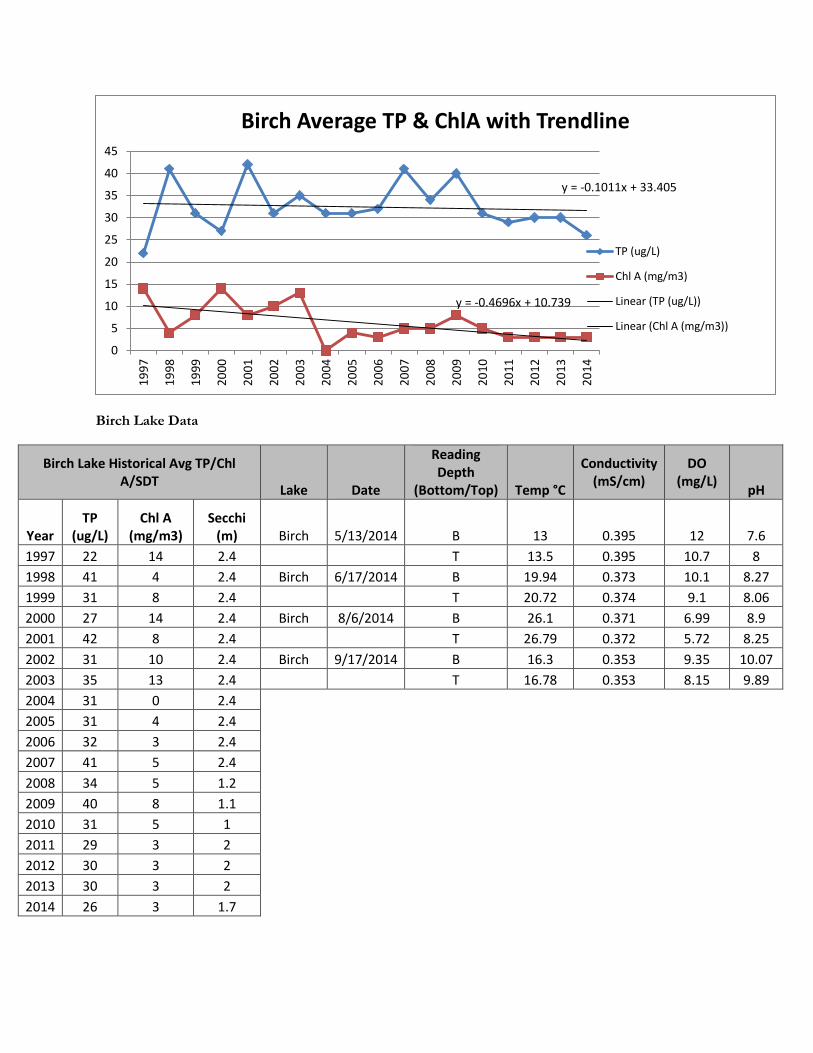
Birch Lake Birch Lake is located within the City of White Bear Lake and is 127 acres with a maximum depth of 6 feet. Land is completely developed around Birch Lake and there are 4 storm sewer inlets around the lake. Birch Lake is a rare find in the metropolitan area because of its clarity and water quality. Results of Chl A and TP are very low for such an urbanized water body. TP and ChlA have had a slight down trend the last 16 years. This is good to see especially for a metro lake because it suggests that runoff from the surrounding watershed entering the lake is also low in nutrient levels. Birch Lake experienced a winter fish kill in 2014. Fish survey completed fall of 2014 did not show much change to the fish population from the 2011 survey except for a lack of largemouth bass in 2014.
Birch Lake Data
Birch Lake Historical Avg TP/Chl A/SDT Lake Date
Reading Depth
(Bottom/Top) Temp °C
Conductivity (mS/cm)
DO (mg/L) pH
Year TP
(ug/L) Chl A
(mg/m3) Secchi
(m) Birch 5/13/2014 B 13 0.395 12 7.6 1997 22 14 2.4 T 13.5 0.395 10.7 8 1998 41 4 2.4 Birch 6/17/2014 B 19.94 0.373 10.1 8.27 1999 31 8 2.4 T 20.72 0.374 9.1 8.06 2000 27 14 2.4 Birch 8/6/2014 B 26.1 0.371 6.99 8.9 2001 42 8 2.4 T 26.79 0.372 5.72 8.25 2002 31 10 2.4 Birch 9/17/2014 B 16.3 0.353 9.35 10.07 2003 35 13 2.4 T 16.78 0.353 8.15 9.89 2004 31 0 2.4
2005 31 4 2.4 2006 32 3 2.4 2007 41 5 2.4 2008 34 5 1.2 2009 40 8 1.1 2010 31 5 1 2011 29 3 2 2012 30 3 2 2013 30 3 2 2014 26 3 1.7
y = -0.1011x + 33.405
y = -0.4696x + 10.739
0
5
10
15
20
25
30
35
40
4519
97
1998
1999
2000
2001
2002
2003
2004
2005
2006
2007
2008
2009
2010
2011
2012
2013
2014
Birch Average TP & ChlA with Trendline
TP (ug/L)
Chl A (mg/m3)
Linear (TP (ug/L))
Linear (Chl A (mg/m3))
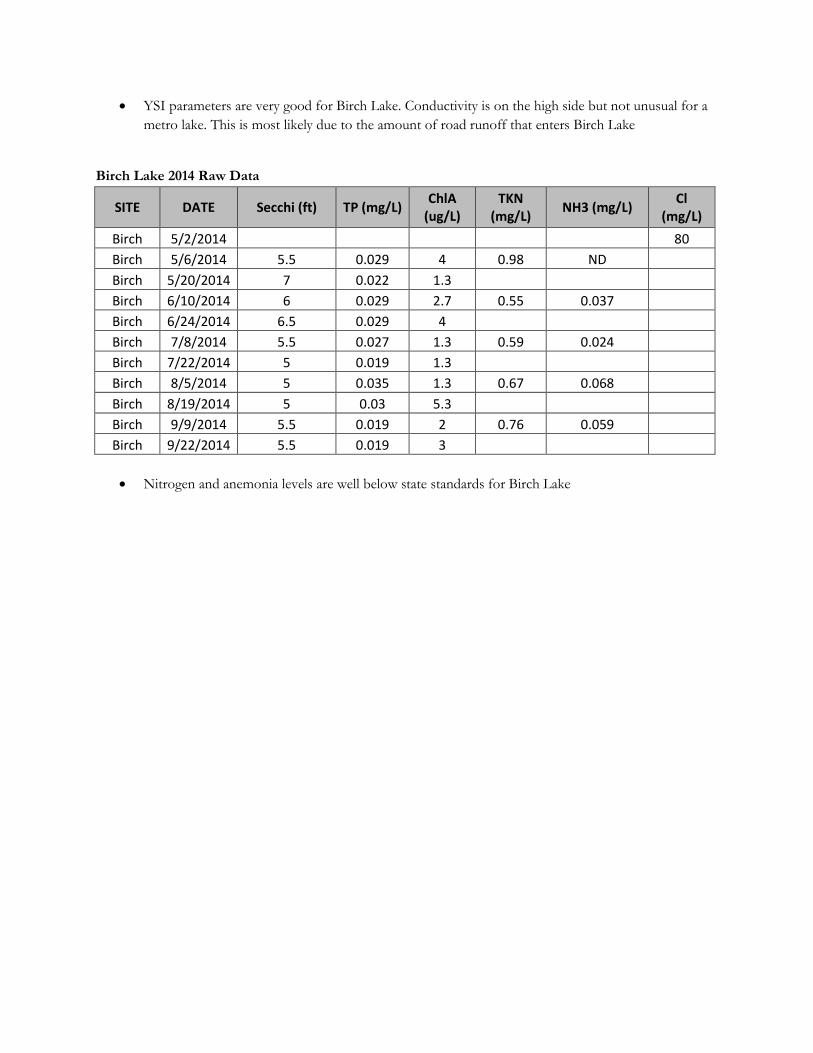
• YSI parameters are very good for Birch Lake. Conductivity is on the high side but not unusual for a metro lake. This is most likely due to the amount of road runoff that enters Birch Lake
Birch Lake 2014 Raw Data
SITE DATE Secchi (ft) TP (mg/L) ChlA (ug/L)
TKN (mg/L) NH3 (mg/L) Cl
(mg/L) Birch 5/2/2014 80 Birch 5/6/2014 5.5 0.029 4 0.98 ND Birch 5/20/2014 7 0.022 1.3 Birch 6/10/2014 6 0.029 2.7 0.55 0.037 Birch 6/24/2014 6.5 0.029 4 Birch 7/8/2014 5.5 0.027 1.3 0.59 0.024 Birch 7/22/2014 5 0.019 1.3 Birch 8/5/2014 5 0.035 1.3 0.67 0.068 Birch 8/19/2014 5 0.03 5.3 Birch 9/9/2014 5.5 0.019 2 0.76 0.059 Birch 9/22/2014 5.5 0.019 3
• Nitrogen and anemonia levels are well below state standards for Birch Lake
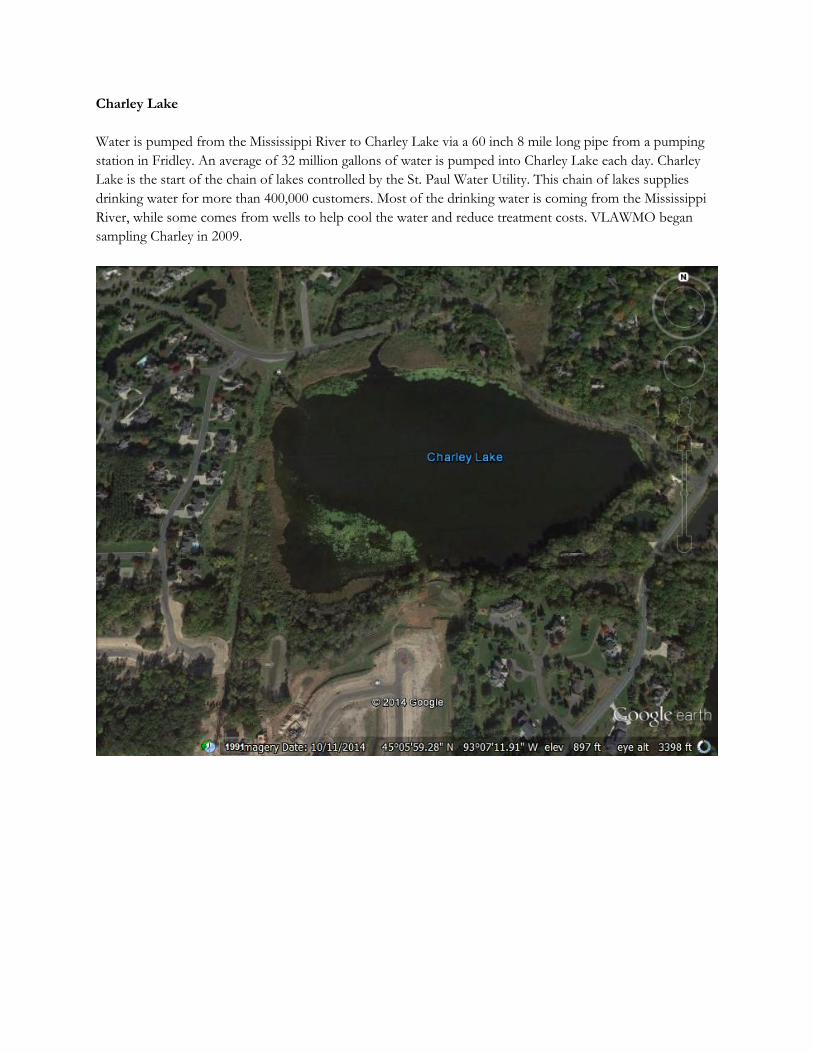
Charley Lake Water is pumped from the Mississippi River to Charley Lake via a 60 inch 8 mile long pipe from a pumping station in Fridley. An average of 32 million gallons of water is pumped into Charley Lake each day. Charley Lake is the start of the chain of lakes controlled by the St. Paul Water Utility. This chain of lakes supplies drinking water for more than 400,000 customers. Most of the drinking water is coming from the Mississippi River, while some comes from wells to help cool the water and reduce treatment costs. VLAWMO began sampling Charley in 2009.
Charley Lake Data
Charley Lake Historical Avg TP/Chl A/SDT Lake Date
Reading Depth
(Bottom/Top) Temp °C Conductivity
(mS/cm) DO
(mg/L) pH
Year TP
(ug/L) Chl A
(mg/m3) Secchi
(m) Charley 5/13/2014 B 12.75 0.33 11.25 7.3 2009 39 18 1 T 12.55 0.327 10.95 7.9 2010 90 18.9 1 Charley 6/17/2014 B 16.49 0.417 5.01 8.07 2011 87 9.3 1.1 T 22.51 0.407 9.36 7.06 2012 74 13 1 Charley 8/6/2014 B 24.19 0.37 5.09 8.21 2013 57 11 1 T 26.15 0.369 6.09 8.41 2014 59 10 1.1 Charley 9/17/2014 B 15.23 0.281 7.41 10.18
T 17.16 0.284 7.37 10.07
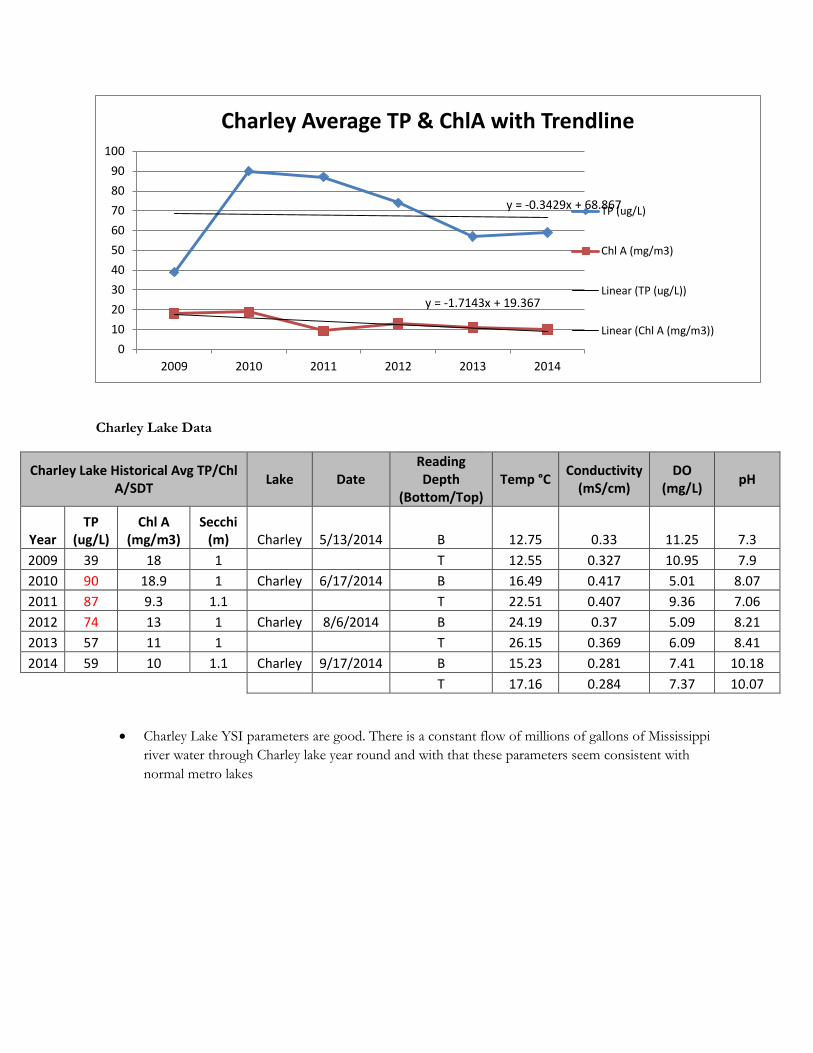
• Charley Lake YSI parameters are good. There is a constant flow of millions of gallons of Mississippi river water through Charley lake year round and with that these parameters seem consistent with normal metro lakes
y = -0.3429x + 68.867
y = -1.7143x + 19.367
0102030405060708090
100
2009 2010 2011 2012 2013 2014
Charley Average TP & ChlA with Trendline
TP (ug/L)
Chl A (mg/m3)
Linear (TP (ug/L))
Linear (Chl A (mg/m3))
Charley Lake 2014 Raw Data
SITE DATE Secchi (ft) TP (mg/L)
ChlA (ug/L)
TKN (mg/L) NH3 (mg/L) Cl
(mg/L) Charley 5/2/2014 25 Charley 5/20/2014 3.5 0.047 6.7 Charley 6/10/2014 3 0.063 27 1.000 0.0054 Charley 6/24/2014 3.5 0.065 12 Charley 7/8/2014 3 0.1 17 0.93 0.023 Charley 7/22/2014 3 0.056 1.3 Charley 8/5/2014 4.5 0.044 8 0.78 0.17 Charley 8/19/2014 4 0.038 5.3 Charley 9/9/2014 4 0.062 7 0.93 0.11 Charley 9/23/2014 5 0.052 5
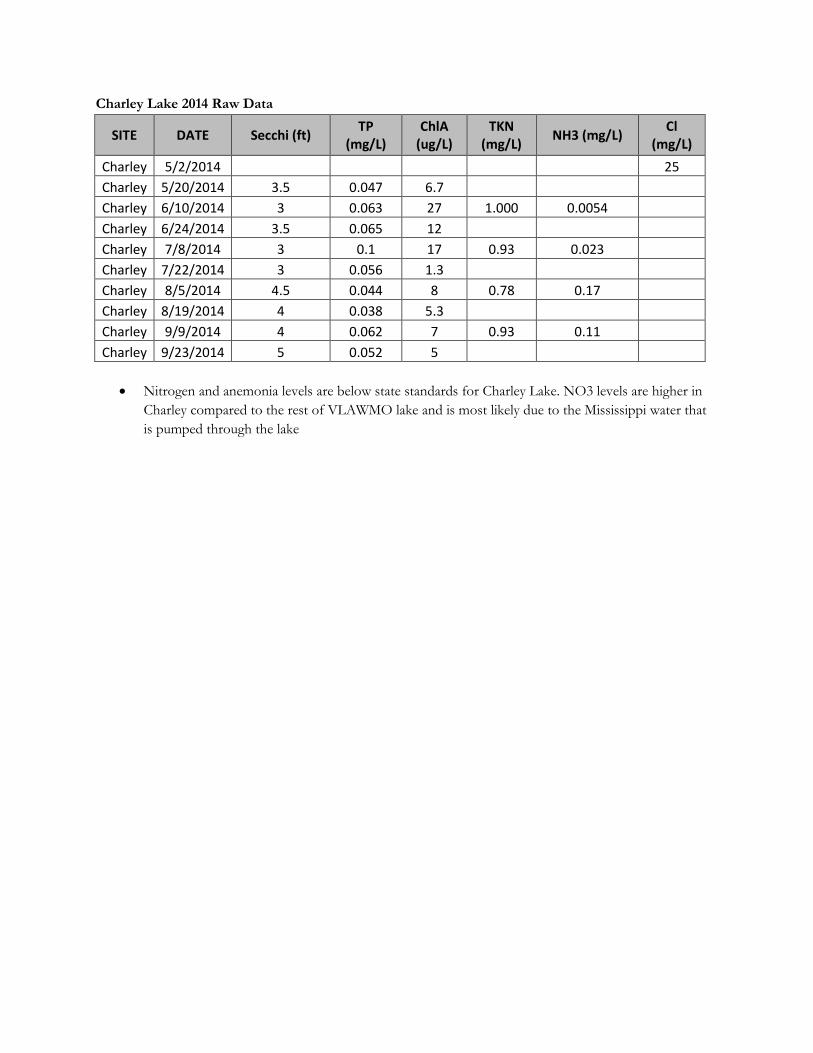
• Nitrogen and anemonia levels are below state standards for Charley Lake. NO3 levels are higher in
Charley compared to the rest of VLAWMO lake and is most likely due to the Mississippi water that is pumped through the lake
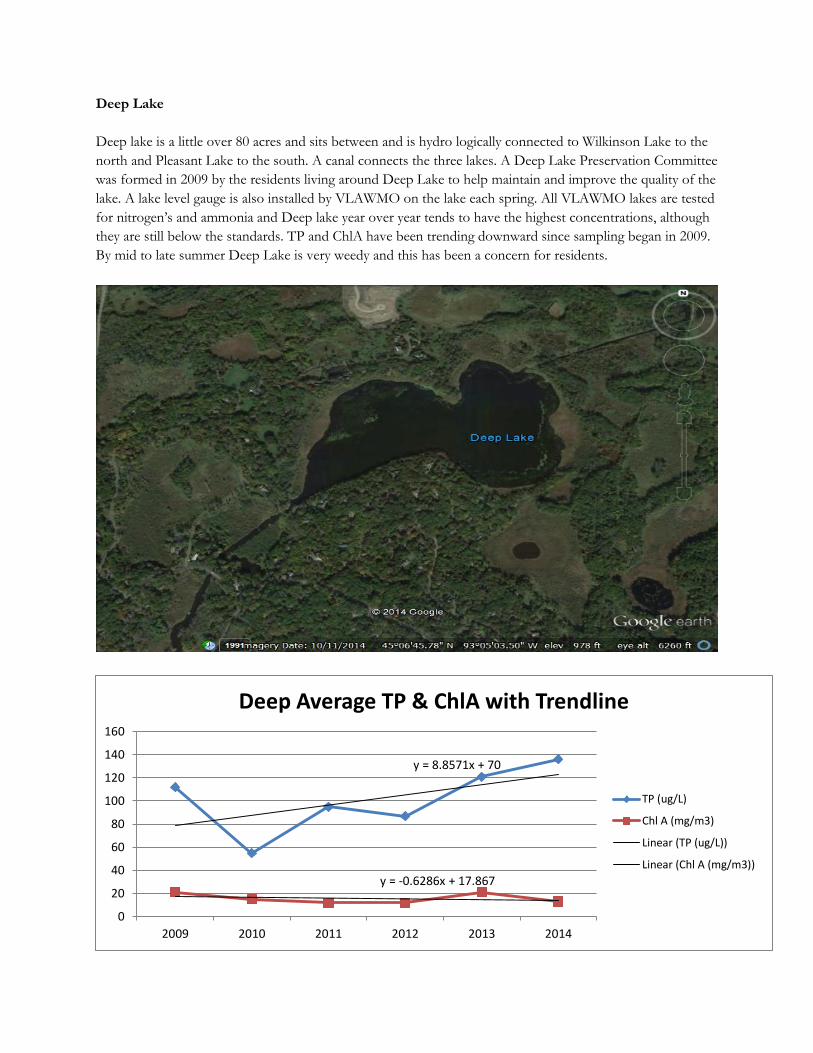
Deep Lake Deep lake is a little over 80 acres and sits between and is hydro logically connected to Wilkinson Lake to the north and Pleasant Lake to the south. A canal connects the three lakes. A Deep Lake Preservation Committee was formed in 2009 by the residents living around Deep Lake to help maintain and improve the quality of the lake. A lake level gauge is also installed by VLAWMO on the lake each spring. All VLAWMO lakes are tested for nitrogen’s and ammonia and Deep lake year over year tends to have the highest concentrations, although they are still below the standards. TP and ChlA have been trending downward since sampling began in 2009. By mid to late summer Deep Lake is very weedy and this has been a concern for residents.
y = 8.8571x + 70
y = -0.6286x + 17.867
0
20
40
60
80
100
120
140
160
2009 2010 2011 2012 2013 2014
Deep Average TP & ChlA with Trendline
TP (ug/L)
Chl A (mg/m3)
Linear (TP (ug/L))
Linear (Chl A (mg/m3))
Deep Lake Data
Deep Lake Historical Avg TP/Chl A/SDT Lake Date
Reading Depth
(Bottom/Top) Temp °C Conductivity
(mS/cm) DO
(mg/L) pH
Year TP
(ug/L) Chl A
(mg/m3) Secchi
(m) Deep 5/13/2014 B 13.14 0.427 8.8 7.5 2009 112 21 1 Deep T 13.17 0.42 8.8 7.89 2010 55 15 0.9 Deep 6/17/2014 B 20.39 0.434 6.5 7.7 2011 95 12 1.2 Deep T 23 0.436 9.51 7.02 2012 87 12 1 Deep 8/6/2014 B 22.56 0.42 0.43 7.78 2013 121 21 1 Deep T 25.6 0.42 4.41 8.21 2014 136 13 1.1 Deep 9/17/2014 B 14.99 0.407 4.24 8.4
Deep T 18.99 0.407 5.42 8.46
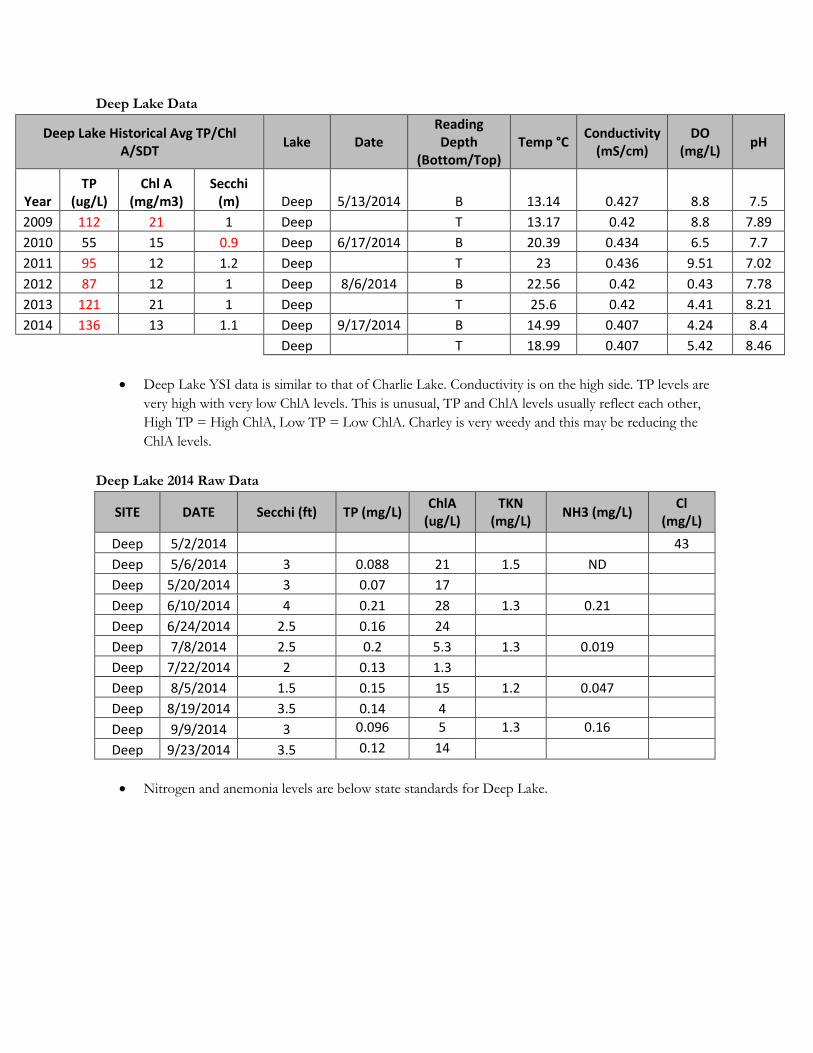
• Deep Lake YSI data is similar to that of Charlie Lake. Conductivity is on the high side. TP levels are
very high with very low ChlA levels. This is unusual, TP and ChlA levels usually reflect each other, High TP = High ChlA, Low TP = Low ChlA. Charley is very weedy and this may be reducing the ChlA levels.
Deep Lake 2014 Raw Data
SITE DATE Secchi (ft) TP (mg/L) ChlA (ug/L)
TKN (mg/L) NH3 (mg/L) Cl
(mg/L) Deep 5/2/2014 43 Deep 5/6/2014 3 0.088 21 1.5 ND Deep 5/20/2014 3 0.07 17 Deep 6/10/2014 4 0.21 28 1.3 0.21 Deep 6/24/2014 2.5 0.16 24 Deep 7/8/2014 2.5 0.2 5.3 1.3 0.019 Deep 7/22/2014 2 0.13 1.3 Deep 8/5/2014 1.5 0.15 15 1.2 0.047 Deep 8/19/2014 3.5 0.14 4 Deep 9/9/2014 3 0.096 5 1.3 0.16 Deep 9/23/2014 3.5 0.12 14
• Nitrogen and anemonia levels are below state standards for Deep Lake.
Gem Lake
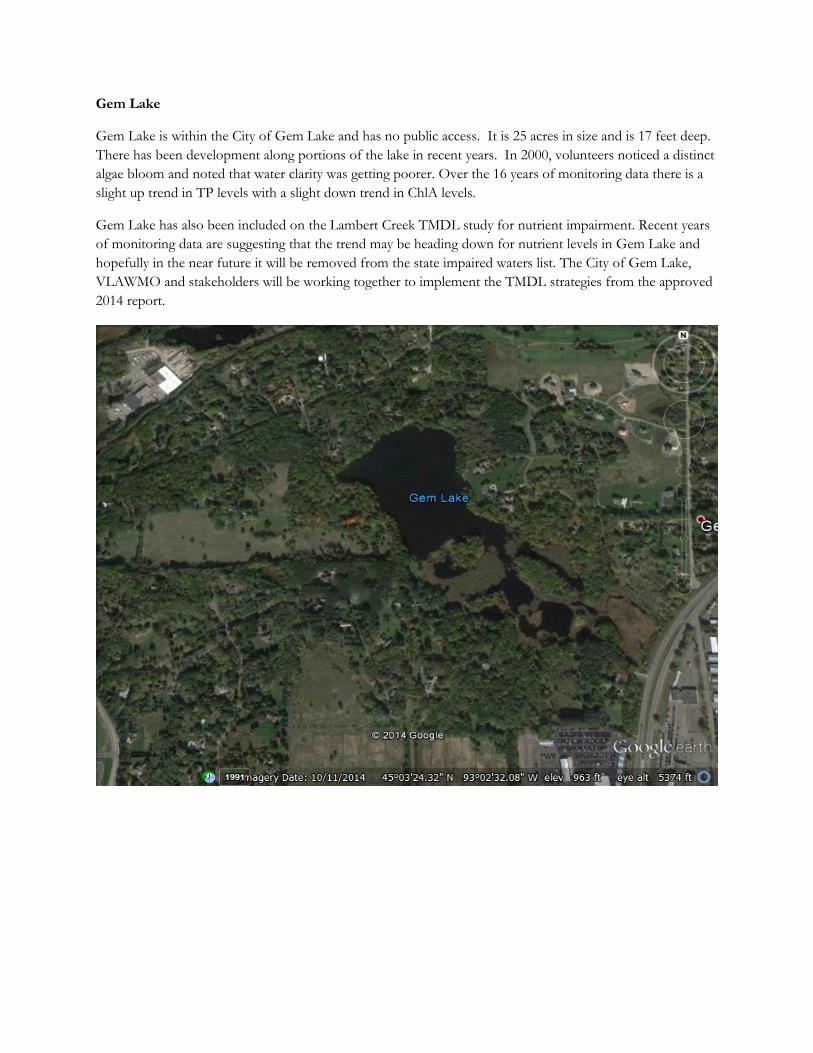
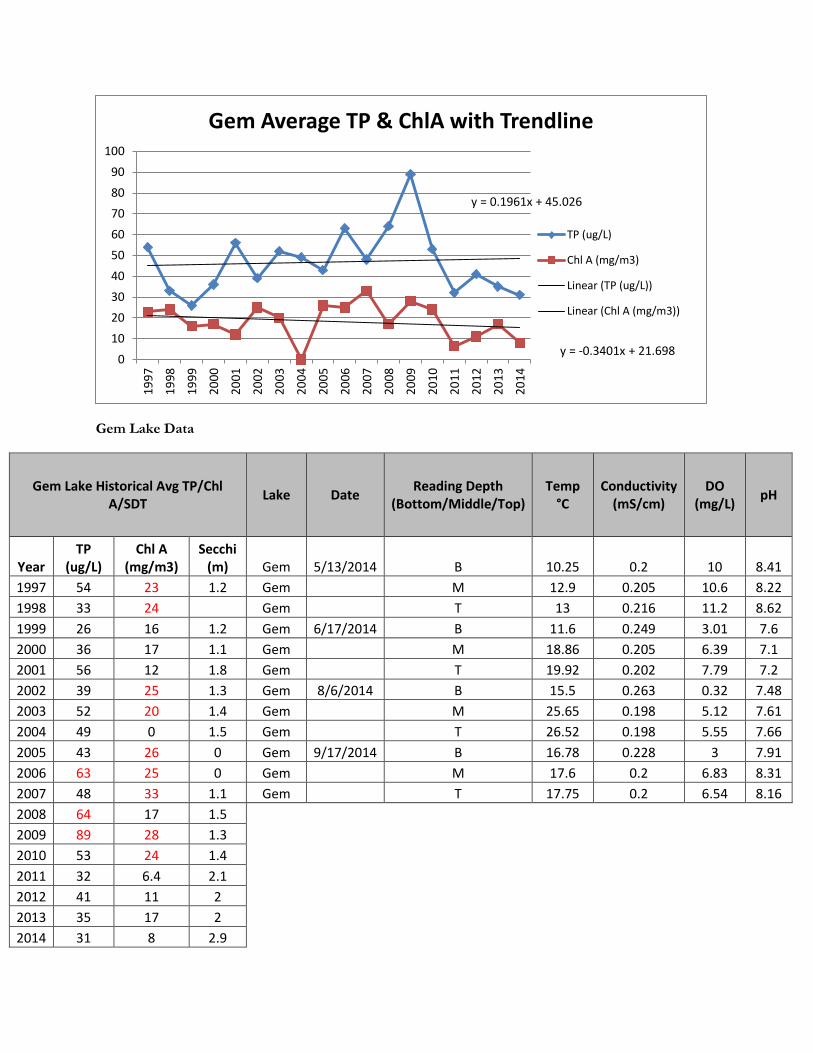
Gem Lake is within the City of Gem Lake and has no public access. It is 25 acres in size and is 17 feet deep. There has been development along portions of the lake in recent years. In 2000, volunteers noticed a distinct algae bloom and noted that water clarity was getting poorer. Over the 16 years of monitoring data there is a slight up trend in TP levels with a slight down trend in ChlA levels.
Gem Lake has also been included on the Lambert Creek TMDL study for nutrient impairment. Recent years of monitoring data are suggesting that the trend may be heading down for nutrient levels in Gem Lake and hopefully in the near future it will be removed from the state impaired waters list. The City of Gem Lake, VLAWMO and stakeholders will be working together to implement the TMDL strategies from the approved 2014 report.
Gem Lake Data
Gem Lake Historical Avg TP/Chl A/SDT Lake Date Reading Depth
(Bottom/Middle/Top) Temp
°C Conductivity
(mS/cm) DO
(mg/L) pH
Year TP
(ug/L) Chl A
(mg/m3) Secchi
(m) Gem 5/13/2014 B 10.25 0.2 10 8.41 1997 54 23 1.2 Gem M 12.9 0.205 10.6 8.22 1998 33 24 Gem T 13 0.216 11.2 8.62 1999 26 16 1.2 Gem 6/17/2014 B 11.6 0.249 3.01 7.6 2000 36 17 1.1 Gem M 18.86 0.205 6.39 7.1 2001 56 12 1.8 Gem T 19.92 0.202 7.79 7.2 2002 39 25 1.3 Gem 8/6/2014 B 15.5 0.263 0.32 7.48 2003 52 20 1.4 Gem M 25.65 0.198 5.12 7.61 2004 49 0 1.5 Gem T 26.52 0.198 5.55 7.66 2005 43 26 0 Gem 9/17/2014 B 16.78 0.228 3 7.91 2006 63 25 0 Gem M 17.6 0.2 6.83 8.31 2007 48 33 1.1 Gem T 17.75 0.2 6.54 8.16 2008 64 17 1.5
2009 89 28 1.3 2010 53 24 1.4 2011 32 6.4 2.1 2012 41 11 2 2013 35 17 2 2014 31 8 2.9
y = 0.1961x + 45.026
y = -0.3401x + 21.698 0
102030405060708090
10019
97
1998
1999
2000
2001
2002
2003
2004
2005
2006
2007
2008
2009
2010
2011
2012
2013
2014
Gem Average TP & ChlA with Trendline
TP (ug/L)
Chl A (mg/m3)
Linear (TP (ug/L))
Linear (Chl A (mg/m3))
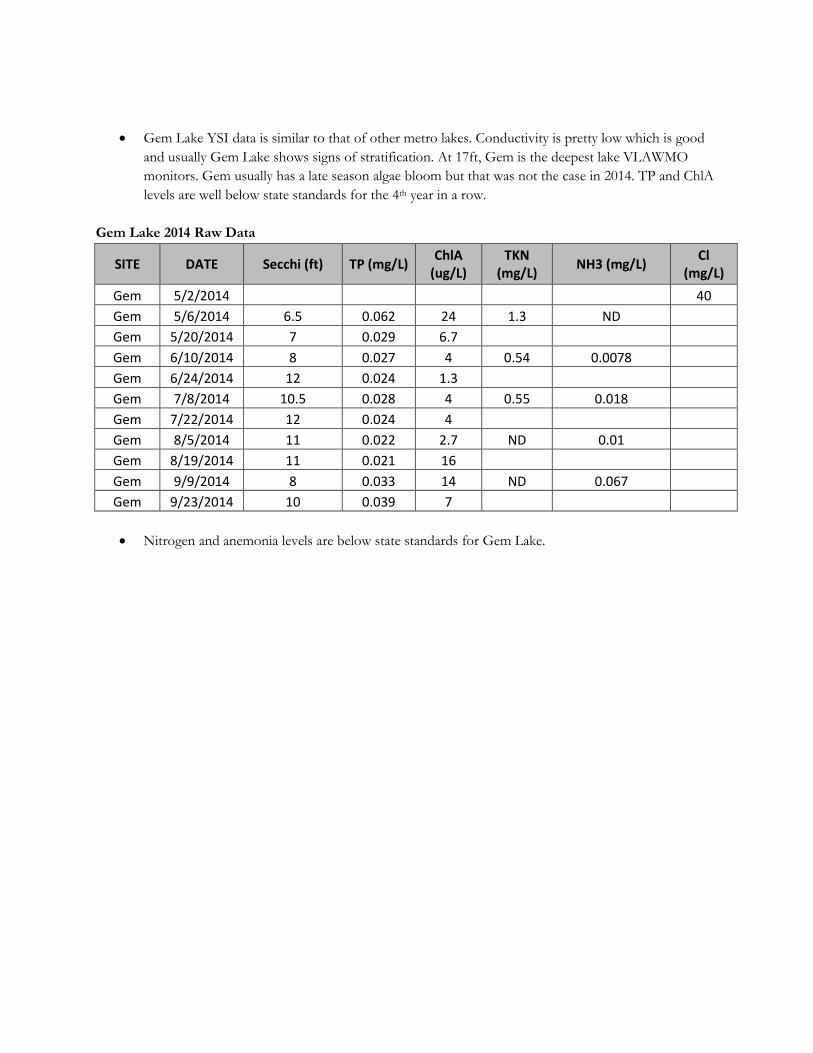
• Gem Lake YSI data is similar to that of other metro lakes. Conductivity is pretty low which is good and usually Gem Lake shows signs of stratification. At 17ft, Gem is the deepest lake VLAWMO monitors. Gem usually has a late season algae bloom but that was not the case in 2014. TP and ChlA levels are well below state standards for the 4th year in a row.
Gem Lake 2014 Raw Data
SITE DATE Secchi (ft) TP (mg/L) ChlA (ug/L)
TKN (mg/L) NH3 (mg/L) Cl
(mg/L) Gem 5/2/2014 40 Gem 5/6/2014 6.5 0.062 24 1.3 ND Gem 5/20/2014 7 0.029 6.7 Gem 6/10/2014 8 0.027 4 0.54 0.0078 Gem 6/24/2014 12 0.024 1.3 Gem 7/8/2014 10.5 0.028 4 0.55 0.018 Gem 7/22/2014 12 0.024 4 Gem 8/5/2014 11 0.022 2.7 ND 0.01 Gem 8/19/2014 11 0.021 16 Gem 9/9/2014 8 0.033 14 ND 0.067 Gem 9/23/2014 10 0.039 7
• Nitrogen and anemonia levels are below state standards for Gem Lake.
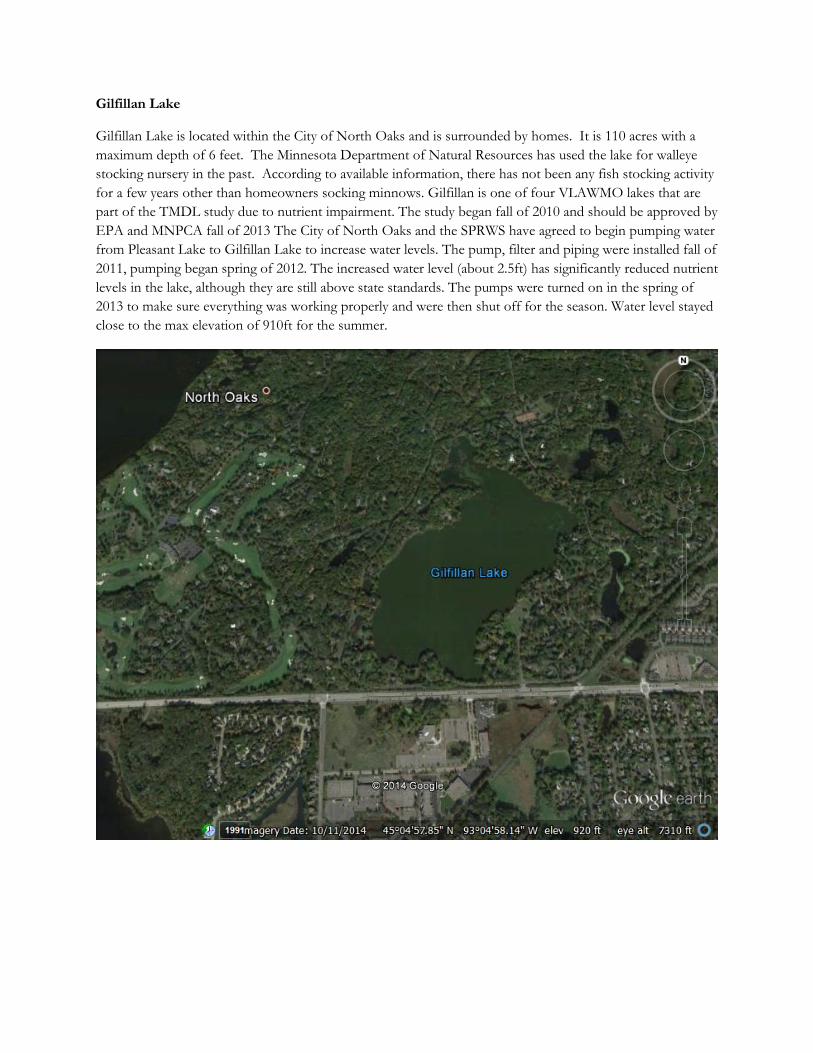
Gilfillan Lake
Gilfillan Lake is located within the City of North Oaks and is surrounded by homes. It is 110 acres with a maximum depth of 6 feet. The Minnesota Department of Natural Resources has used the lake for walleye stocking nursery in the past. According to available information, there has not been any fish stocking activity for a few years other than homeowners socking minnows. Gilfillan is one of four VLAWMO lakes that are part of the TMDL study due to nutrient impairment. The study began fall of 2010 and should be approved by EPA and MNPCA fall of 2013 The City of North Oaks and the SPRWS have agreed to begin pumping water from Pleasant Lake to Gilfillan Lake to increase water levels. The pump, filter and piping were installed fall of 2011, pumping began spring of 2012. The increased water level (about 2.5ft) has significantly reduced nutrient levels in the lake, although they are still above state standards. The pumps were turned on in the spring of 2013 to make sure everything was working properly and were then shut off for the season. Water level stayed close to the max elevation of 910ft for the summer.
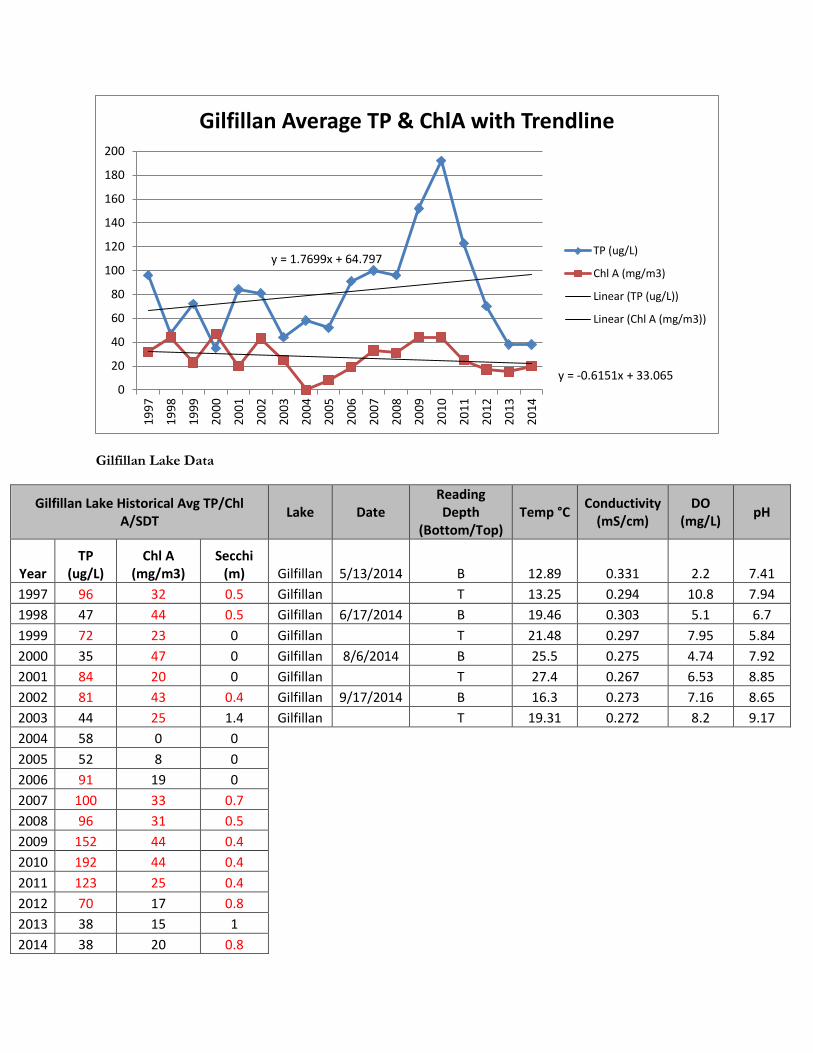
Gilfillan Lake Data
Gilfillan Lake Historical Avg TP/Chl A/SDT Lake Date
Reading Depth
(Bottom/Top) Temp °C Conductivity
(mS/cm) DO
(mg/L) pH
Year TP
(ug/L) Chl A
(mg/m3) Secchi
(m) Gilfillan 5/13/2014 B 12.89 0.331 2.2 7.41 1997 96 32 0.5 Gilfillan T 13.25 0.294 10.8 7.94 1998 47 44 0.5 Gilfillan 6/17/2014 B 19.46 0.303 5.1 6.7 1999 72 23 0 Gilfillan T 21.48 0.297 7.95 5.84 2000 35 47 0 Gilfillan 8/6/2014 B 25.5 0.275 4.74 7.92 2001 84 20 0 Gilfillan T 27.4 0.267 6.53 8.85 2002 81 43 0.4 Gilfillan 9/17/2014 B 16.3 0.273 7.16 8.65 2003 44 25 1.4 Gilfillan T 19.31 0.272 8.2 9.17 2004 58 0 0
2005 52 8 0 2006 91 19 0 2007 100 33 0.7 2008 96 31 0.5 2009 152 44 0.4 2010 192 44 0.4 2011 123 25 0.4 2012 70 17 0.8 2013 38 15 1 2014 38 20 0.8
y = 1.7699x + 64.797
y = -0.6151x + 33.065 0
20
40
60
80
100
120
140
160
180
20019
97
1998
1999
2000
2001
2002
2003
2004
2005
2006
2007
2008
2009
2010
2011
2012
2013
2014
Gilfillan Average TP & ChlA with Trendline
TP (ug/L)
Chl A (mg/m3)
Linear (TP (ug/L))
Linear (Chl A (mg/m3))
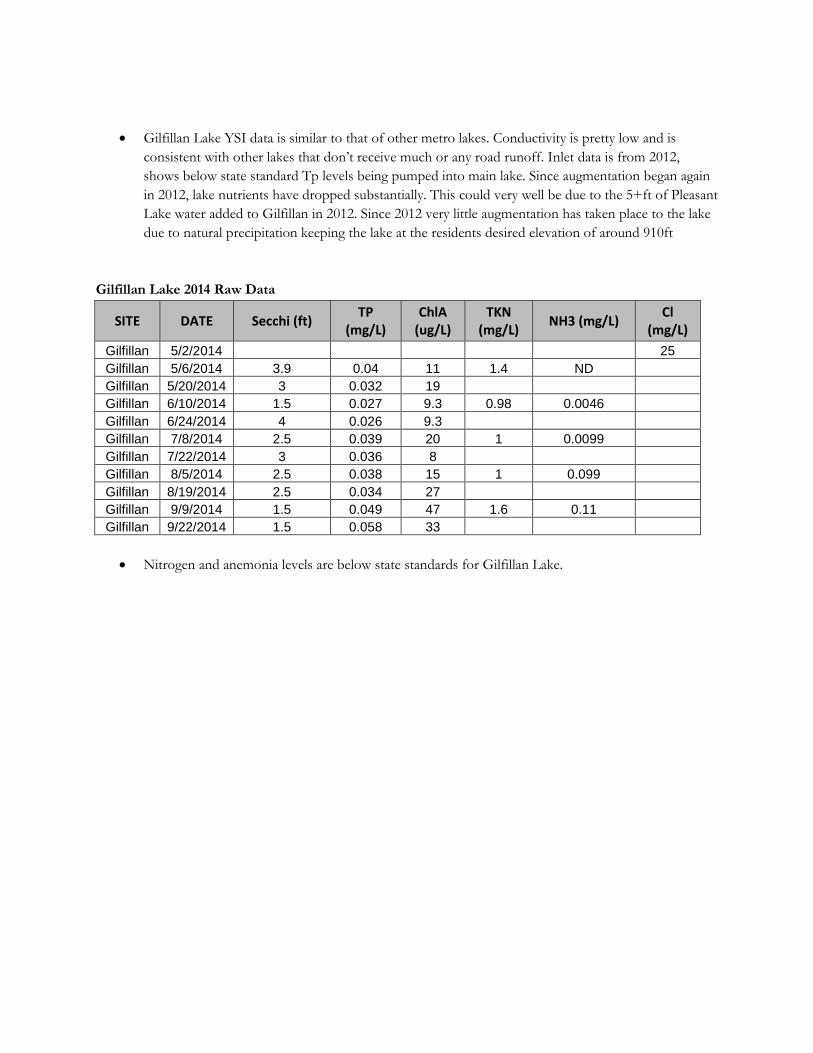
• Gilfillan Lake YSI data is similar to that of other metro lakes. Conductivity is pretty low and is consistent with other lakes that don’t receive much or any road runoff. Inlet data is from 2012, shows below state standard Tp levels being pumped into main lake. Since augmentation began again in 2012, lake nutrients have dropped substantially. This could very well be due to the 5+ft of Pleasant Lake water added to Gilfillan in 2012. Since 2012 very little augmentation has taken place to the lake due to natural precipitation keeping the lake at the residents desired elevation of around 910ft
Gilfillan Lake 2014 Raw Data
SITE DATE Secchi (ft) TP (mg/L)
ChlA (ug/L)
TKN (mg/L) NH3 (mg/L) Cl
(mg/L) Gilfillan 5/2/2014 25 Gilfillan 5/6/2014 3.9 0.04 11 1.4 ND Gilfillan 5/20/2014 3 0.032 19 Gilfillan 6/10/2014 1.5 0.027 9.3 0.98 0.0046 Gilfillan 6/24/2014 4 0.026 9.3 Gilfillan 7/8/2014 2.5 0.039 20 1 0.0099 Gilfillan 7/22/2014 3 0.036 8 Gilfillan 8/5/2014 2.5 0.038 15 1 0.099 Gilfillan 8/19/2014 2.5 0.034 27 Gilfillan 9/9/2014 1.5 0.049 47 1.6 0.11 Gilfillan 9/22/2014 1.5 0.058 33
• Nitrogen and anemonia levels are below state standards for Gilfillan Lake.
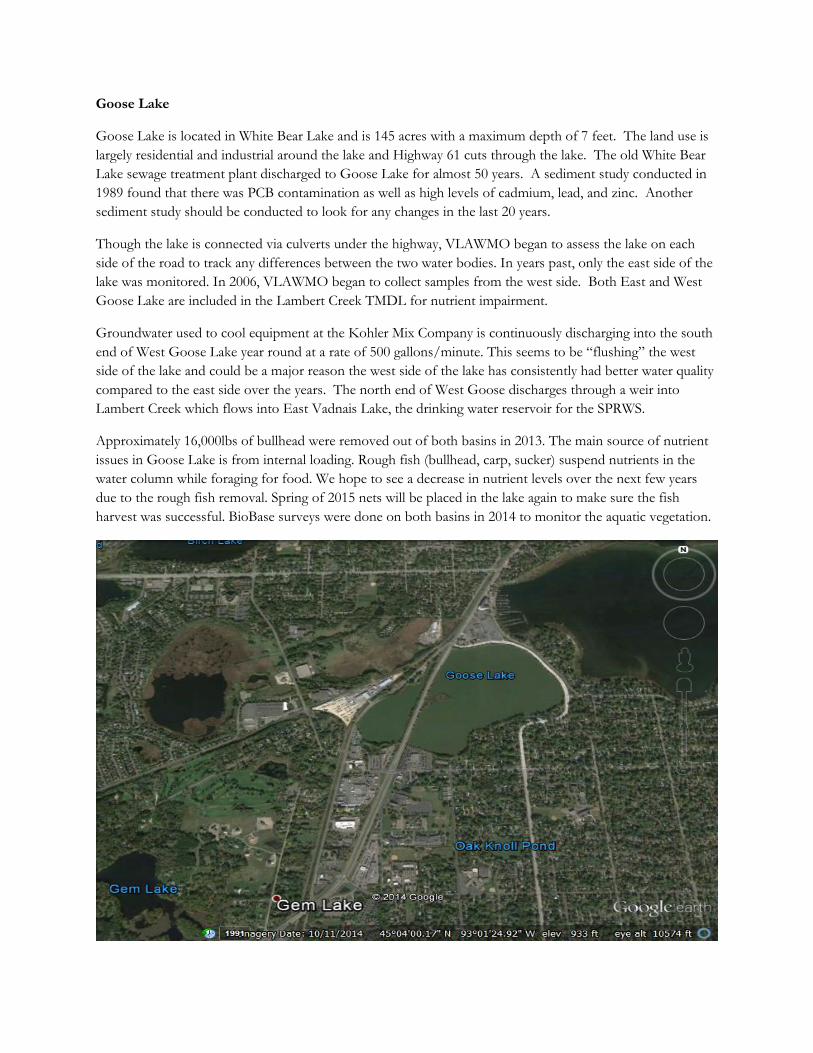
Goose Lake
Goose Lake is located in White Bear Lake and is 145 acres with a maximum depth of 7 feet. The land use is largely residential and industrial around the lake and Highway 61 cuts through the lake. The old White Bear Lake sewage treatment plant discharged to Goose Lake for almost 50 years. A sediment study conducted in 1989 found that there was PCB contamination as well as high levels of cadmium, lead, and zinc. Another sediment study should be conducted to look for any changes in the last 20 years.
Though the lake is connected via culverts under the highway, VLAWMO began to assess the lake on each side of the road to track any differences between the two water bodies. In years past, only the east side of the lake was monitored. In 2006, VLAWMO began to collect samples from the west side. Both East and West Goose Lake are included in the Lambert Creek TMDL for nutrient impairment.
Groundwater used to cool equipment at the Kohler Mix Company is continuously discharging into the south end of West Goose Lake year round at a rate of 500 gallons/minute. This seems to be “flushing” the west side of the lake and could be a major reason the west side of the lake has consistently had better water quality compared to the east side over the years. The north end of West Goose discharges through a weir into Lambert Creek which flows into East Vadnais Lake, the drinking water reservoir for the SPRWS.
Approximately 16,000lbs of bullhead were removed out of both basins in 2013. The main source of nutrient issues in Goose Lake is from internal loading. Rough fish (bullhead, carp, sucker) suspend nutrients in the water column while foraging for food. We hope to see a decrease in nutrient levels over the next few years due to the rough fish removal. Spring of 2015 nets will be placed in the lake again to make sure the fish harvest was successful. BioBase surveys were done on both basins in 2014 to monitor the aquatic vegetation.
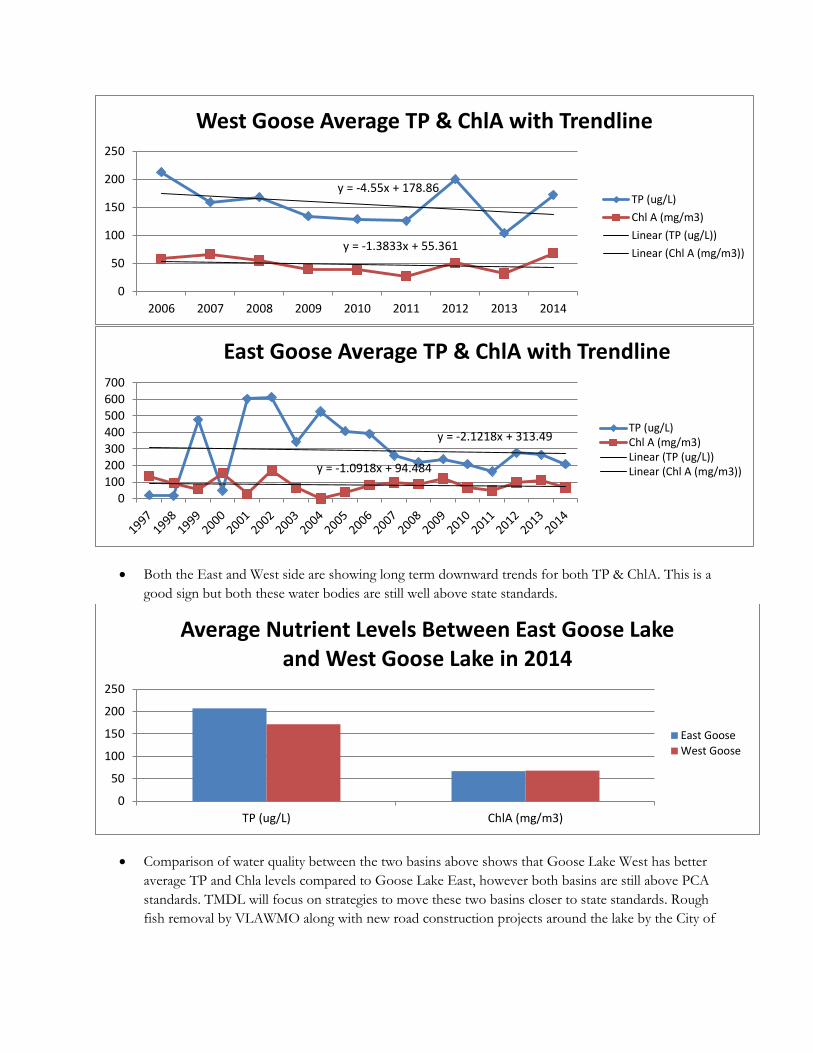
• Both the East and West side are showing long term downward trends for both TP & ChlA. This is a good sign but both these water bodies are still well above state standards.
• Comparison of water quality between the two basins above shows that Goose Lake West has better average TP and Chla levels compared to Goose Lake East, however both basins are still above PCA standards. TMDL will focus on strategies to move these two basins closer to state standards. Rough fish removal by VLAWMO along with new road construction projects around the lake by the City of
y = -4.55x + 178.86
y = -1.3833x + 55.361
0
50
100
150
200
250
2006 2007 2008 2009 2010 2011 2012 2013 2014
West Goose Average TP & ChlA with Trendline
TP (ug/L)Chl A (mg/m3)Linear (TP (ug/L))Linear (Chl A (mg/m3))
y = -2.1218x + 313.49
y = -1.0918x + 94.484
0100200300400500600700
East Goose Average TP & ChlA with Trendline
TP (ug/L)Chl A (mg/m3)Linear (TP (ug/L))Linear (Chl A (mg/m3))
0
50
100
150
200
250
TP (ug/L) ChlA (mg/m3)
Average Nutrient Levels Between East Goose Lake and West Goose Lake in 2014
East GooseWest Goose
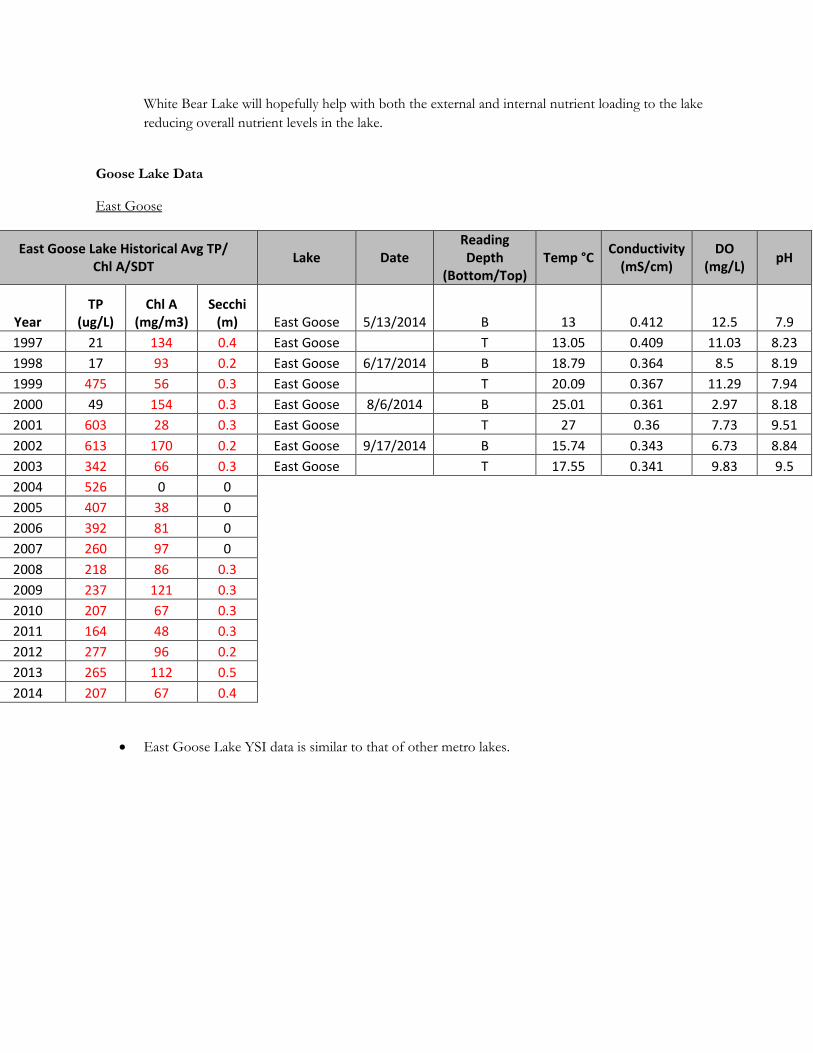
White Bear Lake will hopefully help with both the external and internal nutrient loading to the lake reducing overall nutrient levels in the lake.
Goose Lake Data
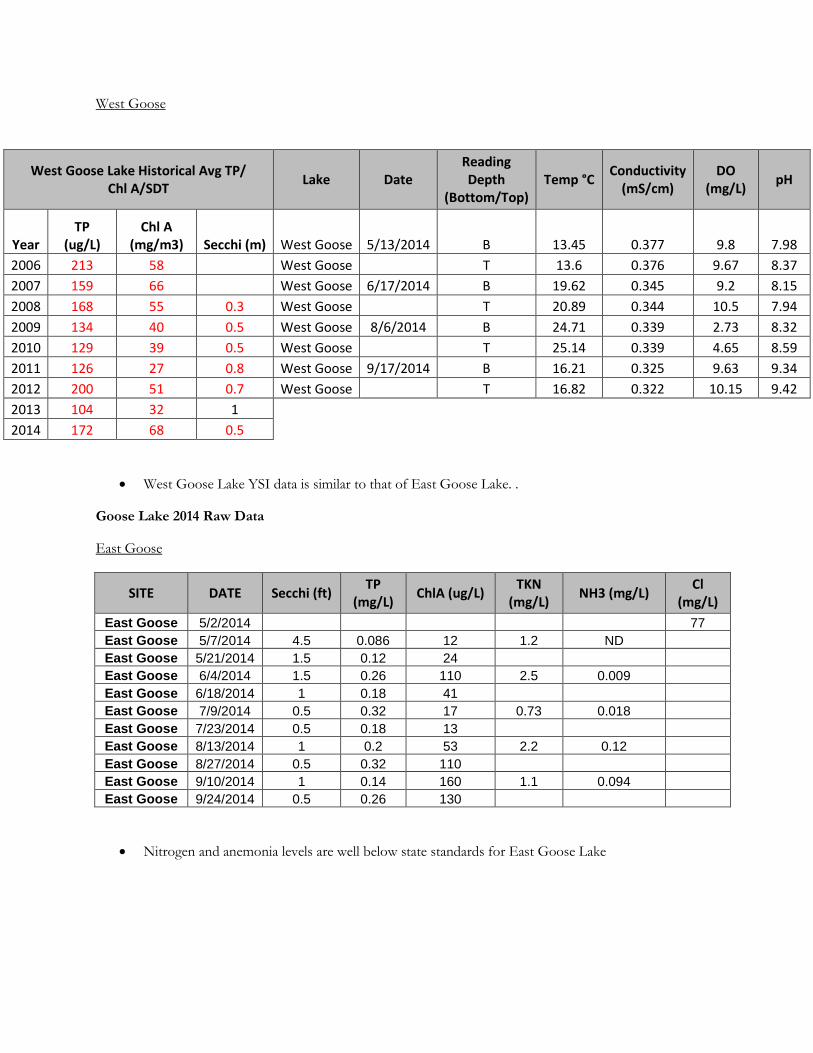
East Goose
East Goose Lake Historical Avg TP/ Chl A/SDT Lake Date
Reading Depth
(Bottom/Top) Temp °C Conductivity
(mS/cm) DO
(mg/L) pH
Year TP
(ug/L) Chl A
(mg/m3) Secchi
(m) East Goose 5/13/2014 B 13 0.412 12.5 7.9 1997 21 134 0.4 East Goose T 13.05 0.409 11.03 8.23 1998 17 93 0.2 East Goose 6/17/2014 B 18.79 0.364 8.5 8.19 1999 475 56 0.3 East Goose T 20.09 0.367 11.29 7.94 2000 49 154 0.3 East Goose 8/6/2014 B 25.01 0.361 2.97 8.18 2001 603 28 0.3 East Goose T 27 0.36 7.73 9.51 2002 613 170 0.2 East Goose 9/17/2014 B 15.74 0.343 6.73 8.84 2003 342 66 0.3 East Goose T 17.55 0.341 9.83 9.5 2004 526 0 0
2005 407 38 0 2006 392 81 0 2007 260 97 0 2008 218 86 0.3 2009 237 121 0.3 2010 207 67 0.3 2011 164 48 0.3 2012 277 96 0.2 2013 265 112 0.5 2014 207 67 0.4
• East Goose Lake YSI data is similar to that of other metro lakes.
West Goose
• West Goose Lake YSI data is similar to that of East Goose Lake. .
Goose Lake 2014 Raw Data
East Goose
SITE DATE Secchi (ft) TP (mg/L) ChlA (ug/L) TKN
(mg/L) NH3 (mg/L) Cl (mg/L)
East Goose 5/2/2014 77 East Goose 5/7/2014 4.5 0.086 12 1.2 ND East Goose 5/21/2014 1.5 0.12 24 East Goose 6/4/2014 1.5 0.26 110 2.5 0.009 East Goose 6/18/2014 1 0.18 41 East Goose 7/9/2014 0.5 0.32 17 0.73 0.018 East Goose 7/23/2014 0.5 0.18 13 East Goose 8/13/2014 1 0.2 53 2.2 0.12 East Goose 8/27/2014 0.5 0.32 110 East Goose 9/10/2014 1 0.14 160 1.1 0.094 East Goose 9/24/2014 0.5 0.26 130
• Nitrogen and anemonia levels are well below state standards for East Goose Lake
West Goose Lake Historical Avg TP/ Chl A/SDT Lake Date
Reading Depth
(Bottom/Top) Temp °C Conductivity
(mS/cm) DO
(mg/L) pH
Year TP
(ug/L) Chl A
(mg/m3) Secchi (m) West Goose 5/13/2014 B 13.45 0.377 9.8 7.98 2006 213 58 West Goose T 13.6 0.376 9.67 8.37 2007 159 66 West Goose 6/17/2014 B 19.62 0.345 9.2 8.15 2008 168 55 0.3 West Goose T 20.89 0.344 10.5 7.94 2009 134 40 0.5 West Goose 8/6/2014 B 24.71 0.339 2.73 8.32 2010 129 39 0.5 West Goose T 25.14 0.339 4.65 8.59 2011 126 27 0.8 West Goose 9/17/2014 B 16.21 0.325 9.63 9.34 2012 200 51 0.7 West Goose T 16.82 0.322 10.15 9.42 2013 104 32 1
2014 172 68 0.5
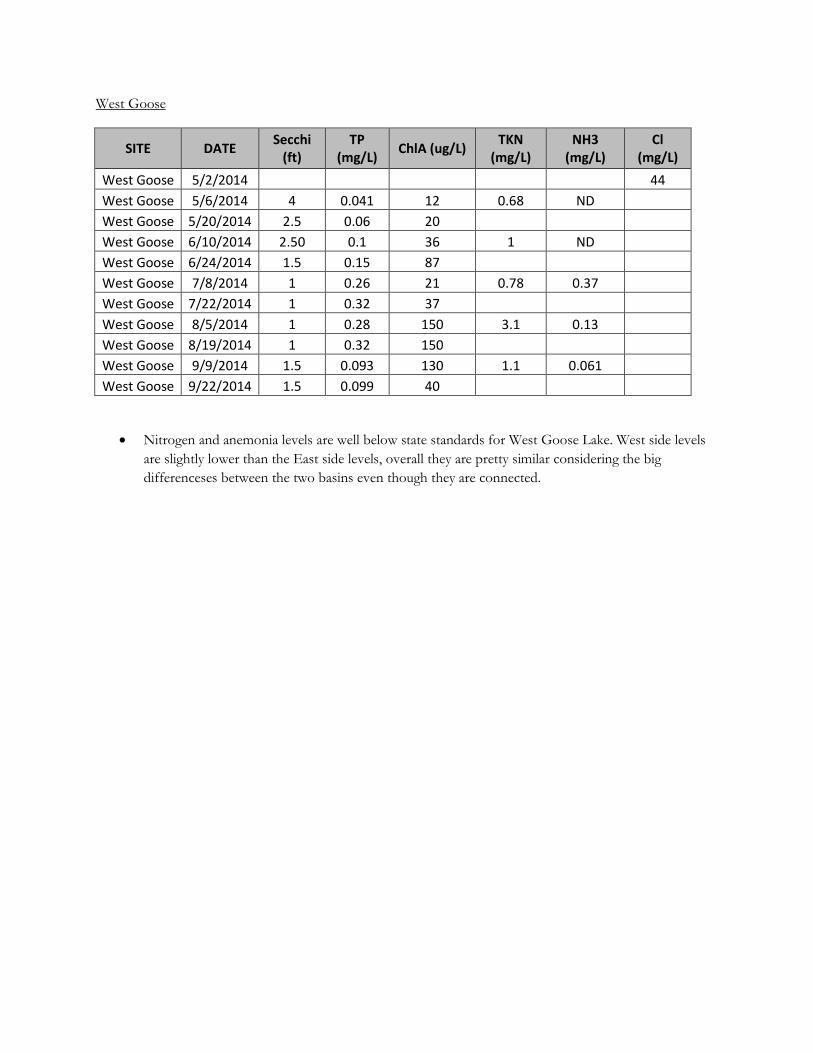
West Goose
SITE DATE Secchi (ft)
TP (mg/L) ChlA (ug/L) TKN
(mg/L) NH3
(mg/L) Cl
(mg/L) West Goose 5/2/2014 44 West Goose 5/6/2014 4 0.041 12 0.68 ND West Goose 5/20/2014 2.5 0.06 20 West Goose 6/10/2014 2.50 0.1 36 1 ND West Goose 6/24/2014 1.5 0.15 87 West Goose 7/8/2014 1 0.26 21 0.78 0.37 West Goose 7/22/2014 1 0.32 37 West Goose 8/5/2014 1 0.28 150 3.1 0.13 West Goose 8/19/2014 1 0.32 150 West Goose 9/9/2014 1.5 0.093 130 1.1 0.061 West Goose 9/22/2014 1.5 0.099 40
• Nitrogen and anemonia levels are well below state standards for West Goose Lake. West side levels are slightly lower than the East side levels, overall they are pretty similar considering the big differenceses between the two basins even though they are connected.
Tamarack Lake
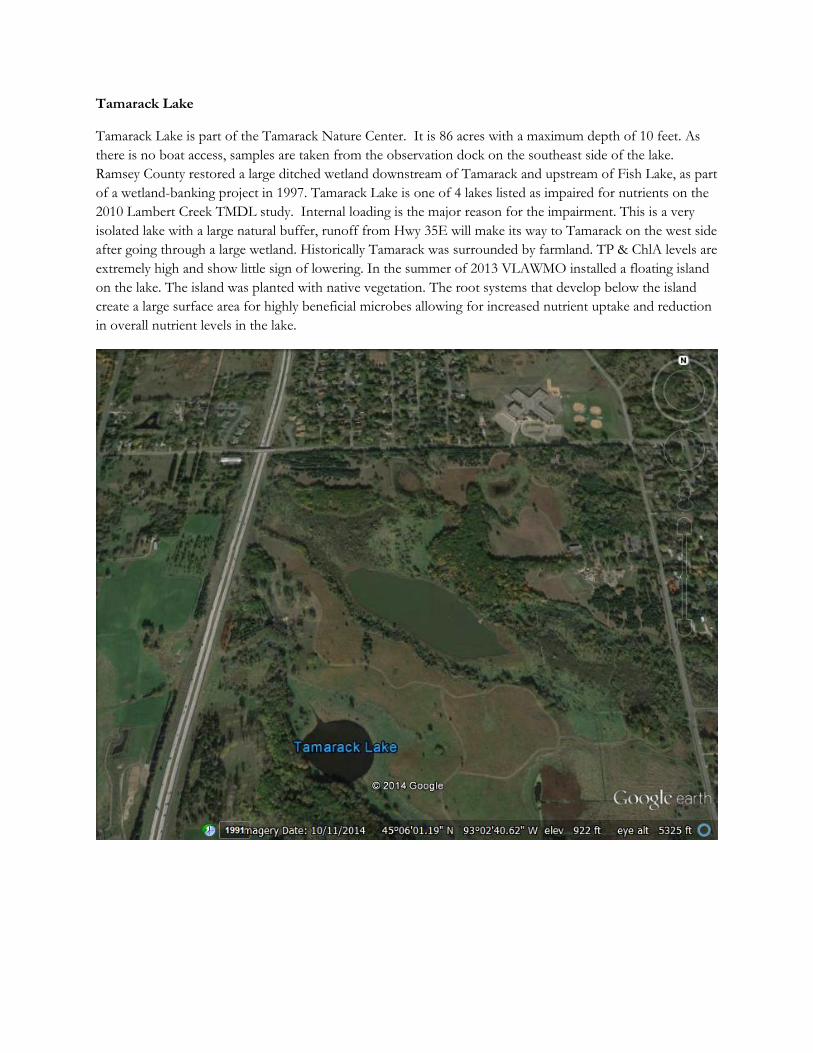
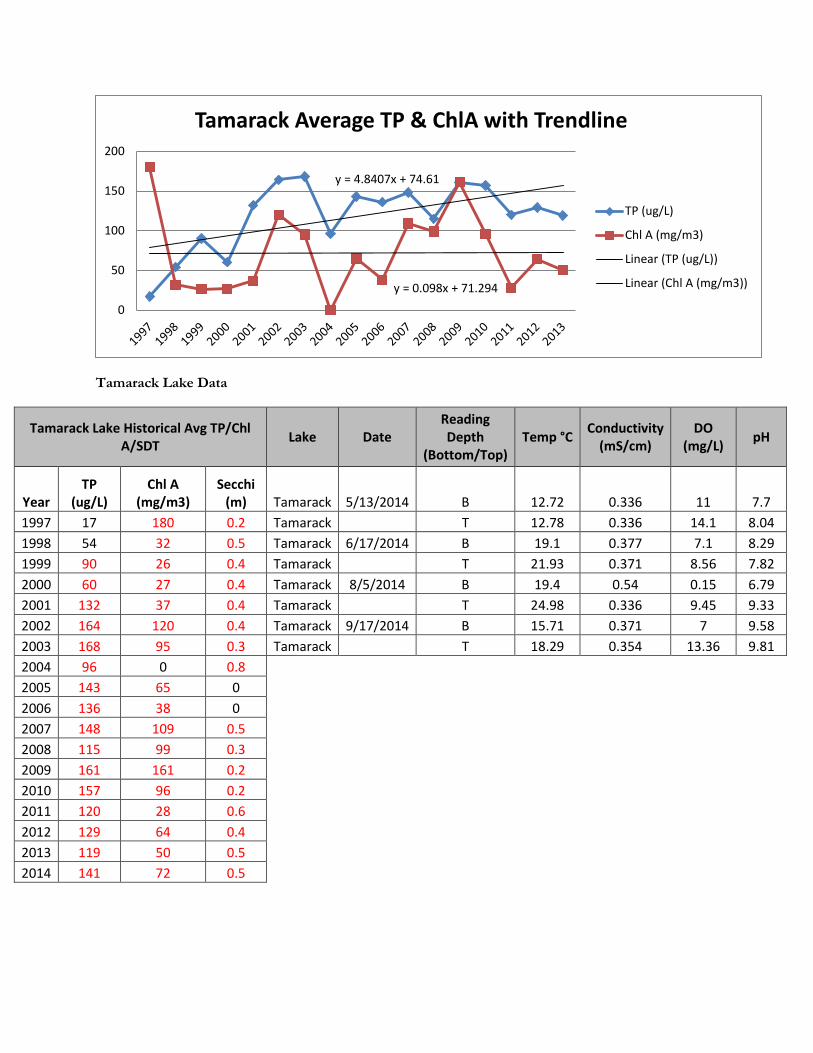
Tamarack Lake is part of the Tamarack Nature Center. It is 86 acres with a maximum depth of 10 feet. As there is no boat access, samples are taken from the observation dock on the southeast side of the lake. Ramsey County restored a large ditched wetland downstream of Tamarack and upstream of Fish Lake, as part of a wetland-banking project in 1997. Tamarack Lake is one of 4 lakes listed as impaired for nutrients on the 2010 Lambert Creek TMDL study. Internal loading is the major reason for the impairment. This is a very isolated lake with a large natural buffer, runoff from Hwy 35E will make its way to Tamarack on the west side after going through a large wetland. Historically Tamarack was surrounded by farmland. TP & ChlA levels are extremely high and show little sign of lowering. In the summer of 2013 VLAWMO installed a floating island on the lake. The island was planted with native vegetation. The root systems that develop below the island create a large surface area for highly beneficial microbes allowing for increased nutrient uptake and reduction in overall nutrient levels in the lake.
Tamarack Lake Data
Tamarack Lake Historical Avg TP/Chl A/SDT Lake Date
Reading Depth
(Bottom/Top) Temp °C Conductivity
(mS/cm) DO
(mg/L) pH
Year TP
(ug/L) Chl A
(mg/m3) Secchi
(m) Tamarack 5/13/2014 B 12.72 0.336 11 7.7 1997 17 180 0.2 Tamarack T 12.78 0.336 14.1 8.04 1998 54 32 0.5 Tamarack 6/17/2014 B 19.1 0.377 7.1 8.29 1999 90 26 0.4 Tamarack T 21.93 0.371 8.56 7.82 2000 60 27 0.4 Tamarack 8/5/2014 B 19.4 0.54 0.15 6.79 2001 132 37 0.4 Tamarack T 24.98 0.336 9.45 9.33 2002 164 120 0.4 Tamarack 9/17/2014 B 15.71 0.371 7 9.58 2003 168 95 0.3 Tamarack T 18.29 0.354 13.36 9.81 2004 96 0 0.8
2005 143 65 0 2006 136 38 0 2007 148 109 0.5 2008 115 99 0.3 2009 161 161 0.2 2010 157 96 0.2 2011 120 28 0.6 2012 129 64 0.4 2013 119 50 0.5 2014 141 72 0.5
y = 4.8407x + 74.61
y = 0.098x + 71.294
0
50
100
150
200
Tamarack Average TP & ChlA with Trendline
TP (ug/L)
Chl A (mg/m3)
Linear (TP (ug/L))
Linear (Chl A (mg/m3))
• Tamarack Lake YSI data is similar to that of similar metro lakes, nutrient levels are very high especially for an isolated lake with significant buffers. Internal loading is most likely the cause of these high levels.
Tamarack Lake 2014 Raw Data
SITE DATE Secchi (ft)
TP (mg/L)
ChlA (ug/L)
TKN (mg/L) NH3 (mg/L) Cl
(mg/L) Tamarack 5/2/2014 35 Tamarack 5/6/2014 1.5 0.17 130 2.6 0.04 Tamarack 5/20/2014 1.5 0.12 84 Tamarack 6/10/2014 2.50 0.11 27 1.7 0.015 Tamarack 6/24/2014 2.5 0.11 44 Tamarack 7/8/2014 2 0.13 32 1.6 0.0083 Tamarack 7/22/2014 1 0.14 41 Tamarack 8/5/2014 1 0.18 180 3.1 0.21 Tamarack 8/19/2014 1 0.16 180 Tamarack 9/9/2014 1 0.16 160 2.9 0.071 Tamarack 9/22/2014 1 0.13 39
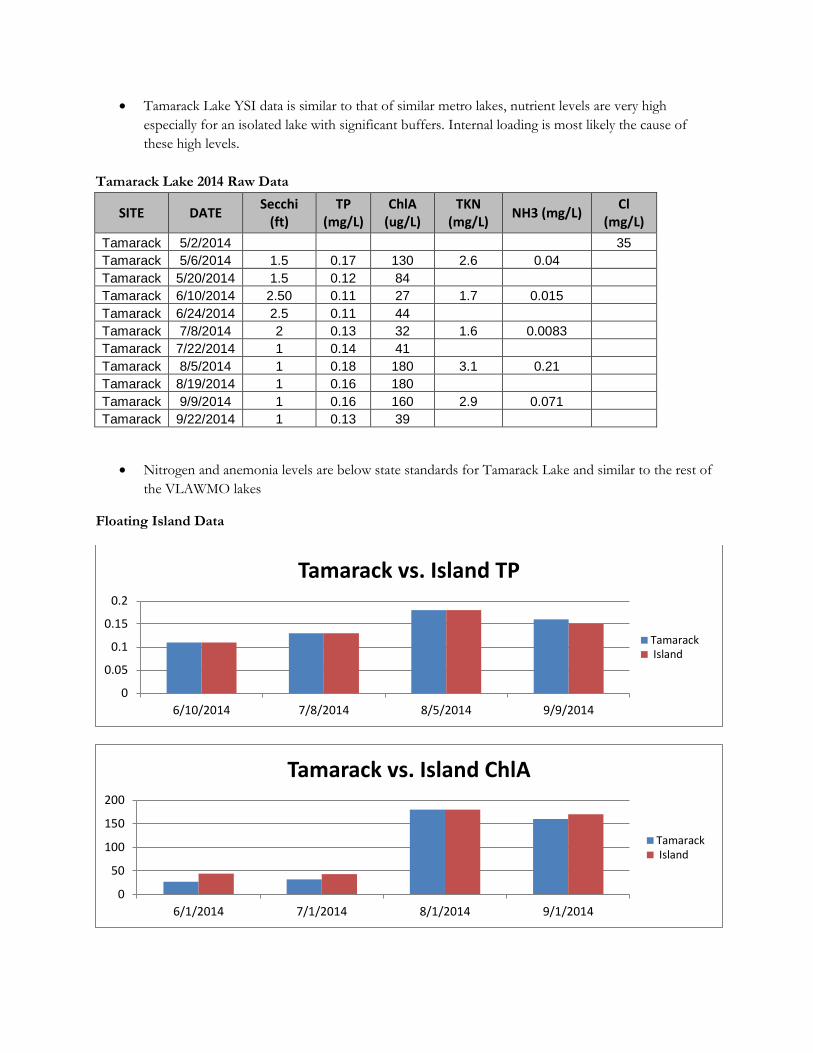
• Nitrogen and anemonia levels are below state standards for Tamarack Lake and similar to the rest of the VLAWMO lakes
Floating Island Data
0
0.05
0.1
0.15
0.2
6/10/2014 7/8/2014 8/5/2014 9/9/2014
Tamarack vs. Island TP
Tamarack Island
0
50
100
150
200
6/1/2014 7/1/2014 8/1/2014 9/1/2014
Tamarack vs. Island ChlA
Tamarack Island
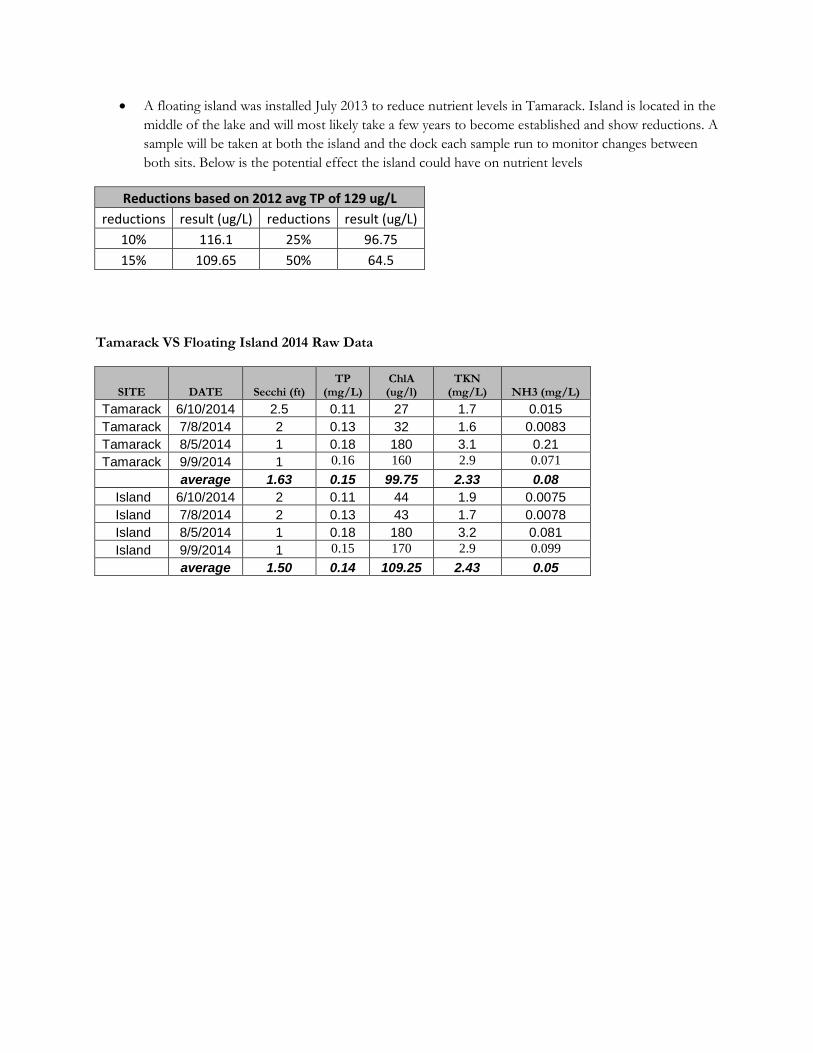
• A floating island was installed July 2013 to reduce nutrient levels in Tamarack. Island is located in the middle of the lake and will most likely take a few years to become established and show reductions. A sample will be taken at both the island and the dock each sample run to monitor changes between both sits. Below is the potential effect the island could have on nutrient levels
Reductions based on 2012 avg TP of 129 ug/L reductions result (ug/L) reductions result (ug/L)
10% 116.1 25% 96.75 15% 109.65 50% 64.5
Tamarack VS Floating Island 2014 Raw Data
SITE DATE Secchi (ft) TP
(mg/L) ChlA (ug/l)
TKN (mg/L) NH3 (mg/L)
Tamarack 6/10/2014 2.5 0.11 27 1.7 0.015 Tamarack 7/8/2014 2 0.13 32 1.6 0.0083 Tamarack 8/5/2014 1 0.18 180 3.1 0.21 Tamarack 9/9/2014 1 0.16 160 2.9 0.071
average 1.63 0.15 99.75 2.33 0.08 Island 6/10/2014 2 0.11 44 1.9 0.0075 Island 7/8/2014 2 0.13 43 1.7 0.0078 Island 8/5/2014 1 0.18 180 3.2 0.081 Island 9/9/2014 1 0.15 170 2.9 0.099
average 1.50 0.14 109.25 2.43 0.05
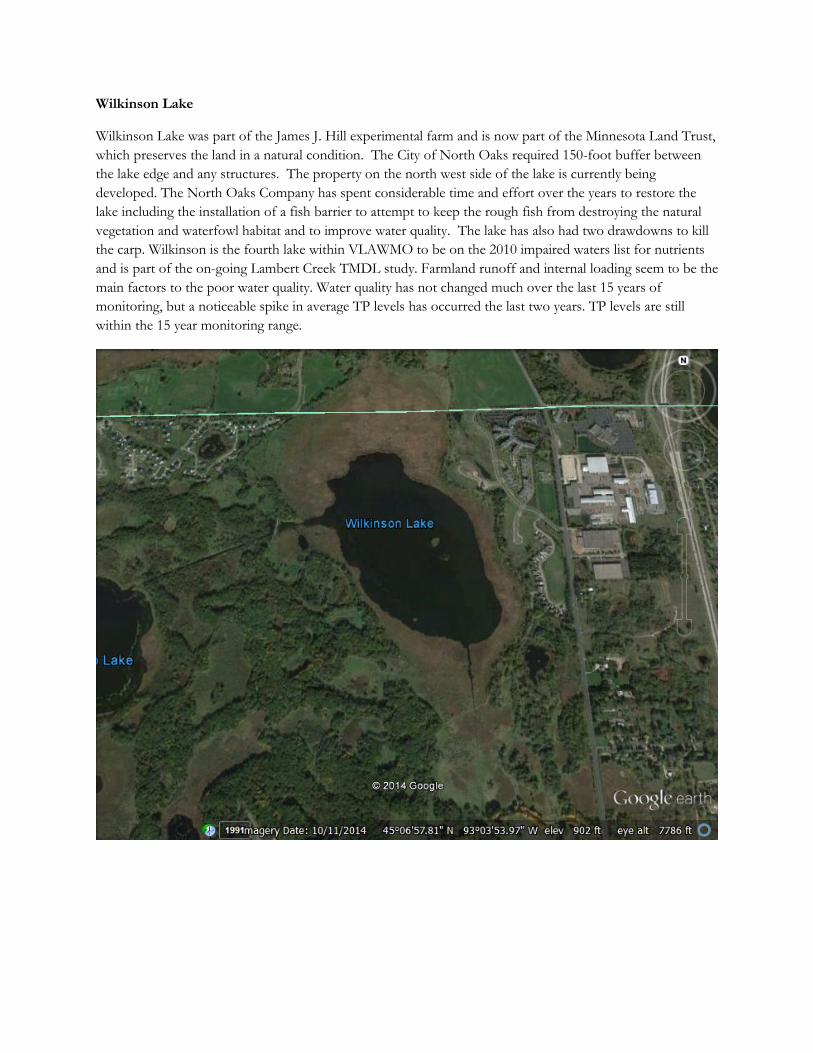
Wilkinson Lake
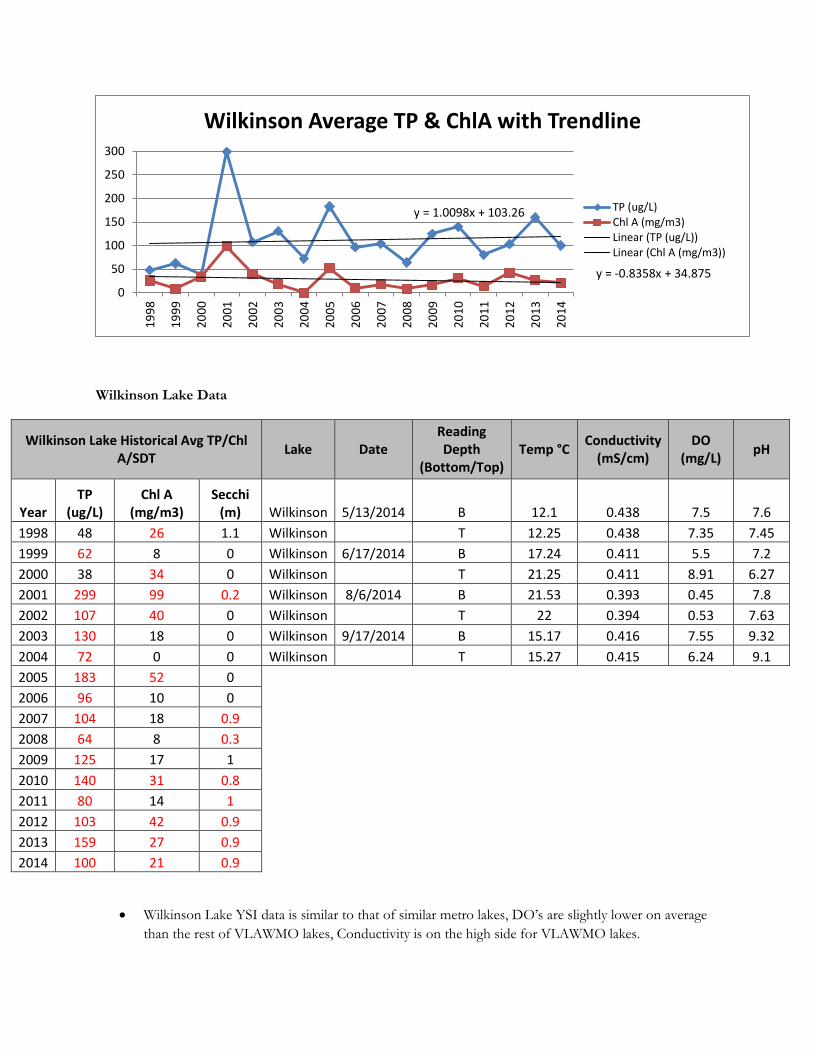
Wilkinson Lake was part of the James J. Hill experimental farm and is now part of the Minnesota Land Trust, which preserves the land in a natural condition. The City of North Oaks required 150-foot buffer between the lake edge and any structures. The property on the north west side of the lake is currently being developed. The North Oaks Company has spent considerable time and effort over the years to restore the lake including the installation of a fish barrier to attempt to keep the rough fish from destroying the natural vegetation and waterfowl habitat and to improve water quality. The lake has also had two drawdowns to kill the carp. Wilkinson is the fourth lake within VLAWMO to be on the 2010 impaired waters list for nutrients and is part of the on-going Lambert Creek TMDL study. Farmland runoff and internal loading seem to be the main factors to the poor water quality. Water quality has not changed much over the last 15 years of monitoring, but a noticeable spike in average TP levels has occurred the last two years. TP levels are still within the 15 year monitoring range.
Wilkinson Lake Data
Wilkinson Lake Historical Avg TP/Chl A/SDT Lake Date
Reading Depth
(Bottom/Top) Temp °C Conductivity
(mS/cm) DO
(mg/L) pH
Year TP
(ug/L) Chl A
(mg/m3) Secchi
(m) Wilkinson 5/13/2014 B 12.1 0.438 7.5 7.6 1998 48 26 1.1 Wilkinson T 12.25 0.438 7.35 7.45 1999 62 8 0 Wilkinson 6/17/2014 B 17.24 0.411 5.5 7.2 2000 38 34 0 Wilkinson T 21.25 0.411 8.91 6.27 2001 299 99 0.2 Wilkinson 8/6/2014 B 21.53 0.393 0.45 7.8 2002 107 40 0 Wilkinson T 22 0.394 0.53 7.63 2003 130 18 0 Wilkinson 9/17/2014 B 15.17 0.416 7.55 9.32 2004 72 0 0 Wilkinson T 15.27 0.415 6.24 9.1 2005 183 52 0
2006 96 10 0 2007 104 18 0.9 2008 64 8 0.3 2009 125 17 1 2010 140 31 0.8 2011 80 14 1 2012 103 42 0.9 2013 159 27 0.9 2014 100 21 0.9
• Wilkinson Lake YSI data is similar to that of similar metro lakes, DO’s are slightly lower on average than the rest of VLAWMO lakes, Conductivity is on the high side for VLAWMO lakes.
y = 1.0098x + 103.26
y = -0.8358x + 34.875 0
50
100
150
200
250
30019
98
1999
2000
2001
2002
2003
2004
2005
2006
2007
2008
2009
2010
2011
2012
2013
2014
Wilkinson Average TP & ChlA with Trendline
TP (ug/L)Chl A (mg/m3)Linear (TP (ug/L))Linear (Chl A (mg/m3))
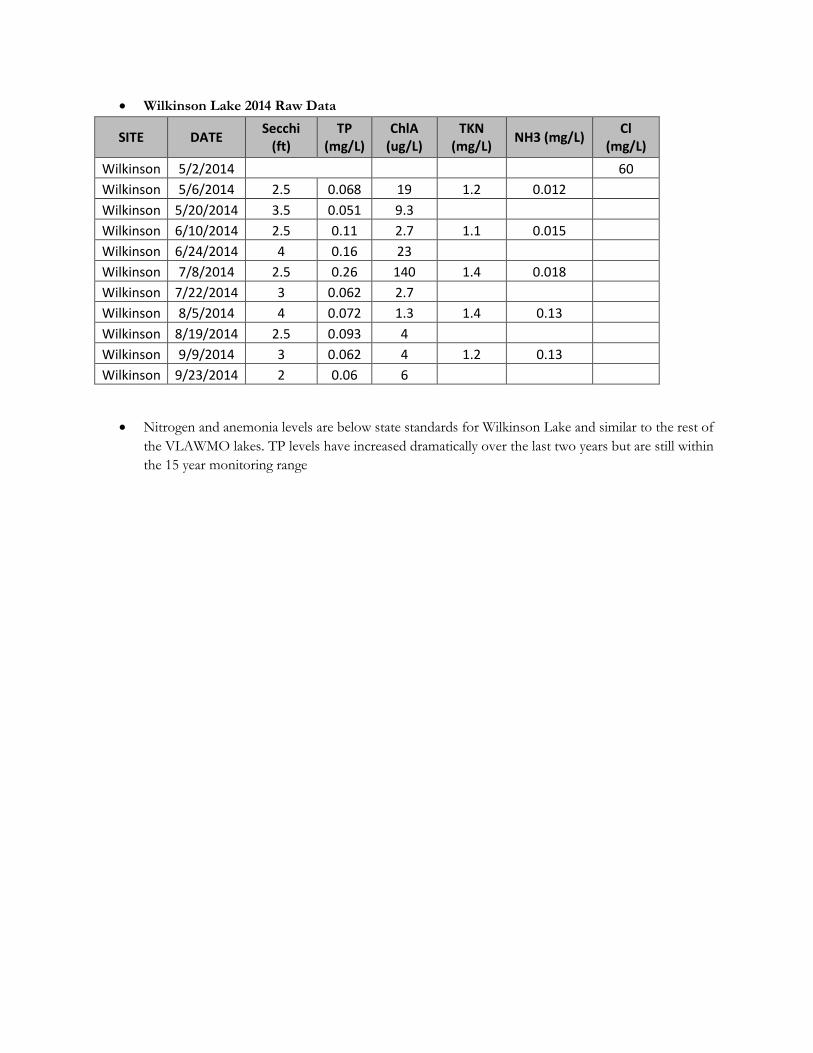
• Wilkinson Lake 2014 Raw Data
SITE DATE Secchi (ft)
TP (mg/L)
ChlA (ug/L)
TKN (mg/L) NH3 (mg/L) Cl
(mg/L) Wilkinson 5/2/2014
60
Wilkinson 5/6/2014 2.5 0.068 19 1.2 0.012 Wilkinson 5/20/2014 3.5 0.051 9.3 Wilkinson 6/10/2014 2.5 0.11 2.7 1.1 0.015 Wilkinson 6/24/2014 4 0.16 23 Wilkinson 7/8/2014 2.5 0.26 140 1.4 0.018 Wilkinson 7/22/2014 3 0.062 2.7 Wilkinson 8/5/2014 4 0.072 1.3 1.4 0.13 Wilkinson 8/19/2014 2.5 0.093 4 Wilkinson 9/9/2014 3 0.062 4 1.2 0.13 Wilkinson 9/23/2014 2 0.06 6
• Nitrogen and anemonia levels are below state standards for Wilkinson Lake and similar to the rest of the VLAWMO lakes. TP levels have increased dramatically over the last two years but are still within the 15 year monitoring range
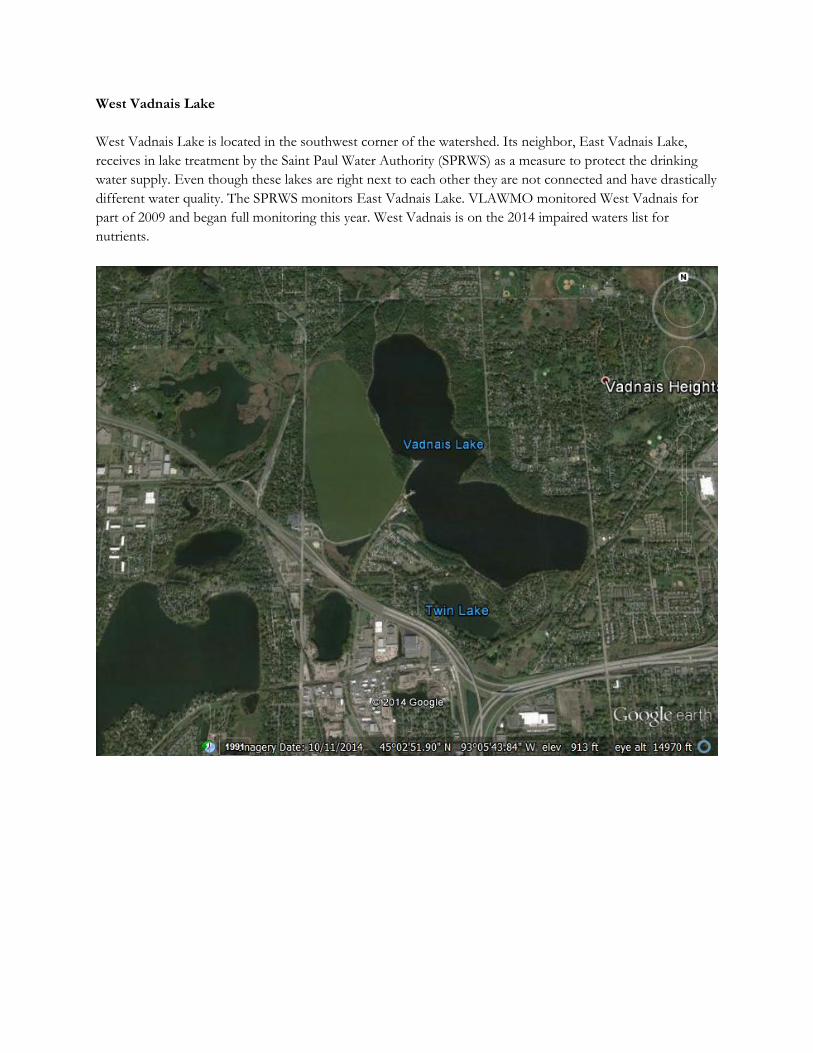
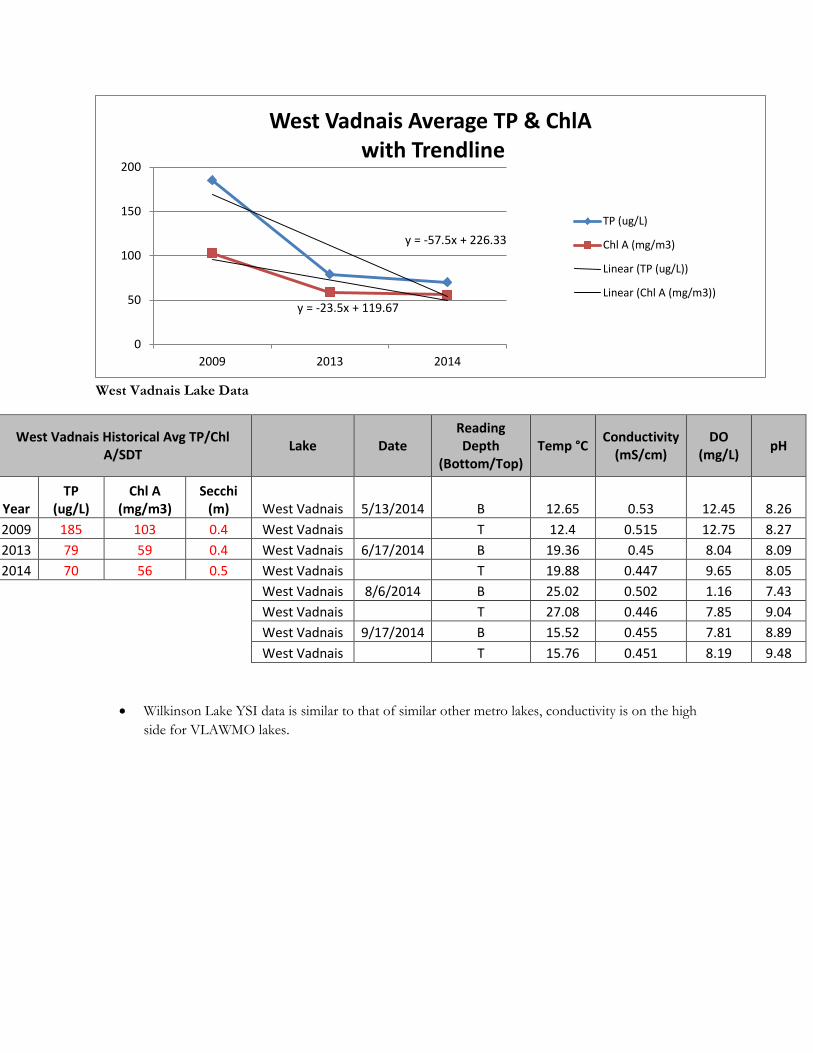
West Vadnais Lake West Vadnais Lake is located in the southwest corner of the watershed. Its neighbor, East Vadnais Lake, receives in lake treatment by the Saint Paul Water Authority (SPRWS) as a measure to protect the drinking water supply. Even though these lakes are right next to each other they are not connected and have drastically different water quality. The SPRWS monitors East Vadnais Lake. VLAWMO monitored West Vadnais for part of 2009 and began full monitoring this year. West Vadnais is on the 2014 impaired waters list for nutrients.
West Vadnais Lake Data
West Vadnais Historical Avg TP/Chl A/SDT Lake Date
Reading Depth
(Bottom/Top) Temp °C Conductivity
(mS/cm) DO
(mg/L) pH
Year TP
(ug/L) Chl A
(mg/m3) Secchi
(m) West Vadnais 5/13/2014 B 12.65 0.53 12.45 8.26 2009 185 103 0.4 West Vadnais T 12.4 0.515 12.75 8.27 2013 79 59 0.4 West Vadnais 6/17/2014 B 19.36 0.45 8.04 8.09 2014 70 56 0.5 West Vadnais T 19.88 0.447 9.65 8.05
West Vadnais 8/6/2014 B 25.02 0.502 1.16 7.43
West Vadnais T 27.08 0.446 7.85 9.04
West Vadnais 9/17/2014 B 15.52 0.455 7.81 8.89
West Vadnais T 15.76 0.451 8.19 9.48
• Wilkinson Lake YSI data is similar to that of similar other metro lakes, conductivity is on the high side for VLAWMO lakes.
y = -57.5x + 226.33
y = -23.5x + 119.67
0
50
100
150
200
2009 2013 2014
West Vadnais Average TP & ChlA with Trendline
TP (ug/L)
Chl A (mg/m3)
Linear (TP (ug/L))
Linear (Chl A (mg/m3))
West Vadnais Lake 2014 Raw Data
SITE DATE Secchi (ft)
TP (mg/L) ChlA (ug/L) TKN
(mg/L) NH3 (mg/L) Cl (mg/L)
West Vadnais 5/2/2014 82 West Vadnais 5/6/2014 3 0.066 28 3.5 1.7 West Vadnais 5/20/2014 3 0.057 56 West Vadnais 6/10/2014 1.50 0.091 61 2.8 ND West Vadnais 6/24/2014 2 0.051 24 West Vadnais 7/8/2014 1.5 0.098 44 1.3 0.018 West Vadnais 7/22/2014 1.5 0.065 25 West Vadnais 8/5/2014 1 0.069 57 2.5 0.089 West Vadnais 8/19/2014 1 0.081 100 West Vadnais 9/9/2014 1 0.052 100 2.1 0.083 West Vadnais 9/23/2014 1 0.071 71
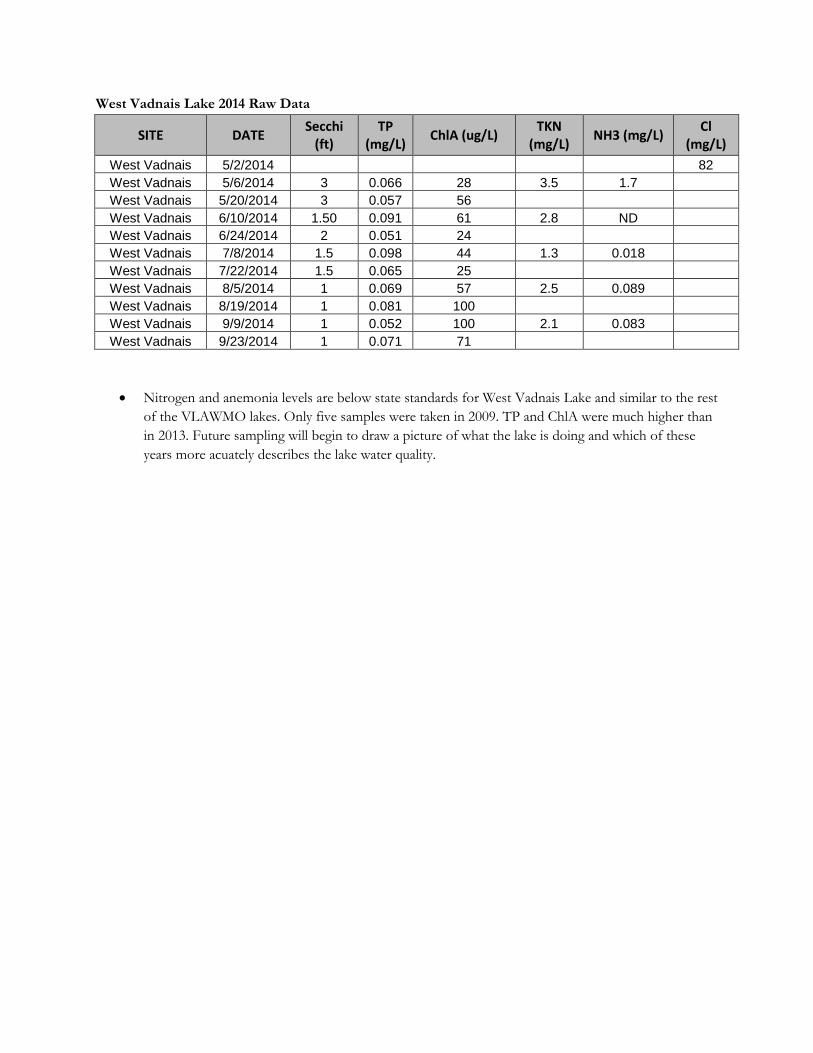
• Nitrogen and anemonia levels are below state standards for West Vadnais Lake and similar to the rest of the VLAWMO lakes. Only five samples were taken in 2009. TP and ChlA were much higher than in 2013. Future sampling will begin to draw a picture of what the lake is doing and which of these years more acuately describes the lake water quality.
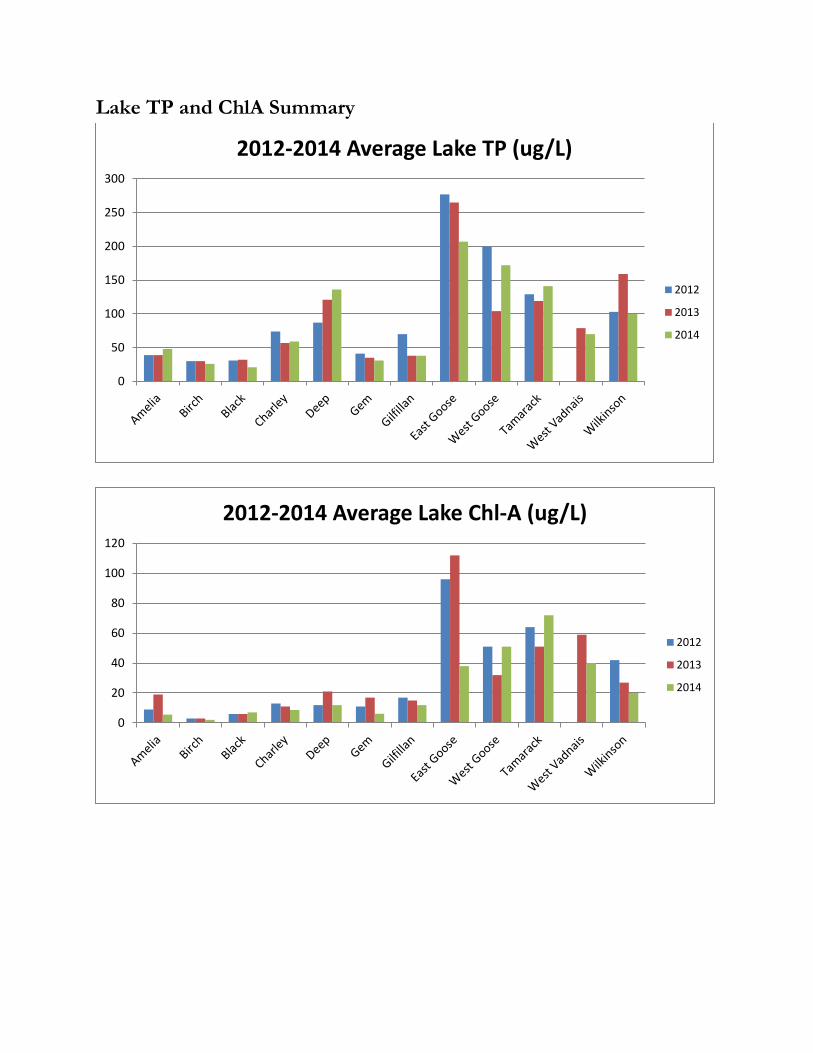
Lake TP and ChlA Summary
0
50
100
150
200
250
300
2012-2014 Average Lake TP (ug/L)
2012
2013
2014
0
20
40
60
80
100
120
2012-2014 Average Lake Chl-A (ug/L)
2012
2013
2014
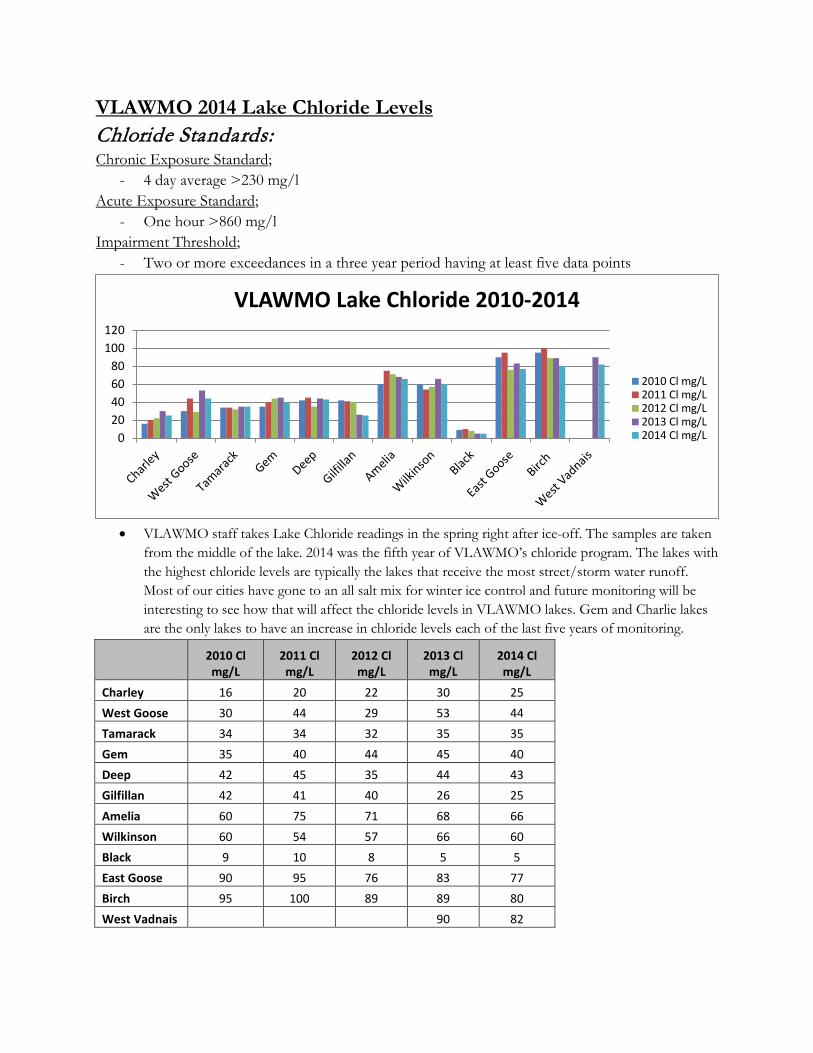
VLAWMO 2014 Lake Chloride Levels
Chloride Standards: Chronic Exposure Standard;
- 4 day average >230 mg/l Acute Exposure Standard;
- One hour >860 mg/l Impairment Threshold;
- Two or more exceedances in a three year period having at least five data points
• VLAWMO staff takes Lake Chloride readings in the spring right after ice-off. The samples are taken
from the middle of the lake. 2014 was the fifth year of VLAWMO’s chloride program. The lakes with the highest chloride levels are typically the lakes that receive the most street/storm water runoff. Most of our cities have gone to an all salt mix for winter ice control and future monitoring will be interesting to see how that will affect the chloride levels in VLAWMO lakes. Gem and Charlie lakes are the only lakes to have an increase in chloride levels each of the last five years of monitoring.
2010 Cl mg/L
2011 Cl mg/L
2012 Cl mg/L
2013 Cl mg/L
2014 Cl mg/L
Charley 16 20 22 30 25 West Goose 30 44 29 53 44 Tamarack 34 34 32 35 35 Gem 35 40 44 45 40 Deep 42 45 35 44 43 Gilfillan 42 41 40 26 25 Amelia 60 75 71 68 66 Wilkinson 60 54 57 66 60 Black 9 10 8 5 5 East Goose 90 95 76 83 77 Birch 95 100 89 89 80 West Vadnais 90 82
020406080
100120
VLAWMO Lake Chloride 2010-2014
2010 Cl mg/L2011 Cl mg/L2012 Cl mg/L2013 Cl mg/L2014 Cl mg/L
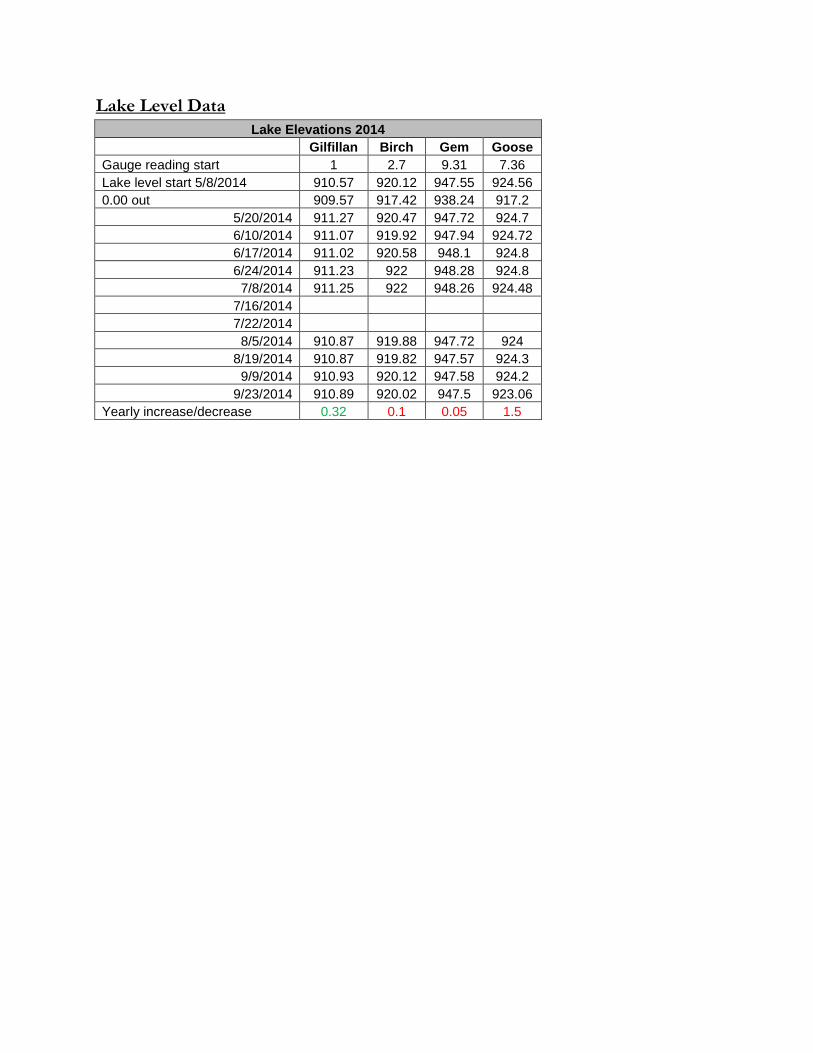
Lake Level Data Lake Elevations 2014
Gilfillan Birch Gem Goose Gauge reading start 1 2.7 9.31 7.36 Lake level start 5/8/2014 910.57 920.12 947.55 924.56 0.00 out 909.57 917.42 938.24 917.2
5/20/2014 911.27 920.47 947.72 924.7 6/10/2014 911.07 919.92 947.94 924.72 6/17/2014 911.02 920.58 948.1 924.8 6/24/2014 911.23 922 948.28 924.8
7/8/2014 911.25 922 948.26 924.48 7/16/2014 7/22/2014
8/5/2014 910.87 919.88 947.72 924 8/19/2014 910.87 919.82 947.57 924.3
9/9/2014 910.93 920.12 947.58 924.2 9/23/2014 910.89 920.02 947.5 923.06
Yearly increase/decrease 0.32 0.1 0.05 1.5
2014 Lambert Creek Monitoring Results
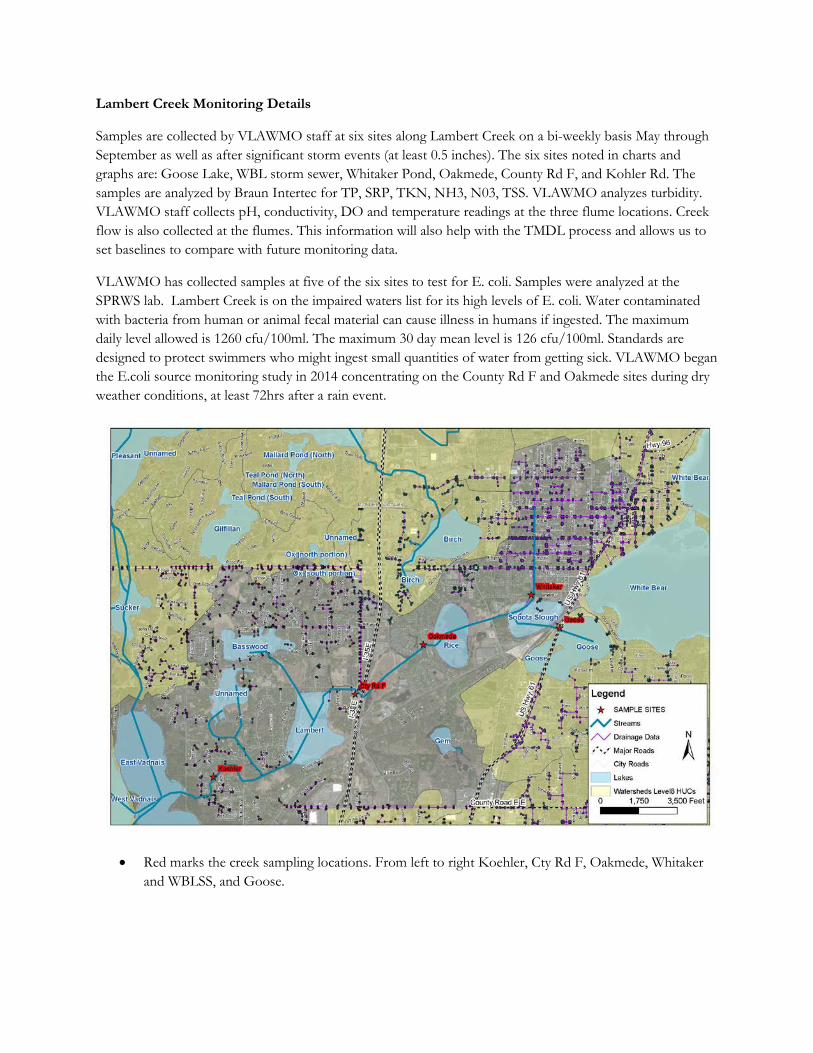
Lambert Creek Monitoring Details
Samples are collected by VLAWMO staff at six sites along Lambert Creek on a bi-weekly basis May through September as well as after significant storm events (at least 0.5 inches). The six sites noted in charts and graphs are: Goose Lake, WBL storm sewer, Whitaker Pond, Oakmede, County Rd F, and Kohler Rd. The samples are analyzed by Braun Intertec for TP, SRP, TKN, NH3, N03, TSS. VLAWMO analyzes turbidity. VLAWMO staff collects pH, conductivity, DO and temperature readings at the three flume locations. Creek flow is also collected at the flumes. This information will also help with the TMDL process and allows us to set baselines to compare with future monitoring data.
VLAWMO has collected samples at five of the six sites to test for E. coli. Samples were analyzed at the SPRWS lab. Lambert Creek is on the impaired waters list for its high levels of E. coli. Water contaminated with bacteria from human or animal fecal material can cause illness in humans if ingested. The maximum daily level allowed is 1260 cfu/100ml. The maximum 30 day mean level is 126 cfu/100ml. Standards are designed to protect swimmers who might ingest small quantities of water from getting sick. VLAWMO began the E.coli source monitoring study in 2014 concentrating on the County Rd F and Oakmede sites during dry weather conditions, at least 72hrs after a rain event.
• Red marks the creek sampling locations. From left to right Koehler, Cty Rd F, Oakmede, Whitaker and WBLSS, and Goose.
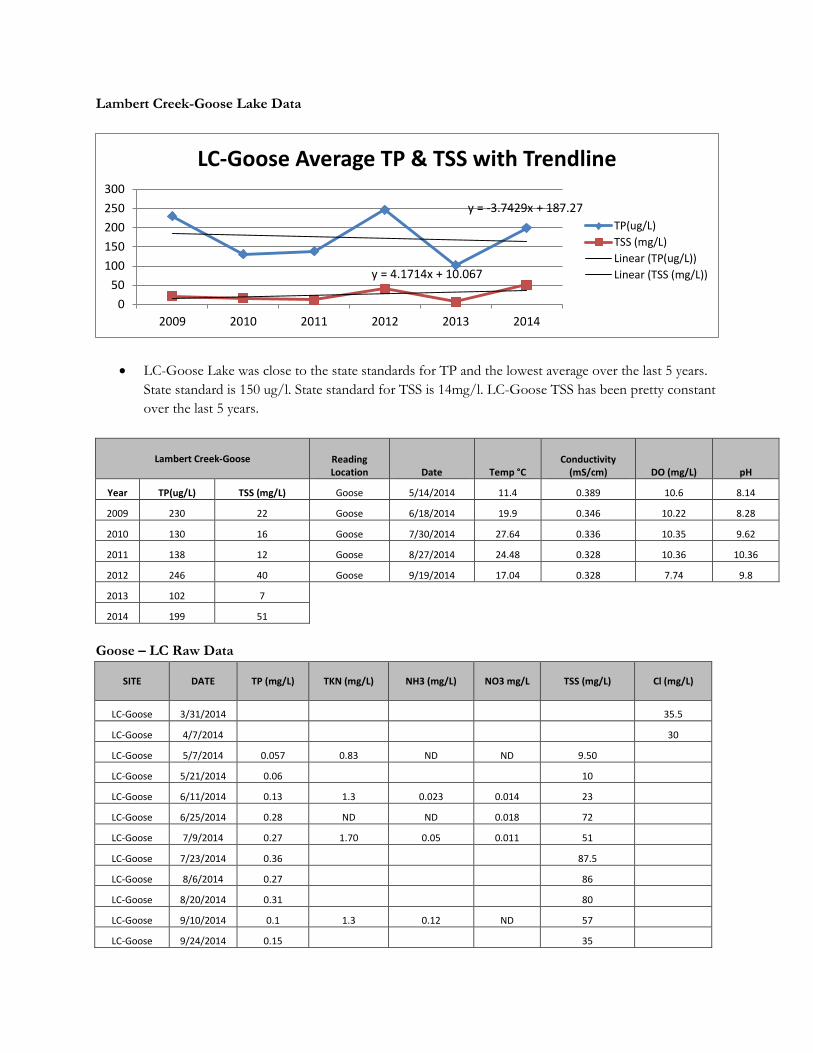
Lambert Creek-Goose Lake Data
• LC-Goose Lake was close to the state standards for TP and the lowest average over the last 5 years. State standard is 150 ug/l. State standard for TSS is 14mg/l. LC-Goose TSS has been pretty constant over the last 5 years.
Lambert Creek-Goose Reading Location Date Temp °C
Conductivity (mS/cm) DO (mg/L) pH
Year TP(ug/L) TSS (mg/L) Goose 5/14/2014 11.4 0.389 10.6 8.14
2009 230 22 Goose 6/18/2014 19.9 0.346 10.22 8.28
2010 130 16 Goose 7/30/2014 27.64 0.336 10.35 9.62
2011 138 12 Goose 8/27/2014 24.48 0.328 10.36 10.36
2012 246 40 Goose 9/19/2014 17.04 0.328 7.74 9.8
2013 102 7
2014 199 51
Goose – LC Raw Data
SITE DATE TP (mg/L) TKN (mg/L) NH3 (mg/L) NO3 mg/L TSS (mg/L) Cl (mg/L)
LC-Goose 3/31/2014 35.5
LC-Goose 4/7/2014 30
LC-Goose 5/7/2014 0.057 0.83 ND ND 9.50
LC-Goose 5/21/2014 0.06 10
LC-Goose 6/11/2014 0.13 1.3 0.023 0.014 23
LC-Goose 6/25/2014 0.28 ND ND 0.018 72
LC-Goose 7/9/2014 0.27 1.70 0.05 0.011 51
LC-Goose 7/23/2014 0.36 87.5
LC-Goose 8/6/2014 0.27 86
LC-Goose 8/20/2014 0.31 80
LC-Goose 9/10/2014 0.1 1.3 0.12 ND 57
LC-Goose 9/24/2014 0.15 35
y = -3.7429x + 187.27
y = 4.1714x + 10.067
050
100150200250300
2009 2010 2011 2012 2013 2014
LC-Goose Average TP & TSS with Trendline
TP(ug/L)TSS (mg/L)Linear (TP(ug/L))Linear (TSS (mg/L))
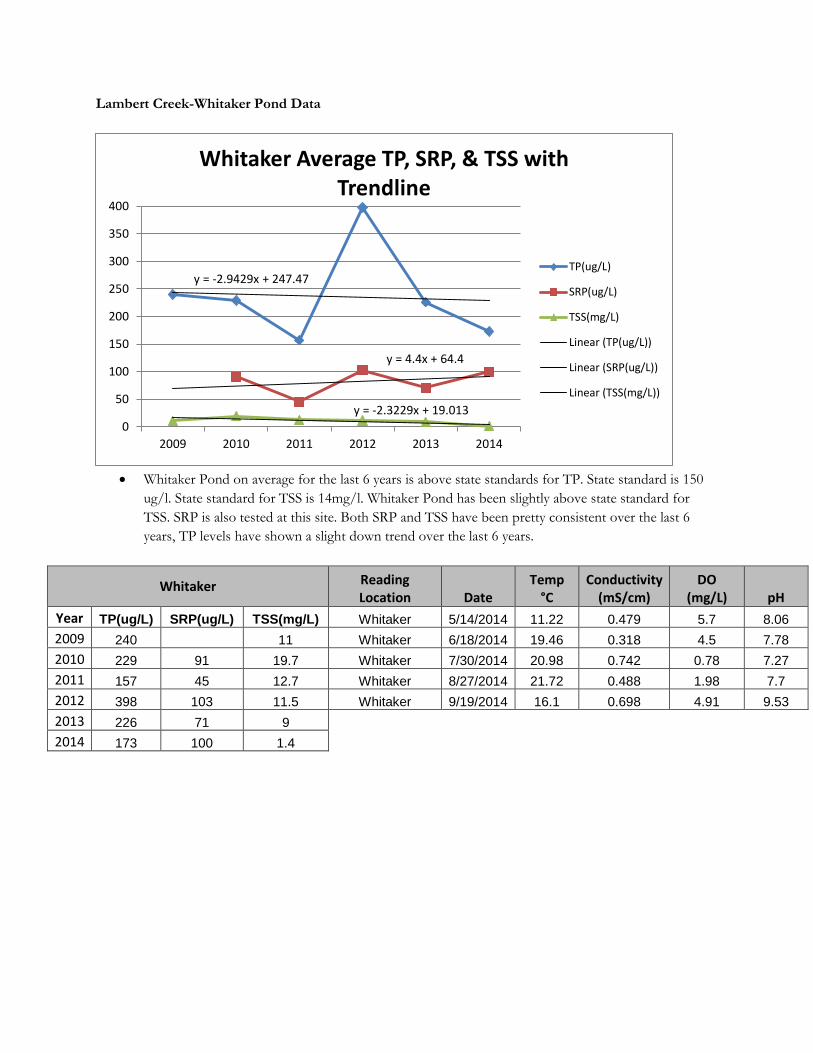
Lambert Creek-Whitaker Pond Data
• Whitaker Pond on average for the last 6 years is above state standards for TP. State standard is 150
ug/l. State standard for TSS is 14mg/l. Whitaker Pond has been slightly above state standard for TSS. SRP is also tested at this site. Both SRP and TSS have been pretty consistent over the last 6 years, TP levels have shown a slight down trend over the last 6 years.
Whitaker Reading Location Date
Temp °C
Conductivity (mS/cm)
DO (mg/L) pH
Year TP(ug/L) SRP(ug/L) TSS(mg/L) Whitaker 5/14/2014 11.22 0.479 5.7 8.06 2009 240 11 Whitaker 6/18/2014 19.46 0.318 4.5 7.78 2010 229 91 19.7 Whitaker 7/30/2014 20.98 0.742 0.78 7.27 2011 157 45 12.7 Whitaker 8/27/2014 21.72 0.488 1.98 7.7 2012 398 103 11.5 Whitaker 9/19/2014 16.1 0.698 4.91 9.53 2013 226 71 9
2014 173 100 1.4
y = -2.9429x + 247.47
y = 4.4x + 64.4
y = -2.3229x + 19.013 0
50
100
150
200
250
300
350
400
2009 2010 2011 2012 2013 2014
Whitaker Average TP, SRP, & TSS with Trendline
TP(ug/L)
SRP(ug/L)
TSS(mg/L)
Linear (TP(ug/L))
Linear (SRP(ug/L))
Linear (TSS(mg/L))
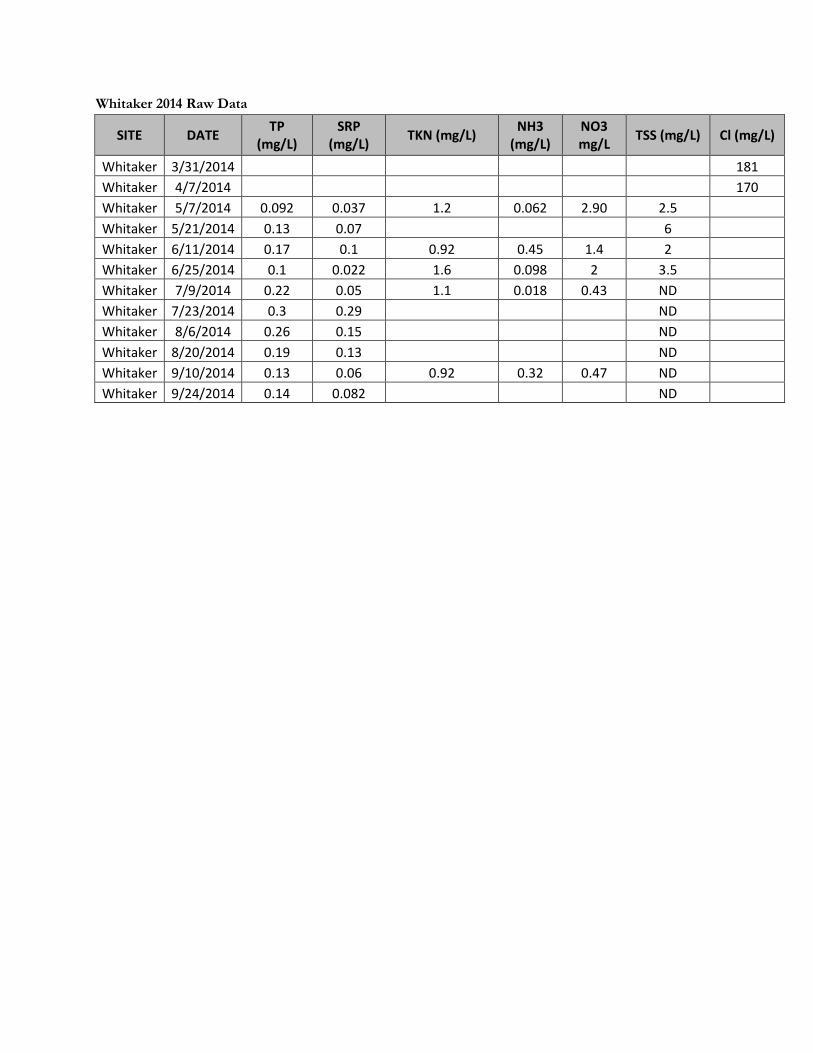
Whitaker 2014 Raw Data
SITE DATE TP (mg/L)
SRP (mg/L) TKN (mg/L) NH3
(mg/L) NO3 mg/L TSS (mg/L) Cl (mg/L)
Whitaker 3/31/2014 181 Whitaker 4/7/2014 170 Whitaker 5/7/2014 0.092 0.037 1.2 0.062 2.90 2.5 Whitaker 5/21/2014 0.13 0.07 6 Whitaker 6/11/2014 0.17 0.1 0.92 0.45 1.4 2 Whitaker 6/25/2014 0.1 0.022 1.6 0.098 2 3.5 Whitaker 7/9/2014 0.22 0.05 1.1 0.018 0.43 ND Whitaker 7/23/2014 0.3 0.29 ND Whitaker 8/6/2014 0.26 0.15 ND Whitaker 8/20/2014 0.19 0.13 ND Whitaker 9/10/2014 0.13 0.06 0.92 0.32 0.47 ND Whitaker 9/24/2014 0.14 0.082 ND
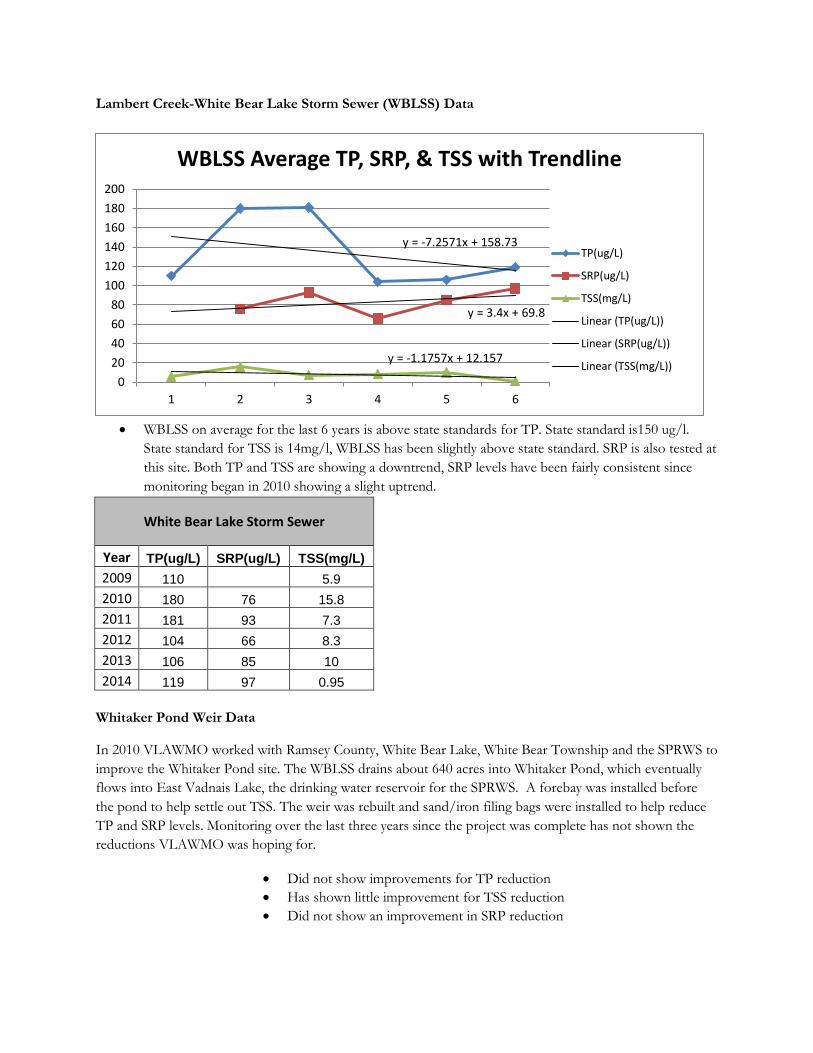
Lambert Creek-White Bear Lake Storm Sewer (WBLSS) Data
• WBLSS on average for the last 6 years is above state standards for TP. State standard is150 ug/l.
State standard for TSS is 14mg/l, WBLSS has been slightly above state standard. SRP is also tested at this site. Both TP and TSS are showing a downtrend, SRP levels have been fairly consistent since monitoring began in 2010 showing a slight uptrend.
White Bear Lake Storm Sewer
Year TP(ug/L) SRP(ug/L) TSS(mg/L) 2009 110 5.9 2010 180 76 15.8 2011 181 93 7.3 2012 104 66 8.3 2013 106 85 10 2014 119 97 0.95
Whitaker Pond Weir Data
In 2010 VLAWMO worked with Ramsey County, White Bear Lake, White Bear Township and the SPRWS to improve the Whitaker Pond site. The WBLSS drains about 640 acres into Whitaker Pond, which eventually flows into East Vadnais Lake, the drinking water reservoir for the SPRWS. A forebay was installed before the pond to help settle out TSS. The weir was rebuilt and sand/iron filing bags were installed to help reduce TP and SRP levels. Monitoring over the last three years since the project was complete has not shown the reductions VLAWMO was hoping for.
• Did not show improvements for TP reduction • Has shown little improvement for TSS reduction • Did not show an improvement in SRP reduction
y = -7.2571x + 158.73
y = 3.4x + 69.8
y = -1.1757x + 12.157
020406080
100120140160180200
1 2 3 4 5 6
WBLSS Average TP, SRP, & TSS with Trendline
TP(ug/L)
SRP(ug/L)
TSS(mg/L)
Linear (TP(ug/L))
Linear (SRP(ug/L))
Linear (TSS(mg/L))
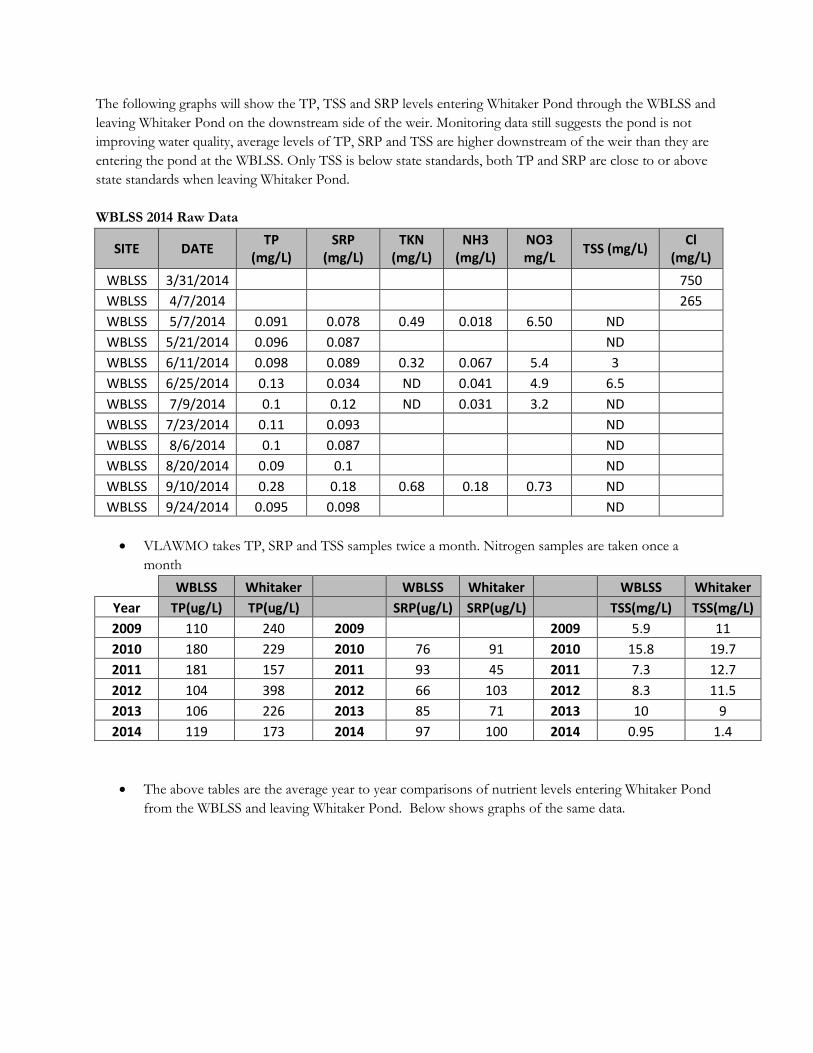
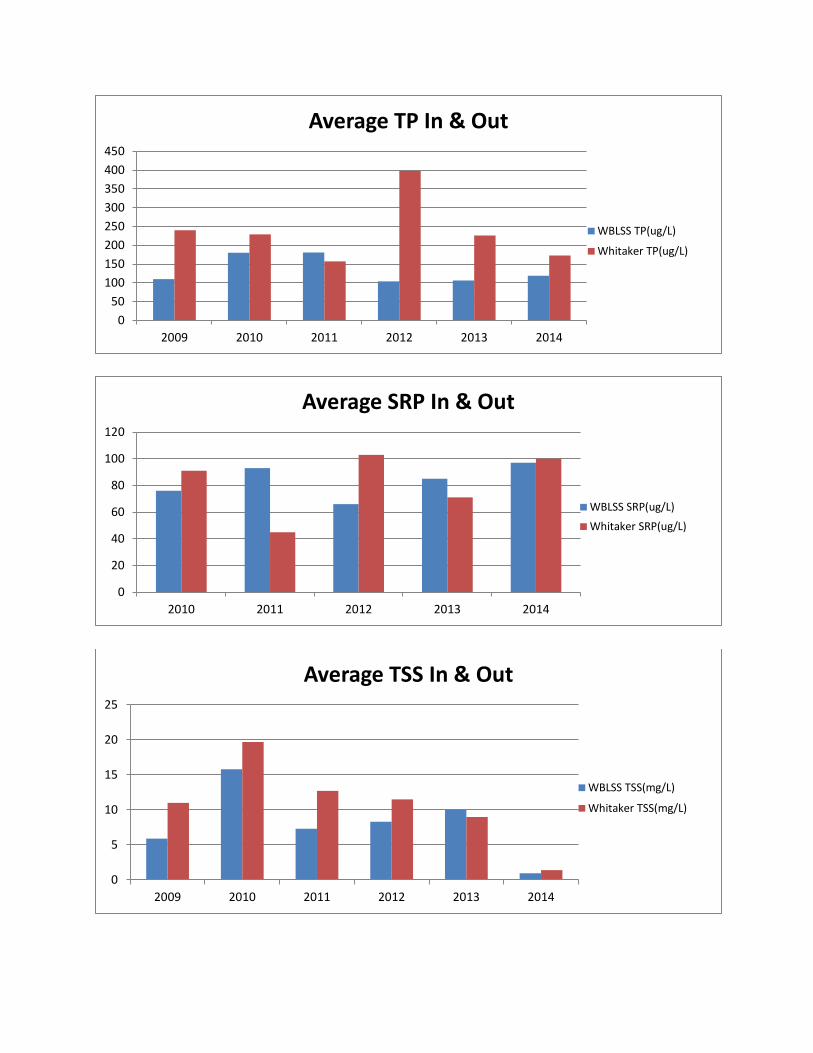
The following graphs will show the TP, TSS and SRP levels entering Whitaker Pond through the WBLSS and leaving Whitaker Pond on the downstream side of the weir. Monitoring data still suggests the pond is not improving water quality, average levels of TP, SRP and TSS are higher downstream of the weir than they are entering the pond at the WBLSS. Only TSS is below state standards, both TP and SRP are close to or above state standards when leaving Whitaker Pond. WBLSS 2014 Raw Data
SITE DATE TP (mg/L)
SRP (mg/L)
TKN (mg/L)
NH3 (mg/L)
NO3 mg/L TSS (mg/L) Cl
(mg/L) WBLSS 3/31/2014 750 WBLSS 4/7/2014 265 WBLSS 5/7/2014 0.091 0.078 0.49 0.018 6.50 ND WBLSS 5/21/2014 0.096 0.087 ND WBLSS 6/11/2014 0.098 0.089 0.32 0.067 5.4 3 WBLSS 6/25/2014 0.13 0.034 ND 0.041 4.9 6.5 WBLSS 7/9/2014 0.1 0.12 ND 0.031 3.2 ND WBLSS 7/23/2014 0.11 0.093 ND WBLSS 8/6/2014 0.1 0.087 ND WBLSS 8/20/2014 0.09 0.1 ND WBLSS 9/10/2014 0.28 0.18 0.68 0.18 0.73 ND WBLSS 9/24/2014 0.095 0.098 ND
• VLAWMO takes TP, SRP and TSS samples twice a month. Nitrogen samples are taken once a
month
WBLSS Whitaker WBLSS Whitaker WBLSS Whitaker
Year TP(ug/L) TP(ug/L) SRP(ug/L) SRP(ug/L) TSS(mg/L) TSS(mg/L) 2009 110 240 2009 2009 5.9 11 2010 180 229 2010 76 91 2010 15.8 19.7 2011 181 157 2011 93 45 2011 7.3 12.7 2012 104 398 2012 66 103 2012 8.3 11.5 2013 106 226 2013 85 71 2013 10 9 2014 119 173 2014 97 100 2014 0.95 1.4
• The above tables are the average year to year comparisons of nutrient levels entering Whitaker Pond from the WBLSS and leaving Whitaker Pond. Below shows graphs of the same data.
050
100150200250300350400450
2009 2010 2011 2012 2013 2014
Average TP In & Out
WBLSS TP(ug/L)
Whitaker TP(ug/L)
0
20
40
60
80
100
120
2010 2011 2012 2013 2014
Average SRP In & Out
WBLSS SRP(ug/L)
Whitaker SRP(ug/L)
0
5
10
15
20
25
2009 2010 2011 2012 2013 2014
Average TSS In & Out
WBLSS TSS(mg/L)
Whitaker TSS(mg/L)
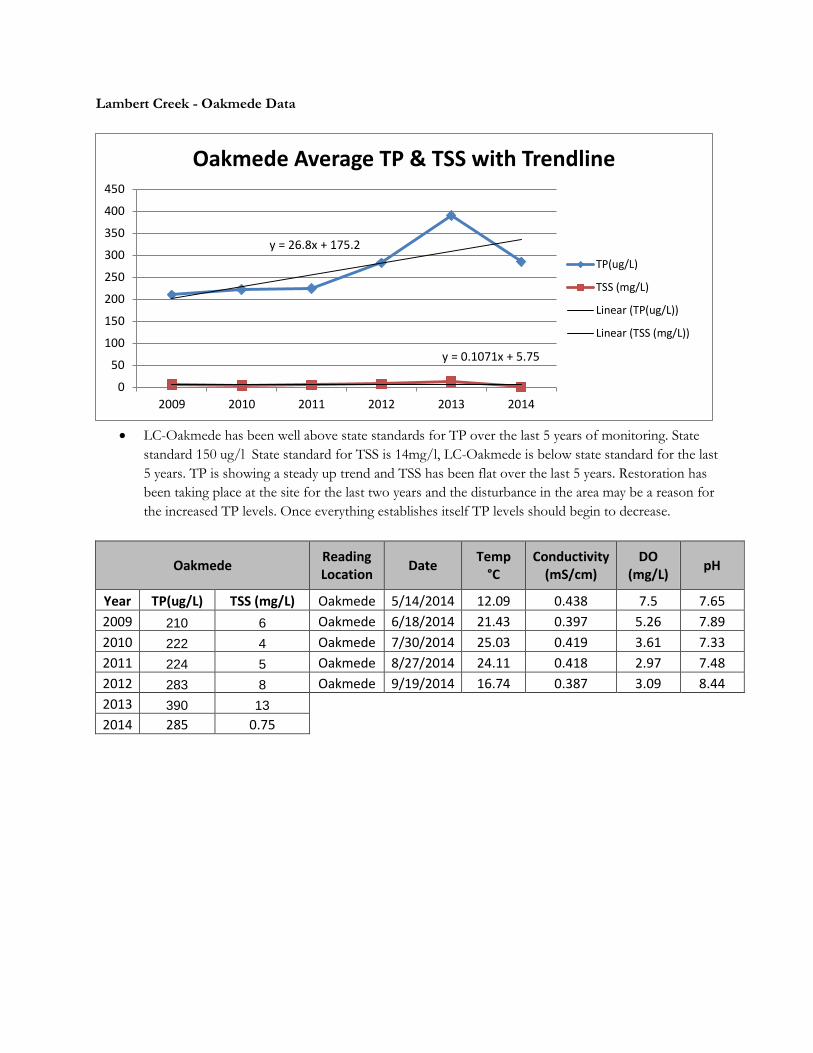
Lambert Creek - Oakmede Data
• LC-Oakmede has been well above state standards for TP over the last 5 years of monitoring. State
standard 150 ug/l State standard for TSS is 14mg/l, LC-Oakmede is below state standard for the last 5 years. TP is showing a steady up trend and TSS has been flat over the last 5 years. Restoration has been taking place at the site for the last two years and the disturbance in the area may be a reason for the increased TP levels. Once everything establishes itself TP levels should begin to decrease.
Oakmede Reading Location Date Temp
°C Conductivity
(mS/cm) DO
(mg/L) pH
Year TP(ug/L) TSS (mg/L) Oakmede 5/14/2014 12.09 0.438 7.5 7.65 2009 210 6 Oakmede 6/18/2014 21.43 0.397 5.26 7.89 2010 222 4 Oakmede 7/30/2014 25.03 0.419 3.61 7.33 2011 224 5 Oakmede 8/27/2014 24.11 0.418 2.97 7.48 2012 283 8 Oakmede 9/19/2014 16.74 0.387 3.09 8.44 2013 390 13
2014 285 0.75
y = 26.8x + 175.2
y = 0.1071x + 5.75
0
50
100
150
200
250
300
350
400
450
2009 2010 2011 2012 2013 2014
Oakmede Average TP & TSS with Trendline
TP(ug/L)
TSS (mg/L)
Linear (TP(ug/L))
Linear (TSS (mg/L))
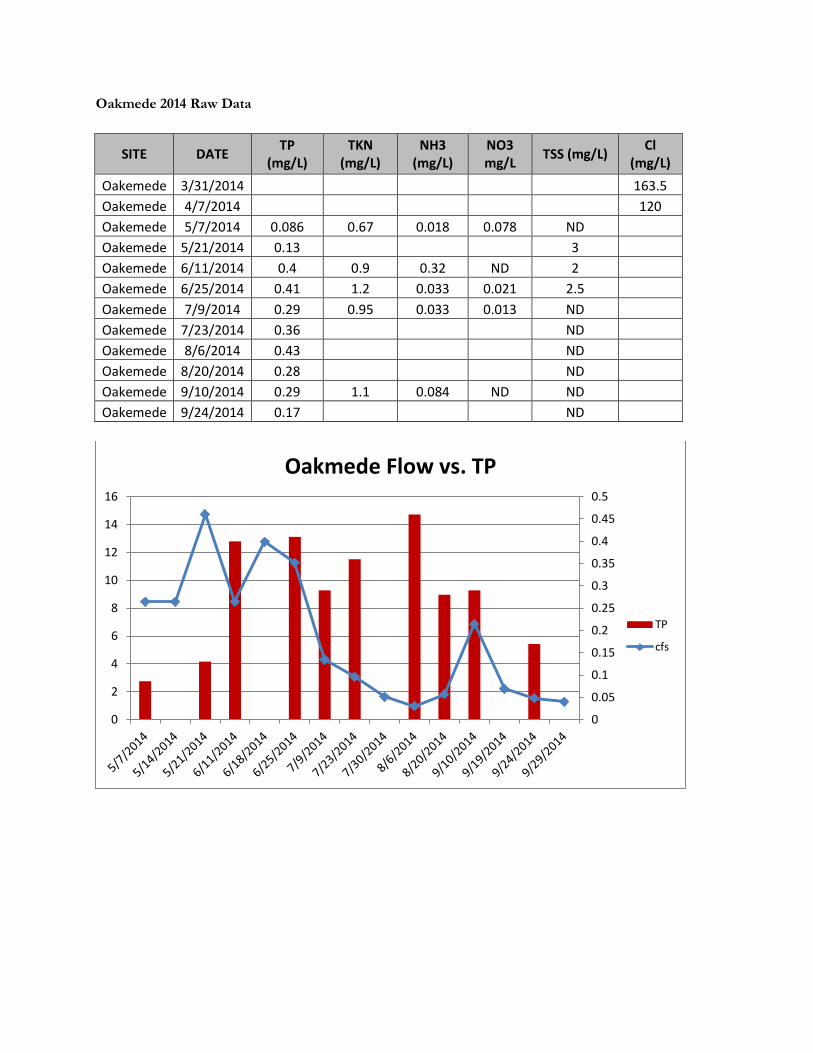
Oakmede 2014 Raw Data
SITE DATE TP (mg/L)
TKN (mg/L)
NH3 (mg/L)
NO3 mg/L TSS (mg/L) Cl
(mg/L) Oakemede 3/31/2014 163.5 Oakemede 4/7/2014 120 Oakemede 5/7/2014 0.086 0.67 0.018 0.078 ND Oakemede 5/21/2014 0.13 3 Oakemede 6/11/2014 0.4 0.9 0.32 ND 2 Oakemede 6/25/2014 0.41 1.2 0.033 0.021 2.5 Oakemede 7/9/2014 0.29 0.95 0.033 0.013 ND Oakemede 7/23/2014 0.36 ND Oakemede 8/6/2014 0.43 ND Oakemede 8/20/2014 0.28 ND Oakemede 9/10/2014 0.29 1.1 0.084 ND ND Oakemede 9/24/2014 0.17 ND
0
0.05
0.1
0.15
0.2
0.25
0.3
0.35
0.4
0.45
0.5
0
2
4
6
8
10
12
14
16
Oakmede Flow vs. TP
TP
cfs
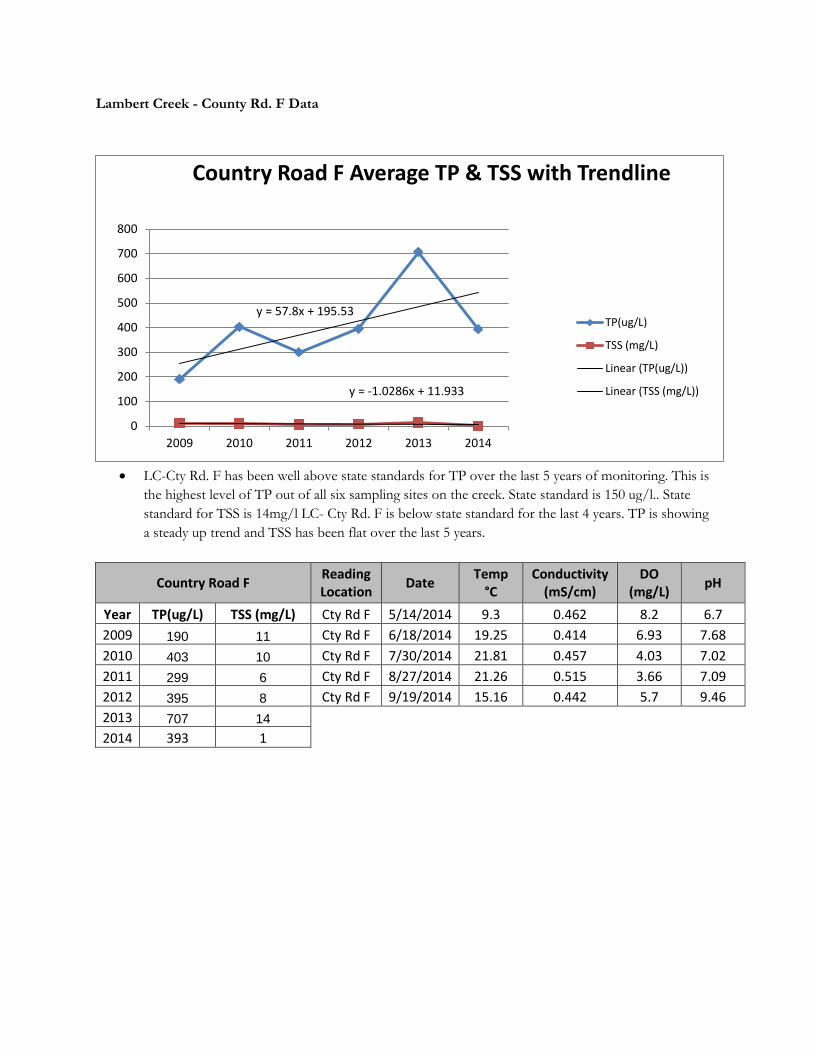
Lambert Creek - County Rd. F Data
• LC-Cty Rd. F has been well above state standards for TP over the last 5 years of monitoring. This is
the highest level of TP out of all six sampling sites on the creek. State standard is 150 ug/l.. State standard for TSS is 14mg/l LC- Cty Rd. F is below state standard for the last 4 years. TP is showing a steady up trend and TSS has been flat over the last 5 years.
Country Road F Reading Location Date Temp
°C Conductivity
(mS/cm) DO
(mg/L) pH
Year TP(ug/L) TSS (mg/L) Cty Rd F 5/14/2014 9.3 0.462 8.2 6.7 2009 190 11 Cty Rd F 6/18/2014 19.25 0.414 6.93 7.68 2010 403 10 Cty Rd F 7/30/2014 21.81 0.457 4.03 7.02 2011 299 6 Cty Rd F 8/27/2014 21.26 0.515 3.66 7.09 2012 395 8 Cty Rd F 9/19/2014 15.16 0.442 5.7 9.46 2013 707 14
2014 393 1
y = 57.8x + 195.53
y = -1.0286x + 11.933
0
100
200
300
400
500
600
700
800
2009 2010 2011 2012 2013 2014
Country Road F Average TP & TSS with Trendline
TP(ug/L)
TSS (mg/L)
Linear (TP(ug/L))
Linear (TSS (mg/L))
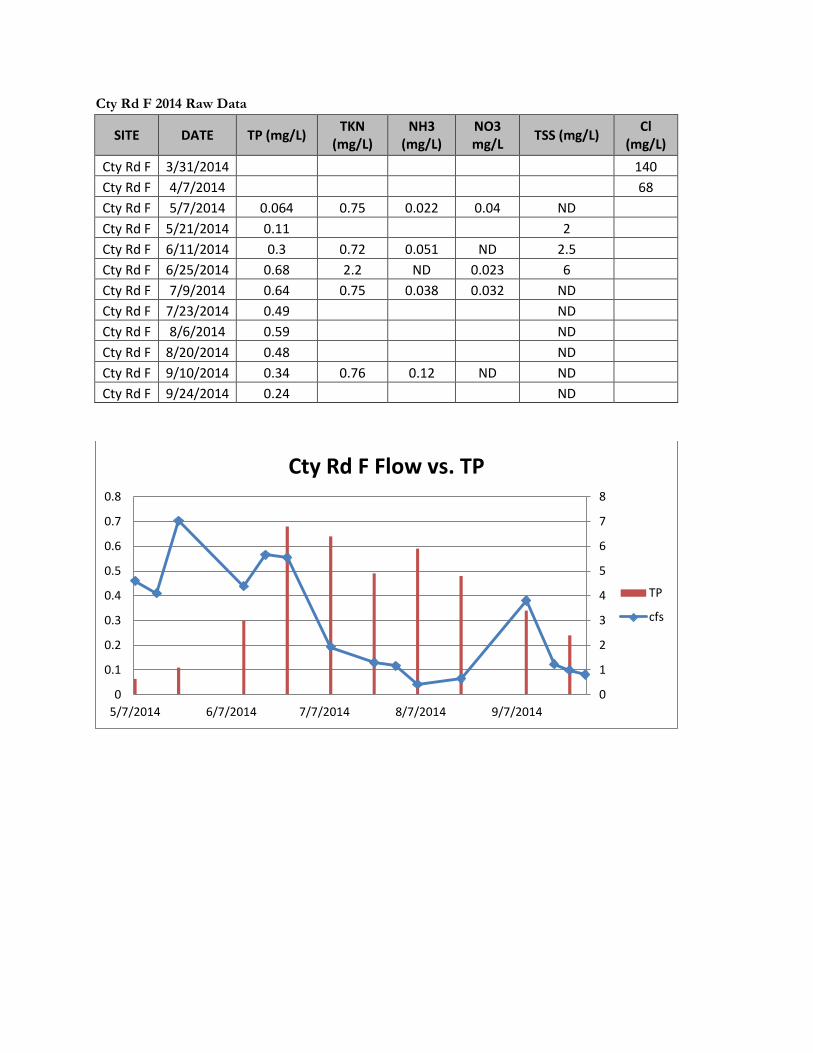
Cty Rd F 2014 Raw Data
SITE DATE TP (mg/L) TKN (mg/L)
NH3 (mg/L)
NO3 mg/L TSS (mg/L) Cl
(mg/L) Cty Rd F 3/31/2014 140 Cty Rd F 4/7/2014 68 Cty Rd F 5/7/2014 0.064 0.75 0.022 0.04 ND Cty Rd F 5/21/2014 0.11 2 Cty Rd F 6/11/2014 0.3 0.72 0.051 ND 2.5 Cty Rd F 6/25/2014 0.68 2.2 ND 0.023 6 Cty Rd F 7/9/2014 0.64 0.75 0.038 0.032 ND Cty Rd F 7/23/2014 0.49 ND Cty Rd F 8/6/2014 0.59 ND Cty Rd F 8/20/2014 0.48 ND Cty Rd F 9/10/2014 0.34 0.76 0.12 ND ND Cty Rd F 9/24/2014 0.24 ND
0
1
2
3
4
5
6
7
8
0
0.1
0.2
0.3
0.4
0.5
0.6
0.7
0.8
5/7/2014 6/7/2014 7/7/2014 8/7/2014 9/7/2014
Cty Rd F Flow vs. TP
TP
cfs
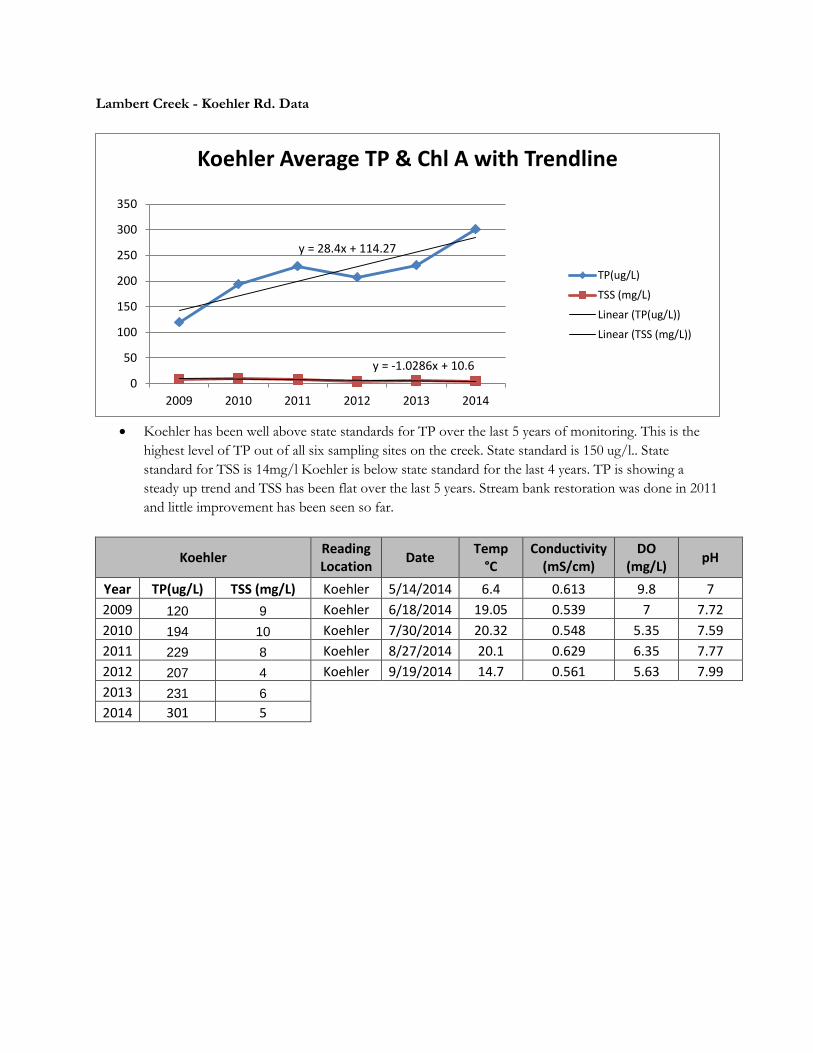
Lambert Creek - Koehler Rd. Data
• Koehler has been well above state standards for TP over the last 5 years of monitoring. This is the
highest level of TP out of all six sampling sites on the creek. State standard is 150 ug/l.. State standard for TSS is 14mg/l Koehler is below state standard for the last 4 years. TP is showing a steady up trend and TSS has been flat over the last 5 years. Stream bank restoration was done in 2011 and little improvement has been seen so far.
Koehler Reading Location Date Temp
°C Conductivity
(mS/cm) DO
(mg/L) pH
Year TP(ug/L) TSS (mg/L) Koehler 5/14/2014 6.4 0.613 9.8 7 2009 120 9 Koehler 6/18/2014 19.05 0.539 7 7.72 2010 194 10 Koehler 7/30/2014 20.32 0.548 5.35 7.59 2011 229 8 Koehler 8/27/2014 20.1 0.629 6.35 7.77 2012 207 4 Koehler 9/19/2014 14.7 0.561 5.63 7.99 2013 231 6
2014 301 5
y = 28.4x + 114.27
y = -1.0286x + 10.6 0
50
100
150
200
250
300
350
2009 2010 2011 2012 2013 2014
Koehler Average TP & Chl A with Trendline
TP(ug/L)
TSS (mg/L)
Linear (TP(ug/L))
Linear (TSS (mg/L))
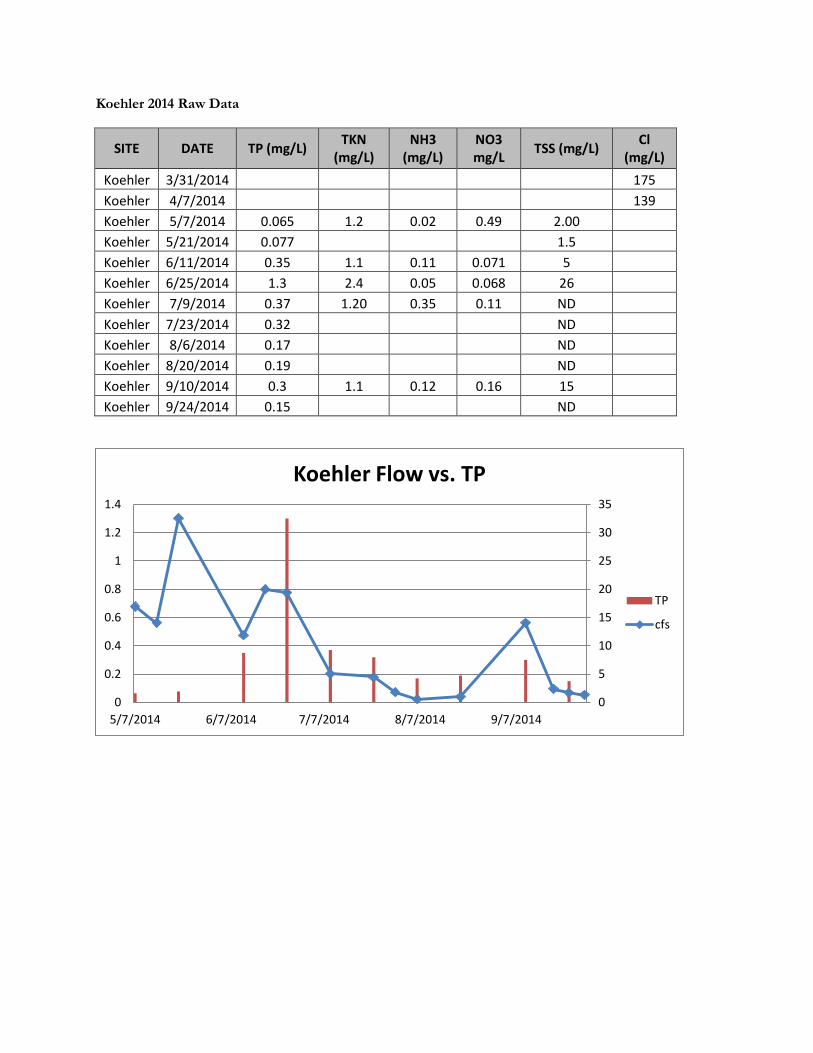
Koehler 2014 Raw Data
SITE DATE TP (mg/L) TKN (mg/L)
NH3 (mg/L)
NO3 mg/L TSS (mg/L) Cl
(mg/L) Koehler 3/31/2014 175 Koehler 4/7/2014 139 Koehler 5/7/2014 0.065 1.2 0.02 0.49 2.00 Koehler 5/21/2014 0.077 1.5 Koehler 6/11/2014 0.35 1.1 0.11 0.071 5 Koehler 6/25/2014 1.3 2.4 0.05 0.068 26 Koehler 7/9/2014 0.37 1.20 0.35 0.11 ND Koehler 7/23/2014 0.32 ND Koehler 8/6/2014 0.17 ND Koehler 8/20/2014 0.19 ND Koehler 9/10/2014 0.3 1.1 0.12 0.16 15 Koehler 9/24/2014 0.15 ND
0
5
10
15
20
25
30
35
0
0.2
0.4
0.6
0.8
1
1.2
1.4
5/7/2014 6/7/2014 7/7/2014 8/7/2014 9/7/2014
Koehler Flow vs. TP
TP
cfs
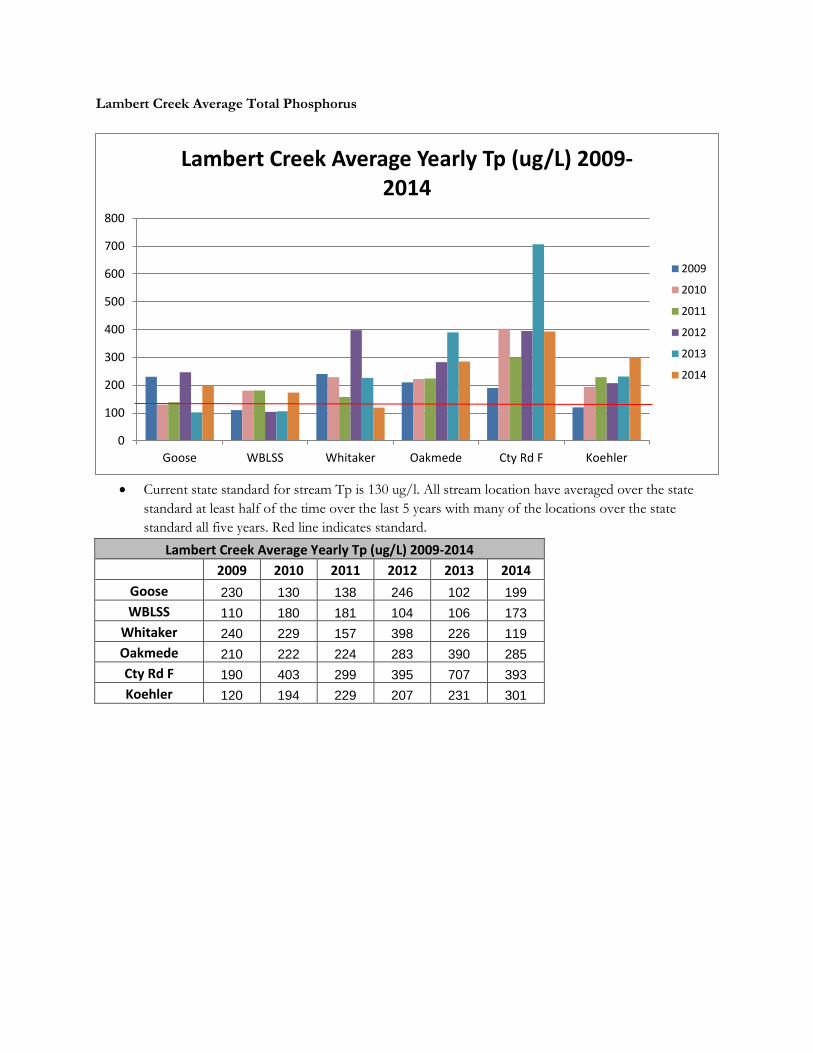
Lambert Creek Average Total Phosphorus
• Current state standard for stream Tp is 130 ug/l. All stream location have averaged over the state
standard at least half of the time over the last 5 years with many of the locations over the state standard all five years. Red line indicates standard.
Lambert Creek Average Yearly Tp (ug/L) 2009-2014 2009 2010 2011 2012 2013 2014
Goose 230 130 138 246 102 199 WBLSS 110 180 181 104 106 173
Whitaker 240 229 157 398 226 119 Oakmede 210 222 224 283 390 285 Cty Rd F 190 403 299 395 707 393 Koehler 120 194 229 207 231 301
0
100
200
300
400
500
600
700
800
Goose WBLSS Whitaker Oakmede Cty Rd F Koehler
Lambert Creek Average Yearly Tp (ug/L) 2009-2014
2009
2010
2011
2012
2013
2014
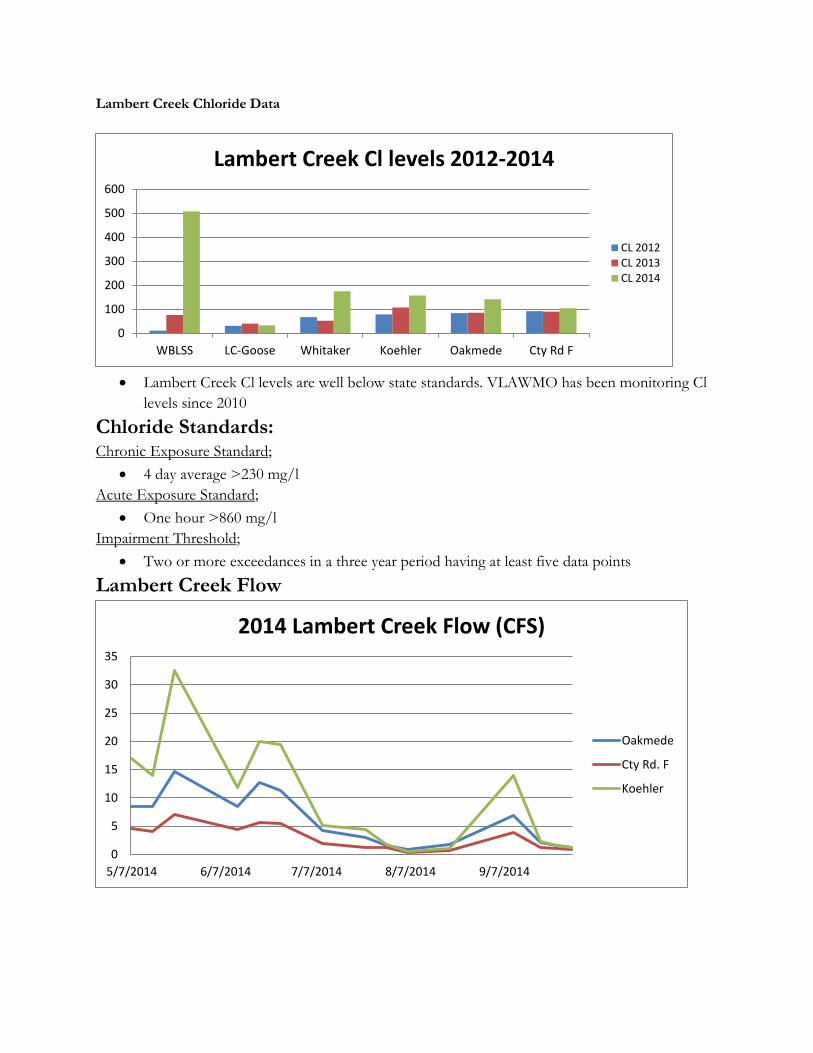
Lambert Creek Chloride Data
• Lambert Creek Cl levels are well below state standards. VLAWMO has been monitoring Cl
levels since 2010
Chloride Standards: Chronic Exposure Standard;
• 4 day average >230 mg/l Acute Exposure Standard;
• One hour >860 mg/l Impairment Threshold;
• Two or more exceedances in a three year period having at least five data points
Lambert Creek Flow
0
100
200
300
400
500
600
WBLSS LC-Goose Whitaker Koehler Oakmede Cty Rd F
Lambert Creek Cl levels 2012-2014
CL 2012CL 2013CL 2014
0
5
10
15
20
25
30
35
5/7/2014 6/7/2014 7/7/2014 8/7/2014 9/7/2014
2014 Lambert Creek Flow (CFS)
Oakmede
Cty Rd. F
Koehler
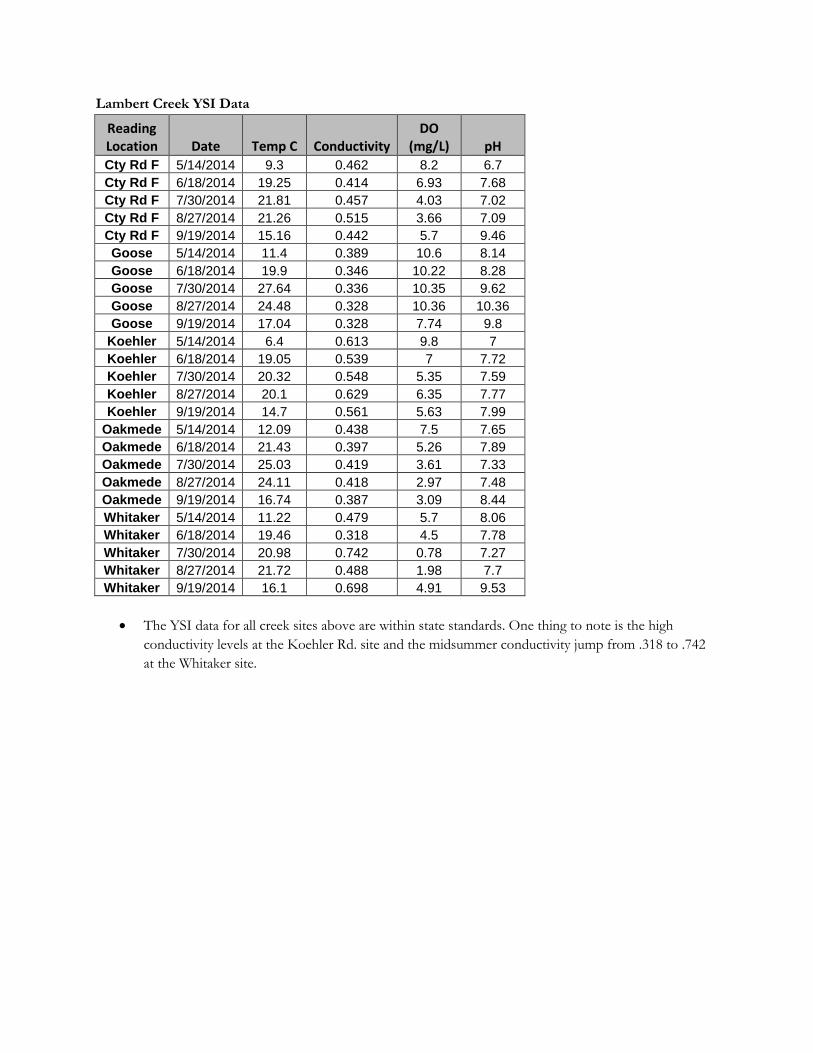
Lambert Creek YSI Data
Reading Location Date Temp C Conductivity
DO (mg/L) pH
Cty Rd F 5/14/2014 9.3 0.462 8.2 6.7 Cty Rd F 6/18/2014 19.25 0.414 6.93 7.68 Cty Rd F 7/30/2014 21.81 0.457 4.03 7.02 Cty Rd F 8/27/2014 21.26 0.515 3.66 7.09 Cty Rd F 9/19/2014 15.16 0.442 5.7 9.46 Goose 5/14/2014 11.4 0.389 10.6 8.14 Goose 6/18/2014 19.9 0.346 10.22 8.28 Goose 7/30/2014 27.64 0.336 10.35 9.62 Goose 8/27/2014 24.48 0.328 10.36 10.36 Goose 9/19/2014 17.04 0.328 7.74 9.8
Koehler 5/14/2014 6.4 0.613 9.8 7 Koehler 6/18/2014 19.05 0.539 7 7.72 Koehler 7/30/2014 20.32 0.548 5.35 7.59 Koehler 8/27/2014 20.1 0.629 6.35 7.77 Koehler 9/19/2014 14.7 0.561 5.63 7.99
Oakmede 5/14/2014 12.09 0.438 7.5 7.65 Oakmede 6/18/2014 21.43 0.397 5.26 7.89 Oakmede 7/30/2014 25.03 0.419 3.61 7.33 Oakmede 8/27/2014 24.11 0.418 2.97 7.48 Oakmede 9/19/2014 16.74 0.387 3.09 8.44 Whitaker 5/14/2014 11.22 0.479 5.7 8.06 Whitaker 6/18/2014 19.46 0.318 4.5 7.78 Whitaker 7/30/2014 20.98 0.742 0.78 7.27 Whitaker 8/27/2014 21.72 0.488 1.98 7.7 Whitaker 9/19/2014 16.1 0.698 4.91 9.53
• The YSI data for all creek sites above are within state standards. One thing to note is the high
conductivity levels at the Koehler Rd. site and the midsummer conductivity jump from .318 to .742 at the Whitaker site.
E.coli Source Monitoring
The Bacteria Sourcing study uses and integrated approach to identifying and reducing bacteria loads to meet regulatory requirements, in this case the TMDL MS4 wasteload allocations. The three main sources for the bacteria loading to the creek have been identified as wildlife, human and urban stormwater. The sourcing study has broken the creek into five sub-drainages and each sub-drainage will be monitored first during dry conditions and then during wet conditions. VLAWMO completed the Oakmede and County Road F sub-drainages this summer for dry conditions. Ecoli concentrations were monitored at a primary site and also possible source sites at both locations which were identified during a creek recon this spring. These sites were also tested for the human and bird genetic markers. Results at both sites showed below state chronic standard levels of ecoli (less than 126cfu/100ml) which indicates the impairment is not dry weather related at these sites. Both sites were also negative for the human genetic marker suggesting there are no septic or sanitary sewer leaks contaminating ground water in these areas leeching into the creek. Both sites were positive for the bird marker suggesting waterfowl have an influence on the bacteria levels in the creek. VLAWMO will continue the dry weather monitoring of the remaining three sub-drainages next year and then start the wet weather monitoring for all sites in 2016.
Oakmede
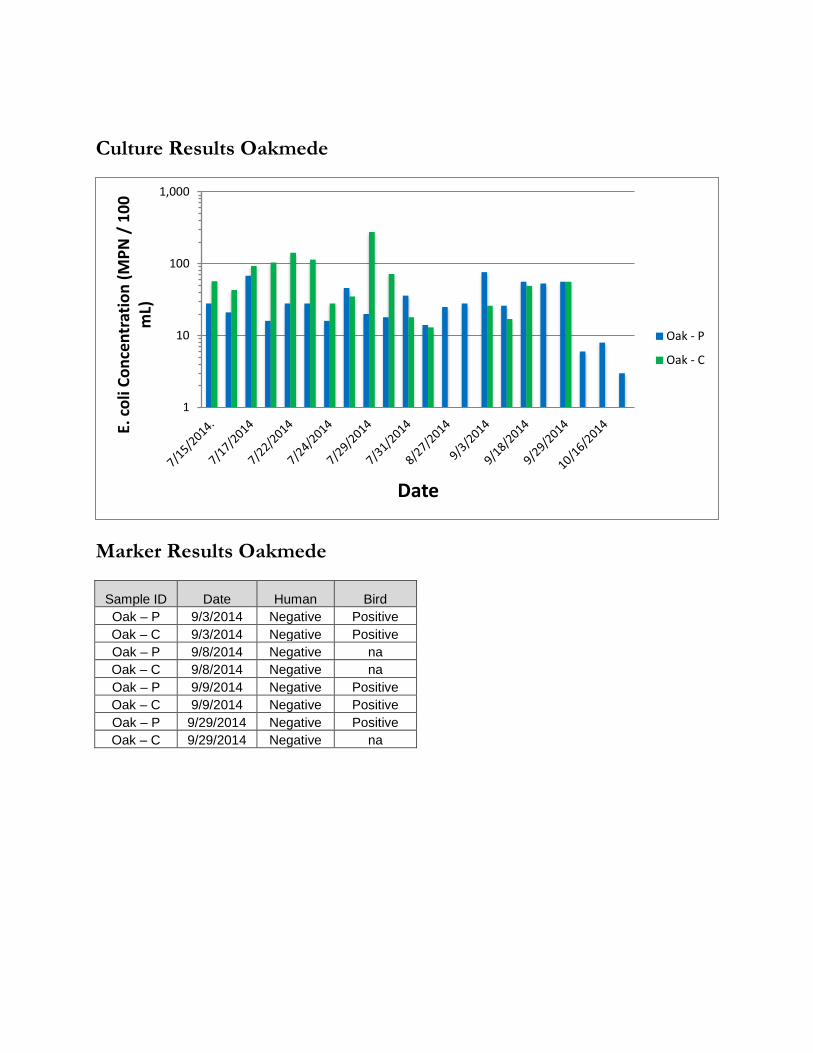
Culture Results Oakmede
Marker Results Oakmede
Sample ID Date Human Bird Oak – P 9/3/2014 Negative Positive Oak – C 9/3/2014 Negative Positive Oak – P 9/8/2014 Negative na Oak – C 9/8/2014 Negative na Oak – P 9/9/2014 Negative Positive Oak – C 9/9/2014 Negative Positive Oak – P 9/29/2014 Negative Positive Oak – C 9/29/2014 Negative na
1
10
100
1,000
E. c
oli C
once
ntra
tion
(MPN
/ 1
00
mL)
Date
Oak - P
Oak - C
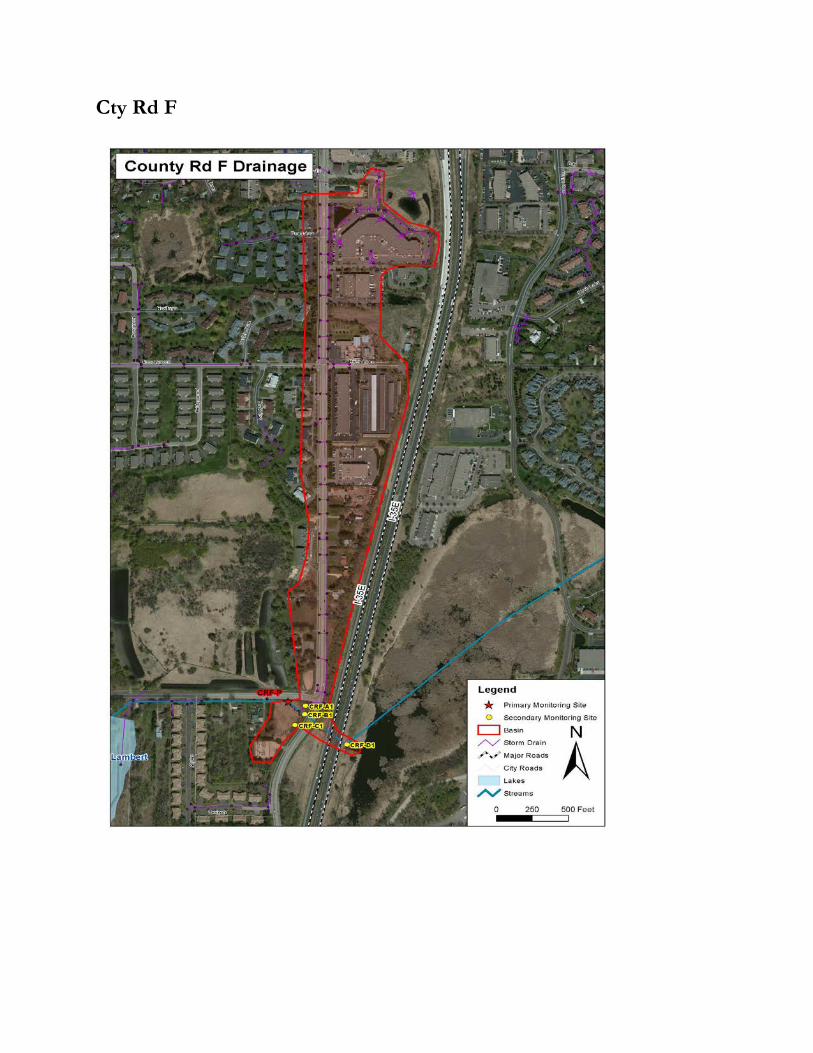
Cty Rd F
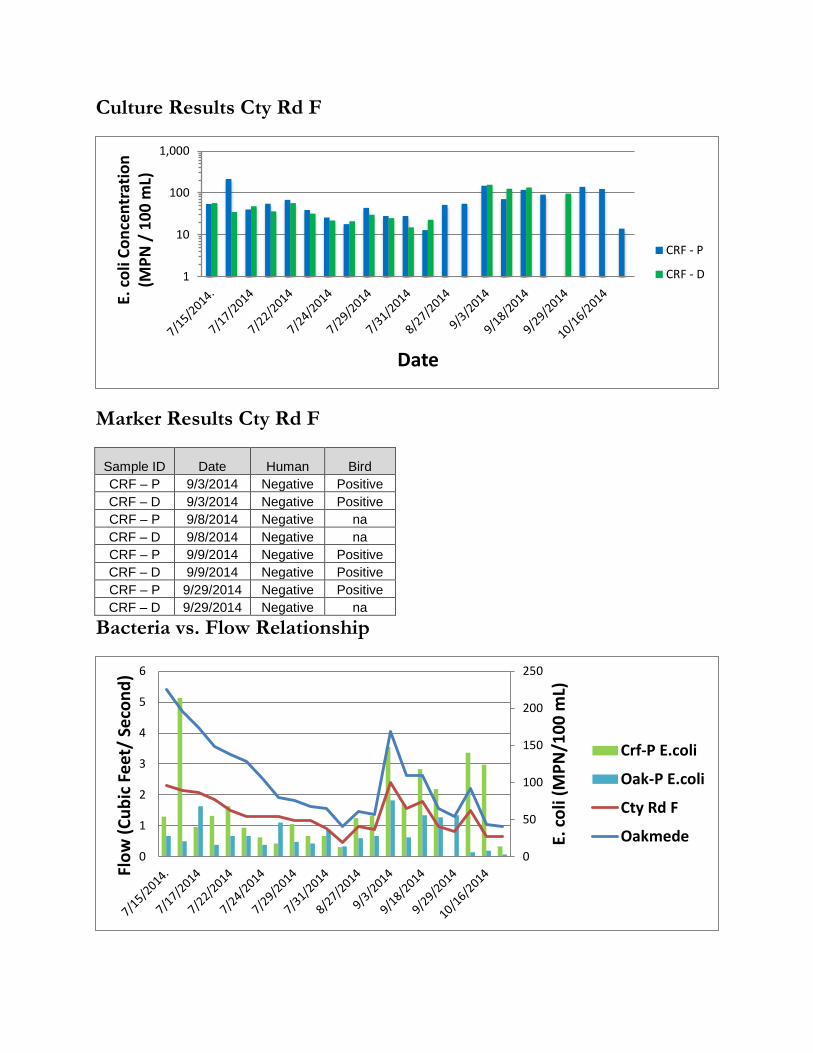
Culture Results Cty Rd F
Marker Results Cty Rd F
Sample ID Date Human Bird CRF – P 9/3/2014 Negative Positive CRF – D 9/3/2014 Negative Positive CRF – P 9/8/2014 Negative na CRF – D 9/8/2014 Negative na CRF – P 9/9/2014 Negative Positive CRF – D 9/9/2014 Negative Positive CRF – P 9/29/2014 Negative Positive CRF – D 9/29/2014 Negative na
Bacteria vs. Flow Relationship
1
10
100
1,000
E. c
oli C
once
ntra
tion
(MPN
/ 1
00 m
L)
Date
CRF - P
CRF - D
0
50
100
150
200
250
0
1
2
3
4
5
6
E. co
li (M
PN/1
00 m
L)
Flow
(Cub
ic F
eet/
Sec
ond)
Crf-P E.coli
Oak-P E.coli
Cty Rd F
Oakmede
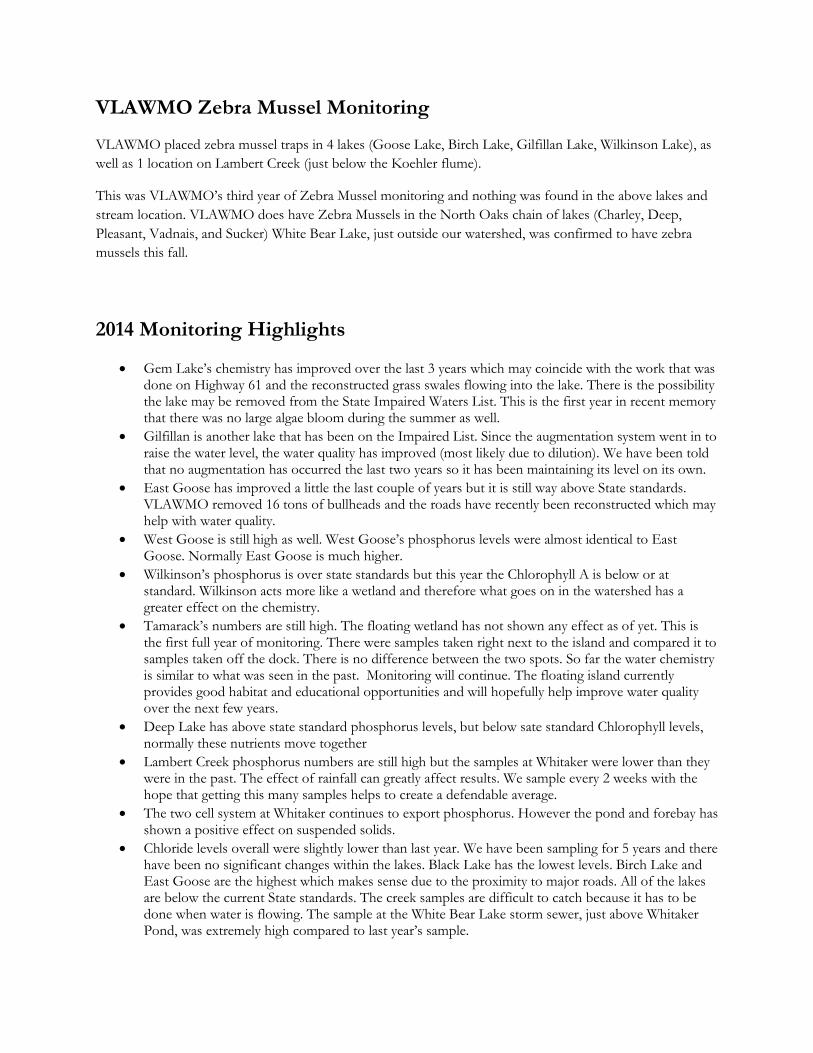
VLAWMO Zebra Mussel Monitoring
VLAWMO placed zebra mussel traps in 4 lakes (Goose Lake, Birch Lake, Gilfillan Lake, Wilkinson Lake), as well as 1 location on Lambert Creek (just below the Koehler flume).
This was VLAWMO’s third year of Zebra Mussel monitoring and nothing was found in the above lakes and stream location. VLAWMO does have Zebra Mussels in the North Oaks chain of lakes (Charley, Deep, Pleasant, Vadnais, and Sucker) White Bear Lake, just outside our watershed, was confirmed to have zebra mussels this fall.
2014 Monitoring Highlights
• Gem Lake’s chemistry has improved over the last 3 years which may coincide with the work that was done on Highway 61 and the reconstructed grass swales flowing into the lake. There is the possibility the lake may be removed from the State Impaired Waters List. This is the first year in recent memory that there was no large algae bloom during the summer as well.
• Gilfillan is another lake that has been on the Impaired List. Since the augmentation system went in to raise the water level, the water quality has improved (most likely due to dilution). We have been told that no augmentation has occurred the last two years so it has been maintaining its level on its own.
• East Goose has improved a little the last couple of years but it is still way above State standards. VLAWMO removed 16 tons of bullheads and the roads have recently been reconstructed which may help with water quality.
• West Goose is still high as well. West Goose’s phosphorus levels were almost identical to East Goose. Normally East Goose is much higher.
• Wilkinson’s phosphorus is over state standards but this year the Chlorophyll A is below or at standard. Wilkinson acts more like a wetland and therefore what goes on in the watershed has a greater effect on the chemistry.
• Tamarack’s numbers are still high. The floating wetland has not shown any effect as of yet. This is the first full year of monitoring. There were samples taken right next to the island and compared it to samples taken off the dock. There is no difference between the two spots. So far the water chemistry is similar to what was seen in the past. Monitoring will continue. The floating island currently provides good habitat and educational opportunities and will hopefully help improve water quality over the next few years.
• Deep Lake has above state standard phosphorus levels, but below sate standard Chlorophyll levels, normally these nutrients move together
• Lambert Creek phosphorus numbers are still high but the samples at Whitaker were lower than they were in the past. The effect of rainfall can greatly affect results. We sample every 2 weeks with the hope that getting this many samples helps to create a defendable average.
• The two cell system at Whitaker continues to export phosphorus. However the pond and forebay has shown a positive effect on suspended solids.
• Chloride levels overall were slightly lower than last year. We have been sampling for 5 years and there have been no significant changes within the lakes. Black Lake has the lowest levels. Birch Lake and East Goose are the highest which makes sense due to the proximity to major roads. All of the lakes are below the current State standards. The creek samples are difficult to catch because it has to be done when water is flowing. The sample at the White Bear Lake storm sewer, just above Whitaker Pond, was extremely high compared to last year’s sample.
• Overall precipitation wasn’t that different from last year. The levels were pretty much the same, except that we got more rain in August this year as compared to 2013.
• E. coli levels showed that the flow in the creek has a correlation to the amount of E. coli in the samples. Stormwater runoff seems to be the source of high E. coli levels in the Oakmede and Cty Rd F subwatersheds